REPORT NO.
UCB/EERC.87/14
SEPTEMBER 1987
REPRODUCED BYU.S. DEPARTMENT OF COMMERCE
NATIONAL TECHNICALINFORMATION SERVICESPRINGFIELD, VA. 22161
PB88-1T4347
EARTHQUAKE ENGINEERING RESEARCH CENTER
EXPERIMENTAL STUDY OFREINFORCED CONCRETE COLUMNSSUBJECTED TO MULTI-AXIALCYCLIC LOADING
by
STANLEY S. LOW
JACK P. MOEHLE
Report to the National Science Foundation
COllEGE OF ENGINEERING
UNIVERSITY OF CALIFORNIA • Berkeley, California

For sale by the National Technical Information Service, U.S. Department of Commerce,Springfield, Virginia 22161.
See back of report for up to date listing ofEERC reports.
DISCLAIMERAny opinions, findings, and conclusions orrecommendations expressed in this pUblication are those of the authors and do notnecessarily reflect the views of the Sponsorsor the Earthquake Engineering ResearchCenter, University of California, Berkeley

I~!f0171 '10
REPORT DOCUMENTATION 11. REPORT NO.
I PAGE NSF/ENG-87039•• Title and Subtitle
Experimental Study of Reinforced Concrete Columnssubjected to Multi-Axial Cyclic Loading
3. Recipient'. Aceeaslon No. I
PB3 8 1 1 4: 3 4 ? I~5. Raport Date
September 1987
1--------------------'----------------.. ---------------17. Author(s)
Stanley S. Low and Jack P. Moehle9. Performing Organization Name and Addres.
Earthquake Engineering Research CenterUniversity of California1301 South 46th StreetRi chmond, Cal iforni a 94804
12. Sponsorlne Organization Name and Address
National Science Foundation1800 G. Street, N.W.Washington, D.C. 20550
15. Supplementary Notes
16. Abstract (Limit: 200 words)
8. Performlne Organization Rept. No.
UCS/ EERC -87/1410. Project/Task/Work Unit No.
11. Contract(C) or Grant(G) No.
(C)
(G) CEE-831666213. Type at Report & Period Covered
14.
between:
!,
~Five nominally identical quarter-scale reinforced concrete columns were constructed andtested using multiaxial cyclic loading histories. The columns were detailed to satisfyrequirements of current North American building codes for reinforced concrete structures inregions of high seismic risk. The columns were loaded as cantilevers attached to stifffoundation blocks. The primary variable was the load history. Load histories included (1)uniaxial cyclic lateral loads with constant axial load, (2) biaxial cyclic lateral loads with~onstant axial load, and (3) biaxial cyclic lateral loads with cyclicly-varying axial loads.
Measured responses indicate that inelastic deformations in these tests were due primarilyto effects of flexure and reinforcement slip from the foundation blacks. Visible damage,stiffness, and resistance were markedly affected by the load history. Existing procedures forcomputing stiffness and strength under biaxial loading correlated reasonably well with the·measured behavior ••
This report documents the experiments and measured data, and presents comparisonsmeasured and calculated responses.
17. Document Analysis •• Descriptors
concrete columnsstiffnessinelastic deformationflexure
b. Identifiers/Open·Ended Terms
c. CaSATl Field/Group
18. Availability Statemen:
Release unlimited
.(See ANS1-Z39.1B)
reinforcement slipuniaxial cyclic loadbiaxial cyclic load
19. Security Cia•• (This Report)
Unclassified20. Security Class (This Paee)
Unclassifieds.. '".truct/one on Rever.e
21. No. of Pages
13S-
OPTIONAL FORM 272 (4-77)(Formerly NTlS-35)Department of Commerce


EXPERIMENTAL STUDY OF REINFORCED CONCREjTE COLUMNS
SUBJECTED TO MULTI-AXIAL CYCLIC LOADING
by
Stanley S. LowResearch Assistant
and
Jack P. MoehleAssoc. Professor of Civil Engineering
A Report to Sponsor:
National Science Foundation
Report No. UCB/EERC-87/14
Earthquake Engineering Research Center
College of Engineering
University of California
Berkeley, California
September 1987


ABSTRACT
Five nominally identical quarter-scale reinforced concrete
columns were constructed and tested using multiaxial cyclic
loading histories. The columns were detailed to satisfy
requirements of current North American building codes for
reinforced concrete structures in regions of high seismic risk.
The columns were loaded as cantilevers attached to stiff
foundation blocks. The primary variable was the load history.
Load histories included (1) uniaxial cyclic lateral loads with
constant axial load, (2) biaxial cyclic lateral loads with
constant axial load, and (3) biaxial cyclic lateral loads with
cyclicly-varying axial loads.
Measured responses indicate that inelastic deformations in
these tests were due primarily to effects of flexure and
reinforcement slip from the foundation blocks. Visible damage,
stiffness, and resistance were markedly affected by the load
history. Existing procedures for computing stiffness and
strength under biaxial loading correlated reasonably well with
the measured behavior.
This report documents the experiments and measured data, and
presents comparisons between measured and calculated responses.
i

ACKNOWLEDGMENTS
The research reported herein was funded by the National
Science Foundation under Grant No. CEE-8316662 and by the
generous contributions from individuals of the Industrial Liaison
Program of the College of Engineering of the University of
California at Berkeley. (The views presented in this report are
those of the authors, and do not necessarily represent the view
of the sponsors.)
The authors thank the support staff of the Department of
civil Engineering for their expert assistance in fabricating the
test specimens, conducting the tests, and reducing the
experimental data. The authors also acknowledge the following
for their advice and encouragement: Professors F. Filippou and
S. Mahin, and graduate research assistants xiaoxuan Qi and Shyh
Jiann Hwang, all of the Department of civil Engineering at the
University of California at Berkeley.
The research described in this report is based primarily on
work conducted by the first author in partial fulfillment of
requirements for the degree of Master of Engineering under the
supervision of the second author.
ii

Abstract
Acknowledgments
Table of Contents
List of Tables
TABLE OF CONTENTS
i
ii
iii
v
List of Figures vi
1 . Introduct ion . . . . . . . . . . . . . . . . . . . . . . . . . . . . . . . . . . . . . . . . . . . . 1
1. 1 General . . . . . . . . . . . . . . . . . . . . . . . . . . . . . . . . . . . . . . . . . . . . . 1
1. 2 Scope . . . . . . . . . . . . . . . . . . . . . . . . . . . . . . . . . . . . . . . . . . . . . . . 2
1.3 Relevance of Experiment to Current Research ........• 3
2. Description of the Experiment .........................•. 4
2 . 1 Text Specimens . . . . . . . . . . . . . . . . . . . . . . . . . . • . . . . . . . . . . . 4
2.2 Materials . . . . . . . . . . . . . . . . . . . . . . . . . . . . . . . . . . . . . . . . . . . 5
2.3 Loading Apparatus . . . . . . . . . . . . . . . . . . . . . . . . . . . . • . . . . . . 5
2.4 Instrumentation and Data Acquisition •................• 6
2. 5 Test Procedure . . . . • . . . . . . . . . . . . . . . . . . . . . • . . . . . . . . . . . 8
3. Experimental Results . . . . . . . . . . . . . . . . . . . . . . . . • . . . . . . . . . .. 11
3. 1 Summary of Data . . . . . . . . . . . . . . . . . . . . . . . . . . . . . . . . . . . .. 11
3.2 Visible Damage . . . . . . . . . . . . . . . . . . . . . . . . . . • . . . . . . . . . •. 11
3.3 Lateral Load-Displacement Relations .....•........•.. 13
3.4 Base Moment-Base Rotation Relations 14
3.5 Strain Histories 15
4. Discussion of Test Results . . . . . . . . . . . . . . . . . . . . . . . . . . . • .. 16
4.1 Introductory Remarks . . . . . . . . . . . . . . . . . . . . . . . . . . . . . . .. 16
iii


4.2 Computed Monotonic Behavior .•.•..•....•............. 16a.) Moment-Curvature Relations 16b.) Biaxial Moment-Axial Load Interaction Diagrams 18c.) Shear strength . . . . . . . . . . . . . . . . . . . . . . . . . . . . . . . .. 18d.) Bar Slip Relations • . . . . . . . . . • . . . . . . . . . . . . . . . . .. 19e.) Calculated Monotonic Load-Displacement Relations. 20
4.3 Comparison Between Computed and Measured Quantities 21a.) Failure Mode •..................•..•.........•.. 21b. ) strength . . . . . . . . . . . . . . . . . . . . . . . . . . . . . . . . . . . . . .. 21c.) Load-Displacement Relations ....•............... 23
4.4 Source of Deformation at Final Loading Stage . . . . . . .. 23
4.5 Effect of Load History~on Load-Displacement Response . 25
4.6 Effect of Load History on Damage • • • • • • . • • • • • • • • • • • •• 29
5. Summary and Conclusions • • • • • • • • • • • • • • • • • • • • • • • • • • • • • • • •• 32
References • • • • • • • • • • • • • • • • • • • • • • • • . . • • • • • • • . • • • • • • • • • • • • • • •• 35
Tables . . . . . . . . . . . . . . . . . . . . . . . . . . . . . . . . . . . . . . . . . . . . . . . . . . . . .. 37
Figures . . . . . . . . . . . . . . . . . . . . . . . . . . . . . . . . . . . . . . . . . . . . . . . . . . . .. 42
iv


LIST OF TABLES
Tables
2.1 Chronology of the Experiments
2.2 Concrete Batch Quantities for One Cubic Yard, SaturatedSurface-Dry Aggregates
2.3 Concrete Compressive Strengths
2.4 Concrete Splitting Tensile Strengths
2.5 Reinforcement properties
3.1 Summary of Selected Experimental Results
4.1 Calculated Effect of Bar Slip on Column End Displacements
v

Figures
LIST OF FIGURES
2.1 Test Specimen Configuration
2.2 Test Specimens Ready for casting
2.3 Test Specimens After casting
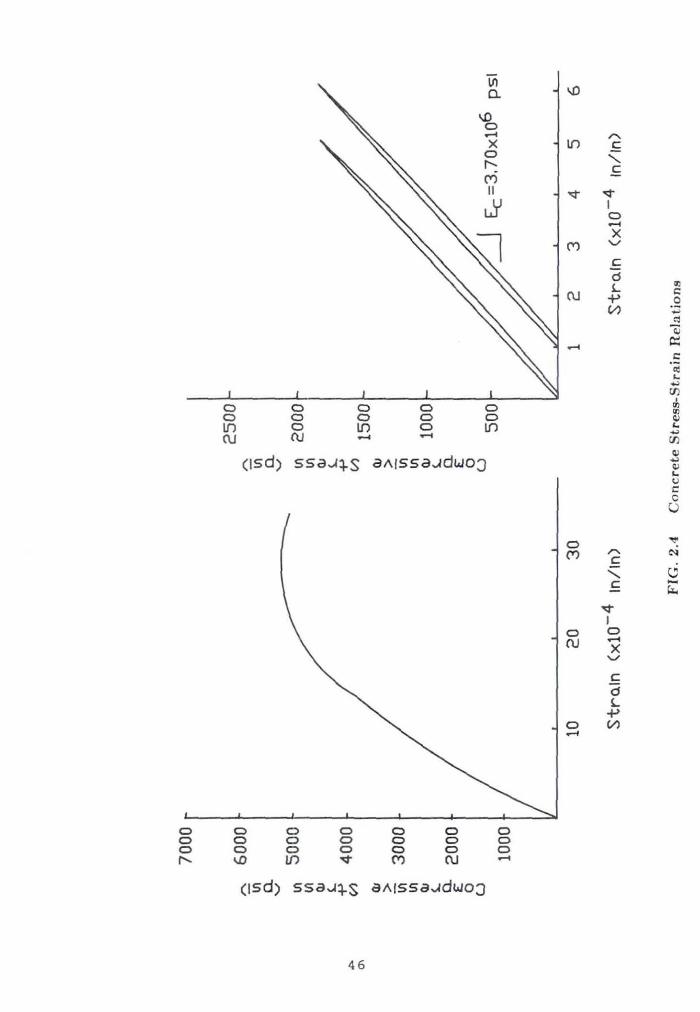
2.4 Concrete Stress-strain Relation
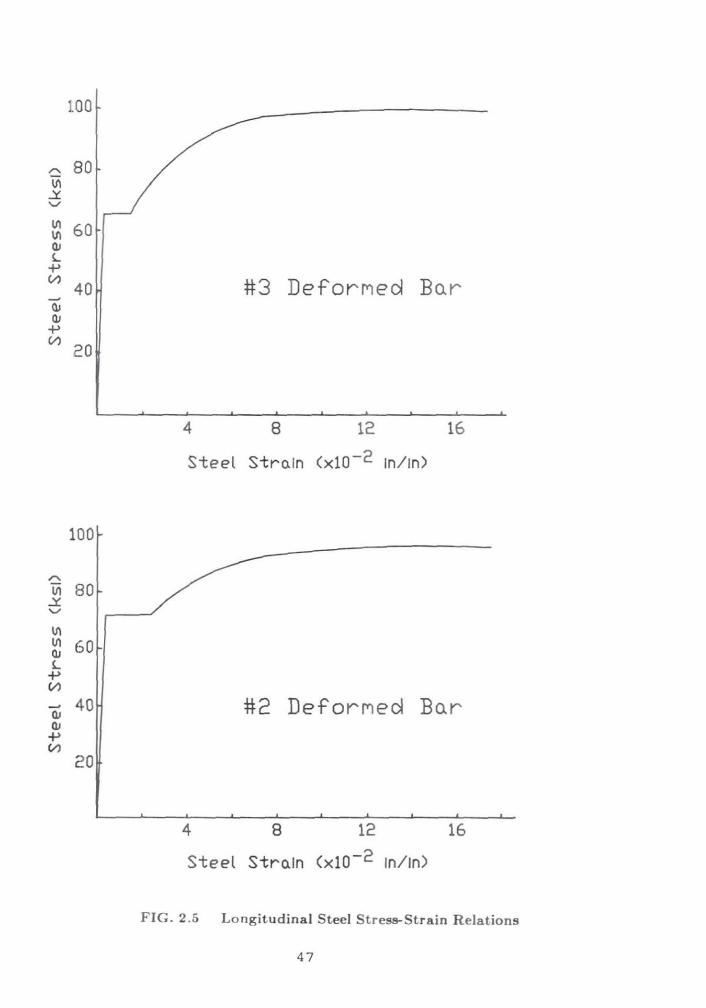
2.5 Longitudinal Steel Stress-Strain Relations
2.6 Loading Apparatus and Instrumentation
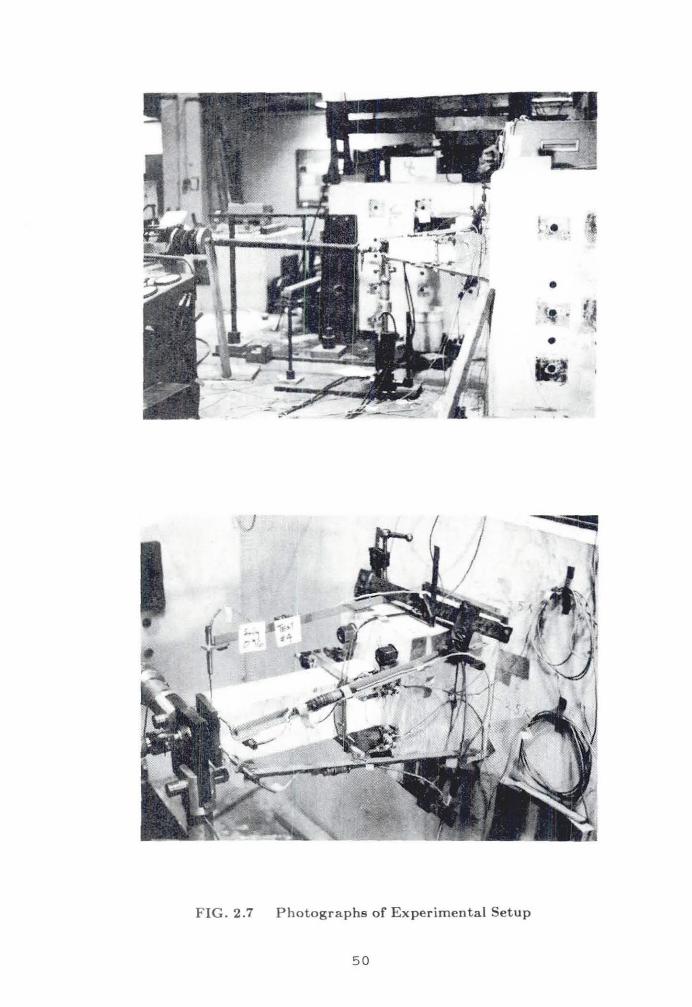
2.7 Photograph of Experimental Setup
2.8 Base Moment Determination
2.9 Intended Displacement and Load Histories
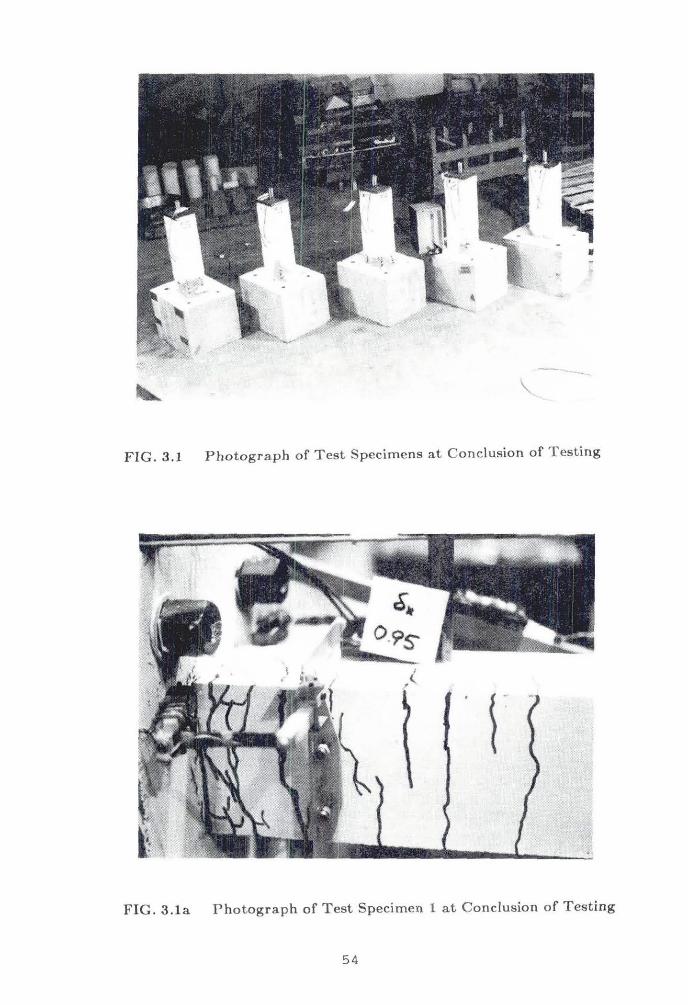
3.1 Photographs of Test Specimens at Conclusion of Testing
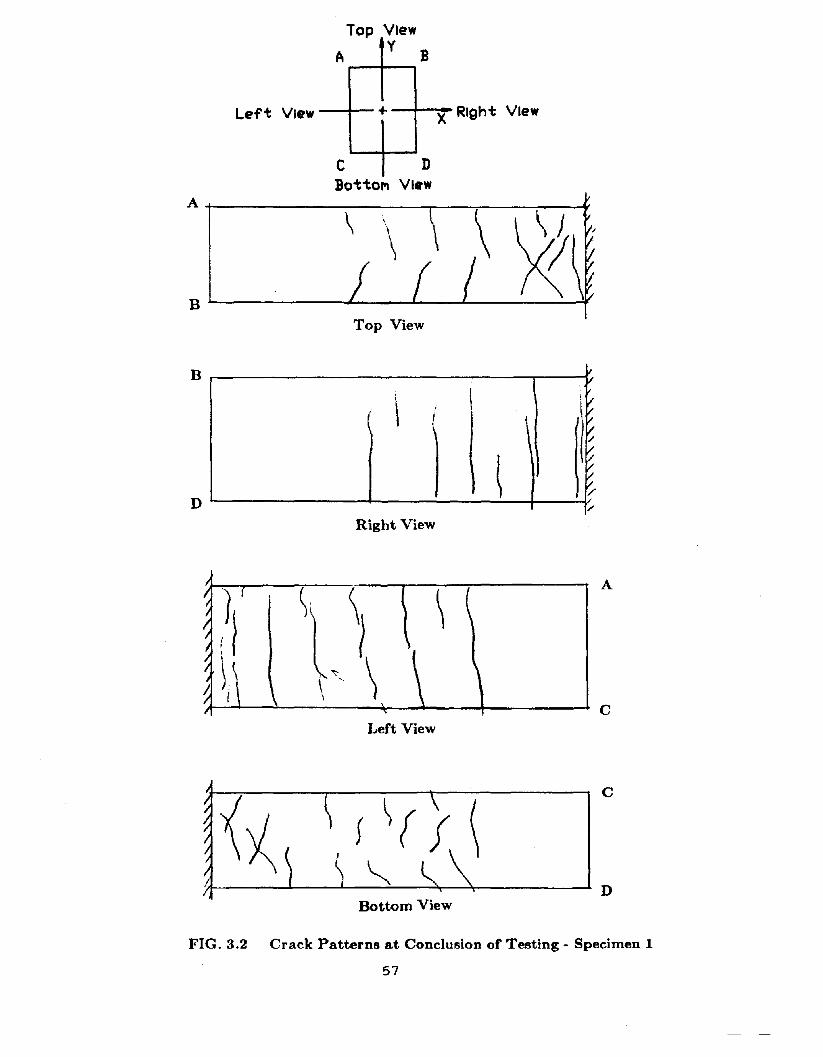
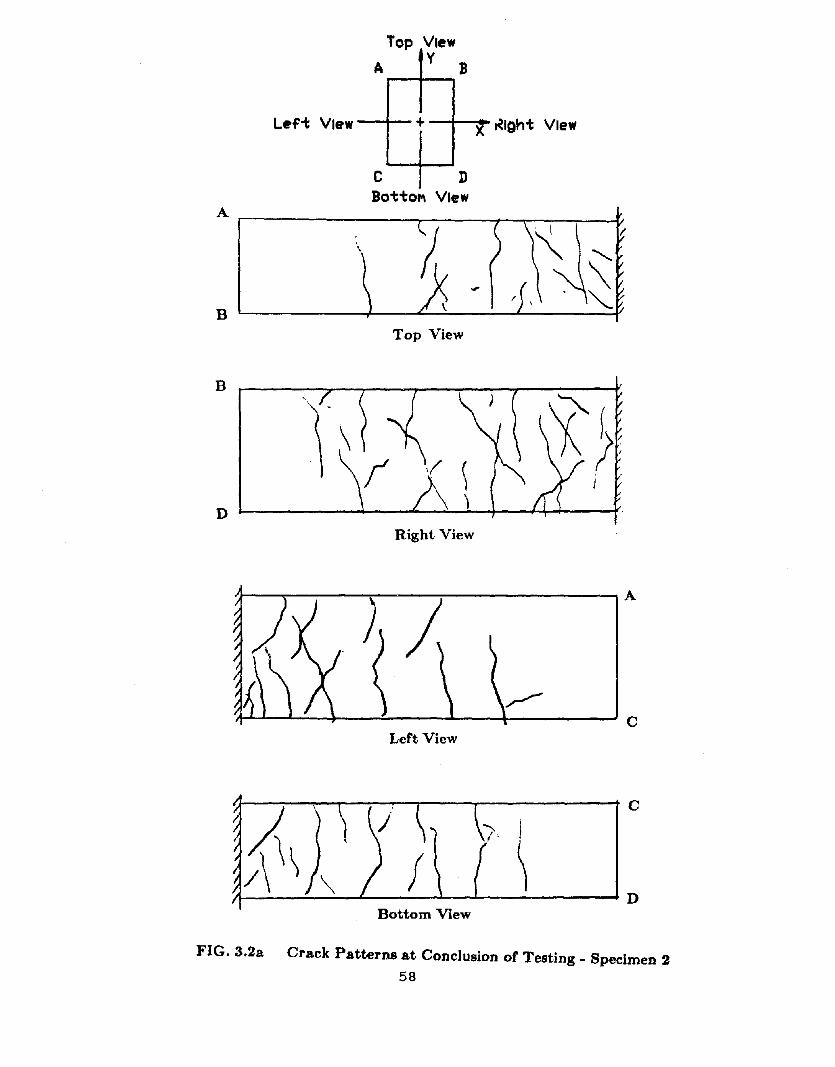
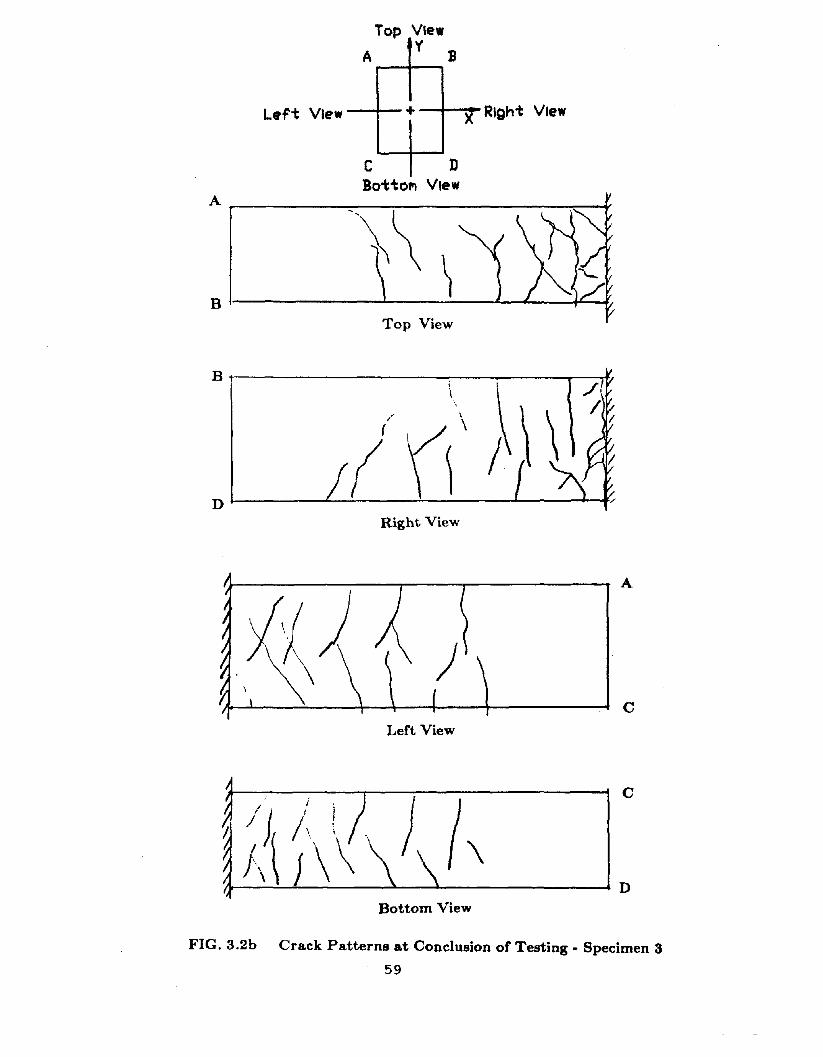
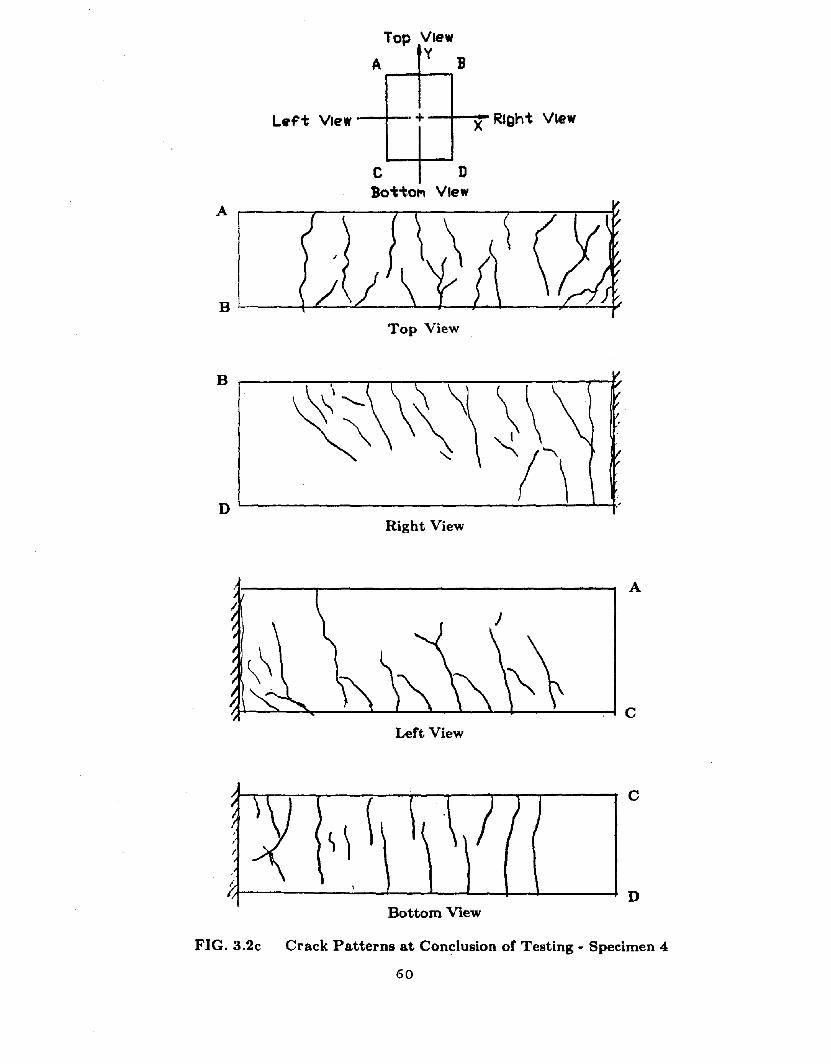
3.2 Crack Patterns at Conclusion of Testing
3.3 Measured Load History for Specimen 1
3.4 Measured Load History for specimen 2
3.5 Measured Load History for Specimen 3
3.6 Measured Load History for Specimen 4
3.7 Measured Load History for Specimen 5
3.8 Lateral Load Versus Lateral Displacement for Specimen 1
3.9 Lateral Load Versus Lateral Displacement for Specimen 2
3.10 Lateral Load Versus Lateral Displacement for Specimen 3
3.11 Lateral Load Versus Lateral Displacement for Specimen 4
3.12 Lateral Load Versus Lateral Displacement for Specimen 5
3.13 Base Moment Versus Lower Column Rotation for Specimen 1
3.14 Base Moment Versus Lower Column Rotation for Specimen 2
3.15 Base Moment Versus Lower Column Rotation for Specimen 3
3.16 Base Moment Versus Lower Column Rotation for Specimen 4
vi

3.17 Base Moment Versus Lower Column Rotation for Specimen 5
3.18 Strain Histories for Specimen 1
3.19 Strain Histories for Specimen 2
3.20 Strain Histories for Specimen 3
3.21 Strain Histories for Specimen 4
3.22 strain Histories for Specimen 5
4.1 Concrete Stress-Strain Relations Assumed forMoment-Curvature Calculations
4.2 Steel Stress-Strain Relations Assumed forMoment-Curvature Calculations
4.3 Computed Moment-Curvature Relations
4.4 Computed Uniaxial Moment-Axial Load Interaction Diagrams
4.5 Computed Biaxial Moment-Axial Load Interaction Diagrams
4.6 Computed Monotonic Load-Displacement Relations
4.7 Comparison Between Measured and Computed Base-Moment Strengths
4.8 contribution of Base Rotation to Total Column Deflection
4.9 Idealized Biaxial Hysteresis Relations for Load Steps "a"through "c"
4.10 Idealized Biaxial Hysteresis Relations for Load steps "a"through "f"
4.11 Idealized Biaxial Hysteresis Relations for Load Steps "a"through "i"
4.12 Idealized Biaxial Hysteresis Relations for Load steps "a"through "m"
4.13 Load Resistance Envelopes for Specimens 1, 2, and 3
4.14 Comparison of Loading stiffnesses
vii

CHAPTER 1
INTRODUCTION
1.1 General
Conventional seismic design of reinforced concrete buildings
is carried out considering one direction of seismic loading at a
time. Usually, the analysis model assumes elastic behavior and
monotonically appl ied loads. However, during an actual severe
earthquake, a building is loaded simultaneously along both axes
and may be sUbj ect to inelastic deformations with many load
reversals. Thus, the capacity of columns in the building to
absorb and dissipate energy during multi-axial loading becomes an
important factor in the design of the structure.
In conventional design practice, a column is designed
explicitly for an ultimate flexural moment, Mu ' shear, Vu ' and
axial load, Pu ' The required ductility of a column is assured
implicitly by establishing an upper and lower limit on the
longitudinal reinforcement ratio and by requiring a minimum
amount and spacing of transverse reinforcing. Adequacy of the
current design method in providing the required strength and
ductility under uniaxial loading reversals has been demonstrated
in previous experimental studies [7). Although behavior of
columns under biaxial loading has been studied previously [5),
adequacy of the design method for columns sUbjected to multi
axial loadings has not been fully investigated.
1.2 Scope
To further investigate behavior under mUlti-axial cyclic
loading, an experimental study was carried out in which five one
quarter scale reinforced concrete columns were sUbjected to
inelastic load histories with reversals. The columns were
nominally identical, and satisfied major requirements of current
codes for design of lateral load resisting columns in regions of
high seismic risk [8].
approximately 5000 psi.
Concrete had compressive strength of
Reinforcement was typical of Grade 60.
The longitudinal reinforcement ratio was 0.0226. Average axial
load was approximately O. 06f I cAg, in which f I c = concrete
compressive strength at time of test and Ag = gross area of
column cross section.
The columns were tested as cantilevers projecting from stiff
foundation blocks. cyclic lateral load histories were either
uniaxial along a principal axis of the column, uniaxial along a
skewed axis of the column, or a "cloverleaf" biaxial loading.
Axial loads were either constant or varied as a function of the
lateral load history.
The experiments and measured data are described in later
sections of this report. Existing analysis methods are used to
compute expected behaviors of the columns, including stiffness,
rebar slip effects, monotonic loading curves, and strength under
biaxial loading. computed and measured responses are compared.
2
1.3 Relevance of Experiment to Current Research
In addition to the importance (as described above) of
studying biaxial loading effects in general, it is noted that the
columns described in this report are nominally identical to
first-story columns of a six-story shake-table model tested in
the Earthquake Simulator Laboratory at the Earthquake Engineering
Research Center of the Berkeley campus [3]. The shake-table
model wassubj ected to "biaxial" excitations on the earthquake
simulator. Column data presented in this report will supplement
the study of the shake-table model.
3
CHAPTER 2
DESCRIPTION OF THE EXPERIMENT
2.1 TEST SPECIMENS
The columns are approximately one-quarter scale models of
columns considered representative of those occurring in modern,
moderately-tall, ductile concrete frames located in regions of
high seismic risk. The columns had the configuration depicted in
Fig. 2.1.
Each column was a 21. 5 in. long cantilever, having gross
cross section of 5 in. by 6.5 in. LongitUdinal reinforcement
comprised #3 deformed bars at each corner, two #2 deformed bars
(0.049 in. 2 cross section) along each long face, and one #2 bar
deformed bar along each short face (Fig. 2.1). The longitudinal
reinforcement ratio, defined as the ratio between total
longitudinal steel area and gross column cross-sectional area,
was 0.0226. All longitudinal bars were anchored with 90-degree
hooks embedded 7-in. into a 13 -in. by 14-in. by 18-in.
reinforced concrete footing. Plain, gage No.9 wire (0.0123 in. 2
cross section) was used as transverse reinforcement in the
columns. starting from the top of footing, tie spacing was 1 in.
for the first nine inches followed by ties at 1.5 in. on centers.
According to prevailing codes [1 J, the first tie spacing above
the top of footing should have been 0.5 in. rather than 1 in.
Apart from this deviation, the columns satisfy current code
requirements for columns in ductile moment resisting frames
located in regions of high seismic risk [8J.
4
The test specimens will be designated as specimens 1 through
5, corresponding to chronology of the individual test dates. As
described in Sections 2.2 and 2.5, the designation also indicates
variations in concrete materials and test load histories. A
chronology of. construction and testing is in Table 2.1.
2.2 Materials
The test specimens were cast in a horizontal position in two
batches, specimens 1 through 3 in the first batch, and 4 and 5 in
the second. Photographs of the reinforcing cages and forms
before and after casting are in Fig. 2.2 and 2.3, respectively.
Details of the materials are given in the following tables
and figures: Concrete mix proportions (Table 2.2), concrete and
steel mechanical properties (Tables 2.3 through 2.5), and stress
strain curves (Fig. 2.4 and 2.5). It is noted that mechanical
properties of the longitudinal reinforcement were characteristic
of those usually obtained for Grade 60 reinforcement, with mean
yield stresses ranging from 60 to 73 ksi. Mean concrete
compressive strengths were approximately 5300 psi for specimens 1
through 3, and 4600 psi for specimens 4 and 5 at time of testing.
2.3 Loading Apparatus
The columns were tested in a horizontal position with the
weak direction (short column cross-sectional dimension) parallel
to the laboratory floor as shown in Fig. 2.6 and 2.7. The
footing block was shimmed and prestressed to a massive reinforced
concrete block before testing. Two 40-kip hydraulic actuators
5

(for lateral loads) and a hydraulic jack (for axial load) were
then attached to the "free" end of the column through a
specially-fabricated universal joint. The joint allowed forces
to be applied at the column end with negligible rotational
restraint.
The hydraulic pressure for the actuators and jack was
provided by three portable Haskel hydraulic pumps. The pumps
were controlled manually, with applied loads varied to follow
approximately the prescribed displacement or force histories.
2.4 Instrumentation and Data Acquisition
Instrumentation measured lateral column displacements,
column loads, deformations of the column near the base, and
strain of longitudinal reinforcement. The instrument locations
are shown schematically in Fig. 2.6, with a photograph of the
test setup in Fig. 2.7.
Displacements of the column were measured near the free end
of the column using LVDTs (linear voltage displacement
transducers). The LVDTs were mounted to a stiff reference frame
attached to the footing blocks, so that recorded displacements
are relative to the footing. Thus, any movement of the footing
blocks during testing does not influence the recorded
displacements.
Deformations of the column near the base were measured with
clip gages attached between the top of the foundation block and
an aluminum yoke that was fixed to the column concrete a distance
6
of 5 in. from the top of the foundation block. Three clip gages
were used, one at each of three corners of the yoke. Average
rotations about each axis along this length were calculated by
dividing the differences in relative displacements by the
distance between clip gages. It is noted that these rotations
include both the rotations due to slippage of the longitudinal
reinforcement in the footing and the flexural curvature in the
lower 5 in. of the column.
The hydraulic actuators and jack were mounted to strain
gaged load cells that were calibrated to obtain the applied
column load. Column base moments (at the top of footing) were
computed as the sum of (1) the primary moment due to lateral load
and (2) the secondary moment due to the axial load acting through
lateral deflections. The primary moment was calculated as the
product between lateral load and loading height. The secondary
moment (P-delta moment) was calculated according to the procedure
outlined in Fig. 2.8. As noted in the equation given in that
figure, the P-delta moment includes both the effect of the axial
load acting through lateral displacement of the column and the
effect of the horizontal component of the "axial" load acting
through column height.
Weldable strain gages having I-in. gage length were
installed on two longitudinal bars located along a diagonal of
the column cross section (Fig. 2.1 and 2.6). The gages were
centered 0.5 in. from the face of the footing block.
signals from all electronic instruments were scanned at
7

discrete intervals using a low-speed scanner box. The signals
were stored digitally on a computer disk. In addition, signals
from displacement and load gages were recorded in analog form on
X-Y and X-Y-Y' plotters. The test program was controlled
manually by monitoring the plotted signals.
All specimens were whitewashed to make cracks in the
concrete more visible. Cracks were marked when the peak
displacement in each direction of a given cycle was reached.
Maximum crack width was also recorded at this time.
2.5 Test Procedure
The footing block of a specimen was shimmed and then
prestressed to a massive concrete block prior to testing.
Instrumentation was then installed and zero values set, followed
by attachment of the loading jack and actuators. Testing began
within an hour of setting zero values for the instruments and
attaching the jack and actuators. The load history was different
for the different test specimens. The target load/deformation
histories for the specimens are shown in Fig. 2.9.
descriptions of the load history of each specimen follow.
Brief
SPECIMEN 1: Uniaxial lateral loading about the weak axis, withconstant axial load of 10 kips
SPECIMEN 2: Biaxial lateral loading with column tipdisplacements along an axis at 45 degrees relativeto the principal axes of the column cross section,with constant axial load of 10 kips.
SPECIMEN 3: Biaxial lateral loading with column tipdisplacements following a "cloverleaf" pattern,with constant axial load of 10 kips.
8

SPECIMEN 4: Biaxial lateral loading with column tipdisplacements along an axis at 45 degrees relativeto the principal axes of the column cross section,with axial load varying from 0.5 to 20 kips.
SPECIMEN 5: Biaxial lateral loading with column tipdisplacements following a "cloverleaf" pattern, withaxial load varying from 0.5 to 20 kips.
The axial loads for specimens 4 and 5 varied with the tip
displacement in the weak direction. For a given displacement
cycle, the axial load varied approximately linearly from 10 kips
at zero displacement to 20 kips at the maximum positive
displacement for that cycle. For loading in the negative
direction, the axial load varied approximately linearly from 10
kips at zero displacement to 0.5 kips at the most negative
displacement for that cycle.
In the early stages of loading before reinforcement yielded,
loading was controlled by the applied lateral load. For all
specimens, the first cycles were at forces corresponding
approximately to first cracking, followed by loading to
approximately 40% of yielding, followed by loading approximately
to initial yielding of reinforcement, as determined for specimen
1. After reinforcement yielded, loading was controlled by the
magnitude of the measured tip displacement.
Two complete cycles were carried out at each level of
loading (Fig. 2.9). The tip displacement was increased
progressively until lateral displacement reached 0.96 in. (5.3%
of specimen height measured from top of footing). After reaching
the maximum displacement for each cycle, the hydraUlic equipment
was not manually adjusted for the period of time (approximately
9

ten minutes) that damage was observed and recorded. Some drop in
hydraulic pressure typically was observed during this time.
10

CHAPTER 3
EXPERIMENTAL RESULTS
3.1 summary of Data
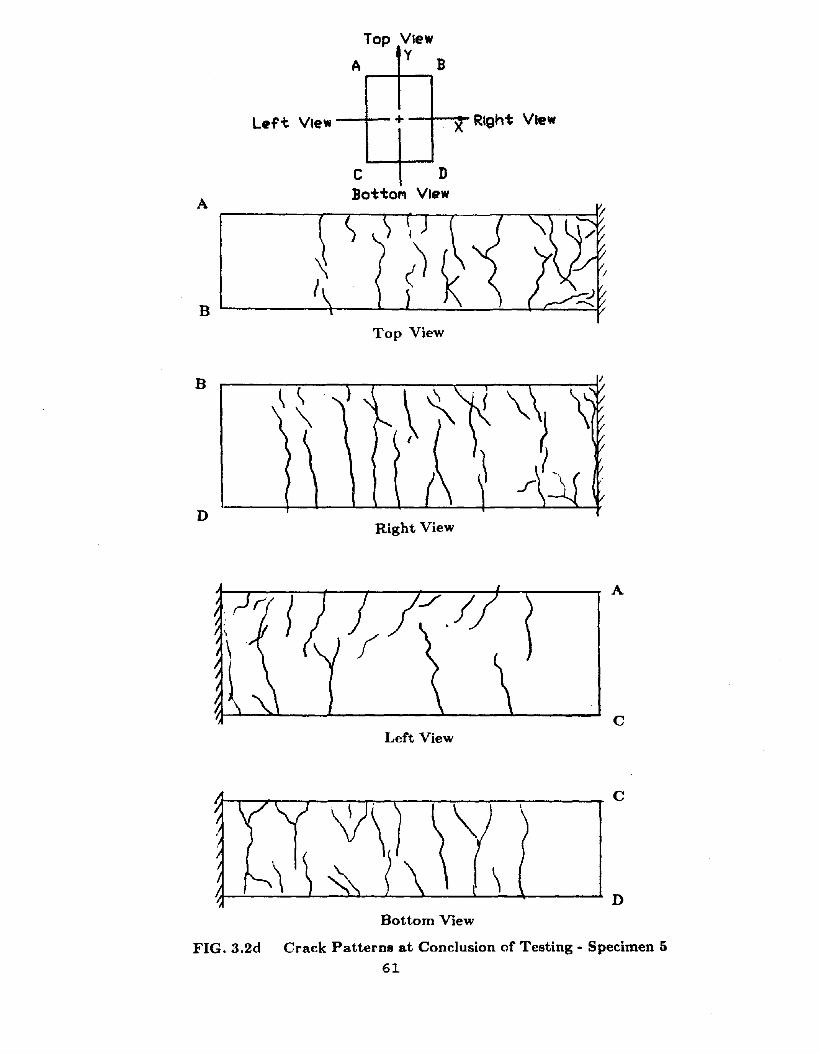
Observed damage is summarized in photographs and crack
diagrams in Fig. 3.1 and 3.2, respectively. Measured load
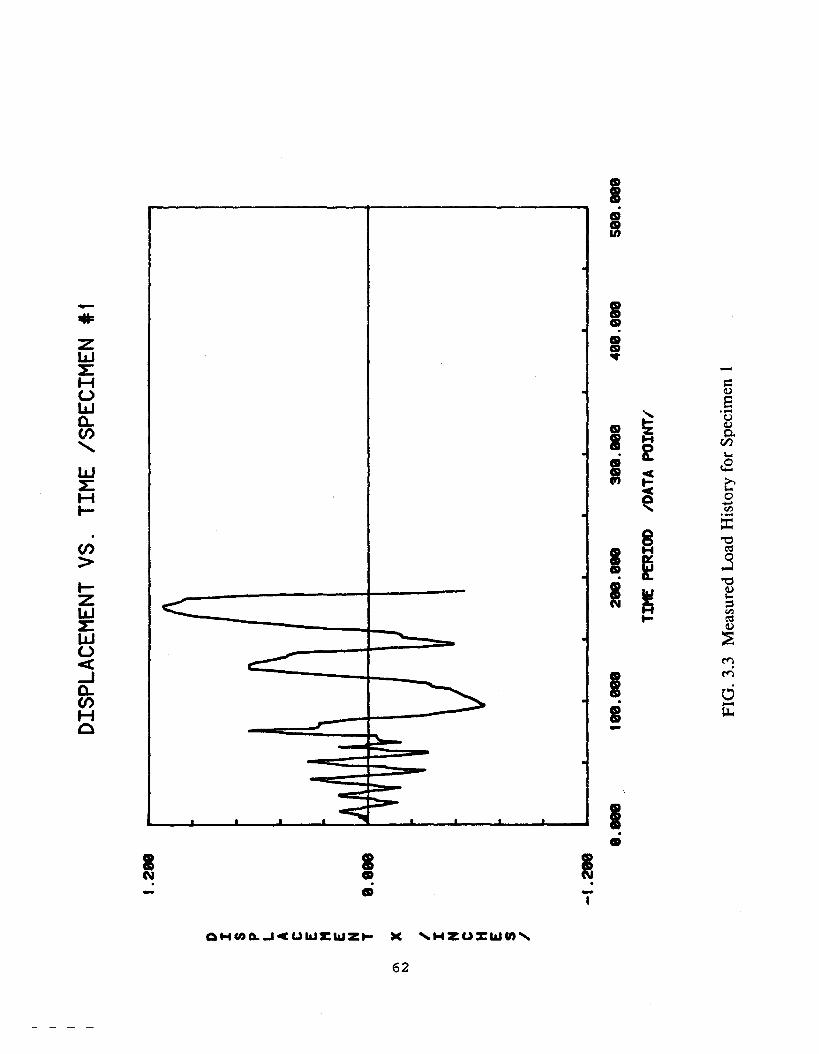
histories are presented in Fig. 3.3 through Fig. 3.7 (in these
figures, one unit of "time" is defined to pass whenever data
readings are taken). Lateral load versus lateral displacement
along each principal axis is presented in Fig. 3.8 through Fig.
3.12. Similarly, relations between base moment (corrected to
account for second-order effects) and base rotation along the
lower five inches of the column are presented in Fig. 3.13
through Fig. 3.17. Reinforcement strain gage readings are
plotted versus time in Fig. 3.18 through Fig. 3.22. A summary of
selected experimental results is in Table 3.1.
3.2 Visible Damage
Several observations are made regarding crack patterns,
and apparent failure modes (Fig. 3.1 and 3.2).
(1) Primary cracks were generally perpendicular to the
longitudinal axis of the columns, and were apparently due to
flexural effects.
(2) As the load increased to yield in either direction, minor
diagonal tension cracks were observed. For specimen 1, the
diagonal cracks formed only on the two faces parallel to the
direction of lateral load. For the other specimens, the diagonal
cracks formed on all faces. Although flexural cracks
11

predominated, the diagonal tension cracks indicate that shear was
a contributing factor in behavior of the test specimens.
(3) Cracks generally closed when the loading fell below
approximately the load that first caused cracking. This is
probably attributable to the presence of axial load on the
column.
(4) Between column end displacements of 0.32 in. and 0.64 in.,
and thereafter, development of new cracks slowed. As larger
displacements were applied in this range of loading, crack width
in existing cracks became larger.
(5) The widest crack in all specimens was at the intersection
between the column and the footing block, indicating the
occurrence of slip of longitudinal bars from the footing.
However, the width of these cracks could not be determined
because the crack grew partially below the footing surface.
(6) For specimens 2 through 5, spalling of concrete cover
initiated at the corners of the column near the footing during
displacement cycles of 0.32 in. or 0.64 in. Specimen 1 did not
begin spalling until the displacement cycle to 0.96 in.
(7) For specimens 2 through 5, total spalling of concrete cover
near the corners occurred for displacements in the range between
0.64 in. 0.96 in. In specimens 2 and 4, only two diagonal
corners spalled, whereas in specimens 3 and 5, all four corners
spalled and small portions of cover adjacent to diagonal tension
cracks showed minor spalling.
(8) The primary failure mode of all specimens was by flexure.
As gaged by the amount and distribution of diagonal cracks, shear
12

also played a minor role in the failure of specimens 3 and 5.
Examination of the specimens revealed that longitudinal
reinforcement did not buckle.
3.3 Lateral Load-Displacement Relations
Relations between lateral load and displacement are plotted
in Fig. 3.8 through 3.12. Lateral loads reported in those
figures are readings obtained directly from load cells in the
lateral-load actuators, without a correction for the lateral
component of the force in the axial load jack. Lateral
displacements were determined directly from readings of LVDTs
(Fig. 2.6), and reflect displacement of the column tip relative
to a rigid reference frame mounted to the footing block. Twist
of the column end about the column longitudinal axis could be
determined from the available LVDT readings, and was observed to
be negligible.
Based on the envelope of load-displacement responses in Fig.
3.8 through 3.12, three distinctly different ranges of stiffness
can be observed, the first corresponding roughly to loading
before flexural cracking, the second corresponding to the range
between cracking and yield of longitudinal bars, and the third
after yield. After the column longitudinal bars had yielded, and
for displacement cycles that did not significantly exceed prior
displacement maxima, a reduction in both stiffness and resistance
were noticeable. When sUbj ected to increased displacements,
resistance was mostly regained.
13
Hysteretic responses for specimens 1, 2, and 4 are similar
to those commonly observed for reinforced concrete elements
sUbjected to axial loads and not having significant shear or
anchorage deterioration [7]. Hysteretic relations for specimens
3 and 5 show loads "relaxing" for lateral displacements near the
maximum and near zero, without significant change in
displacement. The relaxation is attributed to the nature of the
biaxial loading history, as follows. As shown in Fig. 2.9, drift
was first imposed in one direction while ideally fixing
displacement in the transverse direction, and then the axes of
loading were switched. The relaxation shown in Fig. 3.10 and
3.12 is concurrent with commencement of loading in the
perpendicular direction. section 4. 5 of this report discusses
this phenomenon further.
3.4 Base Moment-Base Rotation Relations
Measured relations between base moment and base rotation are
in Fig. 3.13 through 3.17. As noted in Section 2.4 and
illustrated in Fig. 2.8, base moment includes second-order
effects of the axial load acting through lateral displacements.
Base rotations are the total rotation of the column cross-section
at 5 in. from the top of the footing relative to the top of the
footing (Section 2.4 and Fig. 2.6). Thus, the reported rotations
include effects both of column flexure and reinforcement slip
from the footing.
In general, the shape of the moment-rotation relation for
each specimen (Fig. 3.13 through 3.17) appears similar to the
14

corresponding lateral load-displacement relation (Fig. 3.8
through 3.12). The similarity supports a hypothesis that
flexural and bond slip deformations in the "plastic-hinge" region
of the column were the predominant actions contributing to
overall specimen deformation. Section 4.4 of this report
examines the contribution quantitatively.
3.5 strain Histories
strain histories (Fig. 3.18 through 3.22) indicate that
corner longitudinal bars experienced greater inelastic
compression and tension strains in specimens subj ected to the
biaxial cloverleaf lateral loading than in the single specimen
(specimen 1) subj ected to uniaxial lateral loading. The high
strain in the corner portion of the column is consistent with the
observed damage (Fig. 3.1 and 3.2). The observation that the
longitudinal bars did not buckle, despite having undergone many
cycles of high inelastic compression and tension, supports a
conclusion that current detailing procedures are effective in
controlling buckling of reinforcement. The strains developed in
the columns loaded along an axis skewed to the principal axes
(specimens 2 and 4) were less than in the other specimens because
the gaged bars were located (by oversight) on the diagonal axis
of the column transverse to the diagonal of lateral loading.
15

CHAPTER 4
DISCUSSION OF TEST RESULTS
4.1 Introductory Remarks
Data present in Chapter 3 are analyzed and discussed in this
chapter. Computed responses are presented and compared with
measured responses. Sources of deformation in the columns are
analyzed. A summary of the effects of load history on behavior
concludes the chapter.
4.2 Computed Monotonic Behavior
Responses of the columns to monotonically-increasing loads
were computed for comparison with measured responses. Included
in the computed responses are uniaxial and biaxial moment
curvature relations, biaxial moment-axial load interaction
diagrams, shear strengths, bar slip relations, and uniaxial load
deflection relations. These are described in the following
subsections.
(a) Moment-Curvature Relations
Moment-curvature relations were computed for monotonic
loading using conventional assumptions that plane sections remain
plane (including perfect bonding between steel and concrete),
stresseS are related directly to strain, and relations of statics
are valid. A computer program was written to facilitate
computation of the relations. The computational scheme is as
follows:
(1) The cross section is sUbdivided into a grid of small
16

rectangular elements (fiber approach (15]). A material property
is assigned to each of these small elements. Additional elements
on the cross section are defined for the reinforcement.
(2) A strain field is imposed on the cross section, defined by a
maximum concrete strain, depth of neutral axis, and inclination
of neutral axis. The strain at the center of each element
(fiber) of the cross section is computed from geometry
considerations.
(3) Given the strain at the center of each element, stress at
the center of each element is determined from a predefined
stress-strain relation. An average force in each element is
defined as the product between the stress at the center of the
element and cross-sectional area of the element.
(4) Axial load and moment about each axis are determined by
summing effects of averages forces acting on each element of the
cross section. A correction is made for concrete displaced by
reinforcement. Axial load is defined to be acting at the
geometric centroid of the gross concrete cross section. Moments
are defined relative to that centroid.
For the columns in this study, unconfined and confined
concretes were defined using properties measured from test
cylinders, and analytical relations defined by Scott and Park
[13] . The assumed curves are plotted in Fig. 4.1. Assumed
stress-strain relations for reinforcement are in Fig. 4.2.
Computed moment-curvature relations, for the range of axial
loads experienced during the experiments, are in Fig. 4.3. The
17
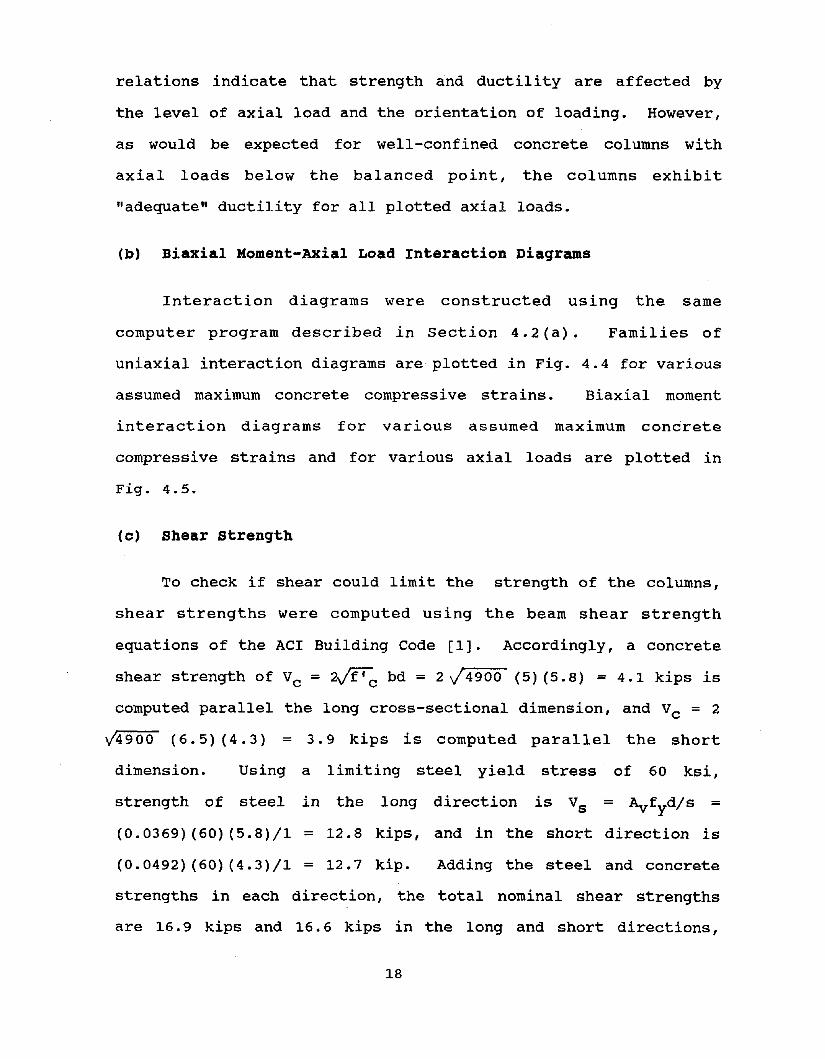
relations indicate that strength and ductility are affected by
the level of axial load and the orientation of loading. However,
as would be expected for well-confined concrete columns with
axial loads below the balanced point, the columns exhibit
"adequate" ductility for all plotted axial loads.
(b) Biaxial Moment-Axial Load Interaction Diagrams
Interaction diagrams were constructed using the same
computer program described in Section 4.2 (a) . Families of
uniaxial interaction diagrams are plotted in Fig. 4.4 for various
assumed maximum concrete compressive strains. Biaxial moment
interaction diagrams for various assumed maximum concrete
compressive strains and for various axial loads are plotted in
Fig. 4.5.
(c) Shear strength
To check if shear could limit the strength of the columns,
shear strengths were computed using the beam shear strength
equations of the ACI Building Code [lJ. Accordingly, a concrete
shear strength of Vc = 2~ bd = 2 /4900 (S) (S. 8) = 4.1 kips is
computed parallel the long cross-sectional dimension, and Vc = 2
14900 (6.S) (4.3) = 3.9 kips is computed parallel the short
dimension. Using a limiting steel yield stress of 60 ksi,
strength of steel in the long direction is Vs = Ayfyd/s =
(0.0369) (60) (S. 8) /1 = 12.8 kips, and in the short direction is
(0.0492) (60) (4.3)/1 = 12.7 kip. Adding the steel and concrete
strengths in each direction, the total nominal shear strengths
are 16.9 kips and 16.6 kips in the long and short directions,
18
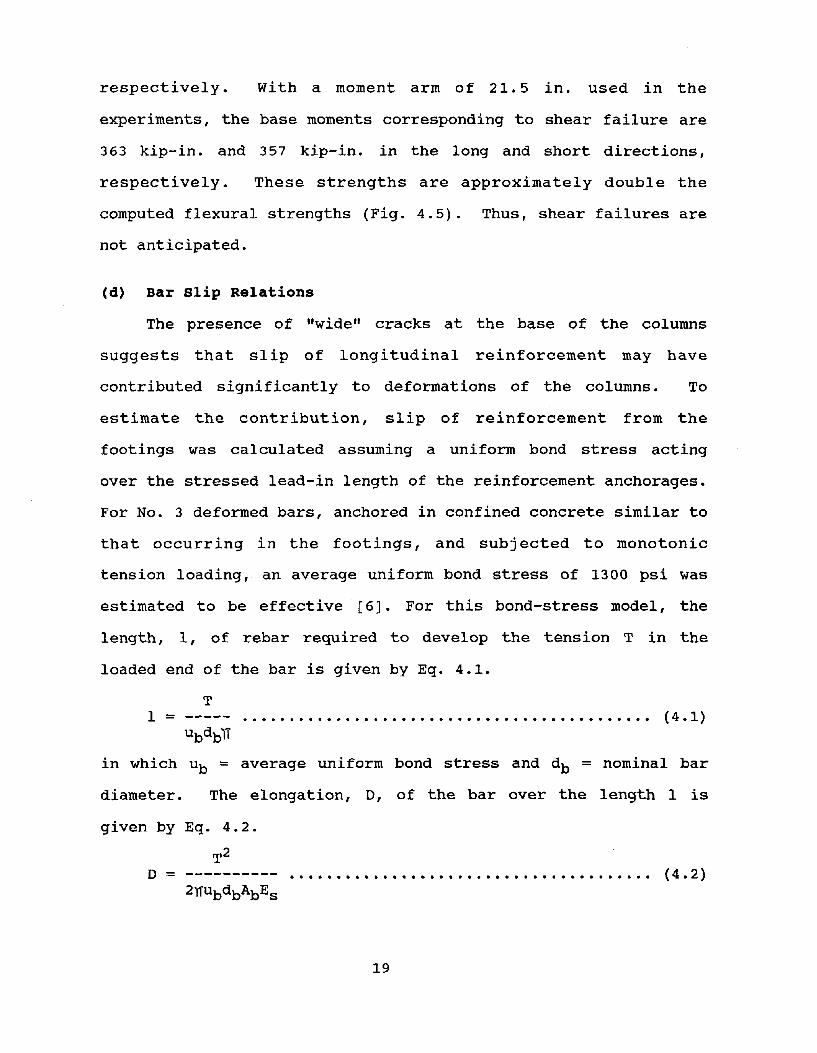
respectively. Wi th a moment arm of 21.5 in. used in the
experiments, the base moments corresponding to shear failure are
363 kip-in. and 357 kip-in. in the long and short directions,
respectively. These strengths are approximately double the
computed flexural strengths (Fig. 4.5). Thus, shear failures are
not anticipated.
Cd) Bar Slip Relations
The presence of "wide" cracks at the base of the columns
suggests that slip of longitudinal reinforcement may have
contributed significantly to deformations of the columns. To
estimate the contribution, slip of reinforcement from the
footings was calculated assuming a uniform bond stress acting
over the stressed lead-in length of the reinforcement anchorages.
For No. 3 deformed bars, anchored in confined concrete similar to
that occurring in the footings, and sUbjected to monotonic
tension loading, an average uniform bond stress of 1300 psi was
estimated to be effective [6]. For this bond-stress model, the
length, 1, of rebar required to develop the tension T in the
loaded end of the bar is given by Eq. 4.1.
T1 = ----- (4 1).. ... .. ......... ............................ .
Ubdb'tT
in which ub = average uniform bond stress and db = nominal bar
diameter. The elongation, 0, of the bar over the length 1 is
given by Eq. 4.2.
T2
D = ---------- ••••••••••••••••••••••••••••.•••••••••• (4.2)
19

in which Ab = cross-sectional area of the bar and Es = Young's
modulus for the bar.
Values for 1 and D are tabulated in Table 4.1 for different
values of the steel stress, f s ' and with T in Eq. 4.1 and 4.2
taken equal to the product between f s and Ab . Even when stressed
to yield (approximately 70 ksi in Table 4.1), the length 1 does
not exceed the available lead-in length for the bars in the
footing (Fig. 2.1). Thus, deformations along the bent portion of
the hook and beyond need not be considered according to the
analytical model. Accordingly, total slip of the bar from the
footing is equal to the value of D.
Displacement at the end of the column due to bar slip is
computed as the product between column height and rotation due to
bar slip. Rotation due to bar slip is computed as the ratio
between bar slip, D, and the distance between the bar and the
neutral axis for bending. The distances are taken equal to 3.1
in. and 4.1 in. for bending about the weak and strong axes,
respectively. Computed column end displacements, Dx and Dy , for
bending about the weak and strong axes , respectively, are
tabulated in Table 4.1.
(d) Calculated Monotonic Load-Displacement Relations
Relations between load and displacement at the column end
were computed by numerically integrating calculated curvatures
over height and adding calculated displacements due to bar slip
from the foundation (Table 4.1).
20
The relations are plotted in
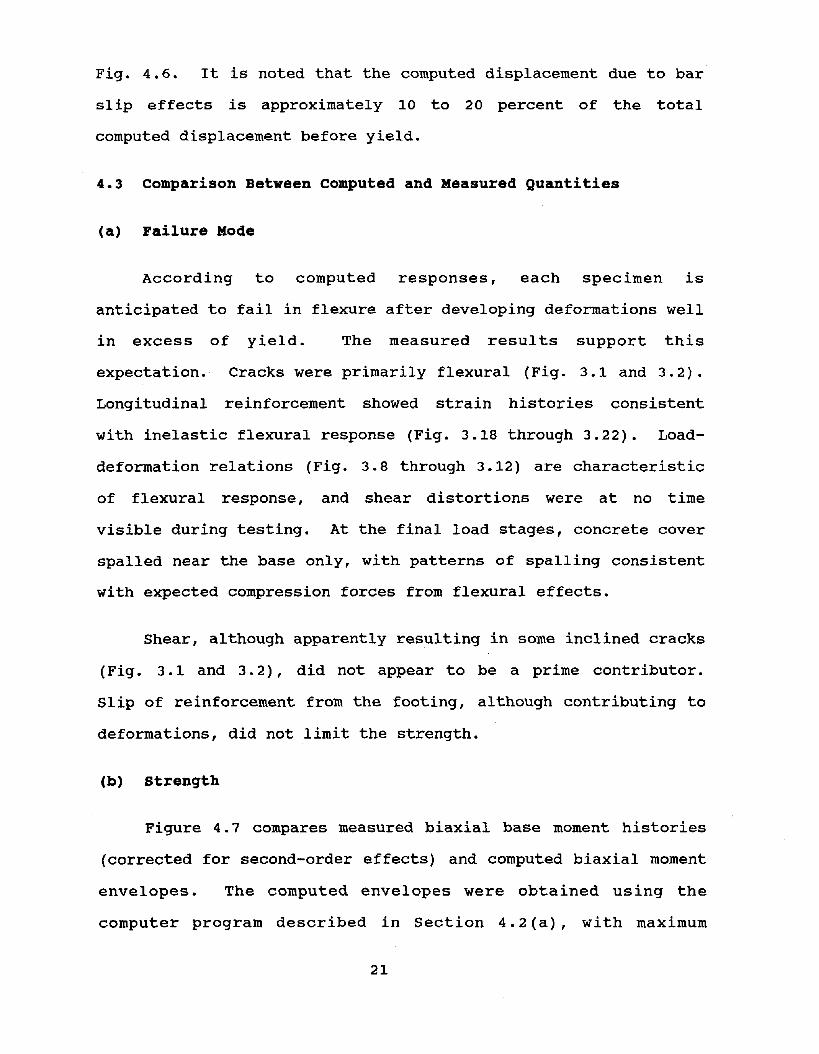
Fig. 4.6. It is noted that the computed displacement due to bar
slip effects is approximately 10 to 20 percent of the total
computed displacement before yield.
4.3 comparison Between Computed and Measured Quantities
(a) Failure Mode
According to computed responses, each specimen is
anticipated to fail in flexure after developing deformations well
in excess of yield. The measured results support this
expectation. Cracks were primarily flexural (Fig. 3.1 and 3.2).
Longitudinal reinforcement showed strain histories consistent
with inelastic flexural response (Fig. 3.18 through 3.22). Load
deformation relations (Fig. 3.8 through 3.12) are characteristic
of flexural response, and shear distortions were at no time
visible during testing. At the final load stages, concrete cover
spalled near the base only, with patterns of spalling consistent
with expected compression forces from flexural effects.
Shear, although apparently reSUlting in some inclined cracks
(Fig. 3.1 and 3.2), did not appear to be a prime contributor.
Slip of reinforcement from the footing, although contributing to
deformations, did not limit the strength.
(b) strength
Figure 4.7 compares measured biaxial base moment histories
(corrected for second-order effects) and computed biaxial moment
envelopes. The computed envelopes were obtained using the
computer program described in Section 4.2(a), with maximum
21

concrete compression strain of 0.01. For specimens 4 and 5, for
which axial load during testing varied between 0.5 and 20 kips
compression, three computed biaxial moment envelopes are shown,·
one each for axial compression of 0.0 kip, 10 kips, and 20 kips.
The data in Fig. 4.7 indicate that measured biaxial moment
strengths compare well with computed strengths. In general,
measured moment strengths exceed computed values. Although no
detailed analysis of the overstrengths will be presented in this
report, it is possible to attribute the overstrength to a
combination of several effects. For one, measured compression
strains in reinforcement exceeded the value of 0.01 assumed for
concrete in the analysis. As shown in Fig. 4.4, flexural
strengths are higher for the range of axial loads under
consideration if larger compression strains are assumed. In
addition, Bauschinger effects due to inelastic load reversals
generally result in higher reinforcement stresses for a given
strain than recognized in the scheme used to calculate member
strengths under monotonic loading. Reinforcement is also likely
to reach higher stresses in the columns than in coupon tension
tests because the smaller length under maximum tension in a
column is not likely to contain a weak "link" that limits
strength in a coupon tension test. Column strength is also
increased due to increases in concrete strength and maximum
strain capacity that result from high strain gradients and
confinement of concrete by the large footing block at the column
base. All of these effects are likely to increase the column
22
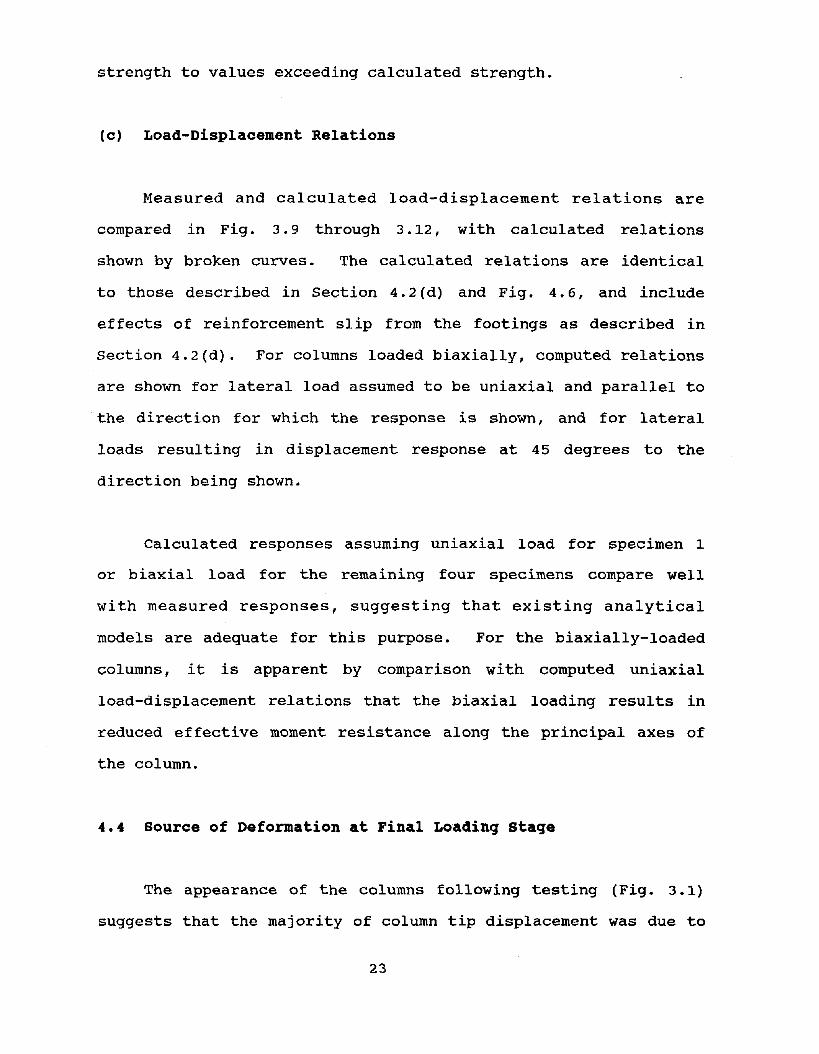
strength to values exceeding calculated strength.
(c) Load-Displacement Relations
Measured and calculated load-displacement relations are
compared in Fig. 3.9 through 3.12, with calculated relations
shown by broken curves. The calculated relations are identical
to those described in Section 4.2(d) and Fig. 4.6, and include
effects of reinforcement slip from the footings as described in
section 4.2(d). For columns loaded biaxially, computed relations
are shown for lateral load assumed to be uniaxial and parallel to
the direction for which the response is shown, and for lateral
loads resulting in displacement response at 45 degrees to the
direction being shown.
Calculated responses assuming uniaxial load for specimen 1
or biaxial load for the remaining four specimens compare well
with measured responses, suggesting that existing analytical
models are adequate for this purpose. For the biaxially-loaded
columns, it is apparent by comparison with computed uniaxial
load-displacement relations that the biaxial loading results in
reduced effective moment resistance along the principal axes of
the column.
4.4 Source of Deformation at Final Loading stage
The appearance of the columns following testing (Fig. 3.1)
suggests that the majority of column tip displacement was due to
23
inelastic rotations occurring at the base of the columns. In
support of this observation, column tip displacements about both
principal axes due to rotations measured by clip gages at the
base of the column were computed for comparison with measured
displacements. For this purpose, the rotation measured over a
five-in. gage length by the clip gages was assumed to be
concentrated at the center of the five-in. length as shown at the
top of Fig. 4.8. Computed displacements due to base rotations
are compared with actual measured maximum displacements at the
bottom of Fig. 4.8. According to this calculation, base
rotations along the bottom five in. of the column contributed
between 82 and 92 percent of the total maximum tip displacement.
A conventional design practice [11] is to assume that all
inelastic action is attributable to uniform flexural curvature
within a plastic hinge region at the end of an element. For the
columns of this study, a plastic hinge length equal to
approximately five in. is appropriate. Hence, rotations inferred
from the clip-gage readings at the base of the column are
effectively the equivalent plastic hinge rotations.
If the measured base rotations are assumed to be
attributable to uniform flexural curvature over the plastic hinge
length, then for specimen 1, for example, the computed curvature
is equal to (0.06 rad)/(5 in.) = 0.012 rad/in. In addition, if
the distance from the neutral axis to the tension reinforcement
is taken equal to the distance between extreme layers of
24
longitudinal reinforcement, that is, 3.0 in., then the expected
strain in longitudinal reinforcement is equal to (0.012
rad/in.)(3 in.) = 0.036 in./in. Actual maximum measured strain
for specimen 1 was 0.029 in./in. Thus, the method for estimating
strain produces fairly good estimates of maximum expected strain.
It is noted in relation to the preceding paragraph that the
calculated strain exceeds the measured strain, even though the
measured strain is likely to be a maximum value whereas the
calculated strain is an average. A plausible reason for this
apparent inversion of magnitudes is that the calculation method
does not consider the effect of rebar slip from the footing
blocks. Because of slip of the reinforcement, the column base
rotation is developed by reinforcement strains over a longer
length, thereby reducing the actual required reinforcement strain
over that length.
4.5 Effect of Load History on Load-Displacement Response
As described in Chapter 2, the columns were loaded to effect
displacement histories that followed prescribed patterns (Fig.
2.8 and 3.3 through 3.7). Under uniaxial lateral loading, either
along one principal axis as for specimen 1 or along an inclined
axis as for specimens 2 and 4, the resulting hysteretic relations
between lateral load and displacement (Fig. 3.8, 3.9, and 3.11)
show familiar patterns of slightly spindle-shaped loops. For
specimens 3 and 5, which were loaded in a cloverleaf pattern of
displacements, the hysteretic loops (Fig. 3.10 and 3.12) and
25

biaxial moment interactions (Fig. 4.7c and 4.7e) follow
unfamiliar patterns. The hysteretic responses of specimens 3 and
5 are explained qualitatively in the following paragraphs.
Figure 4.9 through 4.12 present an idealized chronological
sequence of displacement paths, load-deformation loops, and
biaxial moment interaction diagrams. The diagrams are considered
representative of specimen 3, with constant axial load, and for
lateral loads inducing inelastic response. Similar diagrams can
be plotted for specimen 5, but these would be complicated
somewhat by the simultaneous variations of axial loads during the
loading sequence. To clarify the presentation, the diagrams are
plotted successively on several sheets.
The diagram at the upper left of each sheet of Fig. 4.9
through 4.12 represents the displacement path during a selected
portion of one complete cloverleaf loading cycle. Points "a"
through "m" denoted on the displacement path occur successively.
The second pair of diagrams at the bottom of each sheet
represents the load-deformation relation along "X" and "Y" axes
of the column, with points "a" through "m" from the displacement
history designated at appropriate points. The diagram at the
upper right of each sheet represents the relation between base
moments about each axis, again with points "a" through "m"
designated at appropriate points. There is no attempt to present
the diagrams to any prescribed scale.
Figure 4.9 plots idealized responses for roughly the first
26

quarter cycle (points "a" through "c"). At first loading, the
displacement is increased in the "X" direction to point "a" (Fig.
4.9a). The load-deformation relation in the "X" direction loads
to point "a" (Fig. 4.9c), whereas no loading is noted in the "Y"
direction (Fig. 4.9d). The moment interaction diagram (Fig.
4.9b) shows moment only about the "Y" axis (that is, in the "X"
direction) •
As the displacement progresses to point "b" (Fig. 4.9a), the
load in the "Y" direction increases (Fig. 4.9d). As the moment
Mx increases for loading in the "Y" direction, flexural strength
considerations require that the moment My, developed during
loading to point "a", must decrease (Fig. 4.9b). The decrease in
moment My is noted also in the load-deformation relation in the
"X" direction (Fig. 4.9c). In addition, the displacement in the
"X" direction increases slightly as the load in that direction
relaxes (Fig. 4.9c). The magnitude of this increase in
displacement is partly a function of the test specimen and partly
a function of the loading system used in the experiments.
Similarly, moving from point "b" to point "c", the displacement
in the "X" direction is decreased, which simultaneously results
in an inelastic relaxation of load and displacement in the "Y"
direction.
As the loading is continued into the second quarter cycle
(points "d" through "f" in Fig. 4.10), similar behavior occurs.
Moving from point "c" to point lid", the column is loaded from a
27

positive "Y" displacement to an equally large negative "Y"
displacement (Fig. 4.10a). There is a simultaneous drop in load
in the "X" direction (Fig. 4.10c) as the cross section realigns
to the newly-imposed strain distribution. Moving to point "e",
displacement is applied in the positive "X" direction, as in the
first quarter cycle, with the characteristic relaxation of load
in the "Y" direction (Fig. 4.10d) as moments follow the biaxial
moment interaction diagram (Fig. 4.10b). A familiar pattern is
repeated in moving to point "f".
The diagrams in Fig. 4.11 and 4.12 continue the pattern
described in the preceding paragraphs. The completed idealized
hysteretic loops of Fig. 4.12 are qualitatively similar to those
measured for specimens 3 and 5 (Fig. 3.5 and 3.7, 3.10 and 3.12,
and 4.7).
The influence of biaxial lateral loading on the load
displacement envelopes is illustrated by Fig. 4.13. Figure 4.13a
is an envelope relation of lateral load in the weak direction for
various loading points for specimens 1, 2, and 3, with loading
points illustrated in Fig. 4.13c. As would be expected from
well-known principles for columns under uniaxial and biaxial load
[llJ, specimen 2 (with loading applied approximately along a
diagonal) has less lateral-load resistance than specimen 1 (with
load along the principal axis). For specimen 3, two different
points are plotted. Points "3a" correspond to first loading to
maximum displacement in the weak ("X") direction (Fig. 4.13c).
The envelope for these points is lower than those for specimen 1,
indicating that prior biaxial loading has reduced the effective
28

resistance of specimen 3. Points II 3b" , occurring after the
column has subsequently been loaded in the strong (IIY") direction
(Fig. 4 .13c), reveal even lower resistance (Fig. 4. 13a) ,
indicating that if transverse loads are applied while strength is
being maintained in one direction, a further reduction in load
resistance will occur. Fig. 4.13b presents similar data for the
strong ("yn) direction of loading.
The loading history also influences the loading stiffness.
Figure 4.14 plots loading paths (base moment about the llyn axis
versus base rotation in the same direction) in the positive
loading direction for all specimens. In those figures, different
loading paths are designated with a number. The number
corresponds to a specific displacement cycle of the loading
program, so that, for example, the number "6" for all specimens
corresponds nominally to the same loading cycle "6" for all
specimens. It is concluded from the data in Fig. 4.14 that
loading stiffness in a given principal direction is reduced
significantly by biaxial lateral loading, the biaxial loading
either having been applied previous to or simultaneous with the
current loading.
4.6 Effect of Load History on Damage
The different load histories resulted in markedly different
amounts of damage in the different columns. Photographs of the
five specimens at the conclusion of testing are shown in Fig.
3.1. The photographs were taken after loose concrete was removed
by hand. Even though the columns were each loaded with the same
29

number of cycles in the weak direction, and to the same lateral
displacement, differences in visible damage are clear. The
uniaxially-loaded column, specimen 1, shows very little concrete
spalling. The columns loaded along the diagonal, specimens 2 and
4, show significantly greater damage in the corners along the
loading diagonal. Once the damage began in the corners for those
columns, it spread more readily to other parts of the column
perimeter. The columns with cloverleaf displacement histories,
specimens 3 and 5, show the most severe damage, with major
spalling around the entire perimeter at the base of the column.
In addition to effects of the displacement history,
examination of the photographs in Fig. 3.1 reveals that the
columns with varying axial load, specimens 4 and 5, had more
severe damage than corresponding specimens 2 and 3, respectively,
which underwent the same lateral displacement histories with
constant axial load.
The greater extent of damage in columns with cloverleaf
loading histories (specimens 3 and 5) relative to the uniaxially
loaded column (specimen 1) is also apparent in longitudinal
reinforcement strain histories (Fig. 3.18, 3.20, and 3.22).
(strain-history data for specimens 2 and 4 are not indicative of
the severity of loading, as the measured strains are for bars not
located in the most-severely strained corners of those columns.)
The extensive variation in apparent damage, despite
similarities in maximum lateral drift, is an indicator that
response levels in real structures cannot be closely approximated
30

based on visible damage following an earthquake. A biaxially
loaded column, as might be found in a real structure following an
earthquake, reveals damage significantly different from a similar
column subjected in the laboratory to uniaxial loading.
31
CHAPTER 5
SUMMARY AND CONCLUSIONS
An experimental program was conducted to study the behavior
of reinforced concrete columns sUbjected to inelastic multiaxial
loads with reversals. Five nominally-identical, one-quarter
scale columns were tested in the program. The test specimens
represented columns considered typical of those occurring in
moderately tall buildings designed to satisfy current code
requirements for reinforced concrete construction in regions of
high seismic risk.
The columns were tested as cantilevers projecting from stiff
foundation blocks, with lateral and axial loads applied at the
end of the cantilever. The main variable in the experiments was
the load history. Three columns were tested with constant axial
load, one with uniaxial lateral load directed along a principal
axis of the column, one with uniaxial lateral load directed along
a skew axis of the column, and one with biaxial lateral loads
resulting in a "cloverleaf" displacement pattern. Two remaining
columns were tested under varying axial loads, with lateral load
either applied uniaxially along a skewed axis or applied
biaxially to achieve a cloverleaf displacement pattern.
Experimental measurements include applied lateral loads, column
end displacements, longitudinal reinforcement strains, and column
base deformations.
This report documents the experiments and discusses observed
behavior both qualitatively and by comparison with analytically
32
computed responses. Major conclusions include the following.
(1) Lateral deformations of the columns were predominated by
rotations occurring within a length equal to approximately one
column width measured from the top of the footing. These
rotations are attributed to flexural curvature over this length
and to slip of reinforcement from the footing.
(2) Based on observed damage, and as supported by calculations,
lateral-load strength of the columns was limited by flexural
strength.
(3) Reinforcement details, which satisfied current codes for
ductile concrete frames in regions of high seismic risk, resulted
in satisfactory behavior. strength under load reversals was
sustained through displacements equal to approximately five
percent of column height (displacement ductility of approximately
six), and could probably have been sustained through larger
deformations had the test apparatus permitted further loading.
Buckling of reinforcement did not occur, despite spalling of
concrete cover and measured reinforcement compressive strains as
large as 0.04.
(4) Biaxial lateral loading influenced observed behavior.
Visible damage (concrete cracking and crushing) was notably more
extensive in the biaxially-Ioaded columns. Measured strains in
reinforcement, particularly in compression, were larger than for
the uniaxially-loaded columns. Measured strengths and
stiffnesses under biaxial loading were less than under monotonic
loading. Even columns loaded uniaxially at a given stage of
testing did not reach the uniaxially-measured strengths and
33

stiffnesses if those columns had been previously sUbjected to
transverse loading. In general, the state of damage worsened for
columns also sUbjected to axial load variations, even though the
maximum axial load in these experiments was less than half the
balanced axial load.
(5) Hysteretic relations under biaxial loading were strikingly
different from those measured for uniaxial loading.
(6) Measured strengths and load-deflection envelopes could be
reproduced reasonably well using existing analytical concepts for
reinforced concrete sections sUbjected to monotonic loading. The
analytical correlations were better for the columns loaded
uniaxially along the principle axis or along a skew axis than for
the columns loaded in the cloverleaf pattern.
(6) For columns loaded in the cloverleaf pattern, measured base
moments were closely bounded by biaxial moment envelopes
calculated assuming monotonically applied loads.
34

REFERENCES
1. American Concrete Institute, "Building Code Requirements forReinforced Concrete," (ACI 318M-83), Detroit, Michigan, 1984
2. American Concrete Institute, "CoIDIDentary on Building CodeRequirements for Reinforced Concrete," (ACI 318-83), Detroit,Michigan, 1983
3. Shahrooz, B. M., "Experimental Study of Seismic Response ofRIC Setback Buildings," Ph.D. Dissertation Submitted to theUniversity of California, Berkeley, September 1987.
4. Bertero, V.i Popov, E. and Wang, T., "Hysteretic Behavior ofReinforced Concrete Flexural Members with Special WebReinforcement," Report No. UCB/EERC-7 4/09, EarthquakeEngineering Research Center, University of California,Berkeley, California, 1974.
5. Desai, J. A. and Furlong, R. W., "Strength and stiffness ofReinforced Concrete Rectangular Columns Under BiaxiallyEccentric Thrust," University of Texas, Austin, Texas,January 1976.
6. Filippou, F. C. i Popov, E. and Bertero, V., "Effects of BondDeterioration on Hysteretic Behavior of Reinforced ConcreteJoints," Report No. UCB/EERC-83/19, Earthquake EngineeringResearch Center, University of California, Berkeley,California, August 1983.
7. Gill, W. D.; Park, R., and Priestley, M. J. N., "Ductilityof Rectangular Reinforced Concrete Columns With Axial Load,"Department of Civil Engineering, university of Canterbury,Christchurch, New Zealand, February 1979.
8. International Conference of Building Officials, uniformBuilding Code, Whittier, Ca., 1982.
9. Lai, S. i Will, G. and Otani, S., "Model For InelasticBiaxial Bending of Concrete Members," JOURNAL OF STRUCTURALENGINEERING, Vol. 110 No. 11, November 1984, pg. 2563 2584.
10. Maruyama, K. i Ramirez, H. and Jirsa J., "Short RC ColumnsUnder Bilateral Load Histories,: JOURNAL OF STRUCTURALENGINEERING, Vol. 110 No.1, January 1984, pg. 120 - 137.
11. Park, R. and Paulay, ., "Reinforced Concrete Structures,"John Wiley & Sons, New York, 1975.
35

12. Popov, E.~ Bertero, V. and Krawinkler, H., "Cyclic Behaviorof Three Reinforced Concrete Flexural Members With HighShear," Report No. UCB/EERC-72/05, Earthquake EngineeringResearch Center, university of California, Berkeley,California, 1972.
13. Scott, B. D. ~ Park R., and Priestley, M. J. N., "Stress Strain Relationships For Confined Concrete: RectangularSections," Department of civil Engineering, University ofCanterbury, Christchurch, New Zealand, February 1980.
14. Umehara, H. and Jirsa, J., "Short Rectangular RC ColumnsUnder Bidirectional Loading," JOURNAL OF STRUCTURALENGINEERING, Vol. 110 No.3, March 1984, PG. 605 - 618.
15. Zeris, C. A. , "Three Dimensional Nonl inear Response ofResponse of Reinforced Concrete Buildings," Ph.D.Dissertation Submitted to the University of California~
Berkeley, November 1986.
36
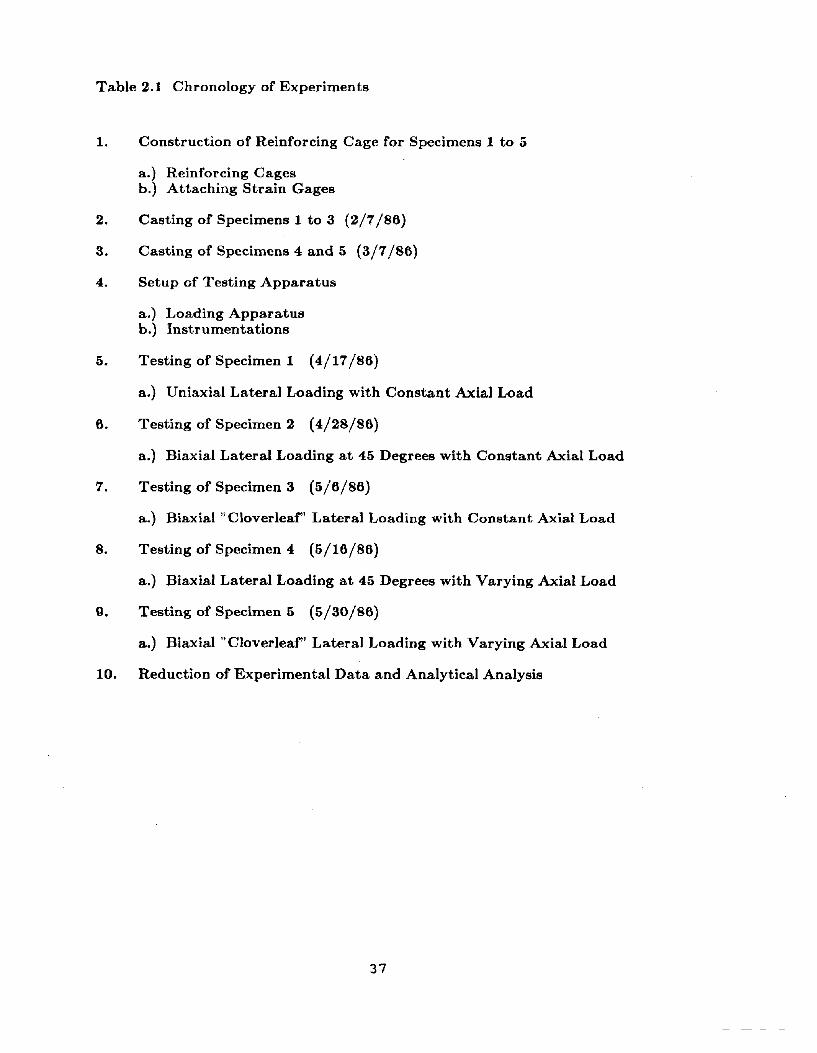
Table 2.1 Chronology of Experiments
1. Construction of Reinforcing Cage for Specimens 1 to 5
a.) Reinforcing Cagesb.) Attaching Strain Gages
2. Casting of Specimens 1 to 3 (2/7/86)
3. Casting of Specimens 4 and 5 (3/7/86)
4. Setup of Testing Apparatus
a.) Loading Apparatusb.) Instrumentations
5. Testing of Specimen 1 (4/17/86)
a.) Uniaxial Lateral Loading with Constant Axial Load
6. Testing of Specimen 2 (4/28/86)
a.) Biaxial Lateral Loading at 45 Degrees with Constant Axial Load
7. Testing of Specimen 3 (5/6/86)
a.) Biaxial "Cloverleaf" Lateral Loading with Constant Axial Load
8. Testing of Specimen 4 (5/16/86)
a.) Biaxial Lateral Loading at 45 Degrees with Varying Axial Load
Q. Testing of Specimen 5 (5/30/86)
a.) Biaxial "Cloverleaf" Lateral Loading with Varying Axial Load
10. Reduction of Experimental Data and Analytical Analysis
37

To.lole 2.2 Concrete Bo.tch QUo.ntltles forOne CulolC Yo.rd" So. turo.ted Surfo.ce-Dry
Bo.tch #1 (llo) Bo.tch #2 (llo)Me. terle.ls
SpeciMens 1-3 SpeciMens 4-5
Type II CeMent611 641
PerMo.nente CI028
'vi 0. ter 342 342
Fine So.nol 325 325Tiolewo.ter BlendCourse So.nol 1300 1300Ro.duM TopFine Gro.vel
1315 1315Ro.duM 3/8' Pea.
Toto.l 3893 3923
To.lole 2.3 Concrete COMpressive strengths
Cycllnder Age of Cycltnoler Avero.geSize Concrete Strength Strength
(Do.vs) (051.) (051.)
28 5459 516948793 x 6 5120Bo.tch #1
63 551b 5318
28 501~ 520153526 x 12 532063 5550 5435
284Rn?
493350643 x 6 5000
Bo.tch #270 5143 5071
28 4500 447044406 x 12 455670 4562 4559
38
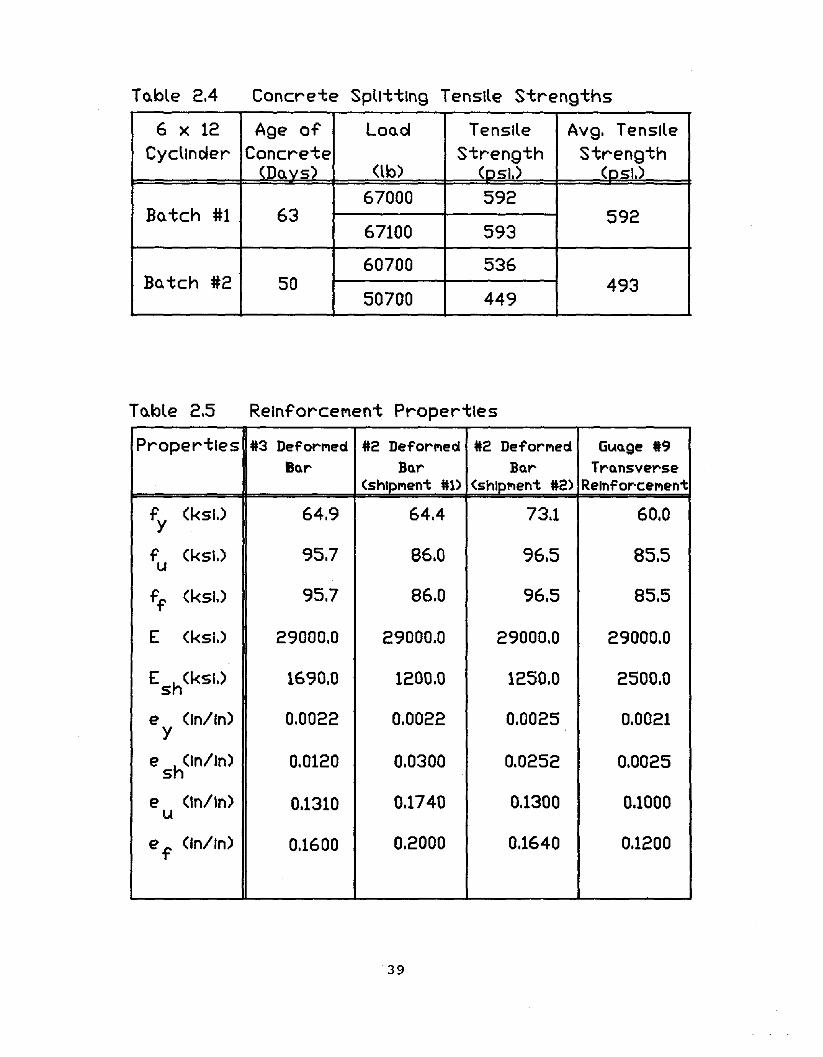
TOoble 2.4 Concrete Splitting Tensile Strengths
6 x 12 Age of LoOocl Tensile Avg. TensileCycllncler Concrete strength strength
(DOovs) (lb) (osl.) (osl.)
67000 592BOotch #1 63 592
67100 593
60700 536Ba.tch #2 50 493
50700 449
TOoble 2.5 ReinforceMent Properties
Properties 13 DeforJ'led 12 DeforJ'led 12 DeforJ'led GuOoge 19800r BOor BOor TrOonsverse
(shlpJ'lent 11> (shlpJ'lent 12) RelnforceJ'lent
f y(ksl.) 64.9 64.4 73.1 60.0
f (ksl.) 95.7 86.0 96.5 85.5u
ff (ksl.) 95.7 86.0 96.5 85.5
E (ksl.) 29000.0 29000.0 29000.0 29000.0
Esh
(ksl.) 1690.0 1200.0 1250.0 2500.0
e (In/In) 0.0022 0.0022 0.0025 0.0021Y
e sh(In/In) 0.0120 0.0300 0.0252 0.0025
e (In/In) 0.1310 0.1740 0.1300 0.1000u
e f (In/In) 0.1600 0.2000 0.1640 0.1200
39

Table 3.1 Summary of Selected Experimental Results
Specimens:11=1 #2 #3 :11=4 #5
YIELDMy (kip-in) 116.0 81.0 62.0
Mx 137.0 85.0
Vx (kips) 5.2 3.4
I2.9
Vy i 5.9 4.5! I
dx (inches) I,
0.19 0.14 0.15
dv I 0.15 0.15ULTIMATE IIMy (kip-in) I 136.0 95.0
I
123.0 142.0 146.0
Mx I 161.0 175.0 151.0 168.0I!
Vx (kips) I 5.9 3.8 5.1 4.0 4.8!
Vv I 6.7 7.6 6.2 7.0MAXIMUM Idx (inches) I 1.12 1.01 1.01 0.99 1.01
Idv I 0.99 1.01 0.97 1.01
40
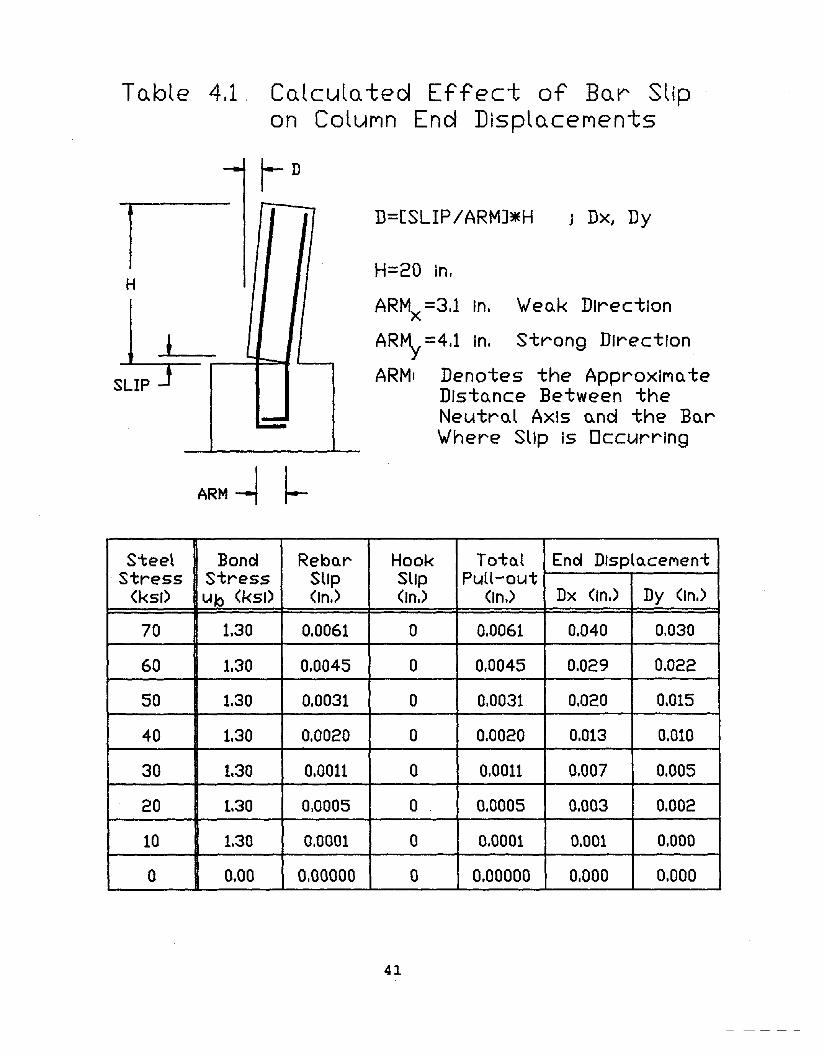
Table 4.1. Calcula ted Effect of Bar Slipon ColuMn End Displa.ceMents
r n
H
SLIP
J
-I il
... - '---
=ARM -I I-
D=[SLIPIARMJ*H j DXJ Dy
H=20 in,
ARMx =3.1 in, 'Wea.k Direction
ARMy =4.1 in, Strong Direction
ARM: Denotes the ApproxlMa. teDlsta.nce Between theNeutra.l Axis a.nd the Ba.r'Where Slip Is Occurring
Steel Bond Refoa.r Hook TotOol End D/splo.ceMentStress stress Slip Slip Pull-out
(ksl) ufo (ks/) (In.) (In,) (In,) Dx (In,) Dy (In,)
70 1.30 0,0061 0 0.0061 0.040 0.030
60 1.30 0.0045 0 0,0045 0,029 0.022
SO 1.30 0,0031 0 0.0031 0.020 0.015
40 1.30 0.0020 0 0.0020 0.013 0,010
30 1.30 0.0011 a 0.0011 0,007 0.005
20 1.30 0.0005 0 0,0005 0,003 0,002
10 1.30 0.0001 a 0,0001 0,001 0,000
a 0.00 0.00000 0 0.00000 0.000 0,000
41
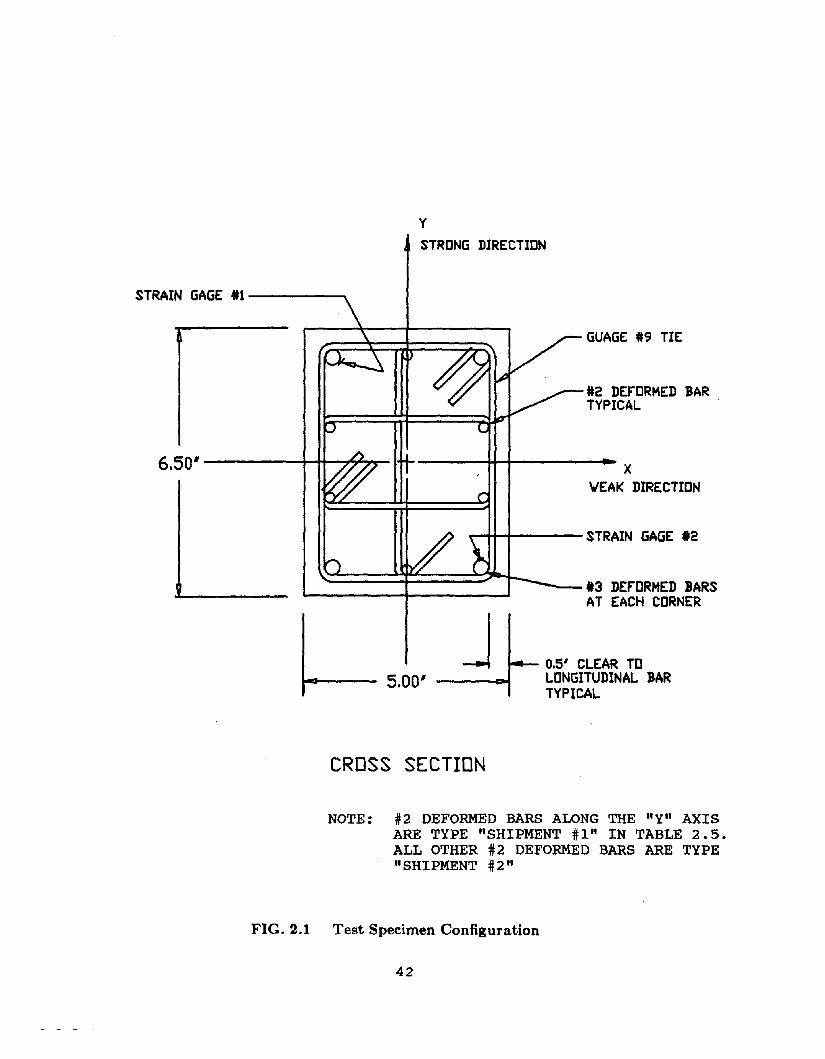
Y
STRONG DIRECTION
STRAIN GAGE #1------------~
X\lEAK DIRECTION
GUAGE 19 TIE
12 DEfORMED BARTYPICAL
0.5' CLEAR TOLONGITUDINAL BARTYPICAL
~-'3 DEfORMED BARSAT EACH CORNER
~+-+--- STRAIN GAGE 12
J5.00'
6.50' -----+-t+---..,.&:~:--
CROSS SECTION
NOTE: #2 DEFORMED BARS ALONG THE "Y" AXISARE TYPE "SHIPMENT #1" IN TABLE 2.5.ALL OTHER #2 DEFORMED BARS ARE TYPE"SHIPMENT #2"
FIG. 2.1 Test Specimen Configuration
42

ANCHOR ROD
5/8' STEEL PLATEFILLET 'YIELDEDTO REBAR
TEST COLUMN SEECROSS-SECTION
REINFORCED CONCRETEFOOTING
r'"...--
- ...
V@ 1.5'
@ l'
rL::J., r'c.:J,rL--.J., ,i.--~
I I I II I I I rI I I IIV0' I I
I II II I
~ ~I II II II II II II I
i iI I
TIES
9 TIES
5.00'LDADING HEIGHT l
21.50'
7.0
13.00' !
L' ~II I I ,I I I II I I I
14.00'
COLUMN ELEVATION "yN DIRECTION
FIG. 2.1 Continued
43

HOR ROD
NFORCED CONCRETETING
ST COLUMN SEEOSS-SECTION
8' STEEL PLATE
r6,50'lA ~
---.-5/
~ '-
1.25' ]
~TECR
REIFOO
L~ L~_I I I II
V- ANCI II
IvIIII I
c :s IIIIIIIII
21.50'
13.00'
LOADING HEIGHT
'----- 18,00' ------
COLUMN ELEVATION 'XII DIRECTION
FIG. 2.1 Continued
44

FIG. 2.2 Test Specimens Ready for Casting
FIG. 2.3 Testing Specimens After Casting
45
65
43
21
3020
10
7000
"-
6000
2500
V1,...
Q.
V1'-
/Q
.
5000
'-/
V1 V1V1
2000
Qj
V1
LQ
j
",
+'
4000
L
'"+
'a.
(I)
Qj
1500
>Q
j
V130
00>
V1V1
Qj
V1
LQ
j10
00~
2000
L Q.
0E:
(..J
0 (..J
1000
500
Str
uln
(x1
0-4
In/I
n)
Str
uln
(xlO
-4In
/In
)
FIG
.2.
4C
on
cre
teS
tress
-Str
ain
Rel
atio
ns
100
'" 80lI\
.Y'-/
lI\ 60lI\QI!...+'
"" 40 #3 DeforMed Bur~
QIQI+'
"" 20
4 8 12 16
Steel Stro.ln (x10 -2 In/In)
100
'"lI\ 80.Y'-/
lI\lI\ 60QI!...+'
"" 40 #2 DeforMed BurQIQI+'
"" 20
4 8
Steel Stro.ln
12
(x10-2 In/In)
16
FIG. 2.5 Longitudinal Steel Stress-Strain Relation.
47

LVD
TAT
CEN
TER
OFCO
LUM
NI
20
,0'------i
""(XlHY
DRAU
LIC
JACK
AXIA
LLO
ADRA
M
LOAD
CELL
I
SPEC
IALL
Y-F
AB
RIC
ATE
DU
NIV
ERSA
LI
JOIN
T
TYPI
CAL C
LIP
GAGE
SPEC
IMEN
LOAD
CELL
HYDR
AULI
CAC
TUAT
OR
"II/F
LO
OR
EL
EV
AT
ION
VIE
'w'
FIG
,2
,6L
oad
ing
Ap
para
tus
an
dIn
stru
men
tati
on

HY
DR
AU
LIC
AC
TUA
TOR
LOA
DC
ELL
~S
,O'
2-
LV
DT
AT
1.7
5'
LwI
FRO
MC
ENTE
RO
FCO
LUM
N-j
S,O
'EA
CH
DIR
ECTI
ON
20.0
'
.... \D
SPE
CIM
EN
CL
IPG
AG
ET
YPC
IAL
TOP
VIE
'"
FIG
,2
,6C
on
tin
ued
)
FIG. 2.7
f,." '
•~
;r,
•.:
;
)
Photographs of Experimental Setup
50

A
PAXIAL LOAD
I\II\IIII\IIt
II\III
l'
Hr
F r ~?JJ_~'1LATERAL LOAD / /
h SPECIMEN !!I II II II I
FIG. 2.8 Bnse Moment Determination
51

0.96SPECIMEN #1
Y STRONGDIRE lION
0.64
X 'WEAKDIRECTION
Y STRONG
2a.
Y STRONGDIRE TION
21:>
X 'WEAK----~&-<----- DIRECTION
DIRE nON3h 31 3c 31:>
3g 3a.
3l 3f
3k 3J 3d 3..
II:> Ia. X 'WEAK:=c===ct===~:::"DIREcnON
SPECIMEN #3
SPECIMEN #2
0.32 A A0.16 V\ A I II
V V 1/ I ~
ll", me<
-0.64
0.320.16
0.320.16
-0.16-0.32
-0.16-0.32
"-CIl -0.64w:I:U~ -0.96v 0.96~zW:I: 0.64wu<l:-JQ..CIl....I:l
!!:. -0.16~ -0.32zCJt:: -0.64uwe:; -0.96I:l 0.96~<l:W~ 0.64
-0.96AXIAL LOAD = 10 KIPS ONE CYCLE
FIG. 2.9 Intended Displacement and Load Histories
52

0.96SPECIMEN #4
Y STRONGDIRE TION
0.644Q
X 'WEAKDIRECTION
Y STRONG
4b
DIRE nON5h 51 5c 5b
59 5Q
Sf'
5k 5J 5d 5"
X 'WEAK------,.i;L-----DIRECnON
SPECIMEN #5
z 0.64Cl.....~
~. 0.32lk: 0.16.....~
~ -0,16~ -0.32
-0.64
"III~ 0.32 A
~ 0.16li\ A f\....~ -0.16 V V \/ V ~Q -0,32 II::EW
~ -0,64if. ONE CYCLEIIIS -0.96c.. 0.96....~
-0.96AXIAL LOAD (KIPS) ONE CYCLE
-0.96 -0.64 -0.32-0,16 0.16 0,32 0,64 0.96
'WEAK DIRECTION TIP DISPLACEMENT <INCHES)
FIG. 2.11 Continued
53
\
FIG. 3.1 Photograph of Test Specimens at Conclusion of Testing
FIG.3.1a Photograph of Test Specimen 1 at Conclusion of Testing
54

\
.'1(
--,#z-
,~ $,o. 'f{,
FIG.3.1b Photograph of Test Specimen 2 at Conclusion of Testing
FIG.3.1c Photograph of Test Specimen 3 at Conclusion of Testing
55

FIG.3.1d Photograph of Test Specimen 4 at Conclusion of Testing
\
FIG.3.1e Photograph of Test Specimen 5 at Conclusion of Testing
56
Left View
Top View
Ay
B
+ X
C DBottol'l View
Right View
AT----------~-..,__-___:"-~
\
B~-----......--..L..--...I-----___=r
Top View
B
D
V
\,V·v
\;
l~I (
IG
\ ~'///
Right View
A
CLeft View
C
~-----..--.L-.--....;......-~~r__------I. DBottom View
FIG. 3.2 Crack Patterns at Conclusion of Testing - Specimen 1
57
~Ight VIew
Top VIew
AY
B
+ -X
C D
Left VIew
BottofW\ View
A..----------r------,,--~__;__r-_y
\
BTop View
B
DRight View
A--~--___;:--__;~------__,A
Left View
Bottom View
FIG. 3.2a Crack Patterns at Conclusion of Testing _ Specimen 2
58
Right View
Top View
AY
B
+ X
C D
Left View
D
Bottofl'l ViewA
"\\~
BTop View
Bi\
Right View
l-----------,---,------,A
cLeft View
Bottom View
FIG. 3.2b Crack Patterns at Conclusion of Testing - Specimen 3
59
RIQht View
Top View
AY
B
+ X
C D
Left VIew
Bottol"l ViewA.-------:~~--~.,.__----.,_-__:___;_-_:_V
Top View
B
nL-----------------..:..--''-tRight View
Left View
C
nBottom View
FIG. 3.2c Crack Patterns at Conclusion of Testing - Specimen 4
60
Right VIew
Top View
AY
B
+ X
C D
L4Pft VIew
A
B
BottOM View
Top View
B
DRight View
A
cLeft View
Bottom View
FIG. 3.2d Crack Patterns at Conclusion of Testing - Specimen 6
61
1.2
88
o I S P L A C E "E N T8
.88
8
0\
XN
I I N C H E S I
-1.2
88
DISP
LACE
MEN
TV
S.TI
ME
/SPE
CIM
EN11
~f\
~ ~~
~
~I~
ft ~rJ
(· · ·
.•
.•
•.
•.
1.-
188.
888
21
8.1
80
38
8.1
10
418.
888
58
8.8
88
TD
£PE
RIO
D/D
ATA
POIH
TI
FIG
.3.
3M
easu
red
Loa
dH
isto
ryfo
rS
peci
men
1

1.289
DIS
"""" ~ I~ ~fLAC IE
"EHT 8.B2e
~ ~ ~X
IINCHESI
-1.290
8.800 'ee.Bee 280.8B9 _.889.
....828
ONE CYCLE
Gee.1ee
, .289
DISPLACE
"EMT 8.888
Y
IINCHESI
-1.200
-1.288
T1HE PERIOD Jl)ATA POINTI
•. Iee
DISPLACEHElolT X IDD£SI
FIG. 3.4 Measured Load History for Specimen 263
1.218

t.~
pISPLAtE
"EHT e.eee
X
IIHCHESI
-t .200
11~ n
n,., r1 \
ArJ\ ~ n R0 l ./ 1"1
VU I Vu
~V u
....
v \J.
ONE CYCLE.
e.eee use.Bee 280.eee
1.280
CISPLACE
"EHT 1._Y
IINCHESI
-L2ee
T!I£ PERrOD IOATA POIIIo'l1
r(
I
I
fo \
-f .288 '.eeeDISPLACO£NT X /INQ£SI
1.288
FIG. 3.5 Measured Load History for Specimen 364
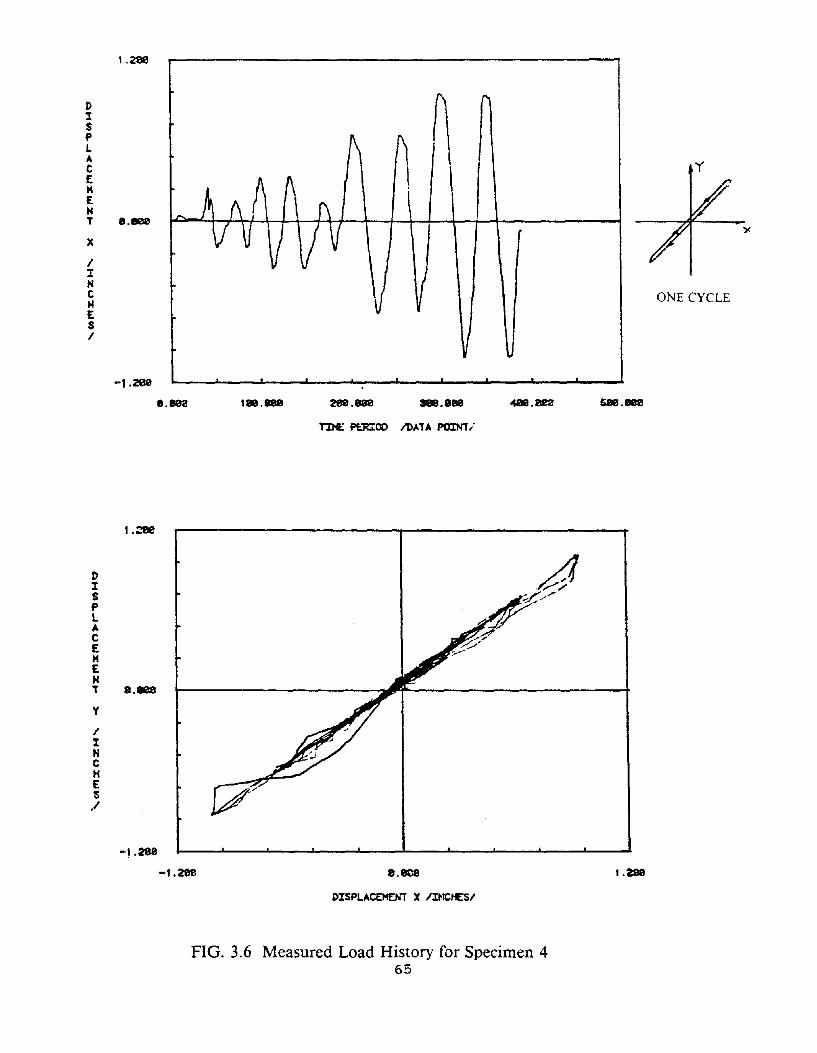
DISf'LACEMEHT
X
IIHCHES/
1.28e
e.8l!l0
ONE CYCLE
1.10e 'ee.1ee 298.880 38B.aee 68e.Bee
1.::fle
DISf'LACEHEHT a.Beey
/INCHES.I
-1.288
-1.28e
TD£ Pf:."R!OD /0"1A POINTi
8.8C8
DISPLACEMENT X IItlCt£S/
FIG. 3.6 Measured Load History for Specimen 465
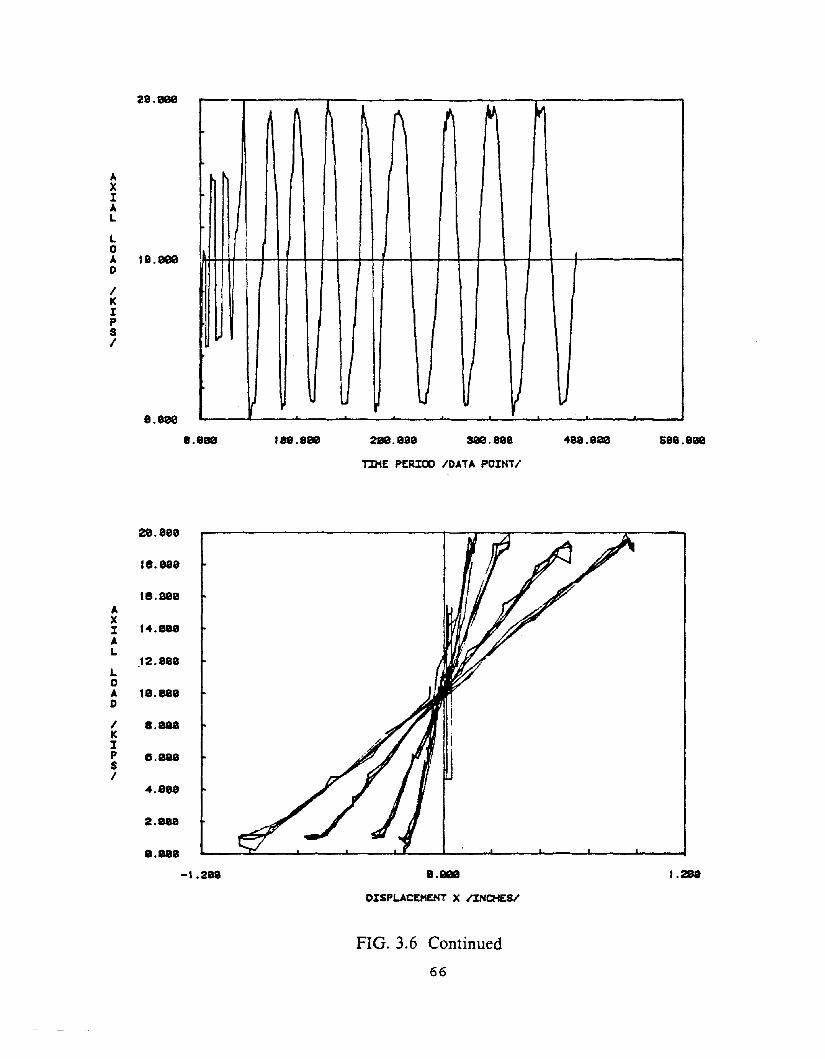
2e.eee
"XIAL
L0A 18.000D
II(
IPSI
I.eee
1\ 1\ 1 M ~
IiII
'" u 1I u V v
'.eBB 'II.eee 2•.e88 see. lee 4ee.eaa sel.erae
29.I8S
18.eae
US.88SAXI 14.1188AL
12.818L0A 111l.eaeD
I I. JaIlJ(
IP I.JaIISI
4.lIlee
2.JaII
Ill. JaIl
-1.2ee
TIME PERIOD 10ATA POINTI
I.eee
OISPLACEMENT X IINCHESI
FIG. 3.6 Continued
66
1 •ae
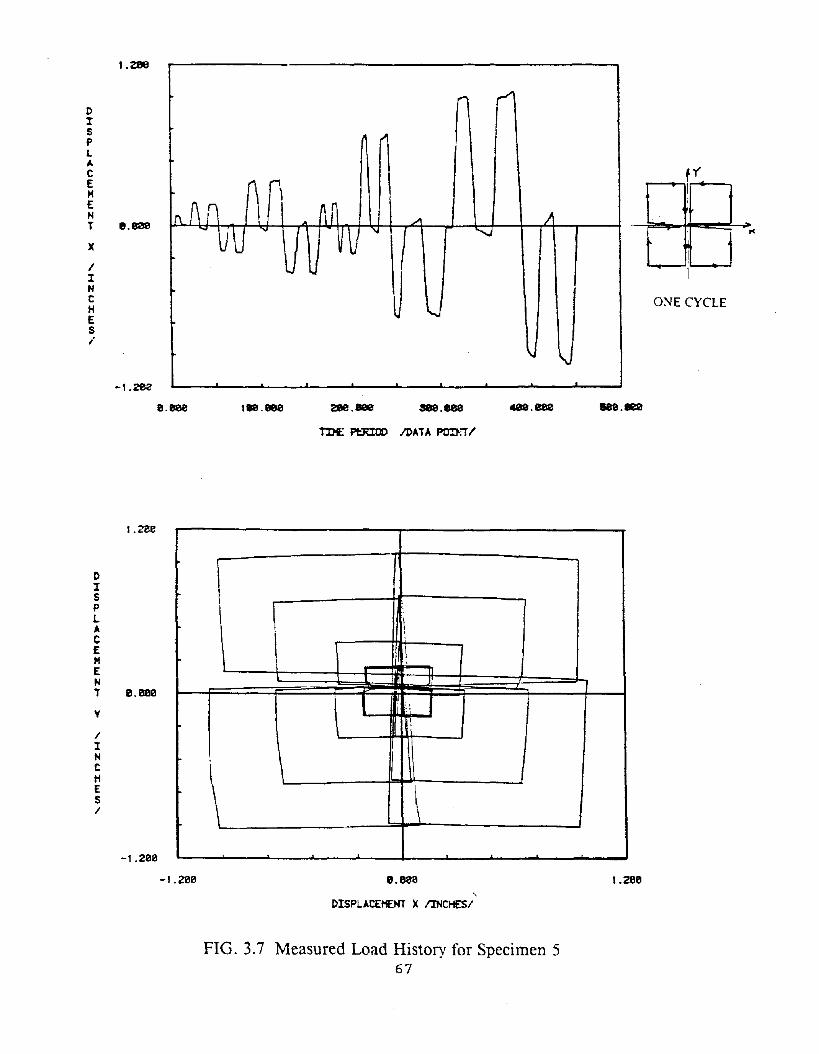
1.280
DYSPL
"cEHENT a.seeX
IINCHES,.
-1.202
..., ,-/1
1"'1
r'\ ("'I,
r\ Ar1 An /I ~
- VU v
~v~(
'""-J
U I.,J
"'J
\j'\J
. . .
1
!
I
ONE CYCLE
"
e.eee ,ee.Bee 38e.eee ....eea
I.ZOO
DISPL-ACEP1ENT e.B00
y
/INCHES/
-1.200
TD£ Pf::RIOD /OATA PO:fo:T/
1\
\\
\\
\I
~ ~
I;
\\
\-1.200 a.eee
,DISPLACEHENT X /INCHES/
FIG. 3.7 Measured Load History for Specimen 567
1.200

28.888
AXIAL
L0A le.eeeD
/KIPSI
8.BB8
, nf
N 11 fr',iI
11;
II
II
IL I) , I' I 1&-., JA.
~• ~ ~
.N1I
,I !
II
\J ~
'lI ...- \oJ I.-J
8.80e lee.see 28e.eee '88.•0 see.80e
28."8"
f8.80e
115.888AXI 14.ee8AL
12.888L0A 18.898D
I a.seeICIP 8.8888I
4.88"
2.888
8.l!l8l!l
-1.280
TIME PERIOD /DATA POINT/
e.eee
DISPUCEHENT )( I:INQiES/
FIG. 3.7 Continued68
, .288

18
.88
8
L 0 A D X8
.88
8/
0'0
I(\0
I P S /
--
-_
_A
nal
yti
cal
Un
iax
ial
Mo
nto
nic
Rel
atio
nat
P=
10
Kip
s
-18
.88
8
-1.2
88
8.8
18
,.2
89
DISP
LACE
MEN
TX
/INC
HES
/
FIG
.3.
8L
ater
alL
oad
Ver
sus
Lat
eral
Dis
plac
emen
tfo
rS
peci
men
1

113.1
3131
3
Bia
xia
l©l
460
rU
nia
xia
l
r_--
--,.
.l--
--
-
L 0 A 0 X
-..l
/13
.1313
13
0K I P S /
--
--
An
aly
tica
lM
on
ton
icR
elat
ion
at
P=
10
Kip
s
-10.
0131
3
-1.21
313
13.13
1313
1.21
313
DISP
LACE
MEN
TX
/I~CHES/
FIG
.3.
9L
ater
alL
oad
Ver
sus
Lat
eral
Dis
plac
emen
tfo
rS
peci
men
2

LU
ni:
.xia
l
-...-
-,,'- f
r-
Bia
xia
l@
46
0
I I ~ I
10
.00
0
L 0 A D y
-..l
I0
.00
0.....
K I p S I
--
--
-A
nal
yti
cal
Mo
nto
nic
Rel
atio
nat
P=
10
Kip
s
-10
.00
0
-1.2
00
0.0
00
1.2
00
DISP
LACE
MEN
TY
IIN
CH
ES/
FIG
.3.
9C
onti
nued
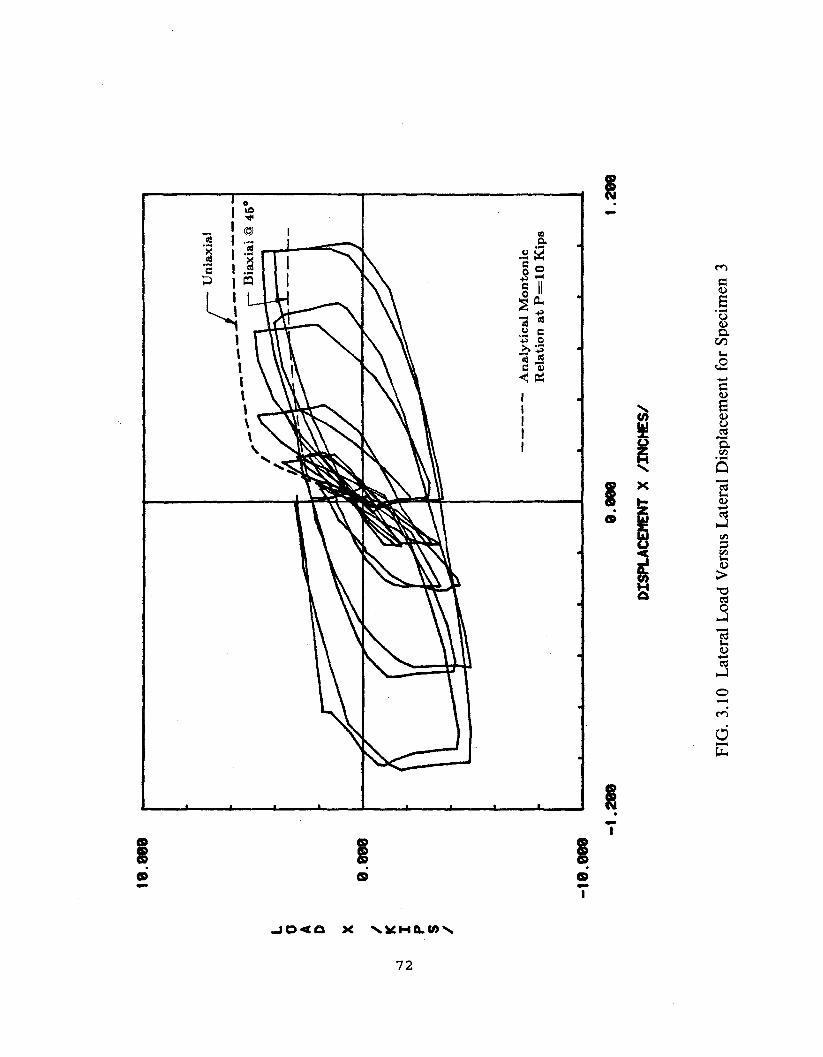
'8.8
88
L 0 A 0 X I9
.88
8
'-J
KN
I p S I
-18
.99
8
__L~~::l
__--
-,---
IB
iax
ial
@4
5°
I I. !J
An
aly
tica
lM
on
ton
icR
elat
ion
at
P=
!OK
ips
-,.2
888
.88
8
DISP
LACE
MEN
TX
IIN
CH
ESI
FIG
.3.
10L
ater
alL
oad
Ver
sus
Lat
eral
Dis
plac
emen
tfo
rSp
ecim
en3
t.2
88

18.8
88
L 0 A D Y8
.88
8I
--.J
Kw
I P S I
_L
Un
iax
ial
---
--,.
.--
rB
iax
ial
@4
60
I I I I ,- "
---
--
An
aly
tica
lM
on
ton
icR
elat
ion
at
P=
10
Kip
s
-18
.88
8
-1.2
88
e.8e
e
DISP
LACE
MEN
TY
IIN
CH
ESI
FIG
.3.
10C
onti
nued
,.2e
8

10
.00
0
L 0 A D X
-...]
/0
.00
0~
K I P S /
-10
.00
0
____
J_U:ax
ial/
-----
/L
Bia
xia
l@
46
·
1--
""'-
""--
-'-
-,.
----
I
--
--
-A
nal
yti
cal
Mo
nto
nic
Rel
atio
nat
P=
10
Kip
s
-,.2
00
0.0
90
DISP
LACE
MEN
TX
fINC
HES
f
FIG
.3.
11L
ater
alL
oad
Ver
sus
Lat
eral
Dis
plac
emen
tfo
rS
peci
men
4
t.2
00

10
.00
0
L 0 A 0 Y
...,J
I0
.00
0U
IK I P S I
-10
.00
0
-1.2
00
__
L_U~iaxial
--
--
--
-A
naly
tical
Mo
nto
nic
Rela
tio
nat
P=
10
Kip
s
0.0
00
DISP
LACE
MEN
TY
IIN
CH
ESI
FIG
.3.
11C
onti
nued
1.2
00
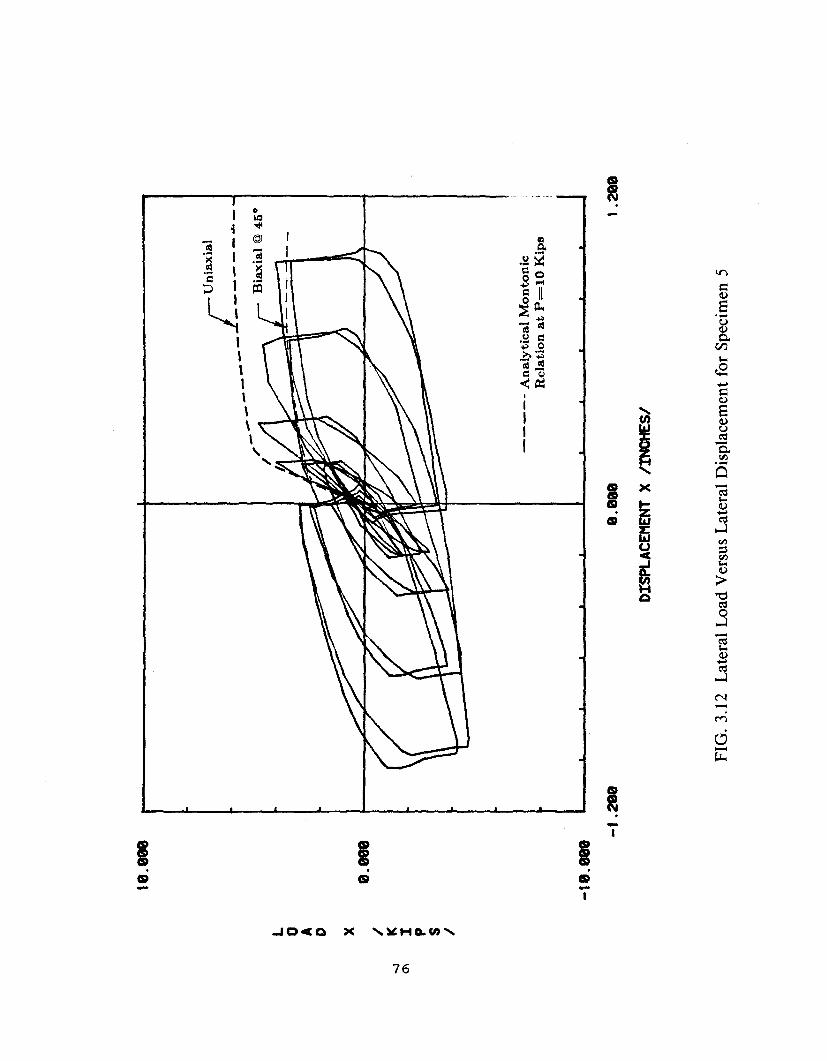
10.0
08
L 0 A D X /0
.00
0
'-l
I(0
\I p S /
-10
.08
0
___LU::~---
."."
....
---/-
AB
·.
I-
r-
lRX
lal
@4
5°
!J
-----
An
aly
tica
lM
on
ton
icR
elat
ion
at
P=
10
Kip
s
-1.2
80
8.0
00
DISP
LACE
MEN
TX
/INC
HES
/
FIG
.3.
12L
ater
alL
oad
Ver
sus
Lat
eral
Dis
plac
emen
tfo
rSp
ecim
en5
1.2
90

18.8
88
L 0 A D Y0
.88
8I
'-J
K'-
JI p S I
-10
.88
8
__L~niaxial
---
--,
...-
r-
Bia
xia
l©!
46
0
I I
-----
An
aly
tica
lM
on
ton
icR
elat
ion
at
P=
10
Kip
s
-1.2
80
9.0
80
DISP
LACE
MEN
TY
IIN
CHES
I
FIG
.3.
12C
onti
nued
t.2
99

t89
.90
9
H 0 H E N T Y0
.00
0-..
.lI
0)
K I p - I N I
-18
0.0
00
-0.0
e00
.00
0
ROTA
TION
ABOU
TY
IRA
DIA
NSI
FIG
.3.
13B
ase
Mom
ent
Ver
sus
Low
erC
olum
nR
otat
ion
for
Spec
imen
1
0.0
60
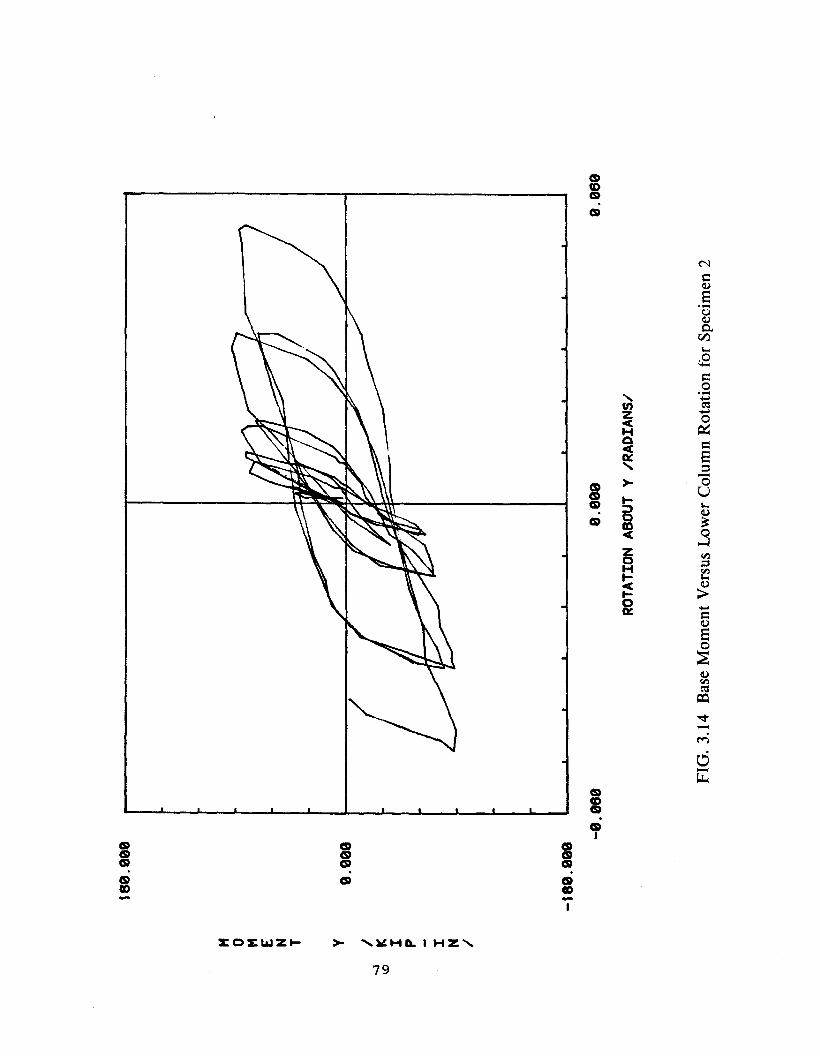
189.
999
M 0 M E N T Y9
.09
9I
-..l
Ie~
I p - I N I
-18
9.9
99
-9.9
89
0.0
00
ROTA
TION
ABOU
TY
IRA
DIA
NS;
FIG
.3.
14B
ase
Mom
ent
Ver
sus
Low
erC
olum
nR
otat
ion
for
Spe
cim
en2
9.0
60

......VIZC(H0 '0• CI)~ ::I
" ~
CD X0';::~
CS) t- oCS) :;) UCS) 0
CD ~•Z ("j
0dH
t- -< I:J..
~
CS)
iCS)I
XCXLaJZ .... x
80
CS)
=CS)CO-I
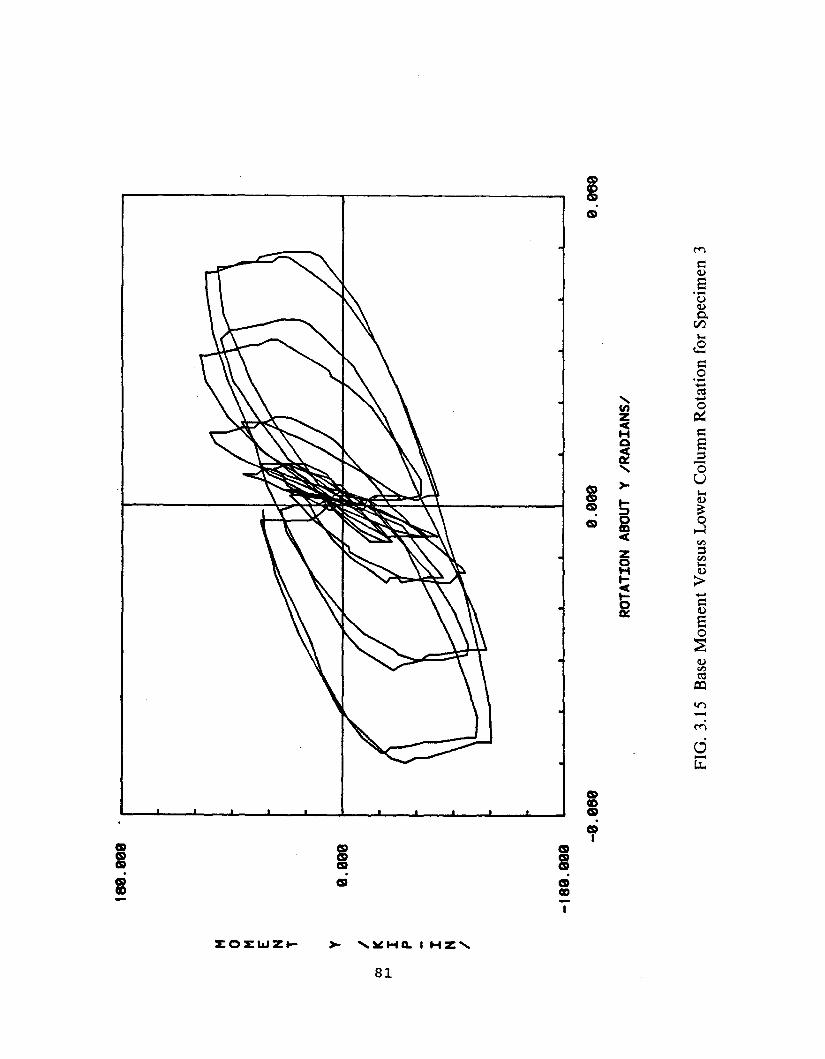
t89
.99
9,
Ii
H 0 H E N T Y0
.99
9I
00I<
f-l
I p - I N I
-18
0.9
99
-9.9
80
9.0
00
ROTA
TION
ABOU
TY
/RA
DIA
NS/
FIG
.3.
15B
ase
Mom
ent
Ver
sus
Low
erC
olum
nR
otat
ion
for
Spe
cim
en3
9.0
89

"-enz-e:~ "l:l< (l.)
~ ::s"- s::.-x +-'
(S> s::CP t- oell) ;:) uCI) ~ an
<Z C""l
0 dHt- -< u..t-o~
I.CI)I
CI) ICI)CI). .CI) CI)
Cll)-I
82
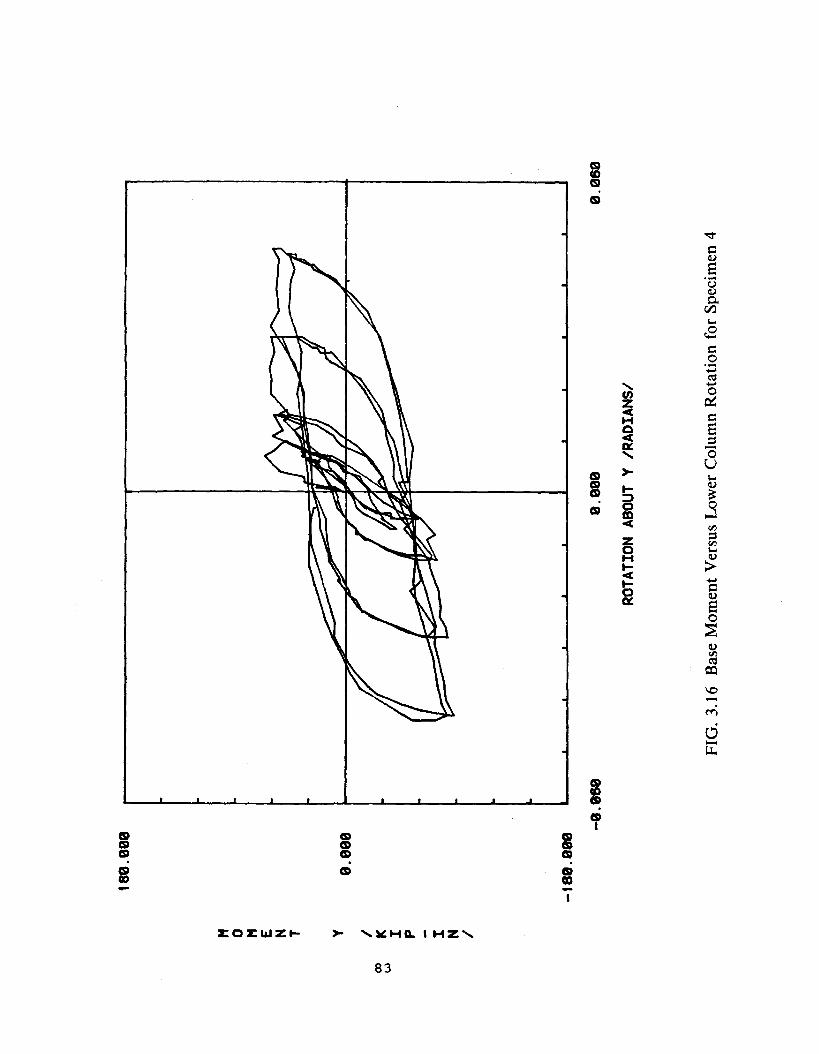
t80
.00
0
H 0 H E N T Y0
.00
0
I()
:)f(
wI p - I N I
-f8
0.0
00
-0.0
60
9.9
00
ROTA
TION
ABOU
TY
IRA
DIA
NS/
FIG
.3.
16B
ase
Mom
ent
Ver
sus
Low
erC
olum
nR
otat
ion
for
Spe
cim
en4
9.0
60
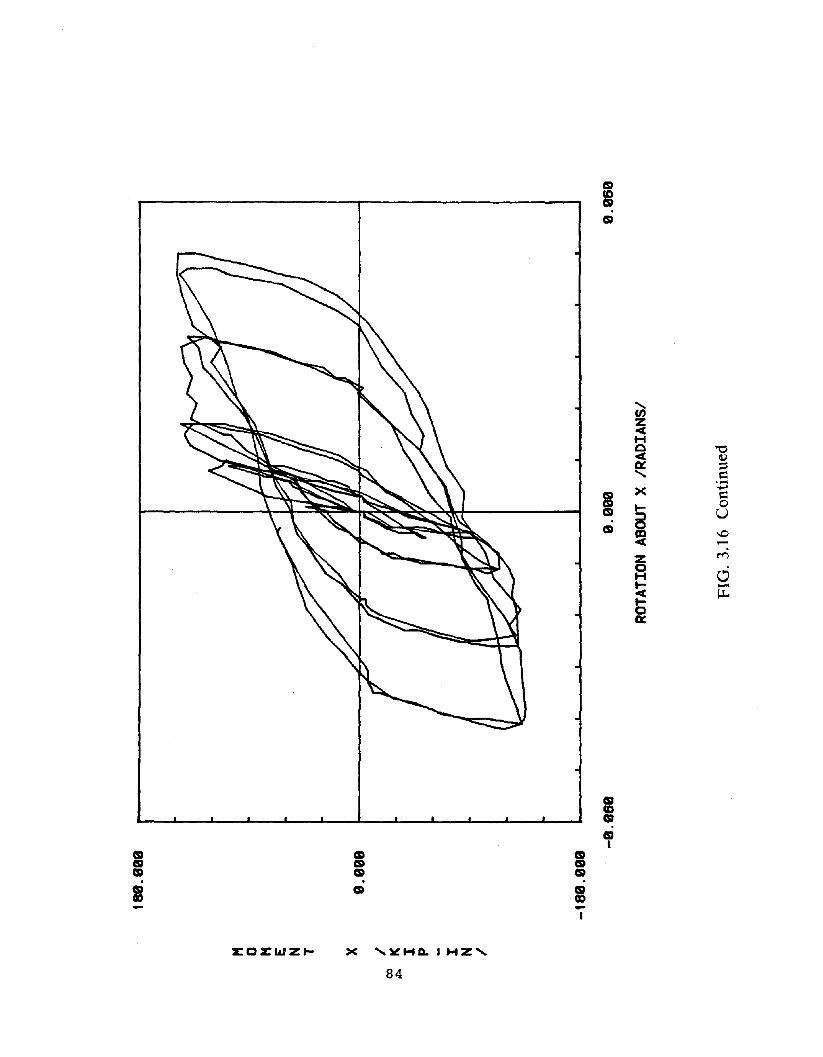
=C5)
mGO-I
'"(I)z<H0 "'0< Cl.)0: ::i
'" ~.-X -C5) ~
CS) t- OCS) ::J UGIl 0
en \0< -Z M
00H
t- -< I:,I..t-o0:
GIlCDmmI
%O%I&IZf- x
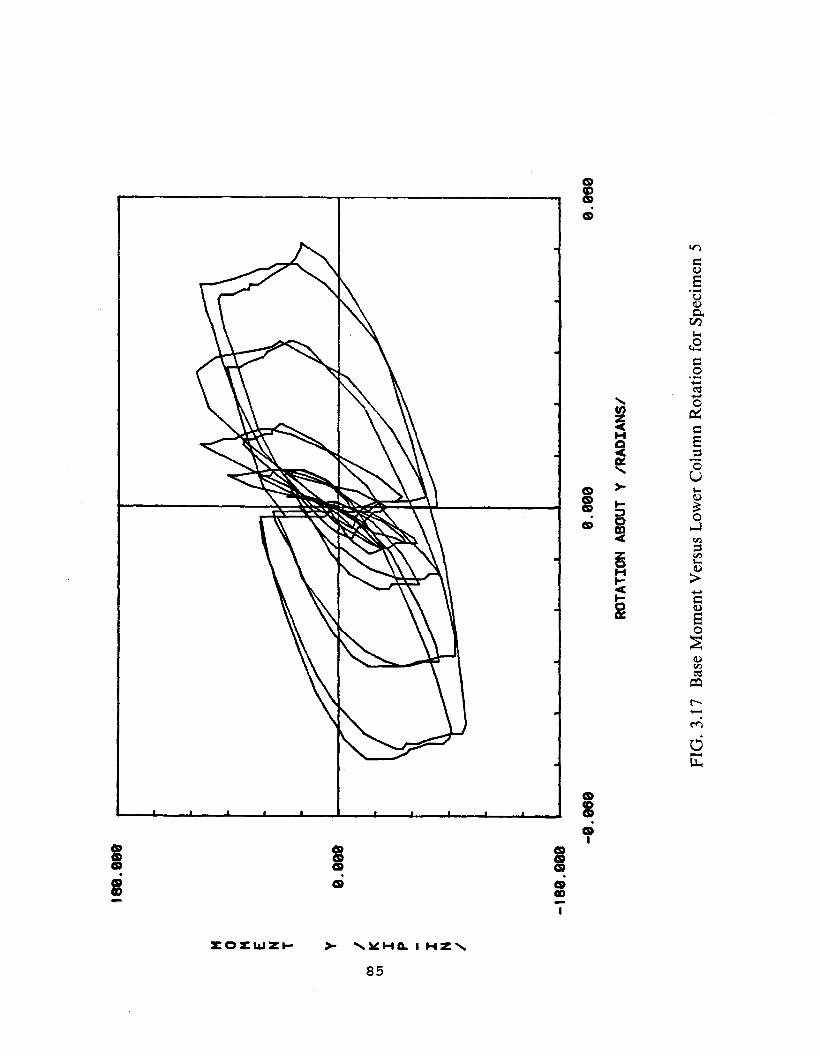
t88
.98
8
H 0 H E N T V0
.00
0I
00K
U1
I p - I N I
-t8
0.0
00
-8.8
80
0.9
98
ROTA
TION
ABOU
TY
/RA
DIA
NS/
FIG
.3.
17B
ase
Mom
ent
Ver
sus
Low
erC
olum
nR
otat
ion
for
Spe
cim
en5
8.0
60
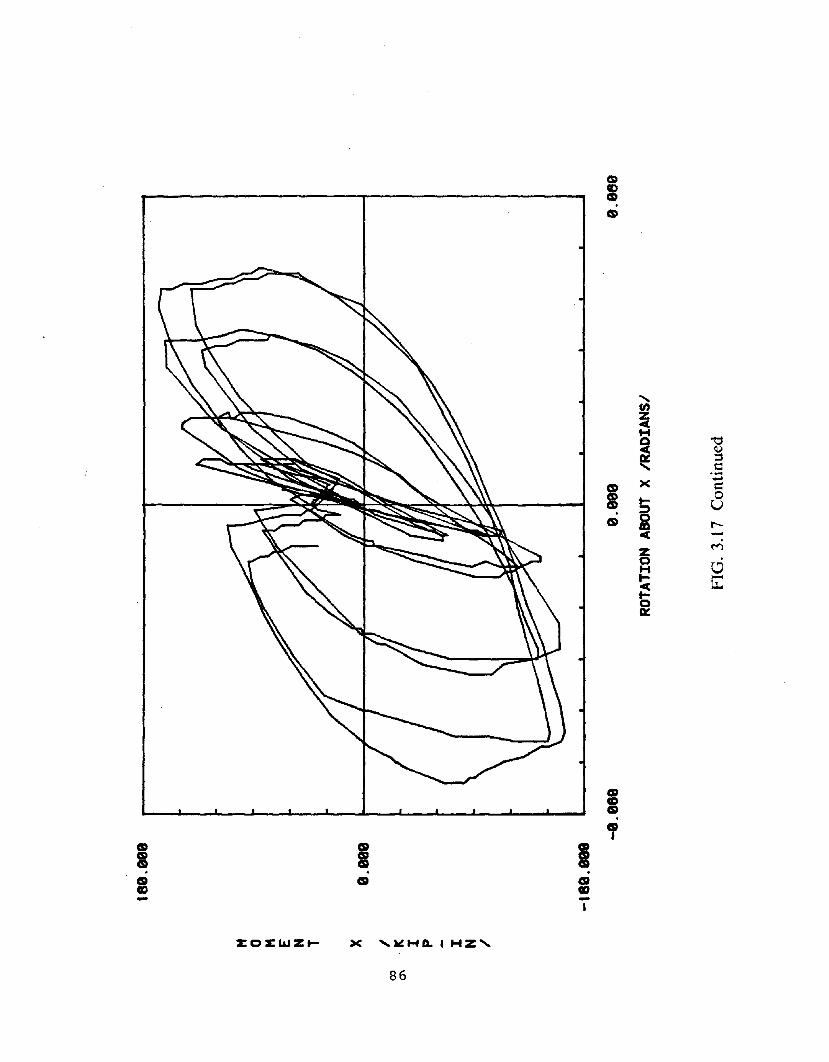
CD
II-
.....enzc(I-tQ ~c( 0« =...... t::.-X
....m t::CS> ... 0m :;:) UCS> 0
l"-mc(
z M
0 c.:JI-tt- -c l.l..t-o«
CDCDCD.CDI
I ICD. .
CD mCD-I
86
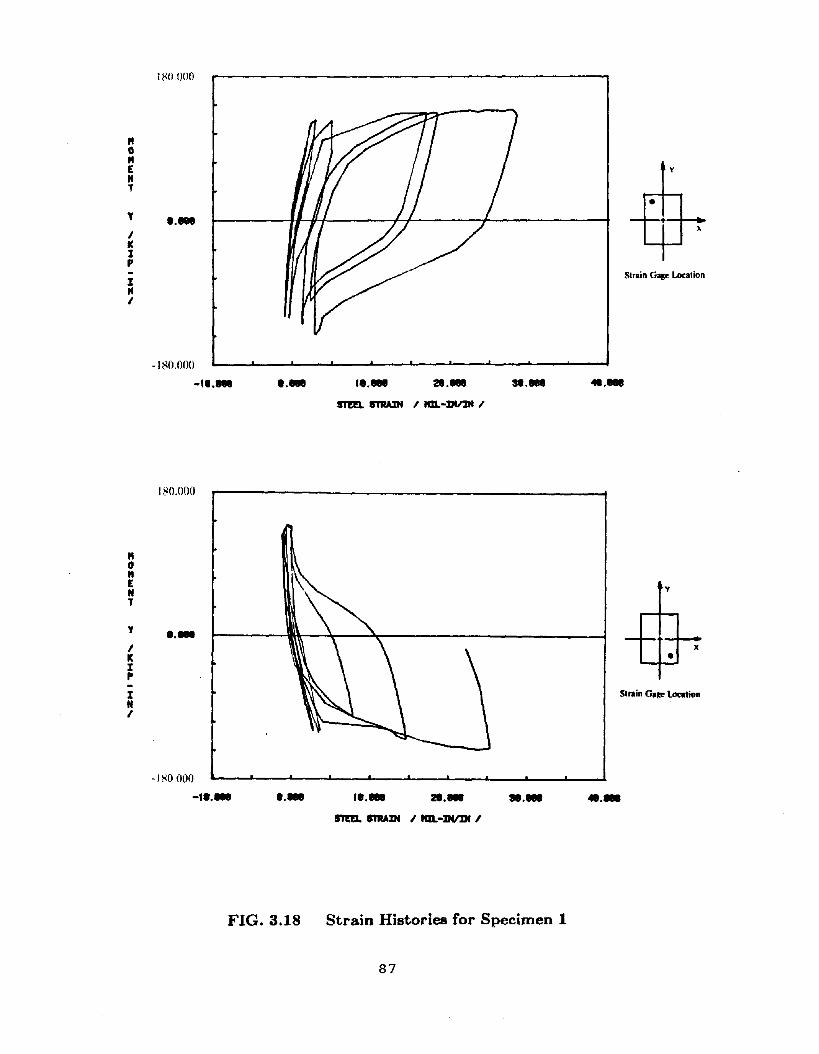
"o"ENT
y
IICIp
INI
I~OOOO
•••
-180.000
-te.... ..... ,..... st....
y
•
Strain Gage Location
......
"o"ENT
y
IKIp-INI
180.000
.....
-I~OOOO
-II.'" ..... ...... 21.... .....
y
•
Strain Gage Location
......
FIG. 3.18 Strain Histories for Specimen 1
87

"o"ENT
y
IIeIp
INI
I ~().()()O
....
-I~O.OOO
-..... ..... ...... 28.... SI.I8e
y
•
Strain Gar.e Loc:ation
48....
STEEL STRAIN' I tm.-INIIN I
"o"ENT
y
IIeIp
INI
180.000
....
-180.000
-II.... ..... I ..... 28.... SI....
y
•
Strain Gage Location
48....
FIG. 3.19
STEEL STRAIN I KtL-:Dl1IN I
Strain Histories for Specimen 2
88

"o"ENT
X
IIeIp
INI
II'lO.OOO
....
-180.(}(}()
-te.... ..... II. tee 2t.tee ••••
•
Strain Gage location
......STEEl. STRAIN I MIL-INIIN I
"o"ENT
X
IIeIp
INI
180.000
....
-180.000
-II.... ..... II.... 28._ .....
y
•
Strain Gage location
48.888
STEEL STRAINS I IfIl.-INIIN I
Fig. 3.19
89
Continue

180.000
"0"£"TY I."IIeIp
INI
-l~O.()OO
-.... -28.888 -II.... 1.888 18.888 28.888
STRAIN GAGE nRST WENTOUT OF RANGE
v
•x
Strain Gage Location
• .•88
J~O.OOO
STEEL STRAIN I HIL-INIIN I
"o"ENT
y
IItIp
1NI
I."
t==========~... -----...:yo...~~:-....~.,::: ~:,~~/~' ------ "OUT OF RANGE
y
Sll'llin Gale loc:Ilion
-180.000......... -..... -28.... -II.'" ..... te.'" 28."
FIG. 3.20
STEEL STRAIN I HIL-INIIN I
Strain Histories for Specimen 3
90
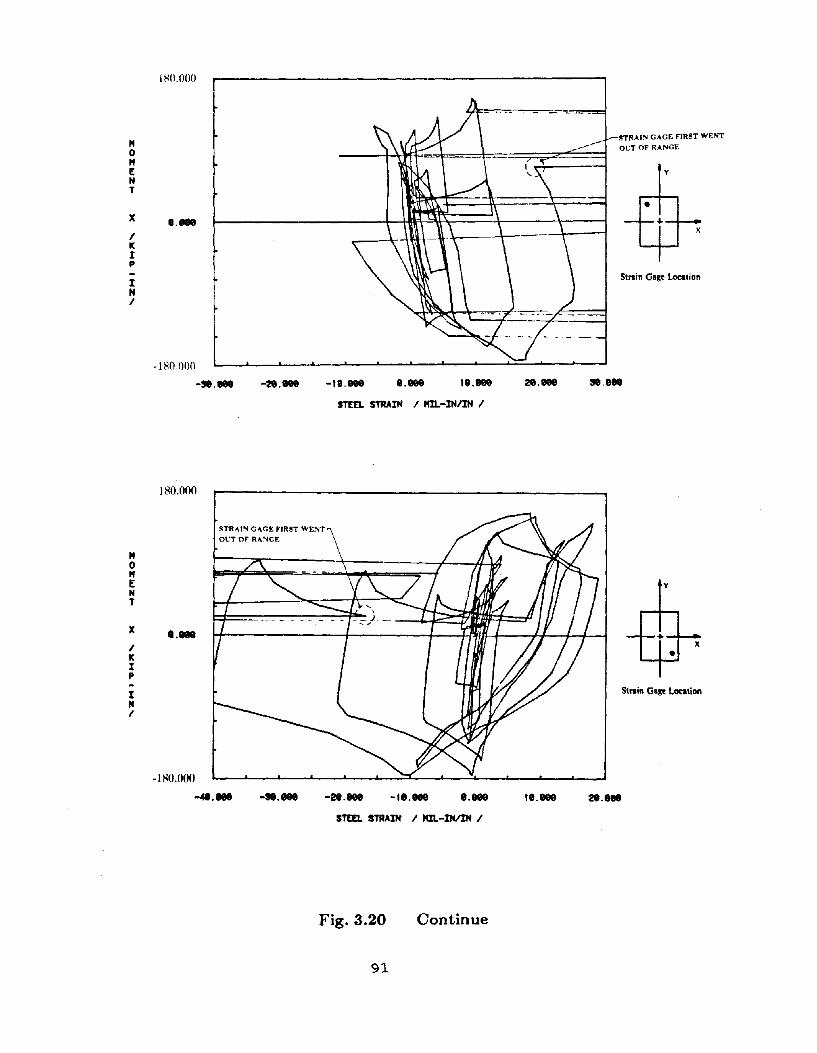
i ~().()()()
"0"ENT
X ....IItIp
INI
-180,000
-,.... -28." -te.888 '.888 1'.888 28.888
STRAI~ CACE rJRST WENT
OI.:T OF RANCE
y
•)(
Strain Gage location
3CU~"
180.000
STEEL STRAIN I Pm.-INIIN I
STRA"" CAGE rJRST WE~TOI.:TOF RANGE
"0"ENT
X ....IItIp
INI
-180.000........ -,..... -28.... -II.... ..... II....
y
x
Strain Gap: Location
28.881
STEEL STRAIN I Pm.-INIIN I
Fig. 3.20
91
Continue

"o"ENT
y
IItIP
INI
l~().OO()
....
•1~().000
-II." ..... II.... 28.... .....
y
•
Strain Gage Loc:ation
.....STEEl. STRAIN I MIL-INIIN I
"o"EHT
y
IIt:rp
IHI
l~().()()O
....
- I~O.OOll
-II.• ..... I ..... 28.... .....
y
Strain G. Loc:ation
.......
FIG. 3.21
STEEl. STRAIN I MIL-INIIN I
Strain Histories for Specimen 4
92

180.000
"0"ENT
lC ....,IItIP
INI
-180.000
-II.... '.888 II.'" 28.'" 38."
y
•x
Strain Gagt Location
48.'"
STEEL STRAIN I tal- INIIN I
180.000
"0"ENTS
lC '.888IItIP
INI
-180.000
-'8.'" 8.888 '1.888 28." 38.819
y
+x
•
Strain Gagt Location
48....
STEEL STRAINS I tlIl-INIIN I
Fig. 3.21
93
Continue

"o"ENT
y
IIeIp
INI
1~(1.000
•••
- H~O.O(lO
•
Strain Ga~t Localion
-,... -21.• -,... ..... ...... 2..... ,.....STEEL. STRAIN I ItIl-IN/IN I
"o"E"Ty
IIeIp
INI
11<0000
•••
• \ RO.OO(l....... -,... -21.• -f..... ..... ,.....
Strain Gage Location
21....
FIG. 3.22
STEEl. STRAIN I MIL-INII" I
Strain Histories for Specimen 5
94
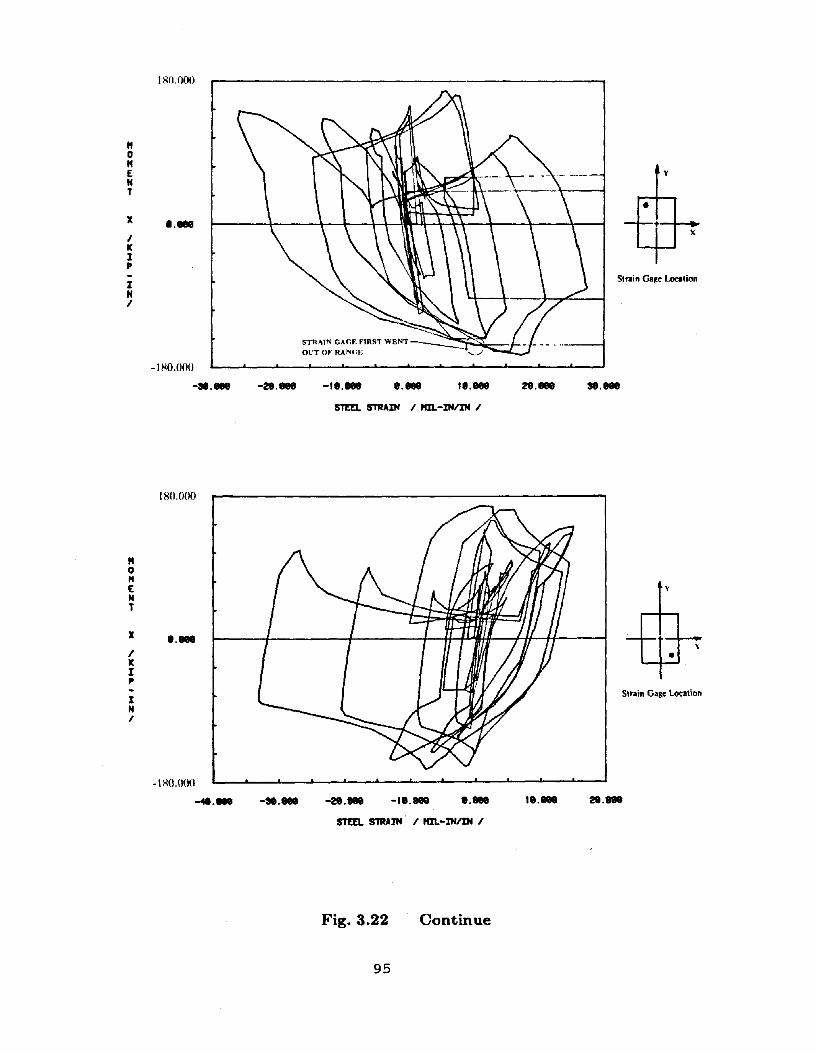
I>lO.OOO
"0"["TX 1.18CiIIKIp
IN/
-180.000
-•. 18CiI -28.18Ci1 -It.... ..... 18.888 28....
y
x
Strain Ga~e Location
.....STEEL STRAIN / NIL-IN/IN /
"o"ENT
X
IKIp
IN/
180.000
1.18CiI
-I ~O.()O()
-<lI.18CiI -..... -28.... -1•.888 •. 18CiI 1.....
y
\
•
Strain Ga~e Location
28 ....
Fig. 3.22
95
Continue
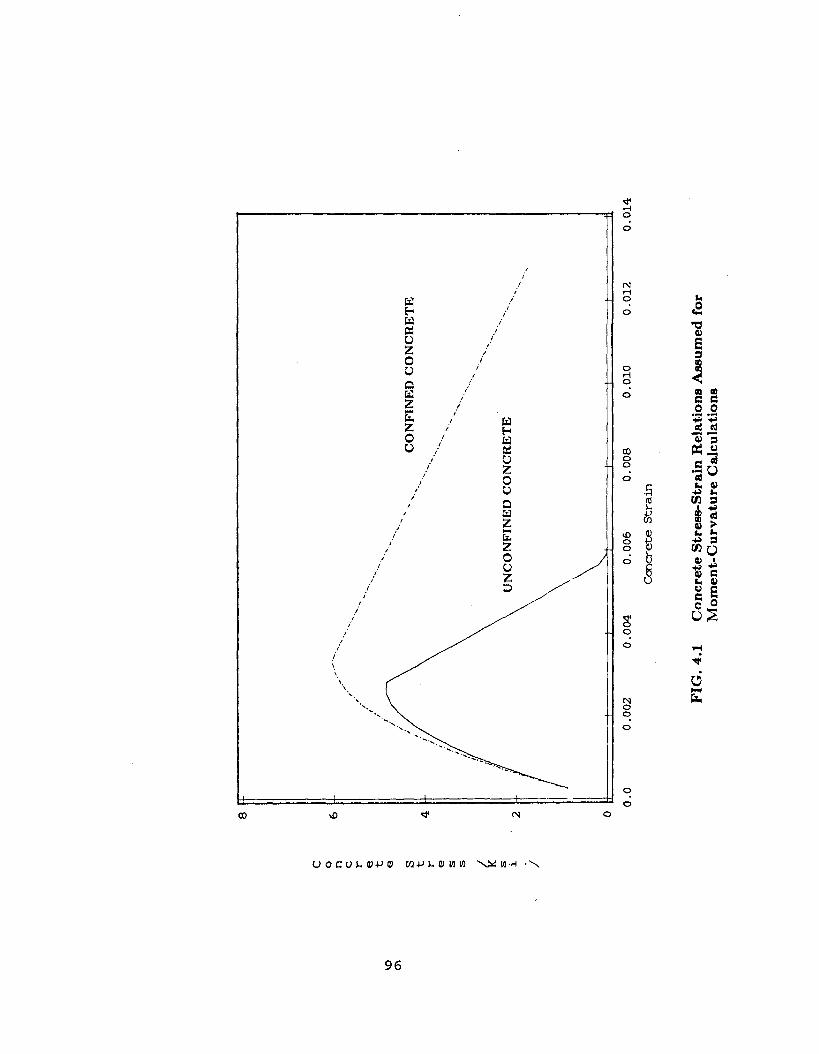
8
'.
'.
",
"
..........
....... .."
.....
UN
CO
NF
INE
DC
ON
CR
ET
E
..........
.........CO
NF
INE
DC
ON
CR
ET
E
..........
........
.....-
..../
,~.
.t'
c 0 n6
c r e
\0t
(j\
e S t r4
e s s k s i2
/
0_ 0.0
0.0
02
0.0
04
0.0
06
0.0
08
0.0
10
0.0
12
0.0
14
Ccr
1cr
ete
Str
ain
FIG
.4
.1C
on
cret
eS
tres
s-S
trai
nR
elat
ion
sA
ssu
med
for
Mo
men
t-C
urv
atu
reC
alcu
lati
ons
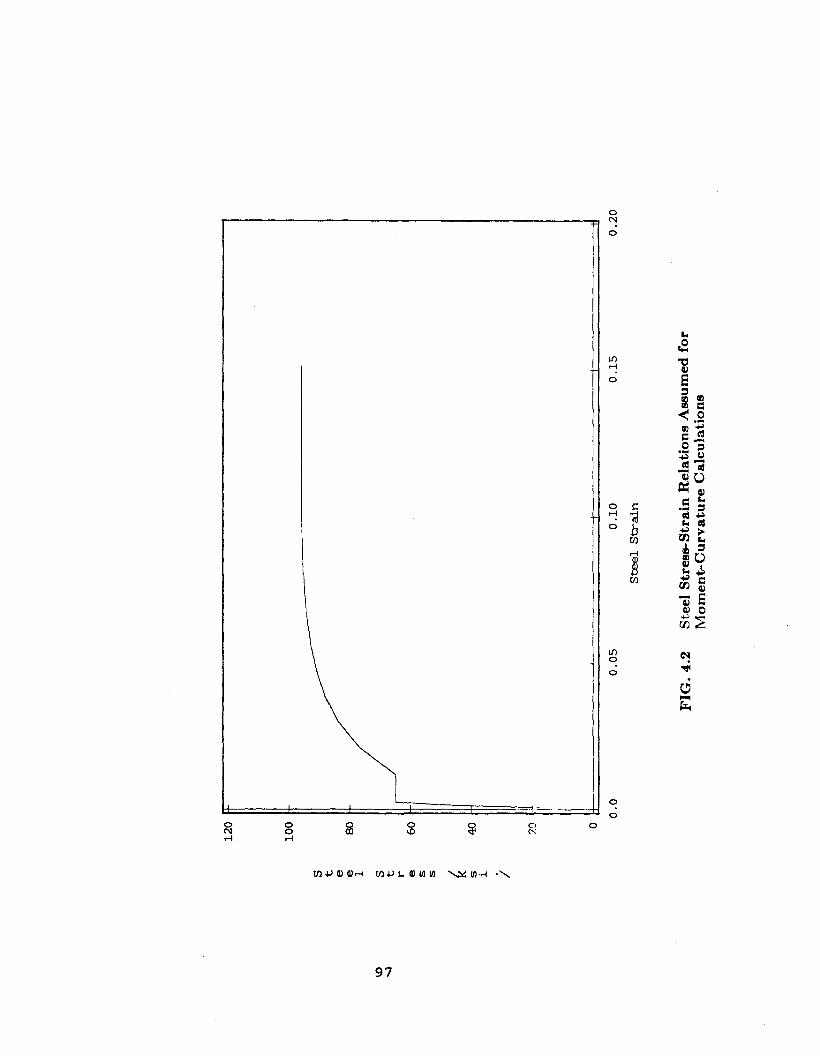
12
01
Tn
:----------------------------------'"
--1
10
0
S t e e8
01
~S
-...l
t r e6
0s s k s
40
i ir
20Ii
oII
!I
III
0.0
0.0
50
.10
Ste
el
Str
ain
0.1
50
.20
FIG
.4
.2S
teel
Str
ess-
Str
ain
Rel
atio
ns
Ass
um
edfo
r:M
om
ent-
Cu
rvat
ure
Cal
cula
tio
ns

20
0.0
00
H'6
0.0
00
0P
=2
0k
ips
P-1
5k
ips
H----
==P
=1
0k
ips
P=
5k
ips
E N T'2
8.8
88L/~~~~
P=
Ok
ips
y
\D/
(Xl
K Isa
.000
P - I N I4
9.0
00
8.8
88
8.0
08
8.0
8S
0.0
10
8.0
15
8.0
28
8.0
25
8.0
30
0.0
35
8.0
48
8.8
4S
8.8
S8
CURV
ATUR
EAB
OUT
Y/
t/IN
/
FIG
.4.
3C
ompu
ted
Mom
ent-
Cur
vatu
reR
elat
ions

20
0.0
00
P=
15
kipl
IP
=1
0ki
plI
P=
5ki
plI
I(}ij/~~
p=
ok
ips
H1
60
.00
0
0 H E N T1
20
.00
0
X
~I
~K I
80
.00
0P - I N I
40
.00
0
0.0
00
0.0
00
0.0
05
0.0
10
0.0
15
0.0
20
0.0
25
0.0
30
0.0
35
0.0
40
0.0
45
0.0
50
CURV
ATUR
EAB
OUT
X/
t/IN
/
FIG
.4.
3C
onti
nued

24
0.0
00
22
0.0
00
20
0.0
00
A1
80
.00
0X I A
le0
.00
0L L
14
0.0
00
0 A1
20
.00
00
.... 0I
10
0.0
00
0I( I
80
.00
0P S /
60
.00
0
40
.00
0
20
.00
0
0.9
00
0.0
00
40
.00
08
0.0
00
12
0.0
00
16
0.0
00
20
0.9
00
24
0.0
00
MOME
NTY
IKIP
-IN
I
FIG
.4.
4Co~puted
Uni
axia
lM
omen
t-A
xial
Loa
dIn
tera
ctio
nD
iagr
ams
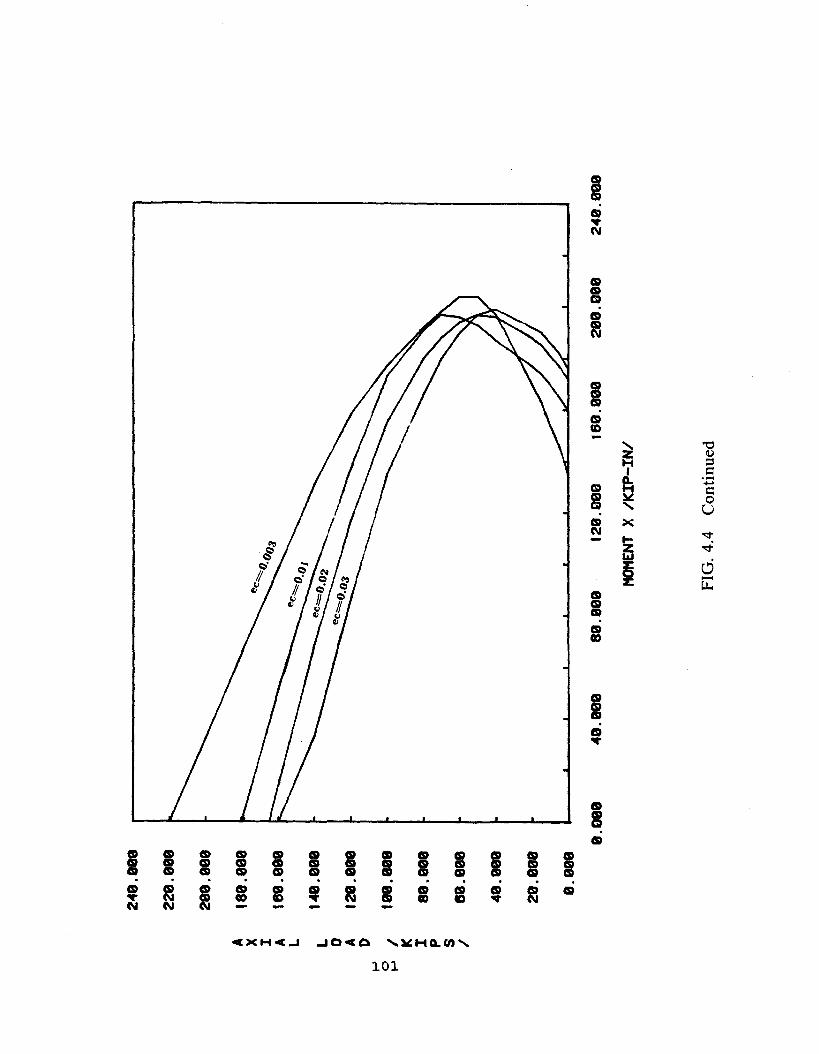
24
9.9
99
22
9.9
99
29
9.9
90
A1
89
.88
8X I A
te8
.89
8L L
1-49
.898
°A12
9.99
8D
"""' :::
I10
9.00
0Ie I
89
.90
0P S
e8.0
00
/
48
.09
0
29
.00
8
0.0
00
0.0
80
40
.90
08
0.0
00
120.
900
160.
000
20
9.9
00
24
0.0
00
MOME
NTX
/KIP
-IN
/
FIG
.4.
4C
onti
nued

t60
.00
0ec=
O.0
03
14
0.0
00
M 01
20
.00
0M E N
10
0.0
00
T Y8
0.0
00
r~~
"""-~
..........
.......
/""
P=
15
kip
s~
I0
Kl\
)
I6
0.0
00
P - IP
=5
kip
sN
40
.00
0l-
I
l2
0.0
00
P=
10
kip
s
0.0
00
0.0
00
40
.00
08
0.C
00
12
0.0
00
160.
00C
20
0.0
00
MOM
ENT
XIK
IP-I
NI
FIG
.4.
5C
ompu
ted
Bia
xial
Mom
ent-
Axi
alL
oad
Inte
ract
ion
Dia
gram
s
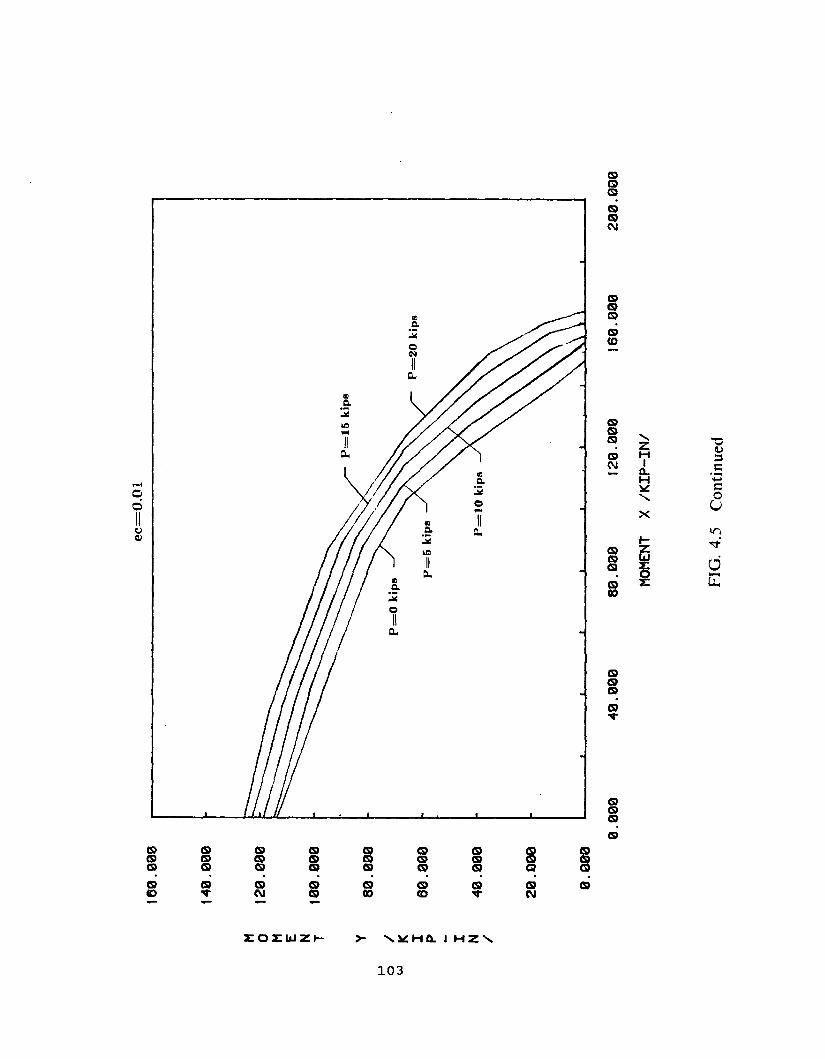
16
0.0
00
ec=
O.O
l
14
0.0
00
M 01
20
.00
0M E N
10
0.0
00
T y8
0.0
00
....I
0
~w
KP
=O
kip
s
I6
0.0
00
X'\.
'\.'\
."~
P=
20
kip
s
PP
=5
kip
s
- I N4
0.0
00
to/
P=
10
kip
s
20
.Q0
0
0.9
00
0.0
00
40
.00
08
0.0
00
12
9.0
00
16
9.0
00
20
0.0
90
MOM
ENT
X/K
IP-I
N/
FIG
.4.
5C
onti
nued

16
0.0
00
ec=
O.0
2
14
0.0
00
MI~
IP
=1
5k
ips
01
20
.00
0M E
I----
-------.....~~
"'-
rP
=2
0k
ips
N1
00
.00
0T
IP
=O
kip
s
y8
0.0
00
......
rP
=5
kip
s0
/~
KI
P=
lOk
ips
I6
0.0
00
P - I N4
0.0
00
/
20
.00
0
0.0
00
0.9
00
40
.00
08
0.0
00
12
0.0
00
16
0.0
00
20
0.0
00
MOME
NTX
/KIP
-IN
/
FIG
.4.
5C
onti
nued
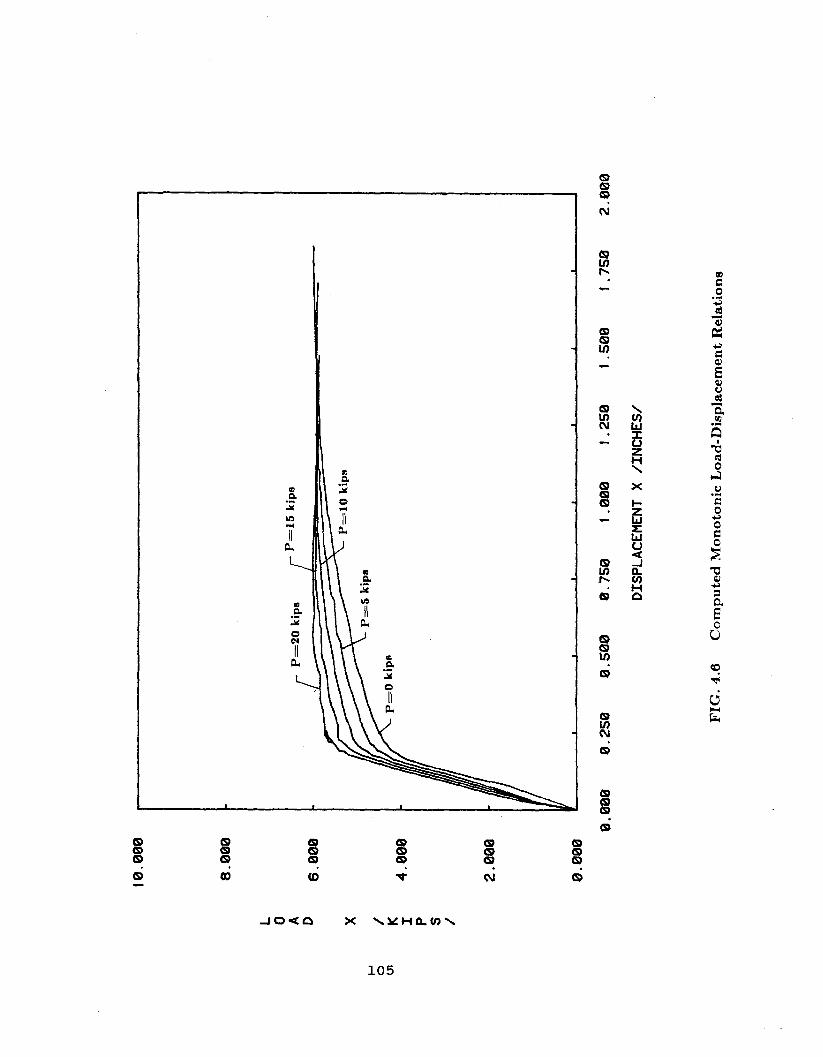
f0.0
00
8.0
00
L 0 A
p8
D6
.00
0
IX
....I
0 01K
4.0
00
I P S I
2.0
00
0.0
00
0.0
00
0.2
50
0.5
00
0.7
50
1.0
00
1.2
50
1.5
00
f.7
50
2.0
00
DISP
LACE
MEN
TX
IIN
CH
ES/
FIG
.4
.6C
om
pu
ted
Mo
no
ton
icL
oad
-Dis
pla
cem
ent
Rel
atio
ns

1121.1
211211
21
8.1211
21121
L 0 A D6.1
211211
21
Y
.....I
0K
4.9
99
0'\
I P S I
2.9
99
9.91
219
.P
=2
0k
ips
P=
15
kip
sP
=lO
kip
sP
=5
kip
s
-P
=O
kip
s
9.0
00
0.2
50
0.51
210
0.75
121
t.01
21121
t.25
121
t.51
21121
1.7
50
2.01
210
DISP
LACE
MEN
TY
IINC
HES
/
FIG
.4
.6C
on
tin
ued
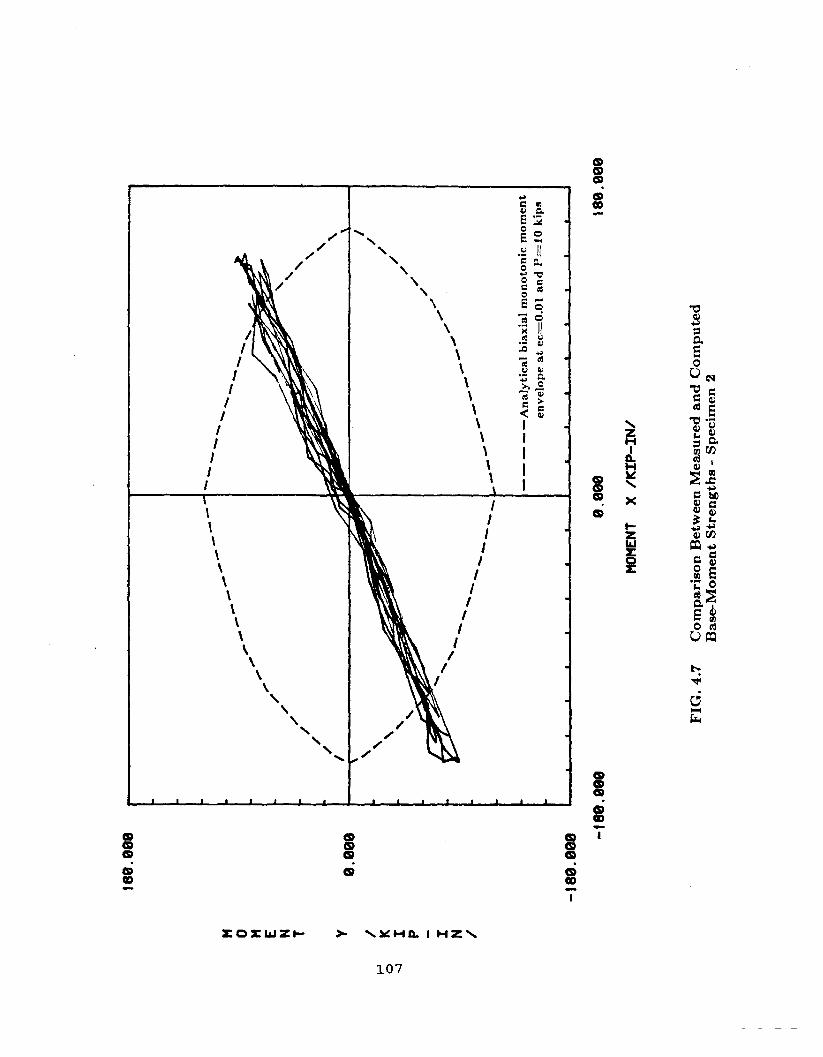
'ea.
aaa
H 0 H E N T Y9
.99
9I
~K
0I
...,J
P - I N I
..,.
.---
-."
,....-
"..--
,--"",,"
/,,/
;'
// I , , ,
, ".....
.....
'--....
...._-
..........
.--.....
--
..........
.--.....
....... ....
........
........
..... .....
..., -
I/
///
//
"",,""
","
-----
....
..,..
..".....
.""
,.
--
--
-A
nal
yti
cal
bia
xia
lm
on
oto
nic
mo
men
ten
vel
op
eat
ec=
O.O
Ian
dP
=IO
kip
s
-'S
9.g
e9
-'S9.
aae
e.aa
a
HOHE
NTX
/KIP
-IN
/
FIG
.4
.7C
om
pari
son
Bet
wee
nM
easu
red
an
dC
om
pu
ted
Bas
e-M
om
ent
Str
en
gth
s-
Sp
ecim
en2
'sa.a
ea
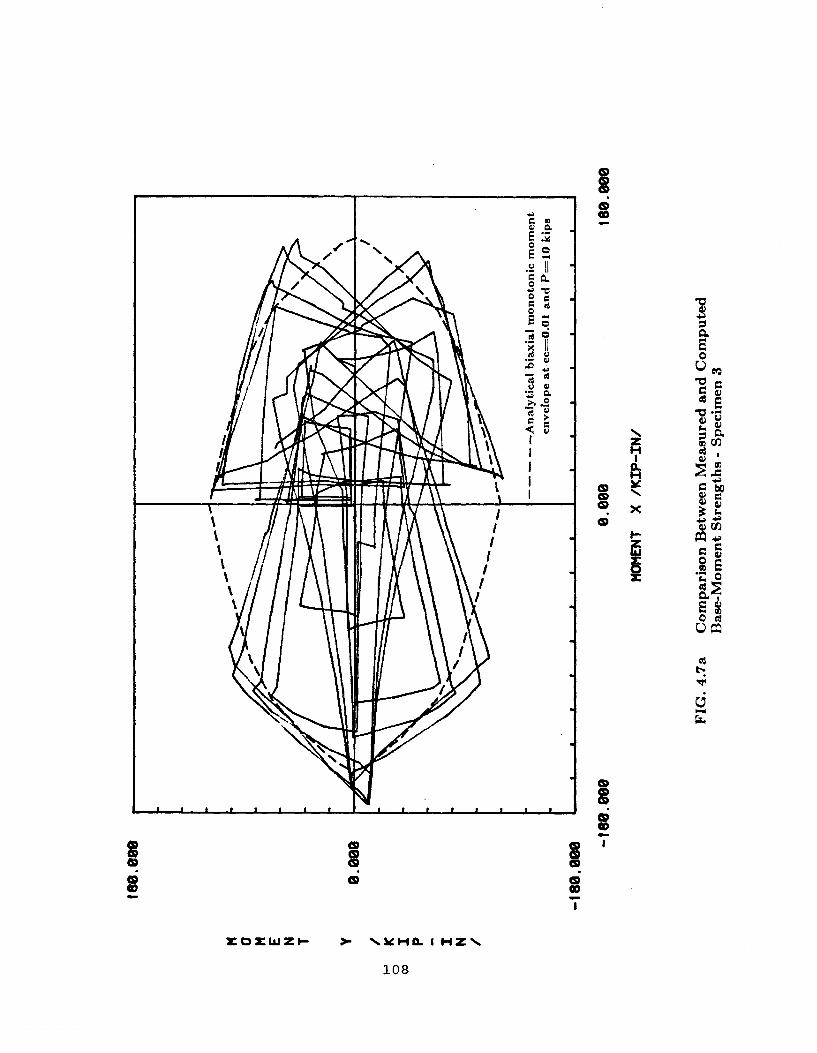
f89
.98
9
M 0 M E N T Y9
.90
8/
I-'
K0
I(X
)
P - I N /
--
--
-An
aly
tical
bia
xia
lm
on
oto
nic
mo
men
ten
velo
pe
at
ec=
O.O
lan
dP
=lO
kip
s
-f8
9.8
08 -1
80
.88
00
.00
0
MOM
ENT
X/K
IP-I
N/
FIG
.4.7
aC
om
par
iso
nB
etw
een
Mea
sure
dan
dC
om
pu
ted
Bas
e-M
om
ent
Str
en
gth
s-
Sp
ecim
en3
188.
808
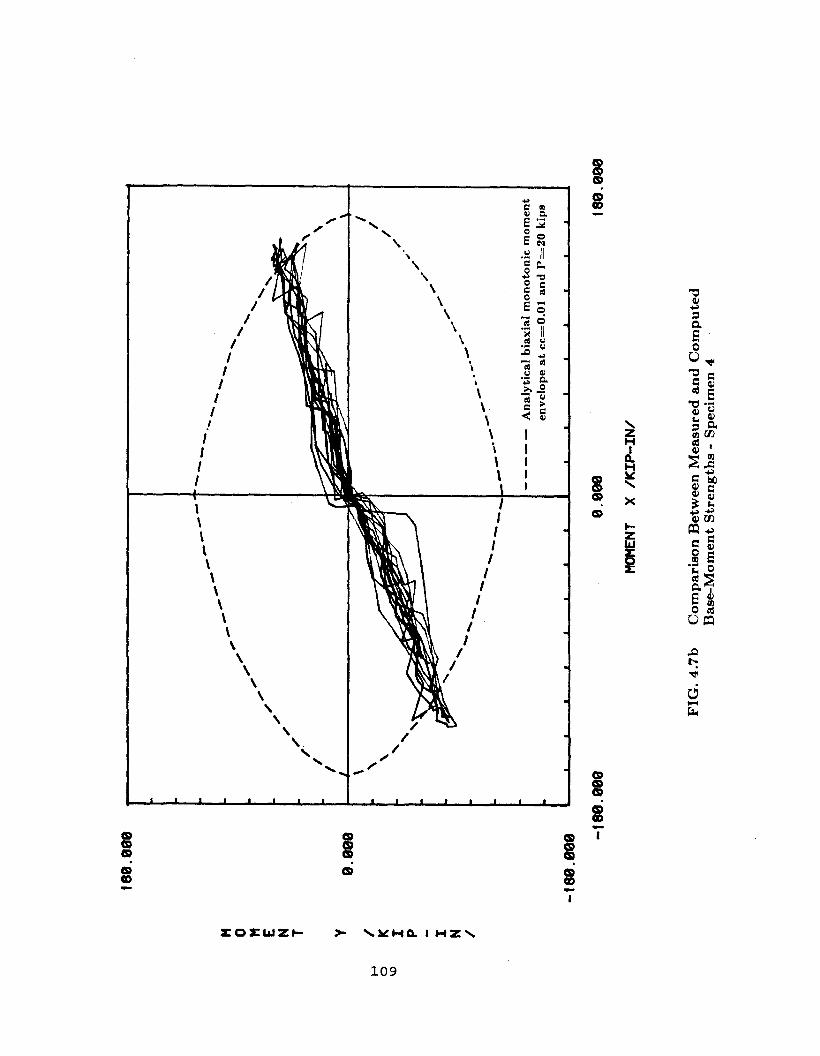
tse.
eae
H 0 H E N T Y9.
9ge
/I-
'K
0 \0I P - I N /
.....,.
...-
----
_...
.......
"'_
....
.
",'
"",'"
",,
/
",,
/
/I I
..........
.....- ....
........
........
. ........
........
.....-
.....
----...
_-
q:
II
//
.,//
.,;'
".,
;'"
.,;
--,....
....-
----,..,
.....
--
--
-A
nal
yti
cal
bia
xia
lm
on
oto
nic
mo
men
ten
vel
op
eat
ec=
O.O
lan
dP
=2
0k
ips
-tsa
.99
9 -IS
9.98
9e.
eee
MOM
ENT
X/K
IP-I
N/
FIG
.4.7
bC
om
par
iso
nB
etw
een
Mea
sure
dan
dC
om
pu
ted
Bas
e-M
om
ent
Str
en
gth
s-
Sp
ecim
en4
tse.
eee
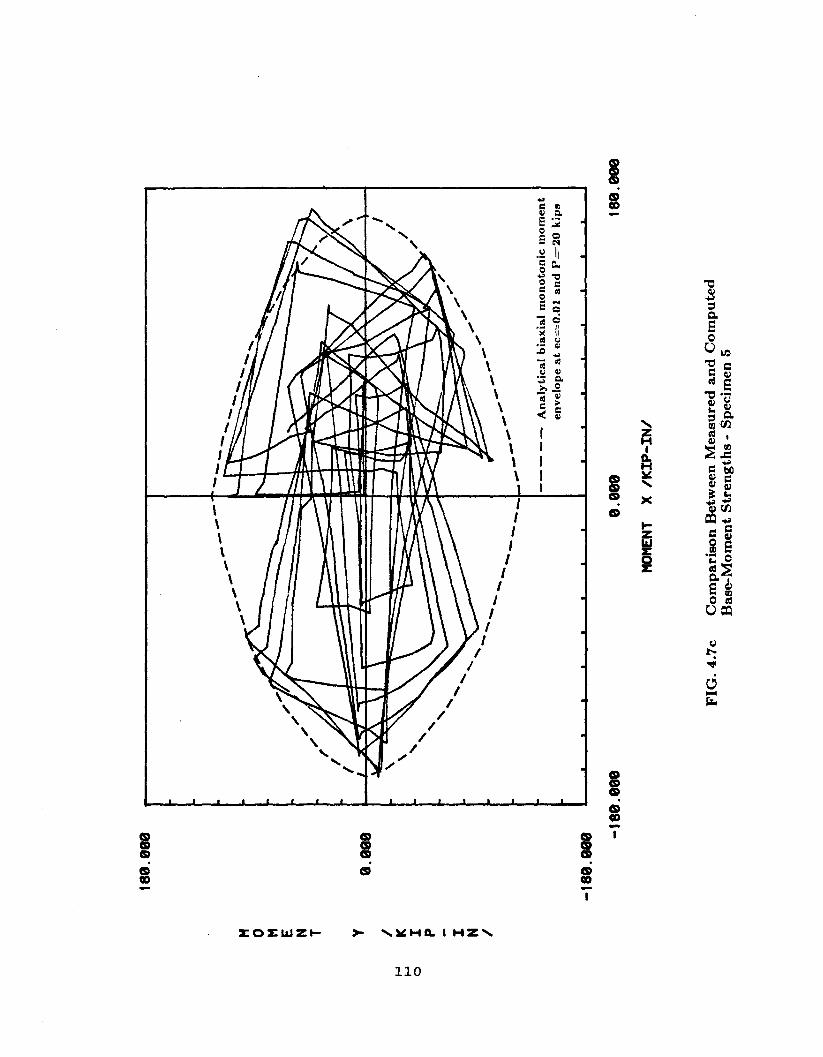
f80
.08
8
~~,/ "
,'"
",'"
-'"
------
---
------
- ---....
."".
,...,.
.----
,.",..~""
....
., .........., .....
... "---
....
._-
---
,/""
,/
,/
,/
/I '\'\
I
M 0 M E N T Y8
.09
8/
I-'
KI-
'I
0P - I N /
--
--
-A
naly
tical
bia
xia
lm
on
oto
nic
mo
men
ten
vel
op
eat
ec=
O.O
lan
dP
=2
0k
ips
-f8
8.8
98 -1
80
.88
88
.00
018
0.00
0
MOM
ENT
XIK
IP-I
N/
FIG
.4.7
cC
om
par
iso
nB
etw
een
Mea
sure
dan
dC
om
pu
ted
Bas
e-M
om
ent
Str
en
gth
s-
Sp
ecim
en5
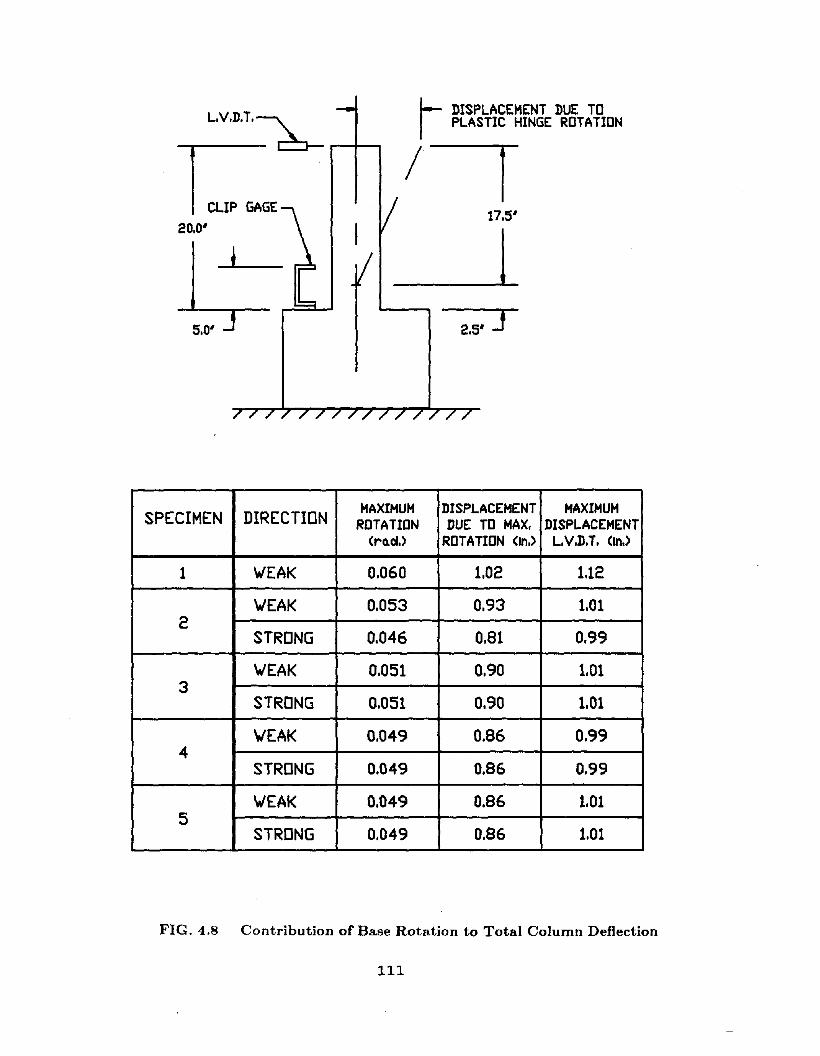
~ DISPLACEMENT DUE TOI PLASTIC HINGE ROTATION
/117.5'
_L2.5' T
SPECIMEN DIRECTIONMAXIMUM DISPLACEMENT MAXIMUM
ROTATION DUE TO MAX, DISPLACEMENT(rOod.) ROTATION (In.) L.V.D.T, (In.)
1 'WEAK 0,060 1.02 1.12
'WEAK 0.053 0.93 1.012
STRONG 0.046 0.81 0.99
'WEAK 0.051 0.90 1.013
STRONG 0.051 0.90 1.01
\lEAK 0.049 0,86 0.994
STRONG 0,049 0.86 0.99
'WEAK 0.049 0,86 1.015
STRONG 0.049 0.86 1.01
FIG. 4.8 Contribution of Base Rotation to Total Column Deflection
111

My
hI
Lly
bc
90.
lP'
If
l:1
kJ
de
x
---/..
..-//
" "-....
........
...
-- --
/c/
//
---M
x
0..
)Lo
o.d
His
tory
-O
neC
ycle
bJ
MO
Men
tV
ers
us
MO
Men
t
I-'
I-'
t-J
My
Mx
b
0.
c
c.)
Lo
o.d
-De
forM
o.t
lon
In'X
'D
ire
cti
on
By
d.)
Lo
o.c
l-D
efo
rMo
.tlo
nIn
'Y'
Dir
ecti
on
ex
FIG
.4
.9Id
eali
zed
Bia
xia
lH
yst
eres
isR
elat
ion
sfo
rL
oad
Ste
ps
"a"
thro
ug
h"e
"

hI
b.y
bc
90.
l1"1
fb
.
kJ
de
x
e
" ", '--
My
/c,/
//
---M
x
b,>
MO
Men
tV
ers
us
MO
Men
t
.... .... w
0..>
Lo
o.d
HIs
tory
-O
neC
ycle
My
0.
f
d
c
0y
e
Mx
b
ex
c.)
Lo
o.d
-De
forl
"'lo
.tlo
nIn
'X'
Dir
ectI
on
d.)
Lo
o.d
-De
forl
"lo
.tlo
nIn
'y'
DIr
ecti
on
FIG
.4
.10
Idea
lize
dB
iax
ial
Hy
ster
esis
Rel
atio
ns
for
Lo
adS
tep
sIIa"
thro
ug
h"r
'
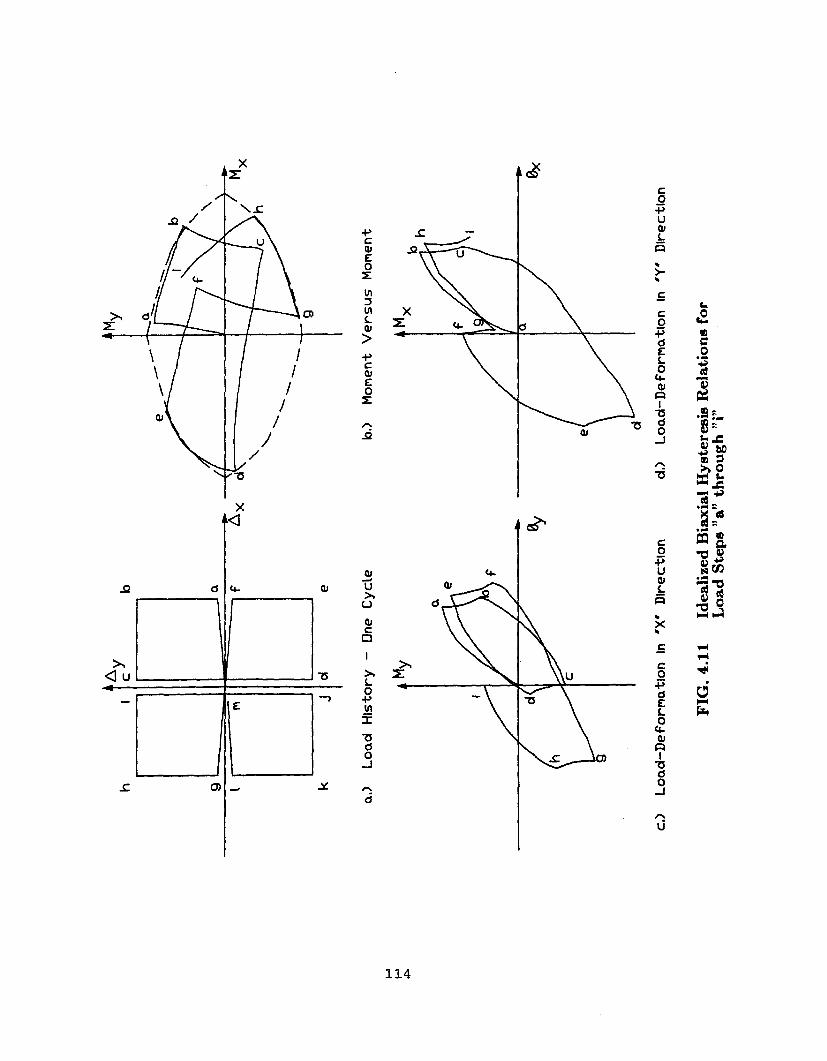
9
My
"'-
..........
.. ---M
x
-e
x
hI
6.y
bc
90.
lr'l
f6.
kJ
01e
0..
)Lo
o.oI
His
tory
-D
neC
ycle
b.)
MO
r'len
tV
ers
us
MO
r'len
t
f-O f-O "'"M
y
0.
f
9
By
Mx
e
ex
c.)
Loo.
oI-D
efo
rMo
.tlo
nIn
'X'
Dir
ecti
on
01.)
Loo.
oI-D
efo
rr'lo
.tlo
nIn
'Y'
Dir
ecti
on
FIG
.4
.11
Idea
lize
dB
iax
ial
Hy
ster
esis
Rel
atio
ns
for
Lo
adS
tep
s"a
"th
rou
gh
"i"

hI
l::1y
bc
90.
lM
f
kJ
ele
b.x
My 9
Mx
a.,)
Loo.
elH
isto
ry-
One
Cyc
leb
,)M
OM
ent
Ve
rsu
sM
OM
ent
I-'
I-'
1M
y+M
x01
bh
I-'
110.
f
~
EO
0x
c,)
Lo
o.e
l-D
efo
rMo
.tlo
nIn
'X'
Dir
ecti
on
el.)
Lo
o.e
l-D
efo
rMo
.tlo
nIn
'Y'
Dir
ecti
on
FIG
.4
.12
Idea
lize
dB
iax
ial
Hy
ster
esis
Rel
atio
ns
for
Lo
ad
Ste
ps"
a"th
rou
gh
"m"
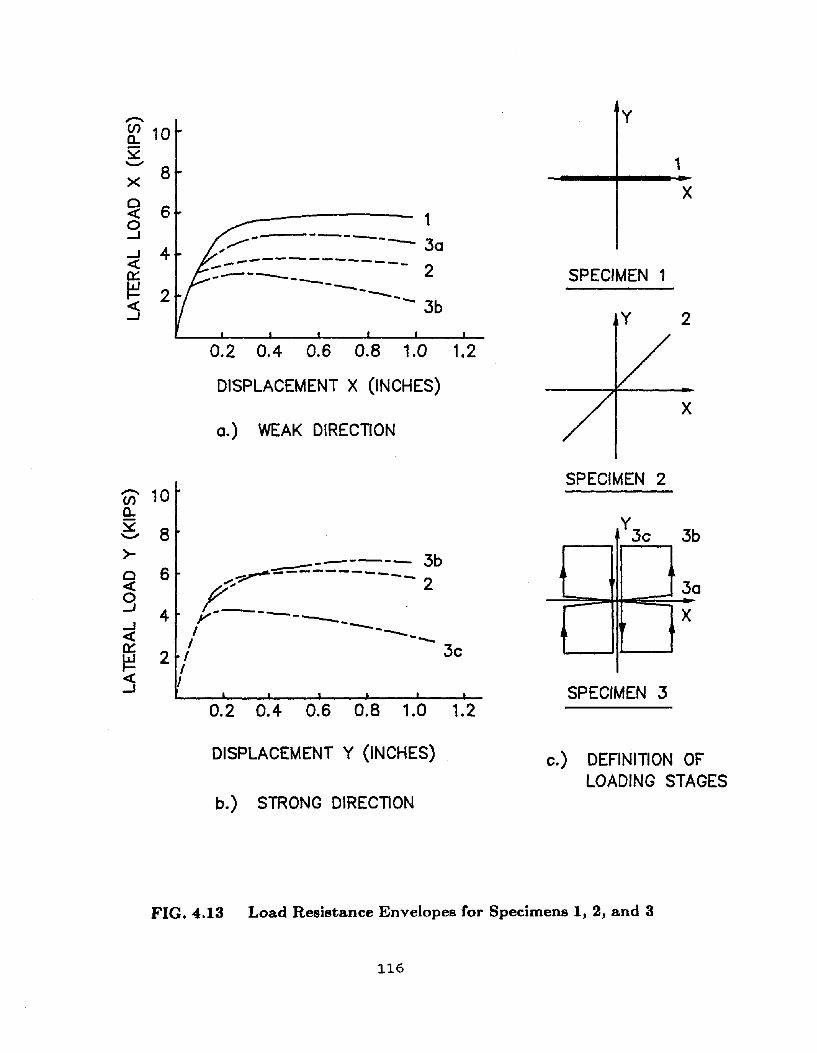
-. y~ 10S2
1'-'8x
X0« 6 10--J -----..---J 4 -- 30« -----------------
20::: _..------------- SPECIMEN 1~ 2 ------« -- 3b--J Y 2
0.2 0.4 0.6 0.8 1.0 1.2
DISPLACEMENT X (INCHES)X
0.) WEAK DIRECTION
SPECIMEN 2en 10a.C, 8
o
by
SPECIMEN 3
3c 3
- 3
X
0.2 0.4 0.6 0.8 1.0 1.2
------ 3b6 "'='~-:::--:=_------- 2
4 1:--- .y -----I ---__ ..
I -2 I 3cII
>o«g--J«0:::
~«--J
DISPLACEMENT Y (INCHES) c.) DEFINITION OFLOADING STAGES
b.) STRONG DIRECTION
FIG. 4.13 Load Resistance Envelopes for Specimens 1, 2, and 3
116

180 SPECIMEN 1
120
60
___5 ..r:::::::::.:6:...-_- 7
0,02 0.04 0,06
ROTATION ABOUT Y (RAD)
7~---
SPECIMEN 2
0,02 0,04 0,06
ROTATION ABOUT Y (RAD)
180SPECIMEN 4
0,02 0,04 0,06
ROTATION ABOUT Y (RAD)
...--,--5 ._---7
FIG. 4.14 Comparison of loading Stiffnesses
117

EARTHQUAKE ENGINEERING RESEARCH CENTER REPORT SERIES
EERC repons are available from the National Information Service for Eanhquake Engineering(NISEE) and from the National Tecbnical InformationService(NTIS). Numbers in parentheses are Accession Numbers assigned by the National Technical Information Service; these are followed by a price code.Contact NTIS. 5285 Pon Royal Road, Springfield Virginia, 22161 for more information. Repons without Accession Numbers were not available from NTISat the time of printing. For a current complete list of EERC repons (from EERC 67-1) and availablity information, please contact Univenity of California,EERC. NISEE, 1301 South 46th Street, Richmond, California 94804.
UCBIEERC,80101 'Eanhquake Response of Concrete Gravity Dams Including Hydrodynamic and Foundation Interaction Effects: by Chopra, A.K.,Chakrabani. P. and Gupta, S.• January 1980. (AD-A087297)AIO.
UCB/EERC,80/02 'Rocking Response of Rigid Blocks to Eanbquakes; by Yim. e.S., Chopra, A.K. and Penzien, 1.. January 1980, (PB80 166 (02)A04.
UCB/EERC,80/03 'Optimum Inelastic Design of Seismic·Resistant Reinforced Concrete Frame Structures: by Zagajeski. S.W. and Benero, V.V.• January1980. (PB80 164 635)A06.
UCB/EERC·80/04 'Effects of Amount and Arrangement of Wall·Panel Reinforcement on Hysteretic Behavior of Reinforced Concrete Walls," by lIiya, R.and Benero. V.V.• February 1980. (PB81 122 525)A09. ,
UCB/EERC·80/05 'Shaking Table Research on Concrete Dam Models,' by Niwa, A. and Gough. R.W., September 1980. (PBSI 122 368)A06.
UCB/EERC·80/06 'The Design of Steel Energy-Absorbing Restrainers and their Incorporation into Nuclear Power Plants for Enhanced Safety (Voila):Piping with Energy Absorbing Restrainers: Parameter Study on Small Systems,' by Powell. G.H.. Oughourlian. e. and Simons, J.• June1980.
UCB/EERC-80/07 'Inelastic Torsional Response of Structures Subjected to Eanhquake Ground Motions: by Yamazaki. Y., April 1980. (PB81 122327)A08.
UCB/EERC-80/08 'Study of X-Braced Steel Frame Structures under Eanhquake Simulation: by Ghanaat, Y.• April 1980, (PB81 122 335)AII.
UCB/EERC-80/09 'Hybrid Modelling of Soil-Structure Interaction; by Gupta, S., Lin. T.W. and Penzien. J.• May 1980. (PB81 122 319)A07.
UCB/EERC-80/1O 'General Applicability of a Nonlinear Model of a One Story Steel Frame; by Sveinsson. B.l. and McNiven, H.D.• May 1980. (PB81124877)A06.
UCBIEERC-801 II •A Green-Function Method for Wave Interaction with a Submerged Body,' by Kiok&, W.• April 1980. (PB81 122 269)A07.
UCBIEERC-80/12 'Hydrodynamic Pressure and Added Mass for Axisymmetric Bodies.; by Nilrat. F.• May 1980. (PB81 122 343)A08.·
UCBIEERC·80/13 'Treatment of Non-Linear Drag Forces Acting on Offshore Platforms,' by Dao. B.V. and Penzien.l.• May 1980, (PB81 153413)A07.
UCBIEERC-80/14 '2D Plane/Axisymmetric Solid Element (Type 3-E1astic or Elastic-Perfectly Plastic) for the ANSR·II Program: by Mondkar. D.P. andPowell. G.H.• July 1980. (PB81 122 350)A03.
UCBIEERC·80115 •A Response Spectrum Method for Random Vibrations,' by Der Kiuregbian. A.• lune 1981. (PB81 122301)A03.
UCB/EERC·80116 "Cyclic Inelastic Buckling of Tubular Steel Braces; by Zayas, VA, Popov, E.P. and Manin. SA. June 1981, (PB81 124885)AIO.
UCB/EERC-SOI17 'Dynamic Response of Simple Arch Dams Including Hydrodynamic Interaction; by Poner. C.S. and Chopra, A.K.. July 1981. (PB81124000)AI3.
UCB/EERC-80118 "Experimental Testing of a Friction Damped Aseismic Base Isolation System with Fail-Safe Characteristics,' by Kelly. J.M.• Beucke.K.E. and Skinner. M.S., July 1980, (PB81 148 595)A04.
UCB/EERC-80/19 "The Design of Steel Emergy-Absorbing Restrainers and their Incorporation into Nuclear Power Plants for Enhanced Safety (VoUB):Stochastic Seismic Analyses of Nuclear Power Plant Structures and Piping Systems Subjected to Multiple Supponed Excitations,' byLee, M.C. and Penzien. J•• June 1980, (PB82 201 872)A08.
UCB/EERC·80/20 "The Design of Steel Energy·Absorbing Restrainers and their Incorporation into Nuclear Power Plants for Enhanced Safety (Vol 10:Numerical Method for Dynamic Substructure Analysis,' by Dickens, J.M. and Wilson. E.L. June 1980.
UCB/EERC-80/21 'The Design of Steel Energy-Absorbing Restrainers and their Incorporation into Nuclear Power Plants for Enhanced Safety (Vol 2):Development and Testing of Restraints for Nuclear Piping Systems,' by Kelly, J.M. and Skinner. M.S., June 1980.
UCB/EERC·80/22 '3D Solid Element (Type 4-Elastic or Elastic-Perfectly-Plastic) for the ANSR·II Program; by Mondkar. D.P. and PoweD, G.H., July1980. (PB81 123 242lA03.
UCB/EERC·80/23 'Gap-Friction Element (Type 5) for tbe Ansr-II Program; by Mondkar. D.P. and Powell. G.H.• July 1980. (PB81 122285)A03.
UCB/EERC·80/24 'U-Bar Restraint Element (Type II) for the ANSR-II Program; by Oughourlian, e. and Powell. G.H.• July 1980. (PB81 122293)A03.
UCB/EERC-80/25 'Testing of a Natural Rubber Base Isolation System by an Explosively Simulated Eanhquake.· by Kelly, J.M., August 1980. (PB81 201360)A04.
UCB/EERC-80/26 'Input Identification from Structural Vibrational Response; by Hu, Y., August 1980. (PB81 152 308)A05.
UCB/EERC-80/27 "Cyclic Inelastic Behavior of Steel Offshore Structures; by Zayas, VA. Mahin. SA and Popov, E.P.• August 1980. (PB8I 196180lA15.
UCBlEERC-80/28 "Shaking Table Testing ofa Reinforced Concrete Frame with Biaxial Response; by Oliva, M.G., October 1980. (PB81 154304)AIO.
UCB/EERC·80/29 "Dynamic Properties of a Twelve-Story Prefabricated Panel Building,· by Bouwkamp, J.G., Kollegger. J.P. and Stephen. R.M.• October1980, (PB82 138 777)A07.
UCBlEERC-80130 'Dynamic propenies of an Eight-Story Prefabricated Panel Building,' by Bouwkamp, J.G., Kollegger, J.P. and Stephen. R.M., October1980, (PBSI 200 313)A05.
UCB/EERC-80/31 'Predictive Dynamic Response of Panel Type Structures under Eanhquakes; by Kollegger. 1.P. and Bouwkamp. J.G.• October 1980.(PB81 152316)A04.
119
Preceding page blank

UCBlEERC-80/32 -The Design of Steel Energy-Absorbing Restrainers and their Incorporation into Nuclear Power Plants for Enhanced Safety (Vol 3):Testing of Commercial Steels in Low-Cycle Torsional Fatique,- by Spanner, P., Parker, E.R., IongeWlW'd, E. and Dory, M., 1980.
UCB/EERC-80133 "The Design of Steel Energy-Absorbina Restrainers and their Incorporation into Nuclear Power Plants for Enhanced Safety (Vol 4):Shaking Table Tests of Piping Systems with Ene!'llY-Absorbing Restrainers: by Stiemer, S.F. and Godden, W.G., September 1980,(PB82 201 880)A05.
UCB/EERC-80134 "The Design of Steel Energy-Absorbing Restrainers and their Incorporation into Nuclear Power Plants for Enhanced Safety (Vol 5):Summary Report," by Spencer, P., 1980.
UCB/EERC-80/35 'Experimental Testing of an Energy-Absorbing Base Isolation System: by Kelly, I.M., Skinner, M.S. and Beuclte. K.E., October 1980,(PB81 154 072)A04.
UCB/EERC-80/36 "Simulating and Analyzing Artiticial Non-Stationary Earth Ground Motions," by Nau, R.F., Oliver, R.M. and Pister, K.S., October1980. (PB81 153 397)A04.
UCB/EERC-80/37 -Earthquake Engineering at Berkeley - 1980: by, September 1980, (PB81 205674)A09.
UCB/EERC·80/38 'Inelastic Seismic Analysis of Large Panel Buildings: by Schriclter, V. and Powell, G.H., September 1980, (PB81 154 338)AI3.
UCBlEERC-80/39 "Dynamic Response of Embankment. Concrete-Gavity and Arch Dams Including Hydrodynamic Interation: "by Hall, ].F. and Chopra,A.K., October 1980, (PB81 152 324)AII.
UCB/EERC-80/40 -Inelastic Buckling of Steel Struts under Cyclic Load Reversal.: by Black, R.G.• Wenger. W.A. and Popov. E.P., October 1980. (PB81154 312)A08.
UCB/EERC-80/41 "Influence of Site Characteristics on Buildings Damage during the October 3,1974 Lima Earthquake: by Repello, P., Arango, I. andSeed, H.B.• September 1980, (PB81 161 739)A05.
UCB/EERC·80/42 "Evaluation of a Shaking Table Test Program on Response Behavior of a Two Story Reinforced Concrete Frame: by Blondet, ].M.,Clough. R.W. and Mahin. S.A.,December 1980. (PB82 196 544)AII.
UCB/EERC-80/43 "Modelling of Soil-Structure Interaction by Finite and Infinite Elements: by Medina. F., December 1980, (PB81 229 270)A04.
UCB/EERC·81/01 'Control of Seismic Response of Piping Systems and Other Structures by Base Isolation: by Kelly, I.M., January 1981, (PB81 200735)A05.
UCB/EERC-81/02 "OPTNSR- An Interactive Software System for Optimal Design of Statically and Dynamically Loaded Structures with NonlinearResponse: by Bhalti, M.A., Ciampi, V. and Pister. K.S., Ianuary 1981, (PB81 218 851)A09.
UCB/EERC-81103 "Analysis of Local Variations in Free Field Seismic Ground Motions: by Chen, ].-C., Lysmer, J. and Seed, H.B.. January 1981, (ADA099508)A13.
UCB/EERC-81/04 "Inelastic Structural Modeling of Braced Offshore Platforms for Seismic Loading. : by Zayas., V.A., Shing, P.-S.B., Mahin. S.A. andPopov, E.P.. January 1981. (PB82 138 777)A07.
UCB/EERC-81/05 'Dynamic Response of Light Equipment in Structures: by Der Kiureghian, A., Sackman, ].L and Nour-0mid, B., April 1981, (PB81218497)A04.
UCB/EERC-81/06 "Preliminary Experimental Investigation of a Broad Base Liquid Storage Tank,' by Bouwkamp, ].G., Kollegger, ].P. and Stepben, R.M.,May 1981, (PB82 140 385)A03.
UCBJEERC-81107 "The Seismic Resistant Design of Reinforced Concrete Coupled Structural Walls: by Aktan, A.E. and Bertero, V.V., Iune 1981, (PB82113358)AII.
UCB/EERC-81/08 "Unassigned: by Unassigned, 1981.
UCB/EERC·81/09 -Experimental Behavior of a Spatial Piping System with Steel Energy Absorbers Subjected to a Simulated Differential Seismic Input," byStiemer, S.F., Godden. W.G. and Kelly, I.M., Iuly 1981. (PB82 201 898)A04.
UCB/EERC-81110 "Evaluation of Seismic Design Provisions for Masonry in the Uniled Stales: by Sveinsson, B.I., Mayes, R.L and McNiven, H.D.,August 1981, (PB82 166 075)A08.
UCB/EERC"81111 "Two-Dimensional Hybrid Modelling of Soil-Structure Interaction: by Tzong, T.·I., Gupta, S. and Penzien. I., August 1981. (PB82 142I 18)A04.
UCB/EERC·81/12 'Studies on Effects of Intills in Seismic Resistant RIC Construction: by Broklten, S. and Bertero, V.V., October 1981, (PB82 166190)A09.
UCB/EERC-81/13 "Linear Models to Predict tbe Nonlinear Seismic Behavior of a One-Story Steel Frame," by Valdimarsson, H., Shah. A.H. andMcNiven, H.D., September 1981. (PB82 138 793)A07.
UCB/EERC-81/14 "TLUSH: A Computer Program for the Three-Dimensional Dynamic Analysis of Earth Dams: by Kagawa, T., Mejia. LH., Seed, H.B.and Lysmer, I., September 1981, (PB82 139 940)A06.
UCBJEERC·8IJI5 -Three Dimensional Dynamic Response Analysis ofEanh Dams: by Mejia, LH. and Seed, RB., September 1981, (PB82 137 274)AI2.
UCBlEERC-81/16 "Experimental Study of Lead and Elastomeric Dampers for Base Isolation Systems: by Kelly, I.M. and Hodder, S.B., October 1981,(PB82 166 182)A05.
UCB/EERC-81/11 "The Influence of Base Isolation on tbe Seismic Response of Light Secondary Equipment,- by Kelly, I.M., April 1981, (PB82 255266)A04.
UCB/EERC-81/18 "Studies on Evaluation of Shaking Table Response Analysis Procedures: by Blondet, 1. Marcial, November 1981, (PB82 197 278)AIO.
UCB/EERC-81/19 "DELlGHT.STRUCT: A Computer-Aided Design Environment for .Structural Engineering. : by Balling, R.J., Pister, K..S. and Polak,E., December 1981, (PB82 218 496)A07.
UCB/EERC-81/20 "Optimal Design of Seismic"Resistant Planar Steel Frames," by Balling, RJ., Ciampi, V. and Pister, K.S., December 1981, (PB82 220I79)A07.
120
UCBlEERC-8210I ·Dynamic Behavior of Ground for Seismic Analysis of Lifeline Systems," by Sato, T. and Der Kiwqhian, A.. January 1982. (PB82 218926)A05.
UCBlEERC·82102 "Sbakinc Table Tests of a Tubular Steel Frame Model: by Gbanaal, Y. and Oough, R.W., January 1982. (PB82 220 161)A07.
UCBlEERC"82103 "Behavior of a Pipinl System under Seismic Excitation: Experimental Investi8lltions of a Spatial Pipins System supported by Mechanical Shock Amston," by Schneider, S., Lee, H.-M. and Godden, W. G., May 1982, (PB83 172 S44)A09.
UCB/EERC"82104 ·New Approaches for the Dynamic Analysis of Larse Structural Systems," by Wilson, E.L, June 1982, (PB8l 148 080)AOS.
UCB/EERC"82105 "Model Study of Effects of Damage on the Vibration Properties of Steel Offshore Platforms,· by Shahrivar, F. and Bouwkamp, J.G.,June 1982, (PB83 148 742)AIO.
UCB/EERC-82106 "States of the Art and Pratice in the Optimum Seismic Design and Analytical Response Prediction of RIC Frame Wall Structures," byAktan. A.E. and Bertero, V.V., July 1982, (PB83 147 736)A05.
UCB/EERC-82107 "Further Study of the Earthquake Response of a Broad Cylindrical Liquid-Storqe Tank Model,· by Manos. G.C. and Oough. R.W.,July 1982, (PB83 147 744)AII.
UCB/EERC-82108 "An Evaluation of the Design and Analytical Seismic Response of a Seven Story Reinforced Concrete Frame," by Charney, F.A. andBenero. V.V., July 1982. (PB83 157 628)A09. I
UCBlEERC-82109 "F1uid"Structure Interactions: Added Mass Computations for Incompressible Fluid. : by Kuo, J.S."H., August 1982, (PB83 156281)A07.
UCB/EERC·82110 "Joint..()pening Nonlinear Mechanism: Interface Smeared Crack Model: by Kuo, J.S.-H., August 1982. (PB83 149 195)A05.
UCB/EERC-82111 "Dynamic Response Analysis ofTechi Dam: by Oough, R.W., Stephen, R.M. and Kuo. J.S."H., August 1982, (PB83 147 496)A06.
UCB/EERC·82112 "Prediction of the Seismic Response of RIC Frame-Coupled Wall Structures," by Aktan, A.E., Bertero, V.V. and Piazza, M., August1982. (PB83 149 203)A09.
UCB/EERC·82113 "Preliminary Report on the Smart I Strong Motion Array in Taiwan: by Boll, BA ,Loh, C.H., Penzien, J. and Tsai, Y.B., August1982. (PB83 159 4OO)AI0.
UCB/EERC·82114 "Shaking-Table Studies of an Eccentrically X"Braced Steel Structure," by Yang, M.S., September 1982, (PB83 260 778)A12.
UCB/EERC·82115 "The Performance of Stairways in Earthquakes: by Roha, C., Axley, J.W. and Benero, V.Y., September 1982. (PB83 157 693)A07.
UCB/EERC-82116 "The Behavior of Submerged Multiple Bodies in Earthquakes: by Liao, W.-G., September 1982, (PB83 158 709)A07.
UCB/EERC-82117 "Effects of Concrete Types and Loading Conditions on Local Bond·Slip Relationships: by Cowell, A.D., Popov, E.P. and Benero. V.V.•September 1982. (PB83 153 577)A04.
UCB/EERC-82118 "Mechanical Behavior of Shear Wall Venical Boundary Memben: An Experimental Investigation," by Wagner, M.T. and Benero. V.V.,October 1982, (PB83 159 764)AOS.
UCB/EERC-82119 "Experimental Studies of Multi-suppon Scismic Loading on Piping Systems: by Kelly, J.M. and Cowell, A.D.• November 1982.
UCB/EERC"82120 'Generalized Plastic Hinge Concepts for 3D Beam-Column Elements: by Chen, P. F.-S. and Powell, G.H.• November 1982, (PB83 247981)AI3.
UCB/EERC"82121 "ANSR·II: General Computer Program for Nonlinear Structural Analysis; by Oughourlian, C.V. and Powell, G.H., November 1982.(PB83 2S1 330)AI2.
UCB/EERC·82122 "Solution Strategies for Statically Loaded Nonlinear Structures," by Simons, J.W. and Powell. G.H., November 1982, (PB83 197970)A06.
UCB/EERC·82123 "Analytical Model of Deformed Bar Anchorages under Generalized Excitations: by Ciampi, V., Eligebausen, R., Bertero. V.V. andPopov. E.P., November 1982. (PB83 169 S32)A06.
UCB/EERC·82124 'A Mathematical Model for the Response of Masonry Walls to Dynamic Excitations," by. Sucuoglu. H., Menli, Y. and McNiven, H.D.,November 1982, (PB83 169 OII)A07.
UCBlEERC-82125 "Earthquake Response Considerations of Broad Liquid Storage Tanks: by Cambra, FJ., November 1982, (PB83 251 215)A09.
UCBlEERC·82126 "Computational Models for Cyclic Plasticity, Rate Dependence and Creep: by Mosaddad. B. and PoweD, G.H., November 1982, (PB8324S 829)A08.
UCBlEERC-82127 "Inelastic Analysis of Piping and Tubular Structures: by Mahasuverachai, M. and Powell, G.H., November 1982, (PB83 249 987)A07.
UCB/EERC-83/01 "The Economic Feasibility of Seismic Rehabilitation of Buildings by Base Isolation: by KeUy, J.M., January 1983, (PB83 197 988)AOS.
UCB/EERC-83/02 "Scismic Moment Connections for Moment-Resisting Steel Frames.: by Popov, E.P., January 1983, (PB83 195 412)A04.
UCB/EERC,83/03 "Design of Links and Beam·tO-Column Connections for Eccentrically Braced Steel Frames: by Popov, E.P. and Malley, J.O., January1983, (PB83 194 81I)A04.
UCB/EERC·83/04 "Numerical Tecbniques for the Evaluation of Soil-Structure Interaction Effects in the Time Domain: by Bayo, E. and Wilson, E.L,February 1983, (PB83 24S 605)A09.
UCBlEERC·83/0S 'A Transducer for Measuring the Internal Forces in the Columns of a Frame-Wall Reinforced Concrete Structure," by Sause, R. andBenero, V.V., May 1983, (PB84 119 494)A06.
UCBlEERC"83/06 'Dynamic Interactions Between Floating Ice and Offshore Structures: by Croteau. P., May 1983, (PB84 119 486)A16"
UCBlEERC,83/07 ·Dynamic Analysis of Multiply Tuned and Arbitrarily Supponed Secondary Systems. : by Igusa, T. and Der Kiureghian, A., July 1983,(PB84 118 272)A11.
UCB/EERC·83/08 •A Laboratory Study of Submerged Multi-body Systems in Earthquakes,· by Ansari, G.R., June 1983, (PB83 261 842)A17.
UCBlEERC·83/09 "Effects of Transient Foundation Uplift on Earthquake Response of Structures,' by Vim, C.-S. and Chopra, A.K., June 1983, (PB83 261396)A07.
121

UCBlEERC-83/1O 'Optimal Design of Friction·Braced Frames under Seismic Loading,' by Austin. M.A. and Pister. KS.• June 1983. {PB84 119 288)A06.
UCBlEERC-83/11 'Shaking Table Study of Sinl!e,Story Masonry Houses: Dynamic Performance under Three Component Seismic Input and Recommen,dations," by Manos, G.c.. Gough, R.W. and Mayes, R.L.. July 1983. {UCBlEERC,83111)A08.
UCBlEERC-83112 'Experimental Error Propaption in Pseudodynamic Testing,' by Shiing, P.B. and Mahin, S.A.. JUDe 1983. {PB84 119 270)A09.
UCB/EERC-83113 'Experimental and Analytical Predictions of the Mechanical Characteristics of a I/S-scale Model of a 7-stOry RIC Frame-Wall BuildilllStructure: by Ak1an. A.E.• Bertero. V.V., Chowdhury, A.A. and Napshima, T.• June 1983. {PB84 119 2l3)A07.
UCB/EERC·83/14 'Shaking Table Tests of l.arge-Panel Precast Concrete Buildilll S)'Item Assemb1a&es." by Oliva. M.G. and Gough, R.W.• June 1983.{PB86 110 210/AS)AI 1.
UCBlEERC-831IS 'Seismic Behavior of Active Beam Links in Eccentrically Braced Frames,' by Hjelmstad, K.D. and Popov, E.P.• July 1983. {PB84 119676)A09.
UCBlEERC·83/16 'System Identification of Structures with Joint Rotation: by Dimsdale. J.S.• July 1983. (PB84 192 210)A06.
UCB/EERC-83/17 "Construction of Inelastic Response Spectra for Sinl!e-Degree-of·Freedom Systems: by Mahin. S. and Lin, J .• June 1983. {PB84 208834)AOS.
UCB/EERC-83/18 'Interactive Computer Analysis Methods for Predicting the Inelastic Cyclic Behaviour of Structural Sections; by Kaba, S. and Mahin.S.• July 1983, {PB84 192 012)A06.
UCB/EERC·83/19 ' Effects of Bond Deterioration on Hysteretic Behavior of Reinforced Concrete Joints," by Filippou. F.C.• Popov. E.P. and Bertero. V.V.•August 1983. (PB84 192020)(\10.
UCB/EERC-83/20 "Analytical and Experimental Correlation of Large-Panel Precast Building System Performance.' by Oliva, M.G.• Gough, R.W.• Velkov.M. and Gavrilovic, P.• November 1983.
UCB/EERC·83/21 'Mechanical Characteristics of Materials Used in a 1/5 Scale Model of a 7·Story Reinforced Concrete Test Structure.' by Berte",. V.V.•Aktan. A.E.• Harris., H.G. and Chowdhury, A.A.. October 1983, (PB84 193 697)AOS.
UCB/EERC-83/22 'Hybrid Modelling of Soil·Structure Interaction in Layered Media: byTzong, T.-J. and Penzien. J.• October 1983. (PB84 192 178)A08.
UCB/EERC-83123 "Local Bond Stress-Slip Relationships of Deformed Bars under Generalized Excitations,' by Eligehausen. R.• Popov. E.P. and Bertero.V.V., October 1983, {PB84 192 848)A09.
UeB/EERC-83/24 'Design Considerations for Shear Links in Eccentrically Braced Frames: by Malley. J.O. and PoPOV. E.P.• November 1983. (PB84 192I86)A07.
UCB/EERC-84/01 "Pseudodynamic Test Method for Seismic Performance Evaluation: Theory and Implementation: by Shing, P.·S. B. and Mahin, S.A.•January 1984, (PB84 190 644)A08.
UCB/EERC-84/02 "Dynamic Response Behavior of Kiang Hong Dian Dam." by Gough. R.W., Chang, K.·T.• Chen. H.-Q. and Stephen. R.M.• April 1984.(PB84 209 402)A08.
UCB/EERC·84/03 "Refined Modelling of Reinforced Concrete Columns for Seismic Analysis: by Kaba, S.A. and Mahin, SA. April 1984, {PB84 234384)A06.
UCB/EERC-84/04 •A New Floor Response Spectrum Method for Seismic Analysis of Multiply Supported Secondary Systems.,' by Asfura, A. and DerKiureghian. A.• June 1984, {PB84 239 417)A06.
UCB/EERC-84/0S ·Earthquake Simulation Tests and Associated Studies of a 115th·scaIe Model of a 7·Story RIC Frame-Wall Test Structure: by 8ertero,V.V.• Aktan. A.E.• Charney. F.A. and Sause. R.• June 1984. {PB84 239 409)A09.
UCB/EERC-84/06 'RlC Structural Walls: Seismic Design for Shear: by Aktan. A.E. and Bertero. V.V.• 1984.
UCBlEERC,84/07 'Behavior of Interior and Exterior FIat-Plate Connections subjected to Inelastic Load Reversals.," by lee. H.I- and Moehle. J.P.• August1984. (PB86 117 629/AS)A07.
UCB/EERC·84/08 ·Experimental Study of the Seismic Behavior of a Tw0-8tory Flat-Plate Structure. : by Moehle. J.P. and Diebold, J.W.• August 1984.(PB86 122 553/AS)AI2.
UCB/EERC·84/09 "Phenomenological Modeling of Steel Braces under Cyclic Loading," by Ikeda, K.. Mahin. S.A. and Dermitzakis., S.N.• May 1984. (PB86132 1981AS)A08.
UCB/EERC·84/10 "Earthquake Analysis and Response of Concrete Gravity Dams: by Fenves, G. and Chopra, A.K.. August 1984. (PB8S 193902lAS)AII.
UCB/EERC-84/11 -EAGo-84: A Computer Program for Earthquake Anal)'lis of Concrete Gravity Dams." by Fenves, G. and Chopra, A.K.. August 1984.{PB8S 193 613/AS)AOS.
UCB/EERC·84/12 "A Refined Physical Theory Model for Predicting the Seismic Behavior of Braced Steel Frames," by Ikeda. K. and Mabin. S.A.• July1984, (PB8S 191 4S0/AS)A09.
UCB/EERC-84/13 "Earthquake Engineering Research at Berkeley· 1984: by. August 1984. (PB8S 197 341/AS)AI0.
UCB/EERC-84/14 'Moduli and Damping Facton for Dynamic Anal)'les ofCohesionless Soils." by Seed, H.B.• Wong, R.T.• Idriss, I.M. and Tokimatsu, K.,September 1984. (PB8S 191 468/AS)A04.
UCB/EERC-84/IS 'The Influence ofSPT Procedures in Soil Liquefaction Resistance Evaluations: by Seed, H.B.• Tokimatsu, K., Harder, L.F. and Chung,R.M.• October 1984. (PB8S 191 7321AS)A04.
UCB/EERC·84/16 'Simplified Procedures for the Evaluation of Settlements in Sands Due to Earthquake Shaking,' by Tokimatsu, K. and Seed, H.B.•October 1984. (PB8S 197 887/AS)A03.
UCB/EERC-84/17 "Evaluation of Energy Absorption Characteristics of Bridges under Seismic Conditions: by Imbsen, R.A. and Penzien. J•• November1984.
UCB/EERC-84/18 "Structure·Foundation Interactions under Dynamic Loads: by Liu. W.O. and Penzien. J•• November 1984. {PB87 124 889/AS)All.
122
UCB/EERC-84119 'Seismic Modelling of Deep Foundations,' by Chen. C.-H. and Pennen, I., November 1984, (PB87 124 7981AS)A07.
UCBlEERC.84120 'Dynamic Re$ponse Behavior of Quan Shui Dam: by Gough. R.W., Chana. K.,T•• Chen. H.oO.• Slephen. R.M~ Gha.naat, Y. and Qi.J.,H., November 1984, (PB86 1I5177/AS)A07.
UCBlEERC·85/0 I
UCBlEERC-85/02
UCBlEERC·85/03
UCBlEERC-85/04
UCBlEERC·85/(15
UCBlEERC·85/06
UCBlEERC·85/07
UCBlEERC·85/08
UCBlEERC·85/09
UCB/EERC·85/10
UCBlEERC-85/11
UCB/EERC-85/12
UCB/EERC-85/13..UCB/EERC·85/14
UCB/EERC·8S/15
UCB/EERC-85/16
·Simplified Methods of Analysis for Earthquake Resistant Desiaa of Buildings,' by Cruz, E.F. and Chopra, A.K.. February 1985, (PBS6112299/AS)AI2.
'Estimation of Seismic Wave Coherency and Rupture Velocity usilll the SMART I StroDe-Motion Array Recordinp," by Abrahamson,N.A., March 1985, (PB86 214 343)A07.
'Dynamic Propenies of a Thirty Story Condominium Tower Building; by Stepbeu. R.M~ Wilson, E.L and Studer. No, April 1985.(PB86 I 1896S/AS)A06.
'Development of Substrueturing Techniques for On-Line Computer ControUed Seismic PerfOrtnaDCe Testina.· by DmBiuaJtis, s. &AdMabin. S., February 1985, (PB86 13294I1AS)A08.
'A Simple Model for Reinforcinl Bar Anchoraces under Cyclic Excitations,' by FiJippou. F.e.. March 1985. (PB86112 919/AS)A05.
'Rackina Behavior of Wood·framed Gypsum Panels under Dynamic Load,. by Oliva, M.G., June 1985.
·Earthquake Analysis and Response of Concrele Arch Dams: by Fok, K..·L and Chopra. A.I<.. June 1985, (PBI6 1396721A.S)AIO,
'Effect of Inelastic Behavior on the Analysis and Desip of Earthquake Resistant Structures; by Un. J.P. a114 Mahin, s.A. June 1985.(PB86 1353401AS)A08.
·Earthquake Simulator Testin, of a Base-Isolated Bridge Dect,' by KeUy, I.M., Buckle. I.G. and Tsai, H.-e~ January 1986. (PB81 124IS2IAS)A06.
'Simplified Analysis for Eanhquake Resistant Design of Concrete Gravity Dams," by Feaves, G. and Chopra, A.K.. June 1986. (PB87124 16OlAS)A08.
'Dynamic Interaction Elfecu in Arch Dams,' by Oouah, R.W., Chang, 1(..T.• Chen. H.oO. and Ghanaat, Y~ October 1985, (PB86135027/AS)AOS.
'Dynamic Re$ponse of Long Valley Dam in the Mammoth Lake Earthquake Series of May 25-21. 1980: by Ui. s. and Seed, H.B~November 1985, (PB86 142304/AS)A05.
•A Methodology for Computer·Aided Design of Earthquake-Resistant Steel Stttlctures," by Austin, M.~ Fister. K.S. and Mahin, s.A.December 1985, (PB86 I5948OJAS)AIO •
·Re$ponse of Tension.Leg Platfonns 10 Vertical Seismic Excitations,· by Liou. G.-5.• Penzieu. J. and Yeuar. R.W~ December 1985.(PB87 124 871/AS)A08.
"Cyclic Loading Tests of Masonry Single Piers: Volume 4 - Additional Tests with Height to Width Ratio of I: by SveiOSSOD. B.•McNiven, H.D. and Sucuoglu, H., December 1985.
•An Experimental Program for Studying the Dynamic Response of a Steel Frame with a Variety of Infill Partitions,' by YancY, B. andMcNiven. H.D., December 1985.
UCBlEERC·8611I
UCB/EERC·86/0 I
UCB/EERC·S6IIO
UCB/EERC-86/07
'A Study of Seismically Resistant Eceenlrical1y Braced Steel Frame Systems,' by Kasai. K. and Popov, E.P•• lanuary 1986. (PBS7 124178/AS)AI4.
-Design Problems in Soil Liquefaction: by Seed. H.B., February 1986, (PB87 124 186/AS)A03.
'Implications of Recent Eanhquake$ and Research on Earthquake.Resistant DesillD and CODStttleti"n of Buildings,: by Bertero. V.V.•March 1986, (PB87 124 194/AS)A05.
'The Use of Load Dependent Vectors for Dynamic and Earthquake Analyses,' by Lqer. P~ Wilsoa, E.L and CIolllllr. R.W.. March1986, (PB87 124 202lAS)AI2.
"Two Beam·To-Columa Web Connections,' by Tsai, K.-e. and Popov, E.P.• April 1986 • (PB87 124 301IAS)A04.
'Determination of Penetration Re$istance for Coarse-Grained Soils usin, the Bec:ter Hammer DrilI,' by Harder, LF. mel Seed, H.B..May 1986, (PB87 124 210/AS)A07•
•A Mathematical Model for Predicting the Nonlinear Re$ponse of Unreinfo~Masonry Walls to lD-PIane Earthquake Ucitations,' byMengi, Y. and McNiven, H.D., May 1986, (PB87 124 7801AS)A06.
'The 19 September 1985 Mexico Eanhquake: Buildin. Behavior: by Berteru. V.V.• July 1986.
'EACD-3D: A Computer Program for Three-Dimensional Earthquake Analysis of Concrete Dams,' by Folt, K.-L. Hall, J.F. aDdChopra. A.K., July 1986, (PB87 124 228/AS)A08.
'Ear!hAuake Simulation Te$u and Associated Studies of a O.3-Scale Model of a Sm-5tory ConceDUica1ly Braa:el Steel Structure,' byUaniC.·M. and Bertero. V.V.• December 1986.
'Mechanical Characteristics of Base Isolation Bearinp for a Bridge Deck Modd Test: by Kelly, J.M.. Buckle. LO. aud Kob. C-G..1987.
UCB/EERC·86112 ~ModeUin& of Dynamic Response of Elastomeric Isolation Bearings,' by Kob, e.-o. and Kelly, J.M~ 1987.
UCB/EERC·S6I08
UCB/EERC·86/09
UCB/EERC·86/0S
UCB/EERC·86/06
UCBlEERC·86/04
UCB/EERC·86/02
UCBlEERC-86/03
UCBlEERC-87/01 'FPS Eanhquake Re$istin& System: Experimental Report: by Zayas, V.A., Low, s.s. and Mahin, S.A., June 1987.
UCB/EERC·87/02 'Eanhquake Simulator Tesu and Associated Studies of a O.3-Scale Model of a Sm-5tory Ea:eatrically Braced Steel St11ll:lun:,; by Whit·taker, A.. Uang, C.·M. and Bertero, V.V., July 1987.
UCBlEERC·87103 •A Displacement Control and Uplift Restraint Device for Base-lsolated Structures,' by Kelly. J.M.. Griffitb, M.e. and Aikeu. LO~ April1987.
123

lJCB/EERC-1l7/04 "Earthquake Simulator Testing of a Combined Sliding Bearing and Rubber Bearing Isolation Sys.tem," by Kelly, J.M. and Chalhllub, M.S., 19l17.
UCB/EERC-87/0S "Three-Dimensional Inelasti<.: Analysis of Reinforced Concrete Frame-Wall Structures," by Moaz·zami, S. and Bertero, V.V., MOlY 1987.
UCB/EERC·87/06 "Experiments on E<.:centrically Braced Frames With Composite Floors," by Rides, J. and Popov, E.,June 1987.
UCR/EERC-1l7/07 "Dynamic Analysis of Seismil'ally Resistant Eccentrically Rraced Frames," by Rides, J. and Popov,E., June 19M7.
UCD/EERC-87/08 "Undrained Cyclic Triaxial Tesling of Gravels· The Effect of Membrane Compliance, " by Evans,M.D. and Seed, H.B., July 19M7.
UCB/EERC-ll7/01J "Hybrid Solution Tc<.:hniques For Generalized Pseudo-Dynamic Testing," by Thewall, C. and Mahin,S. A., July 1987.
UCB/EERC-87/10 "Investigation of Ultimate Bchavior of AISC Group 4 and 5 Heavy Steel Rolled-Section Splices withFull and Partial Penetration BUll Welds," by Bruneau, M. and Mahin, S.A., July 1987.
UCB/EERC-87/11 "Residual Strength of Sand From Dam Failures in the Chilean Earthquake of March 3, 1985," by DeAlba, P., Seed, H. B., Retamal, E. and Seed, R. B., September 1987.
UCB/EERC-87/12 "Inelastic Response of Structures With Mass And/Or Stiffness Eccentricities In Plan Subjected toEarthquake Excitation." by Bruneau, M., September 1987.
UCB/EERC-87/13 "CSTRUCT: An Interactive Computer Environment For the Design and Analysis of EarthquakeResistant Steel Structures." by Austin, M.A., Mahin. S.A. and Pister, K.S., September 1987.
UCB/EERC·87/14 "Experimental Study of Reinforced Concrete Columns Subjected to Multi-Axial Loading." by Low,S.S. and Moehle, J.P., September 1987.
124