Analysis of Reinforced Concrete Columns Subjected to Combined Axial, Flexure, Shear, and Torsional Loads T. R. S. Mullapudi, A.M.ASCE 1 ; and Ashraf Ayoub, M.ASCE 2 Abstract: This paper describes the implementation of a three-dimensional (3D) concrete constitutive model for fiber-based analysis of RC members subjected to combined loadings including torsion. The proposed model is formulated to address the interaction between the axial force, bidirectional shear, biaxial bending, and torsion. The shear mechanism along the beam is modeled using a Timoshenko beam approach with 3D frame elements with arbitrary cross-sectional geometry. The model considers the 3D equilibrium, compatibility, and constitutive laws of materials at the section and structural level. The concrete constitutive law follows the softened membrane model with a tangent-stiffness formulation. The emphasis of the paper is on evaluation of the effect of the different stress states on the global and local behavior of the member. The ability of the model to assess the ultimate strength, stiffness, energy dissipation, failure modes under 3D loading is evaluated by correlation of analytical results with experimental tests of RC specimens. DOI: 10.1061/(ASCE)ST.1943-541X.0000680. © 2013 American Society of Civil Engineers. CE Database subject headings: Torsion; Combined stress; Softening; Concrete columns; Finite element method; Nonlinear analysis. Author keywords: Torsion; Combined loading; Softening; Concrete columns; Finite-element analysis; Nonlinear analysis. Introduction RC structures are subjected to combinations of actions and defor- mations, caused by spatially complex earthquake ground motions, features of structural configurations, and the interaction between input and response characteristics. Combined loadings can have significant effects on the force and deformation capacity of RC structures, resulting in unexpected large deformations and extensive damage that in turn influences the performance of structures. In particular, com- bined bending and torsional effect is observed in structures such as skewed and horizontally curved bridges, bridges with unequal spans or column heights, spandrel beams, and bridges with outrigger beams. The analytical modeling of the behavior of structures under bending, shear, and axial force interaction has received considerable attention in recent years. There is, however, a lack of published research into the combined behavior of three-dimensional (3D) concrete structures. The first tests on combined shear, bending, and torsion were reported by Nylander (1945). Using only longitudinal steel and disregarding transverse steel, the author found that the bending moment reduced the torsional strength. Lessig (1959) derived two possible failure modes and suggested equations for the torsional strength of the beams. Later, most of the experimental work that concentrated on combined loadings focused on the failure modes and the derivation of equations to define a 3D interaction surface (Yudin 1962; Gesund and Boston 1964). Elfgren et al. (1974) de- rived shear, bending, and torsion interaction from the skew bending theory; later Ewida and McMullen (1982) found that the skew bending theory’s predictions agreed fairly well with the available results. Mansur and Paramasivam (1984) tested 10 beams with small circular openings in bending and torsion and found that the torsional strength and stiffness decreased as the opening size increased. For a small amount of bending moment, there is an increase in the torsional capacity of the member; but for a substantial amount of bending, the ultimate torque decreases with the increase of bending. Rahal and Collins (1995b) studied the effect of the thickness of concrete cover on the behavior of RC sections subjected to combined shear and torsion and found that the increase in thickness of the concrete cover increases the strength of sections, increases the crack spacing, and induces lateral curvatures. Rahal and Collins (1995a, 2003a) developed a 3D truss model to analyze members subjected to combined loading with the help of the modified compression field theory. This model follows the curvature and checks the spalling of the concrete cover subjected to combined shear and torsional loads. Rahal and Collins (2003b) evaluated the ACI318–02 (2002) and AASHTO-load and resistance factor design (LRFD) (2000) provisions under combined shear and torsional loads. ACI provisions give very conservative results, with the recommended 45° angle between the compression diagonals and the longitudinal axis of the member. If a lower limit of 30° angle is used for some cases, unconservative results might be possible. Tirasit et al. (2005) investigated the performance of 10 RC columns under cyclically applied bending and torsional loadings with and without the effect of a constant axial compression force. Axial compression increases the torsional strength and angle of cracks but its effect decreases as the rotation increases. The plastic hinge zone changes with the change of angle of twist to drift ratio; as the torsion increases, the flexural capacity and drift of the column is reduced. On the other hand, with the increase of bending moment, tor- sional resistance, and angle of twist reduces significantly. Tirasit and Kawashima (2008) studied the effect of seismic torsion on the per- formance of a skewed bridge and developed the nonlinear torsional 1 Senior Staff Engineer, MMI Engineering, 11490 Westheimer Rd., Suite 150, Houston, TX 77077; formerly, Graduate Student, Dept. of Civil and Environmental Engineering, Univ. of Houston, Houston, TX 77204. 2 Professor of Civil Engineering, City Univ. London, London EC1V OHB, United Kingdom; formerly, Associate Professor, Dept. of Civil and Environmental Engineering., Univ. of Houston, Houston, TX 77204 (cor- responding author). E-mail: [email protected] Note. This manuscript was submitted on January 10, 2012; approved on July 20, 2012; published online on August 11, 2012. Discussion period open until September 1, 2013; separate discussions must be submitted for individual papers. This paper is part of the Journal of Structural Engineering, Vol. 139, No. 4, April 1, 2013. ©ASCE, ISSN 0733-9445/ 2013/4-561–573/$25.00. JOURNAL OF STRUCTURAL ENGINEERING © ASCE / APRIL 2013 / 561 J. Struct. Eng. 2013.139:561-573. Downloaded from ascelibrary.org by UNIVERSITY OF HOUSTON on 04/08/13. Copyright ASCE. For personal use only; all rights reserved.

Welcome message from author
This document is posted to help you gain knowledge. Please leave a comment to let me know what you think about it! Share it to your friends and learn new things together.
Transcript

Analysis of Reinforced Concrete Columns Subjected toCombined Axial, Flexure, Shear, and Torsional Loads
T. R. S. Mullapudi, A.M.ASCE1; and Ashraf Ayoub, M.ASCE2
Abstract: This paper describes the implementation of a three-dimensional (3D) concrete constitutive model for fiber-based analysis of RCmembers subjected to combined loadings including torsion. The proposed model is formulated to address the interaction between the axialforce, bidirectional shear, biaxial bending, and torsion. The shear mechanism along the beam is modeled using a Timoshenko beam approachwith 3D frame elements with arbitrary cross-sectional geometry. The model considers the 3D equilibrium, compatibility, and constitutive lawsof materials at the section and structural level. The concrete constitutive law follows the softened membrane model with a tangent-stiffnessformulation. The emphasis of the paper is on evaluation of the effect of the different stress states on the global and local behavior of themember.The ability of the model to assess the ultimate strength, stiffness, energy dissipation, failure modes under 3D loading is evaluated by correlationof analytical results with experimental tests of RC specimens. DOI: 10.1061/(ASCE)ST.1943-541X.0000680. © 2013 American Society ofCivil Engineers.
CE Database subject headings: Torsion; Combined stress; Softening; Concrete columns; Finite element method; Nonlinear analysis.
Author keywords: Torsion; Combined loading; Softening; Concrete columns; Finite-element analysis; Nonlinear analysis.
Introduction
RC structures are subjected to combinations of actions and defor-mations, caused by spatially complex earthquake ground motions,features of structural configurations, and the interaction between inputand response characteristics. Combined loadings can have significanteffects on the force and deformation capacity of RC structures,resulting in unexpected large deformations and extensive damage thatin turn influences the performance of structures. In particular, com-bined bending and torsional effect is observed in structures such asskewed and horizontally curved bridges, bridges with unequal spansor columnheights, spandrel beams, and bridgeswith outrigger beams.The analytical modeling of the behavior of structures under bending,shear, and axial force interaction has received considerable attentionin recent years. There is, however, a lack of published research into thecombined behavior of three-dimensional (3D) concrete structures.
The first tests on combined shear, bending, and torsion werereported by Nylander (1945). Using only longitudinal steel anddisregarding transverse steel, the author found that the bendingmoment reduced the torsional strength. Lessig (1959) derived twopossible failure modes and suggested equations for the torsionalstrength of the beams. Later, most of the experimental work thatconcentrated on combined loadings focused on the failure modesand the derivation of equations to define a 3D interaction surface
(Yudin 1962; Gesund and Boston 1964). Elfgren et al. (1974) de-rived shear, bending, and torsion interaction from the skew bendingtheory; later Ewida and McMullen (1982) found that the skewbending theory’s predictions agreed fairly well with the availableresults.Mansur and Paramasivam (1984) tested 10 beamswith smallcircular openings in bending and torsion and found that the torsionalstrength and stiffness decreased as the opening size increased. Fora small amount of bending moment, there is an increase in thetorsional capacity of the member; but for a substantial amount ofbending, the ultimate torque decreases with the increase of bending.
Rahal and Collins (1995b) studied the effect of the thickness ofconcrete cover on the behavior ofRC sections subjected to combinedshear and torsion and found that the increase in thickness of theconcrete cover increases the strength of sections, increases the crackspacing, and induces lateral curvatures.
Rahal and Collins (1995a, 2003a) developed a 3D truss modelto analyze members subjected to combined loading with the helpof the modified compression field theory. This model follows thecurvature and checks the spalling of the concrete cover subjectedto combined shear and torsional loads. Rahal and Collins (2003b)evaluated the ACI318–02 (2002) and AASHTO-load and resistancefactor design (LRFD) (2000) provisions under combined shear andtorsional loads. ACI provisions give very conservative results, withthe recommended 45� angle between the compression diagonalsand the longitudinal axis of the member. If a lower limit of 30� angleis used for some cases, unconservative results might be possible.Tirasit et al. (2005) investigated the performance of 10 RC columnsunder cyclically applied bending and torsional loadings with andwithout the effect of a constant axial compression force. Axialcompression increases the torsional strength and angle of cracks butits effect decreases as the rotation increases. The plastic hinge zonechanges with the change of angle of twist to drift ratio; as the torsionincreases, the flexural capacity and drift of the column is reduced.
On the other hand, with the increase of bending moment, tor-sional resistance, and angle of twist reduces significantly. Tirasit andKawashima (2008) studied the effect of seismic torsion on the per-formance of a skewed bridge and developed the nonlinear torsional
1Senior Staff Engineer,MMI Engineering, 11490Westheimer Rd., Suite150, Houston, TX 77077; formerly, Graduate Student, Dept. of Civil andEnvironmental Engineering, Univ. of Houston, Houston, TX 77204.
2Professor of Civil Engineering, City Univ. London, London EC1VOHB, United Kingdom; formerly, Associate Professor, Dept. of Civil andEnvironmental Engineering., Univ. of Houston, Houston, TX 77204 (cor-responding author). E-mail: [email protected]
Note. This manuscript was submitted on January 10, 2012; approvedon July 20, 2012; published online on August 11, 2012. Discussion periodopen until September 1, 2013; separate discussions must be submittedfor individual papers. This paper is part of the Journal of StructuralEngineering, Vol. 139, No. 4, April 1, 2013. ©ASCE, ISSN 0733-9445/2013/4-561–573/$25.00.
JOURNAL OF STRUCTURAL ENGINEERING © ASCE / APRIL 2013 / 561
J. Struct. Eng. 2013.139:561-573.
Dow
nloa
ded
from
asc
elib
rary
.org
by
UN
IVE
RSI
TY
OF
HO
UST
ON
on
04/0
8/13
. Cop
yrig
ht A
SCE
. For
per
sona
l use
onl
y; a
ll ri
ghts
res
erve
d.

hysteretic model. It was found that the torsional strength reduces thecombination of flexure and eccentric impact force from the lack ofbearing movement that induces higher torsion in bridge piers.Prakash et al. (2010) tested circular RC columns under cyclicbending and shear, cyclic pure torsion, and various levels ofcombined cyclic bending, shear, and torsional loads with aspectratios of 3 and 6. It was found that shear capacity increases with thereduction of the aspect ratio. The displacement at ultimate shearand rotation at ultimate torque also decreased significantly undercombined loading.
The establishment of nonlinear constitutive models for RC ele-ments under combined loading and the development of correspondingnonlinear finite-element models are essential to predicting the correctbehavior of RC structures. Over the past three decades, new consti-tutive models were developed in an effort to improve the generalperformance of the structures and elements. In these models, theequilibrium equations assume the stresses in the concrete struts andsteel bars to be smeared. Similarly, the strains of steel and concreteare also smeared, and are obtained by averaging the strains alonga steel bar that crosses several cracks. The constitutive laws of con-crete and steel bars were developed through large-scale panel testing,and relate the smeared stresses to the smeared strains of the element(Belarbi and Hsu 1994, 1995; Hsu and Zhang 1996). The first workto develop such constitutive laws is the one by Vecchio and Collins(1981), who proposed the compression field theory to predict thenonlinear behavior of cracked RC membrane elements. The com-pression field theory, however, is unable to take into account thetension stiffening effect of the concrete.
The researchers later improved their model and developed themodified compression field theory (Vecchio and Collins 1986), inwhich the tension stiffening of concrete is accounted for by imposinga concrete tensile stress across the shear crack. Belarbi and Hsu(1994, 1995) and Pang andHsu (1995) used a different approach anddeveloped the rotating-angle softened-trussmodel. In thismodel, thetension stiffening effect of concrete was taken into account by as-suming a shear stress along the crack direction. Later, the researchersimproved their work and developed the fixed-angle softened-trussmodel (Pang and Hsu 1996; Hsu and Zhang 1997; and Zhang andHsu 1998), which is capable of predicting the concrete contributionto shear resistance by assuming the cracks to be oriented at a fixedangle. Zhu et al. (2001) derived a rational shear modulus and de-veloped a simple solution algorithm for the fixed-angle softened-truss model.
The work was further extended by developing the Hsu/ZhuPoisson ratios (Zhu and Hsu 2002), which led to the developmentof the softened membrane model (SMM), which can accuratelypredict the entire response of the specimen, including both the pre-and postpeak responses. Recently, Jeng and Hsu (2009) developedthe softened membrane model for torsion, which takes into accountthe strain gradient of concrete struts in the shear flow zone with twosignificant modifications: (1) First, in the tensile stress-stain re-lationship of concrete, the initial elastic modulus and strain at peakstress are increased by 45%; and (2) the Hsu/Zhu ratio of torsion istaken as 80% of the Hsu/Zhu ratio for bending-shear (Zhu and Hsu2002).
Vecchio and Selby (1991) developed a finite-element programfor 3D analysis of concrete structures with an eight-node regularhexahedral element. In their constitutive material model, they usedthe modified compression field theory. Gregori et al. (2007) ana-lyzed the section of a concrete column subjected to biaxial bending,bidirectional shear, and torsion by subdividing it into several regionsthat are subjected to states of uniaxial, biaxial, or triaxial state ofstress. The regions subjected to a triaxial state of stress were an-alyzed following the approach of Vecchio and Selby (1991).
In this research, a generalized 3D frame element adopting thesoftened membrane model is implemented. The model is based ona Timoshenko-type force formulation. Each element is divided intoseveral sections along the length and into several fibers across thecross section. Coupling between torsion and axial, flexural, andshear behavior is accounted for through satisfaction of the equilib-rium and compatibility conditions along the three dimensions.This was performed by developing a new algorithm that correctlyevaluates the longitudinal and transverse reinforcement strainscompatible with the 3D cracked concrete behavior. Our study ac-complishes three main tasks:1. It formulates a force-based frame element to simulate the
combined 3D loading effect on concretememberswith reason-able computational efficiency;
2. It expands the use of the SMM constitutive model for analysisof RC members under triaxial states of stresses; and
3. It validates the new finite-element model by comparing itspredictions with the experimental results of RC columns.
The element was added to the library of the FORTRAN-basedfinite-element analysis program FEAPpv, developed by Taylor(2005). To implement the 3D model into FEAPpv, a Timoshenkobeam element with triaxial constitutive relations is added to theexisting library of FEAPpv as presented in Fig. 1. A detailed deri-vation of the element formulation is presented in the next sections.
Finite-Element Formulation
The 3D response is described by defining six degrees of freedom ateach section of the element, which consists of three translationsu0,v0, andw0 and three rotations ux, uy, and uzwith the correspondingforces N, V , andW and three moments T ,My, andMz, respectively.The general 3D beam element with rigid body modes is shown inFig. 2(a), and that without rigid body modes is shown in Fig. 2(b).Each element is further divided into a number of sections that aresubdivided into fibers. Section deformations and forces are shownin Figs. 3(a and b).
The main strains and corresponding stresses acting at any sectioncan be grouped in vector forms as
fɛg ¼ �ɛx gxy gxz
�Tfsg ¼ �
sx txy txz�T ð1Þ
Fig. 1. Implementation of 3D model into the software FEAPpv
562 / JOURNAL OF STRUCTURAL ENGINEERING © ASCE / APRIL 2013
J. Struct. Eng. 2013.139:561-573.
Dow
nloa
ded
from
asc
elib
rary
.org
by
UN
IVE
RSI
TY
OF
HO
UST
ON
on
04/0
8/13
. Cop
yrig
ht A
SCE
. For
per
sona
l use
onl
y; a
ll ri
ghts
res
erve
d.

where ɛx 5 normal strain and gxy and gxz 5 shear strains. Theremaining strain vectors ɛy, ɛz, and gyz are determined by enforcingequilibrium between the concrete and reinforcement, as will bedescribed later.
The section deformations at the origin of the section, in matrixform, can be written as
fsg ¼ �ɛ0 xy xz xx gxy0 gxz0
�T¼�∂u0∂x
∂uy∂x
2∂uz∂x
∂ux∂x
∂v0∂x
2 uz∂w0
∂xþ uy
�T
ð2Þ
where ɛ0 5 longitudinal strain at the section centroid; xy and xz 5curvatures about the y- and x-coordinate system; xx 5 angle of twistper unit length; and gxy0 and gxz0 5 generalized shear strains.
The strain vector at any fiber, ɛ, is related to the sectional strains as
fɛg ¼ �ɛx gxy gxz
�T ¼ ½T �fsg ð3Þ
where
½T � ¼24 1 z y 0 0 0
0 0 0 2z 1 0
0 0 0 y 0 1
35 ð4Þ
In our model, a force-based formulation (Spacone et al. 1996) isadopted. The force-based approach has superior numerical capa-bilities compared to standard displacement formulations. Further-more, the latter suffers from locking if shear deformations areaccounted for. By using the force interpolation function bðxÞ, thesection forces sðxÞ at a section x are related to the element endforces P by
SðxÞ ¼ bðxÞP ð5Þ
where
bðxÞ ¼
266666666666666664
1 0 0 0 0 0
0 0 xL2 1 x
L0 0
0 0 0 0 xL2 1 x
L0 1 0 0 0 0
0 0 0 0 21L
21L
0 0 21L
21L
0 0
377777777777777775
ð6Þ
To implement the force-based model in a finite-element programbased on displacement degrees of freedom, the following equationneeds to be solved for incrementally:
KelementDd ¼ DR ð7Þ
Here, the element stiffnessmatrixK5F21
and the resisting loadincrement is DR5DP1F21ru, where
F ¼ðL0
bTðxÞf ðxÞbðxÞ dx
is the element flexibility matrix, and
ru ¼ðL0
bTðxÞrdðxÞ dx
is the section residual deformation vector. The process of the statedetermination of force-based elements requires an internal elementiteration in addition to the Newton-Raphson global iteration; it isfurther described by Spacone et al. (1996) and Neuenhofer andFilippou (1997).
Section behavior, as stated earlier, is evaluated through fiberdiscretization with the appropriate material constitutive models. Thematerial constitutive models are described next.
Concrete Constitutive Model
There exist six stresses fs3Dg and corresponding strains fɛ3Dgacting on any concrete fiber; however, our formulation considersonly three stress fsg and strain fɛg components, while the otherthree stress and strain components are derived by considering theequilibrium conditions. The different stress and strain vectors aredefined as
fs3Dg ¼ �sx sy sz txy tyz txz
�T ,fɛ3Dg5 f ɛx ɛy ɛz gxy gyz gxz gT
ð8Þ
Fig. 2. Displacements and forces (a) with rigid body modes and (b) without rigid body modes
Fig. 3. (a) Section displacements; (b) section forces
JOURNAL OF STRUCTURAL ENGINEERING © ASCE / APRIL 2013 / 563
J. Struct. Eng. 2013.139:561-573.
Dow
nloa
ded
from
asc
elib
rary
.org
by
UN
IVE
RSI
TY
OF
HO
UST
ON
on
04/0
8/13
. Cop
yrig
ht A
SCE
. For
per
sona
l use
onl
y; a
ll ri
ghts
res
erve
d.

fsg ¼ ½sx txy txz �T , fɛg ¼ ½ ɛx ɛy gxz �T ð9Þ
fsUNg ¼ ½sy sz tyz �T , fɛUNg ¼ �ɛy ɛz gyz
�Tð10Þ
Theunknownstress componentssUN should equal zero to satisfy theinternal equilibrium between the reinforcing steel and concrete,which will result in evaluation of the corresponding three unknownstrain values ɛUN . Because the constrained condition is nonlinear,determination of the corresponding strains requires an iterativesolution.
The proposed model extends the two-dimensional (2D) SMM todescribe the material response of 3D regions. The modified consti-tutive relations follow a 3D stress space formulation and differ fromthose originally proposed in 2D formulations (Mullapudi 2010;Mullapudi and Ayoub 2010).
Concrete strains ɛ3D are used to calculate the principal strains, orEigenvalues, and principal strain directions, or Eigenvectors, withthe help of the Jacobi method.
Eigenvectors, or direction cosines, are derived from the appliedstresses s3D, which are represented with ½a1�, as
½a1� ¼24 l1 l2 l3m1 m2 m3
n1 n2 n3
35 ð11Þ
The calculated principal strains ɛ1, ɛ2, and ɛ3 are sorted in sucha way that ɛ1 . ɛ2 . ɛ3, and the corresponding stresses sc
1, sc2, and
sc3 are calculated using the biaxial constitutive relations, which will
be explained in later sections.The rotation matrix needed to rotate the stress and strain vectors
from the global xeyez system to the applied principal stress di-rection system 1–2–3 with an angle of ½a1� is
½Rða1Þ� ¼
2666666664
l21 m21 n21 l1m1 m1n1 n1l1
l22 m22 n22 l2m2 m2n2 n2l2
l23 m23 n23 l3m3 m3n3 n3l3
2l1l2 2m1m2 2n1n2 l1m2 þ l2m1 m1n2 þ m2n1 n1l2 þ n2l12l2l3 2m2m3 2n2n3 l2m3 þ l3m2 m2n3 þ m3n2 n2l3 þ n3l22l3l1 2m3m1 2n3n1 l3m1 þ l1m3 m3n1 þ m1n3 n3l1 þ n1l3
3777777775
ð12Þ
In a fiber-based element formulation, the process of the statedetermination at the fiber level requires the calculation of thefiber stresses ½sx sy sz txy tyz txz �T from the strain state½ ɛx ɛy ɛz gxy gyz gxz �T . Because the SMM has been implementedin a Timoshenko-type beamelement, the values of ɛx,gxy, andgxz aretypically known, while the lateral strains ɛy and ɛz values must beevaluated from the equilibrium conditions.
Evaluation of Lateral Strain
The equilibrium equations needed to evaluate the stresses in thexeyez coordinate system ½sx sy sz txy tyz txz �T as a function ofthe principal stresses resisted by concrete ½sc
x scy sc
z tcxy t
cyz t
cxz�T
and reinforcing bar stresses fsx, fsy, and fsz along the x, y, and zdirections, respectively, are
�sx sy sz txy tyz txz
�T¼ ½Rða1Þ�21fsc
1 sc2 sc
3 tc12 tc23 tc13 gT
þ �rsxfsx rsyfsy rszfsz 0 0 0
�T ð13Þ
where fsc1 sc
2 sc3 tc12 tc23 tc13 gT 5 local concrete stress
vector; ½R�5 the rotation matrix; and ½R�21 5 ½R�T and rsx, rsy, andrsz 5 smeared steel ratio in the direction of x, y, and z, respectively.
Transverse strains are internal variables determined by imposingequilibrium on eachfiber between concrete and steel stirrups. Stirrupstrains are not known in advance, and because of the nonlinear be-havior of the concrete and steel materials, an iterative procedure isneeded to satisfy the equilibrium in the y- and z-directions, follow-ing the flowchart in Fig. 4.
The second of the equilibrium equations in Eq. (13) is used toevaluate the lateral strain ɛy in fiber i. Taking into consideration thatthe value of sy equals zero,
sc,i1 m2
1 þ sc,i2 m2
2 þ sc,i3 m2
3 þ tc,i122m1m2 þ tc,i232m2m3
þ tc,i312m1m3 þ risy fisy ¼ 0 ð14Þ
Eq. (14) can also be written as
sicy A
icy þ si
sy Aisy ¼ 0 ð15Þ
The third equilibrium equation in Eq. (13) is used to evaluate thelateral strain ɛz in fiber i. Taking into consideration that the value ofsz equals zero,
sc,i1 n21 þ sc,i
2 n22 þ sc,i3 n23 þ tc,i122n1n2 þ tc,i232n2n3
þ tc,i312n3n1 þ risz fisz ¼ 0 ð16Þ
Eq. (16) can also be written as
siczA
icz þ si
szAisz ¼ 0 ð17Þ
Here, sicy and si
cz 5 concrete stresses in the transverse y- and z-directions of fiber i, respectively; si
sy and sisz 5 steel stresses in the
transverse y- and z-directions of fiber i, respectively; Aicy and Ai
cz 5area of concrete in y- and z-directions within the spacing S,respectively (see Fig. 5); Ai
sy and Aisz 5 steel reinforcement, cross-
sectional areas in y- and z-directions within the spacing S, re-spectively; risy, r
isz 5 ratios of steel to concrete area in the y and z
directions of fiber i, respectively; and f isy, fisz 5 transverse steel bar
stresses that are equal to sisy, and si
sz.
564 / JOURNAL OF STRUCTURAL ENGINEERING © ASCE / APRIL 2013
J. Struct. Eng. 2013.139:561-573.
Dow
nloa
ded
from
asc
elib
rary
.org
by
UN
IVE
RSI
TY
OF
HO
UST
ON
on
04/0
8/13
. Cop
yrig
ht A
SCE
. For
per
sona
l use
onl
y; a
ll ri
ghts
res
erve
d.

An iterative procedure is needed to determine the lateral strain ɛyand ɛz that will also satisfy the equations demonstrated in Fig. 4because of the nonlinear behavior of the concrete and steel. Aninitial value for ɛy and ɛz is assumed at each fiber, and the iterationsproceed until Eqs. (14) and (16) are internally satisfied.
Strains in Circular Sections
Circular cross sections are typically divided into a number of sec-tors along the circumferential direction (see Fig. 6).
Uniaxial stress-strain relationships of circular hoops are notavailable in an xeyez coordinate system. Because of this difficulty,they are determined along the tangential direction of the stirrupx0ey0ez0 coordinate system and then later converted to the xeyezcoordinate system. In each section, the x0ey0ez0 coordinate systemis derived by choosing the angle u0such that the z0 axis is perpen-dicular to the transverse reinforcement alignment. The strain valuein the xeyez coordinate system is converted to the x0ey0ez0 co-ordinate system with the help of the transformation matrix A:
½A� ¼24 1 0 0
0 cos u0 2sin u0
0 sin u0 cos u0
35 ð18Þ
Accordingly, the strain perpendicular to the transverse rein-forcement cross section ɛ0y is calculated as
ɛ0y ¼ ɛycos2ðu0Þ2 gyzsinð2u0Þ þ ɛzsin2ðu0Þ ð19Þ
Having obtained the uniaxial stress and stiffness values in thex0ey0ez0 coordinate system, these values are converted to the xeyezcoordinate system to satisfy equilibrium. The transverse steel re-inforcement stress in the y direction becomes fsy 5 f 0ycos
2ðu0Þ; thetransverse steel reinforcement stress in the z-direction becomesfsz 5 f 0ysin
2ðu0Þ; and the shear stress contribution of the steel isneglected.
With similar transformations, the transverse steel reinforcementstiffness in the y direction becomes Esy 5D0
ycos2ðu0Þ; the trans-
verse steel reinforcement stiffness in the z-direction becomesEsz 5D0
ysin2ðu0Þ; and the shear stiffness contribution of the steel
is neglected.
Evaluation of Concrete Stress
The typical concrete stress-strain curves are derived from uniaxialtests, so the biaxial strains in the xeyez direction ½ ɛx ɛy ɛz gxy
gyz gxz�T need to be converted to equivalent uniaxial strains in the1–2–3 direction ½ ɛ1 ɛ2 ɛ3 g12 g23 g13 �T to calculate the concretestresses.
The biaxial principal strains are then evaluated as
Fig. 4. Iterative procedure to find required 3D strains
Fig. 5. 3D fiber element formulation
Fig. 6. Circular cross section transformation
JOURNAL OF STRUCTURAL ENGINEERING © ASCE / APRIL 2013 / 565
J. Struct. Eng. 2013.139:561-573.
Dow
nloa
ded
from
asc
elib
rary
.org
by
UN
IVE
RSI
TY
OF
HO
UST
ON
on
04/0
8/13
. Cop
yrig
ht A
SCE
. For
per
sona
l use
onl
y; a
ll ri
ghts
res
erve
d.

f ɛ1 ɛ2 ɛ3 g12 g23 g13 gT
¼ ½Rða1Þ��ɛx ɛy ɛz gxy gyz gxz
�T ð20Þ
Biaxial principal strains are needed to evaluate the equivalentuniaxial strains. The equivalent uniaxial strains are derived from thebiaxial strains with the help of the suggested Poisson’s Ratioof cracked concrete for SMM, also called the Hsu/Zhu ratiosfm12 m21 m23 m32 m13 m31gT (Zhu and Hsu 2002). From therange of j5 1e3 and k5 1e3, mjk 5 ratio of the resulting tensilestrain increment in the principal j direction to the source com-pressive strain increment in the principal k direction; mkj 5 ratio ofthe resulting compressive strain increment in the principal k di-rection to the tensile source strain increment in the principalj direction. The following equations were suggested by Jeng andHsu (2009) based on comparisons of test data:
mjk ¼ 0:16 þ 680ɛsf , ɛsf # ɛyd ð21Þ
mjk ¼ 1:52, ɛsf . ɛyd ð22Þ
mkj ¼ 0 ð23Þ
where ɛsf 5 strain in the reinforcement that yields first, and ɛyd 5yield strain of reinforcing steel.
After cracking, the Hsu/Zhu ratio mjk lies outside the typicalrange of 0–0.5 for Poisson’s ratio of continuous materials; beforecracking, the Hsu/Zhu ratio is mkj 5 0:2, and after cracking the Hsu/Zhu ratio is mkj 5 0, indicating the tensile strain has no effect on thecompressive strain.
The equivalent uniaxial strains are derived from the biaxialprincipal strains withHsu/Zhu ratios fm12 m21 m23 m32 m13 m31gTas
�ɛ1 ɛ2 ɛ3
�T ¼ ½m�f ɛ1 ɛ2 ɛ3 gT ð24Þ
where
½m� ¼24 1 2m12 2m13
2m21 1 2m23
2m31 2m32 1
3521
ð25Þ
The equivalent uniaxial strain in the longitudinal reinforcementalong the x direction with the effect of Hsu/Zhu ratio is given by
ɛsx ¼ ɛ1l21 þ ɛ2l22 þ ɛ3l23 þ g122l1l2 þ g232l2l3 þ g132l1l3
ð26Þ
The equivalent uniaxial strain in the transverse reinforcement alongthe y direction with the effect of Hsu/Zhu ratio is given by
ɛsy ¼ ɛ1m21 þ ɛ2m2
2 þ ɛ3m23 þ g122m1m2 þ g232m2m3
þ g132m1m3 ð27Þ
The equivalent uniaxial strain in the transverse reinforcement alongthe z-direction with the effect of Hsu/Zhu ratio is given by
ɛsz ¼ ɛ1n21 þ ɛ2n22 þ ɛ3n23 þ g122n1n2 þ g232n2n3
þ g132n1n3 ð28Þ
The equivalent uniaxial longitudinal steel stress fsx, transverse steelstresses fsy, and fsz are calculated from the equivalent uniaxialsteel reinforcement strains ɛsx, ɛsy, and ɛsz through a smeared stress-strain relationships of mild steel bars embedded in concrete andsubjected to uniaxial strains (Belarbi and Hsu 1994, 1995).
The current equivalent uniaxial strains ɛ1, ɛ2, and ɛ3 are in-dividually used to calculate the concrete stressessc
1,sc2, ands
c3 in the
principal direction of the uniaxial concrete material stress-strainrelationship.
The concrete uniaxial model describes the cyclic uniaxial con-stitutive relationships of cracked concrete in compression and ten-sion and follows the modified Kent and Park model (Park et al.1982). The smeared stress-strain relationships of mild steel barsembedded in concrete and subjected to uniaxial strains developed byBelarbi andHsu (1994, 1995) was used in the analysis. Steel stressesare averaged along the steel bar traversing several cracks and theresulting smeared steel stress at first yield is reduced compared withthe local yield stress of a bare bar at the cracks.
Concrete Triaxial Constitutive Relations
The constitutive equations depend on the strain state and the regionof the cross section. The principal strains ɛ1, ɛ2, and ɛ3 are foundfrom the global strains using the Jacobi method, and the equivalentuniaxial strains ɛ1, ɛ2, and ɛ3 are derived based on the Hsu/Zhuratio (Jeng and Hsu 2009). The local concrete material stiffness isderived based on Young’s modulus and the Hsu/Zhu ratio. Theglobal stiffness in Cartesian direction is calculated by transformingthe local stiffness to the global direction. The global stiffness in y-, z-,and yz-directions are condensed in the element formulation and,during this process, the stresses in axial, flexure, and shear directionsbecomes coupled.
The values of the concrete uniaxial strains in principal directions1, 2, and 3 have eight conditions, and the strength in one direction isaffected by the strain state in the other directions following theprocedure proposed by Vecchio and Selby (1991). The uniaxialstrains are sorted in ascending order such that ɛ1 . ɛ2 . ɛ3. Thevalues of concrete compressive strength sc
1 in Direction 1 andconcrete compressive strength sc
3 in Direction 3 are derived asdescribed in the following, while the concrete compressive strengthsc2 in Direction 2 can be found in a similar way by applying the
corresponding relations between the 1- and 2-directions.For the case in which the equivalent uniaxial strain of concrete ɛ1
in principal Direction 1 is in tension, and the equivalent uniaxialstrain ɛ3 in principal Direction 3 is in compression, the uniaxialconcrete stress sc
1 in Direction 1 is calculated from ɛ1 and is nota function of the perpendicular concrete strain ɛ3. The compressivestrength in principal Direction 3, however, sc
3 will soften becauseof the tension in the orthogonal direction. Jeng and Hsu (2009)derived a softening equation in the tension-compression region,which is implemented in our model, and is based on panel testing asproposed by Hsu and Zhu (2002). The equation for the compressivestrength and strain reduction factor z is given by
z ¼ 5:8ffiffiffiffiffiffiffiffiffiffiffiffiffiffiffiffiffif 0cMPa
q # 0:9
1ffiffiffiffiffiffiffiffiffiffiffiffiffiffiffiffiffiffiffiffiffiffi
1 þ 400ɛ1p
!�12
��apr1
��32+
1CA
0B@ ð29Þ
where
apr1 ¼ 0:5tan21
�2g13
ɛ12 ɛ3
ð30Þ
566 / JOURNAL OF STRUCTURAL ENGINEERING © ASCE / APRIL 2013
J. Struct. Eng. 2013.139:561-573.
Dow
nloa
ded
from
asc
elib
rary
.org
by
UN
IVE
RSI
TY
OF
HO
UST
ON
on
04/0
8/13
. Cop
yrig
ht A
SCE
. For
per
sona
l use
onl
y; a
ll ri
ghts
res
erve
d.

The ultimate stress in the orthogonal direction is zf 0c at softenedstrain zɛ0 when z 5 softening coefficient; ap
r1 5 deviation angle indegrees; ɛ1 5 lateral tensile strain; ɛ0 5 concrete strain at peakcompressive strength f 0c ; and zf 0c 5 softened concrete compressivestrength. If the equivalent uniaxial strain of concrete ɛ1 in principalDirection 1 is in compression, and the equivalent uniaxial strain ɛ3in principal Direction 3 is in tension, the same softening equationsapply to the compressive strength in Direction 1.
If the strains ɛ1 and ɛ3 are both in tension, sc1 and sc
3 are func-tions only of the orthogonal concrete strains ɛ1 and ɛ3, respectively.
If the strains ɛ1 and ɛ3 are both in compression, Vecchio’s(1992) simplified version of the biaxial compression strengthequation of Kupfer et al. (1969) is adopted, as described in detailsin Mullapudi and Ayoub (2010).
Fiber State Determination
With the equivalent uniaxial strains, the stiffness values Ec1 , E
c2 , and
Ec3 are determined from a material uniaxial stress-strain diagram.
The material constitutive equation is
�sc123
� ¼ ½Dlo�cfɛ123g ð31Þ
or
�sc1 sc
2 sc3 tc12 tc23 tc13
�T¼ ½Dlo�cf ɛ1 ɛ2 ɛ3 g12 g23 g13 gT ð32Þ
wherefsc123g5 local concrete stress vector; fɛ123g5 local principal
strain vector; ½Dlo�c 5 local uniaxial concrete material secant stiff-ness matrix in the principal direction; and ½Dpr�5 uniaxial concretematerial stiffness matrix in the normal principal directions, whichcan be calculated as
�Dpr� ¼
24 1 2m12 2m13
2m21 1 2m23
2m31 2m32 1
35212664Ec1 0 0
0 Ec2 0
0 0 Ec3
3775 ð33Þ
and
½Dlo�c ¼
2666666666666666664
Dpr1, 1
Dpr1, 2
Dpr1, 3
0 0 0
Dpr2, 1
Dpr2, 2
Dpr2, 3
0 0 0
Dpr3, 1
Dpr3, 2
Dpr3, 3
0 0 0
0 0 0sc12sc
2
ɛ12 ɛ20 0
0 0 0 0sc22sc
3
ɛ22 ɛ30
0 0 0 0 0sc12sc
3
ɛ12 ɛ3
3777777777777777775
ð34Þ
The concrete orthotropic stiffness matrix in the global xeyezdirection ½Dgl�c is evaluated through the rotation matrix R
�Dgl�c¼ ½Rða1Þ�21½Dlo�c½Rða1Þ� ð35Þ
The local uniaxial reinforcement material stiffness matrix in thedirection of reinforcement is given by
�Dgl�sx ¼ rsxEsx,
�Dgl�sy¼ rsyEsy, and
�Dgl�sz ¼ rszEsz
ð36Þ
where ½Dgl�sx 5 longitudinal steel global stiffness matrix; ½Dgl�sy 5transverse steel global stiffness matrix along the y-axis; ½Dgl�sz 5transverse steel global stiffnessmatrix along the z-axis; rsx 5 smearedarea of the longitudinal steel in fiber i; rsy 5 smeared areaof the transverse steel in the y-direction; rsz 5 smeared area ofthe transverse steel in the z-direction; and Esx, Esy, and Esz 5uniaxial steel stiffnesses evaluated from the respective steel modelalong the x-, y-, and z-directions, respectively.
The stiffnessmatrix including concrete and transverse steel termsis evaluated from the concrete stiffness ½Dgl�c, and the transversesteel stiffness ½Dgl�sy, ½Dgl�sz as
�Dgl�c1sy1sz ¼ �
Dgl�cþ �Dgl
�sy þ �Dgl�sz ð37Þ
The total global stiffness matrix is nonsymmetric because the off-diagonal values are affected by the Hsu/Zhu Poisson ratio, whichdepends on the stress state.
Finally, a new process for determination of the sectional andelemental stiffness matrices derived from fiber discretization isproposed in the next section.
Section and Element Stiffness and Force Evaluation
The stress and strain in the global coordinate system are
�scx sy sz txy tyz txz
�T¼ �
Dgl�c1sy1sz� ɛx ɛy ɛz gxy gyz gxz
�T ð38Þ
where the scx 5 longitudinal stress in a concrete fiber; sy and sz 5total transverse fiber stress in the y- and z-directions because of theconcrete and steel; and txy, tyz, and txz 5 total fiber shear stresses.
The proposed fiber beam element follows the plane section hypo-thesis and only have x, xy, and xz degrees of freedom at the sectionlevel. The sectional degree of freedom term corresponding to thetransverse strain in y direction ɛy, transverse strain in z-direction ɛz,
JOURNAL OF STRUCTURAL ENGINEERING © ASCE / APRIL 2013 / 567
J. Struct. Eng. 2013.139:561-573.
Dow
nloa
ded
from
asc
elib
rary
.org
by
UN
IVE
RSI
TY
OF
HO
UST
ON
on
04/0
8/13
. Cop
yrig
ht A
SCE
. For
per
sona
l use
onl
y; a
ll ri
ghts
res
erve
d.
and shear strain gyz and corresponding stiffness and stresses arecondensed out from the section stiffness matrix and load vectorfollowing the procedure described by Mullapudi and Ayoub (2010).
The fiber strains are derived from the section strains as
8<:
ɛxgxygxz
9=; ¼
24 1 z y 0 0 0
0 0 0 2z 1 0
0 0 0 y 0 1
35
�� ɛ0 xy xz xx gxy0 gxz0�T ð39Þ
The transformation matrix to transform the fiber stiffness to thesection stiffness is therefore
½T � ¼24 1 z y 0 0 0
0 0 0 2z 1 0
0 0 0 y 0 1
35 ð40Þ
The contribution of concrete to the section stiffness is
�ðKSectionÞc� ¼ P�½T �T�k11�½T ��Acx ð41Þ
where Acx 5 area of the concrete fiber in the longitudinal direction;and k11 5 condensed section stiffness matrix.
The sectional stiffness from the longitudinal reinforcement is
�ðKSectionÞsx� ¼ P�½T �T�Dgl
�sx½T ��Asx ð42Þ
The sectional forces from the concrete fiber are
�ðFSectionÞc� ¼ P�½T �T�s fiber
�c
�Acx ð43Þ
The sectional forces from the longitudinal steel fiber are
�ðFSectionÞsx� ¼ P24 1 z y 0 0 0
0 0 0 2z 1 0
0 0 0 y 0 1
35T8<:
ssx
0
0
9=;Asx
ð44Þ
The total stiffness of the section is derived from the sum ofconcrete and steel stiffness as
½KSection� ¼ Pnc1ðKSectionÞc þ Pns
1ðKSectionÞsx ð45Þ
where nc and ns5 number of concrete and longitudinal steel fibersin a section, respectively.
The total force of the section is the sum of concrete and steelforces in their respective directions, expressed as
fFSectiong ¼ Pnc1ðFSectionÞc þ Pns
1ðFSectionÞsx ð46Þ
Analysis of Columns Subjected to Combined Loads
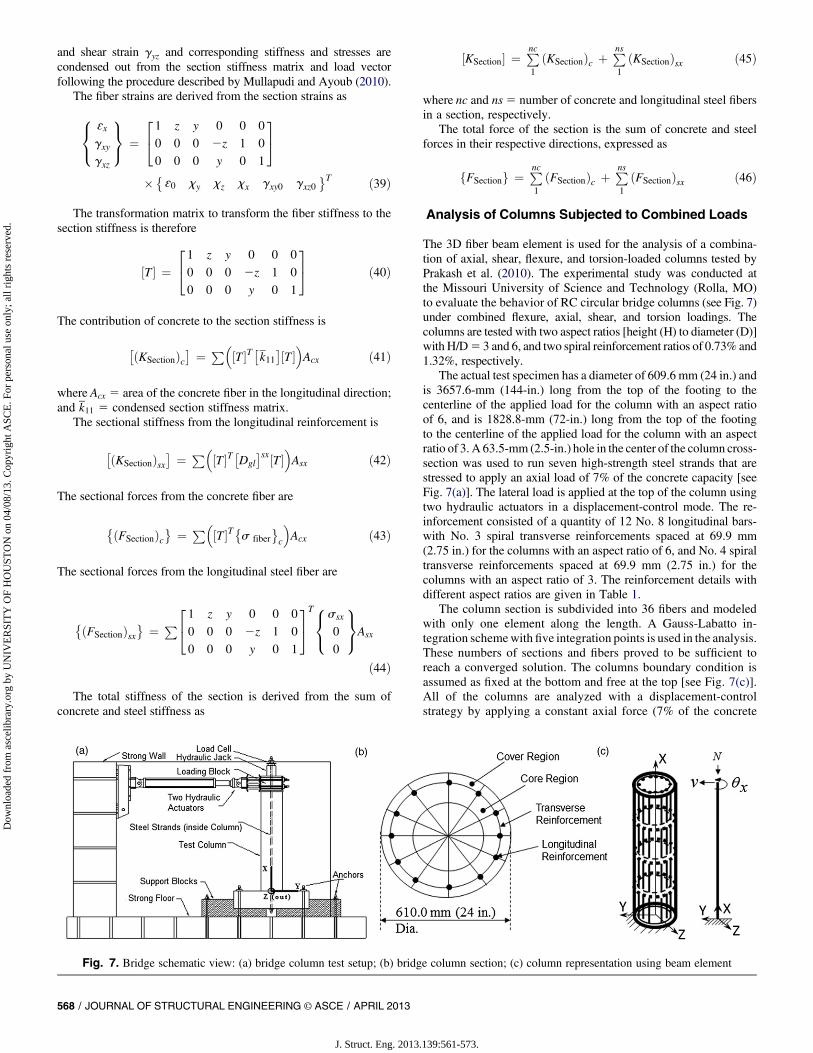
The 3D fiber beam element is used for the analysis of a combina-tion of axial, shear, flexure, and torsion-loaded columns tested byPrakash et al. (2010). The experimental study was conducted atthe Missouri University of Science and Technology (Rolla, MO)to evaluate the behavior of RC circular bridge columns (see Fig. 7)under combined flexure, axial, shear, and torsion loadings. Thecolumns are tested with two aspect ratios [height (H) to diameter (D)]withH/D5 3 and 6, and two spiral reinforcement ratios of 0.73% and1.32%, respectively.
The actual test specimen has a diameter of 609.6 mm (24 in.) andis 3657.6-mm (144-in.) long from the top of the footing to thecenterline of the applied load for the column with an aspect ratioof 6, and is 1828.8-mm (72-in.) long from the top of the footingto the centerline of the applied load for the column with an aspectratio of 3. A 63.5-mm (2.5-in.) hole in the center of the column cross-section was used to run seven high-strength steel strands that arestressed to apply an axial load of 7% of the concrete capacity [seeFig. 7(a)]. The lateral load is applied at the top of the column usingtwo hydraulic actuators in a displacement-control mode. The re-inforcement consisted of a quantity of 12 No. 8 longitudinal bars-with No. 3 spiral transverse reinforcements spaced at 69.9 mm(2.75 in.) for the columns with an aspect ratio of 6, and No. 4 spiraltransverse reinforcements spaced at 69.9 mm (2.75 in.) for thecolumns with an aspect ratio of 3. The reinforcement details withdifferent aspect ratios are given in Table 1.
The column section is subdivided into 36 fibers and modeledwith only one element along the length. A Gauss-Labatto in-tegration schemewith five integration points is used in the analysis.These numbers of sections and fibers proved to be sufficient toreach a converged solution. The columns boundary condition isassumed as fixed at the bottom and free at the top [see Fig. 7(c)].All of the columns are analyzed with a displacement-controlstrategy by applying a constant axial force (7% of the concrete
Fig. 7. Bridge schematic view: (a) bridge column test setup; (b) bridge column section; (c) column representation using beam element
568 / JOURNAL OF STRUCTURAL ENGINEERING © ASCE / APRIL 2013
J. Struct. Eng. 2013.139:561-573.
Dow
nloa
ded
from
asc
elib
rary
.org
by
UN
IVE
RSI
TY
OF
HO
UST
ON
on
04/0
8/13
. Cop
yrig
ht A
SCE
. For
per
sona
l use
onl
y; a
ll ri
ghts
res
erve
d.

capacity) at the top of the column with an appropriate time-variant lateral displacement and twist at the top free-end of thecolumn.
The input data of the model consists of the frame geometry andboundary conditions; external loads or imposed displacements;number of sections and fibers; longitudinal and transverse re-inforcement area; basic material properties (i.e., elastic modulus,yield stress and hardening ratio for steel; compressive strength,strain at compressive strength, postpeak compression slope, andtension stiffening slope for concrete); and time-step increments. Noadditional data are needed.
Column H/D(6)-T/M(0.2) was tested with an applied torsion touniaxial moment (T/M) ratio of 0.2, and an aspect ratio (H/D) of 6.The column’s reinforcement ratio, concrete compressive strength,and peak capacities are given in Table 2. Analysis of the columnwasconducted using the proposed 3D fiber beam-column element undercyclic load (see Fig. 8). Flexural cracks first appeared near thebottom of the column and their angle became more inclined atincreasing heights above the top of the footing. The appearance ofthe cracks increased with an increase in applied loading. The lon-gitudinal bars yielded at about 962.2 mm (38 in.) from the base ofthe column.
The model failed by yielding of the longitudinal and transversereinforcement followed by core degradation. Fig. 8 shows thecomparison of the column performance with a similar columntested under pure uniaxial bending, as well as the analytical resultsusing the proposed model. The analytical load-displacement curvematched well with the experiment. Because of the moderate amountof induced torsion, the bending strength and stiffness were reducedslightly. Fig. 9 shows the longitudinal steel strain history at 432 mm(17 in.) above the foundation. The longitudinal strain increasedwith the increase of the lateral load acting on the column. Theexperimental strain gauge readings matched well with the analyticalresults and the model captured the yielding of the reinforcementrather well.
Another column H/D(6)-T/M(0.4) is analyzed under cyclic loadwith an applied torsion to moment (T/M) ratio of 0.4. The aspectratio H/D of the column is 6. The column’s reinforcement ratio,concrete compressive strength, and peak capacities are given inTable 2. The columnmodel reached the peak shear of 183.8 kN (41.3
kips) at a displacement of 196.0 mm (7.7 in.) (see Fig. 10). Forthis column, both the longitudinal and transverse reinforcementyielded at same time. Because of the higher T/M ratio, damage didnot only occur at the bottom of the column, but also along its entirelength.
The ultimate load and peak displacement values are fairlymatchedwith the experimental results as shown in Fig. 10. There aresome differences between the experimental and analytical resultsspecifically with respect to the unloading stiffness and energydissipation. This is from the fact that the uniaxial concrete model ofPark et al. (1982) assumes a linear unloading stiffness. The analyticalresults of the peak load and corresponding displacement values arecompared with the experimental results in Table 3 for both columnsH/D(6)-T/M(0.2) and H/D(6)-T/M(0.4).
Column H/D(3)-T/M(0.2) with low aspect ratio H/D of 3 isanalyzed with the proposed 3D element. This column was designedto be shear-sensitive, and was tested under monotonic load with anapplied torsion to moment (T/M) ratio of 0.2. The column’s reinforce-ment ratio, concrete compressive strength, and peak capacities are
Table 1. Missouri University of Science and Technology Test: Reinforcement Details for Columns
Material property
Nominal reinforcement size (columns with H/D 5 6) Nominal reinforcement size (columnswith H/D5 3)
#3 (spiral) #4 (spiral)#8 (longitudinalreinforcement) #4 (spiral)
#8 (longitudinalreinforcement)
Modulus ofelasticity
226 GPa(32,780 Ksi)
219 GPa(31,763 Ksi)
206 GPa(29,878 Ksi)
226 GPa(32,780 Ksi)
206 GPa(29,878 Ksi)
Yield stress (0.20%offset method)
525 MPa(76.1 Ksi)
541 MPa(78.5 Ksi)
490 MPa(71.0 Ksi)
525 MPa(76.1 Ksi)
546 MPa(79.1 Ksi)
Peak stress 675 MPa(97.9 Ksi)
693 MPa(100.5 Ksi)
702 MPa(101.8 Ksi)
675 MPa(97.9 Ksi)
702 MPa(100.5 Ksi)
Note: H/D 5 [height (H) to diameter (D)].
Table 2. Column Details and Peak Capacities
Column nameSpiral reinforcement
ratioLongitudinal
reinforcement ratioConcrete compressive
strength (MPa)Peak shearforce (kN)
Peak torsionalmoment (kN×m)
H/D(6)-T/M(0.2) 0.73% 2.10% 41.2 214.0 155.7H/D(6)-T/M(0.4) 0.73% 2.10% 41.2 183.8 204.0H/D(3)-T/M(0.2) 1.32% 2.10% 28.7 448.2 159.1H/D(3)-T/M(0.4) 1.32% 2.10% 26.8 378.0 260.8
Fig. 8. Cyclic load-displacement curve of column H/D(6)-T/M(0.2)
JOURNAL OF STRUCTURAL ENGINEERING © ASCE / APRIL 2013 / 569
J. Struct. Eng. 2013.139:561-573.
Dow
nloa
ded
from
asc
elib
rary
.org
by
UN
IVE
RSI
TY
OF
HO
UST
ON
on
04/0
8/13
. Cop
yrig
ht A
SCE
. For
per
sona
l use
onl
y; a
ll ri
ghts
res
erve
d.
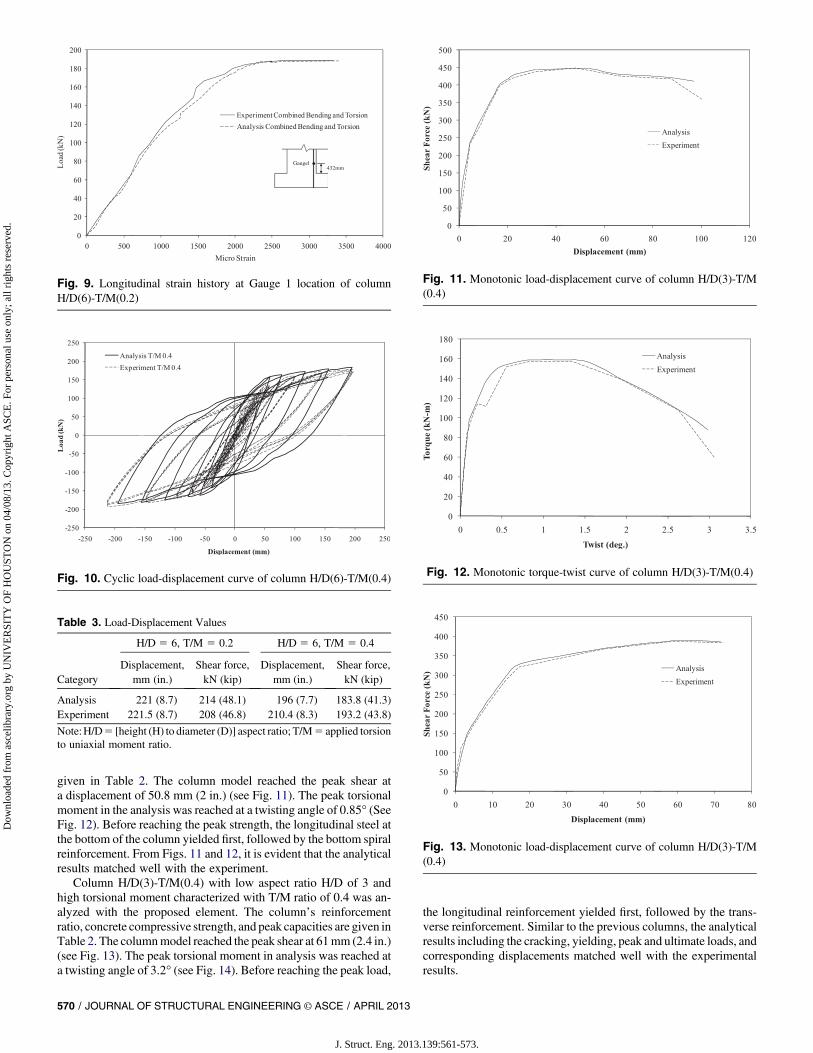
given in Table 2. The column model reached the peak shear ata displacement of 50.8 mm (2 in.) (see Fig. 11). The peak torsionalmoment in the analysis was reached at a twisting angle of 0.85� (SeeFig. 12). Before reaching the peak strength, the longitudinal steel atthe bottom of the column yielded first, followed by the bottom spiralreinforcement. From Figs. 11 and 12, it is evident that the analyticalresults matched well with the experiment.
Column H/D(3)-T/M(0.4) with low aspect ratio H/D of 3 andhigh torsional moment characterized with T/M ratio of 0.4 was an-alyzed with the proposed element. The column’s reinforcementratio, concrete compressive strength, and peak capacities are given inTable 2. The columnmodel reached the peak shear at 61mm (2.4 in.)(see Fig. 13). The peak torsional moment in analysis was reached ata twisting angle of 3.2� (see Fig. 14). Before reaching the peak load,
the longitudinal reinforcement yielded first, followed by the trans-verse reinforcement. Similar to the previous columns, the analyticalresults including the cracking, yielding, peak and ultimate loads, andcorresponding displacements matched well with the experimentalresults.
Fig. 9. Longitudinal strain history at Gauge 1 location of columnH/D(6)-T/M(0.2)
Fig. 10. Cyclic load-displacement curve of column H/D(6)-T/M(0.4)
Table 3. Load-Displacement Values
Category
H/D 5 6, T/M 5 0.2 H/D 5 6, T/M 5 0.4
Displacement,mm (in.)
Shear force,kN (kip)
Displacement,mm (in.)
Shear force,kN (kip)
Analysis 221 (8.7) 214 (48.1) 196 (7.7) 183.8 (41.3)Experiment 221.5 (8.7) 208 (46.8) 210.4 (8.3) 193.2 (43.8)
Note:H/D5 [height (H) to diameter (D)] aspect ratio; T/M5 applied torsionto uniaxial moment ratio.
Fig. 11. Monotonic load-displacement curve of column H/D(3)-T/M(0.4)
Fig. 12. Monotonic torque-twist curve of column H/D(3)-T/M(0.4)
Fig. 13. Monotonic load-displacement curve of column H/D(3)-T/M(0.4)
570 / JOURNAL OF STRUCTURAL ENGINEERING © ASCE / APRIL 2013
J. Struct. Eng. 2013.139:561-573.
Dow
nloa
ded
from
asc
elib
rary
.org
by
UN
IVE
RSI
TY
OF
HO
UST
ON
on
04/0
8/13
. Cop
yrig
ht A
SCE
. For
per
sona
l use
onl
y; a
ll ri
ghts
res
erve
d.

Summary and Conclusions
This work represents a finite-element model for the analysis ofRC structures subjected to combined loading including torsion. Aforce-based Timoshenko-type 3D beam element with SMM con-stitutive model was developed to analyze RC structures with theincorporation of mechanisms of shear deformation and strength.Transverse strains from torsion and shear were evaluated with thedevelopment of an iterative process at the fiber level, and condensedout at the section level. Circular hoop reinforcement stresses andstiffnesses were calculated based upon angular segmentation. Tri-axial constitutive relations based on strain state were developedfor 3D modeling of concrete fibers. The fiber state determination,along with the formulation of stiffness and resisting loads, waspresented.
Correlation studies with available experimental test data wereconducted to investigate the validity of the model. These studiesconfirmed the accuracy of the model in representing both global andlocal parameters as well as the proper failure mode. It was alsoconcluded that the increase of bending moments reduces the tor-sional moment required to cause yielding of the transverse andlongitudinal reinforcement. With the increase of the T/M ratio, thetorsional stiffness degrades rapidly as compared with the flexuralstiffness, and the ultimate twist is reduced. A reduction in aspectratio reduces the displacement and twist at the ultimate resistingload, resulting in a predominantly shear-failure mode.
Acknowledgments
The work presented in this paper was supported by funds fromthe National Science Foundation under Grant No. CMMI-0530737and partially supported by the ASCE O.H. Ammann Research Fel-lowship. This support is gratefully acknowledged. The opinionsexpressed in this paper are those of thewriters and do not necessarilyreflect those of the sponsors.
Notation
The following symbols are used in this paper:½A� 5 transformation
matrix for circularcross section;
Acx 5 area of the concretefiber in x-direction;
Aicy5 area of concrete
between the spacingof the stirrups iny-direction of fiber i;
Aicz5 area of concrete
between the spacingof the stirrups inz-direction of fiber i;
Aisy 5 area of steel
between the spacingof the stirrups iny-direction of fiber i;
Aisz 5 area of steel
between the spacingof the stirrups inz-direction of fiber i;
bðxÞ 5 force interpolationfunction;
½Dgl�c 5 concrete orthotropicstiffness matrix inglobal x-, y-, andz-directions;
½Dgl�c1sy1sz 5 stiffness matrixincluding concreteand transverse steelterms;
½Dgl�sx 5 steel global stiffnessmatrix in x-direction;
½Dgl�sy 5 steel global stiffnessmatrix in y-direction;
½Dgl�sz 5 steel global stiffnessmatrix in z-direction;
½Dlo�c 5 local uniaxialconcrete materialsecant stiffnessmatrix in theprincipaldirection;
½Dpr� 5 uniaxial concretematerial stiffnessmatrix at normal12223 direction;
d 5 element deformation;E
c1 5 concrete uniaxial
stiffness in 1-direction;
Ec2 5 concrete uniaxial
stiffness in 2-direction;
Ec3 5 concrete uniaxial
stiffness in3-direction;
Esx 5 uniaxial steelstiffness alongthe x-axis;
Esy 5 uniaxial steelstiffness alongthe y-axis;
Esz 5 uniaxial steelstiffness alongthe z-axis;
Fig. 14. Monotonic torque-twist curve of column H/D(3)-T/M(0.4)
JOURNAL OF STRUCTURAL ENGINEERING © ASCE / APRIL 2013 / 571
J. Struct. Eng. 2013.139:561-573.
Dow
nloa
ded
from
asc
elib
rary
.org
by
UN
IVE
RSI
TY
OF
HO
UST
ON
on
04/0
8/13
. Cop
yrig
ht A
SCE
. For
per
sona
l use
onl
y; a
ll ri
ghts
res
erve
d.

F 5 element flexibilitymatrix without rigidbody modes;
fFElementg 5 element force vector;fFSectiong 5 total force of the
section;fðFSectionÞcg 5 sectional forces from
the concrete fiber;fðFSectionÞsxg 5 sectional forces from
the longitudinal steelfiber;
f 0c 5 uniaxial concretecompressive strength;
fsx 5 reinforcing bar stressalong x-direction;
fsy 5 reinforcing bar stressalong y-direction;
fsz 5 reinforcing bar stressalong z-direction;
f ðxÞ 5 section flexibility;f 0y 5 stress perpendicular
to the stirrupcross section;
Kc1 5 biaxial strengthmagnification factorin 1-direction;
Kc2 5 biaxial strengthmagnification factorin 2-direction;
Kc3 5 biaxial strengthmagnification factorin 3-direction;
½KElement� 5 element stiffnessmatrix;
½KSection� 5 total stiffness of thesection;
½ðKSectionÞc� 5 contribution ofconcrete to thesection stiffness;
½ðKSectionÞsx� 5 sectional stiffnessfrom the longitudinalreinforcement;
KSectionðxÞ 5 section stiffnessmatrix;
½kfiber� 5 condensed fiberstiffness;
P 5 element end forces;½Rða1Þ� 5 rotation matrix;
rd 5 residual of sectionaldeformation;
ru 5 element residualdeformation vector;
rðxÞ 5 residual sectiondeformation;
SðxÞ5 fN V W T My Mz gT 5 section forces;fsg5 f ɛ0 xy xz xx gxy0 gxz0 gT 5 section deformations;
½T � 5 transformation matrix;f u0 v0 w0 ux uy uz gT 5 frame displacements
in global system;x2 y2 z 5 global coordinate of
RC element;
x0 2 y0 2 z0 5 local coordinate ofRC element forcircular cross section;
½a1� 5 angle between the(x2 y2 z) and(12223) coordinatesystems;
apr1 5 deviation angle
between the appliedstress angle a1 andthe rotating angle ar;
fɛg5 f ɛx gxy gxz gT 5 available strains;ɛsx 5 equivalent uniaxial
strain in thereinforcement inx-direction;
ɛsy 5 equivalent uniaxialstrain in thereinforcement iny-direction;
ɛsz 5 equivalent uniaxialstrain in thereinforcement inz-direction;
f ɛx ɛy ɛz gxy gyz gxz gT 5 global strain vector;ɛ0y 5 strain perpendicular
to the stirrupcross section;
f ɛ1 ɛ2 ɛ3 g12 g23 g13 gT 5 biaxial principalstrains in 12223direction;
f ɛ1 ɛ2 ɛ3 gT 5 equivalent uniaxialstrains;
ɛ1p 5 ultimate strain in1-direction;
ɛ2p 5 ultimate strain in2-direction;
ɛ3p 5 ultimate strain in3-direction;
z 5 softened coefficientof concrete incompression;
u0 5 angle for circularcross section;
fm12 m21 m23 m32 m13 m31 gT 5 Hsu/Zhu ratios;rsx 5 smeared steel ratio
in x-direction;rsy 5 smeared steel ratio
in y-direction;rsz 5 smeared steel ratio
in z-direction;fsx sy sz txy tyz txz gT 5 global total stress
vector;fsg5 fsx txy txz gT 5 available stresses;
fsc1 sc
2 sc3 tc12 tc23 tc13 gT 5 local concrete stress
vector in 12223direction;
sicx 5 concrete stress in
x-direction of fiber i;sicy 5 concrete stress in
y-direction of fiber i;
572 / JOURNAL OF STRUCTURAL ENGINEERING © ASCE / APRIL 2013
J. Struct. Eng. 2013.139:561-573.
Dow
nloa
ded
from
asc
elib
rary
.org
by
UN
IVE
RSI
TY
OF
HO
UST
ON
on
04/0
8/13
. Cop
yrig
ht A
SCE
. For
per
sona
l use
onl
y; a
ll ri
ghts
res
erve
d.

sicz 5 concrete stress in
z-direction of fiber i;sisx 5 steel stress in
x-direction of fiber i;sisy 5 steel stress in
y-direction of fiber i;sisz 5 steel stress in
z-direction of fiber i;s1p 5 ultimate stress in
1-direction;s2p 5 ultimate stress in
2-direction;s3p 5 ultimate stress in
3-direction;fs fibergc 5 condensed concrete
fiber stresses;½ �T 5 transpose matrix;
and12223 5 direction(s) of
applied principaltensile stress.
References
AASHTO. (2000). Bridge design specifications, 2nd Ed., Washington, DC.American Concrete Institute (ACI). (2002). “Building code requirements
for reinforced concrete.” 318-02, Farmington Hills, MI.Belarbi, A., and Hsu, T. T. C. (1994). “Constitutive laws of concrete in
tension and reinforcing bars stiffened by concrete.” ACI Struct. J., 91(4),465–474.
Belarbi, A., andHsu, T. T.C. (1995). “Constitutive laws of softened concretein biaxial tension-compression.” Struct. J., 92(5), 562–573.
Elfgren, L., Karlsson, I., and Losberg, A. (1974). “Torsion-bending-shearinteraction for concrete beams.” J. Struct. Div., 100(ST8), 1657–1676.
Ewida, A. A., and McMullen, A. E. (1982). “Concrete members undercombined torsion and shear.” J. Struct. Div., 108(4), 911–928.
Gesund, H., and Boston, L. A. (1964). “Ultimate strength in combinedbending and torsion of concrete beams containing only longitudinalreinforcement.” J. Struct. Div., 61(11), 1453–1472.
Gregori, J. N., Sosa, P. M., Prada, M. A. F., and Filippou, F. C. (2007). “A3-D numerical model for reinforced and prestressed concrete ele-ments subjected to combined axial, bending, shear and torsion loading.”Eng. Structures, 29(12), 3404–3419.
Hsu, T. T. C., and Zhang, L. X. (1996). “Tension stiffening in reinforcedconcrete membrane elements.” Struct. J., 93(1), 108–115.
Hsu, T. T. C., and Zhang, L. X. (1997). “Nonlinear analysis of membraneelements by fixed-angle softened-trussmodel.” Struct. J., 94(5), 483–492.
Hsu, T. T. C., and Zhu, R. R. H. (2002). “Softened membrane model forreinforced concrete elements in shear.” Struct. J., 99(4), 460–469.
Jeng,C.H., andHsu, T. T.C. (2009). “Asoftenedmembranemodel for torsionin reinforced concrete members.” Eng. Structures, 31(9), 1944–1954.
Kupfer, H. B., Hildorf, H. K., and Rusch, H. (1969). “Behavior of concreteunder biaxial stresses.” Struct. J., 66(8), 656–666.
Lessig, N. N. (1959). Determination of load-carrying capacity of rectan-gular reinforced concrete elements subjected to flexure and torsion,Study No. 5, Institut Betona i Zhelezobetona [Institute of Concrete andReinforced Concrete], Moscow, 5–28.
Mansur,M.A., andParamasivam, P. (1984). “Reinforcedconcrete beamswithsmall opening in bending and torsion.” ACI Struct. J., 81(2), 180–185.
Mullapudi, T. R. S. (2010). “Seismic analysis of reinforced concretestructures subjected to combined axial, bending, shear and torsional
loads.” Ph.D. thesis, Dept. of Civil and Environmental Engineering,Univ. of Houston, Houston.
Mullapudi, T. R. S., and Ayoub, A. S. (2010). “Modeling of the seismicbehavior of shear-critical reinforced concrete columns.” J. Eng. Struct.,32(11), 3601–3615.
Neuenhofer, A., and Filippou, F. C. (1997). “Evaluation of nonlinear framefinite-element models.” J. Struct. Eng., 123(7), 958–966.
Nylander, H. (1945). Torsion and torsional restraint by concrete structures,Bull. D-19, Statens Kommittee för Byggnadsforskning, Stockholm,Sweden.
Pang, X. B., and Hsu, T. T. C. (1995). “Behavior of reinforced concretemembrane elements in shear.” Struct. J. 92(6), 665–679.
Pang, X. B., andHsu, T. T. C. (1996). “Fixed-angle softened-truss model forreinforced concrete.” Struct. J. 93(2), 197–207.
Park, R., Priestley, M. J. N., and Gill, W. D. (1982). “Ductility of squareconfined concrete columns.” J. Struct. Div., 108(4), 929–950.
Prakash, S., Belarbi, A., and You, Y. (2010). “Seismic performance ofcircular RC columns subjected to axial force, bending, and torsion withlow and moderate shear.” Eng. Struct., 32(1), 46–59.
Rahal, K. N., and Collins, M. P. (1995a). “Analysis of sections subjected tocombined shear and torsion—a theoretical investigation.” ACI Struct. J.,92(4), 459–469.
Rahal, K. N., and Collins, M. P. (1995b). “Effect of thickness of concretecover on shear-torsion interaction—an experimental investigation.” ACIStruct. J., 92(3), 334–342.
Rahal, K. N., and Collins, M. P. (2003a). “Combined torsion and bendingin reinforced and prestressed concrete beams.” ACI Struct. J., 100(2),157–165.
Rahal, K. N., and Collins, M. P. (2003b). “Experimental evaluation of ACIand AASHTO-LRFD design provisions for combined shear and tor-sion.” ACI Struct. J., 100(3), 277–282.
Spacone, E., Filippou, F. C., and Taucer, F. F. (1996). “Fiber beam-columnmodel for nonlinear analysis of R/C frames, part I formulation.”Earthquake Eng. Struct. Dynam., 25(7), 711–725.
Taylor, R. L. (2005). FEAP user manual v2.0., Dept. of Civil and Envi-ronmental Engineering, Univ. of California, Berkeley, CA.
Tirasit, P., and Kawashima, K. (2008). “Effect of nonlinear seismic torsionon the performance of skewed bridge piers.” J. Earthquake Eng., 12(6),980–998.
Tirasit, P., Kawashima, K., and Watanabe, G. (2005). “An experimentalstudy on the performance of RC columns subjected to cyclic flexural-torsional loading.” Proc., 2nd Int. Conf. on Urban Earthquake Engi-neering, Tokyo Institute of Technology, Tokyo, 357–364.
Vecchio, F. J. (1992). “Finite element modeling of concrete expansion andconfinement.” J. Struct. Eng., 118(9), 2390–2405.
Vecchio, F. J., and Collins, M. P. (1981). “Stress-strain characteristic ofreinforced concrete in pure shear.” Proc., IABSE Colloquium, Ad-vanced Mechanics of Reinforced Concrete, Delft, Final Rep., Int.Association of Bridge and Structural Engineering, Zurich, Switzer-land, 221–225.
Vecchio, F. J., and Collins, M. P. (1986). “The modified compression fieldtheory for reinforced concrete elements subjected to shear.” Struct. J.,83(2), 219–231.
Vecchio, F. J., and Selby, R. G. (1991). “Toward compression-field analysisof reinforced concrete solids.” J. Struct. Eng., 117(6), 1740–1758.
Yudin, V. K. (1962). “Determination of the load-carrying capacity ofrectangular reinforced concrete elements subjected to combined torsionand bending.” Beton i Zhelezobeton [Concrete and Reinforced Con-crete], Moscow, 6, 265–269 (in Russian).
Zhang, L. X., and Hsu, T. T. C. (1998). “Behavior and analysis of 100 MPaconcrete membrane elements.” J. Struct. Eng., 124(1), 24–34.
Zhu, R. H., and Hsu, T. T. C. (2002). “Poisson effect of reinforced concretemembrane elements.” Struct. J., 99(5), 631–640.
Zhu, R. H., Hsu, T. T. C., and Lee, J. Y. (2001). “Rational shear modulus forsmeared crack analysis of reinforced concrete.” Struct. J., 98(4), 443–450.
JOURNAL OF STRUCTURAL ENGINEERING © ASCE / APRIL 2013 / 573
J. Struct. Eng. 2013.139:561-573.
Dow
nloa
ded
from
asc
elib
rary
.org
by
UN
IVE
RSI
TY
OF
HO
UST
ON
on
04/0
8/13
. Cop
yrig
ht A
SCE
. For
per
sona
l use
onl
y; a
ll ri
ghts
res
erve
d.
Related Documents