Experimental Methods and Physics Skills /Astrophysical Skills and Techniques
Physics and Astrophysics Laboratory
Tutors:
Dr.A.Mahendrasingam (Singam) [email protected]
Professor Rob Jeffries

Physics/Astrophysics Laboratory
Lecture Course Provide an education in the knowledge
required to become a Physicist/Astrophysicist
Laboratory Skills Educating students in some of the skills
required to be a Physicist/Astrophysicist
Physics/Astrophysics Laboratory
Module Structure: Two strands
Practical abilities to perform experiments and the intellectual ability to analyse and access the results of experiments (strand 1)
Basic computational skills (strand 2)
Physics/Astrophysics Laboratory
The experimental Methods Strand Expected to perform 8 laboratory experiments
during the two semesters ( 5 in semester one, 3 in semester 2)
Your laboratory diary will be marked at the end of each laboratory session. From this mark you will receive a final mark for each completed experiments
Each of these 8 experiments should take you 2 weeks ( 2 x 3 hour laboratory sessions)
Physics/Astrophysics Laboratory
The Computing Strand
Spreadsheets Programming
Physics/Astrophysics Laboratory
Assessment
Semester one Strand 1 ( 90 marks) Strand 2 ( 10 marks)
Semester two Strand 1 ( 90 marks) Strand 2 ( 10 marks)
Physics/Astrophysics Laboratory
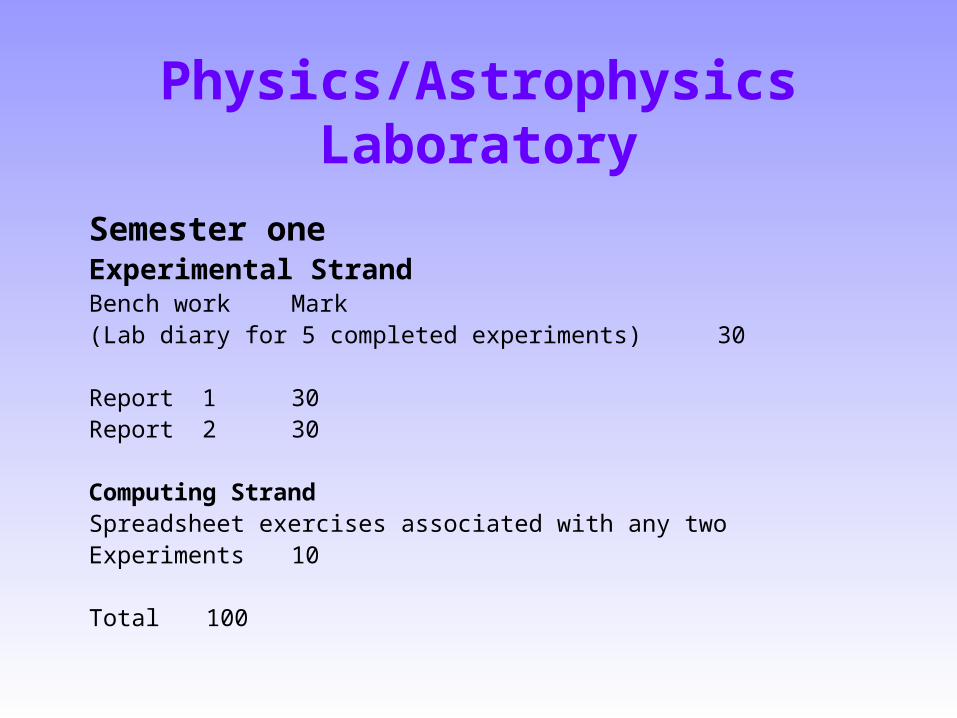
Semester oneExperimental StrandBench work Mark(Lab diary for 5 completed experiments) 30
Report 1 30Report 2 30
Computing StrandSpreadsheet exercises associated with any twoExperiments 10
Total 100
Physics/Astrophysics Laboratory
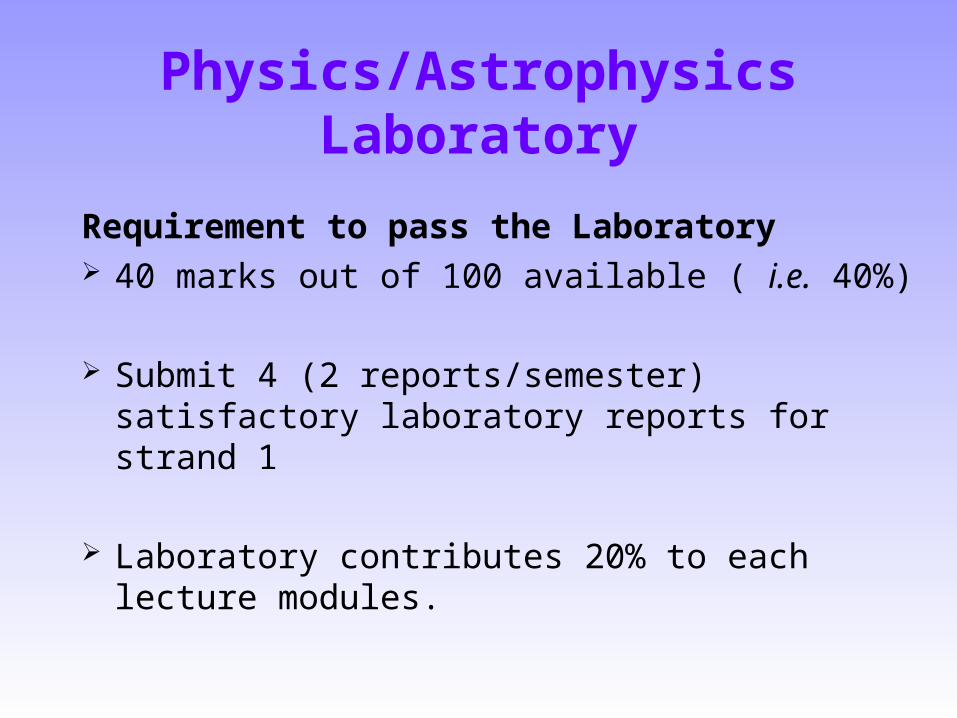
Requirement to pass the Laboratory 40 marks out of 100 available ( i.e. 40%)
Submit 4 (2 reports/semester) satisfactory laboratory reports for strand 1
Laboratory contributes 20% to each lecture modules.
Physics/Astrophysics Laboratory
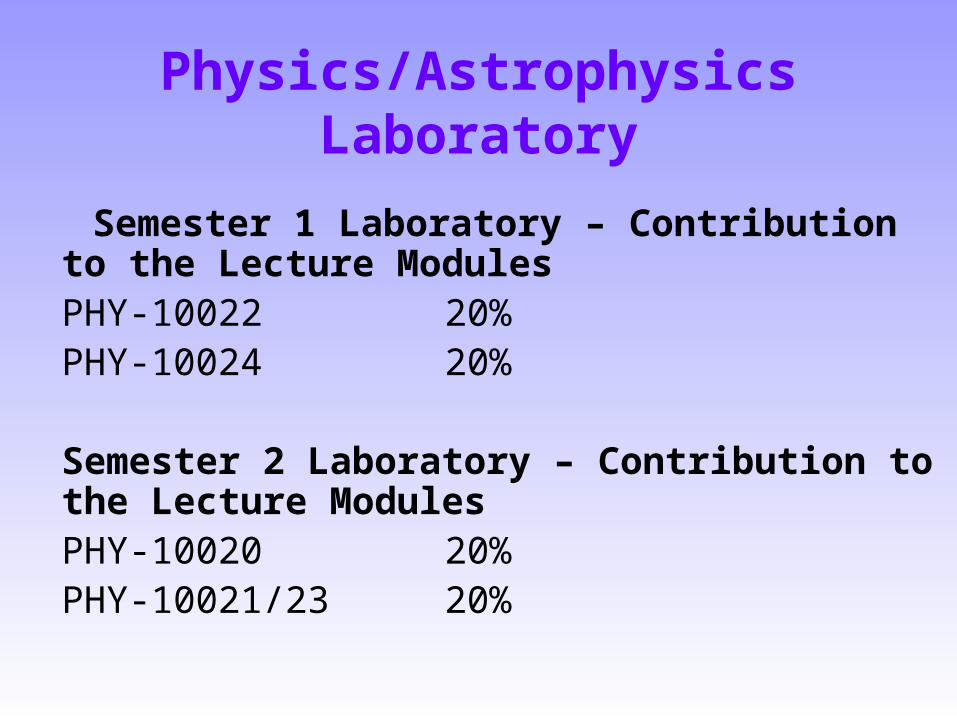
Semester 1 Laboratory – Contribution to the Lecture ModulesPHY-10022 20%PHY-10024 20%
Semester 2 Laboratory – Contribution to the Lecture ModulesPHY-10020 20%PHY-10021/23 20%
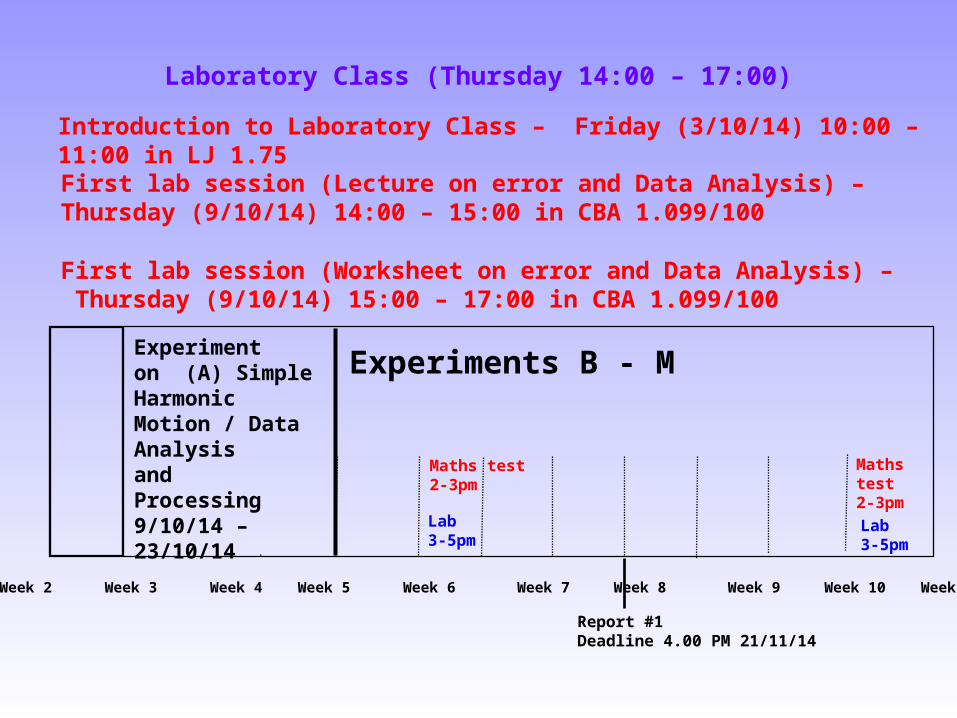
Week 1 Week 2 Week 3 Week 4 Week 5 Week 6 Week 7 Week 8 Week 9 Week 10 Week 11 Week 12
Report #1Deadline 4.00 PM 21/11/14
Experiments B - M
Experimenton (A) SimpleHarmonicMotion / DataAnalysisandProcessing9/10/14 – 23/10/14
Maths test2-3pm
Lab3-5pm
Lab3-5pm
Laboratory Class (Thursday 14:00 – 17:00)
Maths test2-3pm
Introduction to Laboratory Class – Friday (3/10/14) 10:00 – 11:00 in LJ 1.75
First lab session (Lecture on error and Data Analysis) – Thursday (9/10/14) 14:00 – 15:00 in CBA 1.099/100
First lab session (Worksheet on error and Data Analysis) – Thursday (9/10/14) 15:00 – 17:00 in CBA 1.099/100
Physics/Astrophysics Laboratory
Hardback notebook
Your copy of the Lab. Manual
Additional information about the laboratory can be found in the module pages for PHY-10022/PHY-10024 on KLE(http://students.keele.ac.uk)
Laboratory Notebook – Section Front of your notebook should contain:
Name:
Address: School of Physical and Geographical Sciences
Each new experiment should start on a new page
Title of the experiment should be recorded at the start of the each new experiment.
Date should be recorded at the beginning of each laboratory session
Results should be recorded with a short sentence which is sufficiently explanatory that you or someone else can understand it
Record all your data/measurements as you take them
Laboratory NotebookAlways record the units of your measurements along with the measurements themselves
If your data is taken for a certain period of time or a certain number of oscillations etc. then always record this fact along with the measurements themselves.
If you plot or fit your data using one of the computer programs, make a printout of the program output (usually a graph) and attach (glue, sellotape, staple) it into your notebook.
If you use the spreadsheet to analyse the data, make a printout of the spreadsheet and attach (glue, sellotape, staple) it into your notebook.
Laboratory NotebookIf you decide that a set of measurements is incorrect for some reason don’t obliterate it in your notebook. Instead simply draw one diagonal line through it and make a note why you have discarded it. If at a later date you change your mind (or if a staff supervisor or post-graduate demonstrator persuades you to change your mind) you won’t have to re-take the data again. As long as it can still be read it can be used.
Make a note of the pieces of apparatus that you are using in your experiment, e.g. radioactive source B, A.C. circuit box G, a Farnell oscilloscope serial number F831GBX etc. If for some reason a piece of your apparatus is removed (it shouldn’t be but !) then we can recover it if we know the number and you can continue your experiment without having to start again.
At the end of your experiment you should summarise your results, tabulating clearly the values you have obtained for any derived quantities (and their error bars) with suitable notes explaining what each is.
Further details can be found in section 2.1 of the laboratory manual.
PC Lab (LJ1.27) You should able to logon to the computers in the PC Lab using your university computer userid and password.
Also make sure that you save all your work on your network drive (S:).
The networked laser printer in the PC Lab can be used to print your work in the laboratory. Initially you will be given a free 50 pages print quota. Additional print quota can be purchased from Phil.
A key is required to gain access to PC lab. You can obtain a key from Phil by paying a refundable deposit.
You can also use the PCs in the PC Lab in LJ0.026 (Faculty Computing Lab) using Keele Card.

SAFETYBRIEFING FORPHYSICS/ASTROPHYSICS
STUDENTS
Safety
General safety policy
Emergency procedures
Dos and Don'ts

General Safety Policy
The School of Physical and Geographical Sciences must
Provide safe experiments in a safe environment
Establish emergency procedures
Provide safety information and guidance
It is your responsibility to
Take reasonable care for your own health and safety
Take reasonable care for others’ health and safety by complying with the safety rules in the Lennard-Jones Laboratories
Emergency Procedures – FIRE ALARM
THE FIRE ALARM IS A CONTINUOUSLY SOUNDING SIREN
The entire building MUST be evacuated if the siren sounds
Leave either through the foyer or go right along the corridor and leave through the rear building
DO NOT PANICDO NOT TAKE ANY PERSONAL RISKSDO NOT USE THE SERVICE LIFT if the fire alarm sounds
Assemble on the grassed area outside the front entrance of the Lennard-Jones Laboratories
re-entry to the building will not be allowed until Senior Fire Brigade Officer gives permission to do so
Smoke or drink in the laboratory
Drink the water from taps in the Laboratory – There are Drinking Water taps in the toilets
Bring visitors into the laboratories AT ANY TIME
Put bags or coats on the tables
Remove the covers of any equipment or plugs, or use equipment with broken or damaged mains leads
Work in the laboratory without supervision by staff
YOU MUST NOT DO THESE
Store your bag/coats under the bench
Report any suspected faults in equipment to the laboratory staff
YOU MUST DO THESE

Error Bars and the Scientific Process(Lab Manual Section 2.2)
Aim of Science? Advancement of knowledge, understanding nature, etc….
How is this achieved? Building theories/models and testing them by
experimental measurements.
Explaining the results of experiments by theoreticalmodels.
Comparing with theory/other experiments is clearly vital to the scientific process – but how to do this objectively?
Error Bars and the Scientific Process
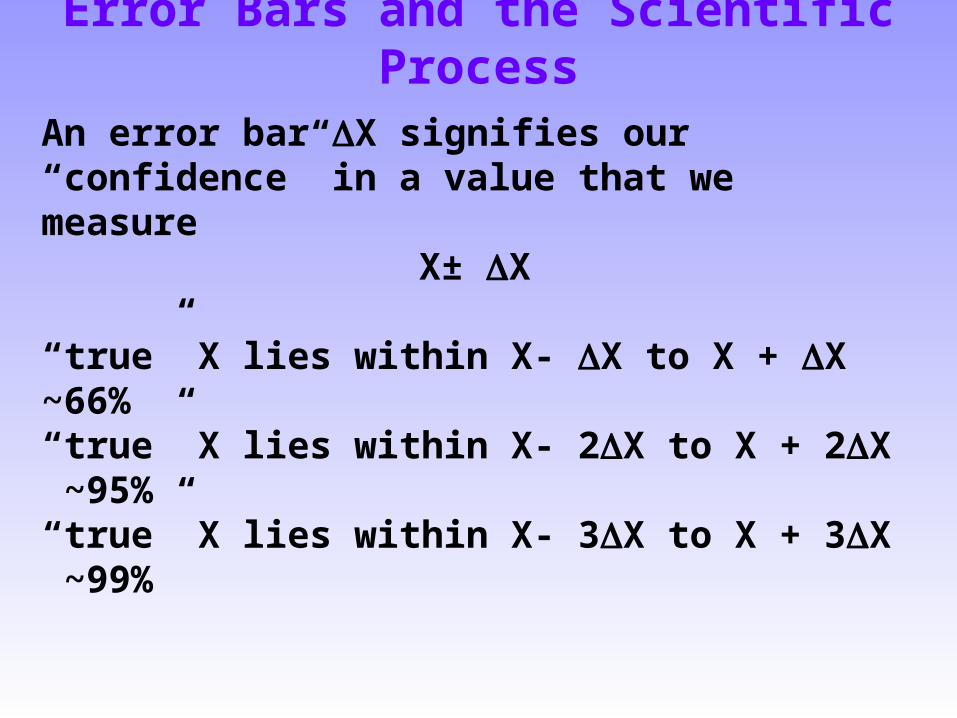
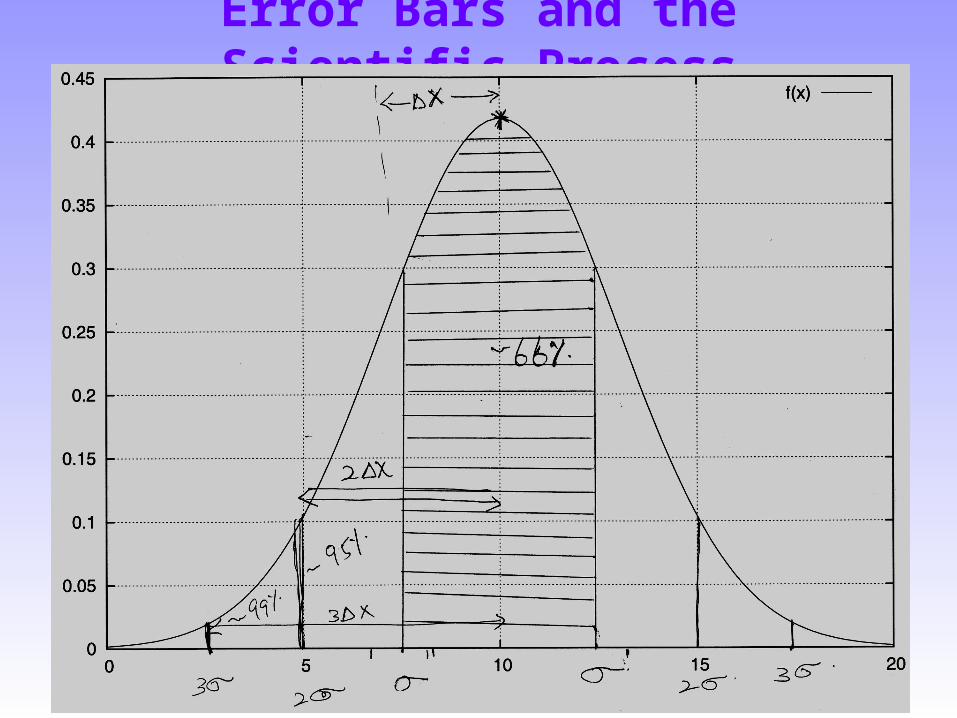
An error bar X signifies our “confidence” in a value that we measure
X± X
“true” X lies within X- X to X + X ~66%“true” X lies within X- 2X to X + 2X ~95%“true” X lies within X- 3X to X + 3X ~99%
Error Bars and the Scientific Process
Error Bars and the Scientific Process
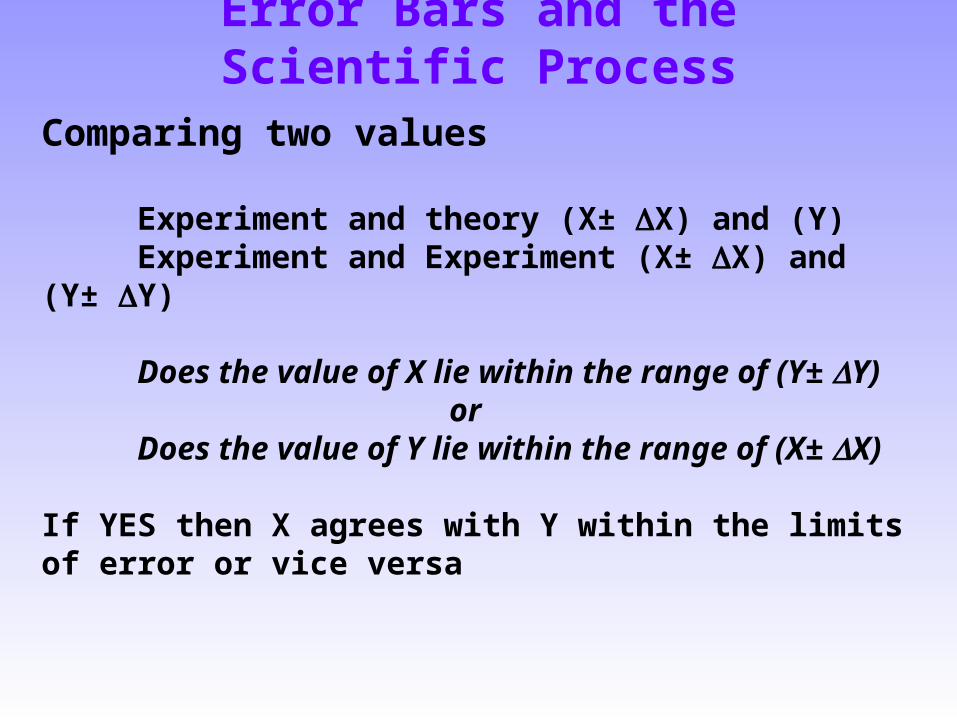
Comparing two values
Experiment and theory (X± X) and (Y)Experiment and Experiment (X± X) and (Y± Y)
Does the value of X lie within the range of (Y± Y)or
Does the value of Y lie within the range of (X± X)
If YES then X agrees with Y within the limits of error or vice versa
Error Bars and the Scientific Process
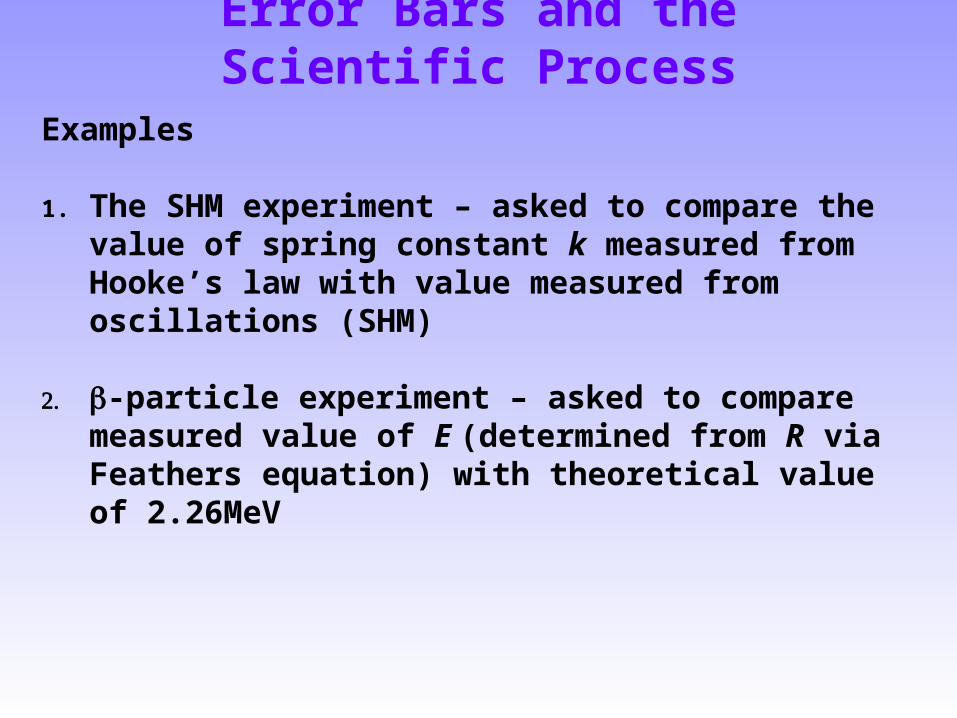
Examples
1. The SHM experiment – asked to compare the value of spring constant k measured from Hooke’s law with value measured from oscillations (SHM)
2. -particle experiment – asked to compare measured value of E (determined from R via Feathers equation) with theoretical value of 2.26MeV
Systematic and Random Errors
Broad classification of errors into one of two classes systematic and random
Systematic errors are the same every time you make a measurement.
Random errors “fluctuate” every time you make a measurement
Systematic Errors Zero offset errors in equipment
Limits of measuring scales (e.g. Graduation on ruler/clock in SHM experiment)
How to deal with systematic errors?
Careful calibration, re-calibration of equipment.
Use another piece of equipment to double check.
Reduce scale graduation errors by measuring a larger value. e.g. In SHM experiment measure 10 oscillations instead of one, scale limit on clock is 1 sec whether measure 1 oscillation or 10.
Use the graduation as error bar (sets limit to knowledge) or estimate of offset value (whichever is bigger).
Random Errors
The measured values fluctuate about a true value due to some random process, e.g.
In -particle experiment the count rate varies due to nuclear fluctuations.
In electrical circuit “noise” can lead to fluctuations in measured voltages.
In SHM experiment starting/stopping clock could be different each time you measure 10 oscillations.
The effect of random errors can be treated statistically.
Random Errors
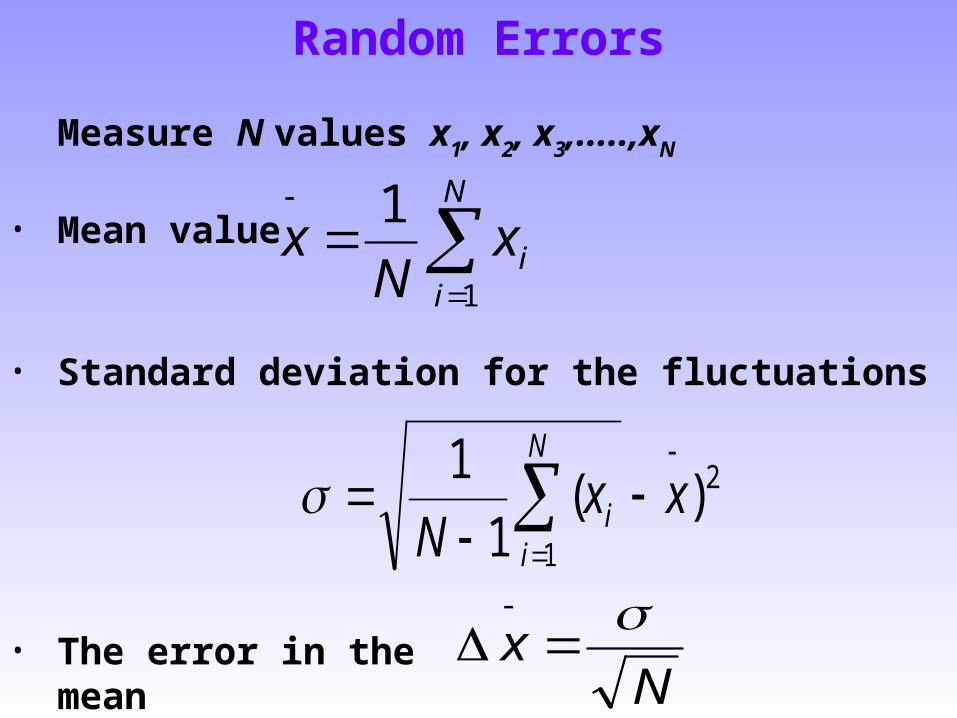
Measure N values x1, x2, x3,.....,xN
• Mean value
N
iix
Nx
1
1
• Standard deviation for the fluctuations
2
1
)(1
1
xxN
N
ii
• The error in the meanN
x
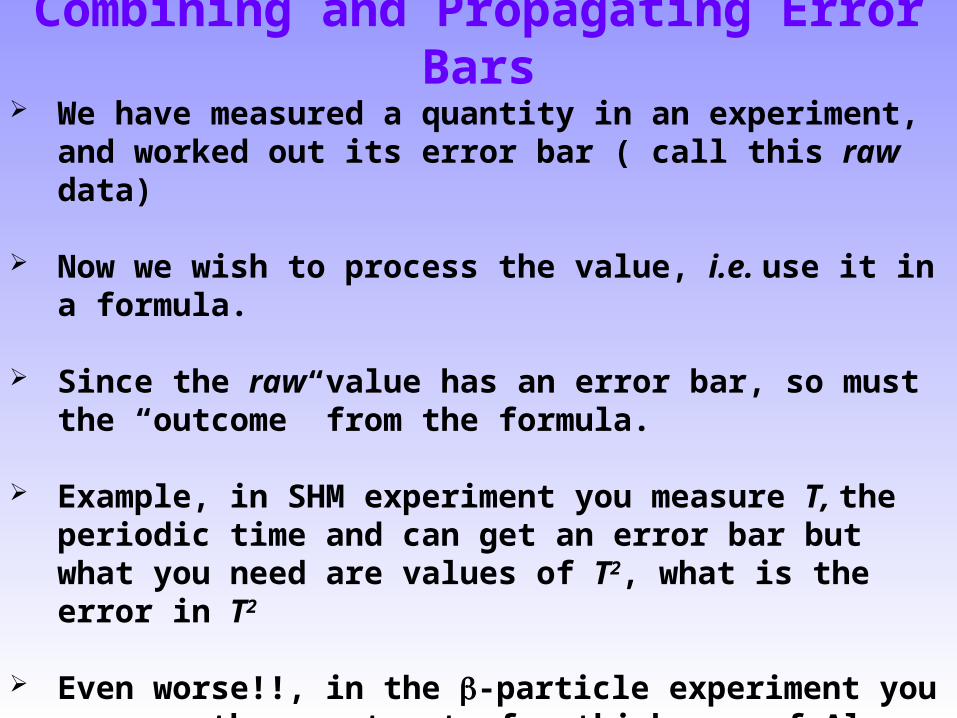
Combining and Propagating Error Bars We have measured a quantity in an experiment, and
worked out its error bar ( call this raw data)
Now we wish to process the value, i.e. use it in a formula.
Since the raw value has an error bar, so must the “outcome” from the formula.
Example, in SHM experiment you measure T, the periodic time and can get an error bar but what you need are values of T2, what is the error in T2
Even worse!!, in the -particle experiment you measure the count rate for thickness of Al, get an error bar in each value and then you need the logarithm of the count rate. What is the error in the logarithm???
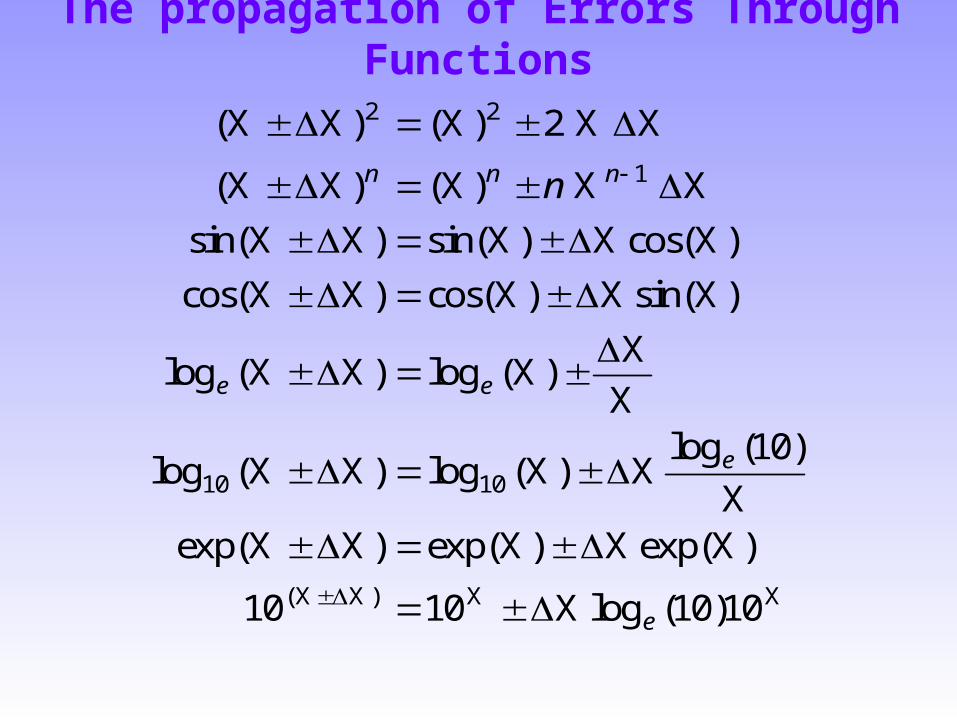
The propagation of Errors Through Functions
( ) ( )
( ) ( )
sin( ) sin( ) cos( )
cos( ) cos( ) sin( )
log ( ) log ( )
log ( ) log ( )log ( )
exp( ) exp( ) exp( )
log ( )( )
X X X X X
X X X X X
X X X X X
X X X X X
X X XX
X
X X X XX
X X X X X
XX X X X
2 2
1
10 10
2
10
10 10 10 10
n n n
e e
e
e
n
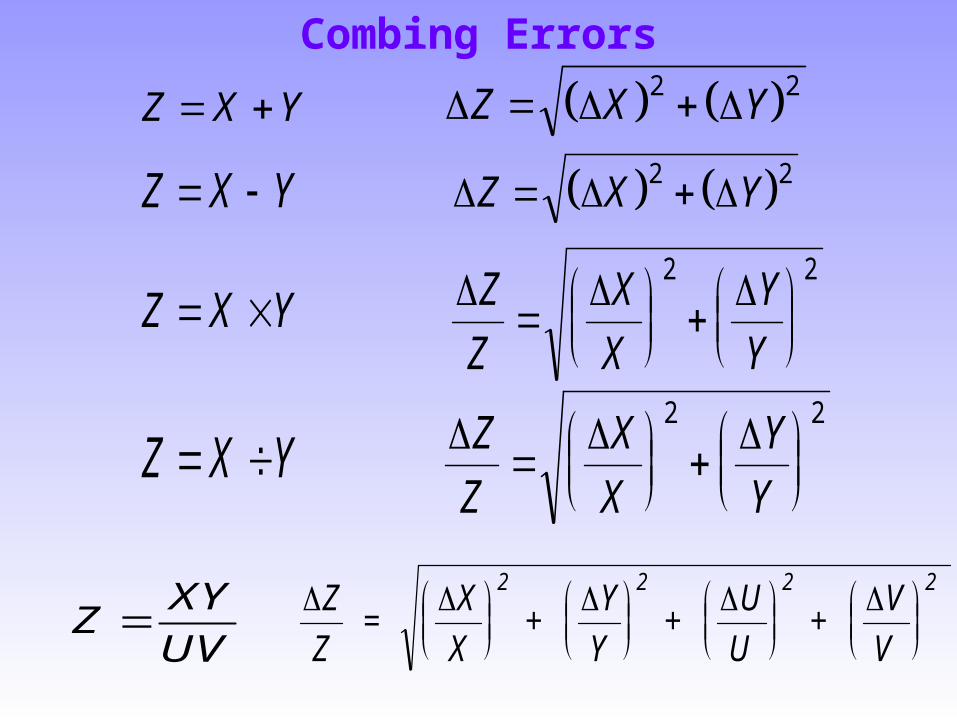
Combing Errors
Z X Y
Z X Y 2 2Z X Y
Z X Y 2 2
Z X Y Z
Z
X
X
Y
Y
2 2
Z X Y Z
Z
X
X
Y
Y
2 2
ZXY
UV Z
Z =
X
X +
Y
Y +
U
U +
V
V
2 2 2 2
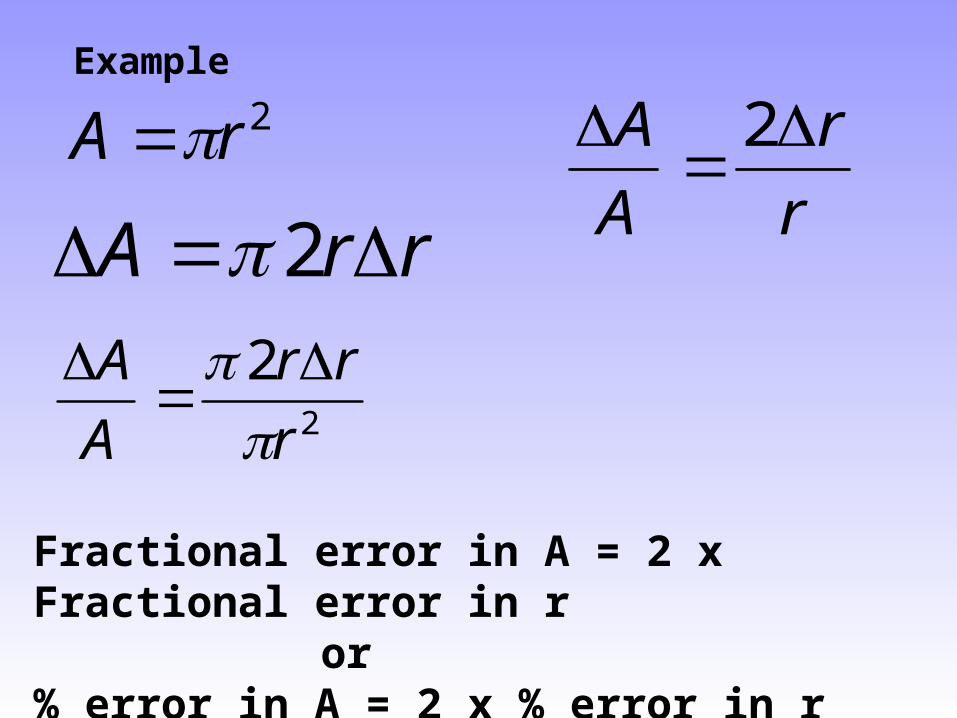
2rA Example
rrA 2
2
2
r
rr
A
A
r
r
A
A
2
Fractional error in A = 2 x Fractional error in ror
% error in A = 2 x % error in r
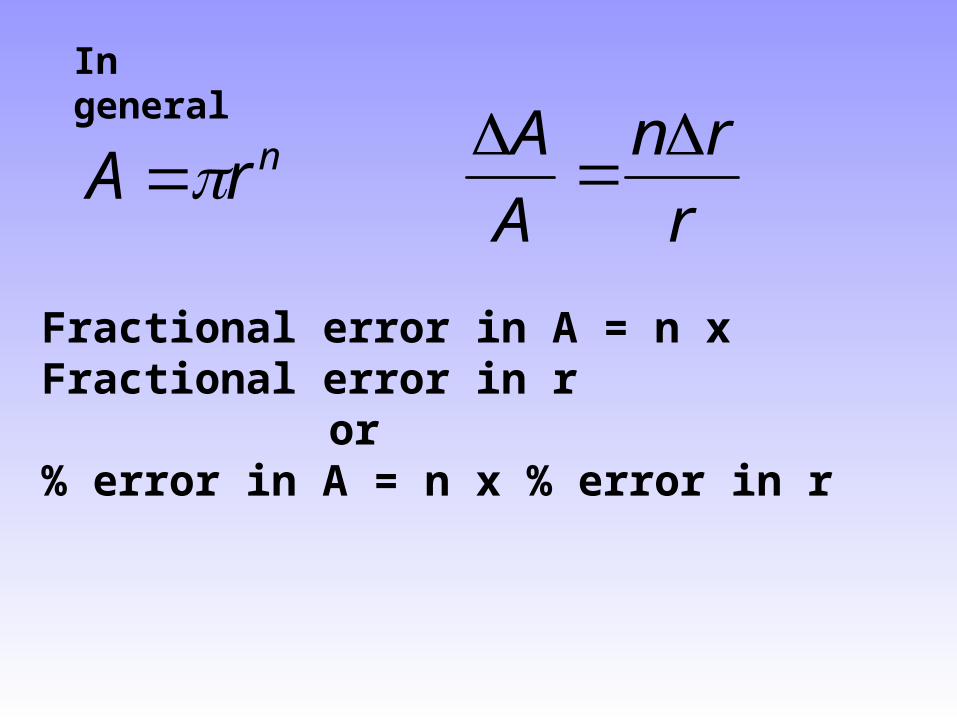
In general
nrA r
rn
A
A
Fractional error in A = n x Fractional error in ror
% error in A = n x % error in r
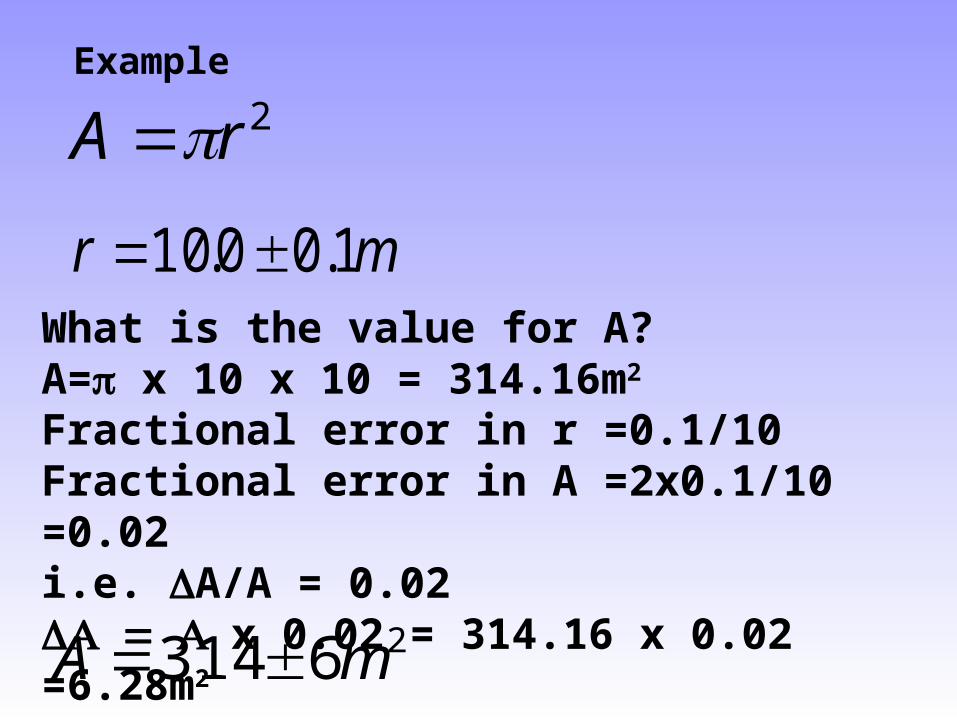
Example
What is the value for A?A= x 10 x 10 = 314.16m2
Fractional error in r =0.1/10Fractional error in A =2x0.1/10 =0.02i.e. A/A = 0.02x 0.02 = 314.16 x 0.02 =6.28m2
2rA
mr 1.00.10
26314 mA
Error Bars and Slopes/Intercepts From Graphs
Plot a graph of raw data points, each one has an error bar.
Want to fit a straight line, get slope, use slope in formula.
Since the data points have error bar so the slope of the straight line will also have an error bar.
“Theory” is called least squares data analysis.
DON’T PANIC, leave the theory later.
Computer program on PC’s in lab to fit straight lines and work out error bars. (LineFit / Excel / KyPlot / DataStudio)
Templates for Excel or Kyplot is available on the web in the Physics/Astrophysics Laboratory web page.