www.elsevier.com/locate/enggeo
Engineering Geology 81
Expansive bentonite–sand mixtures in cyclic controlled-suction
drying and wetting
E.E. Alonso, E. Romero*, C. Hoffmann, E. Garcıa-Escudero
Department of Geotechnical Engineering and Geosciences, Universitat Politecnica de Catalunya,
UPC, c/ Jordi Girona 1-3, Building D-2, 08034 Barcelona, Spain
Available online 11 August 2005
Abstract
Expansive clay buffers in radioactive waste disposal designs experience cyclic drying and wetting paths during different
stages of their design life. Clayey soils subjected to these processes develop swelling and shrinkage deformations, which give
rise to the accumulation of compression or expansion strains during suction cycles. Experimental studies were undertaken using
oedometer tests on an artificially prepared bentonite–sand mixture (80% bentonite by dry mass). In order to study these
processes and to identify the most important features controlling soil behaviour, several wetting–drying cycles with suctions
ranging between 130 and 4 MPa were applied using vapour equilibrium technique and covering a wide range of over-
consolidation ratios (OCR). The tested samples showed cumulative shrinkage strains along the successive cycles, which became
more significant at increasing vertical net stresses (low OCR values). However, no accumulation of expansion strains was
detected at elevated OCR values. Test results were interpreted and predicted within the context of an elastoplastic model
proposed by Alonso et al., 1999, [Alonso, E.E., Vaunat, J., Gens, A., (1999). Modelling the mechanical behaviour of expansive
clays. Engineering Geology, 54, 173–183.] which takes into account the accumulation of strains. A good correspondence
between measured soil response and model predictions was observed. The paper also presents the methodology to derive the
constitutive parameters.
D 2005 Elsevier B.V. All rights reserved.
Keywords: Swelling; Shrinkage; Suction; Expansive clay; Model
0013-7952/$ - see front matter D 2005 Elsevier B.V. All rights reserved.
doi:10.1016/j.enggeo.2005.06.009
* Corresponding author. Geotechnical Laboratory, Departamento
de Ingenierıa del Terreno, Jordi Girona 1-3, Edificio D-2, Universi-
tat Politecnica de Catalunya, 08034 Barcelona, Spain. Tel.: +34 93
4016888; fax: +34 93 4017251.
E-mail address: [email protected] (E. Romero).
1. Introduction
Soils are naturally subjected to cyclic and strong
drying and wetting paths due to natural environmental
fluctuations. Buffers constructed using clays of expan-
sive nature in radioactive waste disposal designs also
experience stress and suction cycles during different
stages of their design life. In a general case, stress and
suction paths are far from being a simple monotonic
(2005) 213–226
E.E. Alonso et al. / Engineering Geology 81 (2005) 213–226214
process. Clayey soils undergo an increase in volume
during water uptake, but also experience an important
amount of shrinkage on water removal, which give
rise to the accumulation of compression or expansion
strains during suction cycles. Several studies were
undertaken in the past; however, few experimental
studies have been reported in the literature with
respect to water transfer in vapour form under con-
trolled-suction conditions. In fact, vapour transfer
plays a major role in buffers of radioactive waste
disposal designs because of the existing strong ther-
mal gradients. In addition, bentonite-based buffers
develop very large suctions, which cannot be tested
using conventional techniques with liquid water trans-
fer, such as the axis translation and osmotic techni-
ques. Furthermore, the response of expansive soils
against suction cycles is a key information required
to understand its constitutive behaviour.
Experimental results describing the volume change
response of expansive soil exposed to cyclic wetting
and drying have been reported by Dif and Bluemel
(1991) and Al-Homoud et al. (1995), who detected
dfatigueT of swelling (shrinkage accumulation) that
increases at higher vertical stresses. This behaviour
was explained in terms of a continuous rearrangement
of soil particles, leading to a less active microstruc-
ture. On the other hand, Obermeier (1973), Popescu
(1980) and Pousada (1984) observed an opposite
effect, in which the amount of swelling increased
with the number of cycles. Day (1994) and Basma
et al. (1996) reported cumulative shrinkage or expan-
sive strains, depending on the suction reached during
the drying paths.
The objectives of the research presented in this
paper are focused on the investigation and prediction
of the volume change response of an artificially pre-
pared mixture of bentonite and sand subjected to
several wetting and drying cycles in the high suction
range. To achieve the first objective, an experimental
programme was designed in which several controlled-
suction wetting and drying cycles, with suctions ran-
ging between 130 and 4 MPa, were applied using
vapour equilibrium technique. Oedometer tests were
performed under different values of constant vertical
net stress covering a wide overconsolidation (OCR)
range. To address the second objective, the volume
change response of the mixture is discussed and inter-
preted within the context of the elastoplastic model
proposed by Alonso et al. (1999) (BExM: Barcelona
Expansive Model). Comparisons are provided
between the experimental results and the predicted
results. Based on these studies model parameters are
derived.
2. Experimental programme
2.1. Tested material
Tests were performed on statically compacted ben-
tonite–sand mixtures. This material was selected due
to the following favourable properties: significant
volume changes on suction cycles and an appropriate
water permeability, which allowed the time required
for equalisation to be kept within reasonable bounds.
Bentonite powder was mixed with silica sand to
achieve a dry mass ratio of 80% bentonite and 20%
sand. Ca-bentonite powder passing ASTM No.40
(FEBEX bentonite, ENRESA, 2000) presents a liquid
limit of 93%, a plastic limit of 47%, 45% of particles
less than 2 Am and a density of solid particles of 2.70
Mg/m3. The uniform sand passing ASTM No.16 pre-
sents a uniformity coefficient of Cu=2 and an effec-
tive size of D10=0.21 mm.
The mixture in powder form was allowed to equi-
librate at an average relative humidity of 55% (suction
of s=80 MPa) to achieve a hygroscopic water content
of 10.5%. Specimens (30 mm in diameter and 8 mm
high) were then statically and one-dimensionally com-
pacted at a displacement rate of 0.2 mm/min and
constant water content to a target dry density of
around 1.5 Mg/m3. The initial degree of saturation
was around 35%.
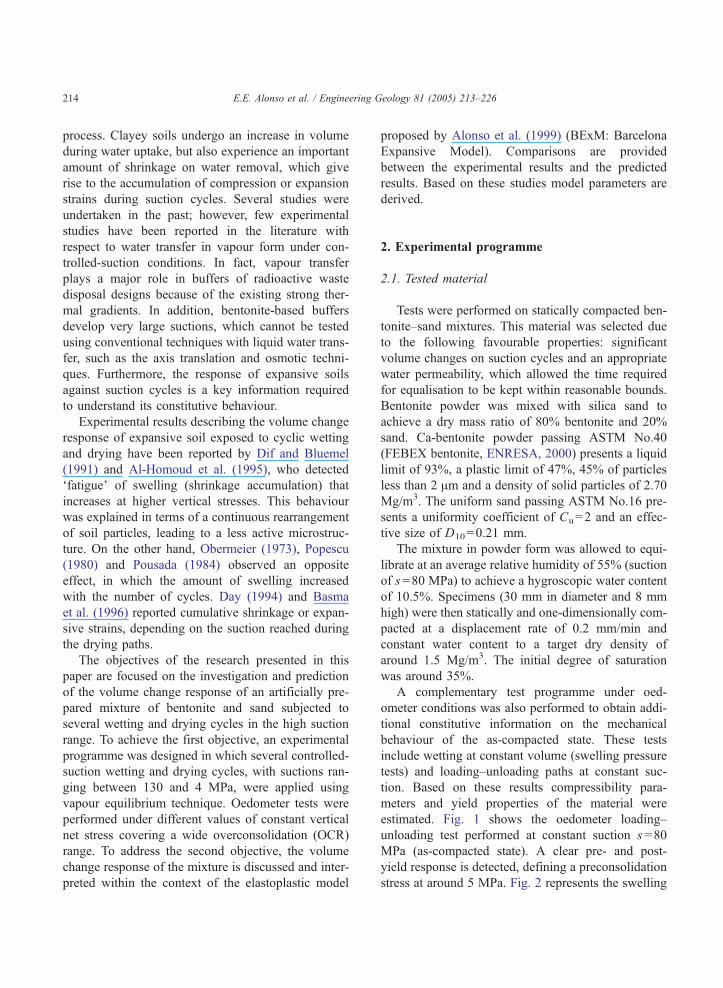
A complementary test programme under oed-
ometer conditions was also performed to obtain addi-
tional constitutive information on the mechanical
behaviour of the as-compacted state. These tests
include wetting at constant volume (swelling pressure
tests) and loading–unloading paths at constant suc-
tion. Based on these results compressibility para-
meters and yield properties of the material were
estimated. Fig. 1 shows the oedometer loading–
unloading test performed at constant suction s =80
MPa (as-compacted state). A clear pre- and post-
yield response is detected, defining a preconsolidation
stress at around 5 MPa. Fig. 2 represents the swelling
100 1000 10000
Vertical net stress, σV (kPa)
1.50
1.60
1.70
1.80
Spe
cific
vol
ume,
(1+
e)
σV=5 MPa
Fig. 1. Loading–unloading test at constant suction s =80 MPa on the
as-compacted sample.
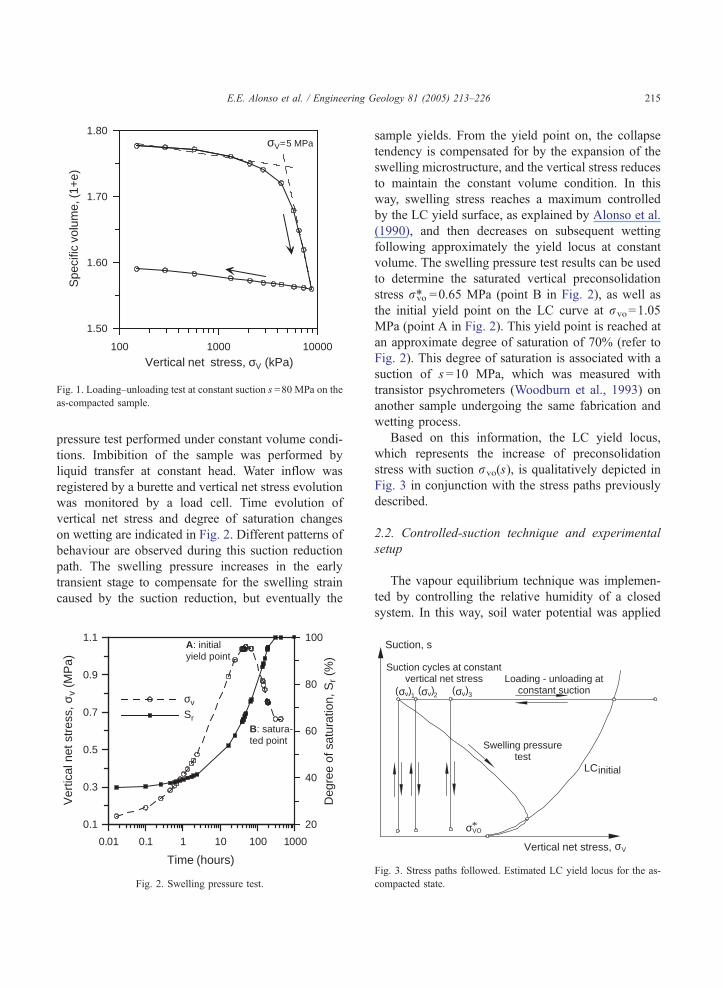
E.E. Alonso et al. / Engineering Geology 81 (2005) 213–226 215
pressure test performed under constant volume condi-
tions. Imbibition of the sample was performed by
liquid transfer at constant head. Water inflow was
registered by a burette and vertical net stress evolution
was monitored by a load cell. Time evolution of
vertical net stress and degree of saturation changes
on wetting are indicated in Fig. 2. Different patterns of
behaviour are observed during this suction reduction
path. The swelling pressure increases in the early
transient stage to compensate for the swelling strain
caused by the suction reduction, but eventually the
0.01 0.1 1 10 100 1000
Time (hours)
0.1
0.3
0.5
0.7
0.9
1.1
Ver
tical
net
str
ess,
σv
(MP
a)
20
40
60
80
100
Deg
ree
of s
atur
atio
n, S
r (%
)
σv
Sr
A: initialyield point
B: satura-ted point
Fig. 2. Swelling pressure test.
sample yields. From the yield point on, the collapse
tendency is compensated for by the expansion of the
swelling microstructure, and the vertical stress reduces
to maintain the constant volume condition. In this
way, swelling stress reaches a maximum controlled
by the LC yield surface, as explained by Alonso et al.
(1990), and then decreases on subsequent wetting
following approximately the yield locus at constant
volume. The swelling pressure test results can be used
to determine the saturated vertical preconsolidation
stress rvo* =0.65 MPa (point B in Fig. 2), as well as
the initial yield point on the LC curve at rvo=1.05
MPa (point A in Fig. 2). This yield point is reached at
an approximate degree of saturation of 70% (refer to
Fig. 2). This degree of saturation is associated with a
suction of s =10 MPa, which was measured with
transistor psychrometers (Woodburn et al., 1993) on
another sample undergoing the same fabrication and
wetting process.
Based on this information, the LC yield locus,
which represents the increase of preconsolidation
stress with suction rvo(s), is qualitatively depicted in
Fig. 3 in conjunction with the stress paths previously
described.
2.2. Controlled-suction technique and experimental
setup
The vapour equilibrium technique was implemen-
ted by controlling the relative humidity of a closed
system. In this way, soil water potential was applied
Vertical net stress, V
Suction, s
VO*
LCinitial
(σ σ v)1
Suction cycles at constantvertical net stress
Swelling pressuretest
Loading - unloading at constant suction( σ
σ
σ
v)2 ( v)3
Fig. 3. Stress paths followed. Estimated LC yield locus for the as
compacted state.
-
1.34 1.36 1.38 1.40
Density of H2SO4 (Mg/m3)
100
110
120
130
140
Suc
tion,
s (
MP
a)
21 oC22 oC23 oC
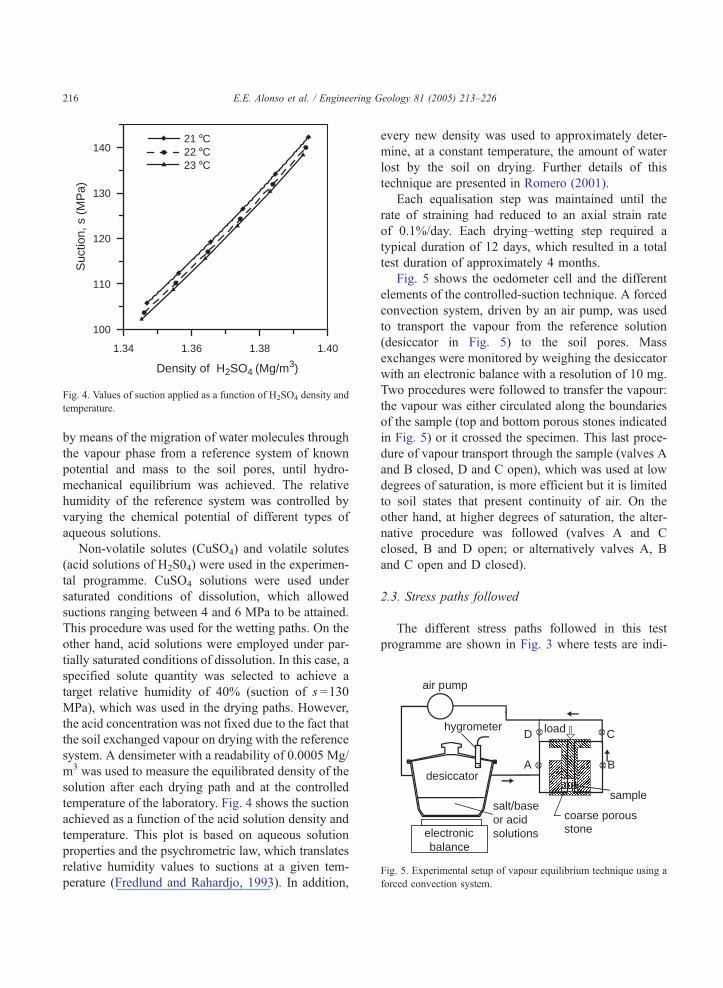
Fig. 4. Values of suction applied as a function of H2SO4 density and
temperature.
A
D C
B
air pump
desiccator
electronic balance
hygrometer
coarse porousstone
sample
load
salt/base or acid solutions
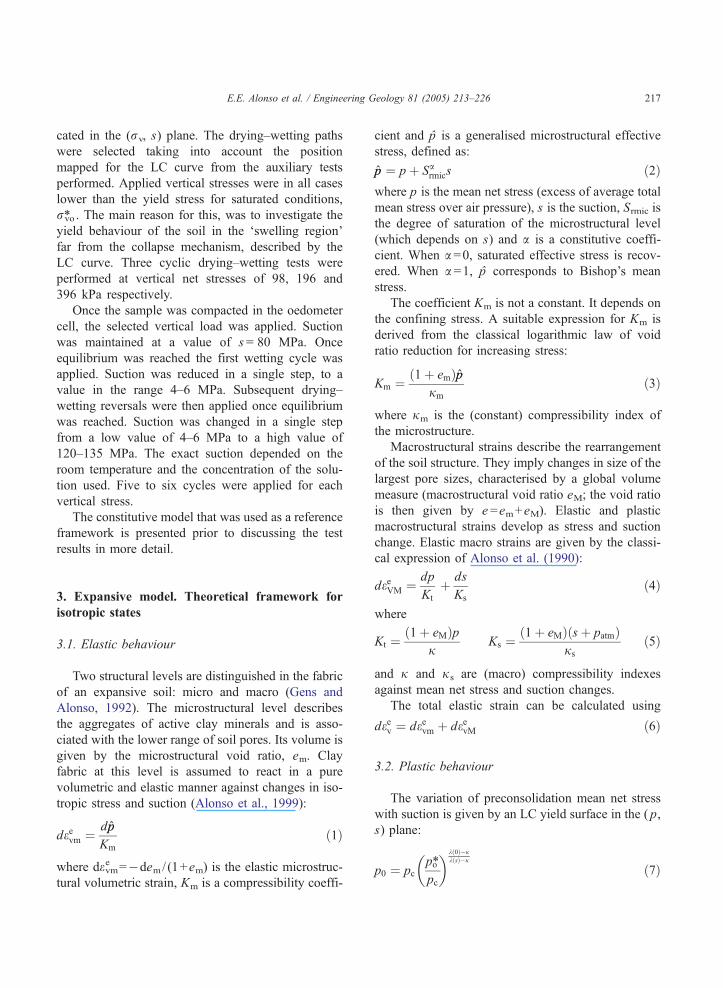
Fig. 5. Experimental setup of vapour equilibrium technique using a
forced convection system.
E.E. Alonso et al. / Engineering Geology 81 (2005) 213–226216
by means of the migration of water molecules through
the vapour phase from a reference system of known
potential and mass to the soil pores, until hydro-
mechanical equilibrium was achieved. The relative
humidity of the reference system was controlled by
varying the chemical potential of different types of
aqueous solutions.
Non-volatile solutes (CuSO4) and volatile solutes
(acid solutions of H2S04) were used in the experimen-
tal programme. CuSO4 solutions were used under
saturated conditions of dissolution, which allowed
suctions ranging between 4 and 6 MPa to be attained.
This procedure was used for the wetting paths. On the
other hand, acid solutions were employed under par-
tially saturated conditions of dissolution. In this case, a
specified solute quantity was selected to achieve a
target relative humidity of 40% (suction of s =130
MPa), which was used in the drying paths. However,
the acid concentration was not fixed due to the fact that
the soil exchanged vapour on drying with the reference
system. A densimeter with a readability of 0.0005 Mg/
m3 was used to measure the equilibrated density of the
solution after each drying path and at the controlled
temperature of the laboratory. Fig. 4 shows the suction
achieved as a function of the acid solution density and
temperature. This plot is based on aqueous solution
properties and the psychrometric law, which translates
relative humidity values to suctions at a given tem-
perature (Fredlund and Rahardjo, 1993). In addition,
every new density was used to approximately deter-
mine, at a constant temperature, the amount of water
lost by the soil on drying. Further details of this
technique are presented in Romero (2001).
Each equalisation step was maintained until the
rate of straining had reduced to an axial strain rate
of 0.1%/day. Each drying–wetting step required a
typical duration of 12 days, which resulted in a total
test duration of approximately 4 months.
Fig. 5 shows the oedometer cell and the different
elements of the controlled-suction technique. A forced
convection system, driven by an air pump, was used
to transport the vapour from the reference solution
(desiccator in Fig. 5) to the soil pores. Mass
exchanges were monitored by weighing the desiccator
with an electronic balance with a resolution of 10 mg.
Two procedures were followed to transfer the vapour:
the vapour was either circulated along the boundaries
of the sample (top and bottom porous stones indicated
in Fig. 5) or it crossed the specimen. This last proce-
dure of vapour transport through the sample (valves A
and B closed, D and C open), which was used at low
degrees of saturation, is more efficient but it is limited
to soil states that present continuity of air. On the
other hand, at higher degrees of saturation, the alter-
native procedure was followed (valves A and C
closed, B and D open; or alternatively valves A, B
and C open and D closed).
2.3. Stress paths followed
The different stress paths followed in this test
programme are shown in Fig. 3 where tests are indi-
E.E. Alonso et al. / Engineering Geology 81 (2005) 213–226 217
cated in the (rv, s) plane. The drying–wetting paths
were selected taking into account the position
mapped for the LC curve from the auxiliary tests
performed. Applied vertical stresses were in all cases
lower than the yield stress for saturated conditions,
rvo* . The main reason for this, was to investigate the
yield behaviour of the soil in the dswelling regionTfar from the collapse mechanism, described by the
LC curve. Three cyclic drying–wetting tests were
performed at vertical net stresses of 98, 196 and
396 kPa respectively.
Once the sample was compacted in the oedometer
cell, the selected vertical load was applied. Suction
was maintained at a value of s = 80 MPa. Once
equilibrium was reached the first wetting cycle was
applied. Suction was reduced in a single step, to a
value in the range 4–6 MPa. Subsequent drying–
wetting reversals were then applied once equilibrium
was reached. Suction was changed in a single step
from a low value of 4–6 MPa to a high value of
120–135 MPa. The exact suction depended on the
room temperature and the concentration of the solu-
tion used. Five to six cycles were applied for each
vertical stress.
The constitutive model that was used as a reference
framework is presented prior to discussing the test
results in more detail.
3. Expansive model. Theoretical framework for
isotropic states
3.1. Elastic behaviour
Two structural levels are distinguished in the fabric
of an expansive soil: micro and macro (Gens and
Alonso, 1992). The microstructural level describes
the aggregates of active clay minerals and is asso-
ciated with the lower range of soil pores. Its volume is
given by the microstructural void ratio, em. Clay
fabric at this level is assumed to react in a pure
volumetric and elastic manner against changes in iso-
tropic stress and suction (Alonso et al., 1999):
deevm ¼ dpp
Km
ð1Þ
where devme =�dem/ (1+em) is the elastic microstruc-
tural volumetric strain, Km is a compressibility coeffi-
cient and p is a generalised microstructural effective
stress, defined as:
pp ¼ pþ Sarmics ð2Þ
where p is the mean net stress (excess of average total
mean stress over air pressure), s is the suction, Srmic is
the degree of saturation of the microstructural level
(which depends on s) and a is a constitutive coeffi-
cient. When a =0, saturated effective stress is recov-
ered. When a =1, p corresponds to Bishop’s mean
stress.
The coefficient Km is not a constant. It depends on
the confining stress. A suitable expression for Km is
derived from the classical logarithmic law of void
ratio reduction for increasing stress:
Km ¼ 1þ emð Þppjm
ð3Þ
where jm is the (constant) compressibility index of
the microstructure.
Macrostructural strains describe the rearrangement
of the soil structure. They imply changes in size of the
largest pore sizes, characterised by a global volume
measure (macrostructural void ratio eM; the void ratio
is then given by e =em+eM). Elastic and plastic
macrostructural strains develop as stress and suction
change. Elastic macro strains are given by the classi-
cal expression of Alonso et al. (1990):
deeVM ¼ dp
Kt
þ ds
Ks
ð4Þ
where
Kt ¼1þ eMð Þp
jKs ¼
1þ eMð Þ sþ patmð Þjs
ð5Þ
and j and js are (macro) compressibility indexes
against mean net stress and suction changes.
The total elastic strain can be calculated using
deev ¼ deevm þ deevM ð6Þ
3.2. Plastic behaviour
The variation of preconsolidation mean net stress
with suction is given by an LC yield surface in the ( p,
s) plane:
p0 ¼ pcp*o
pc
� �k 0ð Þ�jk sð Þ�j
ð7Þ
E.E. Alonso et al. / Engineering Geology 81 (2005) 213–226218
with
k sð Þ ¼ k 0ð Þ r þ 1� rð Þe�bs� �
ð8Þwhere p*o is the saturated preconsolidation mean net
stress, pc is a reference stress, k(0) is the slope of the vir-gin compression line and (r, b) are model parameters.
Eq. (7) describes the yield conditions of the macro-
structure. Experimental evidence, reported in the
Introduction of this paper, indicates that wetting and
drying paths are also capable of inducing plastic
strains. These plastic strains have their origin in the
underlying microstructural deformations but, as
reported previously, they seem to be controlled also
by the applied confining stress and by the density
(alternatively, the intensity of compaction) of the
material. The model describes the plastic straining
by means of two additional yield curves (SI and SD,
associated with suction increase and suction decrease,
respectively), which are represented in Fig. 6. These
yield curves are defined by the expressions p� sI=0
for the SI yield curve and p� sD=0 for the SD yield
curve; sI, sD being the hardening parameters.
When SI and SD yield curves are activated, plastic
strains are induced, which in view of the above consid-
erations have been given the following expressions:
depvM ¼ fI deevm ð9Þ
depvM ¼ fD deevm ð10Þ
fI and fD are micro–macro coupling functions which
are made dependent on ( p/p0), p0 being the current
Microstructural shrinkage
Microstructural swelling
Macrostructural
void ratio plastic
increase
Macrostructural void ratio
plastic decrease
p
sLC
SI
MIC
RO
ST
RU
CT
UR
E
MA
CR
OS
TRU
CT
UR
E
Elasticdomain
NLSD
Current stress state C
Fig. 6. Yield loci of expansive model.
preconsolidation stress at the current value of suc-
tion, as given by the LC yield curve. The nature of
these coupling functions will be discussed later when
the experimental results are analysed.
It was also assumed that SI and SD hardening is
governed by da1=depvSI+de
pvSD, although a depen-
dence on plastic strains induced by LC plastic loading
may be suspected. LC hardening is assumed to depend
on da2=depvSI+de
pvSD+de
pvLC, where de
pvLC is the volu-
metric plastic strain due to the activation of LC. Hard-
ening laws are defined as follows (Alonso et al., 1999):
dsI ¼Kmda1
f¼ dsD ð11Þ
dpT0pT0
¼ 1þ eMð Þda2k 0ð Þ � j
ð12Þ
In Eq. (11) the function f is either fI or fD depend-
ing on whether yielding is occurring on the SI or SD
curve.
4. Test results and interpretation
4.1. Complementary tests
In the remainder of the paper, the mean net stress p
in the model will be replaced by the applied vertical
net stress rv. Since horizontal stresses were not mea-
sured, application of a generalised model would not
lead to significant advantages over the simpler
approach adopted.
The swelling pressure test provides direct infor-
mation on the value of the saturated preconsolidation
stress rvo* and on the shape of the LC yield locus of
the macrostructure. Gens and Alonso (1992) showed
that the maximum swelling pressure is slightly above
the current yield stress for the prevailing suction. In
addition, the swelling pressure path for lower suction
values follows approximately the LC yield curve.
The recorded data given in Fig. 2 has been used to
plot the swelling pressure path in a (rv, s) stress
plane. Measured degrees of saturation (or alterna-
tively, water content w) were related to suction
through the following empirical relationship found
by Villar (1995) for the water retention curve of the
FEBEX bentonite:
w ¼ 36� 5:5ln sð Þ;w in % and s in MPa ð13Þ
0.0 0.2 0.4 0.6 0.8 1.0 1.2
Vertical net stress, σV (MPa)
1
10
100
Suc
tion,
s (M
Pa)
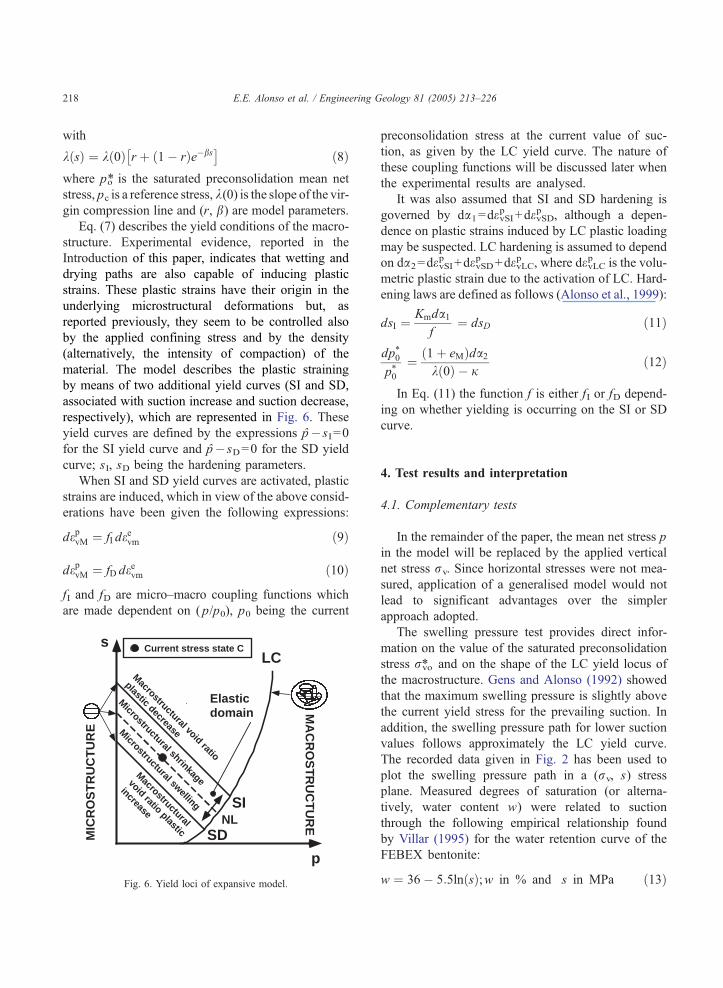
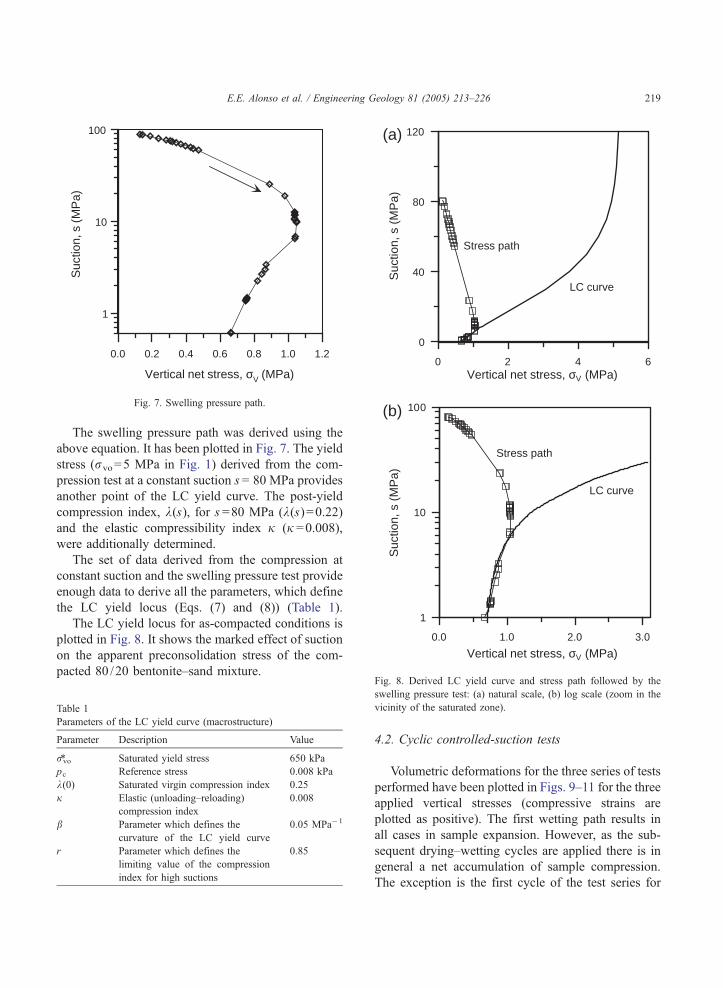
Fig. 7. Swelling pressure path.
0 2 4 6Vertical net stress, σV (MPa)
Vertical net stress, σV (MPa)
0
40
80
120
Suc
tion,
s (
MP
a)
0.0 1.0 2.0 3.0
1
10
100S
uctio
n, s
(M
Pa)
LC curve
Stress path
Stress path
LC curve
(a)
(b)
E.E. Alonso et al. / Engineering Geology 81 (2005) 213–226 219
The swelling pressure path was derived using the
above equation. It has been plotted in Fig. 7. The yield
stress (rvo=5 MPa in Fig. 1) derived from the com-
pression test at a constant suction s = 80 MPa provides
another point of the LC yield curve. The post-yield
compression index, k(s), for s =80 MPa (k(s)=0.22)and the elastic compressibility index j (j =0.008),
were additionally determined.
The set of data derived from the compression at
constant suction and the swelling pressure test provide
enough data to derive all the parameters, which define
the LC yield locus (Eqs. (7) and (8)) (Table 1).
The LC yield locus for as-compacted conditions is
plotted in Fig. 8. It shows the marked effect of suction
on the apparent preconsolidation stress of the com-
pacted 80 /20 bentonite–sand mixture.
Table 1
Parameters of the LC yield curve (macrostructure)
Parameter Description Value
rvo* Saturated yield stress 650 kPa
pc Reference stress 0.008 kPa
k(0) Saturated virgin compression index 0.25
j Elastic (unloading–reloading)
compression index
0.008
b Parameter which defines the
curvature of the LC yield curve
0.05 MPa�1
r Parameter which defines the
limiting value of the compression
index for high suctions
0.85
Fig. 8. Derived LC yield curve and stress path followed by the
swelling pressure test: (a) natural scale, (b) log scale (zoom in the
vicinity of the saturated zone).
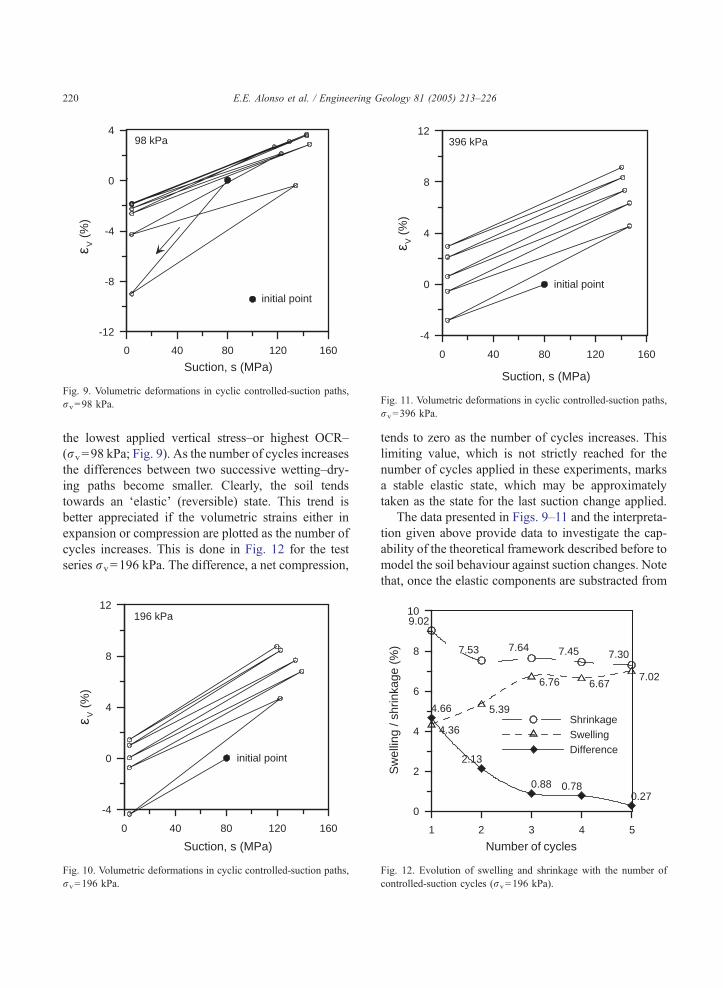
4.2. Cyclic controlled-suction tests
Volumetric deformations for the three series of tests
performed have been plotted in Figs. 9–11 for the three
applied vertical stresses (compressive strains are
plotted as positive). The first wetting path results in
all cases in sample expansion. However, as the sub-
sequent drying–wetting cycles are applied there is in
general a net accumulation of sample compression.
The exception is the first cycle of the test series for
0 40 80 120 160
Suction, s (MPa)
-12
-8
-4
0
4
εV
(%)
98 kPa
initial point
Fig. 9. Volumetric deformations in cyclic controlled-suction paths,
rv=98 kPa.
0 40 80 120 160
Suction, s (MPa)
-4
0
4
8
12
εV (
%)
396 kPa
initial point
Fig. 11. Volumetric deformations in cyclic controlled-suction paths
rv=396 kPa.
E.E. Alonso et al. / Engineering Geology 81 (2005) 213–226220
the lowest applied vertical stress–or highest OCR–
(rv=98 kPa; Fig. 9). As the number of cycles increases
the differences between two successive wetting–dry-
ing paths become smaller. Clearly, the soil tends
towards an delasticT (reversible) state. This trend is
better appreciated if the volumetric strains either in
expansion or compression are plotted as the number of
cycles increases. This is done in Fig. 12 for the test
series rv=196 kPa. The difference, a net compression,
0 40 80 120 160
Suction, s (MPa)
-4
0
4
8
12
εV
(%
)
196 kPa
initial point
Fig. 10. Volumetric deformations in cyclic controlled-suction paths,
rv=196 kPa.
1 2 3 4 5
Number of cycles
0
2
4
6
8
10
Sw
ellin
g / s
hrin
kage
(%
)
9.02
7.53 7.64 7.45 7.30
4.36
5.39
6.76 6.677.02
4.66
2.13
0.88 0.780.27
ShrinkageSwellingDifference
Fig. 12. Evolution of swelling and shrinkage with the number of
controlled-suction cycles (rv=196 kPa).
,
tends to zero as the number of cycles increases. This
limiting value, which is not strictly reached for the
number of cycles applied in these experiments, marks
a stable elastic state, which may be approximately
taken as the state for the last suction change applied.
The data presented in Figs. 9–11 and the interpreta-
tion given above provide data to investigate the cap-
ability of the theoretical framework described before to
model the soil behaviour against suction changes. Note
that, once the elastic components are substracted from
0 100 200 300 400
Vertical net stress, σV (MPa)
0.024
0.028
0.032
0.036
0.040
κ m
exponential fitexperiment
Fig. 13. Elastic compression index for the last suction path applied.
E.E. Alonso et al. / Engineering Geology 81 (2005) 213–226 221
the total strains given in Figs. 9–11, plastic compo-
nents may be obtained and their evolution with the
applied suction cycles could be investigated. There-
fore, the evolution of the coupling functions as defined
in Eqs. (9) and (10) could be investigated. Before this
is done, however, some simplifications have been
introduced into the theoretical framework in order to
facilitate parameter determination.
4.3. Model simplification and parameter determination.
Micro–macro interaction
Since the elastoplastic model is formulated in dif-
ferential terms, the stress paths applied in experiments
should ideally be performed in small incremental steps.
However, in highly plastic expansive materials such as
the bentonite–sand mixtures, the time to equalize a
given suction or stress change is very large for the
typical size of the oedometer (or triaxial) specimen. If
the large suction changes applied had to be divided into
several steps the time length of these tests would have
been exceedingly large. On the other hand, the large
suction changes make it difficult to apply in a direct
manner, the constitutive relations presented before.
The number of couplings between different aspects
of behaviour also makes it difficult to adopt a simple
systematic procedure to derive model parameters.
Since this is always a desirable feature it was decided
to introduce some simplifications even if some model
capabilities are reduced.
Accordingly, the following simplifying assump-
tions were introduced:
– Microstructural deformations will be governed by
changes in saturated effective stress ( p+ s). This
assumption implies a fully saturated microstructure
Srmic=1 and eliminates the need to introduce the
water retention curve and the parameter a (Sarmic=1
in Eq. (2)).
– Suction-induced elastic deformations are consid-
ered only as microstructural deformations, i.e.
any suction-induced macrostructural elastic defor-
mations are ignored (js=0 in Eq. (5)).
– It will be assumed that the SI and SD yield surfaces
are always activated as suction changes during the
application of drying–wetting cycles. In other
words, the elastic region bounded by SI and SD
is assumed to be negligible (sI = sD in Fig. 6). This
assumption facilitates the computation of plastic
strains.
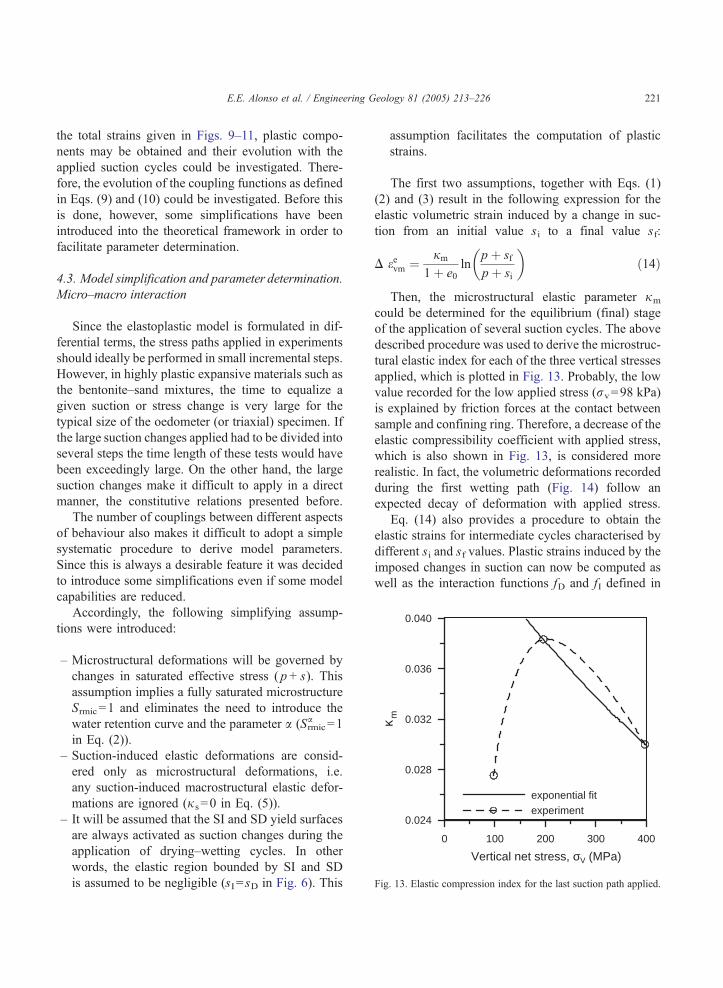
The first two assumptions, together with Eqs. (1)
(2) and (3) result in the following expression for the
elastic volumetric strain induced by a change in suc-
tion from an initial value si to a final value sf:
D eevm ¼ jm
1þ e0ln
pþ sf
pþ si
� �ð14Þ
Then, the microstructural elastic parameter jm
could be determined for the equilibrium (final) stage
of the application of several suction cycles. The above
described procedure was used to derive the microstruc-
tural elastic index for each of the three vertical stresses
applied, which is plotted in Fig. 13. Probably, the low
value recorded for the low applied stress (rv=98 kPa)
is explained by friction forces at the contact between
sample and confining ring. Therefore, a decrease of the
elastic compressibility coefficient with applied stress,
which is also shown in Fig. 13, is considered more
realistic. In fact, the volumetric deformations recorded
during the first wetting path (Fig. 14) follow an
expected decay of deformation with applied stress.
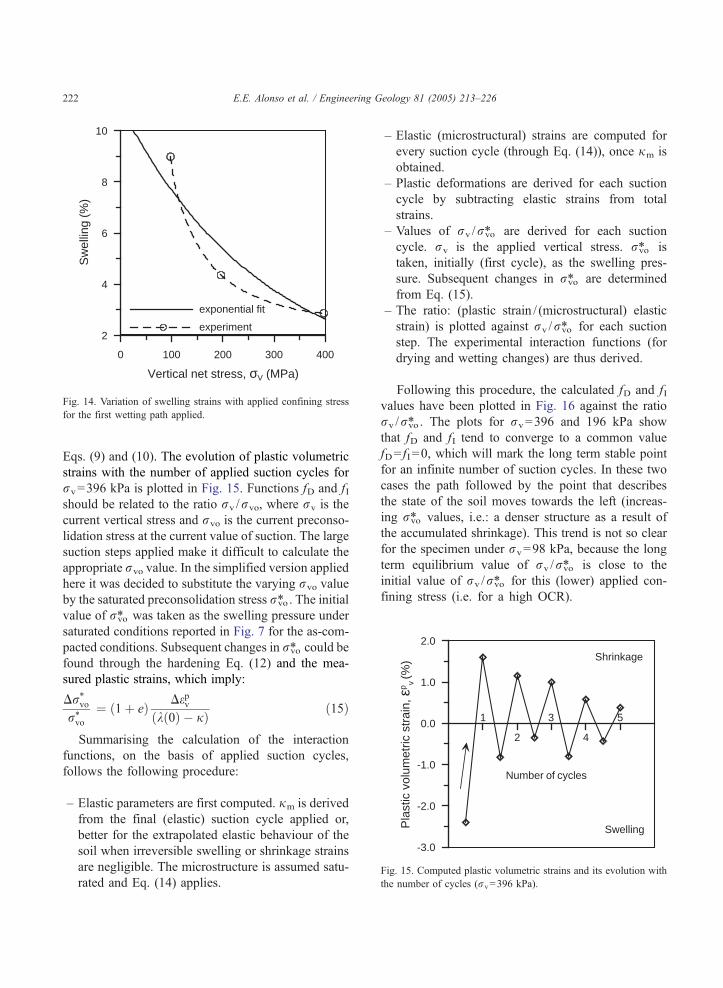
Eq. (14) also provides a procedure to obtain the
elastic strains for intermediate cycles characterised by
different si and sf values. Plastic strains induced by the
imposed changes in suction can now be computed as
well as the interaction functions fD and fI defined in
0 100 200 300 400
Vertical net stress, σV (MPa)
2
4
6
8
10
Sw
ellin
g (%
)
exponential fit
experiment
Fig. 14. Variation of swelling strains with applied confining stress
for the first wetting path applied.
2 4
1 3 5
Number of cycles
-3.0
-2.0
-1.0
0.0
1.0
2.0
Pla
stic
vol
umet
ric s
trai
n, ε
p v (%)
Swelling
Shrinkage
Fig. 15. Computed plastic volumetric strains and its evolution with
the number of cycles (rv=396 kPa).
E.E. Alonso et al. / Engineering Geology 81 (2005) 213–226222
Eqs. (9) and (10). The evolution of plastic volumetric
strains with the number of applied suction cycles for
rv=396 kPa is plotted in Fig. 15. Functions fD and fIshould be related to the ratio rv /rvo, where rv is the
current vertical stress and rvo is the current preconso-
lidation stress at the current value of suction. The large
suction steps applied make it difficult to calculate the
appropriate rvo value. In the simplified version applied
here it was decided to substitute the varying rvo value
by the saturated preconsolidation stress rvo* . The initial
value of rvo* was taken as the swelling pressure under
saturated conditions reported in Fig. 7 for the as-com-
pacted conditions. Subsequent changes in rvo* could be
found through the hardening Eq. (12) and the mea-
sured plastic strains, which imply:
DrTvo
rTvo
¼ 1þ eð Þ Depvk 0ð Þ � jð Þ ð15Þ
Summarising the calculation of the interaction
functions, on the basis of applied suction cycles,
follows the following procedure:
– Elastic parameters are first computed. jm is derived
from the final (elastic) suction cycle applied or,
better for the extrapolated elastic behaviour of the
soil when irreversible swelling or shrinkage strains
are negligible. The microstructure is assumed satu-
rated and Eq. (14) applies.
– Elastic (microstructural) strains are computed for
every suction cycle (through Eq. (14)), once jm is
obtained.
– Plastic deformations are derived for each suction
cycle by subtracting elastic strains from total
strains.
– Values of rv /rvo* are derived for each suction
cycle. rv is the applied vertical stress. rvo* is
taken, initially (first cycle), as the swelling pres-
sure. Subsequent changes in rvo* are determined
from Eq. (15).
– The ratio: (plastic strain / (microstructural) elastic
strain) is plotted against rv /rvo* for each suction
step. The experimental interaction functions (for
drying and wetting changes) are thus derived.
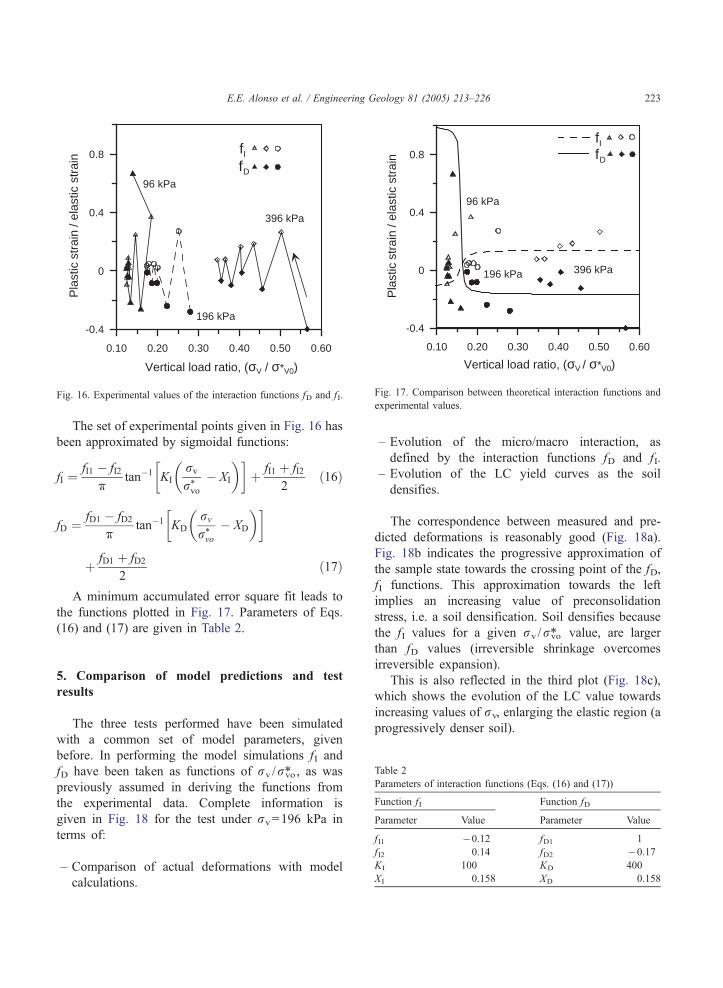
Following this procedure, the calculated fD and fIvalues have been plotted in Fig. 16 against the ratio
rv /rvo* . The plots for rv=396 and 196 kPa show
that fD and fI tend to converge to a common value
fD= fI =0, which will mark the long term stable point
for an infinite number of suction cycles. In these two
cases the path followed by the point that describes
the state of the soil moves towards the left (increas-
ing rvo* values, i.e.: a denser structure as a result of
the accumulated shrinkage). This trend is not so clear
for the specimen under rv=98 kPa, because the long
term equilibrium value of rv /rvo* is close to the
initial value of rv /rvo* for this (lower) applied con-
fining stress (i.e. for a high OCR).
0.10 0.20 0.30 0.40 0.50 0.60
Vertical load ratio, (σV / σ*V0)
-0.4
0
0.4
0.8
Pla
stic
str
ain
/ ela
stic
str
ain
396 kPa
96 kPa
196 kPa
fI
fD
Fig. 17. Comparison between theoretical interaction functions and
experimental values.
0.10 0.20 0.30 0.40 0.50 0.60
Vertical load ratio, (σV / σ*V0)
-0.4
0
0.4
0.8
Pla
stic
str
ain
/ ela
stic
str
ain
396 kPa
96 kPa
196 kPa
fI
fD
Fig. 16. Experimental values of the interaction functions fD and fI.
E.E. Alonso et al. / Engineering Geology 81 (2005) 213–226 223
The set of experimental points given in Fig. 16 has
been approximated by sigmoidal functions:
fI ¼fI1 � fI2
ktan�1 KI
rv
rTvo
� XI
� �� �þ fI1 þ fI2
2ð16Þ
fD ¼ fD1 � fD2
ktan�1 KD
rv
rTvo
� XD
� �� �
þ fD1 þ fD2
2ð17Þ
A minimum accumulated error square fit leads to
the functions plotted in Fig. 17. Parameters of Eqs.
(16) and (17) are given in Table 2.
Table 2
Parameters of interaction functions (Eqs. (16) and (17))
Function fI Function fD
Parameter Value Parameter Value
fI1 �0.12 fD1 1
fI2 0.14 fD2 �0.17
KI 100 KD 400
XI 0.158 XD 0.158
5. Comparison of model predictions and test
results
The three tests performed have been simulated
with a common set of model parameters, given
before. In performing the model simulations fI and
fD have been taken as functions of rv /rvo* , as was
previously assumed in deriving the functions from
the experimental data. Complete information is
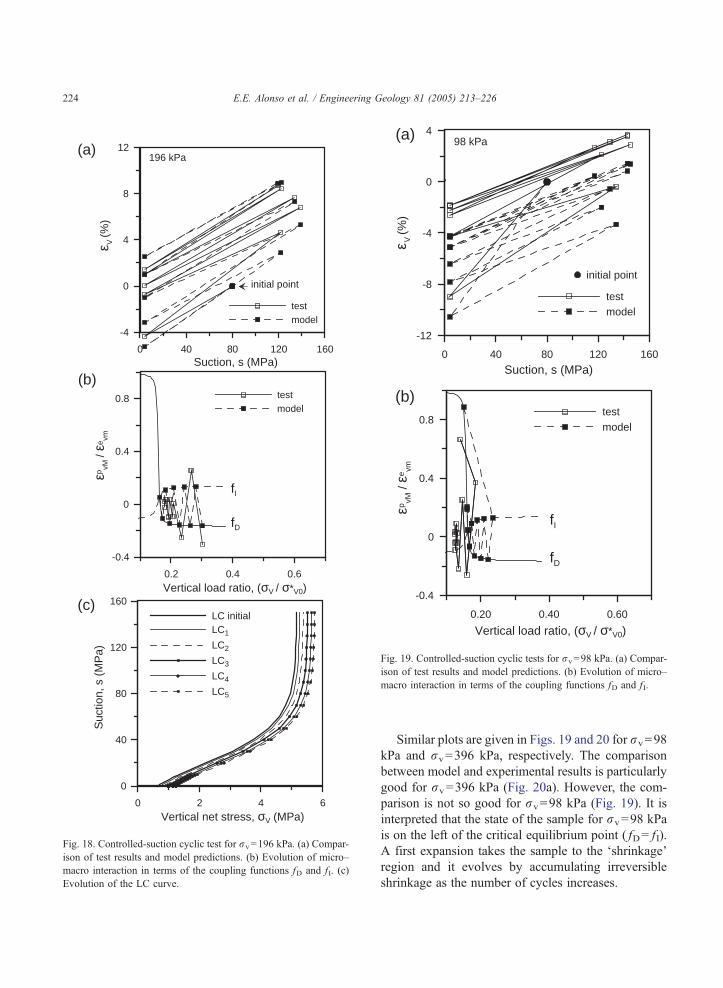
given in Fig. 18 for the test under rv=196 kPa in
terms of:
– Comparison of actual deformations with model
calculations.
– Evolution of the micro/macro interaction, as
defined by the interaction functions fD and fI.
– Evolution of the LC yield curves as the soil
densifies.
The correspondence between measured and pre-
dicted deformations is reasonably good (Fig. 18a).
Fig. 18b indicates the progressive approximation of
the sample state towards the crossing point of the fD,
fI functions. This approximation towards the left
implies an increasing value of preconsolidation
stress, i.e. a soil densification. Soil densifies because
the fI values for a given rv /rvo* value, are larger
than fD values (irreversible shrinkage overcomes
irreversible expansion).
This is also reflected in the third plot (Fig. 18c),
which shows the evolution of the LC value towards
increasing values of rv, enlarging the elastic region (a
progressively denser soil).
0.20 0.40 0.60
Vertical load ratio, (σV / σ*V0)
-0.4
0
0.4
0.8
εp vM
/ εe
vmtestmodel
0 40 80 120 160
Suction, s (MPa)
-12
-8
-4
0
4
εV
(%)
testmodel
98 kPa
fI
fD
(a)
(b)
initial point
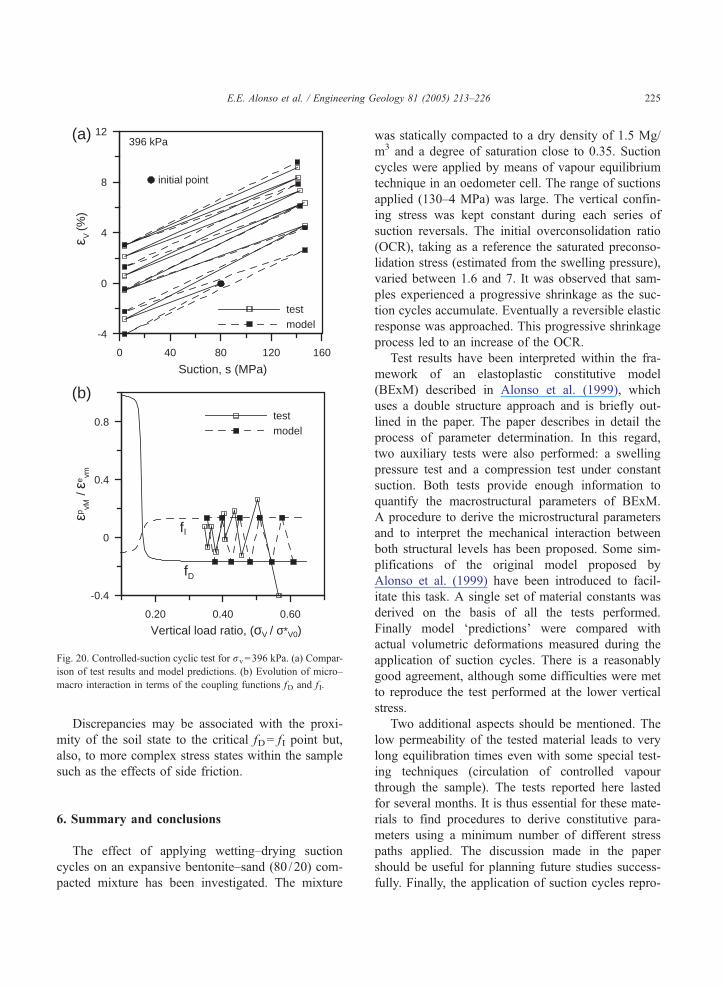
Fig. 19. Controlled-suction cyclic tests for rv=98 kPa. (a) Compar-
ison of test results and model predictions. (b) Evolution of micro–
macro interaction in terms of the coupling functions fD and fI.
0.2 0.4 0.6Vertical load ratio, (σV / σ*V0)
-0.4
0
0.4
0.8
εp vM
/ εe
vm
testmodel
0 40 80 120 160Suction, s (MPa)
-4
0
4
8
12
εV
(%)
testmodel
196 kPa
fI
fD
(a)
(b)
initial point
0 2 4 6Vertical net stress, σV (MPa)
0
40
80
120
160
Suc
tion,
s (
MP
a)
LC initialLC1
LC2
LC3
LC4
LC5
(c)
Fig. 18. Controlled-suction cyclic test for rv=196 kPa. (a) Compar-
ison of test results and model predictions. (b) Evolution of micro–
macro interaction in terms of the coupling functions fD and fI. (c)
Evolution of the LC curve.
E.E. Alonso et al. / Engineering Geology 81 (2005) 213–226224
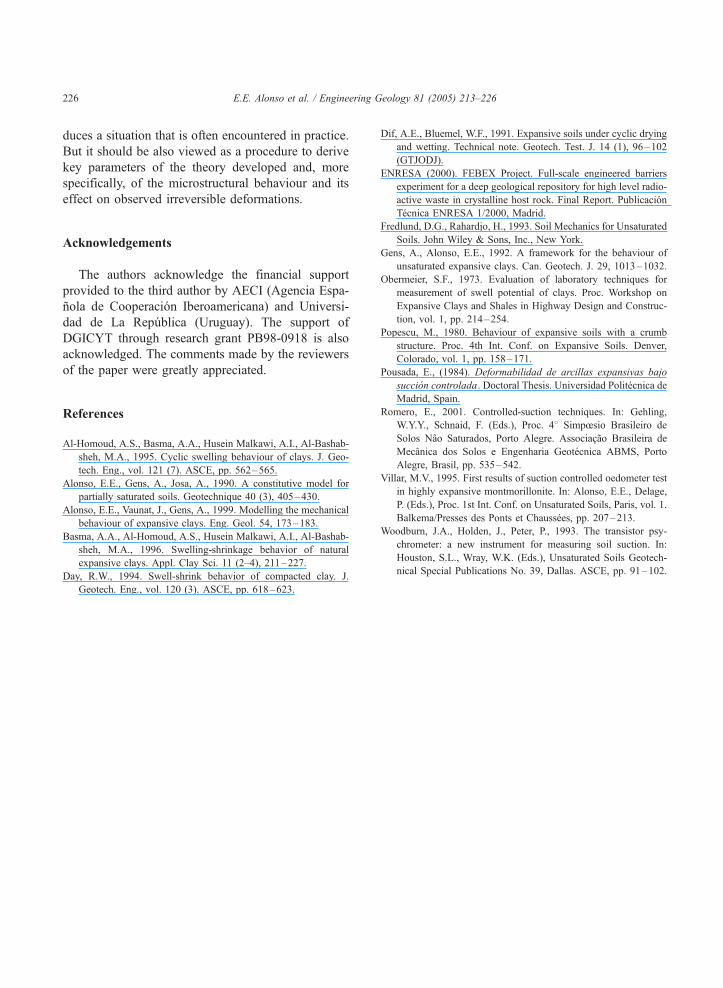
Similar plots are given in Figs. 19 and 20 for rv=98
kPa and rv=396 kPa, respectively. The comparison
between model and experimental results is particularly
good for rv=396 kPa (Fig. 20a). However, the com-
parison is not so good for rv=98 kPa (Fig. 19). It is
interpreted that the state of the sample for rv=98 kPa
is on the left of the critical equilibrium point ( fD=fI).
A first expansion takes the sample to the dshrinkageTregion and it evolves by accumulating irreversible
shrinkage as the number of cycles increases.
0.20 0.40 0.60
Vertical load ratio, (σV / σ*V0)
-0.4
0
0.4
0.8
εp vM
/ ε
e vm
testmodel
0 40 80 120 160
Suction, s (MPa)
-4
0
4
8
12
εV
(%)
testmodel
396 kPa
fD
(a)
(b)
initial point
fI
Fig. 20. Controlled-suction cyclic test for rv=396 kPa. (a) Compar-
ison of test results and model predictions. (b) Evolution of micro–
macro interaction in terms of the coupling functions fD and fI.
E.E. Alonso et al. / Engineering Geology 81 (2005) 213–226 225
Discrepancies may be associated with the proxi-
mity of the soil state to the critical fD= fI point but,
also, to more complex stress states within the sample
such as the effects of side friction.
6. Summary and conclusions
The effect of applying wetting–drying suction
cycles on an expansive bentonite–sand (80 /20) com-
pacted mixture has been investigated. The mixture
was statically compacted to a dry density of 1.5 Mg/
m3 and a degree of saturation close to 0.35. Suction
cycles were applied by means of vapour equilibrium
technique in an oedometer cell. The range of suctions
applied (130–4 MPa) was large. The vertical confin-
ing stress was kept constant during each series of
suction reversals. The initial overconsolidation ratio
(OCR), taking as a reference the saturated preconso-
lidation stress (estimated from the swelling pressure),
varied between 1.6 and 7. It was observed that sam-
ples experienced a progressive shrinkage as the suc-
tion cycles accumulate. Eventually a reversible elastic
response was approached. This progressive shrinkage
process led to an increase of the OCR.
Test results have been interpreted within the fra-
mework of an elastoplastic constitutive model
(BExM) described in Alonso et al. (1999), which
uses a double structure approach and is briefly out-
lined in the paper. The paper describes in detail the
process of parameter determination. In this regard,
two auxiliary tests were also performed: a swelling
pressure test and a compression test under constant
suction. Both tests provide enough information to
quantify the macrostructural parameters of BExM.
A procedure to derive the microstructural parameters
and to interpret the mechanical interaction between
both structural levels has been proposed. Some sim-
plifications of the original model proposed by
Alonso et al. (1999) have been introduced to facil-
itate this task. A single set of material constants was
derived on the basis of all the tests performed.
Finally model dpredictionsT were compared with
actual volumetric deformations measured during the
application of suction cycles. There is a reasonably
good agreement, although some difficulties were met
to reproduce the test performed at the lower vertical
stress.
Two additional aspects should be mentioned. The
low permeability of the tested material leads to very
long equilibration times even with some special test-
ing techniques (circulation of controlled vapour
through the sample). The tests reported here lasted
for several months. It is thus essential for these mate-
rials to find procedures to derive constitutive para-
meters using a minimum number of different stress
paths applied. The discussion made in the paper
should be useful for planning future studies success-
fully. Finally, the application of suction cycles repro-
E.E. Alonso et al. / Engineering Geology 81 (2005) 213–226226
duces a situation that is often encountered in practice.
But it should be also viewed as a procedure to derive
key parameters of the theory developed and, more
specifically, of the microstructural behaviour and its
effect on observed irreversible deformations.
Acknowledgements
The authors acknowledge the financial support
provided to the third author by AECI (Agencia Espa-
nola de Cooperacion Iberoamericana) and Universi-
dad de La Republica (Uruguay). The support of
DGICYT through research grant PB98-0918 is also
acknowledged. The comments made by the reviewers
of the paper were greatly appreciated.
References
Al-Homoud, A.S., Basma, A.A., Husein Malkawi, A.I., Al-Bashab-
sheh, M.A., 1995. Cyclic swelling behaviour of clays. J. Geo-
tech. Eng., vol. 121 (7). ASCE, pp. 562–565.
Alonso, E.E., Gens, A., Josa, A., 1990. A constitutive model for
partially saturated soils. Geotechnique 40 (3), 405–430.
Alonso, E.E., Vaunat, J., Gens, A., 1999. Modelling the mechanical
behaviour of expansive clays. Eng. Geol. 54, 173–183.
Basma, A.A., Al-Homoud, A.S., Husein Malkawi, A.I., Al-Bashab-
sheh, M.A., 1996. Swelling-shrinkage behavior of natural
expansive clays. Appl. Clay Sci. 11 (2–4), 211–227.
Day, R.W., 1994. Swell-shrink behavior of compacted clay. J.
Geotech. Eng., vol. 120 (3). ASCE, pp. 618–623.
Dif, A.E., Bluemel, W.F., 1991. Expansive soils under cyclic drying
and wetting. Technical note. Geotech. Test. J. 14 (1), 96–102
(GTJODJ).
ENRESA (2000). FEBEX Project. Full-scale engineered barriers
experiment for a deep geological repository for high level radio-
active waste in crystalline host rock. Final Report. Publicacion
Tecnica ENRESA 1/2000, Madrid.
Fredlund, D.G., Rahardjo, H., 1993. Soil Mechanics for Unsaturated
Soils. John Wiley & Sons, Inc., New York.
Gens, A., Alonso, E.E., 1992. A framework for the behaviour of
unsaturated expansive clays. Can. Geotech. J. 29, 1013–1032.
Obermeier, S.F., 1973. Evaluation of laboratory techniques for
measurement of swell potential of clays. Proc. Workshop on
Expansive Clays and Shales in Highway Design and Construc-
tion, vol. 1, pp. 214–254.
Popescu, M., 1980. Behaviour of expansive soils with a crumb
structure. Proc. 4th Int. Conf. on Expansive Soils. Denver,
Colorado, vol. 1, pp. 158–171.
Pousada, E., (1984). Deformabilidad de arcillas expansivas bajo
succion controlada. Doctoral Thesis. Universidad Politecnica de
Madrid, Spain.
Romero, E., 2001. Controlled-suction techniques. In: Gehling,
W.Y.Y., Schnaid, F. (Eds.), Proc. 48 Simpœsio Brasileiro de
Solos Nao Saturados, Porto Alegre. Associacao Brasileira de
Mecanica dos Solos e Engenharia Geotecnica ABMS, Porto
Alegre, Brasil, pp. 535–542.
Villar, M.V., 1995. First results of suction controlled oedometer test
in highly expansive montmorillonite. In: Alonso, E.E., Delage,
P. (Eds.), Proc. 1st Int. Conf. on Unsaturated Soils, Paris, vol. 1.
Balkema/Presses des Ponts et Chaussees, pp. 207–213.
Woodburn, J.A., Holden, J., Peter, P., 1993. The transistor psy-
chrometer: a new instrument for measuring soil suction. In:
Houston, S.L., Wray, W.K. (Eds.), Unsaturated Soils Geotech-
nical Special Publications No. 39, Dallas. ASCE, pp. 91–102.