UNIVERSITY OF JYVÄSKYLÄ X-ray tomographic study of wetting bentonite Tero Harjupatana Department of Physics, University of Jyväskylä BOA seminar 19.8.2014

Welcome message from author
This document is posted to help you gain knowledge. Please leave a comment to let me know what you think about it! Share it to your friends and learn new things together.
Transcript
UNIVERSITY OF JYVÄSKYLÄ
X-ray tomographic studyof wetting bentonite
Tero HarjupatanaDepartment of Physics, University of Jyväskylä
BOA seminar 19.8.2014

Goal
To develop and apply experimental techniquesbased on X-ray tomography (CT) in order to
provide data for finding the relevanthydromechanical and transport properties ofwetting bentoniteprovide a data bank for validatinghydromechanical models of bentonite buffer
Utilize CT to measure water content of wettingand swelling bentonite in 3D as a function of time(4D imaging)
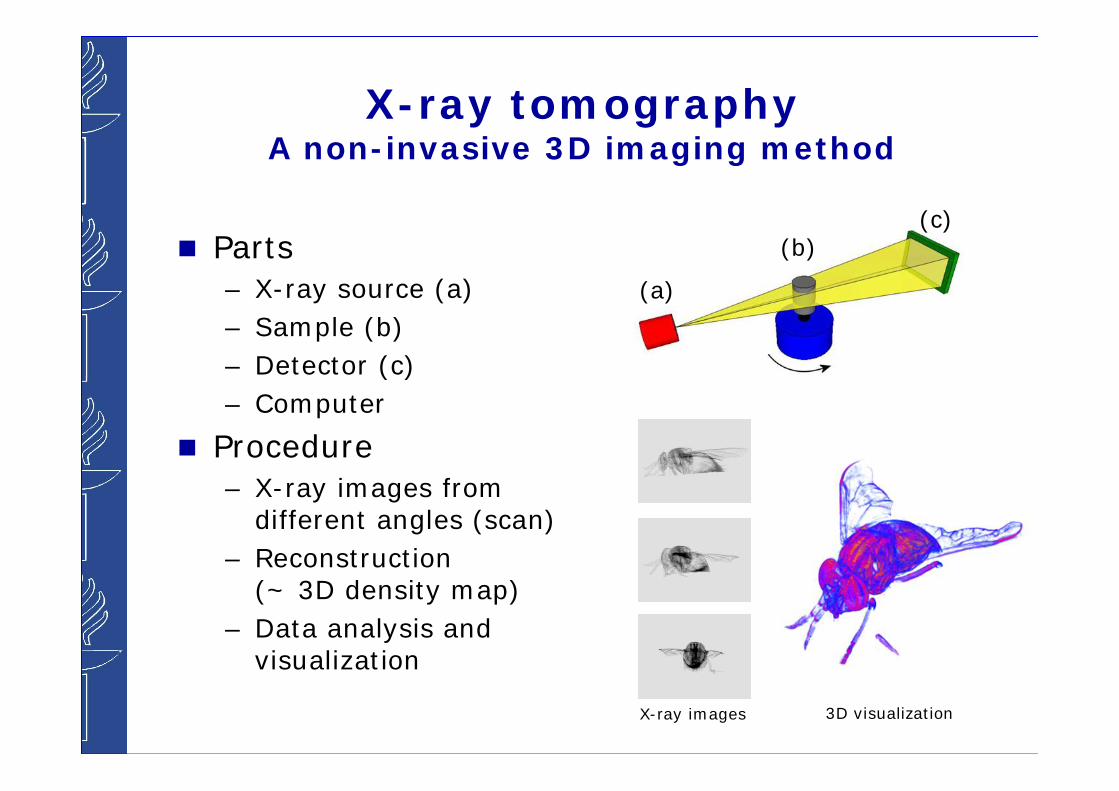
X-ray tomographyA non-invasive 3D imaging method
Parts– X-ray source (a)– Sample (b)– Detector (c)– Computer
Procedure– X-ray images from
different angles (scan)– Reconstruction
(~ 3D density map)– Data analysis and
visualization
(a)
(b)(c)
X-ray images 3D visualization
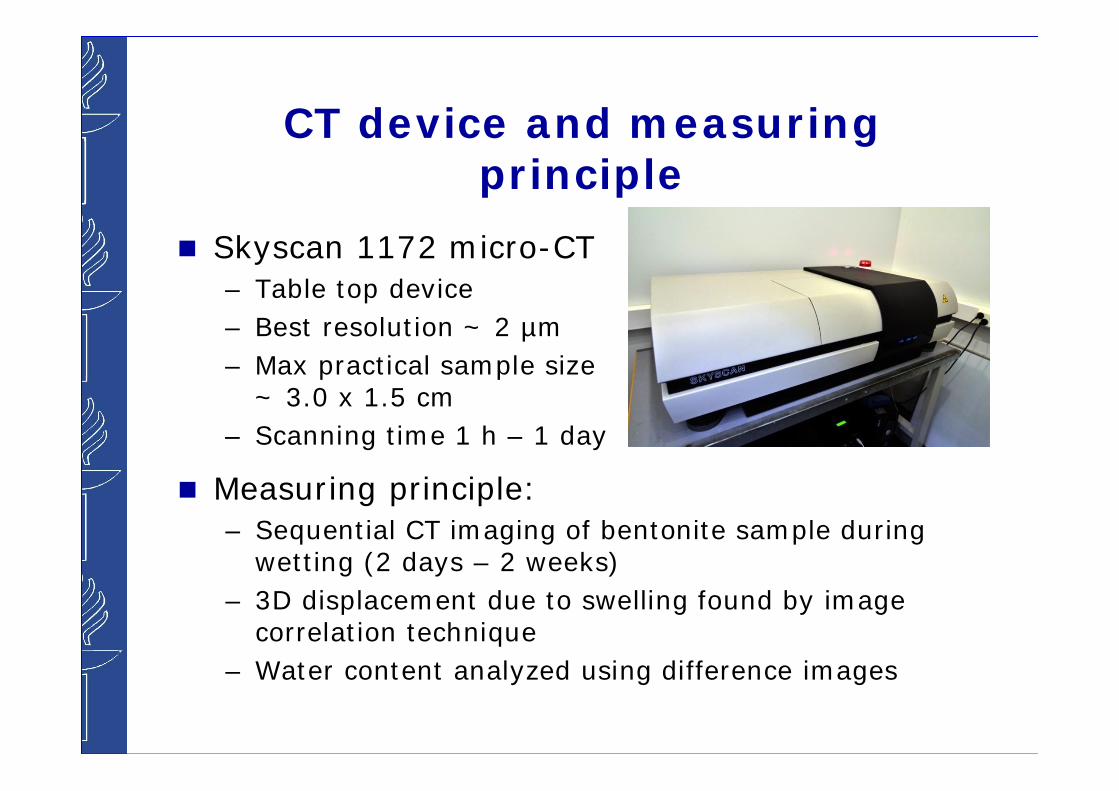
CT device and measuringprinciple
Skyscan 1172 micro-CT– Table top device– Best resolution ~ 2 µm– Max practical sample size
~ 3.0 x 1.5 cm– Scanning time 1 h – 1 day
Measuring principle:– Sequential CT imaging of bentonite sample during
wetting (2 days – 2 weeks)– 3D displacement due to swelling found by image
correlation technique– Water content analyzed using difference images

Requirements
StabilityOptimal selection ofmeasuring parametersCareful calibration andcompensation of imagingartefacts– Latest development: ”Dynamic
Flat-field correction”
Al plates withdifferent thicknessare used in DynamicFlat-field correction
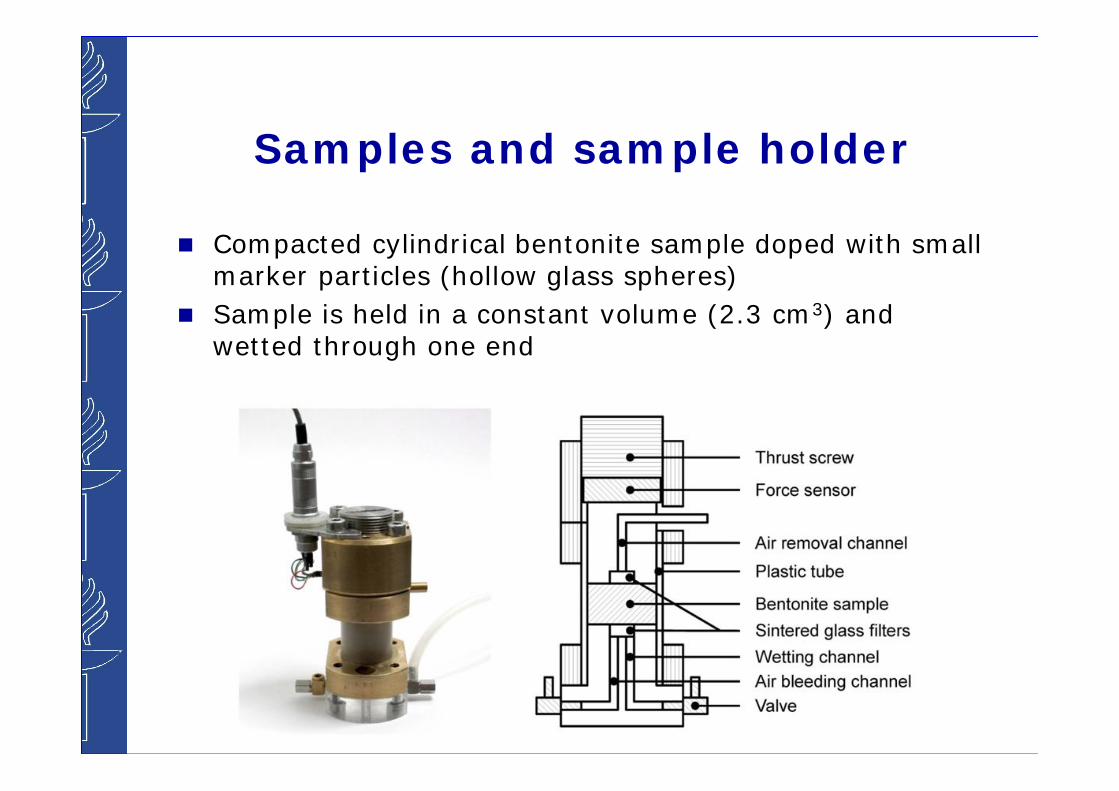
Samples and sample holder
Compacted cylindrical bentonite sample doped with smallmarker particles (hollow glass spheres)Sample is held in a constant volume (2.3 cm3) andwetted through one end

Measurement details
Reference scan of dry sampleWetting initiatedScans at appropriate times, typically 10 times in1-2 weeks. Duration of one scan ~ 45 minThe total mass of water in the sample isachieved by weighings
X-ray image Reconstructed slice 3D visualization
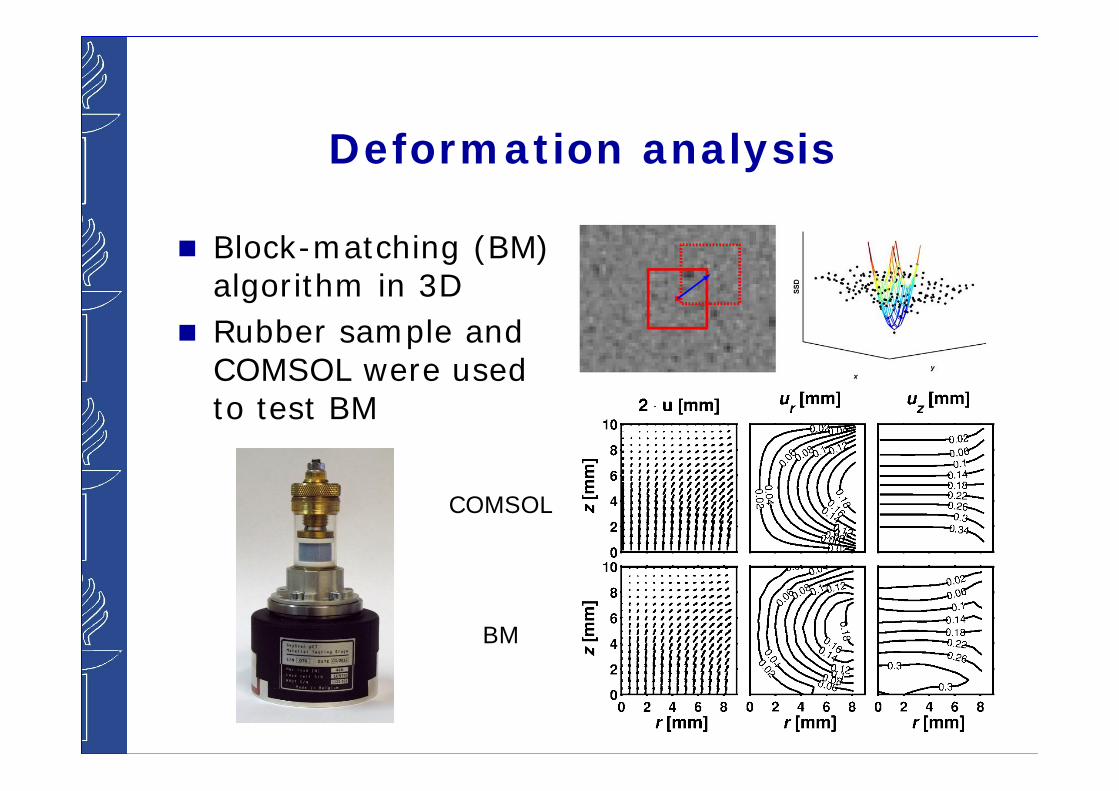
Deformation analysis
Block-matching (BM)algorithm in 3DRubber sample andCOMSOL were usedto test BM
COMSOL
BM
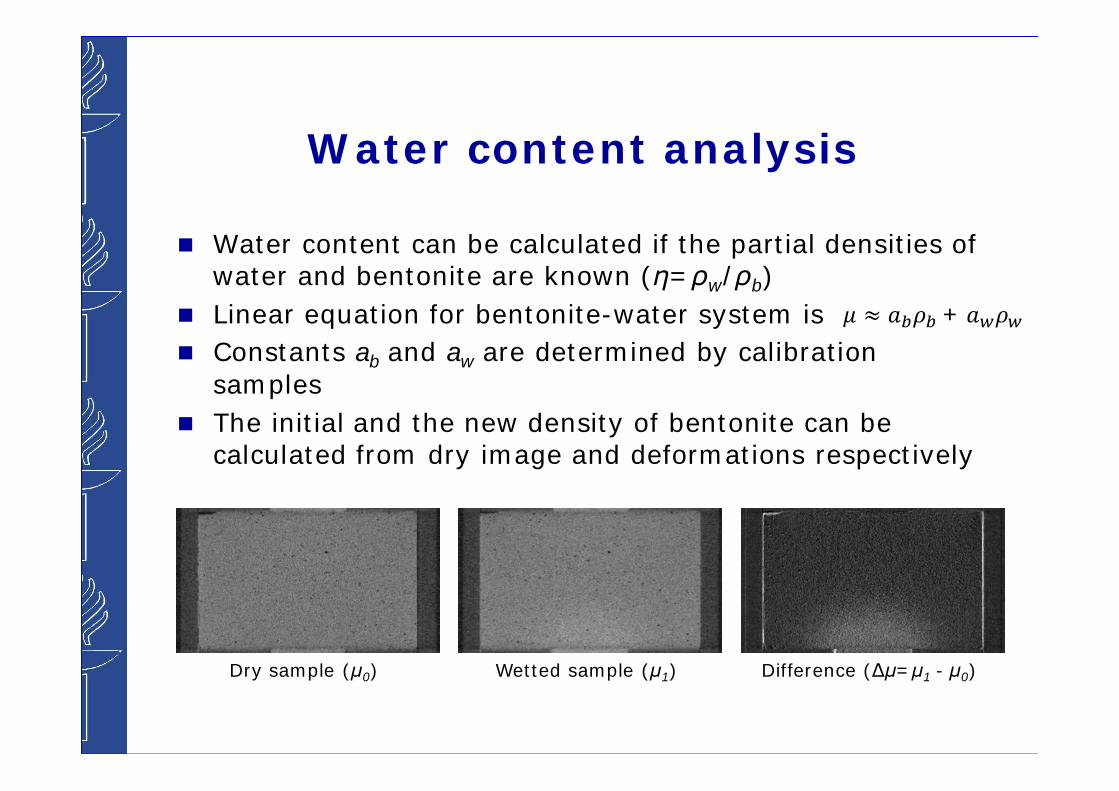
Water content analysis
Water content can be calculated if the partial densities ofwater and bentonite are known ( = w/ b)Linear equation for bentonite-water system isConstants ab and aw are determined by calibrationsamplesThe initial and the new density of bentonite can becalculated from dry image and deformations respectively
Dry sample ( 0) Wetted sample ( 1) Difference ( = 1 - 0)
+
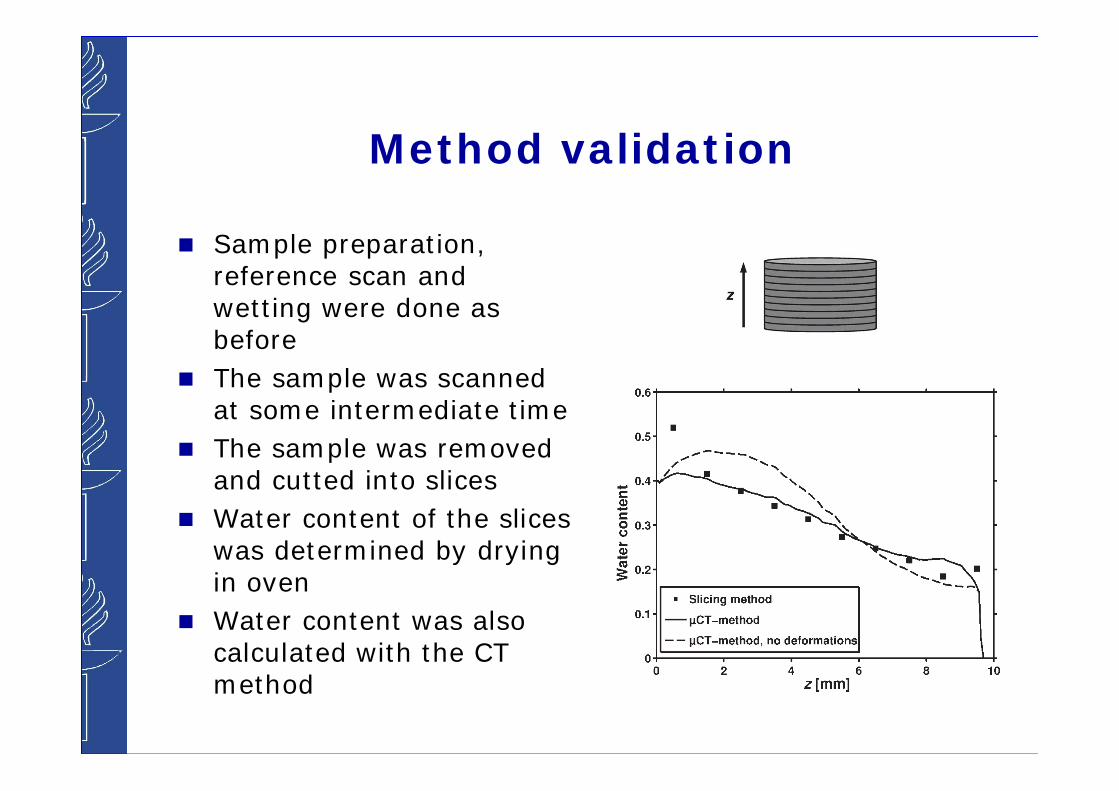
Method validation
Sample preparation,reference scan andwetting were done asbeforeThe sample was scannedat some intermediate timeThe sample was removedand cutted into slicesWater content of the sliceswas determined by dryingin ovenWater content was alsocalculated with the CTmethod

Water content and deformations
Water content

Water content in 1DW
ater
cont
ent[
%]
t [days]
Ideal diffusionMeasured water content

Swelling pressure
Bentonite: MP Biomedicals (purified)Dry density: 1.23 g/cm3
Water: Allard-pH-7 (TDS ~ 0.26 g/L)
Bentonite: CaMT (27 %), NaMT (73 %)Dry density: 1.31 g/cm3
Water: Posiva ref. 2 (TDS = 10 g/L)

Conclusions
4D X-ray tomographic imaging method formonitoring deformation and water transport inswelling bentonite completed (finally)The method allows measuring– 3D displacement field– 3D water content distribution ( b and w) and– swelling pressure from both ends
as a function of timeNext step: application to MX-80 bentonite

UNIVERSITY OF JYVÄSKYLÄ
Thank you

Effect of wetting pressure
Time [days]
Wat
erco
nten
t[%
]
Time [days]Pr
essu
re[k
Pa]
Related Documents