


Epigenetics in Gastric Cancer : Analysis of
Histone Post-translation Modifications and
Modifying Enzymes
By
Shafqat Ali Khan
[LIFE09200904010]
Tata Memorial Centre
Mumbai
A thesis submitted to the Board of Studies in Life Sciences
In partial fulfillment of requirements For the Degree of
DOCTOR OF PHILOSOPHY
Of
HOMI BHABHA NATIONAL INSTITUTE
December, 2015


List of Publications arising from the thesis
Published/ Accepted
Journals
Cell-type specificity of β-actin expression and its clinicopathological correlation in
gastric adenocarcinoma. Shafqat A Khan, Monica Tyagi, Ajit K Sharma, Savio G
Barreto, BhawnaSirohi, Mukta Ramadwar, Shailesh V Shrikhande, Sanjay Gupta..
World J Gastroenterol 2014 September 14; 20(34): 12202-12211
Global Histone Posttranslational Modifications and Cancer: Biomarkers for
Diagnosis, Treatment and Prognosis? Shafqat A Khan, Divya Velga Reddy, Sanjay
Gupta. World J Biol Chem. 2015 Nov 26;6(4):333-45
Book chapters
Techniques to Access Histone Modifications and Variants in Cancer. Monica Tyagi,
Shafqat A Khan, Saikat Bhattacharya, Divya Reddy, Ajit K Sharma, Bharat Khade,
Sanjay Gupta. Methods Mol Biol. 2015;1238:251-72
Under review / To be submitted
Journals
p38-MAPK/ MSK1 mediated regulation of histone H3 Serine 10 phosphorylation
defines distance dependent prognostic value of negative resection margin in gastric
cancer. Shafqat A Khan, R Amnekar, S G Barreto, M Ramadwar, S V Shrikhade, S
Gupta. To be submitted.
Combinatorial effect of HDAC inhibitors and DNA-targeted chemotherapeutic drugs
on gastric cancer cells. Shafqat A Khan, S G Barreto, M Ramadwar, S V Shrikhade,
S Gupta. To be submitted.
Conferences
Oral presentation in DBT-JRF Meet, November 21-22, 2013, ICT, Mumbai, India.
Title: β-actin expression in gastric cancer: cell type specificity and correlation with
clinicopathological parameters. Shafqat A Khan, Monica Tyagi, Ajit K Sharma, Savio
G Barreto, BhawnaSirohi, MuktaRamadwar, Shailesh V Shrikhande, Sanjay Gupta.

Poster presentation in Carcinogenesis-2015 on ‘Molecular Pathways to
Therapeutics: Paradigms and Challenges in Oncology’, February 11-13, 2015,
ACTREC, Navi Mumbai, India. Title: p38MAPK/ MSK1 pathway mediated increase
in histone H3Ser10 phosphorylation leads to poor prognosis in gastric cancer. S A
Khan, R Amnekar, B Khade, S G Barreto, M Ramadwar, S V Shrikhande, S Gupta.
Poster presentation in 5th
Meeting of Asian Forum of Chromosome and Chromatin
Biology on ‘Gene Networks in Chromatin/ Chromosome Function’, January 15-18,
2015, JNCASR, Bengaluru, India. Title: H3S10P, a new histone oncomodification
regulated through p38 MAPK/MSK1 pathway and correlates with clinicopathological
characteristics in gastric cancer. S A Khan, R Amnekar, B Khade, S G Barreto, M
Ramadwar, S V Shrikhande, S Gupta.
Poster presentation in Kestone symposia on ‘Chromatin Mechanisms and Cell
Physiology’, March 23-28, 2014, Oberstdorf, Germany. Title: H3S10
Phosphorylation: Regulation and Correlation with Clinicopathological Parameters in
Gastric Adenocarcinoma. S A Khan, A K Sharma, S G Barreto, B Sirohi, M
Ramadwar, S V Shrikhande, S Gupta.
Poster presentation in 4th
International Conference on Stem Cell and Cancer,October
19-22, 2013, Haffkine Institute, Mumbai, India. Title: HDAC Inhibitors Improve
Chemotherapy Response in Human Gastric Cell lines. Shafqat Ali Khan, Savio G
Barreto, BhawnaSirohi, Shailesh V Shrikhande, Sanjay Gupta.
Poster presentation in 4th
Meeting of Asian Forum of Chromosome and Chromatin
Biology on ‘Epigenetic Mechanisms in Development and Disease’, November 22-24,
2012, CCMB, Hyderabad, India. Title:Post-translational modifications of Histones
and their Clinical Implications in the Management of Gastric Cancer. Shafqat A
Khan, Ajit K Sharma, Savio G. Barreto, Bharat S Khade, MuktaRamadwar, Vivek G
Bhat, Shailesh V Shrikhande, Sanjay Gupta.

Others
Publications in Journals
MKP1 phosphatase mediates dephosphorylation of H3Serine10P during ionization
radiation induced DNA damage response in G1 phase of cell cycle. Ajit Kumar
Sharma, Shafqat A Khan, Asmita Sharda, Divya V Reddy, Sanjay Gupta. Mutat Res.
2015 Aug;778:71-9.
Expression of histone variant, H2A.1 is associated with the undifferentiated state of
hepatocyte. Monica Tyagi, Bharat Khade, Shafqat A Khan, Arvind Ingle and
Sanjay Gupta. Exp Biol Med (Maywood). 2014 Oct;239(10):1335-9.
Dynamic alteration in H3 Serine10 phosphorylation is G1-phase specific during IR-
induced DNA damage response in human cells. Ajit K. Sharma, Saikat
Bhattacharyya, Shafqat A. Khan, and Sanjay Gupta. Mutat Res. 2015 Mar;773:83-
91.

Dedicated
To
Ammi (Umm-e-Salma) and Abbu (Shoharat Ali Khan)
Acknowledgements
PhD is a great peregrination. I wish to take this opportunity to thank everyone who had
been instrumental in making this long journey a rewarding and truly an indelible one.
First and foremost, I would like to express my sincere gratitude to my mentor Dr. Sanjay
Gupta, for taking me to the world of epigenetics, his constant support throughout my PhD
tenure, his continuous guidance, critical analysis, and encouragement to make this thesis
a better one. Especially his approaches to solve any problem with a great ease was a
great lesson for my life.
I am thankful to Dr. S. V. Chiplunkar (Director, ACTREC), Dr. Rajiv Sarin (Ex-Director,
ACTREC) and Dr. Surekha Zingde (Ex-Deputy Director, ACTREC) for providing the
excellent infrastructure. I am honor-bound to DBT, India for my PhD fellowship. I am
thankful to TMC for funding my project. My sincere thanks to the funding agencies, Sam-
mystery and HBNI for supporting the international travel to present my work at an
international conference.
I am grateful to all my Doctoral Committee Chairpersons, Dr. Surekha Zingde
(Ex.Chairperson), Late Dr. Rajiv Kalraiya (Ex. Chairperson), Dr. S.V. Chiplunker and
members Dr. Shaiilesh V Srikhande, Dr. Manoj Mahimker, and Dr. Rukmini Goveker for
their important suggestions, encouragement, and cooperation towards the progress of my
work. A special thanks to Dr. S.V. Chiplunker who stepped in promptly as my chairperson
at the very last hour.
I extend my gratitude to the collaborators of my project, Dr. Shrikhande as a surgeon and
Dr. Mukta Ramadwar as pathologist for always taking time out of their busy schedule for
the histological diagnosis, and clinical inputs for the project. I also thank to all senior
residents of Gastrointestinal and Hepato-Pancreato-Biliary Service, Department of
Surgical Oncology and staff members of Tumor tissue repository (TTR), Tata Memorial
Hospital, for providing us with the gastric cancer tissue samples, patient clinical details,
follow-up data. Here, Dr. Manisha Kulkarni from TTR needs special mention for her
constant support at the time of tissue and related clinical data collection. My
acknowledgement will not be complete until the mention of Dr. Savio George Barreto, ex-
member surgeon of TMC, for his involvement at each and every step of my study from
the designing of the project to data analysis and manuscript writing; I thank you sir. I
would like to extend my sincerest thanks and appreciation to those patient souls who
helped me accomplish this study by agreeing to be a part of this study and making it
possible.
Thanks are also extended to all the members of our Gupta Lab cohort. I am thankful to
Bharat ji, Santosh ji and Arun ji for their excellent technical help. Special thanks to
Bharat for all his help with IHC and many other experiments. I thank all my colleagues,
Saikat, Divya, Asmita and Ram. Ram needs special thanks for all his support in some of
very last experiments. A special thanks to Dr. Ajit Kumar Sharma and Dr. Monica Tyagi

CONTENTS
Contents Page No.
SYNOPSIS 1-17
List of Figures 18
List of Table 19
Abbreviations 20-22
CHAPTER 1: Introduction 23-25
1.1 Background of the work 23
1.2 Layout of the Thesis 24
CHAPTER 2: Review of Literature 26-64
2.1 Stomach 26
2.1.1 Anatomy and histology of stomach 26
2.1.2 Stomach/ Gastric cancer 27
2.2 Classification of gastric cancer 28
2.2.1 Histological classification 28
2.2.1.1 Lauran’s classification 28
2.2.1.2 WHO classification 30
2.2.2 Anatomical Classification 31
2.3 Epidemiology of gastric cancer 32
2.3.1 Incidence 32
2.3.2 Mortality and survival 34
2.4 Risk factors and prevention of gastric cancer 35
2.4.1 Helicobacter pylori infection 35
2.4.2 Dietary factors 36
2.4.3 Tobacco and Alcohol 37
2.4.4 Obesity 37
2.4.5 Occupation 37
2.4.6 Genetic predisposition and sporadically occurring mutations 38
2.4.7 Other risk factors 39
2.5 Pathogenesis of gastric cancer 39
2.6 Diagnosis of gastric cancer 40

2.7 Treatment of gastric cancer 41
2.7.1 Surgery 41
2.7.2 Chemotherapy 42
2.7.3 Radiotherapy 43
2.7.4 Combination therapy 43
2.8 Epigenetics 43
2.8.1 Definition and mechanism of epigenetics 43
2.8.2 Chromatin 45
2.8.3 Histone post-translational modifications 45
2.8.3.1 Histone acetylation 48
2.8.3.2 Histone methylation 48
2.8.3.3 Histone phosphorylation 50
2.8.4 Cross-talk of histone post-translational modifications 50
2.9 Histone post-translational modifications in cancer 51
2.9.1 Dynamics of histone PTMs in cancer 51
2.9.2 Histone PTM in cancer diagnosis 52
2.9.3 Histone PTM in cancer prognosis 54
2.9.4 Histone PTM in cancer treatment 57
2.9.4.1 HAT/HDAC as the targets 57
2.9.4.2 HMT/HDM as the targets 63
2.9.4.3 Kinases/Phosphatases as the targets 64
CHAPTER 3: Aims and Objectives 65-67
3.1 Statement of the Problem 65
3.2 Hypothesis 65
3.3 Objectives 66
3.4 Experimental Plan 66
3.5 Work Done 67
CHAPTER 4: Materials and Methods 68-87
4.1 Tissue Samples and Clinical Data 68
4.1.1 Inclusion criteria and collection of tissue sample 68
4.1.2 Preparation of tissue section slides 69
4.1.3 Hematoxylin and eosin staining 69

4.1.4 Histopathological analysis 69
4.1.5 Collection of clinical data 70
4.2 Immunohistochemistry 70
4.2.1 Immunohistochemical staining 70
4.2.2 Scoring of Immunohistochemical staining 71
4.3 Cell Culture 72
4.3.1 Cell lines and culture conditions 72
4.3.2 Trypsinization and sub-culturing 72
4.3.3 Freezing down cells for liquid nitrogen stocks 73
4.3.4 Thawing cells from liquid nitrogen stocks 73
4.4 Genetic Manipulation 73
4.4.1 Cloning of MSK1 73
4.4.2 Transfection of MSK1 74
4.5 Biochemical Inhibition 74
4.5.1 Inhibition of MAP kinase pathway 74
4.5.2 Inhibition of HDACs 75
4.5.3 Chemotherapy drugs 75
4.6 Cell viability assay 75
4.6.1 Trypan blue exclusion assay 75
4.6.2 MTT assay 76
4.6.3 Colony formation assay 76
4.7 Cell cycle analysis 76
4.7.1 Cell cycle analysis of cell line by FACS 76
4.7.2 Cell cycle analysis of tissue samples by FACS 77
4.7.3 Mitotic index of tissue samples 77
4.8 Microscopy Analysis 77
4.8.1 Immunofluorescence microscopy 77
4.9 Gene Expression Analysis 78
4.9.1 RNA isolation from tissue samples 78
4.9.2 Agarose formaldehyde gel electrophoresis 78
4.9.3 c-DNA synthesis and Reverse transcription PCR 79
4.10 Protein Fractionation 80
4.10.1 Total protein lysate preparation from cell lines 80
4.10.2 Nucleo-cytosolic and chromatin fraction from cell lines 80
4.10.3 Nucleo-cytosolic and chromatin fraction from tissue
samples
80
4.10.4 Histones from cell line and tissue samples 81
4.11 Protein Estimation 81
4.11.1 Protein estimation by Lowry’s method 81
4.12 Polyacrylamide Gel Electrophoresis 81
4.12.1 Resolution of protein fractions by SDS-PAGE 81
4.12.2 Coomassie staining of SDS-PAGE gels 82
4.12.3 Ammoniacal Silver nitrate staining of SDS-PAGE gels 82
4.13 Western Blotting 83
4.13.1 Electroblotting from SDS-PAGE 83
4.13.2 Immunoblot detection 84
4.13.3 Densitometry analysis 84
4.14 Enzyme Activity Assay 85
4.14.1 HAT and HDAC activity assay 85
4.15 Drug and DNA Interaction Assay 85
4.15.1 Quantification of DNA bound chemotherapy drugs 85
4.16 Drug Combination Assay 86
4.16.1 MTT assay with fixed constant ratio 86
4.16.2 Fraction affected (FA) curve analysis 86
4.16.3 Median effect plot analysis 86
4.17 Statistical Analysis 87
4.17.1 Statistics for relative analysis 87
4.17.2 Statistics for clinical correlations 87
4.17.3 Statistics for survival analysis 87
CHAPTER 5: Histone H3 Serine 10 phosphorylation: Regulation and its correlation with clinico-pathological parameters in gastric cancer
88-106
5.1 Introduction 88
5.2 Results 90
5.2.1 Level of H3S10ph levels in tumor and resection margin
tissues
90
5.2.2 Correlation of H3S10ph levels of tumor, PRM and DRM
with clinicopathological variables
90
5.2.3 Correlation of H3S10ph levels of tumor and resection
margins with survival
92
5.2.4 Relation of H3S10ph levels of resection margins and their
distance from the site of tumor
94
5.2.5 Effect of resection margin distance on prognostic value of
H3S10ph
95
5.2.6 Association of increase of H3S10ph with phase of cell cycle
in GC
98
5.2.7MSK1 phosphorylates H3S10 through p38-MAPK pathway
in GC
100
5.3Discussion 102
CHAPTER 6: β-actin expression and its clinicopathological correlation in gastric adenocarcinoma
107-117
6.1 Introduction 107
6.2 Results 109
6.2.1 Overexpression of β-actin in tumor compared to normal
gastric tissue
109
6.2.2 Overexpression of β-actin in tumor tissue is predominantly
contributed by inflammatory cells
110
6.2.3 Correlation of β-actin expression with clinicopathological
parameters
112
6.3Discussion 115
CHAPTER 7: Global hypo-acetylation of histones: Combinatorial effect of HDAC inhibitors with DNA-targeted chemotherapeutic drugs on gastric cancer cell lines
118-134
7.1 Introduction 118
7.2 Results 120
7.2.1 Hypo-acetylation in GC associates with low HDAC activity 120
7.2.2 Dose response of chemotherapy drugs and HDAC inhibitors
on GC cells
121
7.2.3 HDAC inhibitor mediated hyper-acetylation of histones and
cell cycle of GC cells
123
7.2.4 Sequence specific effect of HDAC inhibitor treatment on the
amount of chemotherapeutic drugs bound to DNA
124
7.2.5 Sequence specific effect of HDAC inhibitor and
chemotherapy drug treatment on dose response curve
126
7.2.6 Sequence specific synergistic inhibitory effect of HDAC
inhibitors and chemotherapeutic drugs in GC cell line
128
7.3 Discussion 131
CHAPTER 8: Summary and Conclusion 135-139

8.1 Summary and conclusion 135
8.1.1 Salient findings 135
8.2 Future perspectives 138
Bibliography 140-158
Appendix 159-183
Appendix 1- Consent form 159
Appendix 2- Tables 164
A2.1 Combination sequence specific synergistic, additive
or antagonistic effect of Chemotherapy drugs and HDACi
164
A2.2 Antibodies used for western blotting 166
A2.3 Clinicopathological characteristics of gastric cancer
patients included in the study
169
A2.4 Score for Immunohistochemistry analysis 175
A2.5 Global post-translational modifications of histones in
cancer diagnosis, prognosis and treatment
180
Appendix 3- Figures 182
A3.1 Immunoblot based screening of global histone PTMs 182
A3.2 Resection margin distance dependent survival of GC
patients
183
Published Manuscript (s)

Synopsis
Synopsis
1
Homi Bhabha National Institute
Ph. D. PROGRAMME
1. Name of the Student: Shafqat Ali Khan
2. Name of the Constituent Institution: Tata Memorial Centre, Advanced Centre for
Treatment, Research & Education in Cancer.
3. Enrolment No. : LIFE09200904010
4. Title of the Thesis: Epigenetics in gastric cancer: Analysis of histone modifications and
histone modifying enzymes.
5. Board of Studies: Life Sciences
SYNOPSIS
1. Introduction:
Carcinogenesis involves various genetic and epigenetic alterations. The overall disruption
of the epigenetic landscape is one of the most common features of all human cancers
which include global loss of genomic DNA methylation, local CpG island
hypermethylation and a characteristic histone modification/variant pattern [1]. Histones
are basic proteins and a major component of chromatin. Post-translational modifications
of histones are central in the regulation of chromatin dynamics and gene regulation.
Major reported histone modifications include acetylation, methylation, phosphorylation,
ubiquitylation, glycosylation, ADP-ribosylation, carbonylation and SUMOylation. These
covalent posttranslational modifications (PTMs) of histones singly or in distinct
Synopsis
2
combinations may alter higher-order chromatin state by affecting interaction of histone
with DNA or inter and intra nucleosomes interaction or facilitates recruitment of non-
histone regulatory proteins on chromatin and leads to specific chromatin related functions
and processes like transcription, DNA repair, replication etc [2]. The timing of induction
of different modification on different histones depends on the signaling and physiological
condition within the cell.
Over the past decade accumulated evidences indicate towards the association of
aberrant histone PTMs and cancer. However, only a few of the more than 60 residues of
histones in which modifications have been described and linked to cancer and called as
‘Histone onco-modification’ [3]. Global loss of acetylation of histone H4 at lysine 16
(H4K16Ac) and loss of trimethylation of histone H4 at lysine 20 (H4K20Me3) were the
first histone marks reported to be deregulated in cancer [4]. A decrease of
H3K4Me2/Me3 is observed in a range of neoplastic tissues and a decrease of H3K9Ac
has been linked with tumor progression in prostate and ovarian tumors. In contrast, in
hepatocellular carcinoma an increase in H3K9Ac levels was reported. H3K27Me3 has
been evaluated as a prognostic factor in prostate, breast, ovarian, pancreatic, esophageal
cancers. Loss of H3K18Ac is correlated with poor prognosis and tumor grade in patients
with prostate, pancreatic, lung, breast and kidney cancers suggesting the loss of this
modification is an important event in tumor progression [3]. Therefore, available
literatures have established the alteration in the global histone PTMs for multiple cancers
suggesting their importance in the better management of cancer patients. However,
detailed studies are required to understand how global levels of histone modifications are
established and maintained and what their mechanistic links are to the cancer clinical
behavior.
Synopsis
3
Gastric cancer remains the fourth most common cancer in the world and is second
only to lung cancer in terms of worldwide cancer deaths [5]. It is a disease of very poor
prognosis as most patients are diagnosed in advanced stages of cancer due to the delay in
presentation. Adenocarcinoma is the most common malignancy of the stomach,
accounting for nearly 90% of gastric tumors. Based on location of site of occurrence in
stomah, gastric adenocarcinoma can be classified as: cardia or proximal, and distal or
noncardia. The incidence of gastric carcinoma varies dramatically by geographic location,
environmental and behavioural factors, family history and Helicobacter pylori infection
[6]. The Asian countries with a high incidence include Japan, China, and South Korea;
those with a low incidence include India, Pakistan, and Thailand [5]. In India, across the
various registries, there is a wide variation in the incidence of gastric carcinoma. Among
the six registries, the highest incidence in both sexes is reported from Chennai and the
lowest from Barshi, Maharashtra. The incidence rate of gastric cancer is four times higher
in Southern India compared with Northern India [7].
A radical D2 gastrectomy and more recently radical surgery along with
preoperative chemotherapy holds the best prospect of a cure in gastric cancer [8, 9]. The
most common therapeutic approach to treat locally advanced gastric adenocarcinomas is
a multimodal treatment with preoperative Cisplatin/ 5-fluorouracil/ Epirubicin/
Oxaliplatin-based chemotherapy or radiochemotherapy (CRT), followed by resection.
The neoadjuvant CRT approach facilitates histological tumor regression that may
increase local resectability rates and eliminate chances of distant micro-metastases [10].
In surgery, achieving R0 resection where no residual disease is left behind is a challenge;
therefore, distance and positivity of the resection margin becomes an important factor
affecting the recurrence and prognosis of patients. 5-year survival rates for resection
margin positive and negative disease being 13 versus 35% respectively [11]. Different

Synopsis
4
studies on esophageal adenocarcinoma, esophageal squamous cell carcinomas and gastric
adenocarcinoma treated by preoperative CRT indicate that the degree of histopathological
tumor regression can serve as a stronger prognostic marker than the current TNM system
[10]].
The goal of all these strategies is to achieve curative resection (R0 resection) and
thereby minimizing the chances of loco-regional recurrence and improving the prognosis
of the disease. Despite of R0 resection loco regional recurrence has been encountered in
87% of patients [12]. The extent of resection based on microscopic techniques to define
negative resection margin is not sufficient and is still a controversial topic. Further, other
greatest obstacles to effective chemotherapy or CRT in most of cancers are differential
response and the development of drug resistance [13]. Therefore, it is important to
understand the cause and determine other compounds which can increase effectiveness
and decrease the toxicity, if given along with chemotherapeutic drugs, and there is need
of other molecular markers which can help in deciding the distance of resection margin
by lowering the chances of its positivity. Therefore,
All this leads us to the point that there is need to understand in-depth the differential
alteration in histones, histone modifying enzymes and to define new prognostic markers
and therapeutic targets for the better management of gastric cancer patients.
2. Objectives:
I. To identify differential alterations in histones and their enzymes in gastric cancer.
II. To decipher molecular mechanism of specific alterations in histones in gastric
cancer.
3. Work Plan:
Objective I: To identify differential alterations in histones and their enzymes in gastric
cancer.

Synopsis
5
i. Collection of freshly resected and paraffin embedded blocks of tissues from the site of
tumor and resection margins (proximal and distal) of gastric cancer patients.
ii. Haematoxylin and Eosin (H&E) staining and histopathological confirmation of tissue
identity and tumor content.
iii. PCR and Giemsa staining based screening for Helicobacter pylori infection.
iv. Preparation of chromatin and nucleo-cytosolic fraction from freshly resected tissues.
v. Pilot screening of differential site-specific histone post-translational modifications in
tumor and resection margin tissues using immunoblotting.
vi. Immunohistochemical analysis of specific histone PTM(s) on tumor and resection
margins (proximal and distal) tissues for validation in large cohort of samples.
Objective II: To decipher molecular mechanism of specific alterations in histones in
gastric cancer.
i. Identification of specific histone modifying enzymes responsible for alteration in
specific histone PTMs in cell lines and tissue samples using enzyme assay,
immunoblotting and immunohistochemistry.
ii. Determination of effect of enzyme on site specific histone modification by exogenous
overexpression and chemical inhibition followed by immunoblotting and
immunofluorescence studies.
iii. Identification of regulatory pathway responsible for of specific histone PTM in tissues
and cell lines using immunoblotting and immunofluorescence studies.
iv. Cell based toxicity assays to study the effect of histone modifying enzymes inhibitors
for their potential application in combinatorial chemotherapy.
Synopsis
6
4. Results
4.1.Site-specific hypo-acetylation and hyper-phosphorylation of histones in gastric
cancer
Histopathologically confirmed freshly resected tumor and resection margin (proximal
and distal) tissues of gastric cancer patients (n=10) were processed for studying the
alteration in series of site-specific histone lysine acetylation (H3K9, H3K14, H3K18,
H3K23, H3K27, H4K5, H4K8, H4K12 and H4K16), lysine methylation (H3K4Me,
H3K4Me2, H4K20Me and H4K20Me3) and serine phosphorylation (H3S10).
Western blot analysis showed significant decrease (P < 0.05) of H4K16Ac,
H4K20Me3, H3K27Ac, H3K4Me2 and significant increase of H3S10P (P < 0.001)
in tumor compared to resection margin tissues. Further, combined analysis of all
acetylations revealed hypo-acetylation (P < 0.001) in tumor compared to resection
margin tissues.
Based on these observations in-depth studies were carried out for (i) regulation and
relationships of H3S10 phosphorylation with clinicopathological parameters and (ii)
the significance of histone deacetylation for their prospective relevance in
therapeutics, individually and/or combinatorially with standard chemotherapy.
4.2.Increase in H3S10P leads to poor prognosis in gastric cancer
The status of H3S10P was studied in validation set (n=101) among tumor, proximal
and distal resection margin tissues of gastric cancer using immunohistochemistry
(IHC). IHC was assessed by an experienced pathologist, intensity of staining (ranges
from zero to three) and percentage of cells stained (ranges from zero to hundred) for
specific intensity was calculated and expressed in term of H-score. Comparison of H-
score showed significant (p < 0.001) higher level of H3S10P in tumor than both the
resection margin tissues. Chi-square analysis H-score of tumor, proximal and distal

Synopsis
7
resection margin tissues was done to find correlation of H3S10P levels with
clinicopathological parameters. H3S10P of tumor showed a significantly positive
correlation with tumor grade (p= 0.0001), T stage (p= 0.005), pTNM stage (p= 0.016)
and recurrence (p= 0.034). H3S10P levels of proximal and distal resection margin
also showed a significant positive correlation with above said parameters. Kaplan-
meier survival analysis suggested a significant negative correlation of H3S10P levels
of tumor (p= 0.004 and 0.011), proximal (p= 0.014 and 0.004) and distal (p= 0.026
and 0.006) resection margin tissues with overall and disease free survival,
respectively. Further, H3S10P levels of tumor tissues were also found to be an
independent predictor of overall survival. Therefore, increase in H3S10P levels leads
to poor prognosis in human gastric cancer.
4.2.1. Level of H3S10P in resection margin is distance dependent.
Our observation of decrease in the level of H3S10P in resection margins compared to
tumor tissues lead us to study the importance of distance of resection margin from the
site of tumor from which H3S10P begins to decrease significantly. To answer this, the
resection margin samples were grouped as per their distance from tumor site and their
mean H-score were compared with the H-score of tumor samples. We identified 4 cm
as a distance of resection margin from which H3S10P showed significant reduction (p
< 0.05) for both the margins compared to tumor tissues. In addition, H-score of tumor
samples compared with H-score of resection margins with ≤4 cm and >4 cm distance
also showed a significant (p < 0.001) reduction of H3S10P levels for the group having
resection margin distance >4 cm, whereas resection margin with the distance of ≤4
cm showed no difference in H3S10P level compared to tumor tissues. Further, Chi-
square analysis to investigate the effect of H3S10P dependent proximal resection
margin on clinicopathological parameters showed a positive correlation of H3S10P

Synopsis
8
levels with WHO classification (p= 0.001), T-stage (p= 0.002) and TNM stage (p=
0.023) for the patients with resection margin ≤ 4 cm. In case of distal resection
margin, Chi-square analysis showed a positive correlation of H3S10P levels with
WHO classification (p= 0.0001) and T-stage (p= 0.009) and recurrence (p= 0.031).
For both the resection margins, no correlation was found for patients with resection
margin distance >4 cm. Kaplan-Meier survival analysis also did not show any
significant difference between patients with resection margin distance either ≤ or > 4
cm.
4.2.2. Increase in H3S10P in gastric cancer is cell cycle independent
H3S10P levels alter throughout the cell cycle with the highest level in mitotic (G2/M)
phase. Therefore, to define whether increase of H3S10P in gastric cancer is dependent
or independent of cell cycle profile of the tissues samples, we compared levels of
cyclins, mitotic index and cell cycle profile of tumor and resection margin tissues.
Cyclin B1, D1 and E1 showed higher level in tumor tissues compared to resection
margins, but their ratios were constant with the resection margin tissues. Moreover,
mitotic index also did not show any significant increase in mitotic cells in tumor
compared to resection margin tissues. Flow cytometry based cell cycle analysis of
tissue samples showed equal percentage of G1, S and G2/M cells in tumor and
resection margin tissues, though, both tumor and resection margin tissues showed
more than 80% cells in G1 phase.
In interphase or G1 phase of cell cycle, H3S10P is associated with chromatin
relaxation and transcriptional up-regulation of mainly immediate early (IE) genes.
Therefore, using RT-PCR and immunoblotting we checked the levels of IE genes (c-
jun and c-fos) which showed increase in the levels in tumor compared to resection

Synopsis
9
margin tissues. Collectively, data indicates that increase in H3S10P levels in gastric
cancer is independent of cell cycle.
4.2.3. Phosphorylation of H3S10 is mediated through p38-MAPK/ MSK1
pathway:
Mitogen and stress activated kinase 1 (MSK1) at the downstream of MAPK pathway
is known to phosphorylate H3S10 and required for cellular transformation. Also,
overexpression of c-jun and c-fos is a result of MSK1 mediated phosphorylation of
H3S10 at their promoters. Immunoblot and immunofluorescence analysis of H3S10P,
MSK1, phopho-MSK1 and MAP kinases with their active phospho forms of tissues
and H89 (MSK1 inhibitor) treated gastric cancer cell lines, AGS and KATOIII,
indicated p38-MAPK/MSK1 mediated regulation of H3S10P in gastric cancer.
Further, overexpression of MSK1 in AGS cells and treatment with specific inhibitors
against phospho-EKR1/2 (PD98059) and phospho-p38 (SB203580) in gastric cancer
cell lines, AGS and KATOIII, confirms p38 MAPK/MSK1 mediated regulation of
H3S10P in gastric cancer.
4.2.4. Overexpression of β-actin in tumor compared to normal margins of
gastric tissue:
While working with total cell lysate of gastric tissues we observed a very high level
of β-actin in tumor compared to resection margin. Therefore, to detect an overall
relative mRNA and protein expression of β-actin between gastric normal and tumor
tissues, RT-PCR and western blot was performed on resected fresh tissues (n=5)
which showed a significant higher expression of β-actin level in tumor tissues both at
mRNA (p < 0.001) and protein level (p < 0.01). Existing studies also suggest high
level of β-actin in number of cancer using tissue disruptive techniques; however, there
was no study to provide which cell type-expression is contributing towards significant

Synopsis
10
overexpression of β-actin in cancer. Therefore, we analyzed β-actin expression and
distribution in paired normal and tumor tissue samples of gastric adenocarcinoma
patients using immunohistochemistry (IHC), a tissue non-disruptive technique.
4.2.5. Overexpression of β-actin in tumor is predominantly contributed by
inflammatory cells
To provide histological proof of β-actin overexpression in gastric cancer, IHC was
performed on formalin-fixed paraffin-embedded tissue blocks (n=26). IHC analysis
showed that inflammatory cells express significantly higher level of β-actin compared
to the epithelial cells in both normal (P < 0.001) and tumor (P < 0.001) tissues.
Furthermore, tumor tissues express relatively higher level of β-actin compared to
normal in both epithelial and inflammatory cells; however, difference between
epithelial cells was not significant, whereas inflammatory cells differed significantly
(p < 0.01). Comparison of average IHC score (sum of IHC scores of epithelial and
inflammatory cells) of normal and tumor tissue also showed a significant increase of
β-actin expression in tumor tissues (p < 0.05) compared to normal.
4.2.6. Correlation of β -actin expression with clinicopathological parameters
Univariate analysis was performed (n=26) to correlate ‘total IHC score’ and ‘average
total IHC score’ of epithelial and inflammatory cells for β-actin immunostaining with
clinicopathological parameters. Epithelial and ‘overall’ level of β-actin did not show
any significant correlation with any of the clinicopathological parameters while β-
actin level of inflammatory cells showed significant correlation with tumor grade or
WHO classification (p < 0.05). Further, identification of pattern and statistical
significance of β-actin level in inflammatory cells of tumor tissues of different tumor
grades: moderately differentiated (MD), poorly differentiated (PD) and signet ring
cell carcinoma (SRC-a type of poorly differentiated cell) was carried out. The results

Synopsis
11
showed a positive correlation of β-actin level with tumor grade with significantly
higher level in PD (p < 0.05) and SRC (p < 0.05) compared to MD; however, PD to
SRC difference was not significant (p > 0.05). In addition, low level of β-actin in
SRC cell line, KATOIII compared to MD gastric adenocarcinoma cell line, AGS
fascinated us to look for the pattern of β-actin expression of tissue epithelial cells with
tumor grade. β-actin level in tissue epithelial cells followed a similar pattern of cell
lines, i.e. decreases from MD to PD and to SRC, a negative correlation with tumor
grade, though insignificant. Thus, the data indicates β-actin towards the prospective
prognostic marker in gastric cancer.
4.3.Global and site-specific hypo-acetylation is due to higher HDAC levels in
gastric cancer
The observed hypoacetylation by immmunoblot and IHC analysis in gastric cancer
could be because of the low levels of histone acetyl transferase (HAT) and/or high
levels of histone deacetylase (HDAC) in tumor compared to resection margin tissues
in gastric cancer. Therefore, to determine the level of HAT and HDAC in tissue
samples (n=5) total protein lysate was isolated and used for commercial kit based
calorimetric HAT and HDAC assay. The data suggested significantly increased level
of HDAC (p< 0.01) without alteration in HAT levels in tumor tissues compared to
resection margins. The observed hypo-acetylation and increase in HDAC suggested
that HDAC inhibitors (HDACi) can be explored as prospective therapeutic agent.
4.3.1. HDACi increases the amount of DNA bound chemotherapeutic drug:
Higher level of HDAC in tumor tissues prompted us to exploit HDACi, Valproic acid
(VPA), Trichostatin. A (TSA) and ‘Vorinostat’ or suberoylanilide hydroxamic acid
(SAHA), as drugs that can be used in combination with conventional DNA binding
chemotherapy drugs like Cisplatin, Oxaliplatin and Epirubicin. HDACi leads to
Synopsis
12
increase in histone acetylation favouring chromatin relaxation and thereby may
increase the binding of chemotherapeutic drugs to DNA. The binding of
chemotherapy drugs to DNA at their IC50 values were measured by spectroscopic
method in three different combinations with HDACi i.e. pre-HDACi, concurrent and
post-HDACi treatment in gastric cancer cell line. Absorbance of drugs was measured
at 220, 205 and 254 nm for cisplatin, oxaliplatin and epirubicin, respectively. The
analysis showed increase in the amount of chemotherapy drugs bound to DNA, when
HDAC inhibitors were given in pre- and concurrent combinations; however, pre-
treatment of HDACi resulted in maximum increase in binding of chemotherapy drugs
to DNA.
4.3.2. HDACi act synergistically in combination with chemotherapeutic drugs.
In combinatorial chemotherapy mechanism of drug interaction is an important aspect;
therefore, we tested for the best combination of HDACi and chemotherapy drugs that
leads to synergy at maximum effective dose for cell death. HDACi and chemotherapy
drugs were tested on AGS cells for their additive, antagonistic and synergistic
interaction in three different combinations (pre-HDACi, concurrent HDACi and post-
HDACi) at their constant ratio for cell death using MTT assay. For each combination,
affected fraction (Fa) was calculated using cell survival percentage data of MTT
assay. Fa values were used to calculate combination index with the help of software
CompuSyn and plotted against the dose of the individual and drugs in combination.
The results showed that pre-treatment of HDACi act synergistically in combination
with chemotherapy drugs. Based on these findings, we concluded that HDACi used in
combination with chemotherapeutic drugs will facilitate a reduction in the effective
dose of the chemotherapeutic drug without compromising on cancer cell death. This
could also offer the potential for reducing chemotherapy-associated toxicity in gastric

Synopsis
13
cancer. These results offer a firm rationale for exploring these drug combinations in
the clinical setting.
5. Summary and Conclusion:
In gastric cancer, the present study investigated the differential pattern of various site-
specific histone PTMs, possibility of the use of HDACi in combinatorial
chemotherapy and effect of microenvironment on expression of housekeeping gene,
β-actin.
Salient findings:
(i) The significant increase of histone mark, H3S10P in gastric cancer leads to
poor prognosis. H3S10P was also found to be independent predictor of overall
survival. The correlation of H3S10P levels of resection margins with clinical
parameters and survival indicate towards the involvement of histone PTMs in
field cancerization. Further, mechanistic investigations also revealed that
p38MAPK/MSK1 pathway is responsible for the increase of H3S10P in
gastric cancer.
(ii) HDAC inhibitors, pre-treatment on gastric cancer cell line showed maximum
effect in cell death as it increases the amount of chemotherapy drugs bound to
DNA, and, also showed synergic effect at the fraction effect (Fa) levels 0.5,
0.75 and 0.9 compared to concurrent or post-HDACi treatment as confirmed
by combination index analysis. Dose reduction index analysis also showed the
reduction in dose of chemotherapy drugs in combination with HDACi may
lead to decreasing the toxicity associated with chemotherapy.
(iii) The differential level of β-actin expression in inflammatory and epithelial cells
of tissue microenvironment was showed as a histological evidence of β-actin
overexpression in gastric cancer. The overall higher level of β-actin in tumor

Synopsis
14
tissues is mainly contributed by inflammatory cells which correlate with tumor
grade.
In conclusion, our study has revealed histone hypo-acetylation and hyper-
phosphorylation across a large cohort of gastric tumor samples. The identified hyper-
phosphorylation of H3S10 correlates with different tumor grades, morphologic types,
and phenotypic classes of gastric tumors. Additionally, hyper-phosphorylated H3S10
correlates with distance of resection margins, prognosis and clinical outcome.
Further, association of histone hypo-acetylation with overexpression of HDAC
enzymes lead to the use of small-molecule, HDACi as epigenetic modulators acting
synergistically along with chemotherapeutic drugs for better management of gastric
cancer.
6. References:
1. Shikhar Sharma et al. Epigenetics in cancer. Carcinogenesis, 2009.
2. Anjana Munshi et al. Histone modifications dictate specific biological readouts.
Journal of Genetics and Genomics, 2009.
3. J Fu llgrabe at al. Histone onco-modifications. Oncogene, 2011.
4. Mario F Fraga et al. Loss of acetylation at Lys16 and trimethylation at Lys20 of
histone H4 is a common hallmark of human cancer. Nature Genetics, 2005.
5. Siegel R et al. Cancer statistics, 2013. CA Cancer J Clin, 2013.
6. Mark E. Lockhart et al. Epidemiology of gastric cancer. Cambridge University
Press, 2009.
7. Dikshit RP et al. Epidemiological review of gastric cancer in India. Indian J Med
Paediatr Oncol, 2011.
Synopsis
15
8. Shrikhande SV et al. D2 lymphadenectomy for gastric cancer in Tata Memorial
Hospital: Indian data can now be incorporated in future international trials. Dig
Surg, 2006.
9. Shrikhande SV et al. D2 lymphadenectomy is not only safe but necessary in the
era of neoadjuvant chemotherapy. World J Surg Oncol, 2013.
10. Svenja Thies et al. Tumor regression grading of gastrointestinal carcinomas after
neoadjuvant treatment. Frontiers in Oncology, 2013.
11. Wanebo HJ et al. Cancer of the stomach. A patient care study by the American
College of Surgeons. Ann Surg, 1993.
12. Gunderson LL et al. Adenocarcinoma of the stomach in a re-opertaion series:
clinicopathological correlation and implications for adjuvant therapy. Int J Radiat
Oncol Biol Phys, 1982.
13. Rosado JO et al. A systems pharmacology analysis of major chemotherapy
combination regimens used in gastric cancer treatment: predicting potential new
protein targets and drugs. Curr Cancer Drug Targets, 2011.
7. Publications in Refereed Journal:
a. Published
Shafqat A Khan, Monica Tyagi, Ajit K Sharma, Savio G Barreto, Bhawna
Sirohi, Mukta Ramadwar, Shailesh V Shrikhande, Sanjay Gupta. Cell-type
specificity of β-actin expression and its clinicopathological correlation in
gastric adenocarcinoma. World Journal of Gastroenterology (PMID:
25232253).
Shafqat A Khan, Savio G Barreto, Mukta Ramadwar, Shailesh V Shrikhande,
Sanjay Gupta. Global Histone Posttranslational Modifications and Cancer:

Synopsis
16
Biomarkers for Diagnosis, Treatment and Prognosis? World Journal of
Biological Chemistry (Under review)
b. To be submitted
p38MAPK/ MSK1 pathway mediated increase in histone H3Ser10
phosphorylation leads to poor prognosis in gastric cancer. (original research
article)
HDAC inhibitors improve chemotherapy response in human gastric cancer
cell lines. (original research article)
c. Other publication
Monica Tyagi, Bharat Khade, Shafqat A Khan, Arvind Ingle and Sanjay
Gupta, Expression of histone variant, H2A.1 is associated with the
undifferentiated state of hepatocyte. Experimental Biology and Medicine
(PMID: 24764240).
Ajit K. Sharma, Saikat Bhattacharyya, Shafqat A. Khan, and Sanjay Gupta.
Dynamic alteration in H3 Serine10 phosphorylation is G1-phase specific
during IR- Academic & training Program, ACTREC
Monica Tyagi, Shafqat A Khan, Saikat Bhattacharya, Divya Reddy, Ajit K
Sharma, Bharat Khade, Sanjay Gupta. Techniques to Access Histone
Modifications and Variants in Cancer. Methods in Molecular Biology (PMID:
25421664).

List of Figures
18
List of Figures
S.
No. Figure No. and Title
Page No.
Chapter 2 Review of literature 1 2.1-Anatomy of Stomach 26
2 2.2-Histology of Stomach 27
3 2.3-Histological classification of gastric cancer 29
4 2.4- Incidence and mortality of top cancers in world and India 33
5 2.5- Global prevalence of gastric cancer 34
6 2.6- Global prevalence of H. pylori infection 36
7 2.7- Proposed multistep pathway in the pathogenesis of gastric cancer 40
8 2.8- TNM staging of gastric cancer 41
9 2.9- Schematic representation of fundamental mechanisms of epigenetic
gene regulation
44
10 2.10- Chromatin architecture and histone modifications 46
11 2.11- Readers, writers and erasers of chromatin marks 47
12 2.12- Histone modification cross-talk 51
13 2.13- Histone onco-modifications 53
14 2.14- Deregulation of histone PTMs in cancer 56
15 2.15- Deregulation of histone modifiers in cancer 58
16 2.16- Regulation of cancer hallmarks by Histone deacetylase 62
Chapter- 4 Materials and Methods 17 4.1- pCMV-Flag-MSK1 cloning vector map 74
Chapter 5- Histone H3 serine 10 phosphorylation in GC 18 5.1- H3S10ph level in Tumor, PRM and DRM tissues in GC 90
19 5.2- Effect of H3S10ph levels of Tumor, PRM and DRM on patients’
survival
92
20 5.3- Association of H3S10ph with the distance of resection margin 94
21 5.4- Effect of distance of resection margin on patients’ survival 97
22 5.5- Association of H3S10ph with cell cycle profile of gastric tumor and
resection margin tissues
99
23 5.6- Regulatory mechanism for differential levels of
H3S10ph in GC
101
Chapter 6- β- actin expression in GC 24 6.1- Comparison of β-actin level in gastric normal and tumor tissue 109
25 6.2- Histological analysis of β-actin in gastric normal and tumor tissues 111
26 6.3- Correlation of β-actin expression with tumor grade 114
Chapter 7- Global hypo-acetylation in Gastric cancer 27 7.1- Histone acetylation, HAT and HDAC levels in GC 120
28 7.2- Dose response of chemotherapy drugs and HDACi on GC cells 122
29 7.3- Effect of HDACi on HDAC activity, histone acetylation and cell
cycle of GC cells
124
30 7.4- Effect of sequence specific HDACi treatment on amount of DNA
bound chemotherapy drugs
125
31 7.5- Fraction affected (FA) plot analysis 127
32 7.6- Median effect plot analysis 129

List of Tables
19
List of Tables
S.
No.
Table No. and Title Page No.
Chapter 2-Review of Literature 1 2.1- Characteristic differences between intestinal and diffuse type gastric
cancer
30
2 2.2- Characteristic differences between cardia and non- cardia gastric
cancer
31
3 2.3- Risk factors for development of gastric cancer 38
4 2.4- Staging of gastric cancer as per American Joint Committee on
Cancer Staging for Gastric Cancer
42
5 2.5- Writers, Erasers and functions of histone
post-translational modifications
49
6 2.6- Classification of known Histone deacetylases (HDACs) 59
7 2.7- Classification of known Histone acetyl-transferases (HATs) 60
8 2.8- Inhibitors of histone modifiers 63
Chapter 4-Materials and Methods 9 4.1- List of antibodies used for IHC analysis 71
10 4.2- Scoring system for β-actin immunostaining 72
11 4.3- List of primers used for RT PCR 79
Chapter 5- Histone H3 serine 10 phosphorylation in GC 12 5.1- Correlation between H3S10 phosphorylation levels of Tumor, PRM
and DRM with clinicopathological variables
91
13 5.2- Survival analysis of variables predicting the risk of death for patients
with gastric cancer
93
14 5.3- Correlation between H3S10ph levels of PRM and DRM, ≤ 4 cm vs >
4 cm
96
Chapter 6- β- actin expression in GC 15 6.1- Frequency of samples with respect to total IHC score of β-actin 110
16 6.2- Univariate analysis of β-actin immunostaining with
clinicopathological parameters
113
Chapter 7- Global hypo-acetylation in Gastric cancer 17 7.1- Dose for combinatorial treatment of chemotherapy drugs and HDAC
inhibitors in fixed constant ratio
126

Abbreviations
20
Abbreviations
3D-CRT Three-Dimensional Conformal Radiation Therapy
5-FU 5 Fluoro Uracil
β-ME 2-Mercapto Ethanol
ACT Adjuvant chemotherapy
ADP Adenosine Di-Phosphate
ARAC Cytosine Arabinoside
APS Ammonium Per Sulphate
ATP Adenosine Tri Phosphate
AUT Acetic Acid Urea Triton
BPB Bromophenol Blue
BBS Bes Buffer Saline
BSA Bovine Serum Albumin
CagA Cytotoxin-Associated Gene A
CBBR Coomassie Brilliant Blue R-250
CDH1 Cadherin-1 Or E- Cadherin
CF Chromatin Fraction
CHZ1 Nuclear Chaperon For H2a.Z
CENP-A Centromeric Protein A
CI Combination Index
CNE1 Calnexin
cNUCs Circulating Nucleosome
COX-2 Cyclooxygenase-2
CT Computed Tomographic
CTC Copper Tartrate Carbonate
DAB Diaminobenzidine
DEPC Diethylpyrocarbonate
DFS Disease Free Survival
DRM Distal Resection Margin
DMEM Dulbecco's Modified Eagle Medium
DMSO Dimetheyl Sulfoxide
DNMT1 Dna (Cytosine-5)-Methyltransferase 1
DTT Dl-Dithio Threitol
DZNEP 3-Deazaneplanocin A
ECF Epirubicin, Cisplatin And Fluorouracil
EGF Epidermal Growth Factor
ECX Epirubicin, Cisplatin And Capecitabine
EDTA Ethylenediaminetetraacetic Acid
EGF Epidermal Growth Factor
EGTA Ethylene Glycol Tetraacetic Acid
EMT Epithelial to Mesenchymal Transition
EMR Electronic Medical Record
EOF Epirubicin, Oxaliplatin and Fluorouracil
EGD Esophagogastroduodenoscopy
EOX Epirubicin, Oxaliplatin, and Capecitabine
ERK Extracellular-Signal-Regulated Kinases

Abbreviations
21
EUS Endoscopic Ultrasonography
EZH2 Enhancer of Zeste Homolog 2
FA Fraction Affected
FACS Fluorescent Activated Cell Sorter
FBS Fetal Bovine Serum
FRF Freshly Resected Frozen
FFPE Formalin-Fixed Paraffin-Embedded
miR micro-RNA
GATA1 GATA binding protein 1
GC Gastric Cancer
HFD Histone Fold Domain
HAT Histone Acetyl-Transferases
HBV Hepatitis B Virus
HCV Hepatitis C Virus
HDAC Histone Deacetylase
HDACi HDAC Inhibitor (s)
H&E Hematoxylene and Eosin
HIRA Histone Regulation A
HDM Histone Demethylases
HEPES 4-(2-Hydroxyethyl)-1-Piperazineethanesulfonic Acid
HMT Histone Methyltransferases
HP1 Heterochromatin Protein 1
H3S10ph Histone H3 Serine10 Phosphorylation
IHC Immunohistochemistry
IMRT Intensity Modulated Radiation Therapy
IE Immediate Early
JARID1B Lysine-Specific Demethylase 5b
KDM1A Lysine (K)-Specific Demethylase 1a
LMP1 Epstein–Barr virus latent membrane protein 1
LSD1 Lysine-Specific Demethylase 1
MBT Malignant Brain Tumour
MOZ Monocytic Leukemia Zinc Finger Protein
MOZ-CBP CREB-Binding Protein
MAPK Mitogen-Activated Protein Kinases
MD Moderately Differentiated
MEM Minimum Essential Medium
miR micro-RNA
MMP15 Matrix Metallopeptidase
MMS Methyl Methane Sulfonate
MOPS 3-(N-Morpholino) Propanesulfonic Acid
MSK1 Mitogen- and Stress-Activated Kinase 1
MTT 3-(4,5-Dimethylthiazol-2-Yl)-2,5-iphenyltetrazolium
Bromide
NACT Neo-adjuvant chemotherapy
NAD Nicotinamide Adenine Dinucleotide
NCF Nucleo-Cytosolic Fraction
NEB New England Bioloab

Abbreviations
22
NHD Non-Histone Domain
NSAID Nonsteroidal Anti-Inflammatory Drug
NPC Nasopharyngeal Carcinoma
OS Overall Survival
PBS Phosphata Buffer Saline
PMSF Phenylmethylsulfonyl Fluoride
PTM Post-Translational Modification
PHD Plant Hetero Domain
phMSK1 Phospho MSK1
PRM Proximal Resection Margin
PRMT Protein Arginine Methyl Transferases
PARPS Poly-ADP-Ribose Polymerase
PIK Phospho-Inositide Kinase
PBS Phosphate Buffer Saline
PCR Polymerase Chain Reaction
PD Poorly Differentiated
PKCbI Protein kinase C beta I
PVDF Poly Vinyliene Di-Fluoride
RM Resection Margin
RPMI Roswell Park Memorial Institute Medium
RT-PCR Reverse Transcriptase PCR
SAM S-Adenosyl Methionine
SAHA Suberoylanilide Hydroxamic Acid
SRC Signet Ring Cell Carcinoma
SHH Sonic Hedgehog
SSB Single Strand Breaks
SDS-PAGE Sodium-Dodecyl-Sulphate –Poly-Acrylamide Gel
Electrophoresis
SFRP2 Secreted Frizzled-Related Protein 2
SFRP5 Secreted Frizzled-Related Protein 2
TTBS Tris Buffer Saline
TCL Total Cell Lysate
TEMED N,N,N′,N′-Tetramethylethane-1,2-Diamine
TGF-b Transforming Growth Factor-Β
TPA Terephthalic acid
TTR Tumor Tissue Repository
TSS Transcriptional Start Site
TSA Trichostatin A
TIP60 Tat Interacting Protein-60
UNC5B Unc-5 Homolog B
VPA Valproaic Acid
WBC CHAMBER White Blood Cell Chamber
WHO World Health Organizations
WNT5A Wingless-Type Mmtv Integration Site Family, Member 5a

Chapter 1
Introduction

Chapter 1: Introduction
23
1.1 Background of the Work
Carcinogenesis involves various genetic and epigenetic alterations. The overall disruption
of the epigenetic landscape is one of the most common features of all human cancers,
which include global loss of genomic DNA methylation, local CpG island
hypermethylation and a characteristic histone modification and/or variant pattern. Post-
translational modifications (PTMs) of histones are central in the regulation of chromatin
dynamics and regulate chromatin related processes, like transcription, DNA repair,
replication, DNA damage response etc. Over the past decade accumulated evidences
indicate towards the strong association of aberrant histone PTMs, termed as ‘histone
onco-modifications’ with cancer. Further, available literatures have suggested that the
alteration in the global histone PTMs in multiple cancers highlights their importance for
the better management of cancer patients. However, detailed studies are required to
understand ‘how global levels of histone modifications are established, maintained and
what their mechanistic links to the cancer clinical pathological behavior’.
Gastric cancer is a disease of very poor prognosis and remains fourth most
common cancer in terms of incident, and globally is second in terms of mortality. The
most common therapeutic approach for locally advanced gastric adenocarcinoma is a
multimodal treatment with pre-operative chemotherapy or radio-chemotherapy (CRT),
followed by surgery. The neoadjuvant CRT approach facilitates histological tumor
regression that may increase local resectability rates and eliminate chances of distant
micro-metastases after surgery. In surgery achieving ‘R0’ resection, no residual disease is
left behind, is a challenge; therefore, distance and positivity of the resection margin
becomes an important factor affecting the recurrence and prognosis of patients. Despite of
‘R0’ resection a large numbers of gastric cancer patients show loco-recurrence, signifying
the importance of assessing the currently used methods, microscopy and histology, to

Chapter 1: Introduction
24
define negative resection margin. Further, other greatest obstacles for effective
chemotherapy or CRT in cancers are differential patient response and drug resistance.
Therefore, it is important to determine effective agents/compounds which can increase
effectiveness and decrease the toxicity, if given along with chemotherapeutic drugs. Also,
there is a need of molecular markers which can help in deciding the distance of ‘R0’
resection margin.
In this presented work on human gastric cancer, histone post-translational
modifications and histone modifying enzymes have been studied in association with
clinic-pathological behavior. The levels of site-specific histone post-translational
modifications have been compared between tumor and negative resection margin tissues.
A detailed study is conducted on phosphorylation of histone H3 at serine 10 position
(H3S10ph) for its regulatory mechanism and prognostic potential in gastric cancer.
Further, investigation of histone deacetylase inhibitors (HDACi) has also carried out for
analysis of their potential in combinatorial chemotherapy in gastric cancer.
1.2 Layout of the Thesis
Epigenetics of gastric cancer is a central theme of this thesis; therefore, the thesis starts
with review of literature, chapter 2, describing gastric cancer, epigenetics, histone post-
translational modifications, histone modifying enzymes and their inhibitors in detail with
respect to cancer. ‘Aims and Objectives’ are described in chapter 3. A description on
various methodologies and reagents used are described in chapter 4 as ‘Materials and
Methods’. The findings of the work are presented and discussed from chapter 5 to 7; each
chapter is further divided in ‘Introduction, Results and Discussion’. Chapter 5 (Histone
H3 Serine 10 phosphorylation: Regulation and its correlation with clinico-pathological
parameters in gastric cancer) describes our findings on H3S10ph in gastric cancer, where
using statistical, histo-pathological and molecular approaches, potential of histone mark,

Chapter 1: Introduction
25
H3S10ph in gastric cancer prognosis and defining the ‘true’ negative resection margin
have been investigated. Further, p38-MAPK/MSK1 was concluded as a regulatory
pathway for H3S10ph in gastric cancer using biochemical and genetic manipulations
approaches. While undertaking this work, I had a very interesting observation of
significantly high level of β-actin in gastric tumor compared to histo-pathologically
normal resection margin tissue samples, a housekeeping gene at protein level. Hence, I
undertook an in-depth analysis on this observation using molecular and histopathological
approaches; described in chapter 6 (β-actin expression and its clinicopathological
correlation in gastric adenocarcinoma). This work deduces an interesting finding that β-
actin has a prognostic value in gastric cancer and its high level in tumor is mainly
contributed by infiltrating inflammatory or immune cell in the tumor micro-environment.
The chapter 7 (Global hypo-acetylation of histones: Combinatorial effect of HDAC
inhibitors with DNA-targeted chemotherapeutic drugs on gastric cancer cell lines) shows
the correlation between hypo-acetylation of core histones, H3 and H4 with higher HDAC
activity in gastric cancer. Further, this correlation is exploited to test the potential of
HDAC inhibitors, VPA or TSA or SAHA in combinatorial chemotherapy with cisplatin,
oxaliplatin and epirubicin. The summary and conclusion along with future prospects of
this work is presented in chapter 8. The references are compiled towards the end as
‘Bibliography’ in chapter 9. Many of the supporting evidences for the chapter 5, 6 and 7
are compiled in the ‘Appendix Section’ towards the end. Published manuscripts are also
added after appendix section.

Chapter 2 Review of Literature

Chapter 2: Review of Literature
26
2.1 Stomach
2.1.1 Anatomy and histology of stomach
Stomach undertakes chemical digestion and is located between the esophagus and the
duodenum. It is a muscular, hollow, dilated part of the digestion system and divided into
five sections, each of which has different cells and functions: Cardia, Fundus, Body,
Antrum, and Pylorus. The first three parts of the stomach (cardia, fundus, and body) are
called the proximal stomach, and the lower two parts (antrum and pylorus) are called the
distal stomach. Further, stomach has two curves, which form its upper and lower borders
are called as lesser curvature and greater curvature, respectively. The pylorus is connected
to the duodenum (Figure 2.1).
Figure 2.1: Anatomy of stomach. Stomach is divided into five sections: Cardia, Fundus, Body,
Antrum, and Pylorus. The first three parts of the stomach (cardia, fundus, and body) are called
the proximal stomach, and the lower two parts (antrum and pylorus) are called the distal
stomach. Source-Openstax.
The cardia contains predominantly ‘mucin- secreting cells’. The fundus contains
‘mucoid cells, chief cells, and parietal cells’. The pylorus is composed of ‘mucus-
producing cells and endocrine cells. The stomach wall has five layers: (1) Mucosa- the
innermost layer, where stomach acid and digestive enzymes are made, and where most

Chapter 2: Review of Literature
27
stomach cancers start, (2) Sub mucosa- consists of fibrous connective tissues, (3)
Muscularis propria- a layer of muscle that moves and mixes the stomach contents, (4) Sub
serosa- lies over the Muscularis propria, and (5) Serosa- outermost layer, act as wrapping
layers for the stomach (Figure 2.2).
Figure 2.2: Histology of stomach. The stomach wall is divided into five layers: Mucosa, Sub
mucosa, Muscularis propriaach, Sub serosa and Serosa. Source-Openstax.
2.1.2 Stomach/ Gastric cancer
Stomach cancers tend to develop slowly over many years. Before a true cancer develops,
there are usually changes that take place in the lining of the stomach. These early changes
rarely produce symptoms and therefore often are not noticed. Stomach cancers can spread
in different ways. They can grow through the wall of the stomach and invade nearby
organs. They can metastasize to the lymph vessels and nearby lymph nodes. At advanced
stage, epithelial to mesenchymal transition of tumor cells takes place and through
bloodstream primary gastric tumor spreads to other organs such as the liver, lungs, and
bones and forms a secondary tumor[1]
.

Chapter 2: Review of Literature
28
Based on the cell type involved, gastric cancer is of following four different types.
(1) Adenocarcinomas: About 90% to 95% of stomach tumors are adenocarcinomas.
This cancer develops from the cells that form the innermost lining of the stomach-
the mucosa.
(2) Lymphoma: They account for about 4% of stomach tumors. These are cancers of
the immune system tissue that are sometimes found in the wall of the stomach.
(3) Gastrointestinal stromal tumor: These are rare tumors that seem to start in cells
in the wall of the stomach called interstitial cells of Cajal.
(4) Carcinoid tumor: These are tumor that start in hormone making cells of the
stomach. Most of these tumors do not spread to other organs. About 3% of
stomach cancers are carcinoid tumors.
2.2 Classification of Gastric Cancer
2.2.1 Histological classification
Several classification systems have been proposed to aid the description of gastric cancer
on the basis of macroscopic or histological features, which include Borrman, Japanese
system, World Health Organization (WHO) system and Laurén. However, Lauren’s and
WHO classification are most frequently used[1, 2]
.
2.2.1.1 Lauran’s classification
The Laurén classification system is most commonly used and describes the tumors in
relation to microscopic configuration and growth pattern. This classification system is
useful in evaluating the natural history of gastric carcinoma, especially with regard to its
association with environmental factors, incidence trends and its precursors. Lesions are
classified into one of two major types: intestinal or diffuse (Figure 2.3 and Table 2.1).
Intestinal subtype tumors are often localized in the lower or distal part of the
stomach, and are characterized by having well defined glandular formation, similar to the
Chapter 2: Review of Literature
29
microscopic appearance of colonic mucosa. The development of intestinal subtype gastric
cancer follows a stepwise sequence of precursor lesions starting with superficial gastritis,
continuing through chronic atrophic gastritis, intestinal metaplasia, dysplasia to,
ultimately overt gastric cancer.
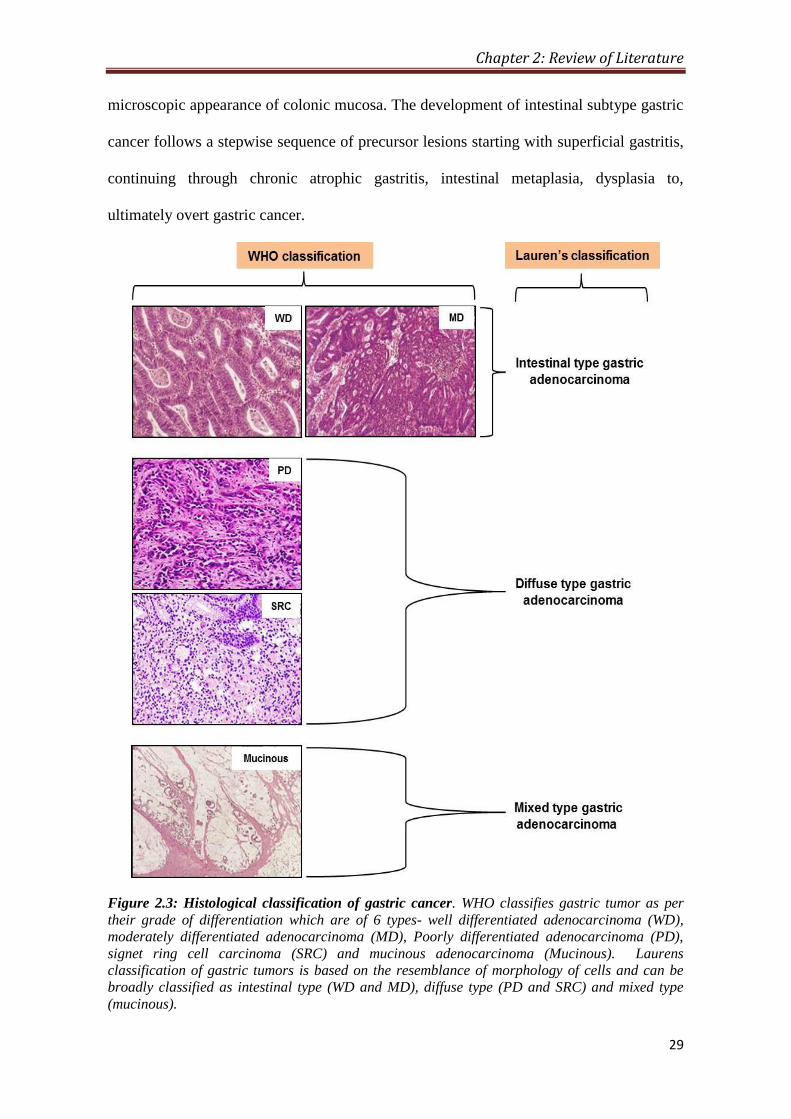
Figure 2.3: Histological classification of gastric cancer. WHO classifies gastric tumor as per
their grade of differentiation which are of 6 types- well differentiated adenocarcinoma (WD),
moderately differentiated adenocarcinoma (MD), Poorly differentiated adenocarcinoma (PD),
signet ring cell carcinoma (SRC) and mucinous adenocarcinoma (Mucinous). Laurens
classification of gastric tumors is based on the resemblance of morphology of cells and can be
broadly classified as intestinal type (WD and MD), diffuse type (PD and SRC) and mixed type
(mucinous).

Chapter 2: Review of Literature
30
The etiology of intestinal subtype gastric cancer is mainly associated to
environmental factors, the tumor frequently develops late in life (after 50 years of age),
and is twice more common in males than females[3]
(Table 2.1)
Diffuse subtype gastric cancer more commonly develops in the corpus or upper
part of the stomach which is characterized by the lack of gland formation and cellular
adhesion, with single/small clusters of neoplastic cells diffusely infiltrating the stroma of
the stomach wall. No recognizable pre-neoplastic lesions have been observed during the
development of diffuse cancers. Diffuse subtype tumors are associated with genetic
predisposition, presumably arise out of single-cell mutations in normal gastric glands.
The diffuse subtype has a relatively constant or even slightly increase in incidence rates,
more often occurs in young individuals, presents a similar prevalence in males and
females, and is associated with a worse prognosis than the intestinal subtypea[3]
.
Table 2.1: Characteristic differences between intestinal and diffuse type gastric cancer[4]
Characteristics Intestinal type Diffuse type
Gross
morphology
Exophytic Ulcerating, diffuse
Microscopy Glandular Single cells, signet-ring cells
Main co-
existing
precancer
condition
Atrophic gastritis, intestinal metaplasia Non-atrophic gastritis
Precancer lesion Adenoma, dysplasia; ‘Correa sequence’ Foveolar hyperplasia?
Age Old age Young age, all age groups
Sex Male > Female Equal
Prevailing site Antrum and angulus Corpus, whole stomach
Metastasis Lymph nodes, liver Lymph nodes, visceral
Biology Oestrogen protects? Neuroendocrine differentiation?
Prior or co-
existing
H. pylori
Common by serology (>80-90%)
False-negative results frequent with breath test,
antigen stool test, biopsy-based urease test, or by
microscopy
Common (>90%)
All tests are reliable
2.2.1.2 WHO classification
The World Health Organization (WHO) classification issued in 2010 appears to be the
most detailed among all pathohistological classification systems. According to WHO
classification, gastric carcinoma is divided into five types (1) Well Differentiated, (2)
Chapter 2: Review of Literature
31
Moderately Differentiated, (3) Poorly Differentiated, (4) Mucinous, and (5) Signet ring
cell carcinoma. In general, well and moderately differentiated cancer of WHO correspond
to intestinal type according to Lauren, whereas poor differentiated or undifferentiated or
signet ring cell- carcinoma to the diffuse type carcinoma respectively (Figure 2.3 and
Table 2.1).
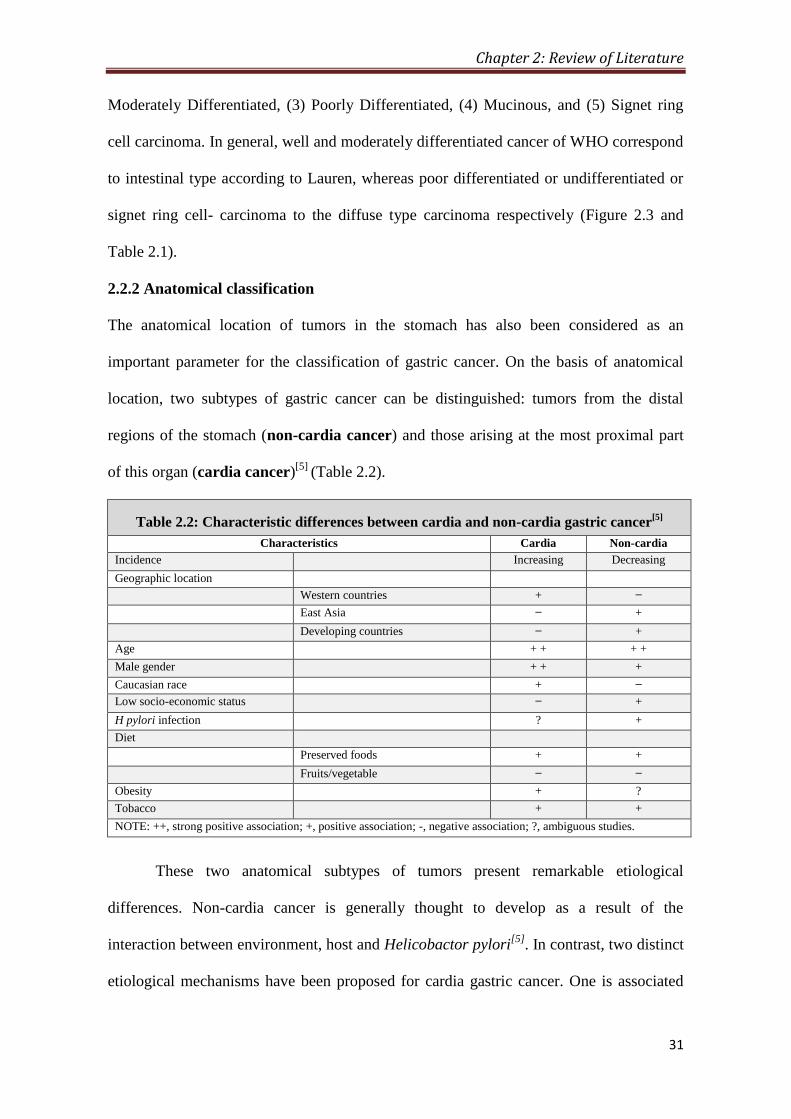
2.2.2 Anatomical classification
The anatomical location of tumors in the stomach has also been considered as an
important parameter for the classification of gastric cancer. On the basis of anatomical
location, two subtypes of gastric cancer can be distinguished: tumors from the distal
regions of the stomach (non-cardia cancer) and those arising at the most proximal part
of this organ (cardia cancer)[5]
(Table 2.2).
Table 2.2: Characteristic differences between cardia and non-cardia gastric cancer[5]
Characteristics Cardia Non-cardia
Incidence Increasing Decreasing
Geographic location
Western countries + ̶
East Asia ̶ +
Developing countries ̶ +
Age + + + +
Male gender + + +
Caucasian race + ̶
Low socio-economic status ̶ +
H pylori infection ? +
Diet
Preserved foods + +
Fruits/vegetable ̶ ̶
Obesity + ?
Tobacco + +
NOTE: ++, strong positive association; +, positive association; -, negative association; ?, ambiguous studies.
These two anatomical subtypes of tumors present remarkable etiological
differences. Non-cardia cancer is generally thought to develop as a result of the
interaction between environment, host and Helicobactor pylori[5]
. In contrast, two distinct
etiological mechanisms have been proposed for cardia gastric cancer. One is associated
Chapter 2: Review of Literature
32
with atrophic gastritis and resembles the development of non-cardia malignancies. The
second arises in similar fashion to esophageal carcinomas, as a result of frequent
refluxing of acidic gastric juice into the distal esophageal mucosa, which leads to the
transformation from squamous to columnar metaplastic epithelium to, ultimately, overt
cancer. Epidemiological dissimilarities also exist between these two anatomical subtypes
of gastric tumors. Non-cardia gastric cancer accounts for the majority of the cases
worldwide and is the predominant type in high-risk areas. In contrast, cardia cancer is
more homogeneously distributed all over the world and its incidence tends to increase[5]
.
2.3 Epidemiology of Gastric Cancer
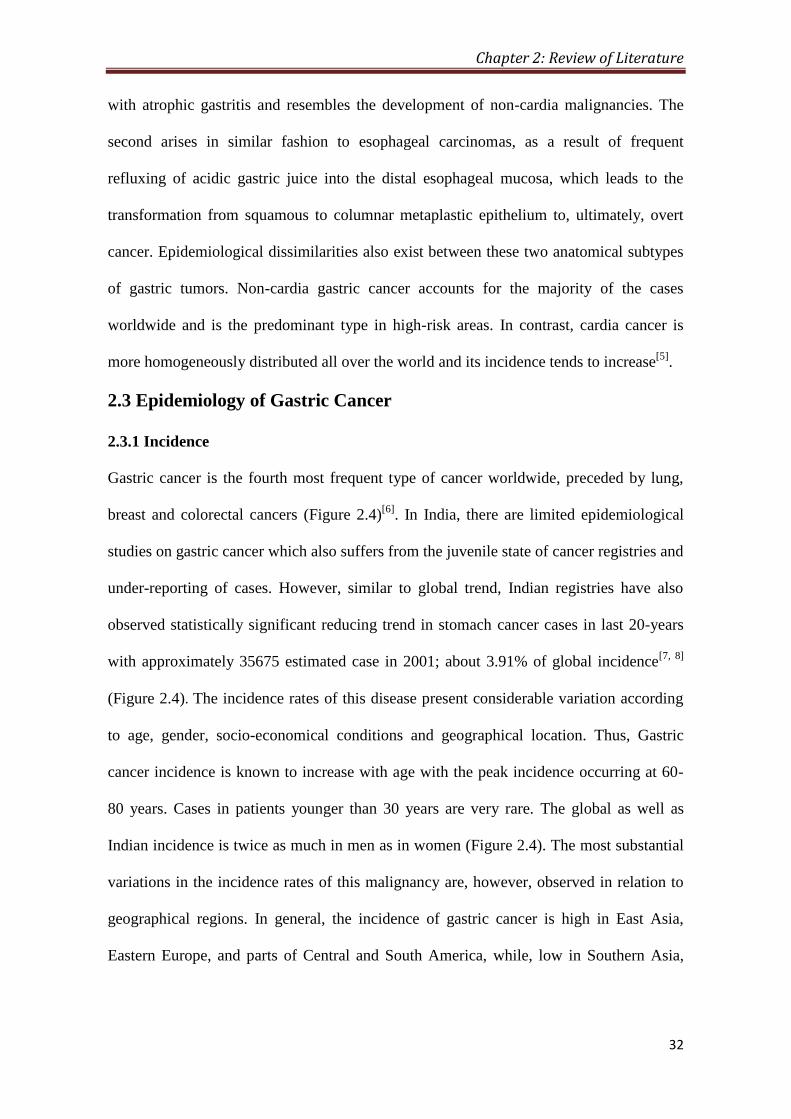
2.3.1 Incidence
Gastric cancer is the fourth most frequent type of cancer worldwide, preceded by lung,
breast and colorectal cancers (Figure 2.4)[6]
. In India, there are limited epidemiological
studies on gastric cancer which also suffers from the juvenile state of cancer registries and
under-reporting of cases. However, similar to global trend, Indian registries have also
observed statistically significant reducing trend in stomach cancer cases in last 20-years
with approximately 35675 estimated case in 2001; about 3.91% of global incidence[7, 8]
(Figure 2.4). The incidence rates of this disease present considerable variation according
to age, gender, socio-economical conditions and geographical location. Thus, Gastric
cancer incidence is known to increase with age with the peak incidence occurring at 60-
80 years. Cases in patients younger than 30 years are very rare. The global as well as
Indian incidence is twice as much in men as in women (Figure 2.4). The most substantial
variations in the incidence rates of this malignancy are, however, observed in relation to
geographical regions. In general, the incidence of gastric cancer is high in East Asia,
Eastern Europe, and parts of Central and South America, while, low in Southern Asia,

Chapter 2: Review of Literature
33
North and East Africa, Western and Northern Europe, North America and Australia
(Figure 2.5)[9]
.
Figure 2.4: Incidence and mortality of top cancers in world and India. (A) Incidence and
mortality in both sexes. (B) Incidence and mortality in men. (C) Incidence and mortality in
women. Source Globocon 2012
Chapter 2: Review of Literature
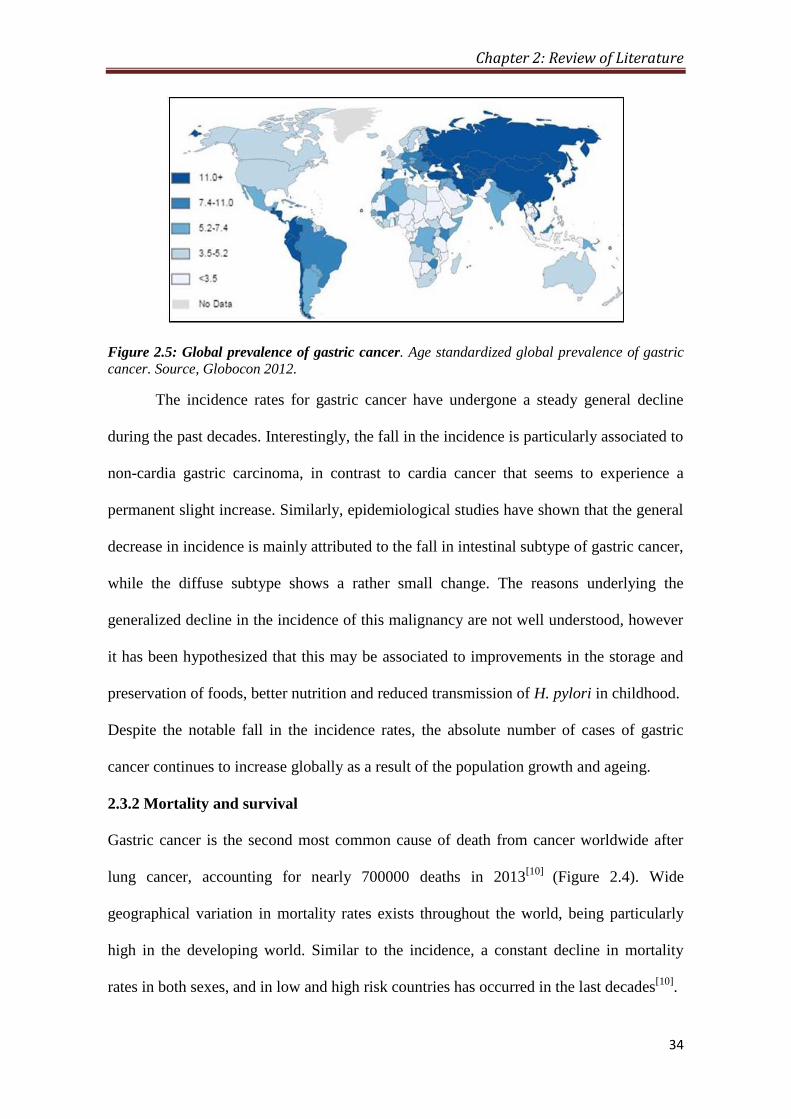
34
Figure 2.5: Global prevalence of gastric cancer. Age standardized global prevalence of gastric
cancer. Source, Globocon 2012.
The incidence rates for gastric cancer have undergone a steady general decline
during the past decades. Interestingly, the fall in the incidence is particularly associated to
non-cardia gastric carcinoma, in contrast to cardia cancer that seems to experience a
permanent slight increase. Similarly, epidemiological studies have shown that the general
decrease in incidence is mainly attributed to the fall in intestinal subtype of gastric cancer,
while the diffuse subtype shows a rather small change. The reasons underlying the
generalized decline in the incidence of this malignancy are not well understood, however
it has been hypothesized that this may be associated to improvements in the storage and
preservation of foods, better nutrition and reduced transmission of H. pylori in childhood.
Despite the notable fall in the incidence rates, the absolute number of cases of gastric
cancer continues to increase globally as a result of the population growth and ageing.
2.3.2 Mortality and survival
Gastric cancer is the second most common cause of death from cancer worldwide after
lung cancer, accounting for nearly 700000 deaths in 2013[10]
(Figure 2.4). Wide
geographical variation in mortality rates exists throughout the world, being particularly
high in the developing world. Similar to the incidence, a constant decline in mortality
rates in both sexes, and in low and high risk countries has occurred in the last decades[10]
.

Chapter 2: Review of Literature
35
Mortality rates are notably high because, in most cases, the disease is diagnosed at
advanced stages when the treatment is likely to fail. In general, the five-year survival for
patients of gastric cancer is below 30% in most countries, despite some variations
according to the country/geographical region[11]
. It is noteworthy, the relatively high 5-
year survival rates of gastric cancer in Japan, which have reached more than 50% in the
last decades. This is thought to be associated with the implementation of X-ray
(photofluorography) based gastric cancer mass screening programs since early in
1960´s[12, 13]
.
2.4 Risk Factors and Prevention of Gastric Cancer
Risk factors for GC are tabulated in Table 2.3; however, some of the important risk
factors strongly associated with gastric cancer are described in detail.
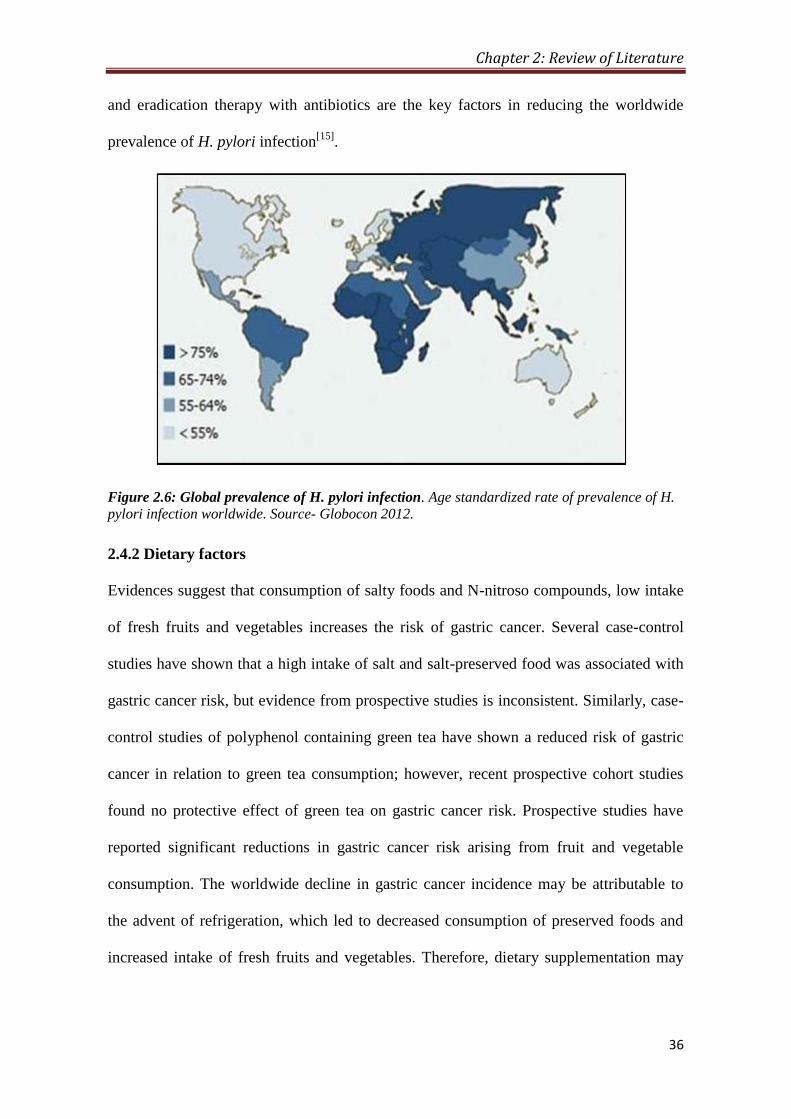
2.4.1 Helicobacter pylori infection
H. pylori is a gram-negative bacillus that colonizes the stomach and may be the most
common chronic bacterial infection worldwide. In 1994, the International Agency for
Research on Cancer classified H. pylori as a type I (definite) carcinogen in human beings
as it increases the risk of gastric cancer by 2 to 16 fold compared to seronegative
individuals. Gastric cancer risk is enhanced by infection with a more virulent strain of H.
pylori carrying the cytotoxin-associated geneA (cagA). Countries with high gastric cancer
rates typically have a high prevalence of H. pylori infection, and the decline in H. pylori
prevalence in developed countries parallels the decreasing incidence of gastric cancer
(Figure 2.6)[14]
.
Prevalence of H. pylori is closely linked to socio-economic factors, such as low
income, poor education, and living conditions during childhood, such as poor sanitation
and overcrowding. Public health measures to improve sanitation and housing conditions
Chapter 2: Review of Literature
36
and eradication therapy with antibiotics are the key factors in reducing the worldwide
prevalence of H. pylori infection[15]
.
Figure 2.6: Global prevalence of H. pylori infection. Age standardized rate of prevalence of H.
pylori infection worldwide. Source- Globocon 2012.
2.4.2 Dietary factors
Evidences suggest that consumption of salty foods and N-nitroso compounds, low intake
of fresh fruits and vegetables increases the risk of gastric cancer. Several case-control
studies have shown that a high intake of salt and salt-preserved food was associated with
gastric cancer risk, but evidence from prospective studies is inconsistent. Similarly, case-
control studies of polyphenol containing green tea have shown a reduced risk of gastric
cancer in relation to green tea consumption; however, recent prospective cohort studies
found no protective effect of green tea on gastric cancer risk. Prospective studies have
reported significant reductions in gastric cancer risk arising from fruit and vegetable
consumption. The worldwide decline in gastric cancer incidence may be attributable to
the advent of refrigeration, which led to decreased consumption of preserved foods and
increased intake of fresh fruits and vegetables. Therefore, dietary supplementation may
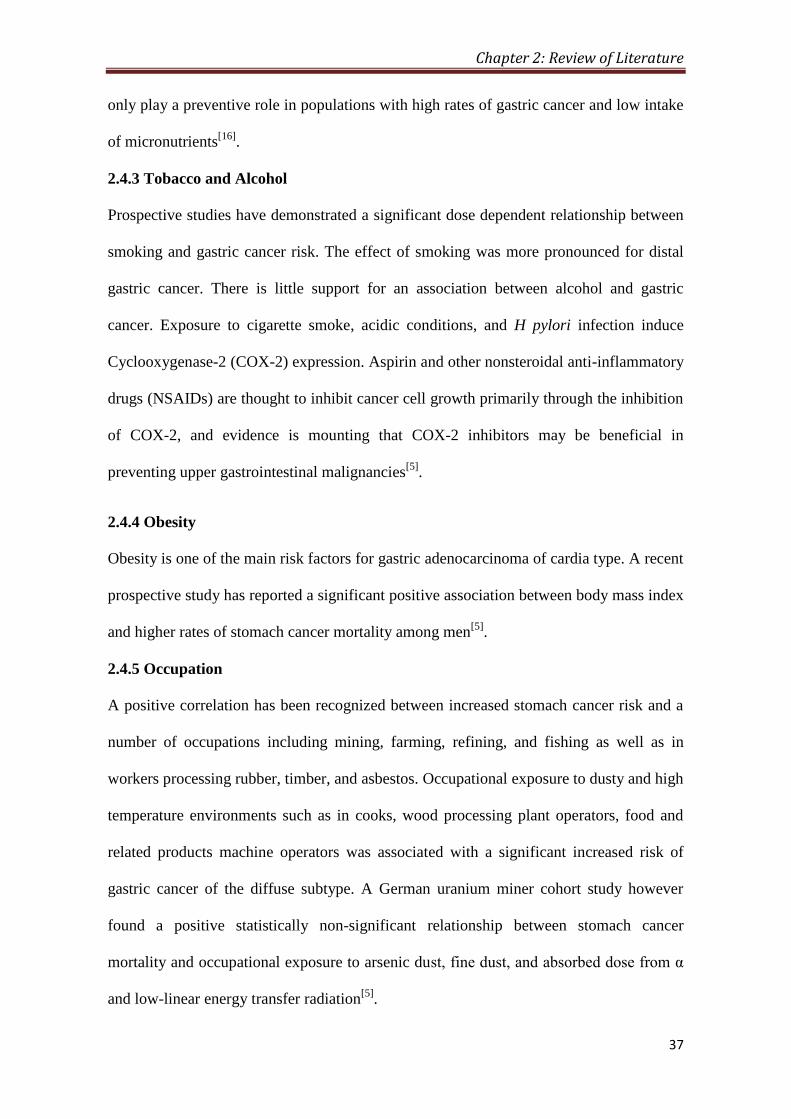
Chapter 2: Review of Literature
37
only play a preventive role in populations with high rates of gastric cancer and low intake
of micronutrients[16]
.
2.4.3 Tobacco and Alcohol
Prospective studies have demonstrated a significant dose dependent relationship between
smoking and gastric cancer risk. The effect of smoking was more pronounced for distal
gastric cancer. There is little support for an association between alcohol and gastric
cancer. Exposure to cigarette smoke, acidic conditions, and H pylori infection induce
Cyclooxygenase-2 (COX-2) expression. Aspirin and other nonsteroidal anti-inflammatory
drugs (NSAIDs) are thought to inhibit cancer cell growth primarily through the inhibition
of COX-2, and evidence is mounting that COX-2 inhibitors may be beneficial in
preventing upper gastrointestinal malignancies[5]
.
2.4.4 Obesity
Obesity is one of the main risk factors for gastric adenocarcinoma of cardia type. A recent
prospective study has reported a significant positive association between body mass index
and higher rates of stomach cancer mortality among men[5]
.
2.4.5 Occupation
A positive correlation has been recognized between increased stomach cancer risk and a
number of occupations including mining, farming, refining, and fishing as well as in
workers processing rubber, timber, and asbestos. Occupational exposure to dusty and high
temperature environments such as in cooks, wood processing plant operators, food and
related products machine operators was associated with a significant increased risk of
gastric cancer of the diffuse subtype. A German uranium miner cohort study however
found a positive statistically non-significant relationship between stomach cancer
mortality and occupational exposure to arsenic dust, fine dust, and absorbed dose from α
and low-linear energy transfer radiation[5]
.

Chapter 2: Review of Literature
38
Table 2.3: Risk factors for development of gastric cancer[17]
Precursor conditions
1 Helicobacter pylori infection
2 Gastric adenomatous polyps
3 Chronic atrophic gastritis and intestinal metaplasia
4 Pernicious anemia
5 Partial gastrectomy for benign disease
6 Dietary Highly salted food
Smoked foods, high fat or contaminated oil intake
Low consumption of fruits and vegetables
7 Habits
Smoking
Consumption of sake or contaminated whiskey
Low socioeconomic status
9 Environmental
Acidic or peaty soil
High nitrate content in water
Elevated lead or zinc in water
Volcanic rock background
Exposure to environmental talc
Extensive use of nitrate fertilizers
Urban residency
10 Genetic
Family history of gastric cancer
Blood type A
Hereditary non-polyposis colon cancer syndrome
Familial adenomatous polyposis syndrome
Peutz–Jeghers syndrome
Li–Fraumeni syndrome
Hyperplastic gastric polyposis
Familial diffuse gastric carcinoma
11 Occupational
Workers in mines and quarries
Painters
Fishermen
Ceramic, clay, and stone workers
Metal industry workers
Agricultural workers
Textile workers
Printers and bookbinders
2.4.6 Genetic predisposition and sporadically occurring mutations
A diverse set of de novo genetic alterations are often found in gastric cancer (Table 2.3).
Familial aggregation of gastric cancer is observed in approximately 10% of the cases, in

Chapter 2: Review of Literature
39
which two or more relatives from the same family are affected. In general, the risk for
developing gastric neoplasia among relatives of gastric cancer patients is estimated to be
2 to 3-fold higher than in persons with no familial background of the disease. The germ-
line mutations of the E-cadherin gene (CDH1) are the most recognized genetic
aberrations found in hereditary gastric cancer, accounting for ~1-3% of the cases. Most of
the gastric cancer cases attributed to CDH1 aberrations are of diffuse subtype, particularly
signet-ring cell adenocarcinoma, and predominantly observed in young individuals[5]
.
2.4.7 Other risk factors
Less common risk factors for gastric cancer include radiation, pernicious anemia, blood
type A, prior gastric surgery for benign conditions, and Epstein- Barr virus. In addition, a
positive family history is a significant risk factor, particularly with genetic syndromes
such as hereditary nonpolyposis colon cancer and Li- Fraumeni syndrome[5]
.
2.5 Pathogenesis of Gastric Cancer
Gastric cancer, like other cancers is the end result of the interplay of many risk factors as
well as protective factors. Environmental and genetic factors are also likely to play a role
in the etiology of the disease. Among the environmental factors, diet and infection with
H. pylori are the most common suspects in gastric carcinogenesis[18]
.
Various epidemiological and pathological studies have suggested that gastric
carcinogenesis develops with the following sequential steps: chronic gastritisatrophy
intestinal metaplasiadysplasia (Figure 2.7). The initial stages have been linked to
excessive salt intake and infection with H. pylori. The genetic factors play an important
role in gastric carcinogenesis; leading to either abnormal gene over expression or
inappropriate expression of normal genes, whose products confer the malignant
phenotype. Advances have been made in the genetic changes mostly of the intestinal type;
its development is probably a multi-step process. The most common genetic

Chapter 2: Review of Literature
40
abnormalities in gastric cancer tend to be loss of heterozygosity of tumor suppressor
genes, particularly of p53 or ‘Adenomatous Polyposis Coli (APC)’ gene. The latter leads
to gastric oncogenesis through changes related to E-cadherin-catenin complex, which
plays a critical role in the maintenance of normal tissue architecture[18]
.
Figure 2.7: Proposed multistep pathway in the pathogenesis of gastric cancer. Infection with
Helicobacter pylori is the common initiating event in most cases, and the presence of the cag
pathogenicity island is associated with more severe disease. Host genetic polymorphisms,
resulting in high production of interleukin-1β and tumor necrosis factor-α and low production of
interleukin-10, contribute to gastric cancer risk. Accumulation of genetic defects within gastric
lesions may play a role in later steps. Gray arrows represent steps that are potentially
reversible[17]
.
2.6 Diagnosis of Gastric Cancer
The initial diagnosis of gastric carcinoma often is delayed because up to 80 percent of
patients are asymptomatic during the early stages of stomach cancer. Weight loss,
abdominal pain, nausea and vomiting, early satiety, and peptic ulcer symptoms may
accompany late-stage gastric cancer. Patients presenting with the aforementioned
symptoms and those with multiple risk factors for gastric carcinoma require further
workup. Esophagogastroduodenoscopy (EGD) and double- contrast barium swallow is

Chapter 2: Review of Literature
41
the diagnostic imaging procedure which provides preliminary information of presence or
absence and benign or malignant feature of lesion. Further confirmation is done by
multiple biopsy specimens obtained from any visually suspicious areas along with
computed tomographic (CT) and endoscopic ultrasonography (EUS) scanning[19-21]
.
2.7 Treatment of Gastric Cancer
2.7.1 Surgery
The only potentially curative treatment for localized gastric cancer is complete surgical
resection. The selection of the surgical procedure in patients with gastric cancer primarily
is based on the location of the tumor (proximal, middle or distal), the growth pattern seen
on biopsy specimens (depth of tumor invasion, T1, T2 or T3), and the expected location
of lymph node metastases; D1- perigastric lymph nodes, D2- nodes along the hepatic, left
gastric, celiac, and splenic arteries or D3- removal of all D1/D2 nodes plus those within
the porta hepatis and periaortic nodes[22]
(Figure 2.8 and Table 2.4)
Figure 2.8: TNM staging of gastric cancer. (A) T-stages or depth of invasion. (B) N-stages or
involvement of lymph nodes. Source-Gastroenterology and hepatology, Jhon Hokins Medicine
The extensive lymphatic network of the stomach and the propensity for
microscopic extension, the traditional surgical approach attempts to maintain a 4 to 5-cm
margin proximally and distally to the primary lesion. Many studies report that nodal

Chapter 2: Review of Literature
42
involvement indicates a poor prognosis, requiring the use of more aggressive surgical
approaches to attempt the removal of involved lymph nodes[23]
.
Table 2.4: Staging of gastric cancer as per American Joint Committee on
Cancer Staging for Gastric Cancer
Tumor (T) stage
TX Primary tumor cannot be assessed
T0 No evidence of primary tumor
T1s Carcinoma in situ: intra-epithelial tumor without invasion of the lamina propia
T1 Tumor invades lamina propria or submucosa
T2 Tumor invades muscularis propria or subserosa
T2a Tumor invades muscularis propria
T2b Tumor invades subserosa
T3 Tumor penetrates serosa (visceral peritoneum) without invasion of adjacent structures
T4 Tumor invades adjacent structures
Nodal (N) Stage
NX Regional lymph node(s) cannot be assessed
N0 No regional lymph node metastasis
N1 Metastasis in 1–6 regional lymph nodes
N2 Metastasis in 7–15 regional lymph nodes
N3 Metastasis in more than 15 regional lymph nodes
Metastasis (M) Stage
MX Presence of distant metastasis cannot be assessed
M0 No distant metastasis
M1 Distant metastasis
Stage grouping
Stage 0 T1s N0 M0
Stage IA T1 N0 M0
Stage IB T1 N1 M0; T2a/b N0 M0
Stage II T1 N2 M0; T2a/b N1 M0; T3 N0 M0
Stage IIIA T2a/b N2 M0; T3 N1 M0; T4 N0 M0
Stage IIIB T3 N2 M0
Stage IV T1-3 N3 M0; T4 N1-3 M0; Any T Any N M1
2.7.4 Chemotherapy
Several trials have shown a significant survival advantage by the use of chemotherapy;
however, none of them have reported chemotherapy as a definitive treatment for gastric
cancer. Chemotherapy can be given before surgery (neoadjuvant treatment) or after
surgery (adjuvant treatment). Neoadjuvant treatment shrinks the size of tumor and
facilitates the curative resection; whereas adjuvant treatment is given to kill any residual
cancer cell that may have left behind after surgery. 5-FU, Cecitabine, Carboplatin,

Chapter 2: Review of Literature
43
Cisplatin, Docetaxel, Epirubicin, Irinotecan, Oxaliplatin and Paclitaxel are the most
common drugs used as a single agent or in combination while treating the gastric cancer.
Usually three cycles of chemotherapy is given before and after surgery, each cycle last for
three weeks. Some of the most common combinations are: ECF
(epirubicin, cisplatin and fluorouracil), EOF ( epirubicin, oxaliplatin and fluorouracil),
ECX (epirubicin, cisplatin and capecitabine) and EOX (epirubicin, oxaliplatin, and
capecitabine).
2.7.3 Radiotherapy
A modest survival advantage has been shown to radiotherapy in patients with gastric
cancer. The dosing regimen of radiation therapy is 45 to 50 Gy in 20 to 30 fractions.
External beam radiation therapy is often used to treat stomach cancer. Often, special types
of external beam radiation, such three-dimensional conformal radiation therapy (3D-
CRT) and intensity modulated radiation therapy (IMRT) are also used. The adverse
effects caused by radiation therapy include gastrointestinal toxicity from dose-limiting
structures surrounding the stomach, like intestines, liver, kidneys, spinal cord, and heart.
2.7.4 Combination therapy
Studies have shown that patients receiving combined chemo-radiation therapy have
demonstrated improved disease free survival and improved overall survival rates.
Preoperative chemotherapy also may be useful in patients with locally advanced gastric
cancer, offering a chance for surgery with curative intention in patients with an otherwise
fatal long-term prognosis[24]
.
2.8 Epigenetics
2.8.1 Definition and mechanism of epigenetics
The field of genetics includes the study of point mutation, deletion, insertion, gene
amplification, chromosomal deletion/inversion/translocation, and allelic loss/gain.
Chapter 2: Review of Literature
44
However, the appreciation of epigenetics is more recent which was originally defined by
C. H. Waddington as ‘the causal interactions between genes and their products, which
bring the phenotype into being’[25]
. Epigenetics in today’s modern terms can be
mechanistically defined as "the sum of the alterations to the chromatin template that
collectively establish and propagate different patterns of gene expression (transcription)
and silencing from the same genome".
Figure 2.9: Schematic representation of fundamental mechanisms of epigenetic gene
regulation[26]
.
Epigenetic mechanisms include DNA methylation, noncoding RNA, histone
variants and histone post translational modifications[27-29]
(Figure 2.9). These mechanisms
work together to regulate the functioning of the genome by altering the local structural
dynamics of chromatin, mostly regulating its accessibility and compactness. The interplay
of these mechanisms makes an ‘epigenetic landscape’ that regulates the way the
mammalian genome manifests itself in different cell types, developmental stages and
disease states[30-33]
. Failure of the proper maintenance of heritable epigenetic marks can
result in inappropriate activation or inhibition of various signaling pathways and lead to
disease states such as cancer[34, 35]
. Epigenetic mechanisms also cooperate with genetic
alteration and work together at all stages of cancer development from initiation to
progression[36]
. Unlike genetic alterations, epigenetic changes are reversible in nature and

Chapter 2: Review of Literature
45
can be restored to their normal state by epigenetic therapy. These findings have led to a
global initiative to understand the role of epigenetics in tumorigenesis and further explore
its utility in disease diagnosis, prognosis and therapy.
2.8.2 Chromatin
Chromatin is the macromolecular complex of DNA, histone proteins and non-histone
proteins, which provides the scaffold for the packaging of genome. Human nuclear DNA
is condensed into nucleosomes, which consist of 146 base pairs of DNA wrapped twice
around an octamer core of histones (two molecules each of histones H2A, H2B, H3 and
H4) (Figure 2.9 and 2.10). The core histones are predominantly globular except for their
N-terminal “tails,” which are unstructured[37]
. In between core nucleosomes, the linker
histone H1 attaches and facilitates further compaction. Each nucleosome core particle
represents the basic repeating unit in chromatin and exists in the form of arrays that forms
basis for higher-order chromatin structure. Nucleosomes are connected by a linker DNA
of variable length (10-80 base pairs) that forms a 10nm beads on a string array. The
positioning of histones along the DNA is mediated by ATP-dependent nucleosome
remodeling complexes generating nucleosome free or dense chromatin. Apart from H4,
all histones are known to have multiple subtypes called “variants, which undergo various
covalent post-translational modifications (PTM)[29]
. Combination of variants and PTMs of
histones modulate the affinity of histones for DNA and DNA-associated proteins,
thereby, governing the transcriptional activity and the availability of DNA for
recombination, replication and repair.
2.8.3 Histone post-translational modifications
Vincent Allfrey’s pioneering studies suggested histones can undergo variety of covalent
post-translational modifications (PTM)[38]
. Today, modifications of histones are central in
the regulation of chromatin dynamics and are the target for variety of covalent
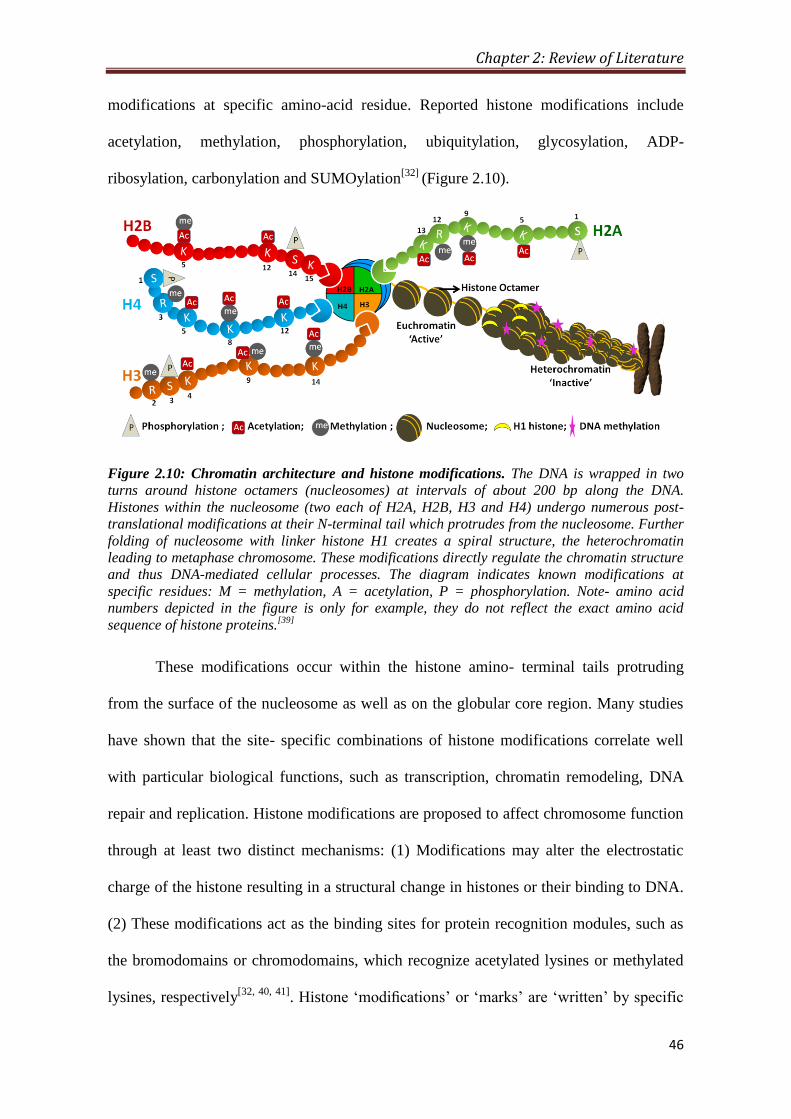
Chapter 2: Review of Literature
46
modifications at specific amino-acid residue. Reported histone modifications include
acetylation, methylation, phosphorylation, ubiquitylation, glycosylation, ADP-
ribosylation, carbonylation and SUMOylation[32]
(Figure 2.10).
Figure 2.10: Chromatin architecture and histone modifications. The DNA is wrapped in two
turns around histone octamers (nucleosomes) at intervals of about 200 bp along the DNA.
Histones within the nucleosome (two each of H2A, H2B, H3 and H4) undergo numerous post-
translational modifications at their N-terminal tail which protrudes from the nucleosome. Further
folding of nucleosome with linker histone H1 creates a spiral structure, the heterochromatin
leading to metaphase chromosome. These modifications directly regulate the chromatin structure
and thus DNA-mediated cellular processes. The diagram indicates known modifications at
specific residues: M = methylation, A = acetylation, P = phosphorylation. Note- amino acid
numbers depicted in the figure is only for example, they do not reflect the exact amino acid
sequence of histone proteins.[39]
These modifications occur within the histone amino- terminal tails protruding
from the surface of the nucleosome as well as on the globular core region. Many studies
have shown that the site- specific combinations of histone modifications correlate well
with particular biological functions, such as transcription, chromatin remodeling, DNA
repair and replication. Histone modifications are proposed to affect chromosome function
through at least two distinct mechanisms: (1) Modifications may alter the electrostatic
charge of the histone resulting in a structural change in histones or their binding to DNA.
(2) These modifications act as the binding sites for protein recognition modules, such as
the bromodomains or chromodomains, which recognize acetylated lysines or methylated
lysines, respectively[32, 40, 41]
. Histone ‘modifications’ or ‘marks’ are ‘written’ by specific
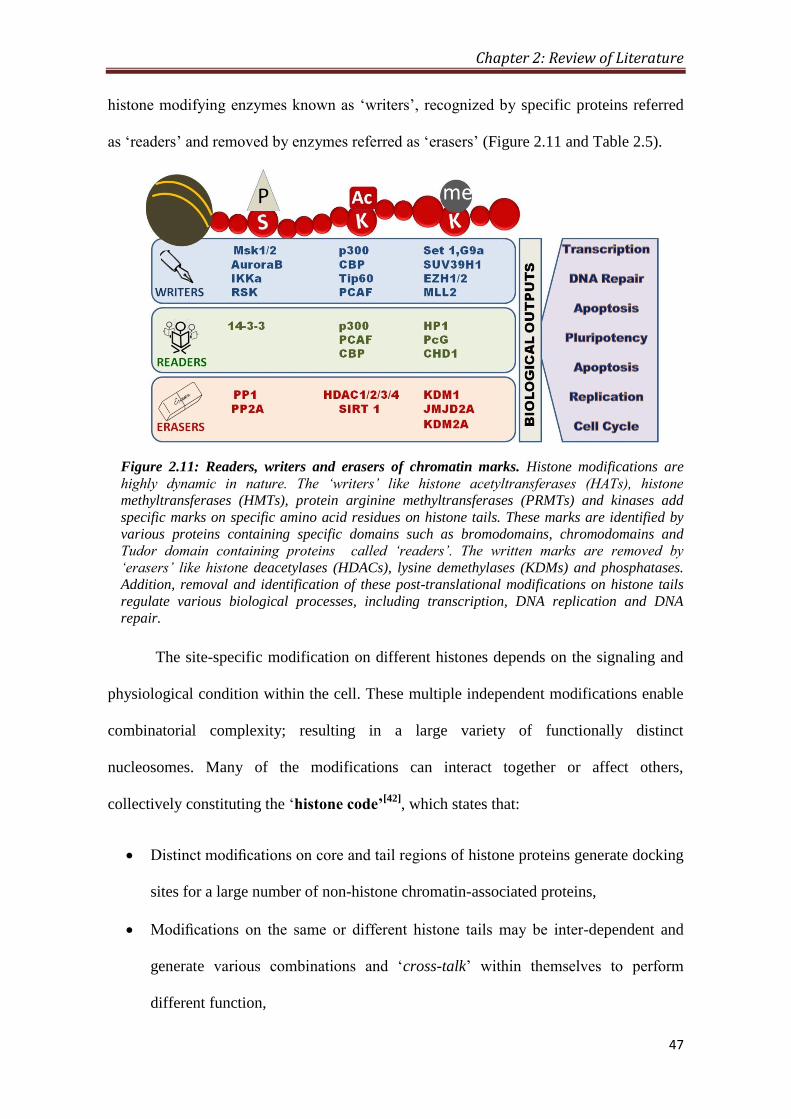
Chapter 2: Review of Literature
47
histone modifying enzymes known as ‘writers’, recognized by specific proteins referred
as ‘readers’ and removed by enzymes referred as ‘erasers’ (Figure 2.11 and Table 2.5).
Figure 2.11: Readers, writers and erasers of chromatin marks. Histone modifications are
highly dynamic in nature. The ‘writers’ like histone acetyltransferases (HATs), histone
methyltransferases (HMTs), protein arginine methyltransferases (PRMTs) and kinases add
specific marks on specific amino acid residues on histone tails. These marks are identified by
various proteins containing specific domains such as bromodomains, chromodomains and
Tudor domain containing proteins called ‘readers’. The written marks are removed by
‘erasers’ like histone deacetylases (HDACs), lysine demethylases (KDMs) and phosphatases.
Addition, removal and identification of these post-translational modifications on histone tails
regulate various biological processes, including transcription, DNA replication and DNA
repair.
The site-specific modification on different histones depends on the signaling and
physiological condition within the cell. These multiple independent modifications enable
combinatorial complexity; resulting in a large variety of functionally distinct
nucleosomes. Many of the modifications can interact together or affect others,
collectively constituting the ‘histone code’[42]
, which states that:
Distinct modifications on core and tail regions of histone proteins generate docking
sites for a large number of non-histone chromatin-associated proteins,
Modifications on the same or different histone tails may be inter-dependent and
generate various combinations and ‘cross-talk’ within themselves to perform
different function,

Chapter 2: Review of Literature
48
Distinct regions of higher order chromatin, such as euchromatic or heterochromatic
domains, are largely depend on the local concentration and combination of
differentially modified nucleosomes,
‘Binary switches ’represent the differential readout of distinct combinations of
marks on two neighboring residues, where one modification influence the binding
of an effector protein onto another modifications on an adjacent or nearby residue
‘Modification cassettes’ signifies combinations of modifications on adjacent sites
within these short clusters lead to distinct biological readouts
2.8.3.1 Histone acetylation
Allfrey et al. first reported histone acetylation in 1964. This modification is almost
invariably associated with activation of transcription. Acetylation of lysine is highly
dynamic and regulated by the opposing action of two families of enzymes, histone
acetyltransferases (HATs) and histone deacetylases (HDACs)[43]
. The HATs utilize acetyl
Co A as cofactor and catalyse the transfer of an acetyl group to the ε- amino group of
lysine side chains. In doing so, they neutralize the lysine’s positive charge and this action
has the potential to weaken the interactions between histones and DNA. HDAC enzymes
oppose the effects of HATs and reverse lysine acetylation, an action that restores the
positive charge of the lysine. This potentially stabilizes the local chromatin architecture
and is consistent with HDACs being predominantly transcriptional repressors.
2.8.3.2 Histone methylation
Histone methylation mainly occurs on the side chains of lysines and arginines. Unlike
acetylation and phosphorylation, histone methylation does not alter the charge of the
histone protein. Histone methylation on lysines may be mono- , di- or tri- methylated,
whereas arginines may be mono or di- methylated with either both methyl groups on one
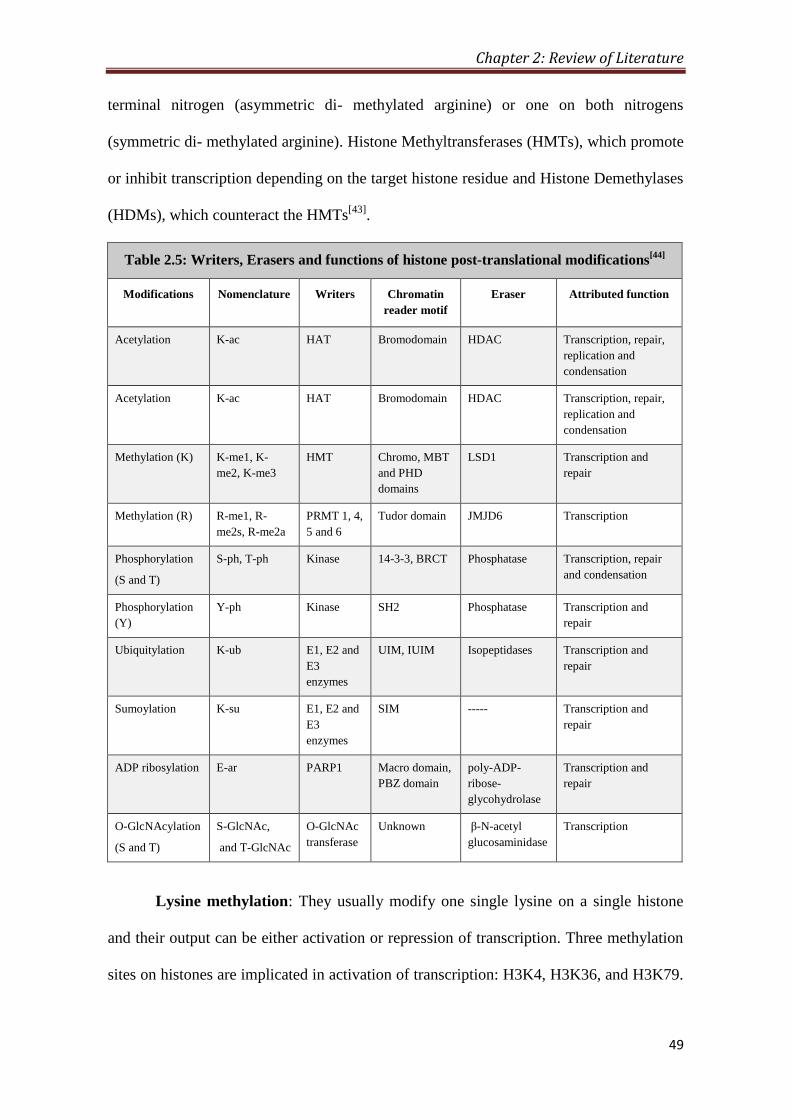
Chapter 2: Review of Literature
49
terminal nitrogen (asymmetric di- methylated arginine) or one on both nitrogens
(symmetric di- methylated arginine). Histone Methyltransferases (HMTs), which promote
or inhibit transcription depending on the target histone residue and Histone Demethylases
(HDMs), which counteract the HMTs[43]
.
Table 2.5: Writers, Erasers and functions of histone post-translational modifications[44]
Modifications Nomenclature Writers Chromatin
reader motif
Eraser Attributed function
Acetylation K-ac HAT Bromodomain HDAC Transcription, repair,
replication and
condensation
Acetylation K-ac HAT Bromodomain HDAC Transcription, repair,
replication and
condensation
Methylation (K) K-me1, K-
me2, K-me3
HMT Chromo, MBT
and PHD
domains
LSD1 Transcription and
repair
Methylation (R) R-me1, R-
me2s, R-me2a
PRMT 1, 4,
5 and 6
Tudor domain JMJD6 Transcription
Phosphorylation
(S and T)
S-ph, T-ph Kinase 14-3-3, BRCT Phosphatase Transcription, repair
and condensation
Phosphorylation
(Y)
Y-ph Kinase SH2 Phosphatase Transcription and
repair
Ubiquitylation K-ub E1, E2 and
E3
enzymes
UIM, IUIM Isopeptidases Transcription and
repair
Sumoylation K-su E1, E2 and
E3
enzymes
SIM ----- Transcription and
repair
ADP ribosylation E-ar PARP1 Macro domain,
PBZ domain
poly-ADP-
ribose-
glycohydrolase
Transcription and
repair
O-GlcNAcylation
(S and T)
S-GlcNAc,
and T-GlcNAc
O-GlcNAc
transferase
Unknown β-N-acetyl
glucosaminidase
Transcription
Lysine methylation: They usually modify one single lysine on a single histone
and their output can be either activation or repression of transcription. Three methylation
sites on histones are implicated in activation of transcription: H3K4, H3K36, and H3K79.
Chapter 2: Review of Literature
50
Three lysine methylation sites are connected to transcriptional repression: H3K9, H3K27,
and H4K20[45]
.
Arginine methylation: Like lysine methylation, arginine methylation can be
either activate or repress the transcription. There are two classes of arginine
methyltransferases, the typeI and typeII enzymes. The two types of arginine
methyltransferases form a relatively large protein family (11 members), the members of
which are referred to as Protein Arginine Methyltransferases (PRMTs). All of these
enzymes transfer a methyl group from SAM (S- adenosyl methionine) to the ω- guanidino
group of arginine within a variety of substrates[45]
.
2.8.3.3 Histone phosphorylation
The phosphorylation of histones is highly dynamic. It takes place on serine, threonine and
tyrosine, predominantly, but not exclusively, in the N- terminal histone tails. The levels of
the modification are controlled by kinases and phosphatases that add and remove the
modification, respectively. Histone kinases transfer a phosphate group from ATP to the
hydroxyl group of the target amino- acid side chain. In doing so, the modification adds
significant negative charge to the histone that undoubtedly influences the chromatin
structure[46]
.
2.8.4 Cross-talk of Histone Post-translational Modifications
It is now well established that there is an intense cross-talk between histone modifications
to drive distinct downstream functions. Cross regulation can occur in different flavors: on
the one hand, one modification can promote/block the addition of another modification.
On the other hand, one modification can stimulate/block the removal of another
modification. Moreover, the cross-talk can occur on the same histone (cross-talk in cis),
between histones within the same nucleosome (cross-talk in trans) or across nucleosomes
(nucleosome cross-talk). An increasing number of histone modifying complexes are

Chapter 2: Review of Literature
51
found to contain more than one distinct enzymatic activities. These enzymes can act in
concert to determine the functional status of chromatin by coordinating multiple histone
modifications[47, 48]
.
Figure 2.12: Histone modification cross-talk. Crosstalk among H3S10ph, H3K0ac and
H3K14ac at promoters of immediate early gene[49]
.
One of the first examples for cross-regulation of histone modifications in cis is
between H3K9 methylation and the neighboring H3S10 phosphorylation[50]
(Figure 2.12).
H3S10 phosphorylation is required for chromosome condensation and segregation during
mitosis[51]
. H3K9me3 can be specifically bound by the chromodomain of heterochromatin
protein 1 (HP1) and has a pivotal role in heterochromatin formation and propagation of
pericentric heterochromatin[52]
. However, in mitosis, HP1 is released from condensed
chromatin despite the persistence of its recruiting mark H3K9me3[53, 54]
. To explain this
methyl-phospho switch model has been proposed. This methyl-phospho switch model is
not limited to directly neighboring residues. For, example, H3T6 phosphorylation by
PKCbI kinase can block H3K4 demethylation by the demethylases LSD1 (specific for
H3K4me1/me2) and JARID1B (specific for H3K4me2/me3) and it redirects their
enzymatic activity towards H3K9 methylation[55]
.
2.9 Histone Post-translational Modifications in Cancer
2.9.1 Dynamics of histone PTMs in cancer
In cancer, several histone PTMs have been reported to be misregulated and called as
histone onco-modifications (Figure 2.13); however, their involvement in cancer patho-
physiological characteristics like cellular transformation, angiogenesis and metastasis etc.
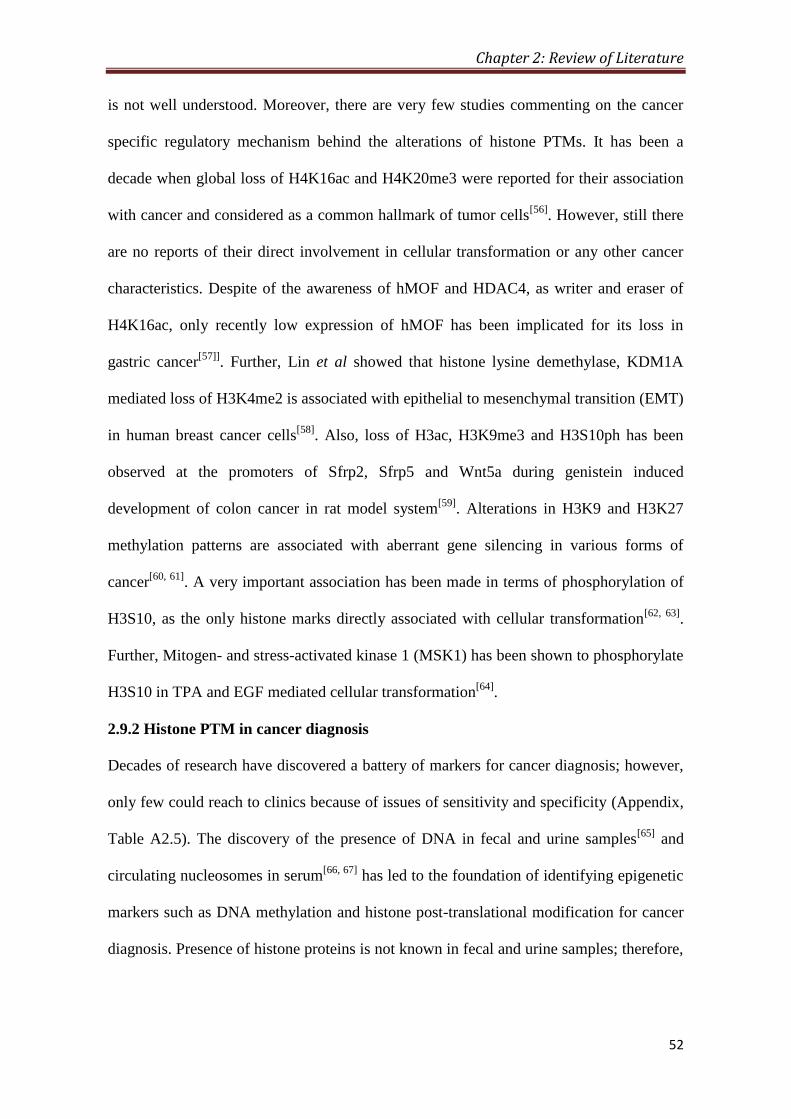
Chapter 2: Review of Literature
52
is not well understood. Moreover, there are very few studies commenting on the cancer
specific regulatory mechanism behind the alterations of histone PTMs. It has been a
decade when global loss of H4K16ac and H4K20me3 were reported for their association
with cancer and considered as a common hallmark of tumor cells[56]
. However, still there
are no reports of their direct involvement in cellular transformation or any other cancer
characteristics. Despite of the awareness of hMOF and HDAC4, as writer and eraser of
H4K16ac, only recently low expression of hMOF has been implicated for its loss in
gastric cancer[57]]
. Further, Lin et al showed that histone lysine demethylase, KDM1A
mediated loss of H3K4me2 is associated with epithelial to mesenchymal transition (EMT)
in human breast cancer cells[58]
. Also, loss of H3ac, H3K9me3 and H3S10ph has been
observed at the promoters of Sfrp2, Sfrp5 and Wnt5a during genistein induced
development of colon cancer in rat model system[59]
. Alterations in H3K9 and H3K27
methylation patterns are associated with aberrant gene silencing in various forms of
cancer[60, 61]
. A very important association has been made in terms of phosphorylation of
H3S10, as the only histone marks directly associated with cellular transformation[62, 63]
.
Further, Mitogen- and stress-activated kinase 1 (MSK1) has been shown to phosphorylate
H3S10 in TPA and EGF mediated cellular transformation[64]
.
2.9.2 Histone PTM in cancer diagnosis
Decades of research have discovered a battery of markers for cancer diagnosis; however,
only few could reach to clinics because of issues of sensitivity and specificity (Appendix,
Table A2.5). The discovery of the presence of DNA in fecal and urine samples[65]
and
circulating nucleosomes in serum[66, 67]
has led to the foundation of identifying epigenetic
markers such as DNA methylation and histone post-translational modification for cancer
diagnosis. Presence of histone proteins is not known in fecal and urine samples; therefore,
Chapter 2: Review of Literature
53
histone posttranslational modifications have been utilized as cancer diagnostic markers
using circulating nucleosomes (cNUCs) in serum samples.
Figure 2.13: Histone onco-modifications. Functional consequences of histone onco-
modifications. Red-decrease, Greeen-increase[68]
Two histone methylation marks, H3K9me3 and H4K20me3, the hallmarks of
pericentric heterochromatin[69]
, were investigated in circulating nucleosomes by
subsequent studies. Ugur et al. investigated the correlation between the H3K9me3 and
H4K20me3 of cNUCs in healthy subjects and patients with colorectal cancer and multiple
myeloma and found low level of these PTMs in cancer[70]
. Further, the same group
showed ALU115 DNA sequence associated high level of H3K9Me in multiple myeloma
patients compared to healthy individuals[71]
. ChIP based analysis of circulating
nucleosomes in serum samples by Gloria et al reported a low level of H3K9me3 and
H4K20me3 in patients with colorectal, pancreatic, breast and lung cancer compared to
healthy control[72, 73]
. Moreover, H3K9me3 and H4K20me3 have been found to be lower
at the pericentromeric satellite II repeat in patients with CRC when compared with
healthy controls or patients with multiple myeloma. In summary, identification of histone
PTMs from serum isolated circulating nucleosomes have open the doors of immense

Chapter 2: Review of Literature
54
possibility that blood samples collected by cancer patients can also be used for histone
PTM based cancer diagnosis.
2.9.3 Histone PTM in cancer prognosis
In cancer, to date, histones PTMs have been mostly studied for their potential as
prognostic marker (Figure 2.14 and Appendix, Table A2.5). The first report in this area
strongly suggested the utility of histone PTMs in cancer diagnosis and showed loss of
H4K16ac and H4K20me3 in several cancers and establish these two marks as a hallmark
of tumor and establishes the correlation of H4K16ac with tumor progression[56]
. Further,
loss of H4K20me3 is as well observed in animal models of carcinogenesis[74, 75]
. A study
on prostate cancer showed a positive correlation of H3K18Ac, H4K12Ac and H4R3Me2
with increasing tumor grade[76]
. Moreover, independently of other clinical and pathologic
parameters, high rate of tumor recurrence in low-grade prostate carcinoma patients is
associated with low level of H3K4me2[76]
. A decrease of H3K4me2/me3 is observed in a
range of neoplastic tissues such as non-small cell lung cancer, breast cancer, renal cell
carcinoma and pancreatic adenocarcinoma serving as a predictor of clinical outcomes[77-
82].
Acetylation of histone H3K9 has shown ambiguous results with the increase in
some and decrease in other cancers. Decrease of H3K9ac in prostate and ovarian tumors
has been linked with tumor progression, histological grading and clinical stage. In
agreement, a decrease in H3K9ac is coupled with a poor prognosis for these patients[76, 83,
84]. Patients with non-small cell lung adenocarcinoma exhibited better prognosis on the
reduction of H3K9ac expression level[79, 85]
. In contrast, in hepatocellular carcinoma an
increase in H3K9ac levels was reported[83]
. Methylation of the same residue K9 of histone
H3 requires loss of H3K9ac and is also linked to number of cancers. An increase in H3K9
methylation, leading to aberrant gene silencing, has been found in various forms of cancer
Chapter 2: Review of Literature
55
and high level of H3K9me3 were associated with poor prognosis in patients with gastric
adenocarcinoma[60, 86]
. However, in patients with acute myeloid leukemia decrease in
H3K9me3 found to be associated with better prognosis[87]
. Loss of H3K18ac is correlated
with poor prognosis in patients with prostate, pancreatic, lung, breast and kidney cancers,
and tumor grade suggesting loss of this modification is an important event in tumor
progression[76, 78, 81]
. Consistent with this observation, the Kurdistani laboratory
demonstrated that oncogenic transformation by the adenovirus protein E1a is
accompanied by dramatic changes in the genomic location of H3K18 acetylation[88, 89]
. In
addition, H3K18 hypoacetylation even strongly correlated with an increased risk of tumor
recurrence in patients with low-grade prostate cancer[76]
. However, in contrast to the
report that found that lower levels of H3K18ac predicts poor survival, low expression of
this histone mark has been associated with a better prognosis for patients with esophageal
squamous cell carcinoma or glioblastoma[85, 90]
. This indicates, once again, that one
histone modification can predict differential prognosis in different cancer types and that
histone marks may possess tissue-specific features. Another histone mark, H3K27me3
has been evaluated as a prognostic factor in prostate, breast, ovarian, pancreatic and
esophageal cancers, however, some of the results are perplexing and need further
investigation. In esophageal cancer high level of H3K27me3 correlates with poor
prognosis, whereas, in case of breast, prostate, ovarian and pancreatic cancers low level
of H3K27me3 had significantly shorter overall survival time when compared with those
with high H3K27me3 expression[90-93]
.
Using the ChIP-on-chip technique, Zhang et al identified candidate genes with
significant differences in H3K27me3 in gastric cancer samples compared to adjacent non-
neoplastic gastric tissues[94]
. These genes included oncogenes, tumor suppressor genes,
cell cycle regulators, and genes involved in cell adhesion. Moreover, this investigation

Chapter 2: Review of Literature
56
demonstrated that higher levels of H3K27me3 produce gene expression changes in
MMP15, UNC5B, and SHH. In non-small cell lung cancer, enhanced H3K27me3 was
correlated with longer overall survival (OS) and better prognosis. Moreover, both
univariate and multivariate analyses indicated that H3K27me3 level was a significant and
independent predictor of better survival. Recently, a study showed K27M mutations of
histone H3.3 variants in 31% pediatric glioblastoma tumors suggesting another level of
complexity in alteration of histone PTMs in cancer which is independent of histone
modifying enzymes[95]
. Mass spectrometry based analysis showed high level of H3K27ac
in colorectal cancer than the corresponding normal mucosa[96]
. Immunohistochemical
analysis on metachronous liver metastasis of colorectal carcinomas by Tamadawa et al
has correlated H3K4me2 and H3K9ac with the tumor histological type. In addition, lower
levels of H3K4me2 correlated with a poor survival rate and also found to be an
independent prognostic factor[97]
.
Figure 2.14: Deregulation of histone PTMs in cancer. Histone onco-modifications; post-
translation modifications on histone tails that occur in cancer cells are represented. Red-
decrease, Greeen-increase[68]
Recently, DNA damage mark ƳH2AX also have shown its prognostic value. In
triple negative breast tumors, high level of ƳH2AX was associated with poor overall
survival and which was further found to be associated with shorter telomere length[98, 99]
.

Chapter 2: Review of Literature
57
In colorectal cancer a high ƳH2AX expression in CRC tissues was associated with tumor
stage and peri-neural invasion. Furthermore, a high ƳH2AX expression was associated
with poor DMFS and OS. Cox regression analysis also revealed that ƳH2AX was an
independent predictor of DMFS and OS. A high ƳH2AX expression in CRC tissues is
associated with a more malignant cancer behavior, as well as poor patient survival[100]
.
ELISA based analysis in glioblastoma multiformes tumors showed the high level of
H3T6ph, H3S10p and H3Y41ph as signatures associated with a poor overall survival[101]
.
Increase in H3S10ph has been associated with poor prognosis in several cancers including
glioblastoma multiformes, cutaneous nodular melanoma, cutaneous melanoma, breast
cancer, esophageal squamous cell carcinoma, gastric cancer, melanoma and
nasopharyngeal carcinoma[101-109]
.
2.9.4 Histone PTM in cancer treatment
Reversible nature of histone modifications has drawn major attention of scientific
community to study the molecular mechanism regulating the alteration in histone post-
translational modifications. Such efforts have led to the discovery of several histone
modifying enzymes[110]
and their chemical inhibitors[111]
which has emerged as an
attractive strategy in cancer treatment. Targeting these enzymes can reactivate
epigenetically silenced tumor-suppressor genes by modulating the levels of histone
posttranslational modifications[112]
. Further, these drugs have also given additional
advantage in the area of combinatorial chemotherapy[113, 114]
.
2.9.4.1 Histone acetyl-transferases / Histone deacetylases as the targets
Histone acetyltransferases (HATs) are grouped into a few evolutionary conserved major
families (Figure 2.15, Table 2.7 and Appendix, Table A2.5). The misregulation of HATs
induced by mutation, translocation and overexpression has been correlated with
hematological malignancies and solid tumors. In AML, translocation of CBP (CREB-

Chapter 2: Review of Literature
58
binding protein) leads to the formation of a chimeric protein fused with the monocytic
leukemia zinc finger protein (MOZ), a transcriptional coactivator with intrinsic HAT
activity. MOZ-CBP and MOZ-p300 cause aberrant gene expression, leading directly to
malignant hematopoiesis. Similarly, mutation or deletion of p300 correlates with solid
tumors, such as colorectal, gastric, breast, ovarian and epithelial cancer. Therefore, the
relevance of HATs misregulation in pathology and understanding the implications of
pleiotropic effects of acetylation are efforts to develop and identify a set of novel
compounds that can modulate counteracting HATs-HDACs by reversing acetylation
status (Table 2.8).
Figure 2.15: Deregulation of histone modifiers in cancer. Enzymes for the respective histone
onco-modifications are represented in green when found to be upregulated or in red if reported
as downregulated in cancer cells[68]
.
Eighteen distinct HDACs have been identified so far and they are classified into
four groups based on their structural divergence, namely class I, II, III and IV HDACs
[115](Table 2.6). Class I and II HDACs are considered as ‘classical’ HDACs while class III
is a family of nicotinamide adenine dinucleotide (NAD+)-dependent proteins. Class IV
HDAC is an atypical category of its own, based solely on its DNA sequence similarity to
the others (Table 2.6). Although there are no conclusive data about the pattern of HDAC
expression in human cancer, there are a number of studies showing altered expression of

Chapter 2: Review of Literature
59
individual HDACs in tumor samples. For example, there is an increase in HDAC1
expression in gastric prostate, colon, and breast carcinomas. Overexpression of HDAC2
has been found in cervical and gastric cancers, and in colorectal carcinoma with loss of
APC expression. Other studies have reported high levels of HDAC3 and HDAC6
expression in colon and breast cancer specimens, respectively (Figure 2.15, Table 2.6 and
Appendix, Table A2.5).
Table 2.6: Classification of known Histone deacetylases (HDACs)[115]
Class I Class II Class III Class IV
HD
AC
Su
b-c
ellu
lar
Lo
cali
zati
on
HD
AC
Su
b-c
ellu
lar
Lo
cali
zati
on
HD
AC
Su
b-c
ellu
lar
Lo
cali
zati
on
HD
AC
Su
b-c
ellu
lar
Lo
cali
zati
on
HDAC1
Nu
cleu
s
HDAC4
Nu
cleu
s/ C
yto
pla
sm
SIRT1 Nucleus/Cytoplasm HDAC11 nucleus/cytoplasm
HDAC2 HDAC5 SIRT2 Cytoplasm
HDAC3 HDAC7 SIRT3 Nucleus/Mitochondria
HDAC8 HDAC9 SIRT4 Mitochondria
HDAC6 SIRT5 Mitochondria
HDAC10 SIRT Nucleus
SIRT7 Nucleus
Aberrant gene silencing in cancer is also associated with a loss of histone
acetylation. Histone acetylations are regulated through HAT (histone acetyltransferases)
and HDAC (histone deacetylases). Therefore, re-establishing normal histone acetylation
patterns through treatment with HAT/ HDAC inhibitors have been shown to have anti-
tumorigenic effects including growth arrest, apoptosis and the induction of
differentiation[116]
. Some of the prominent and clinically important HAT/ HDAC
inhibitors are listed in Table 2.8. Further, these antiproliferative effects of HDAC
inhibitors are mediated by their ability to reactivate silenced tumor suppressor genes.

Chapter 2: Review of Literature
60
Preclinical studies have demonstrated the ability of HDACi in reversing chemoresistance
in cancer cell lines and can cause the inhibition of cellular proliferation and induction of
apoptosis in a number of cancer cell lines[117-122]
(Figure 2.16). However, it is still unclear
whether the preclinical and clinical antitumor effects of HDAC inhibitors are mainly a
result of its epigenetic potency or its influence on key cellular growth regulatory
pathways.
Table 2.7: Classification of known Histone acetyla-transferases (HATs)
S. No. Family Alias Yeast Human Target histone Complex
1 MYST
KAT5 Esa1 Tip60 H4K5, K8, K12, K16; Htz1K14 NuA4/TIP6
0 KAT8 Sas2 MOF/MYST1 H4K16 SAS/MAF2
KAT6 Sas3/Ybf2 H3K14, K23
KAT6a MOZ/MYST3 H3K14
KAT6b MORF/MYST
4
H3K14
KAT7 Hbo1/MYST2 H4K5, K8, K12; H3
2 GNAT
KAT1 Hat1 Hat1 H4K5, K12 HatB
KAT2 Gcn5 H3K9, 14, 18, 23, 27,36; H2B;
yHtzl
SAGA,
ADA,
SLIK/SALS
A
KAT2A hGcn5 H3K9, 14, 18; H2B STAGA,TF
TC KAT2B P/CAF H3K9, 14, 18; H2B PCAF
KAT9 Elp3 Elp3 H3K14; H4K8 Elongator
KAT10 Hpa2 H3K14; H4
Hpa3 H3; H4
Nut1 H3; H4 Mediator
3 P300/
CBP
KAT3B P300 H2A-K5; H2B-K12,
K15; H3; H4
KAT3A H2A-K5; H2B-K12, K15; H3; H4
4 TFIIIC
TFIIIC H3; H4
KAT12 TFIIIC90 H3; H4
TFIIIC110 H3; H4
TFIIIC220 H3; H4
5 p160 KAT13A SRC1 H3; H4
ACTR/pCIP H3; H4
TIF2/GRIP1 H3; H4
6 Orphans
KAT11 Rtt109 H3K9, 56
KAT4 Taf1 Taf1 H3; H4 TFIID
TAFII250 H3; H4 TFIID
KAT13C CLOCK H3; H4
TFIIB TFIIB
Chapter 2: Review of Literature
61
As a single agent, early trials with HDACi like valproic acid and phenylbutyrate
showed weak therapeutic benefit against hematologic malignancies[90]
. Subsequently,
more potent HDAC inhibitors such as the class-specific inhibitors (entinostat and
romidepsin) and the pan HDAC inhibitors (vorinostat, belinostat and panobinostat) have
been developed. In a landmark Phase IIb multicenter trial, Olsen et al. showed that
vorinostat was effective in the treatment of patients with refractory cutaneous T-cell
lymphoma[91]
. Romidepsin has also been shown to have significant and durable efficacy
against cutaneous T-cell lymphoma in a Phase II multi-institutional trial[92]
. These and
subsequent studies have led to the FDA approval of romidepsin and vorinostat for the
treatment of cutaneous T-cell lymphoma, as well as the approval of romidepsin for the
treatment of relapsed peripheral T-cell lymphoma[93]
. There are many other HDAC
inhibitors currently under Phase I and/or II study as monotherapy, including belinostat,
panobinostat, entinostat, chidamide, SB939 and LAQ824 in ovarian, lung, soft tissue
carcinoma, non-small-cell lung, breast and some other cancers[123-130]
. However, the
majority of the results from these HDAC inhibitors among solid tumor patients have been
disappointing. Despite achieving only sporadic anecdotal clinical responses, their use has
been associated with serious toxicities.
The interaction between different components of the epigenetic machinery has led
to the exploration of effective combinatorial cancer treatment strategies. Indeed,
combinations of DNA methyltransferase and histone deacetylase inhibitors appear to
synergize effectively in the reactivation of epigenetically silenced genes[131-133]
. Such
combination treatment strategies have been found to be more effective than individual
treatment approaches. For example, the derepression of certain putative tumor suppressor
genes was only seen when 5-Aza-CdR and trichostatin A were combined[116]
. Synergistic
activities of DNA methylation and HDAC inhibitors were also demonstrated in a study

Chapter 2: Review of Literature
62
showing greater reduction of lung tumor formation in mice when treated with
phenylbutyrate and 5-Aza-CdR together. Pre-treatment of HDAC inhibitor SAHA relaxes
the chromatin and sensitizes cells to DNA damage induced by Topoisomerase II
inhibitor[134]
. Similarly pretreatment of valproic acid act in synergy with epirubicine and
reduces the tumor volume in breast cancer mouse model[135]
.
Figure 2.16: Regulation of cancer hallmarks by Histone deacetylase. By blocking apoptosis
and differentiation in addition to inducing proliferation, angiogenesis as well as metastasis,
individual HDACs dictate malignant growth[136]
.
Using a murine model, Belinsky et al. found that decitabine, when combined with
the HDACi sodium phenylbutyrate, was able to decrease lung cancer formation by more
than 50% in comparison with decitabine alone[133]
. Another study by the same group
reported that the combination of HDACi entinostat with the DNMTi azacitidine reduced
tumor burden and retarded the growth of orthotopically engrafted K-ras/p53 mutant lung
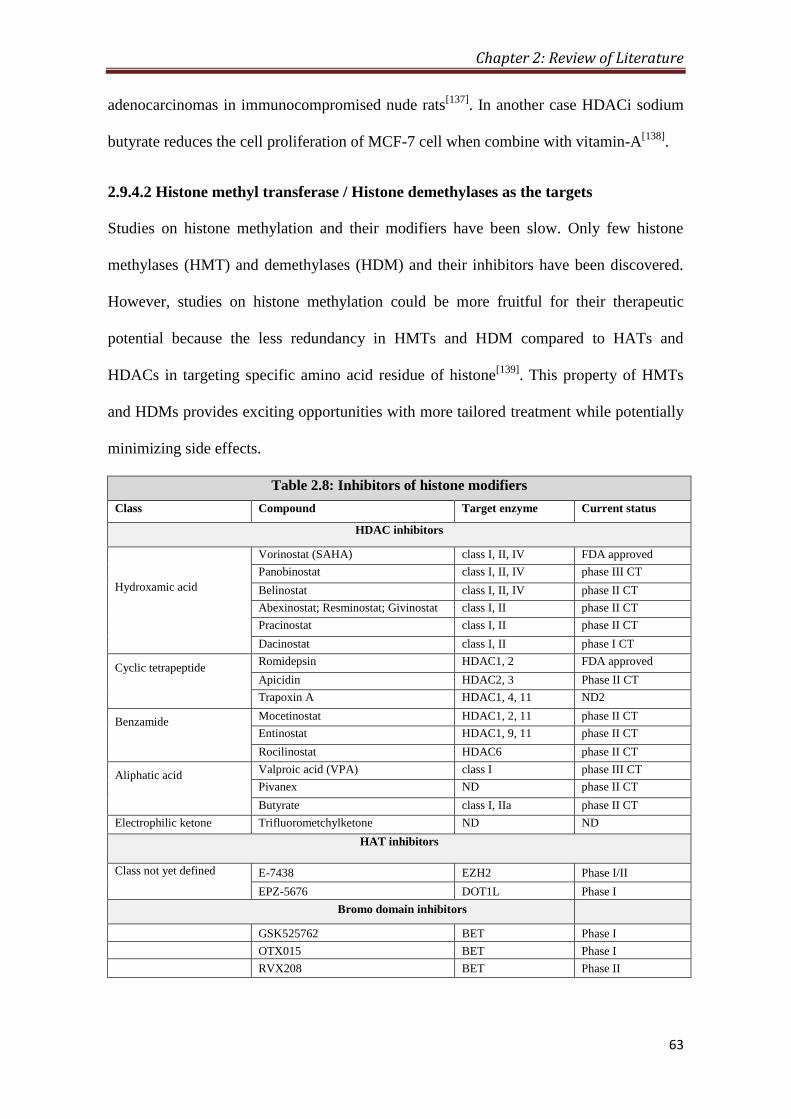
Chapter 2: Review of Literature
63
adenocarcinomas in immunocompromised nude rats[137]
. In another case HDACi sodium
butyrate reduces the cell proliferation of MCF-7 cell when combine with vitamin-A[138]
.
2.9.4.2 Histone methyl transferase / Histone demethylases as the targets
Studies on histone methylation and their modifiers have been slow. Only few histone
methylases (HMT) and demethylases (HDM) and their inhibitors have been discovered.
However, studies on histone methylation could be more fruitful for their therapeutic
potential because the less redundancy in HMTs and HDM compared to HATs and
HDACs in targeting specific amino acid residue of histone[139]
. This property of HMTs
and HDMs provides exciting opportunities with more tailored treatment while potentially
minimizing side effects.
Table 2.8: Inhibitors of histone modifiers
Class Compound Target enzyme Current status
HDAC inhibitors
Hydroxamic acid
Vorinostat (SAHA) class I, II, IV FDA approved
Panobinostat class I, II, IV phase III CT
Belinostat class I, II, IV phase II CT
Abexinostat; Resminostat; Givinostat class I, II phase II CT
Pracinostat class I, II phase II CT
Dacinostat class I, II phase I CT
Cyclic tetrapeptide Romidepsin HDAC1, 2 FDA approved
Apicidin HDAC2, 3 Phase II CT
Trapoxin A HDAC1, 4, 11 ND2
Benzamide Mocetinostat HDAC1, 2, 11 phase II CT
Entinostat HDAC1, 9, 11 phase II CT
Rocilinostat HDAC6 phase II CT
Aliphatic acid Valproic acid (VPA) class I phase III CT
Pivanex ND phase II CT
Butyrate class I, IIa phase II CT
Electrophilic ketone Trifluorometchylketone ND ND
HAT inhibitors
Class not yet defined E-7438
EZH2
Phase I/II
EPZ-5676
DOT1L
Phase I
Bromo domain inhibitors
GSK525762
BET Phase I
OTX015
BET Phase I
RVX208
BET Phase II
Chapter 2: Review of Literature
64
LSD1/ KDM1 was among the first identified histone demethylases selectively
targeting H3K4me1 and H3K4me2[140]
and mediate gene repression. LSD1 has been
found to be overexpressed in a significant number of cancers like brain, breast, and
prostate, thus making it an attractive target for drug therapy[140-142]
. SL11144 and
tranylcypromine inhibits LSD1 and restore expression of multiple aberrantly silenced
tumor suppressors, including secreted frizzled-related protein and GATA transcription
factors[143, 144]
. However, similar to HDACs, off-target effects on H3K9me2 and DNMT1
limit its immediate usefulness and further study is needed[145]
. EZH2 is another
methyltransferase responsible for H3K27me3 leads to gene silencing by promoting DNA
methylation. EZH2 is found to be overexpressed in head and neck, breast, and prostate
cancers and is targeted by a hydrolase inhibitor called 3-deazaneplanocin A (DZNep)[146,
147]. By countering EZH2 and inhibiting H3K27 trimethylation, DZNep induces
differentiation as well as apoptosis in cancer cell lines and xenografts while sparing
normal cells[148, 149]
.
2.9.4.3 Kinases/ Phosphatases as the targets
Compared to histone acetylation and methylation the effort of regulating histone
phosphorylation by targeting kinases and phosphatases for therapeutic uses is new. High
level of several histone H3 phosphorylations such as H3S10ph, H3T6ph has been
reported in number of cancer. p38 MAPK pathway mediated increase in H3S10ph in
response to cisplatin treatment in HeLa and MCF7 cells[150]
. Romain et al recently
reported that the kinase inhibitors like Enzastaurin (PKC-beta inhibitor), AZD1152
(Aurora-B inhibitor) and AZD1480 (Jak2 inhibitor) increases the cell death of TMZ-Irrad
resistant GBM and decreases H3T3ph, H3S10ph and H3Y4ph respectively[101]
. Further,
H89 (MSK1 inhibitor) treatment reduces the TPA and EGF mediated cellular
transformation and by decreasing H3S10ph[64]
.

Chapter 3 Aims and Objectives

Chapter 3: Aims and Objectives
65
3.1 Statement of the Problem
Gastric cancer (GC) is one of the most common malignancies worldwide. Globally, GC
ranks fourth and third in terms of incidence and mortality respectively. In India, it is one
of the most aggressive cancers ranking third and second in terms of incidence and
mortality respectively. Surgery remains the mainstay for cure especially in early cancers,
while in locally advanced GC, the addition of neo-adjuvant chemotherapy offers a better
survival advantage. The NACT facilitates histological tumor regression and thereby
increases the rate of curative or pathologically disease-free margin (R0). However,
despite apparently curative surgery, loco regional recurrence has still been encountered in
87% of GC patients raising the doubt of current pathological techniques used in day to
day practice to truly confirm the adequacy of the surgical resection margins. Therefore,
there is an urgent need to identify molecular markers and investigate their expression in
not only the cancerous tissues, but the surrounding resected (margin) tissue that is
apparently free from disease (R0) based on histopathology.
3.2 Hypothesis
Over the past decade accumulated evidences have identified aberrant alteration in the
global level of several histone post-translational modification, defined as ‘histone onco-
modifications’. These histone onco-modifications provide independent prognostic
information for several cancers. However, relation of histone PTMs between tumor and
resection margin and the regulatory mechanism for their alteration is poorly understood in
cancer. Therefore, detailed studies are required to understand how global levels of histone
modifications are established and maintained and what their mechanistic links are to the
cancer clinical behavior. All this leads us to the point that there is need to understand in-
depth the differential alteration in histones, histone modifying enzymes and to define new
Chapter 3: Aims and Objectives
66
prognostic markers and therapeutic targets for the better management of gastric cancer
patients.
3.3 Objectives
I. To identify differential alterations in histones and their enzymes in gastric cancer
II. To decipher molecular mechanism of specific alterations in histones in gastric
cancer
3.4 Experimental Plan
Objective I: To identify differential alterations in histones and their enzymes in gastric
cancer.
i. Collection of freshly resected and paraffin embedded blocks of tissues from the site of
tumor and resection margins (proximal and distal) of gastric cancer patients.
ii. Haematoxylin and Eosin (H&E) staining and histopathological confirmation of tissue
identity and tumor content.
iii. Preparation of chromatin and nucleo-cytosolic fraction from freshly resected tissues.
iv. Pilot screening of differential site-specific histone post-translational modifications in
tumor and resection margin tissues using immunoblotting.
v. Immunohistochemical analysis of specific histone PTM(s) on tumor and resection
margins (proximal and distal) tissues for validation in large cohort of samples.
Objective II: To decipher molecular mechanism of specific alterations in histones in
gastric cancer.
i. Identification of specific histone modifying enzymes responsible for alteration in
specific histone PTMs in cell lines and tissue samples using enzyme assay,
immunoblotting and immunohistochemistry.

Chapter 3: Aims and Objectives
67
ii. Determination of effect of enzyme on site specific histone modification by exogenous
overexpression and chemical inhibition followed by immunoblotting and
immunofluorescence studies.
iii. Identification of regulatory pathway responsible for of specific histone PTM in tissues
and cell lines using immunoblotting and immunofluorescence studies.
iv. Cell based toxicity assays to study the effect of histone modifying enzymes inhibitors
for their potential application in combinatorial chemotherapy.
3.5 Work Done
The result and discussion of the work carried out under above mentioned objectives are
presented as three chapters with following headings:
Chapter 5: Histone H3 Serine 10 phosphorylation: Regulation and its correlation
with clinico-pathological parameters in gastric cancer.
Chapter 6: β-actin expression and its clinicopathological correlation in gastric
adenocarcinoma.
Chapter 7: Global hypoacetylation of histones: Combinatorial effect of HDAC
inhibitors with DNA-targeted chemotherapeutic drugs on gastric cancer cell lines.

Chapter 4 Materials and Methods
Chapter 4: Materials and Methods
68
4.1 Tissue Samples and Clinical Data
4.1.1 Inclusion criteria and collection of tissue sample
The protocol for collection of freshly resected frozen (FRF) tissues and formalin-fixed
paraffin-embedded (FFPE) tissues blocks was reviewed and approved by institutional
review board and ethics committee of Tata Memorial Center, Tata Memorial Hospital,
Mumbai, India. All patients provided a written informed consent (Appendix-1). FRF and
FFPE tissue samples were collected from gastric cancer patients based on seven inclusion
criteria- Adenocarcinoma (type of cancer), Curative surgery (intent of surgery), Indian
(domicile of the patient), HBV infection negative, HCV infection negative, HIV infection
negative and 1 gm (tissue weight, only for FRF tissues).
Through Indian Council for Medical Research (ICMR) funded, Tumor Tissue
Repository (TTR) at Tata Memorial Hospital, Mumbai, India; FRF tissues and FFPE
blocks were collected. From each patient, tissues were collected form three different sites-
Tumor (T), Proximal resection margin (PRM) and Distal resection margin (DRM). All the
patients were operated between 2009 and 2012 at Tata Memorial Hospital, Mumbai,
India. We first prospectively collected FRF tissues from 84 patients; tissue samples from
48 patients were excluded from the study due to either less weight and/ or tumor content
(< 30%). FRF tissues for rest of the 36 patients were used in the study and FFPE blocks
were also collected for the same. FRF tissues were frozen immediately in liquid nitrogen,
and then stored at -80 °C until required for experimental use. Then, we retrospectively
collected FFPE tissue blocks from 65 gastric cancer patients. Thus, for our study, FRF
tissues were available from 36, while FFPE tissue blocks were available for 101 GC
patients.
The H. pylori infection status in obtained FRF tissue samples were checked PCR
and Giemsa staining based methods, however, all results were negative which can be
Chapter 4: Materials and Methods
69
attributed to the antibiotic treatment that GC patients go through at the initial stage of
treatment.
4.1.2 Preparation of tissue section slides
Both FRF tissues and FFPE tissue blocks were processed cryotome and sections of 4 µm
thickness were prepared. Internal temperature of the machine was always maintained at -
20ºC. Tissue sections were then transferred to poly-L Lysine coated slides and incubated
overnight at 37ºC. These tissue slides were then stored at room temperature until required
for experimental use.
4.1.3 Hematoxylin and eosin staining
Hematoxylin and eosin (H&E) staining was done on poly-L lysine coated glass tissues
slides as per the standard protocol[151]
. Slide with FFPE tissue sections were first
incubated at 65°C for 20 minutes to melt paraffin, treated with Xylene twice for 10
minutes each and then treated with 100% EtOH twice for 5 minutes each. Now, FFPE and
FRF tissues slides were air dried for 30 minutes at 37ºC to remove moisture. The slides
were stained with 0.1% Mayers Hematoxylin (Sigma; MHS-16) for 10 minutes, rinsed in
running tap water for 5 minutes and then dipped in 0.5% Eosin (1.5g dissolved in 300ml
of 95% EtOH) 10 times, each lasting for 1-2 seconds. Hematoxylin and Eosin stained
slides were dipped in distilled water until the Eosin stops streaking, and then washed in
50, 70 and 100% graded EtOH solutions for 5 minute each. In the end slides were cleaned
by washing in Xylene and mounted with DPX mountant (Qualigens, cat#18404).
4.1.4 Histopathological analysis
Histopathological analysis was done using H&E stained tissue sections to confirm the
identity of the tissues and to determine tumor content (% of tumor cells) by a blinded
specialist gastrointestinal pathologist (Dr. Mukta Ramadwar, Tata Memorial Hospital,
Mumbai, India). Based on histopathological analysis, FRF tissues with ≥ 70% tumor

Chapter 4: Materials and Methods
70
content, FPPE tumor tissues with ≥ 10% tumor content and negative resection margins
(without any tumor cell) were included in the final study. Therefore, the present study in
thesis was conducted with paired tumor, PRM and DRM frozen tissues (n=10) and FFPE
tissue blocks (n=101). In some of the subsequent sections negative resection margin
tissues have also been referred as normal tissues.
4.1.5 Collection of clinical data
Information of clinical characteristics of the patients included in the final study was
collected using Electronic Medical Record (EMR) system of Tata Memorial Hospital,
Mumbai, India. Status (Dead/ Alive/ Recurrence) of patients at last follow-up date from
the time of surgery was dually checked using EMR as well as by telephonic conversation
with patient or patient’s relative. Clinical information for all the patients is tabulated in
table (Appendix-1).
4.2 Immunohistochemistry
4.2.1 Immunohistochemical staining
Immunohistochemical staining was performed using VECTASTAIN® ABC kit (Vector
Lab, P6200) and as per manufacturer’s protocol. Briefly, FFPE tissue blocks were
sectioned at a thickness of 4 µm and mounted on poly-L-lysine coated glass slides. The
sections were deparaffinized through a graded series of xylene and rehydrated through a
graded series of absolute alcohol to distilled water. Endogenous peroxidase was quenched
with 3% hydrogen peroxide in methanol at room temperature for 30 minutes in dark.
Microwave antigen retrieval was carried out with 0.01 M Sodium citrate buffer (pH 6.0).
Primary antibodies (Table 4.1) were applied for 16 hours at 4°C. Immunoreactive proteins
were chromogenically detected with diaminobenzidine (DAB) (Sigma, D5537). The
sections were counterstained with Harris’s hematoxylene and then dehydrated and
mounted. In parallel, control staining was performed without adding primary antibody.

Chapter 4: Materials and Methods
71
1X TBS was used to dilute blocking reagent, primary antibody, secondary antibody,
tertiary reagent.
Table 4.1: List of antibodies used for IHC analysis
S. No. Primary Antibody Dilution
1 Anti-β-actin (Sigma, A5316) 1:200 in 1X TBS
2 H3S10ph (Abcam, 51776) 1:100 in 1X TBS
3 H3K16ac (Millipore, 07-329) 1:100 in 1X TBS
4 H4K20me3 (Abcam, 9053) 1:100 in 1X TBS
5 ph-MSK1 (Abcam, 32190) 1:100 in 1X TBS
4.2.2 Scoring of Immunohistochemical staining
The cytoplasmic immunohistochemical staining of β-actin was scored semi-quantitavely
for epithelial and inflammatory cells as described in a previous study by Yip et al[100]
.
“IHC score”, “Total IHC score” and “Average Total IHC score” were calculated by
taking the account into percentage of immunostained cells and staining intensity (Table
4.2). Total IHC score of 2 and above was considered as positive immunoreactivity. Total
IHC score ranges from 2 to 7 and further grouped into: low (score 2 and 3), intermediate
(score 4 and 5) and high (score 6 and 7). The nuclear immunohistochemical staining for
all the antibodies were scored using H-score which is based on intensity of staining
(ranges zero to three) and percentage of stained cells using the formula, H-score= [ (0 x %
of cells with staining intensity of zero) + (1 x % of cells with staining intensity of one) +
(2 x % of cells with staining intensity one) + (3 x % of cells with staining intensity two)].
H-score was further divided in 3 groups (i) 0-100: low level (ii) 100-200: intermediate
level and (iii) 200-300: high level. The immunohistochemical staining was examined by
two independent researchers one of whom is a senior consultant pathologist to ensure the
evaluations were performed properly and accurately. Both the researchers were blinded to
all clinicopathological and outcome variables.

Chapter 4: Materials and Methods
72
Table 4.2: Scoring system for β-actin immune-staining
Percent positivity of stained cells IHC score Staining intensity IHC score
0% 0 None 0
< 25% 1 Weak 1
25%-50% 2 Moderate 2
50%-75% 3 Strong 4
75%-100% 4
Total IHC Score = IHC score of percent positivity + IHC score of staining
4.3 Cell Culture
4.3.1 Cell lines and culture conditions
Gastric cancer cell lines AGS (ATCC® Number: CRL-1739™; moderately
differentiated) and KATO III (ATCC® Number: HTB-103™; signet ring cell carcinoma)
was used. AGS and KATO III cells were cultured in RPMI1640 (Invitrogen) and F12K
(Himedia) media respectively at 37 °C with 5% CO2 supplemented with 10% FBS,
100U/ml penicillin, 100 mg/mL streptomycin (Sigma).
4.3.2 Trypsinization and sub-culturing
For trypsinization and sub-culturing standard protocol was followed with slight
modifications[152]
. Cell lines were passaged every 4-5 days to maintain their normal
morphology and proliferation rate. Medium was removed from culture with a sterile
pipette, adhered cells were washed with PBS, pH7.2-7.4 (1.9mM NaH2PO4, 8.1mM
Na2HPO4 and 154mM NaCl) and 1ml trypsin/EDTA (0.25% w/v trypsin, 0.2% EDTA in
PBS) solution was added. Cells were incubated at 37°C until cells were detached from
surface. Detached cells were re-suspended in 1ml complete medium. The viable cells
were counted as described below and plated in fresh culture dishes (~2X 10⁴ cells/ml).
The number of viable cells was determined by staining with 0.5ml of trypan blue (0.4%
w/v in PBS). Cells were counted on haemocytometer and number of cells/ml was
calculated as follows:
Chapter 4: Materials and Methods
73
No. of cells/ml = average number of cells per WBC chamber × dilution factor (10) × 104
4.3.3 Freezing down cells for liquid nitrogen stocks
For freezing down of cells standard protocol was followed with slight modifications[152]
.
A near 100% confluent 90 mm dish (containing 4-6 x 10⁶) was used to make stocks for
storage. The cells were washed twice with 5ml 1xPBS, harvested by adding 2ml 1x
trypsin for one minute at 37ºC. Trypsin was aspirated; cells were resuspended in 10 ml
media, centrifuged for 5minutes at 1500 rpm. The supernatant was removed; the cells
were again suspended in 1 ml of freezing media (90% serum and 10% DMSO). The date;
identity of cell line; passage number were recorded. The cells were gradually frozen by
incubation at-20 ºC for 2 hours and then at -80ºC for overnight. Finally, the cells were
transferred to liquid nitrogen for long term storage.
4.3.4 Thawing cells from liquid nitrogen stocks
For thawing cells standard protocol was followed with slight modifications[152]
. Cells
were immediately thawed by immersion in 37 ºC water bath for 5 minutes. 9 ml of media
was added, cells were centrifuged and resuspended in 10 ml cultural media. Cells were
allowed to attach overnight (37ºC, 5% CO2) before media was replaced and cells were
passaged or sub-cultured as described above.
4.4 Genetic Manipulation
4.4.1 Cloning of MSK1
The vector DU2012 pCMV-FLAG-MSK1 wt was procured from MRC-Protein
phosphorylation and ubiquitination unit of University of Dundee, UK. The empty vector
pCMV5 was generated by digestion of the above vector with BglII and MluI (sites
flanking Flag Msk1 gene). The 4645 kb band was gel extracted and the ends were blunted
by incubating with Pfu polymerase for 20minutes at 72 ̊ C in a PCR machine. The
resulting product was purified using Fermentas PCR purification kit and ligated using

Chapter 4: Materials and Methods
74
NEB’s Quick Ligase as per the recommended protocol. The ligated product was
transformed in ultracompetant DH5α cells. The colonies were screened by restriction
enzyme digestion with NdeI and XhoI.
Figure 4.1: pCMV-Flag-MSK1 cloning vector map.
4.4.2 Transfection of MSK1
For transfection standard protocol was followed with slight modifications[152]
.
Transfection in AGS cell line was carried out by Calcium phosphate method. The cells
were transfected at 50% confluency with 10μg of plasmid in a 35mm dish. The culture
medium was changed to C-DMEM medium 2hours prior to transfection. Briefly the
plasmid was dissolved in 125μl of TE pH 7.4 followed by addition of 125μl of 2.5M
CaCl2. The solution was mixed by vortexing and to this 150μl of 2X BBS (50 mM BES,
1.5 mM Na2HPO4 and 280 mM NaCl) was added dropwise. The solution of plasmid and
Calcium phosphate was allowed to stand at RT. After 20min 200μl of this solution was
spread dropwise over the cells. The cells were harvested 48hours post transfection in 2X
SDS loading dye.
4.5 Biochemical Inhibition
4.5.1 Inhibition of MAP kinase pathway
PD98059 (Calbiochem, cat#LOC032021), SB203580 (Calbiochem, cat#550389) and H89
(Millipore, cat#19-141) was used to chemically inhibit MAPK kinases ERK1/2, p38 and

Chapter 4: Materials and Methods
75
mitogen and stress kinase-1 (MSK1) respectively. All the inhibitors were dissolved in
DMSO to prepare stock concentrations and stored at -20ºC in small aliquots. AGS and
KATOIII cells were cultured in 90 mm plate till 90% confluence and chemical inhibitors
were added along with with the fresh medium. Cells were treated with PD98059 and
SB203580 for 1 hour at the final concentration of 10 µM; whereas, H89 treatment was
done for 6 hours at the final concentration of 20 µM. After the said treatment cells were
harvested and used for further experiments.
4.5.2 Inhibition of HDACs
Histone deacetylase inhibitors (HDACi), Sodium valproate/ VPA (Sigma, P4543),
Trichostatin A/ TSA (Sigma, T8552) and Suberoylanilide hydroxamic acid/ SAHA
(Sigma, SML0061) were dissolved in absolute ethanol to prepare stock solutions of 600,
10 and 10 mM respectively. As per the requirement of experiment, AGS and KATOIII
cells were treated with range of concentrations of HDACi.
4.5.3 Chemotherapy drugs
DNA binding chemotherapy drugs, Cisplatin (Calbiochem, 232120), Oxaliplatin (Sigma,
O9512) and Epirubicin (Calbiochem, 324905) were dissolved in DMSO to prepare stock
solutions of 165, 63 and 14 mM respectively. As per the requirement of experiment, AGS
and KATOIII cells were treated with range of concentrations of chemotherapy drugs.
4.6 Cell Viability Assay
4.6.1 Trypan blue exclusion assay
Trypan blue exclusion test for cell viability was done as per standard protocol with slight
modifications[153]
. The cells were stained with 0.4% Trypan Blue solution after diluting at
1:1 ratio with the cell suspension. Trypan Blue was sterile filtered before using it in order
to get rid of particles in the solution that may interfere with the counting process. Manual
Chapter 4: Materials and Methods
76
counting of viable (unstained cells) and non-viable cells (blue stained cells) were carried
out in three independent experiments by haemocytometer.
4.6.2 MTT assay
Cell viability was quantified by its ability to reduce tetrazolium salt 3-(4,5-
dimethylthiazole-2ϒ)-2,5-diphenyl tetrasodium bromide (MTT) to colored formazan
products (Sigma# m-2128) as per manufacturer’s protocol[154]
. MTT reagent (5mg/ml in
PBS) was added to the cells at 1/10th volume of the medium to stain only viable cells and
incubated at 37°C for 4hours. MTT solubilisation buffer (0.01M HCl, 10% SDS in 1X
PBS) of two fold volume was added to cells, followed by incubation in the dark at 37°C
for 24hours. The absorbance was measured at 570nm with Spectrostar Nano-Biotek, Lab
Tech plate Reader. Cell viability was expressed as the percentage of absorbance obtained
in control cultures.
4.6.3 Colony formation assay
Colony formation assay was done as per standard protocol with slight modifications[154]
.
The cells (n=2000) were plated in 60mm tissue culture plates and its survival was
measured by clonogenic assay in monolayer after 14 days in triplicate. The cells were
treated with IC50 concentration of chemotherapy drugs and HDAC inhibitors for 72 hour
and after PBS washes, cells were incubated in complete culture medium for additional
14days, with media changes after every 2-3 days. Cells were fixed with 4%
paraformaldehyde for 1 hour, stained with 0.5% crystal violet (Sigma, 0.5% in 70%
ethanol) for 1hours at room temperature, rinsed and air-dried. Surviving colonies with
more than 50 cells were counted and images were captured using a high-resolution Nikon
D70 camera (Nikon, Tokyo, Japan). The survival data of treated cells were normalized to
the plating efficiency of control.

Chapter 4: Materials and Methods
77
4.7 Cell Cycle Analysis
4.7.1 Cell cycle analysis of cell line by FACS
Cell cycle was analyzed as per standard protocol with slight modification[155]
. Cells were
washed with PBS (twice) and fixed with 70% chilled ethanol. During fixation, ethanol
was added drop-wise with vortexing to prepare a single cell suspension. After fixation,
cells were stored at -20°C. Cells were further washed twice with PBS and suspended in
500µl of PBS with 0.1% Triton X-100 and 100µg/ml of RNaseA followed by incubation
at 37°C for 30minutes. After incubation, propidium iodide (sigma, 25µg/ml) was added
followed by with incubation at 37°C for 30 minutes. DNA content analysis was carried
out in a FACS Calibur flow cytometer (BD Biosciences, USA). Cell cycle analysis was
performed using the Mod-fit software from BD Biosciences.
4.7.2 Cell cycle analysis of tissue samples by FACS
Cell cycle was analyzed as per standard protocol with slight modification[155]
. 50 mg of
tissue was first powdered using mortar pestle in liquid nitrogen. The powder was
homogenized in 2 ml of nuclear buffer A (15mM Tris-Cl pH 7.5, 60mM KCl, 15mM,
15mM NaCl, 2mM EDTA, 0.5mM EGTA, 0.34M Sucrose, 0.15mM β-ME, 0.15mM
Spermine and 0.5mM Spermidin) using dounce homogenizer. The homogenate was
centrifuged (5000 rpm for 15 minutes at 4ºC) to pellet nuclei; supernatant was discarded.
The nuclei was washed twice in nuclear buffer A and fixed in 70% chilled absolute EtOH
and stored at -20ºC until required. For cell cycle analysis by FACS rest of the steps were
carried out as mentioned in section 3.6.1.
4.7.3 Mitotic index of tissue samples
On the basis of morphology of the nuclei in H&E-stained tissue sections, mitotic cells or
cells which were not in G0 phase of the cell cycle were counted in 10 consecutive High
Power Field (40X) and average was expressed as Mitotic index.

Chapter 4: Materials and Methods
78
4.8 Microscopy Analysis
4.8.1 Immunofluorescence microscopy
Cells grown on glass coverslips were fixed with 4% paraformaldehyde for 20 minutes.
Cells were then permeabilized in PBS containing 0.5% trition X-100 for 20 minutes at RT
and then blocked with PBS containing 3% BSA and 0.1% NP-40 for 1 hour. Next, cells
were incubated with a primary antibody against H3S10ph and ph-MSK1 and appropriate
secondary antibodies for 2 hours each. Dilution of primary (1:100) and secondary
antibody (Alexa 568 or Alexa 488) was made in blocking buffer. All the steps were
performed in dark and at room temperature. Finally coverslips were mounted in
VECTASHIELD (Vector lab). Fluorescence intensity was analyzed using fluorescence
microscope (IX81; Olympus, Tokyo, Japan).
4.9 Gene Expression Analysis
4.9.1 RNA isolation from tissue samples
Glassware was baked at 300°C for 4hours and compatible plasticware was rinsed with
chloroform and washed with diethylpyrocarbonate (DEPC) treated water. Nitrile gloves
were used to prevent RNase contamination. Total RNA was extracted (Thermo scientific,
0731) from 25 mg of frozen tumor and resection margin (PRM or DRM) tissue with
maximum distance from the site of tumor as per the manufacturer’s instructions. RNA
was stored at -80°C until required. RNA was quantitated by diluting 5μl in 1ml alkaline
water (1mM Na2HPO4) and reading at A260. Quality of RNA was confirmed by A260/A280
(1.9-2.0), A260/A230 (2.0-2.2) and agarose formaldehyde gel electrophoresis[156]
.
4.9.2 Agarose formaldehyde gel electrophoresis
Agarose (0.5g) was dissolved in 36ml water and cooled to ~60°C. To prepare agarose
formaldehyde gel. After cooling, 5ml of 10X MOPS running buffer (0.2M MOPS pH7.0,
0.5M sodium acetate and 0.01M EDTA) and 9ml of 12.3M formaldehyde were added.
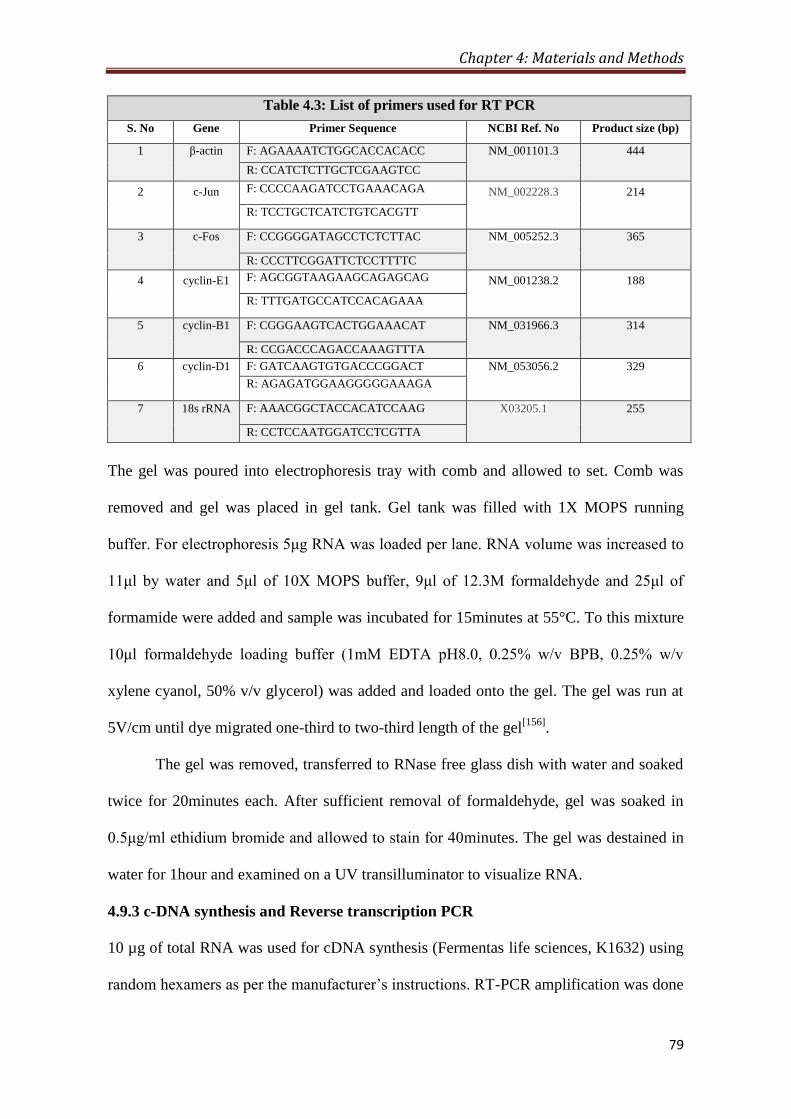
Chapter 4: Materials and Methods
79
Table 4.3: List of primers used for RT PCR
S. No Gene Primer Sequence NCBI Ref. No Product size (bp)
1 β-actin F: AGAAAATCTGGCACCACACC NM_001101.3 444
R: CCATCTCTTGCTCGAAGTCC
2 c-Jun F: CCCCAAGATCCTGAAACAGA NM_002228.3 214
R: TCCTGCTCATCTGTCACGTT
3 c-Fos F: CCGGGGATAGCCTCTCTTAC NM_005252.3 365
R: CCCTTCGGATTCTCCTTTTC
4 cyclin-E1 F: AGCGGTAAGAAGCAGAGCAG NM_001238.2 188
R: TTTGATGCCATCCACAGAAA
5 cyclin-B1 F: CGGGAAGTCACTGGAAACAT NM_031966.3 314
R: CCGACCCAGACCAAAGTTTA
6 cyclin-D1 F: GATCAAGTGTGACCCGGACT NM_053056.2 329
R: AGAGATGGAAGGGGGAAAGA
7 18s rRNA F: AAACGGCTACCACATCCAAG X03205.1 255
R: CCTCCAATGGATCCTCGTTA
The gel was poured into electrophoresis tray with comb and allowed to set. Comb was
removed and gel was placed in gel tank. Gel tank was filled with 1X MOPS running
buffer. For electrophoresis 5μg RNA was loaded per lane. RNA volume was increased to
11μl by water and 5μl of 10X MOPS buffer, 9μl of 12.3M formaldehyde and 25μl of
formamide were added and sample was incubated for 15minutes at 55°C. To this mixture
10μl formaldehyde loading buffer (1mM EDTA pH8.0, 0.25% w/v BPB, 0.25% w/v
xylene cyanol, 50% v/v glycerol) was added and loaded onto the gel. The gel was run at
5V/cm until dye migrated one-third to two-third length of the gel[156]
.
The gel was removed, transferred to RNase free glass dish with water and soaked
twice for 20minutes each. After sufficient removal of formaldehyde, gel was soaked in
0.5μg/ml ethidium bromide and allowed to stain for 40minutes. The gel was destained in
water for 1hour and examined on a UV transilluminator to visualize RNA.
4.9.3 c-DNA synthesis and Reverse transcription PCR
10 µg of total RNA was used for cDNA synthesis (Fermentas life sciences, K1632) using
random hexamers as per the manufacturer’s instructions. RT-PCR amplification was done

Chapter 4: Materials and Methods
80
using specific primers with an initial denaturation step at 95°C for 2 minutes, followed by
15 cycles of denaturation at 95°C for 45 minutes, primer annealing at 55°C for 30 s,
primer extension at 72°C for 30s and a final extension at 72°C for 10 minutes. Amplified
products were resolved on 1.5% agarose gels and visualized by Ethidium bromide
staining.
4.10 Protein Fractionation
4.10.1 Total protein lysate preparation from cell lines
Cells were harvested from 90 mm culture plates and washed twice with chilled PBS. The
cell pellet was lysed in 1 ml of 1X laemmli buffer (2% SDS, 10% v/v Glycerol, 110mM
Tris-Cl pH 6.8, 0.1% v.v β-ME) and stored at -20ºC until requires.
4.10.2 Nucleo-cytosolic and chromatin fraction from cell lines
Cells were harvested from 90 mm culture plates and washed twice with chilled PBS. The
cell pellet was lysed in chilled MKK lysis buffer[157]
(10mM Tris-Cl, 1mM EDTA, 1mM
EGTA, 1% Triton X-100, 10µg/ml Leupeptin, 10µg/ml Aprotenin, 1mM PMSF, 1mM
Sodium orthovanadate, 10mM Sodium fluoride, 10mM β-Glycerophosphate). The lysate
was centrifuged at 100000xg for 30 minutes at 4ºC, supernatant was collected as nucleo-
cytosolic fraction (NCF) and stored at -20ºC until required. The remaining pellet was
dissolved and boiled in 1X laemmli buffer (section 4.10.1) and stored as chromatin
fraction (CF) at -20ºC until required.
4.10.3 Nucleo-cytosolic and chromatin fraction from tissue samples
100 mg of tissue was first powdered using mortar pestle in liquid nitrogen. Using dounce
homogenizer the powder was lysed and homogenized in lysis buffer (20mM Tris-Cl pH8,
2mM EDTA, 10mM EGTA, 5mM MgCl2, 0.1% Triton X-100, 1mM Sodium
orthovanadate, 1mM Sodium fluoride, 20mM β-Glycerophosphate, 10µg/ml Leupeptin,
10µg/ml Aprotenin, 1mM PMSF). The lysate was centrifuged at 100000xg for 30 minutes
Chapter 4: Materials and Methods
81
at 4ºC, supernatant was collected as nucleo-cytosolic fraction (NCF) and stored at -20ºC
until required. The remaining pellet was dissolved and boiled in 1X laemmli buffer
(3.9.1) and stored as chromatin fraction (CF) at -20ºC until required.
4.10.4 Histones from cell line and tissue samples
Histones were isolated by acid extraction method as described[158]
. The purified remaining
chromatin pellet obtained in section 4.10.3 and 4.10.3 was used for histone isolation by
acid extraction method. 0.2M H2SO4 was added drop-wise to the chromatin pellet with
vigorous vortexing and incubated for 30minutes at 4°C. After centrifugation at 16,000
rpm at 4°C, supernatant containing histone protein was precipitated overnight with
acetone at -20°C. Histone pellet was washed with acidified acetone (50mM HCl in
acetone) followed by washing with chilled acetone. Total histone was dissolved in 0.1%
β-mercaptoethanol in H2O and stored at -20°C.
4.11 Protein Estimation
4.11.1 Protein estimation by Lowry’s method
Histone and total protein concentrations in various samples were determined by Lowry
method of protein estimation. Protein standards were prepared containing a range of 2-
16μg of Bovine Serum Albumin (BSA, Sigma) and unknown samples were also prepared
similarly. The freshly prepared Copper Tartrate Carbonate (CTC- 0.1% CuSO4, 0.2%
Sodium potassium tartrate, 10% Na2CO3; CTC mixture: CTC, 0.8N NaOH, 10% SDS
and D/W in 1:1:1:1 ratio,) mixture was added and vortexed. After incubation for
10minutes at RT, 500μl of Folin Ciocalteau reagent (1:6 dilutions with D/W, 0.33N) was
added, tubes were vortexed and incubated in dark for 30 minutes at RT. Absorbance at
750 nm was measured and standard curve was prepared to determine protein
concentration.

Chapter 4: Materials and Methods
82
4.12 Polyacrylamide Gel Electrophoresis
4.12.1 Resolution of protein fractions by SDS-PAGE
Proteins were separated on SDS-PAGE using modification of traditional Laemmli buffer
system[159]
. Histones and total soluble protein lysate were separated on 18% and 10%
SDS-PAGE respectively. Increased concentrations of buffers used in this modification
provide better separation between the stacked histones and SDS micelles. In brief, glass
plate sandwich was assembled using 0.1cm thick spacers. Separating gel solution (17.5%
w/v acrylamide, 0.5% bisacrylamide, 0.75M Tris pH8.8, 0.1% w/v SDS, 0.033% w/v
APS, 0.66% v/v TEMED) was prepared and poured into the glass plate sandwich and
allowed to polymerize. Stacking gel solution (3.8% w/v acrylamide, 0.1% w/v
bisacrylamide, 0.125M Tris-Cl pH 6.8, 0.1% w/v SDS, 0.05% w/v APS, 0.1% v/v
TEMED) was then prepared and poured into the glass plate sandwich in similar manner.
A 0.1cm thick Teflon comb was inserted and gel was allowed to polymerize. Histone
samples to be analyzed were diluted 1:1 (v/v) with 2X SDS sample buffer (0.05M Tris-Cl
pH6.8, 20% v/v glycerol, 4% w/v SDS, 2% v/v 2-ME, 0.01% w/v bromophenol blue,
BPB) and incubated for 5minutes in boiling water. Teflon comb was removed, sandwich
was attached to the electrophoresis chamber and filled with 2X SDS electrophoresis
buffer (0.05M Tris, 0.384M glycine, 0.2% w/v SDS, pH8.3-8.6). Samples were loaded
into the wells formed by comb. The gel was run at 20mA of constant current until the
BPB tracking dye entered the separating gel and then at 30mA until the BPB dye reached
the bottom of the gel. The power supply was then disconnected and gel was subjected to
Coomassie staining or western blot analysis.
4.12.2 Coomassie staining of SDS-PAGE gels
After electrophoresis, gel was transferred to tray containing Coomassie Brilliant Blue R-
250 (CBBR) staining solution (0.1% w/v CBBR, 50% methanol and 10% acetic acid in

Chapter 4: Materials and Methods
83
water). The gel was stained for ~3 hours, transferred to destaining solution (50%
methanol and 10% acetic acid in water) with several changes until visualization of protein
bands.
4.12.3 Ammoniacal Silver nitrate staining of SDS-PAGE gels
Silver staining of SDS-PAGE gels were done as per standard protocol with slight
modifications[160]
. After electrophoresis of histone protein, the gel was treated with three
washes of 50% methanol of 1hour followed by overnight incubation at 4°C. The gel was
incubated with ammoniacal silver (2.8ml liquid ammonia in 0.38% sodium hydroxide
solution (42 ml) followed by drop-wise addition of 8ml 20% silver nitrate to 200ml with
D/W) staining solution for 30 minutes, followed by two washes of 5minutes with D/W.
The washed gel was incubated with developer (15mg citric acid, 0.15 ml formaldehyde in
100 ml D/W) for the development of protein bands and the reaction was stopped with
destaining solution (50% methanol, 10% acetic acid in D/W).
4.13 Western Blotting
4.13.1 Electroblotting from SDS-PAGE
TCL, NCF and histones were run on 18%, 10% and 18% SDS-PAGE respectively and
blotted onto an adsorbent porous Polyvinylidene difluoride (PVDF) membrane, which
gives a mirror image of the gel. Proteins were transferred to PVDF membrane at 4°C,
employing a constant current of 300 mA for 200 minutes.
Histones (5-10μg) were electroblotted from SDS-PAGE gels to PVDF membranes
for western blot analysis [146]
. The transfer tank of electroblotting apparatus (Trans-Blot
Cell, Bio-Rad) was filled with 1x transfer buffer (0.19 M Glycine, 25 mM Tris base,
0.01% SDS and 20% methanol). PVDF membrane was activated in 100% methanol for
5seconds. The activated membrane and SDS-PAGE gel were equilibrated in 1x transfer
buffer. The gel membrane transfer sandwich was prepared and inserted into the transfer

Chapter 4: Materials and Methods
84
tank with gel on cathode side and membrane on anode side. Transfer was conducted at a
constant current of 300mA for 200 minutes. Proteins transferred onto the membrane were
detected by staining with Fast green (0.5% w/v Fast green in destaining solution) and
destaining with several changes of water.
4.13.2 Immunoblot detection
Histones transferred onto PVDF membrane were probed for global levels of acetylation,
methylation and phosphorylation modifications. Antibodies and their Immunoblotting
condition used in this study are list in Appendix, Table A2.2.
In general, membrane with transferred proteins was incubated in ‘blocking buffer’
i.e. 5% BSA in Tween20/Tris-buffered saline (TTBS, 100mM Tris-Cl pH7.5, 0.9% w/v
NaCl and 0.1% v/v Tween20) for 1hr at room temperature on orbital shaker. Blocking
buffer was then replaced by recommended dilutions of primary antibodies in TTBS and
incubated for 1hour at room temperature in orbital shaker. The membrane was vigorously
washed four times with TTBS for 15minutes each at room temperature. Further the
membrane was incubated in recommended concentrations of HRPO labeled secondary
antibodies in TTBS for 1hour at room temperature on orbital shaker. The membrane was
again washed vigorously four times with TTBS at room temperature and developed using
Immobilon Western (Miilipore, cat#P90719). The membrane was exposed to X-ray film
in dark room and developed using Optimax X-ray film processor (Protec).
4.13.3 Densitometry analysis
Wherever required, the densitometry analysis was done on immunoblot and PVDF
membrane to determine their mean intensities using ImageJ software. For native proteins
mean intensity of immunoblot was normalized with the PVDF membrane; and, for
phosphorylated forms mean intensity of immunoblot was normalized with immunoblot of

Chapter 4: Materials and Methods
85
native proteins. The resulted value was used to express their mean relative levels in
resection margin and tumor.
4.14 Enzyme Activity Assay
4.14.1 HAT and HDAC activity assay
Nucleo-cytosolic fractions from tissues and cell lines were estimated and 50 µg of protein
was used for calorimetry based HAT activity assay (Biovision, K332-100) and HDAC
activity assay (Biovision, K331-100) as per the manufacturer’s instructions. Experiment
was done in duplicate and average absorbance was plotted.
4.15 Drug and DNA Interaction Assay
4.15.1 Quantification of DNA bound chemotherapy drugs
AGS cells treated with chemotherapy drugs (Cisplatin, Oxaliplatin or Epirubicin) with or
without different combination to HDAC inhibitors (VPA, TSA or SAHA) are washed in
chilled PBS. Obtained cell pellet from one 90 mm dishes was lysed in 1 ml of chilled
nuclei isolation buffer (10 mM HEPES ph7.9, 1.5 mM MgCl2, 10 mM KCl, 0.5 mM
DTT, 0.1% v/v NP-40, 2 mM EDTA, 1 mM EGTA, 0.15 mM Spermine, 0.5 mM
Spermidine, 1mM Sodium orthovanadate, 10 mM Sodium fluoride, 10 mM β-
Glycerophosphate, 0.2 M PMSF). The lysate was centrifuged (5000 rpm for 10 minutes at
4ºC) to obtain nuclei pellet. Nuclei pellet was digested in 200 µl 5M urea and 2M NaCl
solution and used to estimate DNA at 260 nm; each sample was further diluted using 5M
urea and 2M NaCl solution to make the DNA concentration of all the samples equal.
Equal volume of all the samples were taken to measure the concentration of DNA bound
Cisplatin, Oxaliplatin and Epirubicin at 220, 205 and 254 nm respectively[161, 162]
. The
absorbance at the said wavelength was considered to be in direct proportion of amount of
chemotherapy drugs bound to DNA.

Chapter 4: Materials and Methods
86
4.16 Drug Combination Assay
4.16.1 MTT assay with fixed constant ratio
Cisplatin, oxaliplatin, epirubicin, VPA, TSA and SAHA was serially diluted in cell
culture media in fixed constant ratio of 1:2. For each drug seven concentration keeping
IC50 in the middle was calculated (Table 7.1). Using these concentrations MTT assay (as
described in section) was done on AGS cells in three different combinations-
‘‘Concurrent’’ (24 hours HDACi and chemotherapy drug together), ‘Pre’ (24 hours
HDACi treatment followed by 24 hours chemotherapy drug treatment) and ‘Post’ (24
hours chemotherapy drug treatment followed by 24 hours HDACi treatment) . In the end
of the treatment (48 hours) percentage of cell survival was calculated.
4.16.2 Fraction affected (FA) curve analysis
Fraction affected (FA) curve is a method for growth inhibition analysis on any kind of
treatment to the cells. For FA curve analysis, cell survival percentage values obtained
through MTT assay was used to calculate Fraction affected (FA) values using the
formula, FA value= 1 ̶ (% cell survival/100). FA values range from 0.01 to 0.99; and, FA
values 0.5, 0.75 and 0.95 represents drug dose at with 50%, 75% and 95% cell death is
observed respectively. Further, with the help of software compusyn which works on Chau
Tally’s algorithm[163]
. FA values and respective dose of the drug were used generate FA
curve.
4.16.3 Median effect plot analysis
Median effect plot shows combination index (CI) on Y-axis and FA values on X-axis. For
a particular FA value CI value ranges from 0 to 1; CI < 0.8, CI= 0.8-1.2 and CI > 1.2
represents synergistic, additive or antagonistic nature of drug combinations respectively.
FA values and total dose of drug combinations (Chemotherapy drugs and HDACi) were

Chapter 4: Materials and Methods
87
used to generate median effect plot with the help of software compusyn which works
Chau Tally’s algorithm[163]
.
4.17 Statistical Analysis
4.17.1 Statistics for relative level analysis
To test the statistical significance of paired and unpaired resection margin and tumor
tissues Wilcoxon matched pair and Mann-whitney test was used respectively. Wherever
applicable, data is presented as mean ± SE and P < 0.05 was considered as statistically
significant.
4.17.2 Statistics for clinicopathological correlations
To establish statistical correlation between clinicopathological parameters and β-actin
expression level Mann-whitney and Krukal-wallis test with two-tailed P-value was
applied. To test whether variables differed across groups, we used the Chi-square test. To
test the statistical independence and significance of predictors Multivariate survival
analysis was performed using the Cox proportional hazard regression model. P < 0.05
was considered as statistically significant.
4.17.3 Statistics for survival analysis
Survival curves were plotted using the Kaplan–Meier method, and the significance of the
differences between the survival curves was determined using Univariate log-rank test.
All p values were two-sided, and p< 0.05 was considered significant. All statistical
analyses were performed with graph pad and/or SPSS software. Wherever applicable,
data is presented as mean ± SE and P < 0.05 was considered as statistically significant.
Chapter 5
Histone H3 Serine 10 phosphorylation: Regulation and its
correlation with clinico-pathological parameters in gastric cancer

Chapter 5: Histone H3 Serine 10 phosphorylation in GC
88
5.1 Introduction
Gastric cancer (GC) is one of the most common malignancies worldwide. Globally, GC
ranks fourth and third in terms of incidence and mortality respectively[164]
. In India, it is
one of the most aggressive cancers ranking third and second in terms of incidence and
mortality respectively[7]
. Surgery remains the mainstay for cure especially in early
cancers, while in locally advanced GC, the addition of perioperative chemotherapy
affords a better survival advantage[165]
. The NACT facilitates histological tumor
regression and thereby increases the rate of curative or pathologically disease-free margin
(R0)[166]
. The current standard practice in GC is to submit the resected stomach for
pathological examination to confirm the diagnosis and stage of the tumour as well as to
assess the margins of resection (based on absence of tumor cells using haematoxylin and
eosin staining and examination of the stained tissue under the light microscope). A
pathologically negative resection / R0 margin affords the best chance of cure in GC with
5-year survival rates for resection margin positive and negative disease being 13 versus
35% respectively[167]
. However, despite apparently curative surgery, loco regional
recurrence has still been encountered in 87% of GC patients[168]
raising the doubt of
current pathological techniques used in day to day practice to truly confirm the adequacy
of the surgical resection margins. Therefore, there is an urgent need to identify molecular
markers and investigate their expression in not only the cancerous tissues, but the
surrounding resected (margin) tissue that is apparently free from disease (R0) based on
histpathology.
Epigenetic mechanisms like DNA methylation, microRNA, histone variants and
histone post-translational modifications (PTMs) play an important role in many biological
processes, including cell-cycle regulation, DNA damage and stress response, embryonic
development, cellular differentiation. Global disruption of the epigenetic landscape,

Chapter 5: Histone H3 Serine 10 phosphorylation in GC
89
resulting in aberrant gene expression and function, is a hallmark of human cancer along
with genetic alteartions[169]
. Global loss of acetylation of histone H4 at lysine 16
(H4K16ac) and loss of trimethylation of histone H4 at lysine 20 (H4K20me3) were the
first histone marks reported to be deregulated in cancer[56]
. Over the past decade
accumulated evidence indicates towards the association of aberrant histone PTMs,
defined as ‘histone onco-modifications’, provide an independent prognostic information
for several cancers, including prostate, kidney, lung, ovarian, pancreatic, esophageal and
breast cancers etc[68]
. In gastric cancer, high level of histone methylation, H3K9me3 was
found to be correlated with lympho-vascular invasion, recurrence and poor survival rate.
H3K9me3 was further shown as independent prognostic marker in GC[86]
. In addition to
their role in disease prognosis, epigenetic alterations, specifically DNA methylation are
also reported in field cancerization/defects in various types of cancer, including stomach,
liver, colon, lung, breast, kidney, and esophageal[170]
. However, relation of histone PTMs
between tumor and resection margin and the regulatory mechanism for their alteration is
poorly understood in cancer.
In this chapter of the thesis, we aimed to identify most significant and consistent
differential histone PTM when tumor and negative resection margin is compared. Further,
clinicopathological correlation and regulation the histone marks is studied. After initial
screening, phorylation of histone H3 at serine 10 (H3S10ph) was taken-up for a detailed
study.

Chapter 5: Histone H3 Serine 10 phosphorylation in GC
90
5.2 Results
5.2.1 Level of H3S10ph levels in tumor and resection margin tissues
Histones were prepared from freshly resected paired (n=10) tumor and R0 resection
margin (RM) tissues of gastric cancer patients, for a pilot study. Histones and their
respective paraffin blocks were subjected to immunoblotting and IHC analysis with site-
specific acetylation, methylation and phosphorylation marks of histone H3 and H4
(Appendix, Figure A3.1). H3S10ph showed most significant (p< 0.001) and consistent
(9/10 patients) increase in tumor compared to resection margin tissues in immunoblot
analysis (Figure 5.1A and Appendix, Figure A3.1). Further, the loss of H4K16ac and
H4K20me3 is a hallmark of tumor[56]
; however, it was not reported in GC. Our
immunoblot and IHC analysis confirmed the decrease of H4K16ac and H4K20me3 in GC
as well (Figure 5.1A and 5.1B). This confirmed the universality of epigenetic alterations
and also validated our histopathological analysis at molecular level that defined tumor
and negative resection margin. The status of H3S10ph was further studied in validation
set (n= 101) among tumor, PRM and DRM tissues using IHC. IHC showed high level of
H3S10ph in tumor compared to both the resection margins (Figure 5.1C). H-score based
analysis of frequency distribution of tumor, PRM and DRM tissue samples showed 76, 57
and 42; 19, 40 and 44; 6, 4 and 15 samples with low, intermediate and high level of
H3S10ph, respectively (Figure 5.1D). Further, comparison of H-score showed a
significant high level of H3S10ph in tumor compared to PRM (p < 0.001) and DRM (p <
0.001) tissues (Figure 5.1E).
5.2.2 Correlation of H3S10ph levels of tumor, PRM and DRM with
clinicopathological variables
H3S10ph levels of tumor tissues showed a significant positive correlation with World
Health Organization (WHO) classification (p= 0.0001), T stage (p= 0.005), pTNM stage

Chapter 5: Histone H3 Serine 10 phosphorylation in GC
90
(p= 0.016) and recurrence (p= 0.034). Interestingly, except recurrence, H3S10ph levels
of PRM and DRM tissues also showed a significant positive correlation with the same
clinical parameters as tumor tissues; WHO classification (p= 0.008 and 0.0001 for PRM
and DRM respectively), T-stage (p= 0.001 and 0.003 for PRM and DRM respectively)
and pTNM stage (p= 0.015 and 0.037 for PRM and DRM respectively). Only DRM
showed significant correlation with recurrence (p= 0.012) (Table 5.1).
Figure 5.1: H3S10ph level in Tumor, PRM and DRM tissues in GC: (A) Immunoblot analysis of
H3S10ph, H4K16ac and H4K20me3 in freshly resected paired tumor and resection margin
tissues (n=10). (B) H4K16ac and H4K20me3 immunostaining in paired (n=10) tumor and
resection margin tissues (left panel). Mean H-score of immunostaining was compared using
Wilcoxon matched pair test (right panel). (C) H3S10ph immunostaining in paired (n=101) tumor,
PRM and DRM tissues. (D) Frequency distribution of tumor, PRM and DRM tissues under low
(H-score 0-100), intermediate (H-score 100-200) and high (H- score 200-300) level H3S10ph
groups. (E) Comparison mean H-score of H3S10ph immunostaining revealed loss of H3S10ph in
both PRM and DRM compared to tumor tissues.RM- resection margin, T- tumor, P- patient,
PRM- proximal resection margin, DRM- distal resection margin, ‡-Mann-whitney test.

Chapter 5
: Histo
ne H
3 S
erine 1
0 p
hosp
horyla
tion in
GC
91
Ta
ble
5.1
: Co
rrelatio
n b
etween
H3S
10
ph
osp
ho
ryla
tion
levels o
f Tu
mor, P
RM
an
d D
RM
with
clinico
pa
tho
log
ical v
aria
bles
To
tal (n=
101
)
H3
S10
ph
osp
ho
rylatio
n lev
el of T
um
or
p-v
alue*
H3
S10
ph
osp
ho
rylatio
n lev
el of P
RM
p-v
alue*
H3
S10
ph
osp
ho
rylatio
n lev
el of D
RM
p-v
alue*
L
ow
(%),
n=
42
Inter. (%
),
n=
44
Hig
h (%
),
n=
15
Lo
w (%
),
n=
76
Inter. (%
),
n=
19
Hig
h (%
),
n=
6
Lo
w (%
),
n=
57
Inter. (%
),
n=
40
Hig
h (%
),
n=
4
Age (y
ears)
≤
50
15
(35.7
) 1
8 (4
0.9
) 6
(40
.0)
0.8
79‡
31
(40.8
) 6
(31
.6)
2 (3
3.3
) 0
.73
4‡
21
(36.8
) 1
6 (4
0.0
) 2
(50
.0)
0.8
49‡
>
50
27
(64.3
) 2
6 (5
9.1
) 9
(60
.0)
45
(59.2
) 1
3 (6
8.4
) 4
(66
.7)
36
(63.2
) 2
4 (6
0.0
) 2
(50
.0)
Sex
M
ale 2
9 (6
9.0
) 3
2 (7
2.7
) 9
(60
.0)
0.6
52‡
53
(69.7
) 1
1 (5
7.9
) 6
(10
0.0
) 0
.14
8‡
40
(70.2
) 2
6 (6
5.0
) 4
(10
0.0
) 0
.34
3‡
F
emale
1
3 (3
1.0
) 1
2 (2
7.7
) 6
(40
.0)
23
(30.3
) 8
(42
.1)
0 (0
.0)
17
(29.8
) 1
4 (3
5.0
) 0
(0.0
)
WH
O classificatio
n
W
D
2 (4
.8)
0 (0
.0)
0 (0
.0)
0.0
001
‡
2 (2
.6)
0 (0
.0)
0 (0
.0)
0.0
08‡
2 (3
.5)
0 (0
.0)
0 (0
.0)
0.0
001
‡
M
D
22
(52.4
) 3
(6.8
) 0
(0.0
) 2
4 (3
1.6
) 1
(5.3
) 0
(0.0
) 2
3 (4
0.4
) 2
(5.0
) 0
(0.0
P
D
16
(38.1
) 4
0 (4
0.9
) 7
(46
.7)
44
(57.9
) 1
6 (8
4.2
) 3
(50
.0)
29
(50.9
) 3
3 (8
2.5
) 1
(25
.0)
S
RC
2
(4.8
) 1
(2.3
) 8
(53
.3)
6 (7
.9)
2 (1
0.5
) 3
(50
.0)
3 (5
.3)
5 (1
2.5
) 3
(75
.0)
T stag
e
T
1
9 (2
1.4
) 4
(9.1
) 1
(6.7
)
0.0
05†
13
(17.1
) 1
(5.3
) 0
(0.0
)
0.0
01†
11
(19.3
) 3
(7.5
) 0
(0.0
)
0.0
03†
T
2
11
(26.2
) 1
0 (2
2.7
) 3
(20
.0)
22
(28.9
) 2
(10
.5)
0 (0
.0)
14
(24.6
) 1
0 (2
5.0
) 0
(0.0
T
3
16
(38.1
) 2
0 (4
5.5
) 2
(13
.3)
26
(34.2
) 1
0 (5
2.6
) 2
(33
.3)
23
(40.4
) 1
5 (3
7.5
) 0
(0.0
)
T
4
6 (1
4.3
) 1
0 (2
2.7
) 9
(60
.0)
15
(19.7
) 6
(31
.6)
4 (6
6.7
) 9
(15
.8)
12
(30.0
) 4
(0.0
)
Lym
ph
no
de m
etastasis
0.3
85†
A
bsen
t 2
0 (4
7.6
) 2
7 (6
1.4
) 1
0 (6
6.7
) 0
.13
6†
42
(55.3
) 1
0 (5
2.6
) 5
(83
.3)
30
(52.6
) 2
4 (6
0.0
) 3
(75
.0)
0.3
11†
P
resent
22
(52.4
) 1
7 (3
8.6
) 5
(33
.3)
34
(44.7
) 9
(47
.4)
1 (1
6.7
) 2
7 (4
7.4
) 1
6 (4
0.0
) 1
(25
.0)
pT
NM
stage
I
14
(33.3
) 7
(15
.9)
1 (6
.7)
0.0
16†
20
(26.3
) 2
(10
.5)
0 (0
.0)
0.0
15†
17
(29.8
) 5
(12
.5)
0 (0
.0)
0.0
37†
II
15
(35.7
) 2
2 (5
0.0
) 6
(40
.0)
33
(43.4
) 8
(42
.1)
2 (3
3.3
) 2
2 (3
8.6
) 2
0 (5
0.0
) 1
(25
.0)
III
13
(31.0
) 1
4 (3
1.8
) 7
(46
.7)
22
(28.9
) 8
(42
.1)
4 (6
6.7
) 1
7 (2
9.8
) 1
4 (3
5.0
) 3
(75
.0)
IV
0
(0.0
) 1
(2.3
) 1
(6.7
) 1
(1.3
) 1
(5.3
) 0
(0.0
) 1
(1.8
) 1
(2.5
) 0
(0.0
)
Recu
rrence
A
bsen
t 3
2 (7
6.2
) 2
8 (6
3.6
) 7
(46
.7)
0.0
34†
54
(71.1
) 8
(42
.1)
5 (8
3.3
) 0
.35
1†
43
(75.4
) 2
3 (5
7.5
) 1
(25
.0)
0.0
12†
P
resent
10
(23.8
) 1
6 (3
6.4
) 8
(53
.3)
22
(28.9
) 1
1 (5
7.9
) 1
(16
.7)
14
(24.6
) 1
7 (4
2.5
) 3
(75
.0)
Treatm
ent m
od
ality
S
urg
ery
24
(57.1
) 2
1 (4
7.7
) 1
2 (8
0.0
) 0
.09
3‡
43
(56.6
) 1
1 (5
7.9
) 3
(50
.0)
0.9
43‡
28
(49.1
) 2
6 (6
5.0
) 3
(75
.0)
0.0
87‡
NA
CT
+
Su
rgery
1
8 (4
2.9
) 2
3 (5
2.3
) 3
(20
.0)
33
(43.4
) 8
(42
.1)
3 (5
0.0
) 2
9 (5
0.9
) 1
4 (3
5.0
) 1
(25
.0)
* A
ll three co
lum
ns are co
mpared
in each
category
,† C
hi-sq
uare test b
y tw
o-sid
ed lin
ear-by-lin
ear associatio
n, †
Chi-sq
uare test b
y tw
o-sid
ed lin
ear-by-lin
ear associatio
n
‡ C
hi-sq
uare test b
y tw
o-sid
ed F
ischer’s ex
act test, Bold
indicates v
alues th
at are statistically sig
nifican
t (<0
.05
), Int.- In
termed
iate, PR
M- p
roxim
al resection
marg
in, D
RM
- distal resectio
n m
argin
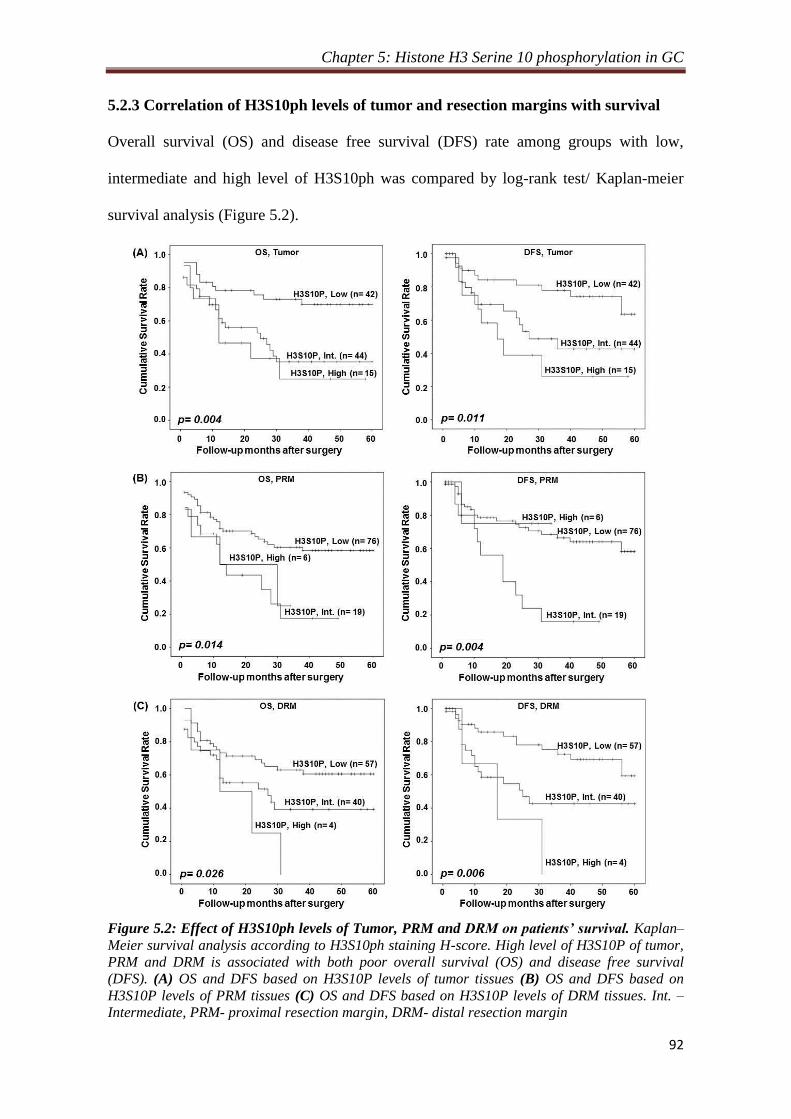
Chapter 5: Histone H3 Serine 10 phosphorylation in GC
92
5.2.3 Correlation of H3S10ph levels of tumor and resection margins with survival
Overall survival (OS) and disease free survival (DFS) rate among groups with low,
intermediate and high level of H3S10ph was compared by log-rank test/ Kaplan-meier
survival analysis (Figure 5.2).
Figure 5.2: Effect of H3S10ph levels of Tumor, PRM and DRM on patients’ survival. Kaplan–
Meier survival analysis according to H3S10ph staining H-score. High level of H3S10P of tumor,
PRM and DRM is associated with both poor overall survival (OS) and disease free survival
(DFS). (A) OS and DFS based on H3S10P levels of tumor tissues (B) OS and DFS based on
H3S10P levels of PRM tissues (C) OS and DFS based on H3S10P levels of DRM tissues. Int. –
Intermediate, PRM- proximal resection margin, DRM- distal resection margin
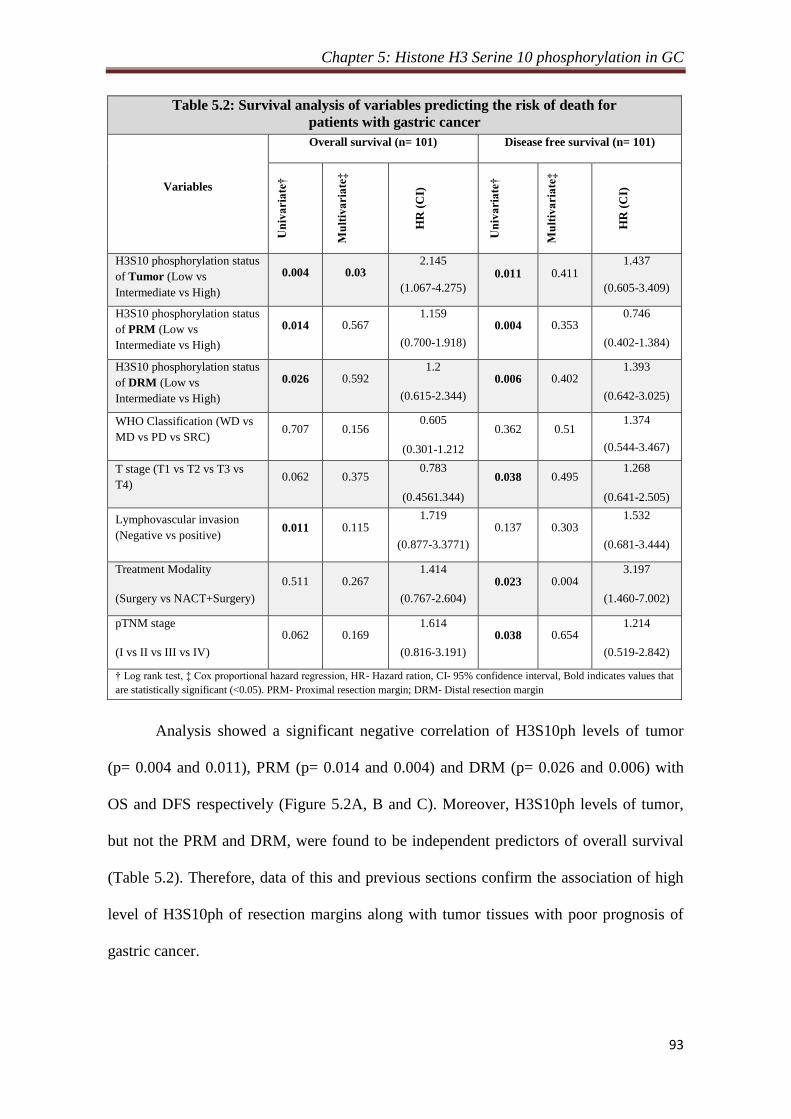
Chapter 5: Histone H3 Serine 10 phosphorylation in GC
93
Table 5.2: Survival analysis of variables predicting the risk of death for
patients with gastric cancer
Variables
Overall survival (n= 101) Disease free survival (n= 101)
Un
iva
ria
te†
Mu
ltiv
ari
ate
‡
HR
(C
I)
Un
iva
ria
te†
Mu
ltiv
ari
ate
‡
HR
(C
I)
H3S10 phosphorylation status
of Tumor (Low vs
Intermediate vs High)
0.004 0.03 2.145
(1.067-4.275)
0.011 0.411 1.437
(0.605-3.409)
H3S10 phosphorylation status
of PRM (Low vs
Intermediate vs High)
0.014 0.567 1.159
(0.700-1.918)
0.004 0.353 0.746
(0.402-1.384)
H3S10 phosphorylation status
of DRM (Low vs
Intermediate vs High)
0.026 0.592 1.2
(0.615-2.344)
0.006 0.402 1.393
(0.642-3.025)
WHO Classification (WD vs
MD vs PD vs SRC) 0.707 0.156
0.605
(0.301-1.212
0.362 0.51 1.374
(0.544-3.467)
T stage (T1 vs T2 vs T3 vs
T4) 0.062 0.375
0.783
(0.4561.344)
0.038 0.495 1.268
(0.641-2.505)
Lymphovascular invasion
(Negative vs positive) 0.011 0.115
1.719
(0.877-3.3771)
0.137 0.303 1.532
(0.681-3.444)
Treatment Modality
(Surgery vs NACT+Surgery)
0.511 0.267 1.414
(0.767-2.604)
0.023 0.004 3.197
(1.460-7.002)
pTNM stage
(I vs II vs III vs IV)
0.062 0.169 1.614
(0.816-3.191)
0.038 0.654 1.214
(0.519-2.842)
† Log rank test, ‡ Cox proportional hazard regression, HR- Hazard ration, CI- 95% confidence interval, Bold indicates values that
are statistically significant (<0.05). PRM- Proximal resection margin; DRM- Distal resection margin
Analysis showed a significant negative correlation of H3S10ph levels of tumor
(p= 0.004 and 0.011), PRM (p= 0.014 and 0.004) and DRM (p= 0.026 and 0.006) with
OS and DFS respectively (Figure 5.2A, B and C). Moreover, H3S10ph levels of tumor,
but not the PRM and DRM, were found to be independent predictors of overall survival
(Table 5.2). Therefore, data of this and previous sections confirm the association of high
level of H3S10ph of resection margins along with tumor tissues with poor prognosis of
gastric cancer.

Chapter 5: Histone H3 Serine 10 phosphorylation in GC
94
5.2.4 Relation of H3S10ph levels of resection margins and their distance from the
site of tumor
Our observation of low level of H3S10ph in resection margin compared to tumor tissues
led us to examine whether the decrease had any relation with the distance of resection
margin from the tumor. To answer this, we first grouped the resection margin samples as
per their distance from tumor site and compared the mean H-score of H3S10ph
immunostaining of each group with the mean H-score of tumor samples (Figure 5.3). For
both PRM and DRM, a significant reduction in HS10ph (p < 0.05) was observed for
patient’s group with resection margin distance is > 4 cm (Figure 5.3A and B, left panel).
Figure 5.3: Association of H3S10ph with the distance of resection margin. (A) and (C) To
identify the distance of resection margin from where H3S10ph start decreasing significantly
compared to tumor tissues, accordingly resection margins were grouped as per their distance
from the site of tumor with 1 cm interval and mean H-score (H3S10ph) of each group was
compared with tumor. In case of both PRM and DRM, analysis showed a significant decrease in
H3S10ph levels as the margin length reaches more than 4 cm (left panel). Comparison of mean
H-score of all resection margins with margin distance ≤ 4 cm and >4 cm with tumor confirms the
significant reduction of H3S10ph if the margin distance is > 4 cm (right panel). (B) and (D)
Confirmation of reduction of H3S10ph, if the margin length is > 4 cm by immunoblotting.

Chapter 5: Histone H3 Serine 10 phosphorylation in GC
95
Further, patients were divided into two groups based on the distance of resection
margin- ≤ 4 cm or > 4 cm and their mean H-scores were compared with tumor.
Comparison showed H3S10ph levels of resection margins with the distance ≤ 4 cm were
almost equal to tumor tissues, however, resection margins with > 4cm distance showed a
significant (p < 0.001) reduction both in case PRM and DRM (Figure 5.3A and B, middle
panel). Additionally, immunoblot analysis also confirmed the reduction of H3S10ph
levels of resection margin if the distance is > 4cm from the site of tumor (Figure 5.3A and
B, right panel).
5.2.5 Effect of resection margin distance on prognostic value of H3S10ph
To investigate the effect of resection margin distance from the site of tumor on the
prognostic value of H3S10ph, its association with clinicopathological variables and
survival were compared between the group with the resection margin ≤ 4 cm and > 4 cm.
Chi-square analysis showed a positive correlation of H3S10ph levels with WHO
classification (p= 0.001), T-stage (p= 0.002) and TNM stage (p= 0.023) for the patients
with resection margin ≤ 4 cm. In case of DRM, Chi-square analysis showed a positive
correlation of H3S10ph levels with WHO classification (p= 0.0001) and T-stage (p=
0.009) and recurrence (p= 0.031) for the patients with resection margin ≤ 4 cm. For both
the resection margins, no correlation was found for patients with > 4 cm resection margin
distance (Table 5.3).
In case of OS, patients with PRM ≤ 4 cm showed significant (p= 0.003) difference
among the group of high, intermediate and low level of H3S10ph (Figure 5.4A) and no
difference was observed in case of DRM (Figure 5.4C). However, in case of DFS,
distance seems to have no effect as patients with both ≤ or > 4 cm resection showed
significant difference in survival among the group of high, intermediate and low level of
H3S10ph for both PRM (p= 0.028 vs 0.006) and DRM (p= 0.041 vs 0.005).
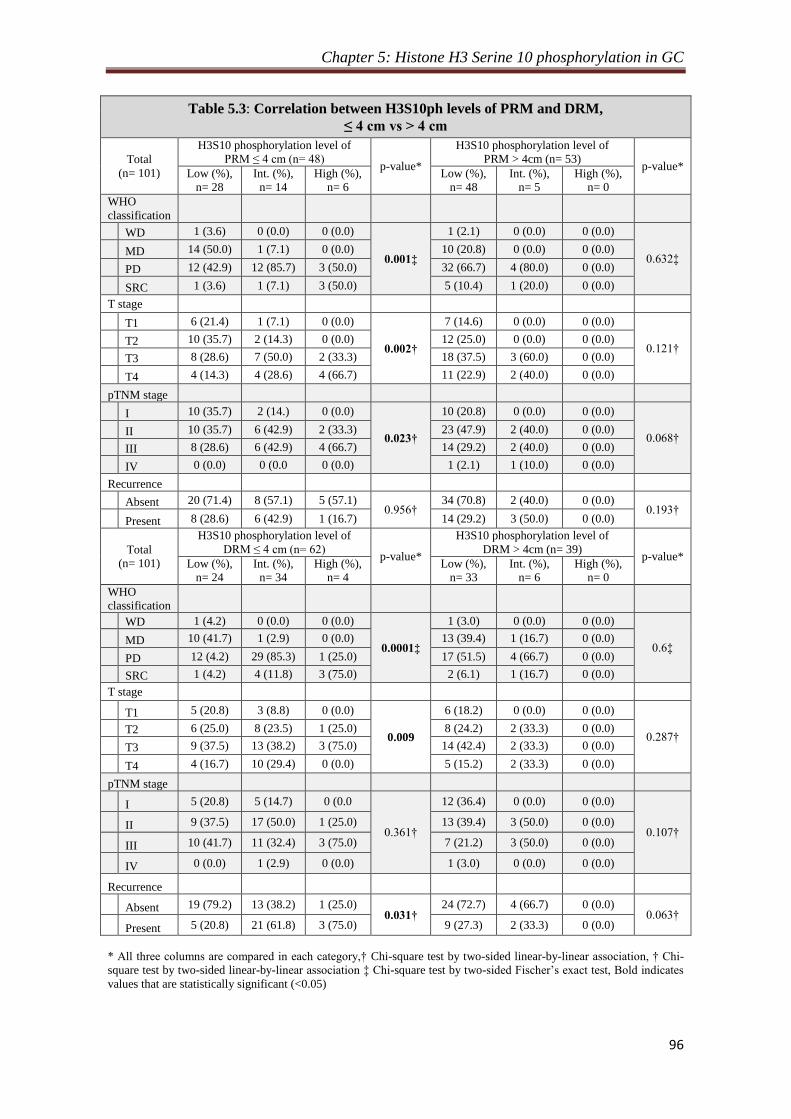
Chapter 5: Histone H3 Serine 10 phosphorylation in GC
96
Table 5.3: Correlation between H3S10ph levels of PRM and DRM,
≤ 4 cm vs > 4 cm
Total
(n= 101)
H3S10 phosphorylation level of
PRM ≤ 4 cm (n= 48) p-value*
H3S10 phosphorylation level of
PRM > 4cm (n= 53) p-value*
Low (%),
n= 28
Int. (%),
n= 14
High (%),
n= 6
Low (%),
n= 48
Int. (%),
n= 5
High (%),
n= 0
WHO
classification
WD 1 (3.6) 0 (0.0) 0 (0.0)
0.001‡
1 (2.1) 0 (0.0) 0 (0.0)
0.632‡ MD 14 (50.0) 1 (7.1) 0 (0.0) 10 (20.8) 0 (0.0) 0 (0.0)
PD 12 (42.9) 12 (85.7) 3 (50.0) 32 (66.7) 4 (80.0) 0 (0.0)
SRC 1 (3.6) 1 (7.1) 3 (50.0) 5 (10.4) 1 (20.0) 0 (0.0)
T stage
T1 6 (21.4) 1 (7.1) 0 (0.0)
0.002†
7 (14.6) 0 (0.0) 0 (0.0)
0.121† T2 10 (35.7) 2 (14.3) 0 (0.0) 12 (25.0) 0 (0.0) 0 (0.0)
T3 8 (28.6) 7 (50.0) 2 (33.3) 18 (37.5) 3 (60.0) 0 (0.0)
T4 4 (14.3) 4 (28.6) 4 (66.7) 11 (22.9) 2 (40.0) 0 (0.0)
pTNM stage
I 10 (35.7) 2 (14.) 0 (0.0)
0.023†
10 (20.8) 0 (0.0) 0 (0.0)
0.068† II 10 (35.7) 6 (42.9) 2 (33.3) 23 (47.9) 2 (40.0) 0 (0.0)
III 8 (28.6) 6 (42.9) 4 (66.7) 14 (29.2) 2 (40.0) 0 (0.0)
IV 0 (0.0) 0 (0.0 0 (0.0) 1 (2.1) 1 (10.0) 0 (0.0)
Recurrence
Absent 20 (71.4) 8 (57.1) 5 (57.1)
0.956† 34 (70.8) 2 (40.0) 0 (0.0)
0.193† Present 8 (28.6) 6 (42.9) 1 (16.7) 14 (29.2) 3 (50.0) 0 (0.0)
Total
(n= 101)
H3S10 phosphorylation level of
DRM ≤ 4 cm (n= 62) p-value*
H3S10 phosphorylation level of
DRM > 4cm (n= 39) p-value*
Low (%),
n= 24
Int. (%),
n= 34
High (%),
n= 4
Low (%),
n= 33
Int. (%),
n= 6
High (%),
n= 0
WHO
classification
WD 1 (4.2) 0 (0.0) 0 (0.0)
0.0001‡
1 (3.0) 0 (0.0) 0 (0.0)
0.6‡ MD 10 (41.7) 1 (2.9) 0 (0.0) 13 (39.4) 1 (16.7) 0 (0.0)
PD 12 (4.2) 29 (85.3) 1 (25.0) 17 (51.5) 4 (66.7) 0 (0.0)
SRC 1 (4.2) 4 (11.8) 3 (75.0) 2 (6.1) 1 (16.7) 0 (0.0)
T stage
T1 5 (20.8) 3 (8.8) 0 (0.0)
0.009
6 (18.2) 0 (0.0) 0 (0.0)
0.287† T2 6 (25.0) 8 (23.5) 1 (25.0) 8 (24.2) 2 (33.3) 0 (0.0)
T3 9 (37.5) 13 (38.2) 3 (75.0) 14 (42.4) 2 (33.3) 0 (0.0)
T4 4 (16.7) 10 (29.4) 0 (0.0) 5 (15.2) 2 (33.3) 0 (0.0)
pTNM stage
I 5 (20.8) 5 (14.7) 0 (0.0
0.361†
12 (36.4) 0 (0.0) 0 (0.0)
0.107† II 9 (37.5) 17 (50.0) 1 (25.0) 13 (39.4) 3 (50.0) 0 (0.0)
III 10 (41.7) 11 (32.4) 3 (75.0) 7 (21.2) 3 (50.0) 0 (0.0)
IV 0 (0.0) 1 (2.9) 0 (0.0) 1 (3.0) 0 (0.0) 0 (0.0)
Recurrence
Absent 19 (79.2) 13 (38.2) 1 (25.0) 0.031†
24 (72.7) 4 (66.7) 0 (0.0) 0.063†
Present 5 (20.8) 21 (61.8) 3 (75.0) 9 (27.3) 2 (33.3) 0 (0.0)
* All three columns are compared in each category,† Chi-square test by two-sided linear-by-linear association, † Chi-
square test by two-sided linear-by-linear association ‡ Chi-square test by two-sided Fischer’s exact test, Bold indicates
values that are statistically significant (<0.05)
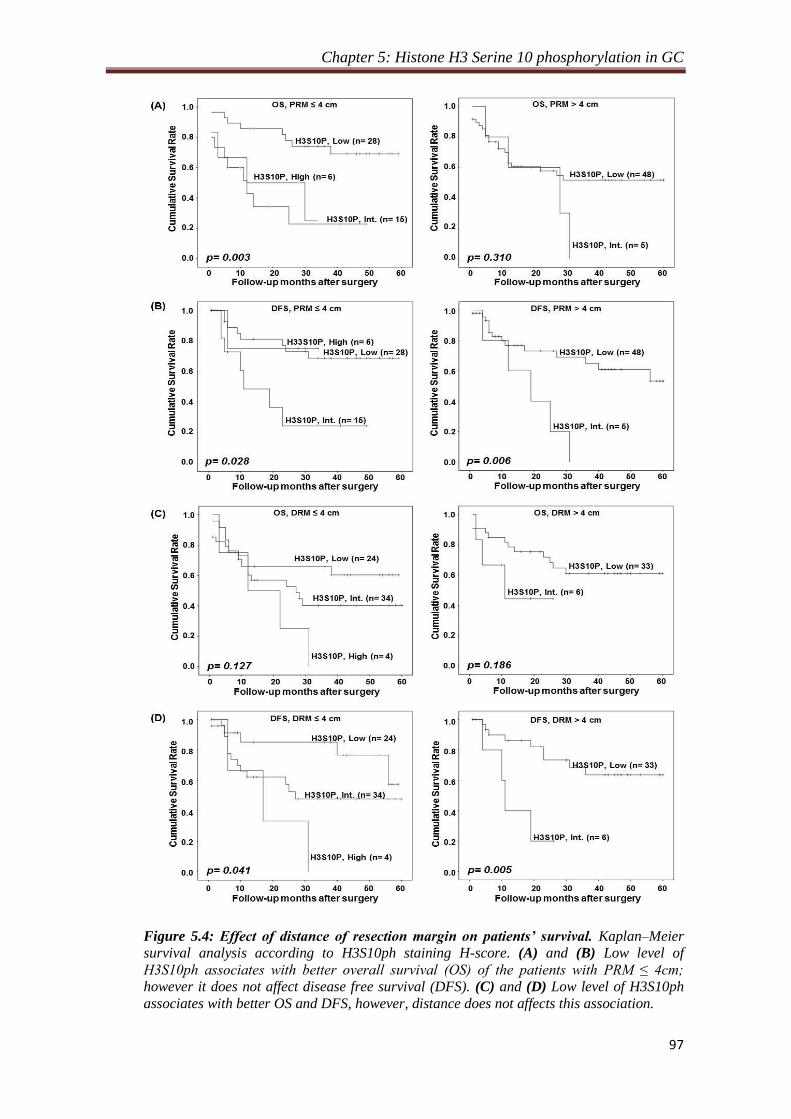
Chapter 5: Histone H3 Serine 10 phosphorylation in GC
97
Figure 5.4: Effect of distance of resection margin on patients’ survival. Kaplan–Meier
survival analysis according to H3S10ph staining H-score. (A) and (B) Low level of
H3S10ph associates with better overall survival (OS) of the patients with PRM ≤ 4cm;
however it does not affect disease free survival (DFS). (C) and (D) Low level of H3S10ph
associates with better OS and DFS, however, distance does not affects this association.

Chapter 5: Histone H3 Serine 10 phosphorylation in GC
98
Taken together, these data indicate that the distance of resection margin is an
important factor in GC prognosis and H3S10ph could be a potential biomarker in
predicting the association between distance of resection margin and clinical parameters.
However, H3S10ph cannot be used to predict the survival difference based on the
distance of resection margin for both PRM and DRM.
5.2.6 Association of increase of H3S10ph with phase of cell cycle in GC
H3S10ph is a very dynamic histone marker and its level changes throughout the cell cycle
with the highest level in mitotic, and the lowest level in the interphase of the cell cycle[51,
171]. To determine whether increase of H3S10ph in gastric cancer is dependent on the cell
cycle profile of the tissues samples, cyclin levels, mitotic index and cell cycle profile of
tumor and resection margin tissues were studied (Figure 5.5). Cyclin B1, D1 and E1
levels are known to peak at the time of G2/M phase transition, mid-S phase and G1/S
phase transition, respectively. RT-PCR analysis showed the increase in the mRNA levels
of all the cyclins in tumor than the resection margin tissues; however no change were
observed in their ratios between tumor and resection margin tissues (Figure 5.5A).
Mitotic index also did not show any significant increase in mitotic cells in tumor
compared to resection margin tissues (Figure 5.5B). Flow cytometry based cell cycle
analysis of tissue samples showed equal percentage of G1, S and G2/M cells in tumor and
resection margin tissues with maximum population of cells in G1 phase (Figure 5.5C).
These results indicate that the observed increase of H3S10ph in GC is not because of the
enrichment of cells in any cell cycle phase in tumor compared to resection margin tissues.
In mitotic phase H3S10ph is associated with chromatin condensation and
transcription silencing while in interphase of cell cycle increase of H3S10ph is associated
with chromatin relaxation and transcription up-regulation of mainly immediate early (IE)
genes[172]
. Cell cycle analysis revealed about 80% cells of tumor and resection margin

Chapter 5: Histone H3 Serine 10 phosphorylation in GC
99
tissues were in G1 phase (Figure. 5.5C). Therefore, to determine whether increase in
H3S10ph in GC is an interphase-associated phenomenon or not, we checked the levels of
IE genes (c-jun and c-fos) using RT-PCR and immunoblotting. The data showed increase
in the levels of c-jun and c-fos in tumor compared to resection margin tissues (Figure.
5.5D). Therefore, taken together, these data confirm that increase in H3S10ph levels in
GC is independent of cell cycle, but an interphase associated phenomenon.
Figure 5.5: Association of H3S10ph with cell cycle profile of gastric tumor and resection
margin tissues. (A) RT-PCR analysis shows high mRNA level of cyclin B1, D1 and E1 in tumor
than resection margin tissues (left panel). mRNA level of cyclins were normalized with 18s rRNA,
combined % was calculated for each cyclin in tumor and resection margin tissues and their
relative % levels were compared showing no significant difference in cell cycle profile of tumor
and resection margin tissues (right panel). (B) Arrow heads showing mitotic cells in H&E stained
resection margin and tumor tissue sections (left panel). On H&E stained tissue sections mitotic
index was calculated for paired samples (n=40) and compared between tumor and resection
margin tissues showing no significant difference (right panel). (C) FACS based cell cycle profile
showed most of the cells of both tumor and resection margin tissues are in G1 phase (upper
panel). Comparison of mean % (n=10) of G2/M, G1 and S phase of cell cycle showed no
difference in cell cycle profile of tumor and resection margin tissues (lower panel). (D) RT-PCR
(left upper panel) and immunoblot (left lower panel) analysis showed high level of immediate
early genes, c-jun and c-fos in tumor than resection margin tissues. After normalization,
comparison of relative level also showed significant increase of c-jun and c-fos in tumor tissues,
both at transcript (right upper panel) and protein (right lower panel) level. Wilcoxon matched pair test.

Chapter 5: Histone H3 Serine 10 phosphorylation in GC
100
5.2.7 MSK1 phosphorylates H3S10 through p38-MAPK pathway in GC
Several kinases are known to phosphorylate H3S10[51]
; however, only mitogen- and
stress-activated protein kinase-1 (MSK1) mediated phosphorylation of H3S10 is known
to be involved in cellular transformation[63]
which is activated through p38 and/ or
ERK1/2 MAP kinase pathway[173]
. In addition, overexpression of c-jun and c-fos, as
observed in our experiments (Figure. 5.5D) has also been linked to MSK1 mediated
phosphorylation of H3S10 at their promoters[172]
. Therefore, Levels of ph-MSK1 and ph-
p38 and ph-ERK1/2 levels in tumor and resection margin tissues of GC patients were
analysed (Figure 5.6A). Immunoblot (Figure 5.6A, upper panel) as well as densitometry
analysis (Figure 5.6A, lower panel) showed the increase of ph-MSK1 and ph-p38 levels
while ph-ERK1/2 levels decrease in tumor compared to resection margin tissues. Thus,
indicating p38 mediated activation of MSK1 in GC. The increase of ph-MSK1 levels in
GC was further confirmed by IHC analysis of the same tissues (Figure 5.6B). The
observed increase of H3S10ph on overexpression of MSK1 in AGS cells by immunoblot
(Figure 5.6C) and moreover, decrease of H3S10ph on H89 mediated biochemical
inhibition of MSK1 by immunoblot studies in AGS and KATOII cell lines (Figure 5.6D)
and immunofluorescence studies in AGS cells (Figure 5.6E) confirmed MSK1 mediated
phosphorylation of H3S10 in GC. Further, immunoblot analysis with specific antibodies
showed decrease of ph-MSK1 and H3S10ph only on the treatment of p38 inhibitor
(SB203580) in AGS and KATOIII cells but not on the treatment of ERK1/2 inhibitor
(PD89059) (Figure. 5.6F). And, immunofluorescence studies on inhibitor treated AGS
cells validated that p38 is responsible for phosphorylation of MSK1 in GC. Thus,
confirming p38-MAPK/ MSK1 mediated increase of H3S10ph in GC.
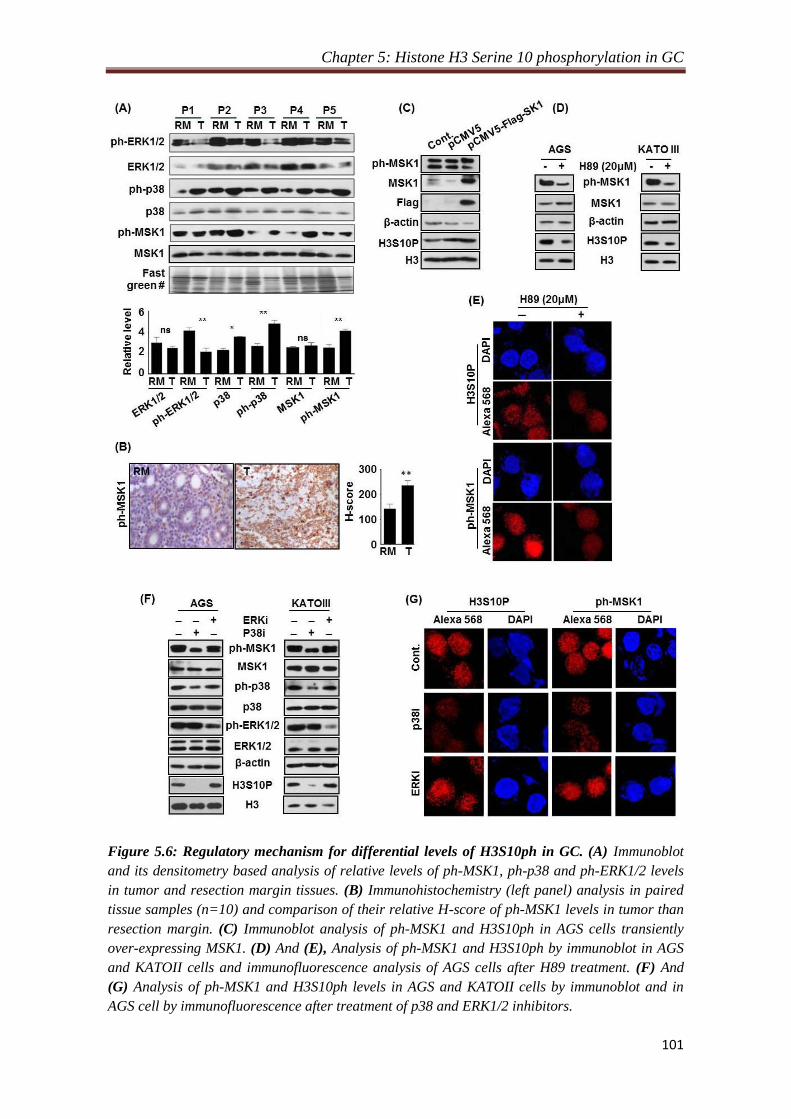
Chapter 5: Histone H3 Serine 10 phosphorylation in GC
101
Figure 5.6: Regulatory mechanism for differential levels of H3S10ph in GC. (A) Immunoblot
and its densitometry based analysis of relative levels of ph-MSK1, ph-p38 and ph-ERK1/2 levels
in tumor and resection margin tissues. (B) Immunohistochemistry (left panel) analysis in paired
tissue samples (n=10) and comparison of their relative H-score of ph-MSK1 levels in tumor than
resection margin. (C) Immunoblot analysis of ph-MSK1 and H3S10ph in AGS cells transiently
over-expressing MSK1. (D) And (E), Analysis of ph-MSK1 and H3S10ph by immunoblot in AGS
and KATOII cells and immunofluorescence analysis of AGS cells after H89 treatment. (F) And
(G) Analysis of ph-MSK1 and H3S10ph levels in AGS and KATOII cells by immunoblot and in
AGS cell by immunofluorescence after treatment of p38 and ERK1/2 inhibitors.

Chapter 5: Histone H3 Serine 10 phosphorylation in GC
102
5.3 Discussion
Histone post-translational modifications (PTMs) play an important role in the regulation
of gene expression, including those involved in cancer development and progression. The
histone modifications like acetylation (i.e., H3K9ac, H3K14ac, H3K23ac, H4K5ac and
H4K16ac) is generally associated with relaxed chromatin and transcriptional activation,
whereas histone methylation is associated with both transcriptional activation (i.e., H3K4,
H3K36, and H3K79) and repression (i.e., H3K9, H3K27, and H4K20)[32]
. Also,
phosphorylation of histone like H3S10ph and H3S28ph are associated with the regulation
of proto-oncogenes such as c-fos, c-jun and c-myc[172]
. However, despite of more than a
decade, no global scale comparative analysis of histone PTM levels for large cohort study
with clinical samples has been carried out between tumor and R0 resection margin in
gastric cancer tissues. Moreover, studies related to their regulatory pathways are also very
limited. Such studies present novel avenues for tackling the significance of global histone
modification patterns in human cancer. From this study on human GC, we identified most
consistent alteration in H4K16ac, H4K20me3 and H3S10ph in paired tumor and negative
resection margin tissue samples (Figure. 5.1A and B). H3S10ph showed highly
significant difference between tumor and R0 resection margin. To the best of our
knowledge, several cell lines and animal model based studies have shown increase in
H3S10ph, as the only histone marker responsible in carcinogenesis and cellular
transformation[62, 63, 102, 174]
. However, there is no report on its relative level (tumor vs
resection margin) and regulatory pathway in GC. Our IHC analysis in paired samples
(n=101) demonstrated increase of H3S10ph in gastric tumor compared to both negative
PRM and DRM, for the first time. This observation also corroborated with earlier study in
nasopharyngeal carcinoma (NPC) where H3S10ph was found to be significantly higher in
the poorly differentiated NPC tissues than normal nasopharynx tissues[102]
. The histone

Chapter 5: Histone H3 Serine 10 phosphorylation in GC
103
modifications, H4K16ac and H4K20me3, reported as hallmarks of tumor[56, 86]
, also
showed the novel finding of decrease in GC compared to resection margin tissues. This
observation also validates our histopathological analysis to define tumor and negative
resection margin tissues. On further analysis with clinical parameters, we identified that
increase of H3S10ph in tumor tissues is a marker of poor prognosis and independent
prognostic marker for OS in GC (Table. 5.1, 5.2 and Figure. 5.2A).
Currently, surgery is a main treatment for GC and achieving adequate margin
length for R0 resection is a major challenge. With a 9-21% false negative result,
palpation, gross inspection and even assessment of tumor and resection margin by frozen
section examination are seemingly unreliable methods to judge the adequacy of
resection[175, 176]
. Studies in esophageal, pancreatic, rectal, soft tissue sarcoma and oral
value; however, positive resection margin and its length affects recurrence and survival of
patients[177-181]
. The alarmingly high loco-regional recurrence rate of gastric cancer in
patients with R0 resection[182]
, which point towards the fact that defined negative
resection margin, is not ‘true’ negative resection margin. In our study H3S10ph of both
PRM and DRM showed association with clinical parameters and poorly affects OS and
DFS (Table. 4.1; Figure. 5.1B and C). Additionally, H3S10ph levels of DRM showed
positive correlation with recurrence were disease reverted back in 75% patients of high
level H3S10ph group compared to 42.5% and 24.6% in intermediate and low level of
H3S10ph groups, respectively. Our data implicate that high levels of phosphorylation is
prognostically relevant. Thus, this study for the first time identified, H3S10ph as a
potential molecular marker in predicting prognosis of R0 resected GC patients using their
histopathologically confirmed negative resection margins. Further, observed loss of
H3S10ph and association with clinical parameters including recurrence for the patient
group with the resection margin length > 4 cm (Table. 5.3) in determining the ‘true’

Chapter 5: Histone H3 Serine 10 phosphorylation in GC
104
negative resection margin in GC. Demarcation of 4 cm as an optimal margin length in our
study rationalizes the recommendations of National Comprehensive Cancer Network at
molecular level, which state that ‘the resection margin of more than 4 cm is necessary to
achieve a negative microscopic margin[183]
. Therefore, H3S10ph could be helpful in
limiting the extent of resection and thereby preventing post-surgery loco-recurrence of
disease. The distance dependent relation of H3S10ph with clinical parameters strongly
suggests its association with field cancerization defects. Moreover, various epigenetic
factors like chromatin state, histone deacetylase, microRNA and DNA methylation and
chromatin remodeling factors have shown their involvement in field cancerization in
number of cancers including GC[184-187]
. The occurrence of such epigenetic field defects
may predispose the tissue to go through oncogenic transformation. Further, earlier in vitro
study has shown that higher level of H3S10ph alone is responsible for cellular
transformation. The altered epigenome in the histopathological normal appearing cells
may permit for more permissive environment for the growth of newly transformed cells.
This may provide a possible explanation for high loco-recurrence after R0 resection. Our
results of distance dependent alteration in H3S10ph level of negative resection margin
(Figure. 5.3) and its association with clinical parameters provides the first proof of
histone PTMs in field effect. However, further profiling studies of early GC lesions will
enable us to establish role of H3S10ph in risk assessment and recurrence of GC.
Most of the earlier reports have shown H3S10ph as a better marker for assessing
proliferation and mitotic index than Ki-67, and also have established the increase of
H3S10ph as a marker for poor prognosis in several cancers including GC[100, 103, 107-109,
188]. However, except glioblastoma study, none of these studies have used paired normal
mucosa or negative resection margin along with tumor tissues; therefore, it is difficult to
comment on whether the high proliferation and/or mitotic index or G2/M phase cells is
Chapter 5: Histone H3 Serine 10 phosphorylation in GC
105
the reason for the elevated level of H3S10ph in cancer. H3S10ph is known to regulate
protein–protein interactions to favour chromatin condensation as cells enter the M-phase,
whereas, favours expression of immediate early genes in G1 phase of cell cycle. In
background of these cell cycle specific functions, our data (Figure. 5.5 A, B and C) have
shown no difference in relative cyclin levels, mitotic index and cell cycle profile between
tumor and negative resection margin tissues, thus strongly suggesting that the increase of
H3S10ph in GC is independent of G2/M cell cycle phase. A recent report have also
shown cell cycle independent cigarette sidestream smoke induced increase of H3S10ph
leads to the overexpression of proto-oncogenes c-jun and c-fos and tumor promotion[174]
.
Further, our study also showed presence of maximum percentage of cells in G1 phase of
cell cycle (Figure. 5.5C) and overexpression of c-jun and c-fos in tumor than negative
resection margin tissues lead us to believe that increase of H3S10ph in GC is a cell cycle
interphase-specific phenomenon.
Interestingly, global H3S10ph modification levels were lower in non-malignant
resection margin tissue, and increased dramatically in GC. This indicates that the action
of the histone modifying enzymes differs in paired R0 resection margin as compared to
gastric cancer sample. In our study, cell cycle independent increase of H3S10ph and high
expression of IE genes c-jun and c-fos (Figure. 5.5) suggests us to believe that an
interphase specific kinase, MSK1 phosphorylates H3S10. Moreover, MSK1 is also the
only known kinase of H3S10 whose direct role has been implicated in cellular
transformation[171, 172]
. This notion was further strengthened by the observed high level of
ph-MSK1 (active form of MSK1) in GC tumor tissues (Figure. 5.6A and B). MSK1 is
phosphorylated by MAP kinases, ERK1/2 or p38 in context dependent manner[173, 189]
. In
GC, ph-ERK1/2 reported to have no association with clinical parameters[190]
. On the other
hand several studies in prostate cancer, breast cancer, bladder cancer, liver cancer, lung
Chapter 5: Histone H3 Serine 10 phosphorylation in GC
106
cancer, transformed follicular lymphoma and leukemia have suggested direct role of p38
MAPK in cancer patho-physiological characteristics like proliferation, metastasis and
angiogenesis etc[191-197]
. Our study demonstrates for the first time that p38 MAPK cascade
is responsible for MSK1 mediated H3S10 phosphorylation in gastric or any other cancer
(Figure. 5.6). Further, chronic inflammation is a characteristic of GC[198]
which manifest
itself by overexpression of pro-inflammatory cytokines like IL-1 and IL-6[199]
; therefore,
along with above stated facts p38 MAPK being a key regulator of inflammatory
response[200]
justifies p38 MAPK/ MSK1 but not ERK1/2 MAPK/ MSK1 pathway
mediated regulation of H3S10ph in GC.
In summary, present study provides the first evidence that p38/MSK1 regulated
increase in H3S10ph is strongly correlated with resection margins and concomitantly with
patients’ prognosis. The MSK1-mediated nucleosomal response via H3S10ph in gastric
cancer might be associated with aberrant gene expression. Further, the coherence of
H3S10ph in GC with two well-known reported altered histone modifications in human
cancers, H4K16ac and H3K20me3 suggests that combination of epigenetic modifications
may serve as molecular biomarkers for gastric cancer. Importantly, our data provide a
new rationale for using MSK1 as a molecular target to alter the epigenetic landscape in
GC.

Chapter 6
β- actin expression and its clinicopathological correlation in
gastric adenocarcinoma
Chapter 6: β -actin expression in GC
107
6.1 Introduction
In the last section while investigating the regulatory mechanism of H3S10ph in GC using
total cell lysate and nuleo-cytosolic fraction we observed a very high level of β-actin in
tumor tissues in immunoblot studies. The observation was very consistent and
reproducible; therefore, we persuaded this observation to investigate clinicopathological
importance of β-actin in GC.
Gastric cancer (GC) incidence and mortality is decreasing over several decades,
however, it still remains the fourth most common type of cancer and the second leading
cause of cancer related deaths worldwide[6]
. In India, there are limited epidemiological
studies on gastric cancer which also suffers from the juvenile state of cancer registries and
under-reporting of cases. However, similar to global trend, Indian registries have also
observed statistically significant reducing trend in stomach cancer cases in last 20-years
with approximately 35675 estimated case in 2001; about 3.91% of global incidence[7, 8]
. A
radical D2 gastrectomy and more recently radical surgery along with perioperative
chemotherapy holds the best prospect of a cure in gastric cancer[165, 201]
. However,
delayed presentation and thus diagnosis owing to the non-specific symptoms often
preclude the possibility of a curative surgical resection making palliative chemotherapy
and other measures as the treatment mainstay in these patients. The development of
chemoresistance[202]
is also an increasingly appreciated phenomenon contributing to the
poor outcomes in the disease. Therefore, an improved understanding of GC molecular
biology to ascertain new potential tumor biomarkers would be useful to guide patient
management and develop new therapeutic options is essential.
β-actin is a housekeeping gene and an obligatory part of the cell cytoskeleton. It
expresses in almost all eukaryotic cells and is involved in controlling basic housekeeping
functions such as development and maintenance of cell shape, cell migration, cell

Chapter 6: β -actin expression in GC
108
division, growth and signaling. It also plays a critical role in transcriptional regulation,
mRNA transport, mRNA processing and chromatin remodeling[203-205]
. Further, β-actin is
also one of the most commonly used endogenous reference loading controls in laboratory
techniques to normalize gene and protein expressions as it is believed to have constant
expression levels in different cellular, experimental and physiological conditions.
However, growing evidences have demonstrated its differential expression in certain
situations like growth, ageing, differentiation, developmental stages and diseases like
asthma, Alzheimer's disease, congenital heart disease and cancer[205]
.
In comparison to normal, an overall differential expression of β-actin is reported
in multiple cancers[206-212]
. The methodologies used in earlier tissue based studies make it
difficult to answers, which specific cell type out of the heterogeneous population of cells
in a tissue, is responsible for altered expression of β-actin in cancer. To date, no
histological studies have been conducted to provide informations about the pattern of β-
actin expression and distribution in different cell types of the normal and tumor tissues.
Such information of β-actin expression in a tissue will provide a better understanding of
its role in carcinogenesis, its correlation with clinicopathological parameters and its
potential to be used as a tumor biomarker or therapeutic target. β-actin polymerization or
remodeling plays a crucial role in a cell’s physiology and drugs altering the dynamics of
β-actin have been studied as potential chemotherapeutic agent, however, clinical
implications of these drugs are yet to be established[213-215]
.
The present study aimed to provide histological evidence of β-actin expression
and distribution in specific cell types of gastric adenocarcinoma and its correlation with
clinicopathological parameters.

Chapter 6: β -actin expression in GC
109
6.2 Results
6.2.1 Overexpression of β-actin in tumor compared to normal gastric tissue
To detect an overall relative mRNA and protein expression of β-actin between gastric
normal and tumor tissues, RT-PCR and western blot were performed on curatively
resected fresh tissues from 5 randomly selected gastric cancer patients. Relative β-actin
mRNA and protein levels were expressed after normalizing their intensities with the
intensity of 18S rRNA and total protein respectively. Intensities were calculated by using
ImageJ software[216]
. Compared to normal, RT-PCR and western blot analysis showed a
significant higher expression of β-actin level in tumor tissues both at mRNA (1.47 ± 0.13
vs 2.36 ± 0.16; P < 0.001) and protein level (1.92 ± 0.26 vs 2.88 ± 0.32; P < 0.01) as
confirmed by paired t-test (Figure 6.1A and B).
Figure 6.1: Comparison of β-actin level in gastric normal and tumor tissue (n = 5). A: RT-PCR
analysis of β-actin and 18S rRNA was used as an internal loading control (upper panel). Band
intensities of β-actin mRNA were normalized with 18S rRNA band intensity of respective lanes
and obtained values were plotted (lower panel); B: Western blot analysis of β-actin (upper
panel). Band intensity of blot was normalized with the total protein lysate intensity of respective
lanes and obtained values were plotted (lower panel). Statistical significance was tested using
“paired t-test”. N: Normal; T: Tumor.
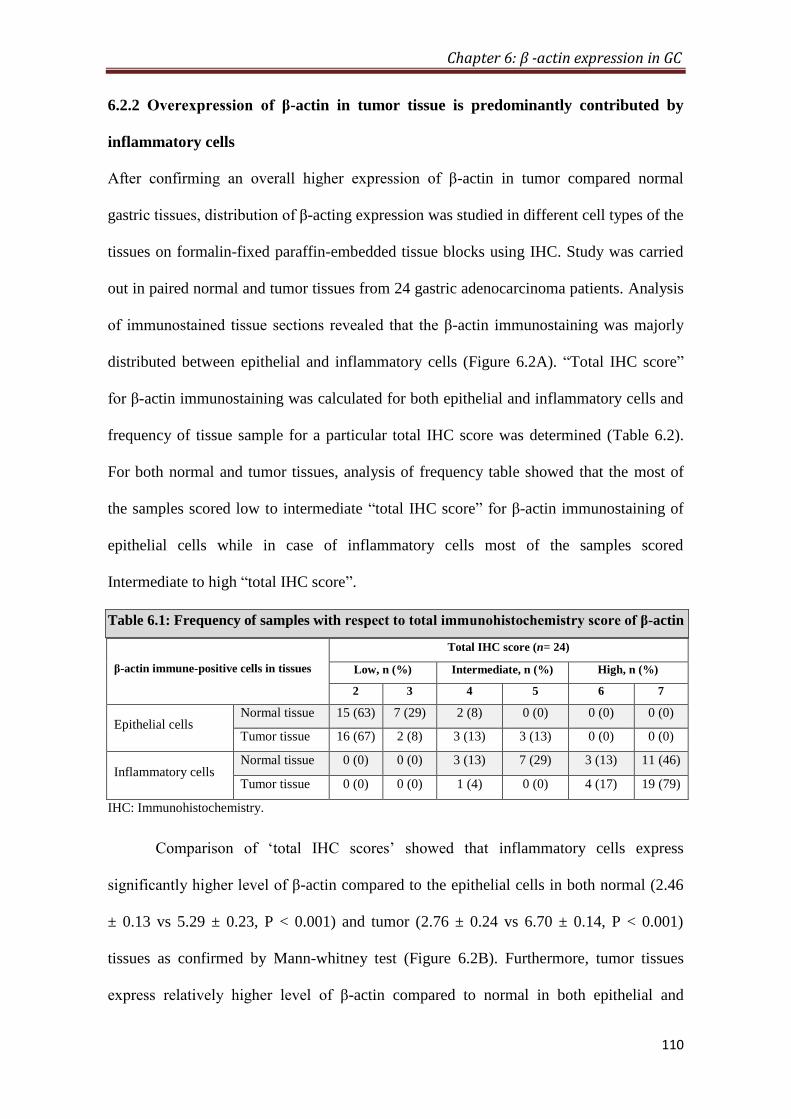
Chapter 6: β -actin expression in GC
110
6.2.2 Overexpression of β-actin in tumor tissue is predominantly contributed by
inflammatory cells
After confirming an overall higher expression of β-actin in tumor compared normal
gastric tissues, distribution of β-acting expression was studied in different cell types of the
tissues on formalin-fixed paraffin-embedded tissue blocks using IHC. Study was carried
out in paired normal and tumor tissues from 24 gastric adenocarcinoma patients. Analysis
of immunostained tissue sections revealed that the β-actin immunostaining was majorly
distributed between epithelial and inflammatory cells (Figure 6.2A). “Total IHC score”
for β-actin immunostaining was calculated for both epithelial and inflammatory cells and
frequency of tissue sample for a particular total IHC score was determined (Table 6.2).
For both normal and tumor tissues, analysis of frequency table showed that the most of
the samples scored low to intermediate “total IHC score” for β-actin immunostaining of
epithelial cells while in case of inflammatory cells most of the samples scored
Intermediate to high “total IHC score”.
Table 6.1: Frequency of samples with respect to total immunohistochemistry score of β-actin
β-actin immune-positive cells in tissues
Total IHC score (n= 24)
Low, n (%) Intermediate, n (%) High, n (%)
2 3 4 5 6 7
Epithelial cells Normal tissue 15 (63) 7 (29) 2 (8) 0 (0) 0 (0) 0 (0)
Tumor tissue 16 (67) 2 (8) 3 (13) 3 (13) 0 (0) 0 (0)
Inflammatory cells Normal tissue 0 (0) 0 (0) 3 (13) 7 (29) 3 (13) 11 (46)
Tumor tissue 0 (0) 0 (0) 1 (4) 0 (0) 4 (17) 19 (79)
IHC: Immunohistochemistry.
Comparison of ‘total IHC scores’ showed that inflammatory cells express
significantly higher level of β-actin compared to the epithelial cells in both normal (2.46
± 0.13 vs 5.29 ± 0.23, P < 0.001) and tumor (2.76 ± 0.24 vs 6.70 ± 0.14, P < 0.001)
tissues as confirmed by Mann-whitney test (Figure 6.2B). Furthermore, tumor tissues
express relatively higher level of β-actin compared to normal in both epithelial and
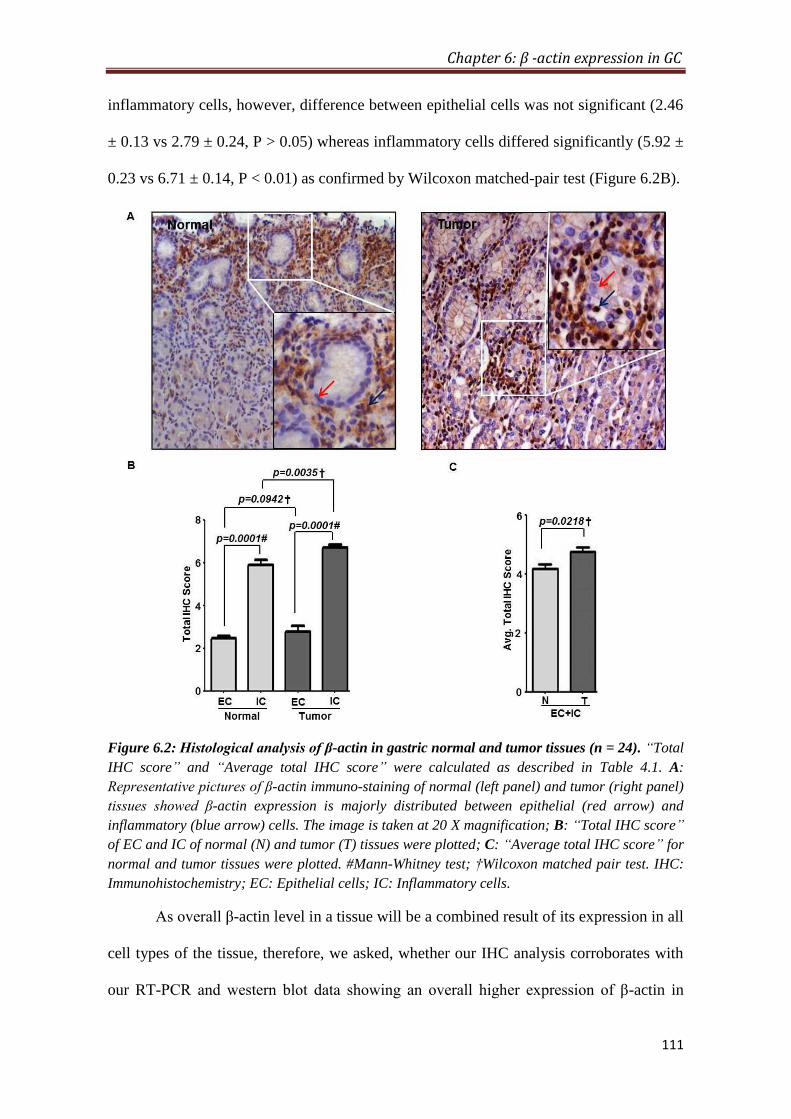
Chapter 6: β -actin expression in GC
111
inflammatory cells, however, difference between epithelial cells was not significant (2.46
± 0.13 vs 2.79 ± 0.24, P > 0.05) whereas inflammatory cells differed significantly (5.92 ±
0.23 vs 6.71 ± 0.14, P < 0.01) as confirmed by Wilcoxon matched-pair test (Figure 6.2B).
Figure 6.2: Histological analysis of β-actin in gastric normal and tumor tissues (n = 24). “Total
IHC score” and “Average total IHC score” were calculated as described in Table 4.1. A:
Representative pictures of β-actin immuno-staining of normal (left panel) and tumor (right panel)
tissues showed β-actin expression is majorly distributed between epithelial (red arrow) and
inflammatory (blue arrow) cells. The image is taken at 20 X magnification; B: “Total IHC score”
of EC and IC of normal (N) and tumor (T) tissues were plotted; C: “Average total IHC score” for
normal and tumor tissues were plotted. #Mann-Whitney test; †Wilcoxon matched pair test. IHC:
Immunohistochemistry; EC: Epithelial cells; IC: Inflammatory cells.
As overall β-actin level in a tissue will be a combined result of its expression in all
cell types of the tissue, therefore, we asked, whether our IHC analysis corroborates with
our RT-PCR and western blot data showing an overall higher expression of β-actin in

Chapter 6: β -actin expression in GC
112
tumor tissues? To answer this, we compared “average total IHC score” (average of “total
IHC scores” of epithelial and inflammatory cells) of normal and tumor tissue. IHC
analysis supports the results of RT-PCR and western blotting and also showed a
significant increase of β-actin expression in tumor tissues (4.19 ± 0.15 vs 4.75 ± 0.14, P <
0.05) compared to normal (Figure 6.2C).
6.2.3 Correlation of β-actin expression with clinicopathological parameters
A total 26 non-metastatic gastric adenocarcinoma cases were examined and analyzed.
Although, only inflammatory cells showed significant increase in β-actin level of tumor
tissues; for correlational studies, epithelial cells were also considered because they have
also shown an increase in tumor compared to normal tissues (Figure 6.2B). Univariate
analysis was performed to correlate “total IHC score” and “average total IHC score” of
epithelial and inflammatory cells for β-actin immunostaining with clinicopathological
parameters like age, sex, tumor grade, depth of invasion, lymph node status and mode of
treatment. The associations between β-actin expression and clinicopathological
parameters are shown in Table 6.2. Epithelial and overall level of β-actin did not show
any significant correlation with any of the clinicopathological parameters while β-actin
level of inflammatory cells showed significant correlation with tumor grade or WHO
classification (P < 0.05). Further, identification of pattern and statistical significance of β-
actin level in inflammatory cells of tumor tissues of different tumor grades: moderately
differentiated (MD), poorly differentiated (PD) and signet ring cell carcinoma (SRC) was
carried out. The results showed a positive correlation of β-actin level with tumor grade
(Figure 6.3A) with significantly higher level in PD (6.25 ± 0.22 vs 6.79 ± 0.21, P < 0.05)
and SRC (6.25 ± 0.22 vs 6.88 ± 0.14, P < 0.05) compared to MD; however, PD to SRC
difference was not significant (6.79 ± 0.21 vs 6.88 ± 0.14, P > 0.05).

Chapter 6: β -actin expression in GC
113
Table 6.2: Univariate analysis of β-actin immunostaining with
clinicopathological parameters n (%)
Clinicopathological
parameters Groups N (%)
Epithelial
Cells
(total IHC score)
Inflammatory
cells
(total IHC score)
Epithelial +
Inflammatory cells
(avg. total IHC
score)
P value P value P value
Age (yr)
≤ 50 11 (42) 0.49331 0.27241 0.29411
> 50 15 (58)
Sex
Male 20 (77) 0.97211 0.27241 0.52751
Female 6 (23)
Tumor grade
WD 0 (0)
0.60892 0.01682 0.83932
MD 4 (15)
PD 14 (54)
Mucinous 0 (0)
SRC 8 (31)
Depth of invasion3
T1 2 (8)
0.54462 0.66182 0.88042 T2 2 (8)
T3 13 (52)
T4 8 (32)
Lymph Node status3
N0 6 (24)
0.7512 0.62932 0.54262 N1 8 (32)
N2 8 (32)
N3 3 (12)
Treatment Modality3
Surgery 14 (56)
0.35421 0.81351 0.2911 NACT+
Surgery 11 (44)
1Mann Whitney Test; 2Kruskal Wallis Test; 3TNM staging and Treatment modality information was available for only 25 (out of 26)
patients. P < 0.05 indicates statistically significant difference. IHC: Immunohistochemistry; MD: Moderately differentiated; PD:
Poorly differentiated; SRC: Signet ring cell carcinoma.
In addition, low level of β-actin in signet ring cell carcinoma (a type of poorly
differentiated cell) cell line KATO III compared to moderately differentiate gastric
adenocarcinoma cell line AGS (Figure 6.3B) attracted us to look for the pattern of β-actin
expression of tissue epithelial cells with tumor grade. β-actin level in tissue epithelial

Chapter 6: β -actin expression in GC
114
cells followed a similar pattern of cell lines and decreases from MD to PD and to SRC
(Figure 6.3C), a negative correlation with tumor grade, though insignificant.
Figure 6.3: Correlation of β-actin expression with tumor grade. A: “Total IHC scores” of β-
actin immunostaining in inflammatory cells were correlated with tumor grade; B: β-actin
expression between gastric cancer cell lines AGS and KATO III was analyzed using western
blotting (right panel). Blot intensities were normalized with the intensity of total protein lysate of
respective lanes and obtained values from three independent experiments were plotted (right
panel); C: “Total IHC scores” of β-actin immunostaining in epithelial cells were correlated with
tumor grade. #Mann-Whitney test; *Kruskal-Wallis test.
The SRC is a type of poorly differentiated adenocarcinoma, therefore, SRC and
PD was combined together and analyzed for their β-actin expression in epithelial and
inflammatory cells compared to MD (Figure 6.3A and 6.3C). The significance of
differential expression of β-actin was increased both in case of inflammatory cells (P =
0.0168 to P = 0.0051) and epithelial cells (P = 0.6089 to P = 0.3922), further confirming
the association of β-actin expression with tumor grade in gastric adenocarcinoma.

Chapter 6: β -actin expression in GC
115
6.3 Discussion
β-actin has been reported to be differentially expressed in multiple cancers[206-211]
and
suggested as a possible target for chemotherapy[213-215]
. These studies signify the potential
of β-actin to be considered as a tumor biomarker. Till date, only overall level of varying
expression of β-actin in cancer has been reported at the mRNA and protein level by
“tissue disruptive techniques”, where whole tissue with heterogeneous population of cells
crushed and lysed, therefore, observed differential level of β-actin can’t be attributed to a
specific cell type. The present study, along with tissue disruptive techniques (RT-PCR
and western blotting) provides histological evidences (IHC) of differential expression and
distribution of β-actin in different cell types of gastric adenocarcinoma.
β-actin overexpression in tumor compared to normal tissues at mRNA level was
most consistent and significant as evident by comparing P-values of RT-PCR (1.47 ±
0.13 vs 2.36 ± 0.16; P < 0.001) and western blot (1.92 ± 0.26 vs 2.88 ± 0.32; P < 0.01)
analysis (Figure 6.1A and B). Therefore, the significant overexpression of β-actin at
mRNA level in gastric cancer suggests its deregulation at the level of transcription or
mRNA turnover. Earlier reports have also shown β-actin overexpression in colorectal,
pancreatic, esophageal, hepatic and gastric cancers patients using tissue disruptive
techniques. Molecular mechanism of β-actin transcription control is still unclear,
however, CpG island hypermethylation of β-actin promoter has been found to be a
negative regulator of expression[217]
. Further, rapid upregulation in β-actin transcription in
response to mitogenic stimuli including epidermal growth factor (EGF), transforming
growth factor-β (TGF-β), and platelet derived growth factor[218-220]
have also been
reported. In addition, miR-145, miR-206 and miR-466a are known to target and degrade
β-actin mRNA, therefore, playing a critical role in altering its mRNA turn over[221-224]
.
Functionally, β-actin plays a predominant role in cell migration as its overexpression is
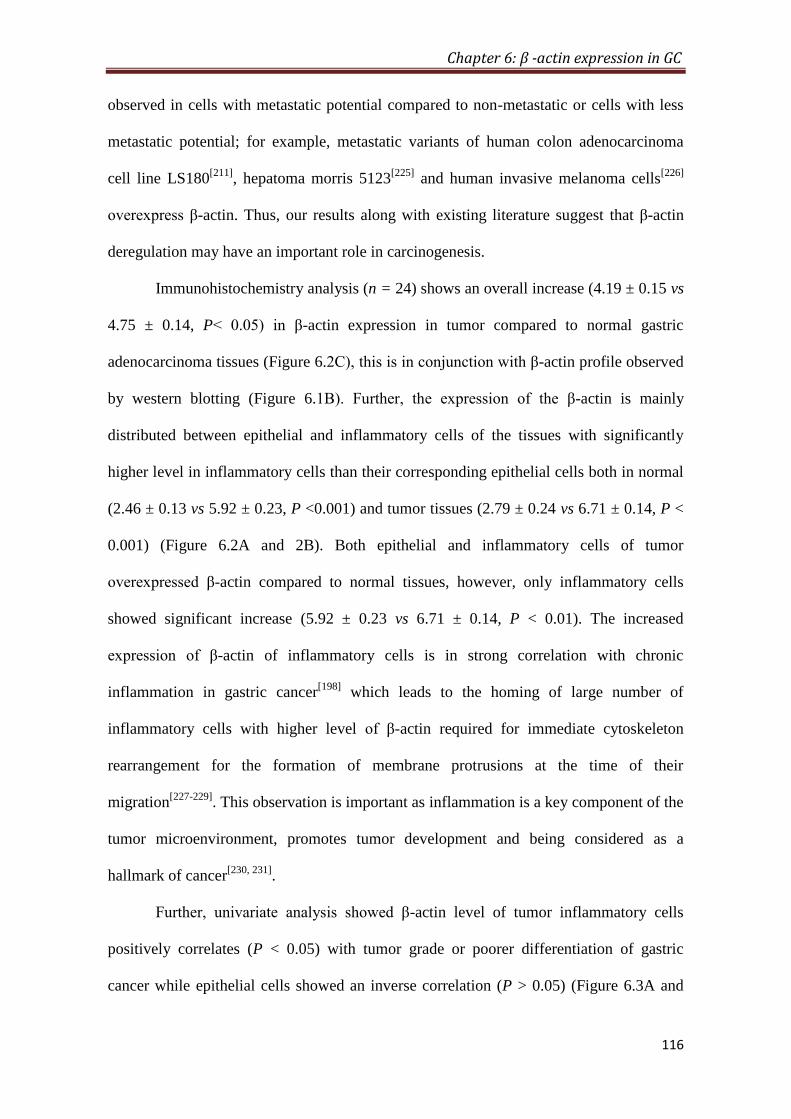
Chapter 6: β -actin expression in GC
116
observed in cells with metastatic potential compared to non-metastatic or cells with less
metastatic potential; for example, metastatic variants of human colon adenocarcinoma
cell line LS180[211]
, hepatoma morris 5123[225]
and human invasive melanoma cells[226]
overexpress β-actin. Thus, our results along with existing literature suggest that β-actin
deregulation may have an important role in carcinogenesis.
Immunohistochemistry analysis (n = 24) shows an overall increase (4.19 ± 0.15 vs
4.75 ± 0.14, P< 0.05) in β-actin expression in tumor compared to normal gastric
adenocarcinoma tissues (Figure 6.2C), this is in conjunction with β-actin profile observed
by western blotting (Figure 6.1B). Further, the expression of the β-actin is mainly
distributed between epithelial and inflammatory cells of the tissues with significantly
higher level in inflammatory cells than their corresponding epithelial cells both in normal
(2.46 ± 0.13 vs 5.92 ± 0.23, P <0.001) and tumor tissues (2.79 ± 0.24 vs 6.71 ± 0.14, P <
0.001) (Figure 6.2A and 2B). Both epithelial and inflammatory cells of tumor
overexpressed β-actin compared to normal tissues, however, only inflammatory cells
showed significant increase (5.92 ± 0.23 vs 6.71 ± 0.14, P < 0.01). The increased
expression of β-actin of inflammatory cells is in strong correlation with chronic
inflammation in gastric cancer[198]
which leads to the homing of large number of
inflammatory cells with higher level of β-actin required for immediate cytoskeleton
rearrangement for the formation of membrane protrusions at the time of their
migration[227-229]
. This observation is important as inflammation is a key component of the
tumor microenvironment, promotes tumor development and being considered as a
hallmark of cancer[230, 231]
.
Further, univariate analysis showed β-actin level of tumor inflammatory cells
positively correlates (P < 0.05) with tumor grade or poorer differentiation of gastric
cancer while epithelial cells showed an inverse correlation (P > 0.05) (Figure 6.3A and

Chapter 6: β -actin expression in GC
117
C). The insignificant correlation of epithelial cells can be attributed to low number of
moderately differentiated gastric adenocarcinoma tissue samples (n = 4) with high range
of “total IHC score” (3.5 ± 1.5). This correlation indicates toward an important role of β-
actin in tumor dedifferentiation. The chronic inflammation in gastric cancer,
predominantly caused by Helicobacter pylori infection, is known to promote poorer
tumor differentiation and CpG-island hypermethylation[198, 232, 233]
and β-actin promoter
hypermethylation downregulates the gene expression[217]
. Therefore, the positive
correlation of β-actin level of tumor inflammatory cells with tumor grade may be due to
the persistent inflammation in tumor micro-environment. On the other hand,
hypermethylation of β-actin promoter may be a cause of negative correlation of β-actin
level of tumor epithelial with tumor grade. Low level of β-actin in gastric
adenocarcinoma cell line KATO III (signet ring cell carcinoma, a type of poorly
differentiated cell) compared to AGS (moderately differentiated) (Figure 6.3B), further
strengthens the observation that β-actin level of tumor epithelial cells negatively
correlates with poorer tumor differentiation.
In summary, to the best of our knowledge, present study provides first histological
evidence of cell type specific distribution of β-actin in normal and tumor gastric tissues.
The significant increase in β-actin expression in tumor tissues is due to inflammation, an
initial characteristic in the stage of gastric cancer progression and positively correlates
with tumor grade. Therefore, β-actin may represent a promising biomarker in early
diagnosis and prognosis of gastric cancer. However, further studies are needed to explore
the relationship of cell type specific differential expression of β-actin with its functional
implications in carcinogenesis and to be used as a chemotherapeutic target.

Chapter 7
Global hypo-acetylation of histones: Combinatorial effect of HDAC inhibitors with DNA-targeted
chemotherapeutic drugs on gastric cancer cell lines

Chapter 7: Global hypo-acetylation of histones in GC
118
7.1 Introduction
Gastric cancer (GC) is the second leading cause of cancer related deaths in the world and
the one of the top lethal cancer in Asia[164]
. In India, it is one of the most aggressive
cancers ranking third and second in terms of incidence and mortality respectively[7]
. The
management of gastric cancer is usually a multi-approach involving surgery,
chemotherapy and radiotherapy. For operable GC, surgery along with neoadjuvant and
adjuvant chemotherapy (NACT and ACT) holds the best prospects of cure[165]
. The
NACT facilitates histological tumor regression and thereby increases the rate of curative
or R0 resection where no residual disease is left behind, whereas, ACT is given to kill the
cancer cells if left behind after surgical resection[166]
. In case of inoperable GC, chemo
and radiotherapy based palliative care is the only treatment. Therefore, in both the cases
chemotherapy is a major aspect of GC treatment, mostly given in combination with
different drugs. Some of the most commonly used drug combinations are- ECF
(epirubicin, cisplatin and fluorouracil), EOF (epirubicin, oxaliplatin and fluorouracil),
ECX (epirubicin, cisplatin and capecitabine) and EOX (epirubicin, oxaliplatin, and
capecitabine)[202]
. In all these combinations, drugs such as cisplatin, oxaliplatin and
epirubicin are important part, which exert their cytotoxic effect by DNA intercalation/
binding and thereby causing DNA damage and inhibition of DNA related processes[234,
235]. Based on some of the reports where inhibitors of chromatin remodelers such as
Valproic acid and Butyric acid have increased the efficacy of chemotherapy drugs[236-238]
,
it has now been hypothesized that chromatin confirmation affects the amount of DNA
bound chemotherapy drugs. Therefore, chemical compounds which can interfere with the
activity of chromatin modifiers and alter the dynamics of chromatin confirmation could
be of immense potential if combined with conventional DNA binding chemotherapy
drugs[239]
.
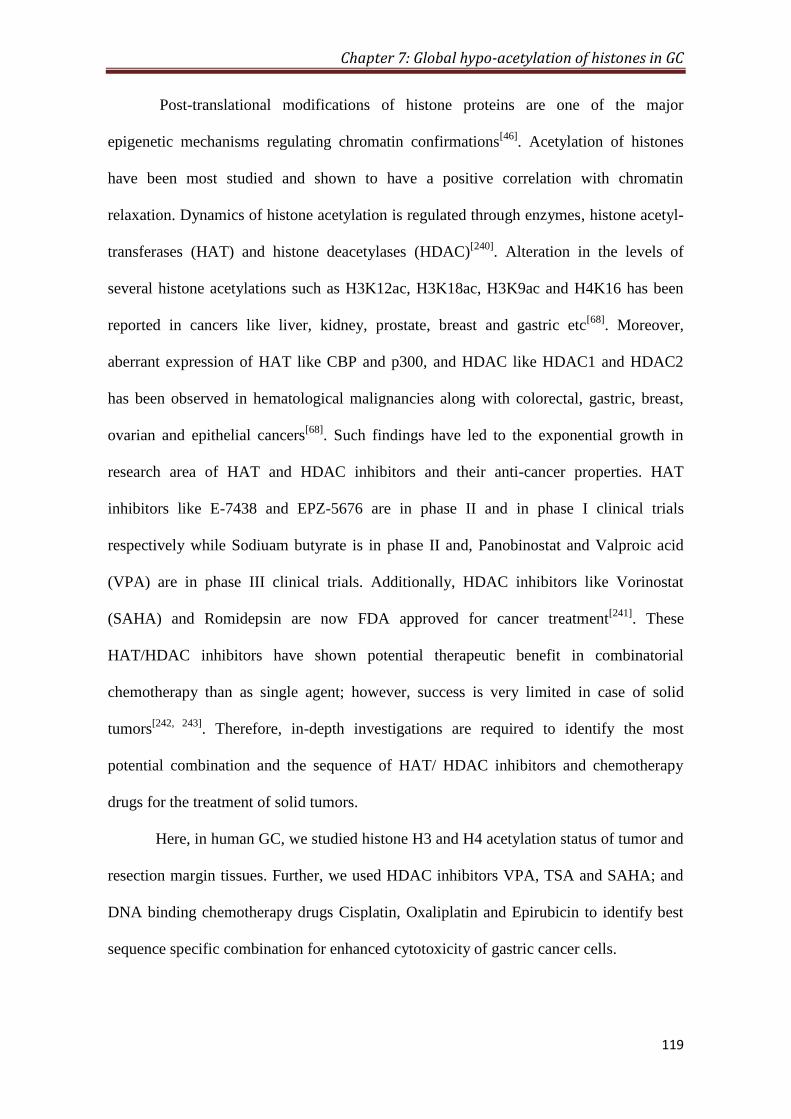
Chapter 7: Global hypo-acetylation of histones in GC
119
Post-translational modifications of histone proteins are one of the major
epigenetic mechanisms regulating chromatin confirmations[46]
. Acetylation of histones
have been most studied and shown to have a positive correlation with chromatin
relaxation. Dynamics of histone acetylation is regulated through enzymes, histone acetyl-
transferases (HAT) and histone deacetylases (HDAC)[240]
. Alteration in the levels of
several histone acetylations such as H3K12ac, H3K18ac, H3K9ac and H4K16 has been
reported in cancers like liver, kidney, prostate, breast and gastric etc[68]
. Moreover,
aberrant expression of HAT like CBP and p300, and HDAC like HDAC1 and HDAC2
has been observed in hematological malignancies along with colorectal, gastric, breast,
ovarian and epithelial cancers[68]
. Such findings have led to the exponential growth in
research area of HAT and HDAC inhibitors and their anti-cancer properties. HAT
inhibitors like E-7438 and EPZ-5676 are in phase II and in phase I clinical trials
respectively while Sodiuam butyrate is in phase II and, Panobinostat and Valproic acid
(VPA) are in phase III clinical trials. Additionally, HDAC inhibitors like Vorinostat
(SAHA) and Romidepsin are now FDA approved for cancer treatment[241]
. These
HAT/HDAC inhibitors have shown potential therapeutic benefit in combinatorial
chemotherapy than as single agent; however, success is very limited in case of solid
tumors[242, 243]
. Therefore, in-depth investigations are required to identify the most
potential combination and the sequence of HAT/ HDAC inhibitors and chemotherapy
drugs for the treatment of solid tumors.
Here, in human GC, we studied histone H3 and H4 acetylation status of tumor and
resection margin tissues. Further, we used HDAC inhibitors VPA, TSA and SAHA; and
DNA binding chemotherapy drugs Cisplatin, Oxaliplatin and Epirubicin to identify best
sequence specific combination for enhanced cytotoxicity of gastric cancer cells.
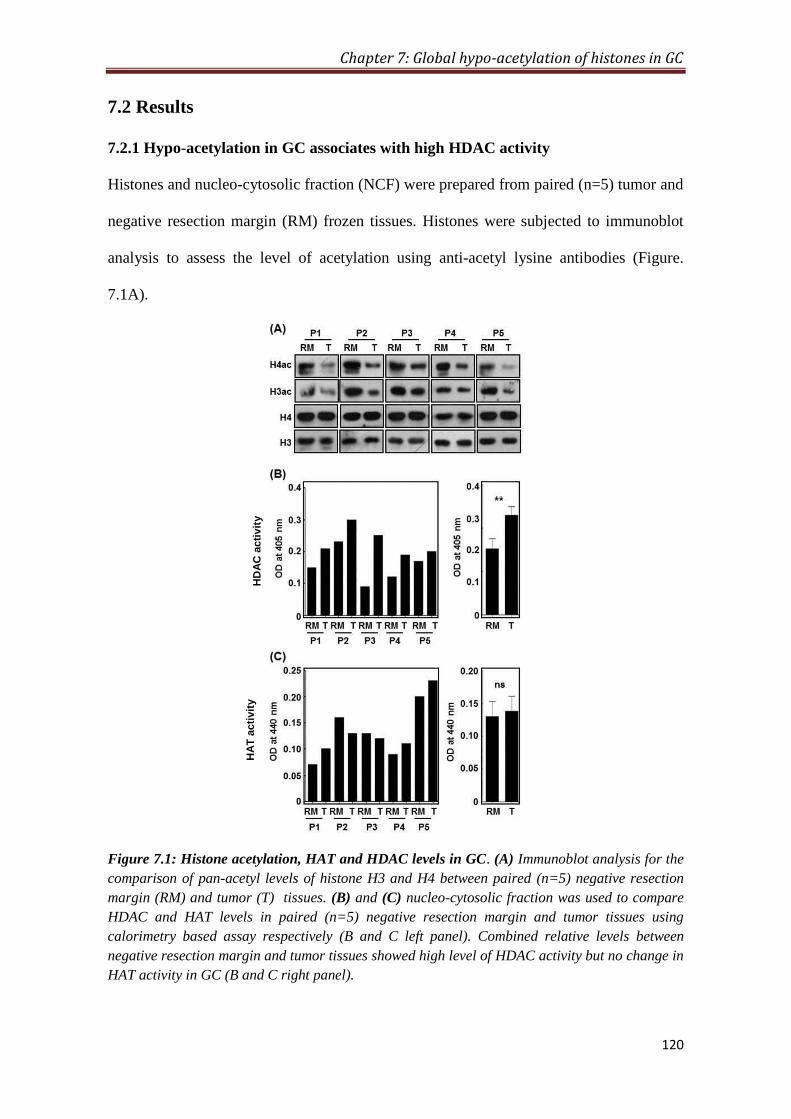
Chapter 7: Global hypo-acetylation of histones in GC
120
7.2 Results
7.2.1 Hypo-acetylation in GC associates with high HDAC activity
Histones and nucleo-cytosolic fraction (NCF) were prepared from paired (n=5) tumor and
negative resection margin (RM) frozen tissues. Histones were subjected to immunoblot
analysis to assess the level of acetylation using anti-acetyl lysine antibodies (Figure.
7.1A).
Figure 7.1: Histone acetylation, HAT and HDAC levels in GC. (A) Immunoblot analysis for the
comparison of pan-acetyl levels of histone H3 and H4 between paired (n=5) negative resection
margin (RM) and tumor (T) tissues. (B) and (C) nucleo-cytosolic fraction was used to compare
HDAC and HAT levels in paired (n=5) negative resection margin and tumor tissues using
calorimetry based assay respectively (B and C left panel). Combined relative levels between
negative resection margin and tumor tissues showed high level of HDAC activity but no change in
HAT activity in GC (B and C right panel).
HD
AC
acti
vit
y
HA
T a
cti
vit
y

Chapter 7: Global hypo-acetylation of histones in GC
121
Immunoblot analysis showed low level of histone H3 and H4 acetylation in all the
tumor tissues compared negative RM tissues. This observed loss in acetylation level of
histone H3 and H4 could be result of low or high level of HAT (histone acetyl
transferase) or HDAC (histone deacetylase) activity respectively. Therefore, NCF was
used to assess HAT and HDAC activity using calorimetric assay (Figure. 7.1B and C).
Tumor and RM tissues showed differential level of HAT and HDAC activity; however,
all the tumor tissues showed high HDAC activity (Figure. 7.1B, left panel) compared to
their paired RM tissues, but HAT activity (Figure. 7.1C, left panel) did not show any
consistent pattern. Further, on statistical analysis showed a significant (p< 0.001) high
level of HDAC activity in tumor compared negative RM (Figure.7.1B, right panel).
However, no significant difference was found in HAT activity (Figure. 7.1C, right panel).
Taken together, our data indicates a positive association between hypo-acetylation and
HDAC activity in GC.
7.2.2 Dose response of chemotherapy drugs and HDAC inhibitors on GC cells
Dose response curve for chemotherapy drugs (Cisplatin, Oxaliplatin and Epirubicin) and
HDAC inhibitors (VPA, TSA and SAHA) was generated using MTT assay (Figure 7.2A).
All the experiments were done in duplicate and average values were plotted. Analysis of
dose response curve for Cisplatin, Oxaliplatin and Epirubicin showed differential
behavior or AGS (well differentiated) and KATOIII (poorly differentiated) gastric
adenocarcinoma cells (Fig. 7.2A). AGS showed resistance behavior towards cisplatin,
oxaliplatin and epirubicin than KATOIII with less percentage of cell death at all the
doses. Moreover, in case of AGS cells, IC50 of cisplatin, oxaliplatin and epirubicin was
identified as 12µM, 10µM and 0.2µM (200nM) respectively (Figure 7.2A, upper panel),
whereas for KATOIII it was 7µM, 8µM and 0.05µM (50nM) respectively (Figure 7.2A,
upper panel).
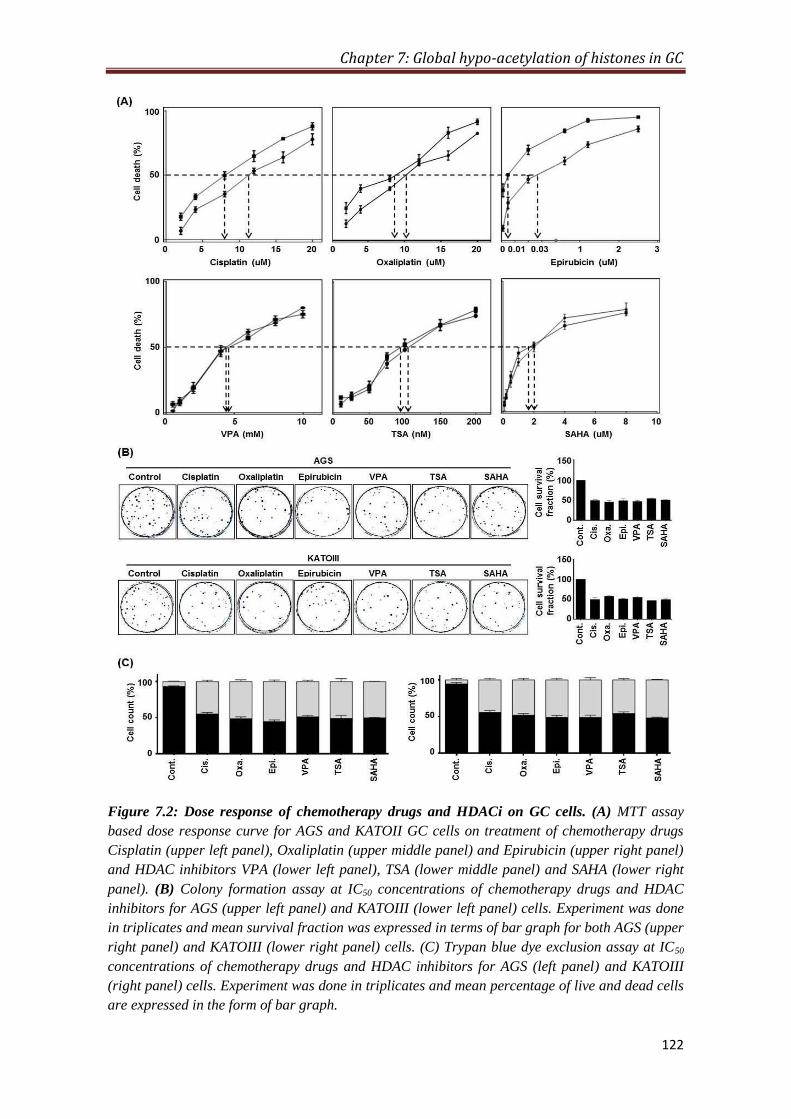
Chapter 7: Global hypo-acetylation of histones in GC
122
Figure 7.2: Dose response of chemotherapy drugs and HDACi on GC cells. (A) MTT assay
based dose response curve for AGS and KATOII GC cells on treatment of chemotherapy drugs
Cisplatin (upper left panel), Oxaliplatin (upper middle panel) and Epirubicin (upper right panel)
and HDAC inhibitors VPA (lower left panel), TSA (lower middle panel) and SAHA (lower right
panel). (B) Colony formation assay at IC50 concentrations of chemotherapy drugs and HDAC
inhibitors for AGS (upper left panel) and KATOIII (lower left panel) cells. Experiment was done
in triplicates and mean survival fraction was expressed in terms of bar graph for both AGS (upper
right panel) and KATOIII (lower right panel) cells. (C) Trypan blue dye exclusion assay at IC50
concentrations of chemotherapy drugs and HDAC inhibitors for AGS (left panel) and KATOIII
(right panel) cells. Experiment was done in triplicates and mean percentage of live and dead cells
are expressed in the form of bar graph.

Chapter 7: Global hypo-acetylation of histones in GC
123
On the other hand, both AGS and KATOIII cells showed similar dose response
curve upon treatment of VPA, TSA and SAHA with similar IC50 concentration as
4000µM (4mM), 2µM and 0.01µM (10nM) respectively (Figure 7.2A bottom panel). IC50
concentrations of chemotherapy drugs and HDAC inhibitors were further tested for their
effect on proliferation and viability of AGS and KATOIII cells using clonogenic/ colony
formation and trypan blue exclusion assay respectively (Figure. 7.2B and C). Comparison
of mean of cell survival fraction from three independent clonogenic assay experiments
showed IC50 concentration of chemotherapy drugs and HDAC inhibitors effectively
inhibits approximately 50% proliferation ability of both AGS (Figure. 7.2B, upper panel)
and KATOIII cells (Figure. 7.2B, lower panel). Further, trypan blue exclusion assay
showed approximately equal mean percentage of live and dead cells after treatment of
chemotherapy drugs. HDAC inhibitors at their respective IC50 concentrations confirms
the results of MTT assay and clonogenic assays on AGS (Figure 7.2C, left panel) and
KATOII (Figure. 7.2C, right panel) cells.
7.2.3 HDAC inhibitor mediated hyper-acetylation of histones and cell cycle of GC
cells
HDAC inhibitors induce hyper-acetylation. Histone acetylation is closely associated with
transcription activation, chromatin relaxation and phases of cell cycle. We assessed the
effect of HDAC inhibitors VPA, TSA and SAHA treatment after 24hours on HDAC
activity, histone acetylation levels, cell-cycle profile in same population of AGS cells
(Figure. 7.3). Calorimetric assay, using NCF showed marked decrease in HDAC activity
on treatment of HDAC inhibitors (Figure. 7.3A). Immunoblot data also showed hyper-
acetylation of histone H3 and H4 on treatment of HDAC inhibitors (Figure. 7.3B).
Moreover, no marked difference in the percentage of cell in G0-G1, G2-M, S phases of
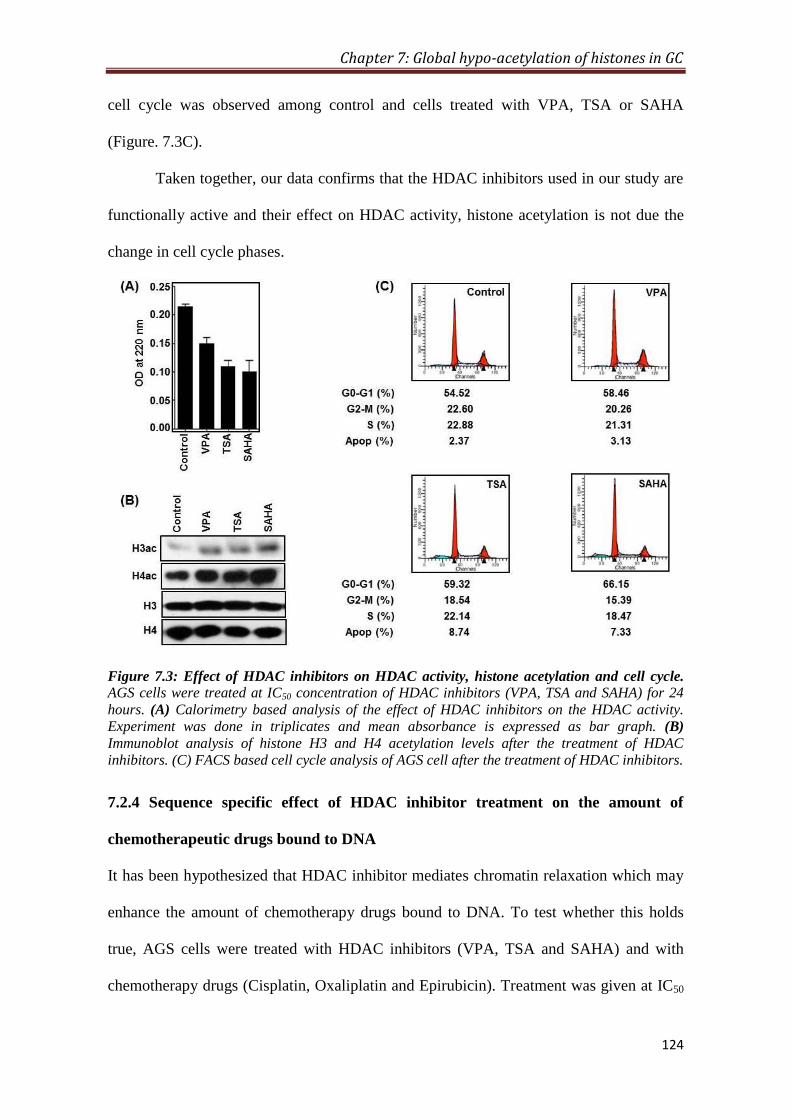
Chapter 7: Global hypo-acetylation of histones in GC
124
cell cycle was observed among control and cells treated with VPA, TSA or SAHA
(Figure. 7.3C).
Taken together, our data confirms that the HDAC inhibitors used in our study are
functionally active and their effect on HDAC activity, histone acetylation is not due the
change in cell cycle phases.
Figure 7.3: Effect of HDAC inhibitors on HDAC activity, histone acetylation and cell cycle.
AGS cells were treated at IC50 concentration of HDAC inhibitors (VPA, TSA and SAHA) for 24
hours. (A) Calorimetry based analysis of the effect of HDAC inhibitors on the HDAC activity.
Experiment was done in triplicates and mean absorbance is expressed as bar graph. (B)
Immunoblot analysis of histone H3 and H4 acetylation levels after the treatment of HDAC
inhibitors. (C) FACS based cell cycle analysis of AGS cell after the treatment of HDAC inhibitors.
7.2.4 Sequence specific effect of HDAC inhibitor treatment on the amount of
chemotherapeutic drugs bound to DNA
It has been hypothesized that HDAC inhibitor mediates chromatin relaxation which may
enhance the amount of chemotherapy drugs bound to DNA. To test whether this holds
true, AGS cells were treated with HDAC inhibitors (VPA, TSA and SAHA) and with
chemotherapy drugs (Cisplatin, Oxaliplatin and Epirubicin). Treatment was given at IC50
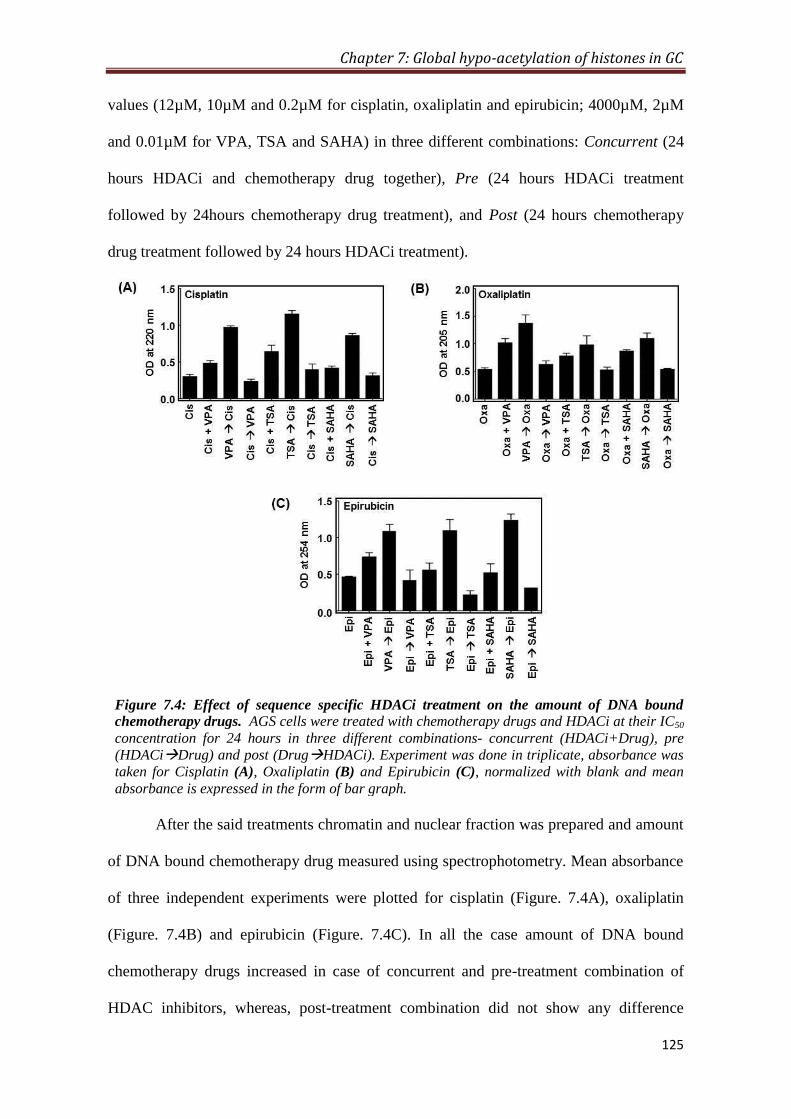
Chapter 7: Global hypo-acetylation of histones in GC
125
values (12µM, 10µM and 0.2µM for cisplatin, oxaliplatin and epirubicin; 4000µM, 2µM
and 0.01µM for VPA, TSA and SAHA) in three different combinations: Concurrent (24
hours HDACi and chemotherapy drug together), Pre (24 hours HDACi treatment
followed by 24hours chemotherapy drug treatment), and Post (24 hours chemotherapy
drug treatment followed by 24 hours HDACi treatment).
Figure 7.4: Effect of sequence specific HDACi treatment on the amount of DNA bound
chemotherapy drugs. AGS cells were treated with chemotherapy drugs and HDACi at their IC50
concentration for 24 hours in three different combinations- concurrent (HDACi+Drug), pre
(HDACiDrug) and post (DrugHDACi). Experiment was done in triplicate, absorbance was
taken for Cisplatin (A), Oxaliplatin (B) and Epirubicin (C), normalized with blank and mean
absorbance is expressed in the form of bar graph.
After the said treatments chromatin and nuclear fraction was prepared and amount
of DNA bound chemotherapy drug measured using spectrophotometry. Mean absorbance
of three independent experiments were plotted for cisplatin (Figure. 7.4A), oxaliplatin
(Figure. 7.4B) and epirubicin (Figure. 7.4C). In all the case amount of DNA bound
chemotherapy drugs increased in case of concurrent and pre-treatment combination of
HDAC inhibitors, whereas, post-treatment combination did not show any difference
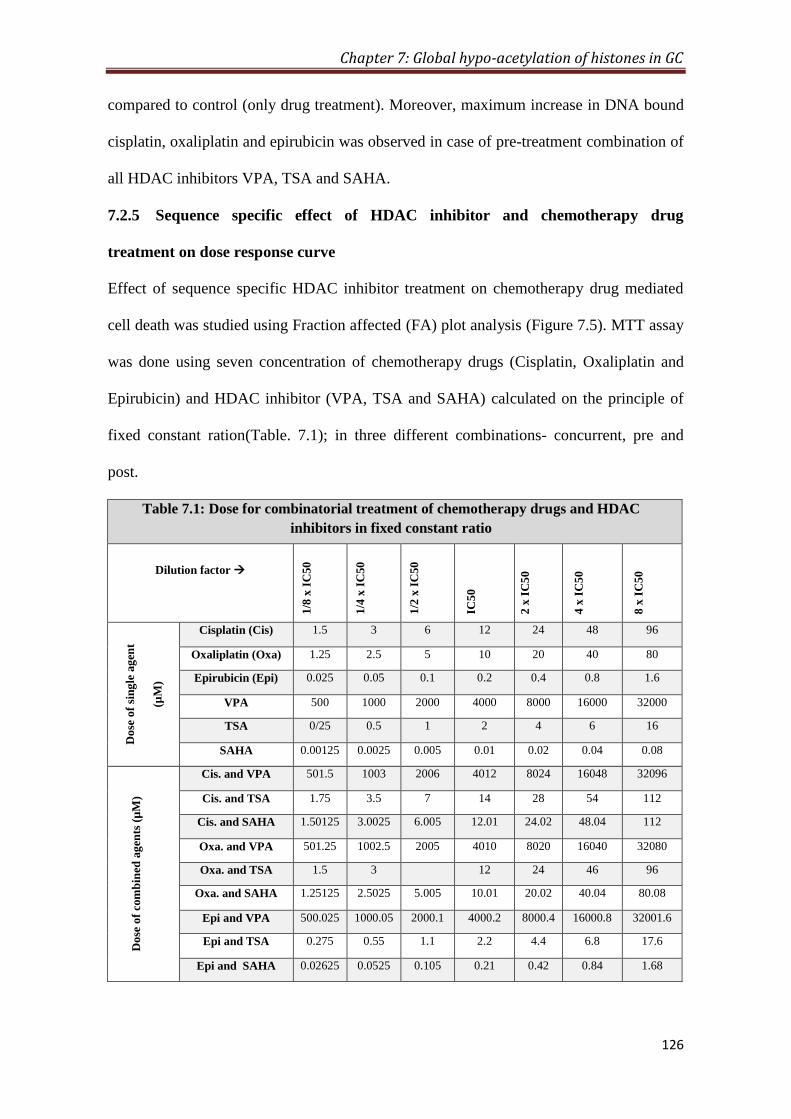
Chapter 7: Global hypo-acetylation of histones in GC
126
compared to control (only drug treatment). Moreover, maximum increase in DNA bound
cisplatin, oxaliplatin and epirubicin was observed in case of pre-treatment combination of
all HDAC inhibitors VPA, TSA and SAHA.
7.2.5 Sequence specific effect of HDAC inhibitor and chemotherapy drug
treatment on dose response curve
Effect of sequence specific HDAC inhibitor treatment on chemotherapy drug mediated
cell death was studied using Fraction affected (FA) plot analysis (Figure 7.5). MTT assay
was done using seven concentration of chemotherapy drugs (Cisplatin, Oxaliplatin and
Epirubicin) and HDAC inhibitor (VPA, TSA and SAHA) calculated on the principle of
fixed constant ration(Table. 7.1); in three different combinations- concurrent, pre and
post.
Table 7.1: Dose for combinatorial treatment of chemotherapy drugs and HDAC
inhibitors in fixed constant ratio
Dilution factor
1/8
x I
C50
1/4
x I
C50
1/2
x I
C50
IC5
0
2 x
IC
50
4 x
IC
50
8 x
IC
50
Do
se o
f si
ng
le a
gen
t
(µM
)
Cisplatin (Cis) 1.5 3 6 12 24 48 96
Oxaliplatin (Oxa) 1.25 2.5 5 10 20 40 80
Epirubicin (Epi) 0.025 0.05 0.1 0.2 0.4 0.8 1.6
VPA 500 1000 2000 4000 8000 16000 32000
TSA 0/25 0.5 1 2 4 6 16
SAHA 0.00125 0.0025 0.005 0.01 0.02 0.04 0.08
Do
se o
f co
mb
ined
ag
ents
(µ
M)
Cis. and VPA 501.5 1003 2006 4012 8024 16048 32096
Cis. and TSA 1.75 3.5 7 14 28 54 112
Cis. and SAHA 1.50125 3.0025 6.005 12.01 24.02 48.04 112
Oxa. and VPA 501.25 1002.5 2005 4010 8020 16040 32080
Oxa. and TSA 1.5 3 12 24 46 96
Oxa. and SAHA 1.25125 2.5025 5.005 10.01 20.02 40.04 80.08
Epi and VPA 500.025 1000.05 2000.1 4000.2 8000.4 16000.8 32001.6
Epi and TSA 0.275 0.55 1.1 2.2 4.4 6.8 17.6
Epi and SAHA 0.02625 0.0525 0.105 0.21 0.42 0.84 1.68
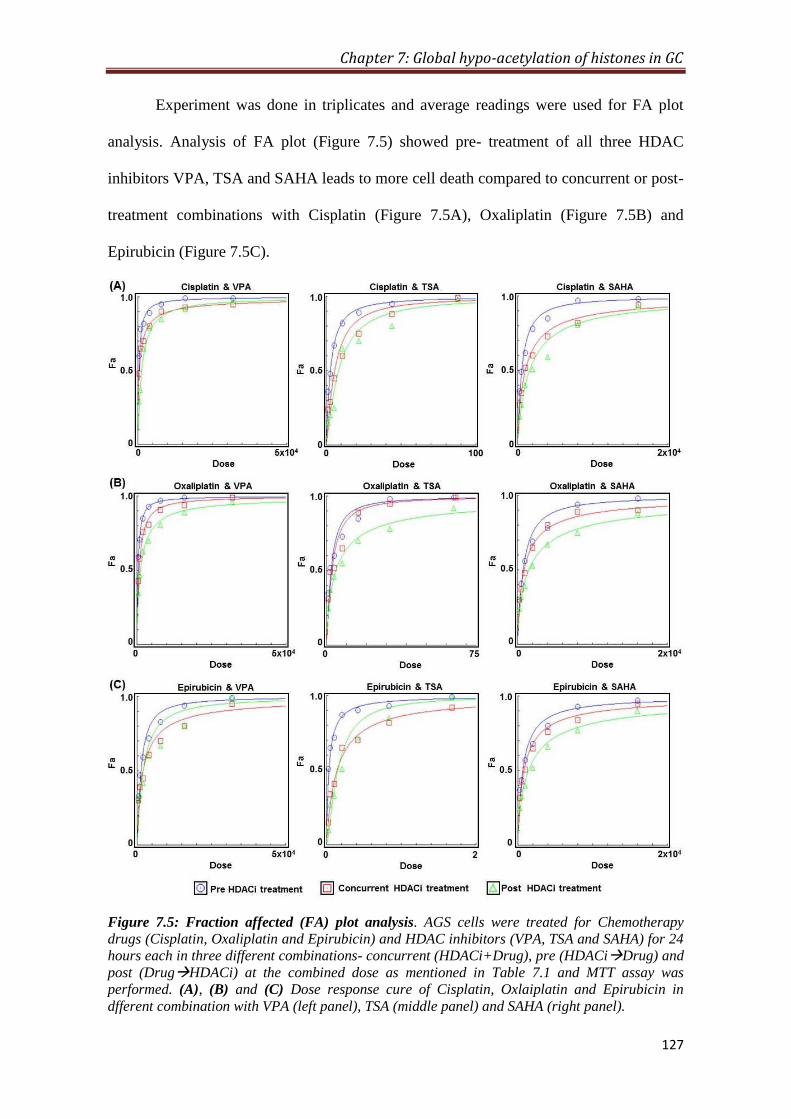
Chapter 7: Global hypo-acetylation of histones in GC
127
Experiment was done in triplicates and average readings were used for FA plot
analysis. Analysis of FA plot (Figure 7.5) showed pre- treatment of all three HDAC
inhibitors VPA, TSA and SAHA leads to more cell death compared to concurrent or post-
treatment combinations with Cisplatin (Figure 7.5A), Oxaliplatin (Figure 7.5B) and
Epirubicin (Figure 7.5C).
Figure 7.5: Fraction affected (FA) plot analysis. AGS cells were treated for Chemotherapy
drugs (Cisplatin, Oxaliplatin and Epirubicin) and HDAC inhibitors (VPA, TSA and SAHA) for 24
hours each in three different combinations- concurrent (HDACi+Drug), pre (HDACiDrug) and
post (DrugHDACi) at the combined dose as mentioned in Table 7.1 and MTT assay was
performed. (A), (B) and (C) Dose response cure of Cisplatin, Oxlaiplatin and Epirubicin in
dfferent combination with VPA (left panel), TSA (middle panel) and SAHA (right panel).

Chapter 7: Global hypo-acetylation of histones in GC
128
Further, combined doses of chemotherapy drugs and HDAC inhibitors required to
achieve FA 0.5, 0.75 and 0.95 was analyzed (Appendix, Table A2.1). Pre-treatment
combination of TSA and Cisplatin required lesser combined dose to achieve FA 0.5, 0.75
and 0.95 compared to both concurrent and post-treatment combinations (Figure 7.5A,
middle panel). However, pre-treatment combination of VPA or SAHA and Cisplatin
could achieve only FA 0.5 and 0.75 at a lower combined dose than concurrent or post-
treatment combinations (Figure 7.5A, left and right panels). In case of Oxaliplatin, pre-
treatment combination of all HDAC inhibitors VPA, TSA or SAHA achieved FA 0.5,
0.75 and 0.95 at lower combined dose than concurrent or post-treatment combinations
(Figure 7.5B, left, middle and right panel respectively). In case of Epirubicin, pre-
treatment combination of VPA, TSA or SAHA required lesser dose at FA 0.5, 0.75 and
0.95 than concurrent or post-treatment combinations (Fig. 7.5C, left, middle and right
panel). Hence, the data suggest that pre-treatment combination of HDAC inhibitors is
most effective in cell death when combined with chemotherapy drugs.
7.2.6 Sequence specific synergistic effect of HDAC inhibitors and chemotherapeutic
drug on GC cell line
In order to assess which combination (concurrent, pre or post) of chemotherapy drugs
(Cisplatin, Oxaliplatin and Epirubicin) and HDAC inhibitors (VPA, TSA and SAHA)
have a synergistic effect, combined dose of the drugs (chemotherapy drugs and HDAC
inhibitors) and FA values obtained in the experiment of previous section through MTT
assay on AGS cell were used. Median effect plot was generated and data were
quantitatively analyzed using a combination index (CI) based on the Chou-Talalay
method[163]
by the software compusyn (Figure. 7.6). Further, CI values at FA levels 0.5,
0.75 and 0.95 were analyzed (Figure 7.6 and Appendix Table. A2.1). At FA value 0.5,
concurrent and pre-treatment combination of VPA and Cisplatin or Oxaliplatin (Figure.
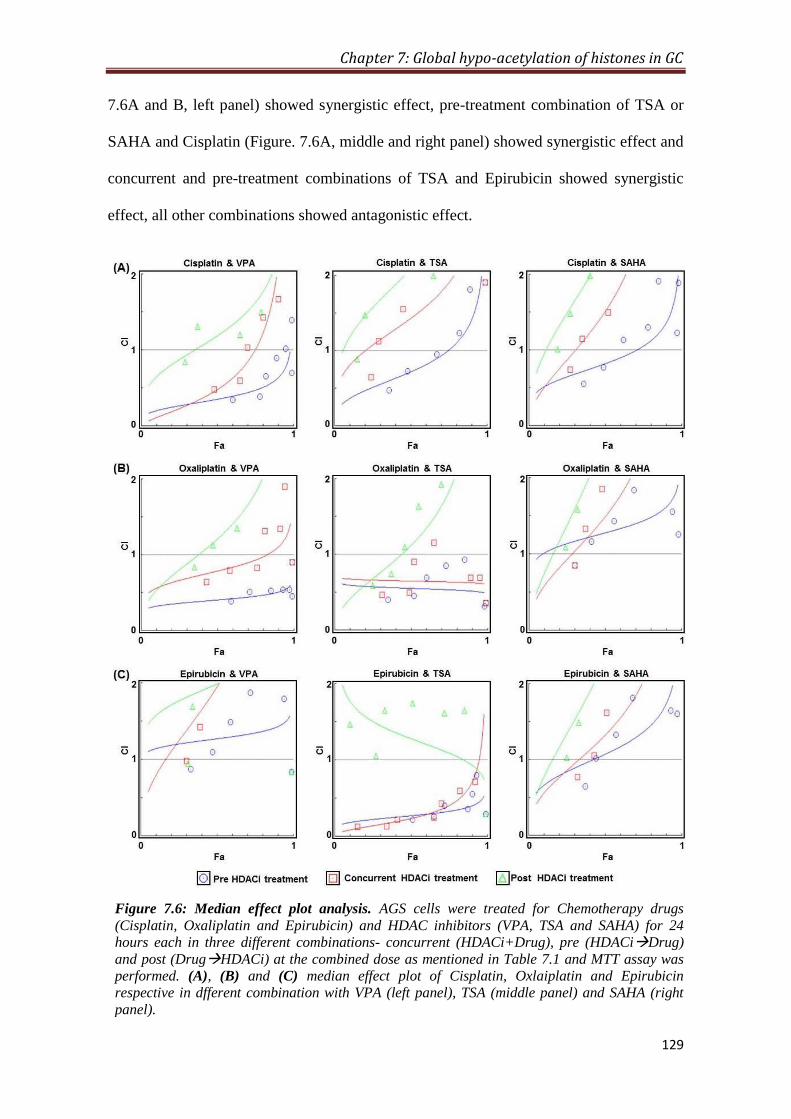
Chapter 7: Global hypo-acetylation of histones in GC
129
7.6A and B, left panel) showed synergistic effect, pre-treatment combination of TSA or
SAHA and Cisplatin (Figure. 7.6A, middle and right panel) showed synergistic effect and
concurrent and pre-treatment combinations of TSA and Epirubicin showed synergistic
effect, all other combinations showed antagonistic effect.
Figure 7.6: Median effect plot analysis. AGS cells were treated for Chemotherapy drugs
(Cisplatin, Oxaliplatin and Epirubicin) and HDAC inhibitors (VPA, TSA and SAHA) for 24
hours each in three different combinations- concurrent (HDACi+Drug), pre (HDACiDrug)
and post (DrugHDACi) at the combined dose as mentioned in Table 7.1 and MTT assay was
performed. (A), (B) and (C) median effect plot of Cisplatin, Oxlaiplatin and Epirubicin
respective in dfferent combination with VPA (left panel), TSA (middle panel) and SAHA (right
panel).
Chapter 7: Global hypo-acetylation of histones in GC
130
At FA value 0.75, pre-treatment combination of VPA and Cisplatin or Oxaliplatin
(Figure. 7.6A and B, left panel), concurrent and pre-combination of TSA and Oxaliplatin
or Epirubicin (Figure. 7.6B and C, middle panel) showed synergistic effect; all other
combinations showed additive or antagonistic effect. At FA level 0.95, pre-treatment
combination of VPA and Oxaliplatin (Fig. 7.6B, left panel), concurrent and pre-tretment
combinations of TSA and Oxaliplatin (Figure. 7.6B, middle panel) and pre-treatment
combination of TSA and Epirubicin (Figure. 7.5C, middle panel) showed synergistic
effect; all other combinations showed antagonistic effect.
Taken together, the data shows that post-treatment combination of VAP, TSA or
SAHA did not have any synergistic effect when combined with Cisplatin, Oxaliplatin or
Epirubicin. VPA was found to have more synergistic effect in combination with Cisplatin
and Oxaliplatin; however, TSA showed more synergistic active in combination with
Oxaliplatin and Epirubicin.

Chapter 7: Global hypo-acetylation of histones in GC
131
7.3 Discussion
In last decade, the discovery of several histone post-translational modifications (PTMs)
and histone modifying enzymes has undoubtedly added to our understanding of
epigenetic aspect of cancer biology. Among all histone PTMs, acetylation marks are most
studied in cancer for their diagnostic, prognostic and therapeutic potential[68]
. Histone
acetylations are regulated through the balancing act of histone acetyl-transferases (HAT)
and histone deacetylases (HDAC) and have significant effect on modulating chromatin
architecture and transcription[240]
. Therefore, several HAT and HDAC inhibitors have
been identified and a large amount of preclinical in vivo and in vitro data has been
gathered on their antitumor properties, opened a new area of cancer epigenetic therapy.
As epigenetic therapy, these inhibitors are used to reactivate tumour-suppressor genes
restoring the normal function of cells; and, combined with other drugs to increase the
efficacy of existing therapies.
In human gastric cancer, we observed the global loss of site specific acetylations
(Appendix, Figure A3.1) and pan-acetylation (Figure. 7.6A) of histone H3 and H4 and
high level of HDAC activity in tumor compared to normal adjacent mucosa. Our
observation corroborates with earlier findings where global loss of histone acetylations
such as H4K16ac, H3K9ac, H3K14ac and H3K18ac has been reported in several cancers
including prostate, pancreatic, lung, breast and kidney cancers. Earlier studies have also
showed high levels of HDACs in number of cancers including gastric, prostate,
colorectal, lung, lever, breast and nuroblastoma[68]
. Taken together, our and previous
studies explain the exponential growth in the area of histone deacetylase inhibitors
(HDACi) research for their therapeutic potential. Based on promising preclinical data
several HDACi are now being investigated in early phase clinical trials, both as single

Chapter 7: Global hypo-acetylation of histones in GC
132
agents and in combination with other cytotoxic therapies, showing activity against several
malignancies[244]
.
In solid tumors, studies of HDAC inhibitors as an agent in combination
chemotherapy are very limited. Therefore, we investigated the effect of three HDACi-
Valproic acid (VPA), Trichostatic A (TSA) and Vorinostat or Suberoylanilide
hydroxamic acid (SAHA) when combined with chemotherapy drugs- Cisplatin,
Oxaliplatin and Epirubicin on GC cells. Mechanism of action HDAC inhibitors are not
very well understood but VPA is class I HDAC inhibitor; whereas, TSA and SAHA are
pan-HDAC inhibitors[245, 246]
. Chemotherapy drugs used in the study exert their effect
mainly by binding or intercalating with DNA, which in turn induces DNA damage and
halts DNA replication and transcription[234]
. Pre-treatment combination of HDACi and
chemotherapy drugs increased the amount of DNA bound cisplatin, oxaliplatin and
epirubicin compared to concurrent and post-treatment combinations in AGS cells (Figure
7.4). Moreover, fraction affected (FA) plot analysis also showed low amount of combined
dose of HDACi and chemotherapy drug is required to achieve same level of cell death in
case of pre-treatment combination (Figure 7.5). Thus, our results suggest that pre-
treatment of HDAC inhibitors could be more potent in combinatorial chemotherapy than
concurrent or post-treatment combinations. Further, we also showed histone hyper-
acetylation of histones without any change in the cell cycle profile on HDACi treatment
(Figure 7.3) on AGS cell. Taken together, our data confirm the hypothesis that histone
hyper-acetylation associated relaxation of chromatin on HDAC inhibitor treatment
facilitates the binding of chemotherapy drugs to DNA. This action of HDAC inhibitors
have been thought to enable a reduction in the dose of the chemotherapy drug without
compromising cancer cell death. This could also offer the potential for reducing
chemotherapy-associated toxicity in gastric cancer.

Chapter 7: Global hypo-acetylation of histones in GC
133
Increase in cell death on combination of two or more drugs does not form the
basis of pre-clinical or clinical studies which can only be taken-up if the combination
shows synergistic effect. Encouraged by our results we did median effect plot analysis for
concurrent, pre and post combinations of HDAC inhibitors and chemotherapy drugs to
most synergistic combination. Any of the post-treatment combinations did not show
synergistic effect. All pre-treatment combinations of HDAC inhibitors and chemotherapy
drugs showed higher percentage of cell death at low combined doses; however, only
VPA-Oxaliplatin and TSA-Epirubicin are found to be best due to their synergistic effect
throughout FA values from 0.5 to 0.95. Pre-treatment combination of VPA-Cisplatin also
showed synergistic effect but till FA value 0.75; however, TSA-Oxaliplatin showed
synergy at higher FA values 0.75 to 0.95. Therefore, our findings suggest pre-treatment of
HDAC inhibitors acts more synergistically than concurrent-treatment combinations. This
could be explained based on the extra time provided to induce histone acetylation by
HDAC inhibitors in pre-treatment combination than concurrent. This notion has been
further strengthened by our observation of no synergistic effect of post-treatment
combinations and synergistic effect of concurrent-treatment combination (VPA-Cisplatin/
Oxaliplatin and TSA-Epirubicin) at low FA values (0.5 to 0.55). Despite of low
percentage of cell death compared to pre-treatment combinations, synergistic effect of
concurrent-treatment combinations further establishes the fact that only enhanced cell
death in combinatorial chemotherapy cannot guarantee synergistic effect. Taken together,
our results establishes VPA as a most potent HDAC inhibitor when combined with
platinum based chemotherapy drugs like Cisplatin and Oxaliplatin, whereas, TSA shows
more synergistic activity in combination with athracyclin based drugs like Epirubicin.
In conclusion, our results offer a firm rationale for exploring HDAC inhibitors as
an epigenetic therapy for gastric as well as other solid cancers in pre-clinical and clinical

Chapter 7: Global hypo-acetylation of histones in GC
134
settings. Variation in the HDAC and HAT activity in tumor tissues among GC patients as
observed (Figure 7.1B and C) suggest the possibility of the failure of HDAC inhibitors in
solid tumor chemotherapy as in earlier studies their levels were not checked in cancer
patients. Thus, first identifying the levels of HAT/ HDAC in cancer patients and then
deciding on the drug accordingly will help us in personalizing the chemotherapy in future.
Further, apart from as single agent, HDAC inhibitors can be of immense therapeutic use
as part of a combination with other therapeutic modalities, such as chemotherapy,
immunotherapy or radiotherapy. Epigenetic therapy might also be useful as a
chemopreventive approach, especially for individuals diagnosed with aberrant epigenetic
alterations but have not yet acquired neoplastic lesions. Furthermore, with the
comprehensive knowledge of mechanistic aspect of HDACs and HDAC inhibitors
development of more specific epigenetic drugs are anticipated in the near future.

Chapter 8
Summary and Conclusion

Summary and Conclusion
135
8.1 Summary and Conclusion
Epigenetic mechanisms are essential for normal development and differentiation, but also
act in adult organisms, either by patho-physiological state of the cell or under the
influence of the environment. Further, it became increasingly evident that epigenetic
disruption underlies the development of several human diseases, including cancer. In
gastric cancer, with the exception of DNA promoter hypermethylation studies, no other
epigenetic mechanism, such as histone post-translational modifications and miRNA have
been explored in-depth as a determinant of etiology of disease, clinical implication and
regarding their potential importance in therapy. The present study investigated the
differential pattern of site-specific histone PTMs with their regulatory mechanism,
sequence specific time-dependent potential use of HDACi in combinatorial
chemotherapy, and as an offshoot studied in detail an interesting finding on the
expression of housekeeping gene, β-actin in gastric cancer.
8.1.1 Salient findings:
1. Histone H3 Serine 10 phosphorylation: Regulation and its correlation with clinico-
pathological parameters in gastric cancer.
(i) The significantly (p< 0.01) higher level of H3S10ph is observed in tumor
tissues compared to histopathologically confirmed R0 resection margins.
(ii) H3S10ph levels of tumor tissues showed a significant positive correlation with
World Health Organization (WHO) classification (p= 0.0001), T stage (p=
0.005), pTNM stage (p= 0.016) and recurrence (p= 0.034).
(iii) The higher level of H3S10ph in tumor tissues is correlated with poor
prognosis of gastric cancer.
Summary and Conclusion
136
(iv) The distance of resection margin is an important factor in GC prognosis and
H3S10ph could be a potential biomarker in predicting the association between
distance of resection margin and clinical parameters.
(v) p38 MAPK cascade is responsible for MSK1 mediated H3S10 phosphorylation
in gastric cancer.
2. β-actin expression and its clinicopathological correlation in gastric adenocarcinoma
(i) Tissue disruptive techniques revealed significant overexpression of β-actin
level, at both mRNA and protein level in tumor tissues compared to
histopathologically confirmed R0 resection margins.
(ii) Immunostaining studies revealed that β-actin expression is majorly distributed
between epithelial and inflammatory cells of the tissues. However, comparative
analysis between normal and tumor tissues revealed that both epithelial and
inflammatory cells overexpress β-actin in tumor tissues, however, significant
difference was observed only in inflammatory cells.
(iii) A positive correlation of β-actin level of inflammatory cells is observed with
tumor grade, while epithelial cells exhibited negative correlation.
3. Global hypo-acetylation of histones: Combinatorial effect of HDAC inhibitors with
DNA-targeted chemotherapeutic drugs on gastric cancer cell lines
(i) Global loss of acetylation is observed at histone H3 and H4 in tumour tissues
compared to R0 resection margins in gastric cancer.
Summary and Conclusion
137
(ii) In gastric cancer tissues, HDAC’s are significantly up-regulated, whereas the
level of HAT did not show significant alteration suggesting that the observed
hypoacetylation is associated with the increase of HDAC.
(iii) The ‘pre’ treatment of HDAC inhibitors on gastric cancer cell line show
maximum cell death, and is associated with significant increases in the
binding/intercalation of chemotherapy drugs to DNA.
(iv) The combination index analysis shows that ‘pre’ treatment synergic effect at
the fraction effect (Fa) levels 0.5, 0.75 and 0.9 compared to ‘concurrent’ or ‘post’
HDACi treatment.
(v) Dose reduction index analysis also showed the reduction in dose of
chemotherapy drugs in combination with HDACi may lead to decreasing the
toxicity associated with chemotherapy.
In conclusion, our study has revealed histone hypo-acetylation and hyper-phosphorylation
across a large cohort of gastric tumor samples. The identified hyper-phosphorylation of
H3S10 correlates with different tumor grades, morphologic types, and phenotypic classes
of gastric tumors. Additionally, hyper-phosphorylated H3S10 correlates with distance of
resection margins, prognosis and clinical outcome. Further, association of histone hypo-
acetylation with overexpression of HDAC enzymes lead to the use of small-molecule,
HDACi as epigenetic modulators acting synergistically in a sequence specific pattern
along with chemotherapeutic drugs for better management of gastric cancer.

Summary and Conclusion
138
8.2 Future Perspectives:
1. Histone H3 Serine 10 phosphorylation: Regulation and its correlation with clinico-
pathological parameters in gastric cancer
While screening for differential patterns of histone PTMs between tumor and
negative resection margin tissue samples from GC patients, significant increase in
H3S10ph and decrease in total histone acetylation levels were observed. In
future, investigations in three different directions will give further insights to the
finds presented in this thesis. First, identification of the genomic regions/ genes
which are enriched in H3S10ph using ChIP-seq (Tumor vs RM) and their further
validation the GC carcinogenesis. Second, as cross-talk among histone PTMs are
at the core of their effect on pahto-physiological characteristics; therefore, in-
depth investigation of other histone PTMs, especially acetylation along with
H3S10ph is required with respect to carcinogenesis. Such efforts may result in the
finding regulatory switch of histone PTMs involved in GC. Third, the regulatory
pathway identified for H3S10ph in GC should be explored in future to identify
novel targets for cancer therepy.
2. β-actin expression and its clinicopathological correlation in gastric
adenocarcinoma
The findings of the presented study strengthens the area of actin biology and
emphasize on the fact that conventional housekeeping genes should not be chosen
as internal loading control without validation. This work provides impetus to
further study of β-actin expression in different cancers and implicate the findings
to understand the role of β-actin in carcinogenesis. It also laid the foundation to
find prognostic and diagnostic value of β-actin in cancer along with as a direct or
Summary and Conclusion
139
indirect target for chemotherapeutic intervention similarly as other cytoskeletal
element such as microtubules.
3. Global hypo-acetylation of histones: Combinatorial effect of HDAC inhibitors
with DNA-targeted chemotherapeutic drugs on gastric cancer cell lines
This part of the study presents encouraging results by in vitro experiments for
further detailed study to test the potential of HDAC inhibitors pre and. Or
concurrent-treatment combination chemotherapy. In future, animal model based
xenograft studies will validate our findings that HDAC inhibitors, specifically
VPA and TSA could work in synergy when combine with DNA based
chemotherapy drugs. Such investigations will also be helpful in assessing the
enhanced cytotoxic effect, reduction in the dose of chemotherapy drugs and
associated side effects. Thus, forming a firm rational for investigation of HAT/
HDAC level in GC patients, group them and conduct a clinical trial to test the
efficacy of HDACi in GC chemotherapy.

Bibliography

Bibliography
140
Bibliography
1 Bosman FT, World Health Organization., International Agency for Research on
Cancer. WHO classification of tumours of the digestive system. 4th ed. Lyon:
International Agency for Research on Cancer, 2010
2 Lauren P. The Two Histological Main Types of Gastric Carcinoma: Diffuse and So-
Called Intestinal-Type Carcinoma. An Attempt at a Histo-Clinical Classification. Acta
pathologica et microbiologica Scandinavica 1965; 64: 31-49 [PMID: 14320675]
3 Lauren PA, Nevalainen TJ. Epidemiology of intestinal and diffuse types of gastric
carcinoma. A time-trend study in Finland with comparison between studies from high-
and low-risk areas. Cancer 1993; 71(10): 2926-2933 [PMID: 8490820]
4 Vauhkonen M, Vauhkonen H, Sipponen P. Pathology and molecular biology of gastric
cancer. Best practice & research Clinical gastroenterology 2006; 20(4): 651-674
[PMID: 16997151 DOI: 10.1016/j.bpg.2006.03.016]
5 Crew KD, Neugut AI. Epidemiology of gastric cancer. World journal of
gastroenterology : WJG 2006; 12(3): 354-362 [PMID: 16489633 PMCID: 4066052]
6 Siegel R, Naishadham D, Jemal A. Cancer statistics, 2013. CA: a cancer journal for
clinicians 2013; 63(1): 11-30 [PMID: 23335087 DOI: 10.3322/caac.21166]
7 Dikshit RP, Mathur G, Mhatre S, Yeole BB. Epidemiological review of gastric cancer
in India. Indian journal of medical and paediatric oncology : official journal of Indian
Society of Medical & Paediatric Oncology 2011; 32(1): 3-11 [PMID: 21731209
PMCID: 3124986 DOI: 10.4103/0971-5851.81883]
8 Yeole BB. Trends in cancer incidence in esophagus, stomach, colon, rectum and liver
in males in India. Asian Pacific journal of cancer prevention : APJCP 2008; 9(1): 97-
100 [PMID: 18439085]
9 Bertuccio P, Chatenoud L, Levi F, Praud D, Ferlay J, Negri E, Malvezzi M, La
Vecchia C. Recent patterns in gastric cancer: a global overview. International journal
of cancer Journal international du cancer 2009; 125(3): 666-673 [PMID: 19382179
DOI: 10.1002/ijc.24290]
10 Stewart BW, Wild C, International Agency for Research on Cancer, World Health
Organization. World cancer report 2014
11 Forman D, Burley VJ. Gastric cancer: global pattern of the disease and an overview of
environmental risk factors. Best practice & research Clinical gastroenterology 2006;
20(4): 633-649 [PMID: 16997150 DOI: 10.1016/j.bpg.2006.04.008]
12 Rosero-Bixby L, Sierra R. X-ray screening seems to reduce gastric cancer mortality by
half in a community-controlled trial in Costa Rica. British journal of cancer 2007;
97(7): 837-843 [PMID: 17912238 PMCID: 2360405 DOI: 10.1038/sj.bjc.6603729]
13 Fukao A, Tsubono Y, Tsuji I, S HI, Sugahara N, Takano A. The evaluation of
screening for gastric cancer in Miyagi Prefecture, Japan: a population-based case-
control study. International journal of cancer Journal international du cancer 1995;
60(1): 45-48 [PMID: 7814150]
14 Walker MM, Teare L, McNulty C. Gastric cancer and Helicobacter pylori: the bug, the
host or the environment? Postgraduate medical journal 2008; 84(990): 169-170
[PMID: 18424570 DOI: 10.1136/pgmj.2008.068346]
15 Graham DY, Malaty HM, Evans DG, Evans DJ, Jr., Klein PD, Adam E. Epidemiology
of Helicobacter pylori in an asymptomatic population in the United States. Effect of
age, race, and socioeconomic status. Gastroenterology 1991; 100(6): 1495-1501
[PMID: 2019355]

Bibliography
141
16 Lazarevic K, Nagorni A, Rancic N, Milutinovic S, Stosic L, Ilijev I. Dietary factors
and gastric cancer risk: hospital-based case control study. Journal of BUON : official
journal of the Balkan Union of Oncology 2010; 15(1): 89-93 [PMID: 20414933]
17 Mark E. Lockhart CLC. Gastric cancer: Epidemiology of gastric cancer, 2010
18 Correa P, Piazuelo MB. The gastric precancerous cascade. Journal of digestive
diseases 2012; 13(1): 2-9 [PMID: 22188910 PMCID: 3404600 DOI: 10.1111/j.1751-
2980.2011.00550.x]
19 Koh YX, Chok AY, Zheng HL, Tan CS, Chow PK, Wong WK, Goh BK. A systematic
review and meta-analysis comparing laparoscopic versus open gastric resections for
gastrointestinal stromal tumors of the stomach. Annals of surgical oncology 2013;
20(11): 3549-3560 [PMID: 23793362 DOI: 10.1245/s10434-013-3051-1]
20 Low VH, Levine MS, Rubesin SE, Laufer I, Herlinger H. Diagnosis of gastric
carcinoma: sensitivity of double-contrast barium studies. AJR American journal of
roentgenology 1994; 162(2): 329-334 [PMID: 8310920 DOI:
10.2214/ajr.162.2.8310920]
21 Kiff RS, Taylor BA. Comparison of computed tomography, endosonography, and
intraoperative assessment in TN staging of gastric carcinoma. Gut 1994; 35(2): 287-
288 [PMID: 8166822 PMCID: 1374523]
22 Siewert JR, Fink U, Sendler A, Becker K, Bottcher K, Feldmann HJ, Hofler H,
Mueller J, Molls M, Nekarda H, Roder JD, Stein HJ. Gastric Cancer. Current
problems in surgery 1997; 34(11): 835-939 [PMID: 9413246]
23 Kaibara N, Sumi K, Yonekawa M, Ohta M, Makino M, Kimura O, Nishidoi H, Koga
S. Does extensive dissection of lymph nodes improve the results of surgical treatment
of gastric cancer? American journal of surgery 1990; 159(2): 218-221 [PMID:
2301716]
24 Wilke H, Preusser P, Fink U, Gunzer U, Meyer HJ, Meyer J, Siewert JR, Achterrath
W, Lenaz L, Knipp H, et al. Preoperative chemotherapy in locally advanced and
nonresectable gastric cancer: a phase II study with etoposide, doxorubicin, and
cisplatin. Journal of clinical oncology : official journal of the American Society of
Clinical Oncology 1989; 7(9): 1318-1326 [PMID: 2769330]
25 Waddington CH. The epigenotype. 1942. International journal of epidemiology 2012;
41(1): 10-13 [PMID: 22186258 DOI: 10.1093/ije/dyr184]
26 Luca Lovrečić AM, Maja Zadel and Borut Peterlin. The Role of Epigenetics in
Neurodegenerative Diseases, 2013
27 Castelo-Branco G, Bannister AJ. The epigenetics of cancer: from non-coding RNAs to
chromatin and beyond. Briefings in functional genomics 2013; 12(3): 161-163 [PMID:
23709460 DOI: 10.1093/bfgp/elt020]
28 Beckedorff FC, Amaral MS, Deocesano-Pereira C, Verjovski-Almeida S. Long non-
coding RNAs and their implications in cancer epigenetics. Bioscience reports 2013;
33(4) [PMID: 23875687 PMCID: 3759304 DOI: 10.1042/BSR20130054]
29 Vardabasso C, Hasson D, Ratnakumar K, Chung CY, Duarte LF, Bernstein E. Histone
variants: emerging players in cancer biology. Cellular and molecular life sciences :
CMLS 2014; 71(3): 379-404 [PMID: 23652611 PMCID: 4025945 DOI:
10.1007/s00018-013-1343-z]
30 Bernstein BE, Meissner A, Lander ES. The mammalian epigenome. Cell 2007; 128(4):
669-681 [PMID: 17320505 DOI: 10.1016/j.cell.2007.01.033]
31 Suzuki MM, Bird A. DNA methylation landscapes: provocative insights from
epigenomics. Nature reviews Genetics 2008; 9(6): 465-476 [PMID: 18463664 DOI:
10.1038/nrg2341]

Bibliography
142
32 Kouzarides T. Chromatin modifications and their function. Cell 2007; 128(4): 693-705
[PMID: 17320507 DOI: 10.1016/j.cell.2007.02.005]
33 Zhang B, Pan X, Cobb GP, Anderson TA. microRNAs as oncogenes and tumor
suppressors. Developmental biology 2007; 302(1): 1-12 [PMID: 16989803 DOI:
10.1016/j.ydbio.2006.08.028]
34 Jones PA, Baylin SB. The fundamental role of epigenetic events in cancer. Nature
reviews Genetics 2002; 3(6): 415-428 [PMID: 12042769 DOI: 10.1038/nrg816]
35 Egger G, Liang G, Aparicio A, Jones PA. Epigenetics in human disease and prospects
for epigenetic therapy. Nature 2004; 429(6990): 457-463 [PMID: 15164071 DOI:
10.1038/nature02625]
36 Jones PA, Laird PW. Cancer epigenetics comes of age. Nature genetics 1999; 21(2):
163-167 [PMID: 9988266 DOI: 10.1038/5947]
37 Luger K, Mader AW, Richmond RK, Sargent DF, Richmond TJ. Crystal structure of
the nucleosome core particle at 2.8 A resolution. Nature 1997; 389(6648): 251-260
[PMID: 9305837 DOI: 10.1038/38444]
38 Allfrey VG, Faulkner R, Mirsky AE. Acetylation and Methylation of Histones and
Their Possible Role in the Regulation of Rna Synthesis. Proceedings of the National
Academy of Sciences of the United States of America 1964; 51: 786-794 [PMID:
14172992 PMCID: 300163]
39 Khan SA, Reddy D, Gupta S. Global histone post-translational modifications and
cancer: Biomarkers for diagnosis, prognosis and treatment? World J Biol Chem 2015;
6(4): 333-345 [PMID: 26629316 PMCID: PMC4657128 DOI:
10.4331/wjbc.v6.i4.333]
40 Suganuma T, Workman JL. Signals and combinatorial functions of histone
modifications. Annual review of biochemistry 2011; 80: 473-499 [PMID: 21529160
DOI: 10.1146/annurev-biochem-061809-175347]
41 Zhou VW, Goren A, Bernstein BE. Charting histone modifications and the functional
organization of mammalian genomes. Nature reviews Genetics 2011; 12(1): 7-18
[PMID: 21116306 DOI: 10.1038/nrg2905]
42 Jenuwein T, Allis CD. Translating the histone code. Science 2001; 293(5532): 1074-
1080 [PMID: 11498575 DOI: 10.1126/science.1063127]
43 Rice JC, Allis CD. Histone methylation versus histone acetylation: new insights into
epigenetic regulation. Current opinion in cell biology 2001; 13(3): 263-273 [PMID:
11343896]
44 Dawson MA, Kouzarides T. Cancer epigenetics: from mechanism to therapy. Cell
2012; 150(1): 12-27 [PMID: 22770212 DOI: 10.1016/j.cell.2012.06.013]
45 Bannister AJ, Kouzarides T. Reversing histone methylation. Nature 2005; 436(7054):
1103-1106 [PMID: 16121170 DOI: 10.1038/nature04048]
46 Bannister AJ, Kouzarides T. Regulation of chromatin by histone modifications. Cell
research 2011; 21(3): 381-395 [PMID: 21321607 PMCID: 3193420 DOI:
10.1038/cr.2011.22]
47 Izzo A, Schneider R. Chatting histone modifications in mammals. Briefings in
functional genomics 2010; 9(5-6): 429-443 [PMID: 21266346 PMCID: 3080777 DOI:
10.1093/bfgp/elq024]
48 Suganuma T, Workman JL. Crosstalk among Histone Modifications. Cell 2008;
135(4): 604-607 [PMID: 19013272 DOI: 10.1016/j.cell.2008.10.036]
49 Sawicka A, Seiser C. Histone H3 phosphorylation - a versatile chromatin modification
for different occasions. Biochimie 2012; 94(11): 2193-2201 [PMID: 22564826
PMCID: PMC3480636 DOI: 10.1016/j.biochi.2012.04.018]

Bibliography
143
50 Dormann HL, Tseng BS, Allis CD, Funabiki H, Fischle W. Dynamic regulation of
effector protein binding to histone modifications: the biology of HP1 switching. Cell
cycle 2006; 5(24): 2842-2851 [PMID: 17172865]
51 Prigent C, Dimitrov S. Phosphorylation of serine 10 in histone H3, what for? Journal
of cell science 2003; 116(Pt 18): 3677-3685 [PMID: 12917355 DOI:
10.1242/jcs.00735]
52 Lachner M, O'Carroll D, Rea S, Mechtler K, Jenuwein T. Methylation of histone H3
lysine 9 creates a binding site for HP1 proteins. Nature 2001; 410(6824): 116-120
[PMID: 11242053 DOI: 10.1038/35065132]
53 Fischle W, Tseng BS, Dormann HL, Ueberheide BM, Garcia BA, Shabanowitz J, Hunt
DF, Funabiki H, Allis CD. Regulation of HP1-chromatin binding by histone H3
methylation and phosphorylation. Nature 2005; 438(7071): 1116-1122 [PMID:
16222246 DOI: 10.1038/nature04219]
54 Hirota T, Lipp JJ, Toh BH, Peters JM. Histone H3 serine 10 phosphorylation by
Aurora B causes HP1 dissociation from heterochromatin. Nature 2005; 438(7071):
1176-1180 [PMID: 16222244 DOI: 10.1038/nature04254]
55 Metzger E, Imhof A, Patel D, Kahl P, Hoffmeyer K, Friedrichs N, Muller JM,
Greschik H, Kirfel J, Ji S, Kunowska N, Beisenherz-Huss C, Gunther T, Buettner R,
Schule R. Phosphorylation of histone H3T6 by PKCbeta(I) controls demethylation at
histone H3K4. Nature 2010; 464(7289): 792-796 [PMID: 20228790 DOI:
10.1038/nature08839]
56 Fraga MF, Ballestar E, Villar-Garea A, Boix-Chornet M, Espada J, Schotta G, Bonaldi
T, Haydon C, Ropero S, Petrie K, Iyer NG, Perez-Rosado A, Calvo E, Lopez JA, Cano
A, Calasanz MJ, Colomer D, Piris MA, Ahn N, Imhof A, Caldas C, Jenuwein T,
Esteller M. Loss of acetylation at Lys16 and trimethylation at Lys20 of histone H4 is a
common hallmark of human cancer. Nature genetics 2005; 37(4): 391-400 [PMID:
15765097 DOI: 10.1038/ng1531]
57 Zhu L, Yang J, Zhao L, Yu X, Wang L, Wang F, Cai Y, Jin J. Expression of hMOF,
but not HDAC4, is responsible for the global histone H4K16 acetylation in gastric
carcinoma. International journal of oncology 2015; 46(6): 2535-2545 [PMID:
25873202 DOI: 10.3892/ijo.2015.2956]
58 Lin T, Ponn A, Hu X, Law BK, Lu J. Requirement of the histone demethylase LSD1 in
Snai1-mediated transcriptional repression during epithelial-mesenchymal transition.
Oncogene 2010; 29(35): 4896-4904 [PMID: 20562920 PMCID: 3093107 DOI:
10.1038/onc.2010.234]
59 Zhang Y, Li Q, Chen H. DNA methylation and histone modifications of Wnt genes by
genistein during colon cancer development. Carcinogenesis 2013; 34(8): 1756-1763
[PMID: 23598468 PMCID: 3731807 DOI: 10.1093/carcin/bgt129]
60 Nguyen CT, Weisenberger DJ, Velicescu M, Gonzales FA, Lin JC, Liang G, Jones
PA. Histone H3-lysine 9 methylation is associated with aberrant gene silencing in
cancer cells and is rapidly reversed by 5-aza-2'-deoxycytidine. Cancer research 2002;
62(22): 6456-6461 [PMID: 12438235]
61 Valk-Lingbeek ME, Bruggeman SW, van Lohuizen M. Stem cells and cancer; the
polycomb connection. Cell 2004; 118(4): 409-418 [PMID: 15315754 DOI:
10.1016/j.cell.2004.08.005]
62 Chadee DN, Hendzel MJ, Tylipski CP, Allis CD, Bazett-Jones DP, Wright JA, Davie
JR. Increased Ser-10 phosphorylation of histone H3 in mitogen-stimulated and
oncogene-transformed mouse fibroblasts. The Journal of biological chemistry 1999;
274(35): 24914-24920 [PMID: 10455166]
Bibliography
144
63 Choi HS, Choi BY, Cho YY, Mizuno H, Kang BS, Bode AM, Dong Z.
Phosphorylation of histone H3 at serine 10 is indispensable for neoplastic cell
transformation. Cancer research 2005; 65(13): 5818-5827 [PMID: 15994958 PMCID:
2227263 DOI: 10.1158/0008-5472.CAN-05-0197]
64 Kim HG, Lee KW, Cho YY, Kang NJ, Oh SM, Bode AM, Dong Z. Mitogen- and
stress-activated kinase 1-mediated histone H3 phosphorylation is crucial for cell
transformation. Cancer research 2008; 68(7): 2538-2547 [PMID: 18381464 PMCID:
2288657 DOI: 10.1158/0008-5472.CAN-07-6597]
65 Machiels BM, Ruers T, Lindhout M, Hardy K, Hlavaty T, Bang DD, Somers VA,
Baeten C, von Meyenfeldt M, Thunnissen FB. New protocol for DNA extraction of
stool. BioTechniques 2000; 28(2): 286-290 [PMID: 10683738]
66 Leon SA, Shapiro B, Sklaroff DM, Yaros MJ. Free DNA in the serum of cancer
patients and the effect of therapy. Cancer research 1977; 37(3): 646-650 [PMID:
837366]
67 Matei DE, Nephew KP. Epigenetic therapies for chemoresensitization of epithelial
ovarian cancer. Gynecologic oncology 2010; 116(2): 195-201 [PMID: 19854495
PMCID: 2813995 DOI: 10.1016/j.ygyno.2009.09.043]
68 Fullgrabe J, Kavanagh E, Joseph B. Histone onco-modifications. Oncogene 2011;
30(31): 3391-3403 [PMID: 21516126 DOI: 10.1038/onc.2011.121]
69 Barski A, Cuddapah S, Cui K, Roh TY, Schones DE, Wang Z, Wei G, Chepelev I,
Zhao K. High-resolution profiling of histone methylations in the human genome. Cell
2007; 129(4): 823-837 [PMID: 17512414 DOI: 10.1016/j.cell.2007.05.009]
70 Gezer U, Mert U, Ozgur E, Yoruker EE, Holdenrieder S, Dalay N. Correlation of
histone methyl marks with circulating nucleosomes in blood plasma of cancer patients.
Oncology letters 2012; 3(5): 1095-1098 [PMID: 22783398 PMCID: 3389626 DOI:
10.3892/ol.2012.600]
71 Deligezer U, Akisik EE, Erten N, Dalay N. Sequence-specific histone methylation is
detectable on circulating nucleosomes in plasma. Clinical chemistry 2008; 54(7):
1125-1131 [PMID: 18487283 DOI: 10.1373/clinchem.2007.101766]
72 Leszinski G, Gezer U, Siegele B, Stoetzer O, Holdenrieder S. Relevance of histone
marks H3K9me3 and H4K20me3 in cancer. Anticancer research 2012; 32(5): 2199-
2205 [PMID: 22593510]
73 Gezer U, Ustek D, Yoruker EE, Cakiris A, Abaci N, Leszinski G, Dalay N,
Holdenrieder S. Characterization of H3K9me3- and H4K20me3-associated circulating
nucleosomal DNA by high-throughput sequencing in colorectal cancer. Tumour
biology : the journal of the International Society for Oncodevelopmental Biology and
Medicine 2013; 34(1): 329-336 [PMID: 23086575 DOI: 10.1007/s13277-012-0554-5]
74 Tryndyak VP, Kovalchuk O, Pogribny IP. Loss of DNA methylation and histone H4
lysine 20 trimethylation in human breast cancer cells is associated with aberrant
expression of DNA methyltransferase 1, Suv4-20h2 histone methyltransferase and
methyl-binding proteins. Cancer biology & therapy 2006; 5(1): 65-70 [PMID:
16322686]
75 Bagnyukova TV, Tryndyak VP, Montgomery B, Churchwell MI, Karpf AR, James
SR, Muskhelishvili L, Beland FA, Pogribny IP. Genetic and epigenetic changes in rat
preneoplastic liver tissue induced by 2-acetylaminofluorene. Carcinogenesis 2008;
29(3): 638-646 [PMID: 18204080 DOI: 10.1093/carcin/bgm303]
76 Seligson DB, Horvath S, Shi T, Yu H, Tze S, Grunstein M, Kurdistani SK. Global
histone modification patterns predict risk of prostate cancer recurrence. Nature 2005;
435(7046): 1262-1266 [PMID: 15988529 DOI: 10.1038/nature03672]
Bibliography
145
77 Seligson DB, Horvath S, McBrian MA, Mah V, Yu H, Tze S, Wang Q, Chia D,
Goodglick L, Kurdistani SK. Global levels of histone modifications predict prognosis
in different cancers. The American journal of pathology 2009; 174(5): 1619-1628
[PMID: 19349354 PMCID: 2671251 DOI: 10.2353/ajpath.2009.080874]
78 Elsheikh SE, Green AR, Rakha EA, Powe DG, Ahmed RA, Collins HM, Soria D,
Garibaldi JM, Paish CE, Ammar AA, Grainge MJ, Ball GR, Abdelghany MK,
Martinez-Pomares L, Heery DM, Ellis IO. Global histone modifications in breast
cancer correlate with tumor phenotypes, prognostic factors, and patient outcome.
Cancer research 2009; 69(9): 3802-3809 [PMID: 19366799 DOI: 10.1158/0008-
5472.CAN-08-3907]
79 Barlesi F, Giaccone G, Gallegos-Ruiz MI, Loundou A, Span SW, Lefesvre P, Kruyt
FA, Rodriguez JA. Global histone modifications predict prognosis of resected non
small-cell lung cancer. Journal of clinical oncology : official journal of the American
Society of Clinical Oncology 2007; 25(28): 4358-4364 [PMID: 17906200 DOI:
10.1200/JCO.2007.11.2599]
80 Ellinger J, Kahl P, Mertens C, Rogenhofer S, Hauser S, Hartmann W, Bastian PJ,
Buttner R, Muller SC, von Ruecker A. Prognostic relevance of global histone H3
lysine 4 (H3K4) methylation in renal cell carcinoma. International journal of cancer
Journal international du cancer 2010; 127(10): 2360-2366 [PMID: 20162570 DOI:
10.1002/ijc.25250]
81 Manuyakorn A, Paulus R, Farrell J, Dawson NA, Tze S, Cheung-Lau G, Hines OJ,
Reber H, Seligson DB, Horvath S, Kurdistani SK, Guha C, Dawson DW. Cellular
histone modification patterns predict prognosis and treatment response in resectable
pancreatic adenocarcinoma: results from RTOG 9704. Journal of clinical oncology :
official journal of the American Society of Clinical Oncology 2010; 28(8): 1358-1365
[PMID: 20142597 PMCID: 2834495 DOI: 10.1200/JCO.2009.24.5639]
82 Rajendran G, Shanmuganandam K, Bendre A, Muzumdar D, Goel A, Shiras A.
Epigenetic regulation of DNA methyltransferases: DNMT1 and DNMT3B in gliomas.
Journal of neuro-oncology 2011; 104(2): 483-494 [PMID: 21229291 DOI:
10.1007/s11060-010-0520-2]
83 Bai X, Wu L, Liang T, Liu Z, Li J, Li D, Xie H, Yin S, Yu J, Lin Q, Zheng S.
Overexpression of myocyte enhancer factor 2 and histone hyperacetylation in
hepatocellular carcinoma. Journal of cancer research and clinical oncology 2008;
134(1): 83-91 [PMID: 17611778 DOI: 10.1007/s00432-007-0252-7]
84 Mohamed MA, Greif PA, Diamond J, Sharaf O, Maxwell P, Montironi R, Young RA,
Hamilton PW. Epigenetic events, remodelling enzymes and their relationship to
chromatin organization in prostatic intraepithelial neoplasia and prostatic
adenocarcinoma. BJU international 2007; 99(4): 908-915 [PMID: 17378849 DOI:
10.1111/j.1464-410X.2006.06704.x]
85 Liu BL, Cheng JX, Zhang X, Wang R, Zhang W, Lin H, Xiao X, Cai S, Chen XY,
Cheng H. Global histone modification patterns as prognostic markers to classify
glioma patients. Cancer epidemiology, biomarkers & prevention : a publication of the
American Association for Cancer Research, cosponsored by the American Society of
Preventive Oncology 2010; 19(11): 2888-2896 [PMID: 20978174 DOI:
10.1158/1055-9965.EPI-10-0454]
86 Park YS, Jin MY, Kim YJ, Yook JH, Kim BS, Jang SJ. The global histone
modification pattern correlates with cancer recurrence and overall survival in gastric
adenocarcinoma. Annals of surgical oncology 2008; 15(7): 1968-1976 [PMID:
18470569 DOI: 10.1245/s10434-008-9927-9]
Bibliography
146
87 Muller-Tidow C, Klein HU, Hascher A, Isken F, Tickenbrock L, Thoennissen N,
Agrawal-Singh S, Tschanter P, Disselhoff C, Wang Y, Becker A, Thiede C, Ehninger
G, zur Stadt U, Koschmieder S, Seidl M, Muller FU, Schmitz W, Schlenke P,
McClelland M, Berdel WE, Dugas M, Serve H, Study Alliance L. Profiling of histone
H3 lysine 9 trimethylation levels predicts transcription factor activity and survival in
acute myeloid leukemia. Blood 2010; 116(18): 3564-3571 [PMID: 20498303 PMCID:
2981478 DOI: 10.1182/blood-2009-09-240978]
88 Ferrari R, Pellegrini M, Horwitz GA, Xie W, Berk AJ, Kurdistani SK. Epigenetic
reprogramming by adenovirus e1a. Science 2008; 321(5892): 1086-1088 [PMID:
18719284 PMCID: 2693122 DOI: 10.1126/science.1155546]
89 Horwitz GA, Zhang K, McBrian MA, Grunstein M, Kurdistani SK, Berk AJ.
Adenovirus small e1a alters global patterns of histone modification. Science 2008;
321(5892): 1084-1085 [PMID: 18719283 PMCID: 2756290 DOI:
10.1126/science.1155544]
90 Tzao C, Tung HJ, Jin JS, Sun GH, Hsu HS, Chen BH, Yu CP, Lee SC. Prognostic
significance of global histone modifications in resected squamous cell carcinoma of
the esophagus. Modern pathology : an official journal of the United States and
Canadian Academy of Pathology, Inc 2009; 22(2): 252-260 [PMID: 18953329 DOI:
10.1038/modpathol.2008.172]
91 Yu J, Yu J, Rhodes DR, Tomlins SA, Cao X, Chen G, Mehra R, Wang X, Ghosh D,
Shah RB, Varambally S, Pienta KJ, Chinnaiyan AM. A polycomb repression signature
in metastatic prostate cancer predicts cancer outcome. Cancer research 2007; 67(22):
10657-10663 [PMID: 18006806 DOI: 10.1158/0008-5472.CAN-07-2498]
92 Wei Y, Xia W, Zhang Z, Liu J, Wang H, Adsay NV, Albarracin C, Yu D, Abbruzzese
JL, Mills GB, Bast RC, Jr., Hortobagyi GN, Hung MC. Loss of trimethylation at lysine
27 of histone H3 is a predictor of poor outcome in breast, ovarian, and pancreatic
cancers. Molecular carcinogenesis 2008; 47(9): 701-706 [PMID: 18176935 PMCID:
2580832 DOI: 10.1002/mc.20413]
93 He LR, Liu MZ, Li BK, Rao HL, Liao YJ, Guan XY, Zeng YX, Xie D. Prognostic
impact of H3K27me3 expression on locoregional progression after chemoradiotherapy
in esophageal squamous cell carcinoma. BMC cancer 2009; 9: 461 [PMID: 20028503
PMCID: 2804715 DOI: 10.1186/1471-2407-9-461]
94 Zhang L, Zhong K, Dai Y, Zhou H. Genome-wide analysis of histone H3 lysine 27
trimethylation by ChIP-chip in gastric cancer patients. Journal of gastroenterology
2009; 44(4): 305-312 [PMID: 19267258 DOI: 10.1007/s00535-009-0027-9]
95 Schwartzentruber J, Korshunov A, Liu XY, Jones DT, Pfaff E, Jacob K, Sturm D,
Fontebasso AM, Quang DA, Tonjes M, Hovestadt V, Albrecht S, Kool M, Nantel A,
Konermann C, Lindroth A, Jager N, Rausch T, Ryzhova M, Korbel JO, Hielscher T,
Hauser P, Garami M, Klekner A, Bognar L, Ebinger M, Schuhmann MU, Scheurlen
W, Pekrun A, Fruhwald MC, Roggendorf W, Kramm C, Durken M, Atkinson J,
Lepage P, Montpetit A, Zakrzewska M, Zakrzewski K, Liberski PP, Dong Z, Siegel P,
Kulozik AE, Zapatka M, Guha A, Malkin D, Felsberg J, Reifenberger G, von
Deimling A, Ichimura K, Collins VP, Witt H, Milde T, Witt O, Zhang C, Castelo-
Branco P, Lichter P, Faury D, Tabori U, Plass C, Majewski J, Pfister SM, Jabado N.
Driver mutations in histone H3.3 and chromatin remodelling genes in paediatric
glioblastoma. Nature 2012; 482(7384): 226-231 [PMID: 22286061 DOI:
10.1038/nature10833]
96 Karczmarski J, Rubel T, Paziewska A, Mikula M, Bujko M, Kober P, Dadlez M,
Ostrowski J. Histone H3 lysine 27 acetylation is altered in colon cancer. Clinical

Bibliography
147
proteomics 2014; 11(1): 24 [PMID: 24994966 PMCID: 4071346 DOI: 10.1186/1559-
0275-11-24]
97 Tamagawa H, Oshima T, Shiozawa M, Morinaga S, Nakamura Y, Yoshihara M,
Sakuma Y, Kameda Y, Akaike M, Masuda M, Imada T, Miyagi Y. The global histone
modification pattern correlates with overall survival in metachronous liver metastasis
of colorectal cancer. Oncology reports 2012; 27(3): 637-642 [PMID: 22076537 DOI:
10.3892/or.2011.1547]
98 Nagelkerke A, van Kuijk SJ, Sweep FC, Nagtegaal ID, Hoogerbrugge N, Martens JW,
Timmermans MA, van Laarhoven HW, Bussink J, Span PN. Constitutive expression
of gamma-H2AX has prognostic relevance in triple negative breast cancer.
Radiotherapy and oncology : journal of the European Society for Therapeutic
Radiology and Oncology 2011; 101(1): 39-45 [PMID: 21840613 DOI:
10.1016/j.radonc.2011.07.009]
99 Nagelkerke A, van Kuijk SJ, Martens JW, Sweep FC, Hoogerbrugge N, Bussink J,
Span PN. Poor prognosis of constitutive gamma-H2AX expressing triple-negative
breast cancers is associated with telomere length. Biomarkers in medicine 2015; 9(4):
383-390 [PMID: 25808442 DOI: 10.2217/bmm.15.2]
100 Lee YC, Yin TC, Chen YT, Chai CY, Wang JY, Liu MC, Lin YC, Kan JY. High
Expression of Phospho-H2AX Predicts a Poor Prognosis in Colorectal Cancer.
Anticancer research 2015; 35(4): 2447-2453 [PMID: 25862913]
101 Pacaud R, Cheray M, Nadaradjane A, Vallette FM, Cartron PF. Histone H3
phosphorylation in GBM: a new rational to guide the use of kinase inhibitors in anti-
GBM therapy. Theranostics 2015; 5(1): 12-22 [PMID: 25553095 PMCID: 4265745
DOI: 10.7150/thno.8799]
102 Li B, Huang G, Zhang X, Li R, Wang J, Dong Z, He Z. Increased phosphorylation of
histone H3 at serine 10 is involved in Epstein-Barr virus latent membrane protein-1-
induced carcinogenesis of nasopharyngeal carcinoma. BMC cancer 2013; 13: 124
[PMID: 23496845 PMCID: 3610199 DOI: 10.1186/1471-2407-13-124]
103 Ladstein RG, Bachmann IM, Straume O, Akslen LA. Prognostic importance of the
mitotic marker phosphohistone H3 in cutaneous nodular melanoma. The Journal of
investigative dermatology 2012; 132(4): 1247-1252 [PMID: 22297638 DOI:
10.1038/jid.2011.464]
104 Skaland I, Janssen EA, Gudlaugsson E, Klos J, Kjellevold KH, Soiland H, Baak JP.
Validating the prognostic value of proliferation measured by Phosphohistone H3
(PPH3) in invasive lymph node-negative breast cancer patients less than 71 years of
age. Breast cancer research and treatment 2009; 114(1): 39-45 [PMID: 18373192
DOI: 10.1007/s10549-008-9980-x]
105 Skaland I, Janssen EA, Gudlaugsson E, Klos J, Kjellevold KH, Soiland H, Baak JP.
Phosphohistone H3 expression has much stronger prognostic value than classical
prognosticators in invasive lymph node-negative breast cancer patients less than 55
years of age. Modern pathology : an official journal of the United States and Canadian
Academy of Pathology, Inc 2007; 20(12): 1307-1315 [PMID: 17917671 DOI:
10.1038/modpathol.3800972]
106 Nakashima S, Shiozaki A, Ichikawa D, Komatsu S, Konishi H, Iitaka D, Kubota T,
Fujiwara H, Okamoto K, Kishimoto M, Otsuji E. Anti-phosphohistone H3 as an
independent prognostic factor in human esophageal squamous cell carcinoma.
Anticancer research 2013; 33(2): 461-467 [PMID: 23393337]
107 Uguen A, Conq G, Doucet L, Talagas M, Costa S, De Braekeleer M, Marcorelles P.
Immunostaining of phospho-histone H3 and Ki-67 improves reproducibility of
recurrence risk assessment of gastrointestinal stromal tumors. Virchows Archiv : an
Bibliography
148
international journal of pathology 2015 [PMID: 25823616 DOI: 10.1007/s00428-
015-1763-2]
108 Takahashi H, Murai Y, Tsuneyama K, Nomoto K, Okada E, Fujita H, Takano Y.
Overexpression of phosphorylated histone H3 is an indicator of poor prognosis in
gastric adenocarcinoma patients. Applied immunohistochemistry & molecular
morphology : AIMM / official publication of the Society for Applied
Immunohistochemistry 2006; 14(3): 296-302 [PMID: 16932020]
109 Nielsen PS, Riber-Hansen R, Jensen TO, Schmidt H, Steiniche T. Proliferation indices
of phosphohistone H3 and Ki67: strong prognostic markers in a consecutive cohort
with stage I/II melanoma. Modern pathology : an official journal of the United States
and Canadian Academy of Pathology, Inc 2013; 26(3): 404-413 [PMID: 23174936
DOI: 10.1038/modpathol.2012.188]
110 Marmorstein R, Trievel RC. Histone modifying enzymes: structures, mechanisms, and
specificities. Biochimica et biophysica acta 2009; 1789(1): 58-68 [PMID: 18722564
PMCID: 4059211 DOI: 10.1016/j.bbagrm.2008.07.009]
111 Cole PA. Chemical probes for histone-modifying enzymes. Nature chemical biology
2008; 4(10): 590-597 [PMID: 18800048 PMCID: 2908280 DOI:
10.1038/nchembio.111]
112 Espino PS, Drobic B, Dunn KL, Davie JR. Histone modifications as a platform for
cancer therapy. Journal of cellular biochemistry 2005; 94(6): 1088-1102 [PMID:
15723344 DOI: 10.1002/jcb.20387]
113 Balch C, Nephew KP. Epigenetic targeting therapies to overcome chemotherapy
resistance. Advances in experimental medicine and biology 2013; 754: 285-311
[PMID: 22956507 DOI: 10.1007/978-1-4419-9967-2_14]
114 Li SY, Sun R, Wang HX, Shen S, Liu Y, Du XJ, Zhu YH, Jun W. Combination
therapy with epigenetic-targeted and chemotherapeutic drugs delivered by
nanoparticles to enhance the chemotherapy response and overcome resistance by
breast cancer stem cells. Journal of controlled release : official journal of the
Controlled Release Society 2015; 205: 7-14 [PMID: 25445694 DOI:
10.1016/j.jconrel.2014.11.011]
115 Seto E, Yoshida M. Erasers of histone acetylation: the histone deacetylase enzymes.
Cold Spring Harb Perspect Biol 2014; 6(4): a018713 [PMID: 24691964 DOI:
10.1101/cshperspect.a018713]
116 Cameron EE, Bachman KE, Myohanen S, Herman JG, Baylin SB. Synergy of
demethylation and histone deacetylase inhibition in the re-expression of genes silenced
in cancer. Nature genetics 1999; 21(1): 103-107 [PMID: 9916800 DOI:
10.1038/5047]
117 Cacan E, Ali MW, Boyd NH, Hooks SB, Greer SF. Inhibition of HDAC1 and DNMT1
modulate RGS10 expression and decrease ovarian cancer chemoresistance. PloS one
2014; 9(1): e87455 [PMID: 24475290 PMCID: 3903677 DOI:
10.1371/journal.pone.0087455]
118 Hehlgans S, Storch K, Lange I, Cordes N. The novel HDAC inhibitor NDACI054
sensitizes human cancer cells to radiotherapy. Radiotherapy and oncology : journal of
the European Society for Therapeutic Radiology and Oncology 2013; 109(1): 126-132
[PMID: 24060178 DOI: 10.1016/j.radonc.2013.08.023]
119 Hubaux R, Vandermeers F, Crisanti MC, Kapoor V, Burny A, Mascaux C, Albelda
SM, Willems L. Preclinical evidence for a beneficial impact of valproate on the
response of small cell lung cancer to first-line chemotherapy. European journal of
cancer 2010; 46(9): 1724-1734 [PMID: 20451370 DOI: 10.1016/j.ejca.2010.03.021]

Bibliography
149
120 Munster PN, Troso-Sandoval T, Rosen N, Rifkind R, Marks PA, Richon VM. The
histone deacetylase inhibitor suberoylanilide hydroxamic acid induces differentiation
of human breast cancer cells. Cancer research 2001; 61(23): 8492-8497 [PMID:
11731433]
121 Louis M, Rosato RR, Brault L, Osbild S, Battaglia E, Yang XH, Grant S, Bagrel D.
The histone deacetylase inhibitor sodium butyrate induces breast cancer cell apoptosis
through diverse cytotoxic actions including glutathione depletion and oxidative stress.
International journal of oncology 2004; 25(6): 1701-1711 [PMID: 15547708]
122 Said TK, Moraes RC, Sinha R, Medina D. Mechanisms of suberoylanilide hydroxamic
acid inhibition of mammary cell growth. Breast cancer research : BCR 2001; 3(2):
122-133 [PMID: 11250759 PMCID: 13923 DOI: 10.1186/bcr284]
123 Dizon DS, Blessing JA, Penson RT, Drake RD, Walker JL, Johnston CM, Disilvestro
PA, Fader AN. A phase II evaluation of belinostat and carboplatin in the treatment of
recurrent or persistent platinum-resistant ovarian, fallopian tube, or primary peritoneal
carcinoma: a Gynecologic Oncology Group study. Gynecologic oncology 2012;
125(2): 367-371 [PMID: 22366594 PMCID: 3330705 DOI:
10.1016/j.ygyno.2012.02.019]
124 Tarhini AA, Zahoor H, McLaughlin B, Gooding WE, Schmitz JC, Siegfried JM,
Socinski MA, Argiris A. Phase I trial of carboplatin and etoposide in combination with
panobinostat in patients with lung cancer. Anticancer research 2013; 33(10): 4475-
4481 [PMID: 24123018 PMCID: 4157617]
125 Cassier PA, Lefranc A, Amela EY, Chevreau C, Bui BN, Lecesne A, Ray-Coquard I,
Chabaud S, Penel N, Berge Y, Domont J, Italiano A, Duffaud F, Cadore AC, Polivka
V, Blay JY. A phase II trial of panobinostat in patients with advanced pretreated soft
tissue sarcoma. A study from the French Sarcoma Group. British journal of cancer
2013; 109(4): 909-914 [PMID: 23922114 PMCID: 3749588 DOI:
10.1038/bjc.2013.442]
126 Yardley DA, Ismail-Khan RR, Melichar B, Lichinitser M, Munster PN, Klein PM,
Cruickshank S, Miller KD, Lee MJ, Trepel JB. Randomized phase II, double-blind,
placebo-controlled study of exemestane with or without entinostat in postmenopausal
women with locally recurrent or metastatic estrogen receptor-positive breast cancer
progressing on treatment with a nonsteroidal aromatase inhibitor. Journal of clinical
oncology : official journal of the American Society of Clinical Oncology 2013; 31(17):
2128-2135 [PMID: 23650416 DOI: 10.1200/JCO.2012.43.7251]
127 Witta SE, Jotte RM, Konduri K, Neubauer MA, Spira AI, Ruxer RL, Varella-Garcia
M, Bunn PA, Jr., Hirsch FR. Randomized phase II trial of erlotinib with and without
entinostat in patients with advanced non-small-cell lung cancer who progressed on
prior chemotherapy. Journal of clinical oncology : official journal of the American
Society of Clinical Oncology 2012; 30(18): 2248-2255 [PMID: 22508830 DOI:
10.1200/JCO.2011.38.9411]
128 Dong M, Ning ZQ, Xing PY, Xu JL, Cao HX, Dou GF, Meng ZY, Shi YK, Lu XP,
Feng FY. Phase I study of chidamide (CS055/HBI-8000), a new histone deacetylase
inhibitor, in patients with advanced solid tumors and lymphomas. Cancer
chemotherapy and pharmacology 2012; 69(6): 1413-1422 [PMID: 22362161 DOI:
10.1007/s00280-012-1847-5]
129 Zorzi AP, Bernstein M, Samson Y, Wall DA, Desai S, Nicksy D, Wainman N,
Eisenhauer E, Baruchel S. A phase I study of histone deacetylase inhibitor, pracinostat
(SB939), in pediatric patients with refractory solid tumors: IND203 a trial of the NCIC
IND program/C17 pediatric phase I consortium. Pediatric blood & cancer 2013;
60(11): 1868-1874 [PMID: 23893953 DOI: 10.1002/pbc.24694]
Bibliography
150
130 de Bono JS, Kristeleit R, Tolcher A, Fong P, Pacey S, Karavasilis V, Mita M, Shaw H,
Workman P, Kaye S, Rowinsky EK, Aherne W, Atadja P, Scott JW, Patnaik A. Phase
I pharmacokinetic and pharmacodynamic study of LAQ824, a hydroxamate histone
deacetylase inhibitor with a heat shock protein-90 inhibitory profile, in patients with
advanced solid tumors. Clinical cancer research : an official journal of the American
Association for Cancer Research 2008; 14(20): 6663-6673 [PMID: 18927309 DOI:
10.1158/1078-0432.CCR-08-0376]
131 Shi H, Wei SH, Leu YW, Rahmatpanah F, Liu JC, Yan PS, Nephew KP, Huang TH.
Triple analysis of the cancer epigenome: an integrated microarray system for assessing
gene expression, DNA methylation, and histone acetylation. Cancer research 2003;
63(9): 2164-2171 [PMID: 12727835]
132 Yang X, Phillips DL, Ferguson AT, Nelson WG, Herman JG, Davidson NE.
Synergistic activation of functional estrogen receptor (ER)-alpha by DNA
methyltransferase and histone deacetylase inhibition in human ER-alpha-negative
breast cancer cells. Cancer research 2001; 61(19): 7025-7029 [PMID: 11585728]
133 Belinsky SA, Klinge DM, Stidley CA, Issa JP, Herman JG, March TH, Baylin SB.
Inhibition of DNA methylation and histone deacetylation prevents murine lung cancer.
Cancer research 2003; 63(21): 7089-7093 [PMID: 14612500]
134 Marchion DC, Bicaku E, Daud AI, Richon V, Sullivan DM, Munster PN. Sequence-
specific potentiation of topoisomerase II inhibitors by the histone deacetylase inhibitor
suberoylanilide hydroxamic acid. Journal of cellular biochemistry 2004; 92(2): 223-
237 [PMID: 15108350 DOI: 10.1002/jcb.20045]
135 Marchion DC, Bicaku E, Daud AI, Sullivan DM, Munster PN. In vivo synergy
between topoisomerase II and histone deacetylase inhibitors: predictive correlates.
Molecular cancer therapeutics 2005; 4(12): 1993-2000 [PMID: 16373714 DOI:
10.1158/1535-7163.MCT-05-0194]
136 Hagelkruys A, Sawicka A, Rennmayr M, Seiser C. The biology of HDAC in cancer:
the nuclear and epigenetic components. Handb Exp Pharmacol 2011; 206: 13-37
[PMID: 21879444 DOI: 10.1007/978-3-642-21631-2_2]
137 Belinsky SA, Grimes MJ, Picchi MA, Mitchell HD, Stidley CA, Tesfaigzi Y, Channell
MM, Liu Y, Casero RA, Jr., Baylin SB, Reed MD, Tellez CS, March TH.
Combination therapy with vidaza and entinostat suppresses tumor growth and
reprograms the epigenome in an orthotopic lung cancer model. Cancer research 2011;
71(2): 454-462 [PMID: 21224363 PMCID: 3075424 DOI: 10.1158/0008-5472.CAN-
10-3184]
138 Andrade FO, Nagamine MK, Conti AD, Chaible LM, Fontelles CC, Jordao Junior AA,
Vannucchi H, Dagli ML, Bassoli BK, Moreno FS, Ong TP. Efficacy of the dietary
histone deacetylase inhibitor butyrate alone or in combination with vitamin A against
proliferation of MCF-7 human breast cancer cells. Brazilian journal of medical and
biological research = Revista brasileira de pesquisas medicas e biologicas /
Sociedade Brasileira de Biofisica [et al] 2012; 45(9): 841-850 [PMID: 22714808
PMCID: 3854326]
139 Mack GS. To selectivity and beyond. Nature biotechnology 2010; 28(12): 1259-1266
[PMID: 21139608 DOI: 10.1038/nbt.1724]
140 Metzger E, Wissmann M, Yin N, Muller JM, Schneider R, Peters AH, Gunther T,
Buettner R, Schule R. LSD1 demethylates repressive histone marks to promote
androgen-receptor-dependent transcription. Nature 2005; 437(7057): 436-439 [PMID:
16079795 DOI: 10.1038/nature04020]
141 Lim S, Janzer A, Becker A, Zimmer A, Schule R, Buettner R, Kirfel J. Lysine-specific
demethylase 1 (LSD1) is highly expressed in ER-negative breast cancers and a
Bibliography
151
biomarker predicting aggressive biology. Carcinogenesis 2010; 31(3): 512-520
[PMID: 20042638 DOI: 10.1093/carcin/bgp324]
142 Schulte JH, Lim S, Schramm A, Friedrichs N, Koster J, Versteeg R, Ora I, Pajtler K,
Klein-Hitpass L, Kuhfittig-Kulle S, Metzger E, Schule R, Eggert A, Buettner R, Kirfel
J. Lysine-specific demethylase 1 is strongly expressed in poorly differentiated
neuroblastoma: implications for therapy. Cancer research 2009; 69(5): 2065-2071
[PMID: 19223552 DOI: 10.1158/0008-5472.CAN-08-1735]
143 Huang Y, Stewart TM, Wu Y, Baylin SB, Marton LJ, Perkins B, Jones RJ, Woster
PM, Casero RA, Jr. Novel oligoamine analogues inhibit lysine-specific demethylase 1
and induce reexpression of epigenetically silenced genes. Clinical cancer research :
an official journal of the American Association for Cancer Research 2009; 15(23):
7217-7228 [PMID: 19934284 PMCID: PMC2927136 DOI: 10.1158/1078-0432.CCR-
09-1293]
144 Wu Y, Steinbergs N, Murray-Stewart T, Marton LJ, Casero RA. Oligoamine
analogues in combination with 2-difluoromethylornithine synergistically induce re-
expression of aberrantly silenced tumour-suppressor genes. The Biochemical journal
2012; 442(3): 693-701 [PMID: 22132744 PMCID: 3286856 DOI:
10.1042/BJ20111271]
145 Wang J, Hevi S, Kurash JK, Lei H, Gay F, Bajko J, Su H, Sun W, Chang H, Xu G,
Gaudet F, Li E, Chen T. The lysine demethylase LSD1 (KDM1) is required for
maintenance of global DNA methylation. Nature genetics 2009; 41(1): 125-129
[PMID: 19098913 DOI: 10.1038/ng.268]
146 Bracken AP, Dietrich N, Pasini D, Hansen KH, Helin K. Genome-wide mapping of
Polycomb target genes unravels their roles in cell fate transitions. Genes &
development 2006; 20(9): 1123-1136 [PMID: 16618801 PMCID: 1472472 DOI:
10.1101/gad.381706]
147 Albert M, Helin K. Histone methyltransferases in cancer. Seminars in cell &
developmental biology 2010; 21(2): 209-220 [PMID: 19892027 DOI:
10.1016/j.semcdb.2009.10.007]
148 Gannon OM, Merida de Long L, Endo-Munoz L, Hazar-Rethinam M, Saunders NA.
Dysregulation of the repressive H3K27 trimethylation mark in head and neck
squamous cell carcinoma contributes to dysregulated squamous differentiation.
Clinical cancer research : an official journal of the American Association for Cancer
Research 2013; 19(2): 428-441 [PMID: 23186778 DOI: 10.1158/1078-0432.CCR-12-
2505]
149 Tan J, Yang X, Zhuang L, Jiang X, Chen W, Lee PL, Karuturi RK, Tan PB, Liu ET,
Yu Q. Pharmacologic disruption of Polycomb-repressive complex 2-mediated gene
repression selectively induces apoptosis in cancer cells. Genes & development 2007;
21(9): 1050-1063 [PMID: 17437993 PMCID: 1855231 DOI: 10.1101/gad.1524107]
150 Wang D, Lippard SJ. Cisplatin-induced post-translational modification of histones H3
and H4. The Journal of biological chemistry 2004; 279(20): 20622-20625 [PMID:
15010460 DOI: 10.1074/jbc.M402547200]
151 Fischer AH, Jacobson KA, Rose J, Zeller R. Hematoxylin and eosin staining of tissue
and cell sections. CSH Protoc 2008; 2008: pdb prot4986 [PMID: 21356829 DOI:
10.1101/pdb.prot4986]
152 Phelan K, May KM. Basic techniques in Mammalian cell tissue culture. Curr Protoc
Cell Biol 2015; 66: 1 1 1-1 1 22 [PMID: 25727327 DOI:
10.1002/0471143030.cb0101s66]
153 Strober W. Trypan blue exclusion test of cell viability. Curr Protoc Immunol 2001;
Appendix 3: Appendix 3B [PMID: 18432654 DOI: 10.1002/0471142735.ima03bs21]

Bibliography
152
154 ittampalam GS CN, Nelson H. Cell Viability Assays. 2013
155 Darzynkiewicz PPaZ. Analysis of Cell Cycle by Flow Cytometry
156 Rio DC. Denaturation and electrophoresis of RNA with formaldehyde. Cold Spring
Harb Protoc 2015; 2015(2): 219-222 [PMID: 25646498 DOI:
10.1101/pdb.prot080994]
157 Staples CJ, Owens DM, Maier JV, Cato AC, Keyse SM. Cross-talk between the
p38alpha and JNK MAPK pathways mediated by MAP kinase phosphatase-1
determines cellular sensitivity to UV radiation. The Journal of biological chemistry
2010; 285(34): 25928-25940 [PMID: 20547488 PMCID: 2923983 DOI:
10.1074/jbc.M110.117911]
158 Shechter D, Dormann HL, Allis CD, Hake SB. Extraction, purification and analysis of
histones. Nature protocols 2007; 2(6): 1445-1457 [PMID: 17545981 DOI:
10.1038/nprot.2007.202]
159 Gallagher SR. One-dimensional SDS gel electrophoresis of proteins. Curr Protoc
Protein Sci 2012; Chapter 10: Unit 10 11 11-44 [PMID: 22470126 DOI:
10.1002/0471140864.ps1001s68]
160 Bartsch H, Arndt C, Koristka S, Cartellieri M, Bachmann M. Silver staining
techniques of polyacrylamide gels. Methods in molecular biology 2012; 869: 481-486
[PMID: 22585513 DOI: 10.1007/978-1-61779-821-4_42]
161 Alexander S, Swatson WS, Alexander H. Pharmacogenetics of resistance to Cisplatin
and other anticancer drugs and the role of sphingolipid metabolism. Methods in
molecular biology 2013; 983: 185-204 [PMID: 23494308 PMCID: PMC3988468 DOI:
10.1007/978-1-62703-302-2_10]
162 Schorn PJ. The European Pharmacopoeia. Med Secoli 1993; 5(1): 103-114 [PMID:
11640140]
163 Chou TC. Drug combination studies and their synergy quantification using the Chou-
Talalay method. Cancer research 2010; 70(2): 440-446 [PMID: 20068163 DOI:
10.1158/0008-5472.CAN-09-1947]
164 Cancer statistics. Jama 2013; 310(9): 982 [PMID: 24002295 DOI:
10.1001/jama.2013.5289]
165 Shrikhande SV, Barreto SG, Talole SD, Vinchurkar K, Annaiah S, Suradkar K, Mehta
S, Goel M. D2 lymphadenectomy is not only safe but necessary in the era of
neoadjuvant chemotherapy. World journal of surgical oncology 2013; 11: 31 [PMID:
23375104 PMCID: 3583696 DOI: 10.1186/1477-7819-11-31]
166 Thies S, Langer R. Tumor regression grading of gastrointestinal carcinomas after
neoadjuvant treatment. Frontiers in oncology 2013; 3: 262 [PMID: 24109590 PMCID:
3791673 DOI: 10.3389/fonc.2013.00262]
167 Wanebo HJ, Kennedy BJ, Chmiel J, Steele G, Jr., Winchester D, Osteen R. Cancer of
the stomach. A patient care study by the American College of Surgeons. Annals of
surgery 1993; 218(5): 583-592 [PMID: 8239772 PMCID: 1243028]
168 Gunderson LL, Sosin H. Adenocarcinoma of the stomach: areas of failure in a re-
operation series (second or symptomatic look) clinicopathologic correlation and
implications for adjuvant therapy. International journal of radiation oncology,
biology, physics 1982; 8(1): 1-11 [PMID: 7061243]
169 Berdasco M, Esteller M. Aberrant epigenetic landscape in cancer: how cellular identity
goes awry. Developmental cell 2010; 19(5): 698-711 [PMID: 21074720 DOI:
10.1016/j.devcel.2010.10.005]
170 Ushijima T. Epigenetic field for cancerization. Journal of biochemistry and molecular
biology 2007; 40(2): 142-150 [PMID: 17394762]
Bibliography
153
171 Nowak SJ, Corces VG. Phosphorylation of histone H3: a balancing act between
chromosome condensation and transcriptional activation. Trends in genetics : TIG
2004; 20(4): 214-220 [PMID: 15041176 DOI: 10.1016/j.tig.2004.02.007]
172 Drobic B, Perez-Cadahia B, Yu J, Kung SK, Davie JR. Promoter chromatin
remodeling of immediate-early genes is mediated through H3 phosphorylation at either
serine 28 or 10 by the MSK1 multi-protein complex. Nucleic acids research 2010;
38(10): 3196-3208 [PMID: 20129940 PMCID: 2879512 DOI: 10.1093/nar/gkq030]
173 Deak M, Clifton AD, Lucocq LM, Alessi DR. Mitogen- and stress-activated protein
kinase-1 (MSK1) is directly activated by MAPK and SAPK2/p38, and may mediate
activation of CREB. The EMBO journal 1998; 17(15): 4426-4441 [PMID: 9687510
PMCID: 1170775 DOI: 10.1093/emboj/17.15.4426]
174 Ibuki Y, Toyooka T, Zhao X, Yoshida I. Cigarette sidestream smoke induces histone
H3 phosphorylation via JNK and PI3K/Akt pathways, leading to the expression of
proto-oncogenes. Carcinogenesis 2014; 35(6): 1228-1237 [PMID: 24398671 DOI:
10.1093/carcin/bgt492]
175 Papachristou DN, Agnanti N, D'Agostino H, Fortner JG. Histologically positive
esophageal margin in the surgical treatment of gastric cancer. American journal of
surgery 1980; 139(5): 711-713 [PMID: 7468923]
176 Eker R. Carcinomas of the stomach; investigation of the lymphatic spread from gastric
carcinomas after total and partial gastrectomy. Acta chirurgica Scandinavica 1951;
101(2): 112-126 [PMID: 14818627]
177 Pultrum BB, Honing J, Smit JK, van Dullemen HM, van Dam GM, Groen H, Hollema
H, Plukker JT. A critical appraisal of circumferential resection margins in esophageal
carcinoma. Annals of surgical oncology 2010; 17(3): 812-820 [PMID: 19924487
PMCID: 2820690 DOI: 10.1245/s10434-009-0827-4]
178 Reid TD, Chan DS, Roberts SA, Crosby TD, Williams GT, Lewis WG. Prognostic
significance of circumferential resection margin involvement following
oesophagectomy for cancer and the predictive role of endoluminal ultrasonography.
British journal of cancer 2012; 107(12): 1925-1931 [PMID: 23169281 PMCID:
3516692 DOI: 10.1038/bjc.2012.511]
179 Nagtegaal ID, Quirke P. What is the role for the circumferential margin in the modern
treatment of rectal cancer? Journal of clinical oncology : official journal of the
American Society of Clinical Oncology 2008; 26(2): 303-312 [PMID: 18182672 DOI:
10.1200/JCO.2007.12.7027]
180 Novais EN, Demiralp B, Alderete J, Larson MC, Rose PS, Sim FH. Do surgical
margin and local recurrence influence survival in soft tissue sarcomas? Clinical
orthopaedics and related research 2010; 468(11): 3003-3011 [PMID: 20645035
PMCID: 2947688 DOI: 10.1007/s11999-010-1471-9]
181 Priya SR, D'Cruz AK, Pai PS. Cut margins and disease control in oral cancers. Journal
of cancer research and therapeutics 2012; 8(1): 74-79 [PMID: 22531518 DOI:
10.4103/0973-1482.95178]
182 D'Angelica M, Gonen M, Brennan MF, Turnbull AD, Bains M, Karpeh MS. Patterns
of initial recurrence in completely resected gastric adenocarcinoma. Annals of surgery
2004; 240(5): 808-816 [PMID: 15492562 PMCID: 1356486]
183 Ajani JA, Barthel JS, Bekaii-Saab T, Bentrem DJ, D'Amico TA, Das P, Denlinger C,
Fuchs CS, Gerdes H, Hayman JA, Hazard L, Hofstetter WL, Ilson DH, Keswani RN,
Kleinberg LR, Korn M, Meredith K, Mulcahy MF, Orringer MB, Osarogiagbon RU,
Posey JA, Sasson AR, Scott WJ, Shibata S, Strong VE, Washington MK, Willett C,
Wood DE, Wright CD, Yang G, Panel NGC. Gastric cancer. Journal of the National
Comprehensive Cancer Network : JNCCN 2010; 8(4): 378-409 [PMID: 20410333]

Bibliography
154
184 Ando T, Yoshida T, Enomoto S, Asada K, Tatematsu M, Ichinose M, Sugiyama T,
Ushijima T. DNA methylation of microRNA genes in gastric mucosae of gastric
cancer patients: its possible involvement in the formation of epigenetic field defect.
International journal of cancer Journal international du cancer 2009; 124(10): 2367-
2374 [PMID: 19165869 DOI: 10.1002/ijc.24219]
185 Stypula-Cyrus Y, Damania D, Kunte DP, Cruz MD, Subramanian H, Roy HK,
Backman V. HDAC up-regulation in early colon field carcinogenesis is involved in
cell tumorigenicity through regulation of chromatin structure. PloS one 2013; 8(5):
e64600 [PMID: 23724067 PMCID: 3665824 DOI: 10.1371/journal.pone.0064600]
186 Cherkezyan L, Stypula-Cyrus Y, Subramanian H, White C, Dela Cruz M, Wali RK,
Goldberg MJ, Bianchi LK, Roy HK, Backman V. Nanoscale changes in chromatin
organization represent the initial steps of tumorigenesis: a transmission electron
microscopy study. BMC cancer 2014; 14: 189 [PMID: 24629088 PMCID: 3995586
DOI: 10.1186/1471-2407-14-189]
187 Takeshima H, Niwa T, Takahashi T, Wakabayashi M, Yamashita S, Ando T, Inagawa
Y, Taniguchi H, Katai H, Sugiyama T, Kiyono T, Ushijima T. Frequent involvement
of chromatin remodeler alterations in gastric field cancerization. Cancer letters 2015;
357(1): 328-338 [PMID: 25462860 DOI: 10.1016/j.canlet.2014.11.038]
188 Tetzlaff MT, Curry JL, Ivan D, Wang WL, Torres-Cabala CA, Bassett RL, Valencia
KM, McLemore MS, Ross MI, Prieto VG. Immunodetection of phosphohistone H3 as
a surrogate of mitotic figure count and clinical outcome in cutaneous melanoma.
Modern pathology : an official journal of the United States and Canadian Academy of
Pathology, Inc 2013; 26(9): 1153-1160 [PMID: 23558574 DOI:
10.1038/modpathol.2013.59]
189 Soloaga A, Thomson S, Wiggin GR, Rampersaud N, Dyson MH, Hazzalin CA,
Mahadevan LC, Arthur JS. MSK2 and MSK1 mediate the mitogen- and stress-induced
phosphorylation of histone H3 and HMG-14. The EMBO journal 2003; 22(11): 2788-
2797 [PMID: 12773393 PMCID: 156769 DOI: 10.1093/emboj/cdg273]
190 Fujimori Y, Inokuchi M, Takagi Y, Kato K, Kojima K, Sugihara K. Prognostic value
of RKIP and p-ERK in gastric cancer. Journal of experimental & clinical cancer
research : CR 2012; 31: 30 [PMID: 22463874 PMCID: 3351370 DOI: 10.1186/1756-
9966-31-30]
191 Maroni PD, Koul S, Meacham RB, Koul HK. Mitogen Activated Protein kinase signal
transduction pathways in the prostate. Cell communication and signaling : CCS 2004;
2(1): 5 [PMID: 15219238 PMCID: 449737 DOI: 10.1186/1478-811X-2-5]
192 Tsai PW, Shiah SG, Lin MT, Wu CW, Kuo ML. Up-regulation of vascular endothelial
growth factor C in breast cancer cells by heregulin-beta 1. A critical role of
p38/nuclear factor-kappa B signaling pathway. The Journal of biological chemistry
2003; 278(8): 5750-5759 [PMID: 12471041 DOI: 10.1074/jbc.M204863200]
193 Kumar B, Koul S, Petersen J, Khandrika L, Hwa JS, Meacham RB, Wilson S, Koul
HK. p38 mitogen-activated protein kinase-driven MAPKAPK2 regulates invasion of
bladder cancer by modulation of MMP-2 and MMP-9 activity. Cancer research 2010;
70(2): 832-841 [PMID: 20068172 DOI: 10.1158/0008-5472.CAN-09-2918]
194 Iyoda K, Sasaki Y, Horimoto M, Toyama T, Yakushijin T, Sakakibara M, Takehara T,
Fujimoto J, Hori M, Wands JR, Hayashi N. Involvement of the p38 mitogen-activated
protein kinase cascade in hepatocellular carcinoma. Cancer 2003; 97(12): 3017-3026
[PMID: 12784337 DOI: 10.1002/cncr.11425]
195 Greenberg AK, Basu S, Hu J, Yie TA, Tchou-Wong KM, Rom WN, Lee TC. Selective
p38 activation in human non-small cell lung cancer. American journal of respiratory
Bibliography
155
cell and molecular biology 2002; 26(5): 558-564 [PMID: 11970907 DOI:
10.1165/ajrcmb.26.5.4689]
196 Elenitoba-Johnson KS, Jenson SD, Abbott RT, Palais RA, Bohling SD, Lin Z, Tripp S,
Shami PJ, Wang LY, Coupland RW, Buckstein R, Perez-Ordonez B, Perkins SL, Dube
ID, Lim MS. Involvement of multiple signaling pathways in follicular lymphoma
transformation: p38-mitogen-activated protein kinase as a target for therapy.
Proceedings of the National Academy of Sciences of the United States of America
2003; 100(12): 7259-7264 [PMID: 12756297 PMCID: 165863 DOI:
10.1073/pnas.1137463100]
197 Liu RY, Fan C, Liu G, Olashaw NE, Zuckerman KS. Activation of p38 mitogen-
activated protein kinase is required for tumor necrosis factor-alpha -supported
proliferation of leukemia and lymphoma cell lines. The Journal of biological chemistry
2000; 275(28): 21086-21093 [PMID: 10783388 DOI: 10.1074/jbc.M001281200]
198 Fox JG, Wang TC. Inflammation, atrophy, and gastric cancer. The Journal of clinical
investigation 2007; 117(1): 60-69 [PMID: 17200707 PMCID: 1716216 DOI:
10.1172/JCI30111]
199 Kabir S, Daar GA. Serum levels of interleukin-1, interleukin-6 and tumour necrosis
factor-alpha in patients with gastric carcinoma. Cancer letters 1995; 95(1-2): 207-212
[PMID: 7656232]
200 Kumar S, Boehm J, Lee JC. p38 MAP kinases: key signalling molecules as therapeutic
targets for inflammatory diseases. Nature reviews Drug discovery 2003; 2(9): 717-726
[PMID: 12951578 DOI: 10.1038/nrd1177]
201 Shrikhande SV, Shukla PJ, Qureshi S, Siddachari R, Upasani V, Ramadwar M,
Kakade AC, Hawaldar R. D2 lymphadenectomy for gastric cancer in Tata Memorial
Hospital: Indian data can now be incorporated in future international trials. Digestive
surgery 2006; 23(3): 192-197 [PMID: 16837811 DOI: 10.1159/000094537]
202 Rosado JO, Henriques JP, Bonatto D. A systems pharmacology analysis of major
chemotherapy combination regimens used in gastric cancer treatment: predicting
potential new protein targets and drugs. Current cancer drug targets 2011; 11(7): 849-
869 [PMID: 21762077]
203 Hofmann WA, de Lanerolle P. Nuclear actin: to polymerize or not to polymerize. The
Journal of cell biology 2006; 172(4): 495-496 [PMID: 16476772 PMCID: 2063669
DOI: 10.1083/jcb.200601095]
204 Hofmann WA. Cell and molecular biology of nuclear actin. International review of
cell and molecular biology 2009; 273: 219-263 [PMID: 19215906 DOI:
10.1016/S1937-6448(08)01806-6]
205 Ruan W, Lai M. Actin, a reliable marker of internal control? Clinica chimica acta;
international journal of clinical chemistry 2007; 385(1-2): 1-5 [PMID: 17698053
DOI: 10.1016/j.cca.2007.07.003]
206 Atkins H, Anderson PJ. Actin and tubulin of normal and leukaemic lymphocytes. The
Biochemical journal 1982; 207(3): 535-539 [PMID: 7165706 PMCID: 1153894]
207 Lupberger J, Kreuzer KA, Baskaynak G, Peters UR, le Coutre P, Schmidt CA.
Quantitative analysis of beta-actin, beta-2-microglobulin and porphobilinogen
deaminase mRNA and their comparison as control transcripts for RT-PCR. Molecular
and cellular probes 2002; 16(1): 25-30 [PMID: 12005444 DOI:
10.1006/mcpr.2001.0392]
208 Rubie C, Kempf K, Hans J, Su T, Tilton B, Georg T, Brittner B, Ludwig B, Schilling
M. Housekeeping gene variability in normal and cancerous colorectal, pancreatic,
esophageal, gastric and hepatic tissues. Molecular and cellular probes 2005; 19(2):
101-109 [PMID: 15680211 DOI: 10.1016/j.mcp.2004.10.001]
Bibliography
156
209 Leavitt J, Leavitt A, Attallah AM. Dissimilar modes of expression of beta- and
gamma-actin in normal and leukemic human T lymphocytes. The Journal of biological
chemistry 1980; 255(11): 4984-4987 [PMID: 6966280]
210 Blomberg J, Andersson M, Faldt R. Differential pattern of oncogene and beta-actin
expression in leukaemic cells from AML patients. British journal of haematology
1987; 65(1): 83-86 [PMID: 3468999]
211 Nowak D, Skwarek-Maruszewska A, Zemanek-Zboch M, Malicka-Blaszkiewicz M.
Beta-actin in human colon adenocarcinoma cell lines with different metastatic
potential. Acta biochimica Polonica 2005; 52(2): 461-468 [PMID: 15940343]
212 Xu J, Zhang Z, Chen J, Liu F, Bai L. Overexpression of beta-actin is closely associated
with metastasis of gastric cancer. Hepato-gastroenterology 2013; 60(123): 620-623
[PMID: 23635433 DOI: 10.5754/hge11038]
213 Stournaras C, Stiakaki E, Koukouritaki SB, Theodoropoulos PA, Kalmanti M, Fostinis
Y, Gravanis A. Altered actin polymerization dynamics in various malignant cell types:
evidence for differential sensitivity to cytochalasin B. Biochemical pharmacology
1996; 52(9): 1339-1346 [PMID: 8937443]
214 Hemstreet GP, 3rd, Rao J, Hurst RE, Bonner RB, Waliszewski P, Grossman HB,
Liebert M, Bane BL. G-actin as a risk factor and modulatable endpoint for cancer
chemoprevention trials. Journal of cellular biochemistry Supplement 1996; 25: 197-
204 [PMID: 9027619]
215 Jordan MA, Wilson L. Microtubules and actin filaments: dynamic targets for cancer
chemotherapy. Current opinion in cell biology 1998; 10(1): 123-130 [PMID: 9484604]
216 Schneider CA, Rasband WS, Eliceiri KW. NIH Image to ImageJ: 25 years of image
analysis. Nature methods 2012; 9(7): 671-675 [PMID: 22930834]
217 Quitschke WW, Lin ZY, DePonti-Zilli L, Paterson BM. The beta actin promoter. High
levels of transcription depend upon a CCAAT binding factor. The Journal of
biological chemistry 1989; 264(16): 9539-9546 [PMID: 2722849]
218 Leof EB, Proper JA, Getz MJ, Moses HL. Transforming growth factor type beta
regulation of actin mRNA. Journal of cellular physiology 1986; 127(1): 83-88 [PMID:
3457016 DOI: 10.1002/jcp.1041270111]
219 Keski-Oja J, Raghow R, Sawdey M, Loskutoff DJ, Postlethwaite AE, Kang AH,
Moses HL. Regulation of mRNAs for type-1 plasminogen activator inhibitor,
fibronectin, and type I procollagen by transforming growth factor-beta. Divergent
responses in lung fibroblasts and carcinoma cells. The Journal of biological chemistry
1988; 263(7): 3111-3115 [PMID: 3125175]
220 Elder PK, Schmidt LJ, Ono T, Getz MJ. Specific stimulation of actin gene
transcription by epidermal growth factor and cycloheximide. Proceedings of the
National Academy of Sciences of the United States of America 1984; 81(23): 7476-
7480 [PMID: 6334309 PMCID: 392169]
221 Takagi T, Iio A, Nakagawa Y, Naoe T, Tanigawa N, Akao Y. Decreased expression of
microRNA-143 and -145 in human gastric cancers. Oncology 2009; 77(1): 12-21
[PMID: 19439999 DOI: 10.1159/000218166]
222 Szczyrba J, Loprich E, Wach S, Jung V, Unteregger G, Barth S, Grobholz R, Wieland
W, Stohr R, Hartmann A, Wullich B, Grasser F. The microRNA profile of prostate
carcinoma obtained by deep sequencing. Molecular cancer research : MCR 2010;
8(4): 529-538 [PMID: 20353999 DOI: 10.1158/1541-7786.MCR-09-0443]
223 Adams BD, Furneaux H, White BA. The micro-ribonucleic acid (miRNA) miR-206
targets the human estrogen receptor-alpha (ERalpha) and represses ERalpha messenger
RNA and protein expression in breast cancer cell lines. Molecular endocrinology
2007; 21(5): 1132-1147 [PMID: 17312270 DOI: 10.1210/me.2007-0022]
Bibliography
157
224 Sikand K, Singh J, Ebron JS, Shukla GC. Housekeeping gene selection advisory:
glyceraldehyde-3-phosphate dehydrogenase (GAPDH) and beta-actin are targets of
miR-644a. PloS one 2012; 7(10): e47510 [PMID: 23091630 PMCID: 3472982 DOI:
10.1371/journal.pone.0047510]
225 Popow A, Nowak D, Malicka-Blaszkiewicz M. Actin cytoskeleton and beta-actin
expression in correlation with higher invasiveness of selected hepatoma Morris 5123
cells. Journal of physiology and pharmacology : an official journal of the Polish
Physiological Society 2006; 57 Suppl 7: 111-123 [PMID: 17228099]
226 Goidin D, Mamessier A, Staquet MJ, Schmitt D, Berthier-Vergnes O. Ribosomal 18S
RNA prevails over glyceraldehyde-3-phosphate dehydrogenase and beta-actin genes as
internal standard for quantitative comparison of mRNA levels in invasive and
noninvasive human melanoma cell subpopulations. Analytical biochemistry 2001;
295(1): 17-21 [PMID: 11476540 DOI: 10.1006/abio.2001.5171]
227 Peckham M, Miller G, Wells C, Zicha D, Dunn GA. Specific changes to the
mechanism of cell locomotion induced by overexpression of beta-actin. Journal of cell
science 2001; 114(Pt 7): 1367-1377 [PMID: 11257002]
228 Pollard TD, Borisy GG. Cellular motility driven by assembly and disassembly of actin
filaments. Cell 2003; 112(4): 453-465 [PMID: 12600310]
229 Bunnell TM, Burbach BJ, Shimizu Y, Ervasti JM. beta-Actin specifically controls cell
growth, migration, and the G-actin pool. Molecular biology of the cell 2011; 22(21):
4047-4058 [PMID: 21900491 PMCID: 3204067 DOI: 10.1091/mbc.E11-06-0582]
230 Colotta F, Allavena P, Sica A, Garlanda C, Mantovani A. Cancer-related
inflammation, the seventh hallmark of cancer: links to genetic instability.
Carcinogenesis 2009; 30(7): 1073-1081 [PMID: 19468060 DOI:
10.1093/carcin/bgp127]
231 Coussens LM, Werb Z. Inflammatory cells and cancer: think different! The Journal of
experimental medicine 2001; 193(6): F23-26 [PMID: 11257144 PMCID: 2193419]
232 Maekita T, Nakazawa K, Mihara M, Nakajima T, Yanaoka K, Iguchi M, Arii K,
Kaneda A, Tsukamoto T, Tatematsu M, Tamura G, Saito D, Sugimura T, Ichinose M,
Ushijima T. High levels of aberrant DNA methylation in Helicobacter pylori-infected
gastric mucosae and its possible association with gastric cancer risk. Clinical cancer
research : an official journal of the American Association for Cancer Research 2006;
12(3 Pt 1): 989-995 [PMID: 16467114 DOI: 10.1158/1078-0432.CCR-05-2096]
233 Etoh T, Kanai Y, Ushijima S, Nakagawa T, Nakanishi Y, Sasako M, Kitano S,
Hirohashi S. Increased DNA methyltransferase 1 (DNMT1) protein expression
correlates significantly with poorer tumor differentiation and frequent DNA
hypermethylation of multiple CpG islands in gastric cancers. The American journal of
pathology 2004; 164(2): 689-699 [PMID: 14742272 PMCID: 1602280 DOI:
10.1016/S0002-9440(10)63156-2]
234 Denny WA. DNA-intercalating ligands as anti-cancer drugs: prospects for future
design. Anti-cancer drug design 1989; 4(4): 241-263 [PMID: 2695099]
235 Martinez R, Chacon-Garcia L. The search of DNA-intercalators as antitumoral drugs:
what it worked and what did not work. Current medicinal chemistry 2005; 12(2): 127-
151 [PMID: 15638732]
236 Catalano MG, Fortunati N, Pugliese M, Poli R, Bosco O, Mastrocola R, Aragno M,
Boccuzzi G. Valproic acid, a histone deacetylase inhibitor, enhances sensitivity to
doxorubicin in anaplastic thyroid cancer cells. The Journal of endocrinology 2006;
191(2): 465-472 [PMID: 17088416 DOI: 10.1677/joe.1.06970]
237 Niitsu N, Kasukabe T, Yokoyama A, Okabe-Kado J, Yamamoto-Yamaguchi Y,
Umeda M, Honma Y. Anticancer derivative of butyric acid (Pivalyloxymethyl

Bibliography
158
butyrate) specifically potentiates the cytotoxicity of doxorubicin and daunorubicin
through the suppression of microsomal glycosidic activity. Molecular pharmacology
2000; 58(1): 27-36 [PMID: 10860924]
238 Wittenburg LA, Bisson L, Rose BJ, Korch C, Thamm DH. The histone deacetylase
inhibitor valproic acid sensitizes human and canine osteosarcoma to doxorubicin.
Cancer chemotherapy and pharmacology 2011; 67(1): 83-92 [PMID: 20306194
PMCID: 2916050 DOI: 10.1007/s00280-010-1287-z]
239 Dey P. Chromatin remodeling, cancer and chemotherapy. Current medicinal chemistry
2006; 13(24): 2909-2919 [PMID: 17073637]
240 Yang XJ, Seto E. HATs and HDACs: from structure, function and regulation to novel
strategies for therapy and prevention. Oncogene 2007; 26(37): 5310-5318 [PMID:
17694074 DOI: 10.1038/sj.onc.1210599]
241 Dhanak D, Jackson P. Development and classes of epigenetic drugs for cancer.
Biochemical and biophysical research communications 2014; 455(1-2): 58-69 [PMID:
25016182 DOI: 10.1016/j.bbrc.2014.07.006]
242 Oronsky B, Oronsky N, Scicinski J, Fanger G, Lybeck M, Reid T. Rewriting the
epigenetic code for tumor resensitization: a review. Translational oncology 2014; 7(5):
626-631 [PMID: 25389457 PMCID: 4225689 DOI: 10.1016/j.tranon.2014.08.003]
243 Ahuja N, Easwaran H, Baylin SB. Harnessing the potential of epigenetic therapy to
target solid tumors. The Journal of clinical investigation 2014; 124(1): 56-63 [PMID:
24382390 PMCID: 3871229 DOI: 10.1172/JCI69736]
244 Yoo CB, Jones PA. Epigenetic therapy of cancer: past, present and future. Nature
reviews Drug discovery 2006; 5(1): 37-50 [PMID: 16485345 DOI: 10.1038/nrd1930]
245 Xu WS, Parmigiani RB, Marks PA. Histone deacetylase inhibitors: molecular
mechanisms of action. Oncogene 2007; 26(37): 5541-5552 [PMID: 17694093 DOI:
10.1038/sj.onc.1210620]
246 Kim HJ, Bae SC. Histone deacetylase inhibitors: molecular mechanisms of action and
clinical trials as anti-cancer drugs. American journal of translational research 2011;
3(2): 166-179 [PMID: 21416059 PMCID: 3056563]

Appendix

Appendix
159
Appendix 1: Informed Consent Form
Informed Consent Form
“Identification of post-translational modifications/ variants of histones for
exploitation as biomarker in patients with gastric cancer”
i) Principal Investigator: Dr. Shailesh V. Shrikhande, TMH
Dr. Sanjay Gupta, CRI – ACTREC
ii) Co-Investigator(s) Dr. Parul J. Shukla, Dr. KM Mohandas, TMH
Dr. Shaesta Mehta, Dr. Mukta Ramadwar, TMH
Introduction: You are invited to participate in a study/research/experiment. The purpose
of this study is to find the defects that occur in proteins and genes that cause cancer of
the stomach. We request you to give consent to use tissue that we are going to remove
from your body at the time of your surgical procedure, which will be carried out on you as
a part of your treatment. This tissue will be made available for biomedical research to
find more about cause of cancer and how to better diagnose, treat, or even cure it in the
future. This will not be of any risk to you.
If you agree, a piece of the tumour and the surrounding area along with normal
mucosa of the stomach would be resected. The removal of the small portion of
normal mucosa may cause inflammation that will heal readily and rapidly.
The tissue will be used for research at this institution.
You will not be given the results of any research performed on the tissue.
The research will not benefit you directly, but may benefit someone like you in the future.
The researchers who use the tissue may need to know some things about your health before and after surgery (for example; your age, sex, ethnic group, dietary habits, do you smoke, alcohol intake, what is your diagnosis, how have you been medically treated for your condition, what is your family history?).
Use of your tissue sample and information does not create any right, title, or interest in the tissue or products that may be developed as a result of the research.
Your participation is voluntary.

Appendix
160
You are free to decline or withdraw from participation without giving any reasons and this
will not affect your care or your relation with the treating doctor.
Information
A small portion of your tumour that is removed at the time of surgery will be sent for
biopsy testing. A small portion of this tumour will be used to obtain proteins. These
proteins will be studied in the laboratory.
No extra time will be required to be spent by you in the hospital. You will not suffer any
extra pain for giving the tissue as it will be removed from the tissue taken out during your
operation.
If applicable to your study, list:
All patients who are being operated for stomach cancer will be asked to take part in the
study.
Nobody else will know that you are participating in the study
The portion of the tissue that we are taking from you will be broken down in the
laboratory at ACTREC into small pieces and the protein will be removed for study
Risks
There are no risks to your health by this study as you do not have to undergo any extra
procedure for the removal of the tissue other than the operation. You will have no side
effects as a result of this other than the normal changes that occur after surgery.
Costs
You will not have to pay any extra money for taking part in the study other than the
amount that is paid for the surgery. This study is funded by the Tata Memorial Centre.
Reimbursement for Participation
We will not be reimbursing any money as you are not undergoing any extra procedure
for taking part in the study.
Emergency Medical Treatment (If applicable, add here)
Not applicable

Appendix
161
Benefits
The results of this study will help us to understand the changes that occur in stomach
cancer, a disease that is so common in India.
The results of this study may not directly benefit you, but will help us understand how cancer is caused which may finally help us to find better treatments for stomach cancer in the future.
We may be able to find out whether your disease is a good disease that will allow you a
longer life, or otherwise.
We may be able to find better agents to treat stomach cancer in the future
The most effective treatments used today are the result of clinical trials done in the past.
Confidentiality
The information in the study records will be kept confidential and the clinical charts will
be housed in the TMH/CRS. Data will be stored securely and will be made available only
to persons conducting the study unless you specifically give permission in writing to do
otherwise. No reference will be made in oral or written reports that could link you to the
study. Result of the project will not be communicated to the subject unless deemed
necessary.
Compensation for protocol Related Injury
Not applicable
Contact
If you have questions at any time about the study or the procedures, you may contact the
researcher,
Dr. Shailesh Shrikhande
Office number 21, Department of GI Surgical Oncology
Tata Memorial Hospital, Parel – Mumbai 400 012
Ph No. (022) 27147173
If you have questions about your rights as a participant, contact the member secretary, HEC
Dr. Medha Joshi, Secretary – HEC-II
Digital Lib. Sciences, Tata Memorial Hospital, Parel – Mumbai
Appendix
162
Ph No. (022) 2417 7000
Participation
Your participation in this study is voluntary; you may decline to participate at anytime
without penalty and without loss of benefits to which you are otherwise entitled.
If you withdraw from the study prior to its completion, you will receive the usual standard
of care for your disease, and your non participation will not have any adverse effects on
your subsequent medical treatment or relationship with the treating physician
If you withdraw from the study before data collection is completed, your data will not be
entered in the project report.
Consent
I have read the above information and agree to participate in this study. I have received
a copy of this form.
Participant's name
Participant's signature
Address (capital letters)
Tel No. Date
Witness’s name (print)
Witness’s signature
Tel No Date
PI or the person administering the consent: Name (Print) & signature

Appendix
163
Participant Information Sheet/Glossary
Gastric cancer is a common cancer in India.
It is diagnosed by barium meal and endoscopy
The treatment of gastric cancer is surgery
Chemotherapy is used in patients with advanced cancer and when surgery cannot be done
In this study, you will be given the treatment that is given to all patients with gastric cancer as per the current standards of care
Your treatment and follow up will be at Tata Memorial Hospital
No extra time and cost will be involved
Questionnaire to be given to the participant before administration of
the Informed Consent Form
(This is to ensure that the Participant is now ready for Informed Decision Making)
1. What is the purpose of this study? 2. Who is doing it? 3. How long will the study last? 4. How many other people are included? 5. Do you know why you are chosen to be part of the study? 6. Do you know what tests are going to be done? Are they over and above the usual
tests? 7. What do you have to do? 8. What are the possible side effects? 9. Who will you contact if you face any problem? 10. How will the study affect your daily life? 11. Does the study involve extra time, costs and/or follow up visits? 12. Do you know that the information collected about yourself will be kept
confidential? 13. What will happen if you do not agree to participate?
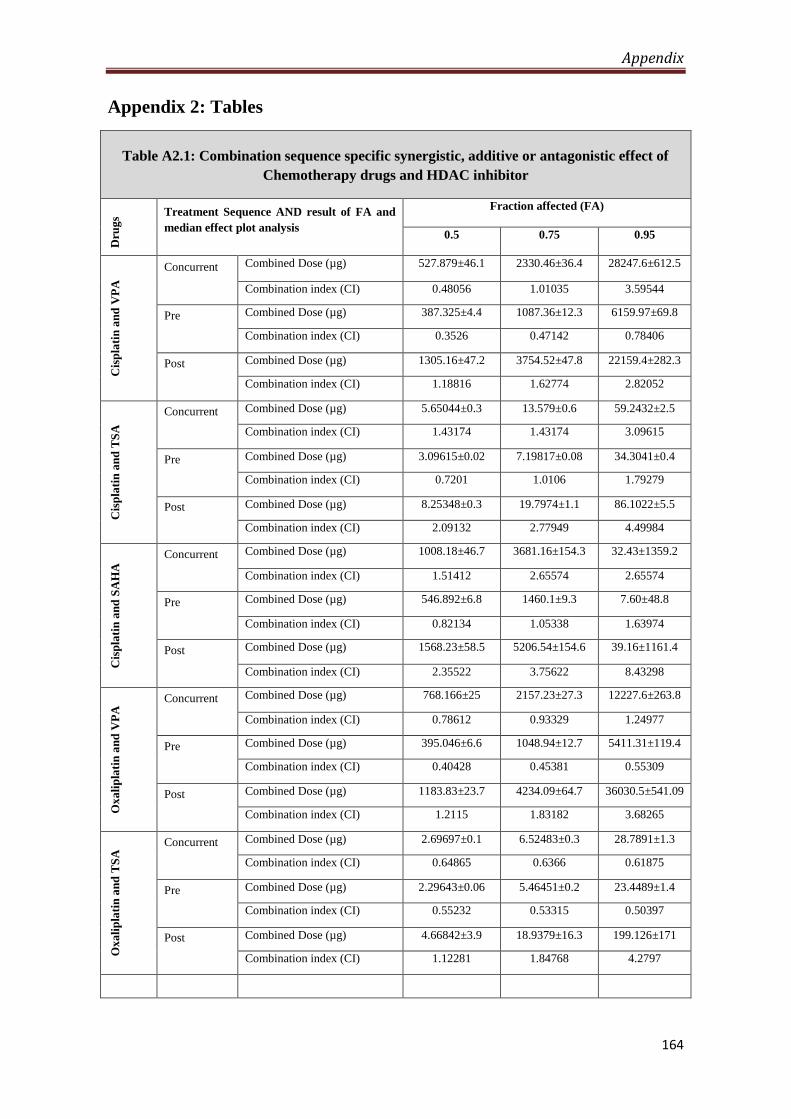
Appendix
164
Appendix 2: Tables
Table A2.1: Combination sequence specific synergistic, additive or antagonistic effect of
Chemotherapy drugs and HDAC inhibitor
Dru
gs
Treatment Sequence AND result of FA and
median effect plot analysis
Fraction affected (FA)
0.5 0.75 0.95
Cis
pla
tin
an
d V
PA
Concurrent Combined Dose (µg) 527.879±46.1 2330.46±36.4
36
28247.6±612.5
Combination index (CI) 0.48056 1.01035 3.59544
Pre Combined Dose (µg) 387.325±4.4 1087.36±12.3 6159.97±69.8
Combination index (CI) 0.3526 0.47142 0.78406
Post Combined Dose (µg) 1305.16±47.2 3754.52±47.8 22159.4±282.3
Combination index (CI) 1.18816 1.62774 2.82052
Cis
pla
tin
an
d T
SA
Concurrent Combined Dose (µg) 5.65044±0.3 13.579±0.6 59.2432±2.5
Combination index (CI) 1.43174 1.43174 3.09615
Pre Combined Dose (µg) 3.09615±0.02 7.19817±0.08 34.3041±0.4
Combination index (CI) 0.7201 1.0106 1.79279
Post Combined Dose (µg) 8.25348±0.3 19.7974±1.1 86.1022±5.5
Combination index (CI) 2.09132 2.77949 4.49984
Cis
pla
tin
an
d S
AH
A Concurrent Combined Dose (µg) 1008.18±46.7 3681.16±154.3 32.43±1359.2
Combination index (CI) 1.51412 2.65574 2.65574
Pre Combined Dose (µg) 546.892±6.8 1460.1±9.3 7.60±48.8
Combination index (CI) 0.82134 1.05338 1.63974
Post Combined Dose (µg) 1568.23±58.5 5206.54±154.6 39.16±1161.4
Combination index (CI) 2.35522 3.75622 8.43298
Ox
ali
pla
tin
an
d V
PA
Concurrent Combined Dose (µg) 768.166±25 2157.23±27.3 12227.6±263.8
Combination index (CI) 0.78612 0.93329 1.24977
Pre Combined Dose (µg) 395.046±6.6 1048.94±12.7 5411.31±119.4
Combination index (CI) 0.40428 0.45381 0.55309
Post Combined Dose (µg) 1183.83±23.7 4234.09±64.7 36030.5±541.09
Combination index (CI) 1.2115 1.83182 3.68265
Ox
ali
pla
tin
an
d T
SA
Concurrent Combined Dose (µg) 2.69697±0.1 6.52483±0.3 28.7891±1.3
Combination index (CI) 0.64865 0.6366 0.61875
Pre Combined Dose (µg) 2.29643±0.06 5.46451±0.2 23.4489±1.4
Combination index (CI) 0.55232 0.53315 0.50397
Post Combined Dose (µg) 4.66842±3.9 18.9379±16.3 199.126±171
Combination index (CI) 1.12281 1.84768 4.2797

Appendix
165
Ox
ali
pla
tin
an
d S
AH
A
Concurrent Combined Dose (µg) 861.884±21.4 3310.03±51.6 31.74±478
Combination index (CI) 1.48934 2.38296 5.26134
Pre Combined Dose (µg) 739.242±10.8 1995.4±52.6 10.58±278.7
Combination index (CI) 1.27741 1.43653 1.75387
Post Combined Dose (µg) 1482.15±74.6 6586.37±302.2 80.71±1682.3
Combination index (CI) 2.56116 4.74167 13.3777
Ep
iru
bic
in a
nd
VP
A
Concurrent Combined Dose (µg) 1963.4±193.6 7387.71±462.4 68459.5±3997.3
Combination index (CI) 1.95315 3.06639 6.59033
Pre Combined Dose (µg) 1278.26±38 3246.62±104.6 15544.4±265
Combination index (CI) 1.27159 1.34756 1.4964
Post Combined Dose (µg) 1997.06±48.9 5397.95±129.7 28693.2±689.6
Combination index (CI) 1.98663 2.24051 2.76218
Ep
iru
bic
in a
nd
TS
A
Concurrent Combined Dose (µg) 0.13966±0.02 0.45355±0.3 3.28193±0.3
Combination index (CI) 0.2358 0.4065 1.06633
Pre Combined Dose (µg) 0.03158±0.004 0.09785±0.02 0.65427±0.05
Combination index (CI) 0.27129 0.32981 0.45981
Post Combined Dose (µg) 0.14882±0.03 0.32325±0.04 1.18996±0.26
Combination index (CI) 0.2358 0.4065 1.06633
Ep
iru
bic
in a
nd
SA
HA
Concurrent Combined Dose (µg) 791.556±25.2 2979.11±115.2 27.61±1902
Combination index (CI) 1.32472 2.04339 4.25583
Pre Combined Dose (µg) 640.884±18.9 1994±66.1 13.42±485.5
Combination index (CI) 1.07256 1.3677 2.06891
Post Combined Dose (µg) 1391.23±82.9 5882.06±214.2 66.30±1016
Combination index (CI) 2.3283 4.03454 10.2169

Appendix
166
Table A2.2: Antibodies used for western blotting
S. No Antibody (Ab) 1º Ab condition Blocking 2º Ab condition
1
H3
Upstate
5% BSA- TBST
60min RT
1:2000 1%BSA -TBST
O/N 4 ̊C
Anti-Mouse
1:5000 5% BSA-TBST
60min RT
2
H3S10P
Millipore 06-570
5% BSA- TBST
60min RT
1:5000 1%BSA-TBST
O/N 4 ̊C
Anti-Rabbit
1:8000 5%BSA-TBST
60min RT
3
H3ac
Upstate
5% Milk- TBST
60min RT
1:3000 1%BSA-TBST
O/N 4 ̊C
Anti-Rabbit
1:8000 5%BSA-TBST
60min RT
4
H3K9ac
1% BSA- TBST
60min RT
1:1500 1%BSA-TBST
O/N 4 ̊C
Anti-Rabbit
1:8000 5%BSA-TBST
60min RT
5
H3K14ac
Abcam 52946
1% BSA -TBST
60min RT
1:2000 1%BSA-TBST
O/N 4 ̊C
Anti-Rabbit
1:8000 5%BSA-TBST
60min RT
6 H3K18
Millipore 07-354
5% BSA- TBST
60min RT
1:2000 1%BSA-TBST
O/N 4 ̊C
Anti-Rabbit
1:8000 5%BSA-TBST
60min RT
7 H3K23ac
Millipore 07-335
5% BSA -TBST
60min RT
1:10000 1%BSA-TBST
O/N 4 ̊C
Anti-Rabbit
1:8000 5%BSA-TBST
60min RT
8 H3K27ac
Abcam 4729
1% BSA -TBST
60min RT
1:3000 1%BSA-TBST
O/N 4 ̊C
Anti-Rabbit
1:8000 5%BSA-TBST
60min RT
9 H3K56ac
Abcam 76309
1% BSA -TBST
60min RT
1:2000 1%BSA-TBST
O/N 4 ̊C
Anti-Rabbit
1:8000 5%BSA-TBST
60min RT
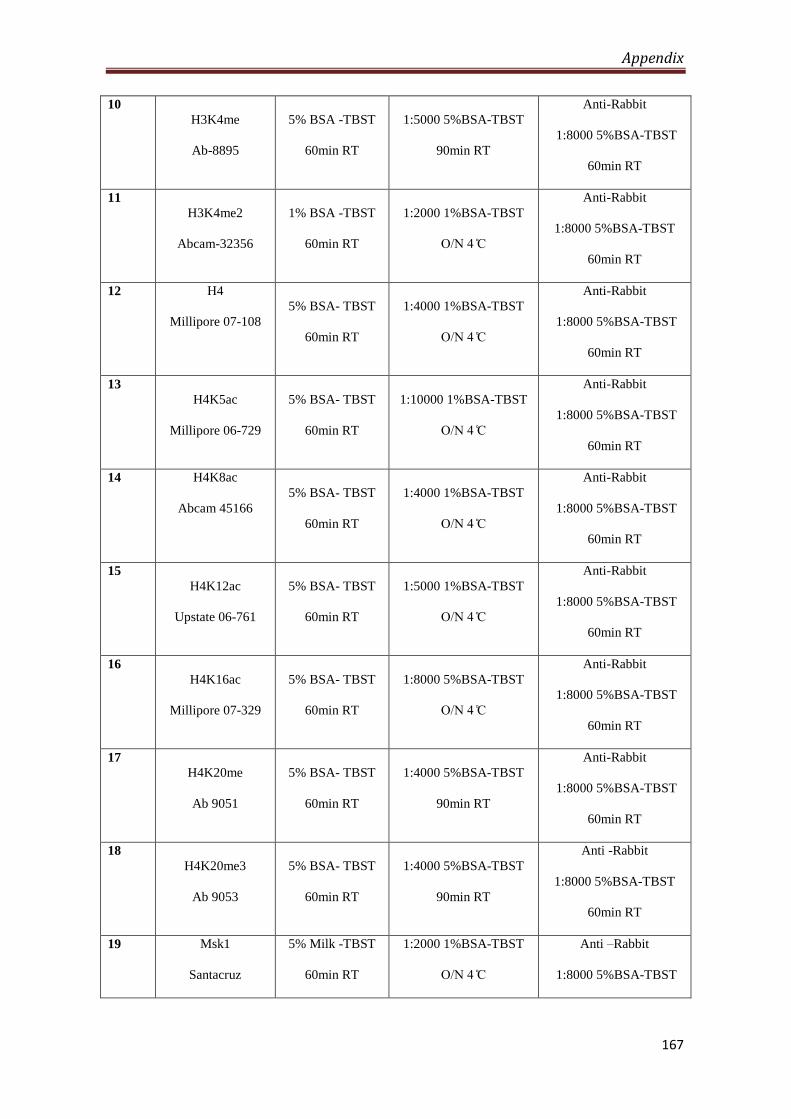
Appendix
167
10
H3K4me
Ab-8895
5% BSA -TBST
60min RT
1:5000 5%BSA-TBST
90min RT
Anti-Rabbit
1:8000 5%BSA-TBST
60min RT
11
H3K4me2
Abcam-32356
1% BSA -TBST
60min RT
1:2000 1%BSA-TBST
O/N 4 ̊C
Anti-Rabbit
1:8000 5%BSA-TBST
60min RT
12 H4
Millipore 07-108
5% BSA- TBST
60min RT
1:4000 1%BSA-TBST
O/N 4 ̊C
Anti-Rabbit
1:8000 5%BSA-TBST
60min RT
13
H4K5ac
Millipore 06-729
5% BSA- TBST
60min RT
1:10000 1%BSA-TBST
O/N 4 ̊C
Anti-Rabbit
1:8000 5%BSA-TBST
60min RT
14 H4K8ac
Abcam 45166
5% BSA- TBST
60min RT
1:4000 1%BSA-TBST
O/N 4 ̊C
Anti-Rabbit
1:8000 5%BSA-TBST
60min RT
15
H4K12ac
Upstate 06-761
5% BSA- TBST
60min RT
1:5000 1%BSA-TBST
O/N 4 ̊C
Anti-Rabbit
1:8000 5%BSA-TBST
60min RT
16
H4K16ac
Millipore 07-329
5% BSA- TBST
60min RT
1:8000 5%BSA-TBST
O/N 4 ̊C
Anti-Rabbit
1:8000 5%BSA-TBST
60min RT
17
H4K20me
Ab 9051
5% BSA- TBST
60min RT
1:4000 5%BSA-TBST
90min RT
Anti-Rabbit
1:8000 5%BSA-TBST
60min RT
18
H4K20me3
Ab 9053
5% BSA- TBST
60min RT
1:4000 5%BSA-TBST
90min RT
Anti -Rabbit
1:8000 5%BSA-TBST
60min RT
19 Msk1
Santacruz
5% Milk -TBST
60min RT
1:2000 1%BSA-TBST
O/N 4 ̊C
Anti –Rabbit
1:8000 5%BSA-TBST
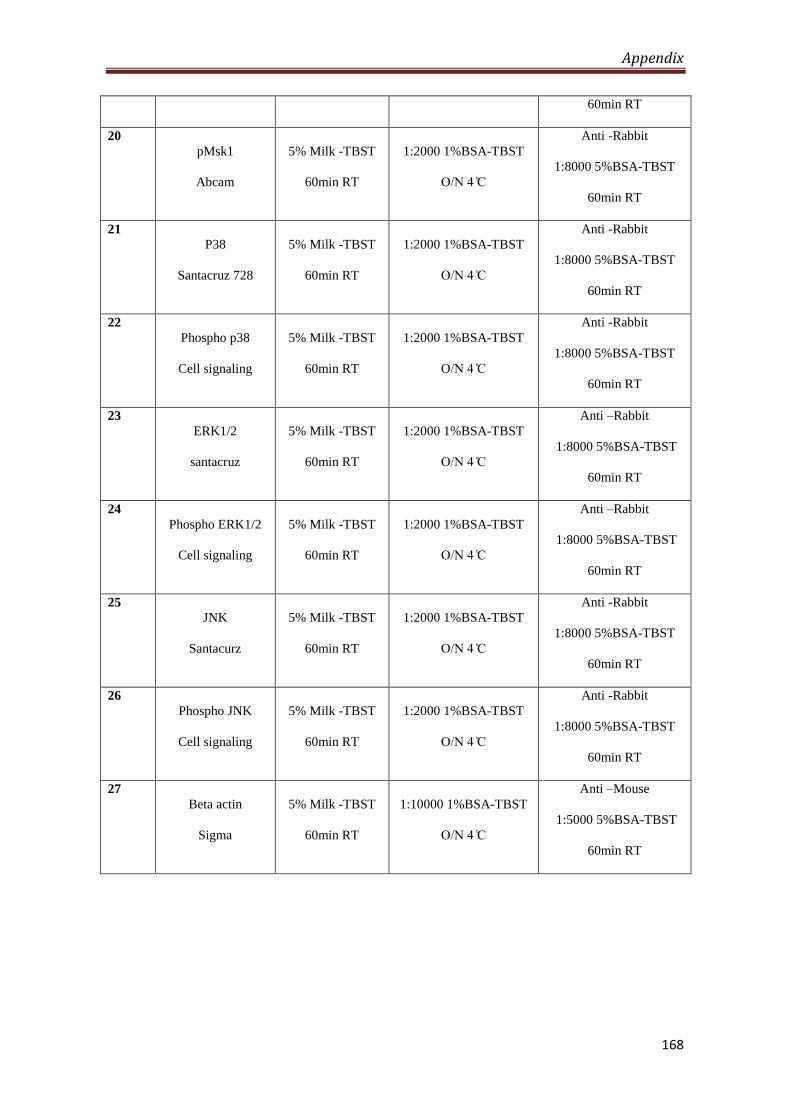
Appendix
168
60min RT
20
pMsk1
Abcam
5% Milk -TBST
60min RT
1:2000 1%BSA-TBST
O/N 4 ̊C
Anti -Rabbit
1:8000 5%BSA-TBST
60min RT
21
P38
Santacruz 728
5% Milk -TBST
60min RT
1:2000 1%BSA-TBST
O/N 4 ̊C
Anti -Rabbit
1:8000 5%BSA-TBST
60min RT
22
Phospho p38
Cell signaling
5% Milk -TBST
60min RT
1:2000 1%BSA-TBST
O/N 4 ̊C
Anti -Rabbit
1:8000 5%BSA-TBST
60min RT
23
ERK1/2
santacruz
5% Milk -TBST
60min RT
1:2000 1%BSA-TBST
O/N 4 ̊C
Anti –Rabbit
1:8000 5%BSA-TBST
60min RT
24
Phospho ERK1/2
Cell signaling
5% Milk -TBST
60min RT
1:2000 1%BSA-TBST
O/N 4 ̊C
Anti –Rabbit
1:8000 5%BSA-TBST
60min RT
25
JNK
Santacurz
5% Milk -TBST
60min RT
1:2000 1%BSA-TBST
O/N 4 ̊C
Anti -Rabbit
1:8000 5%BSA-TBST
60min RT
26
Phospho JNK
Cell signaling
5% Milk -TBST
60min RT
1:2000 1%BSA-TBST
O/N 4 ̊C
Anti -Rabbit
1:8000 5%BSA-TBST
60min RT
27
Beta actin
Sigma
5% Milk -TBST
60min RT
1:10000 1%BSA-TBST
O/N 4 ̊C
Anti –Mouse
1:5000 5%BSA-TBST
60min RT
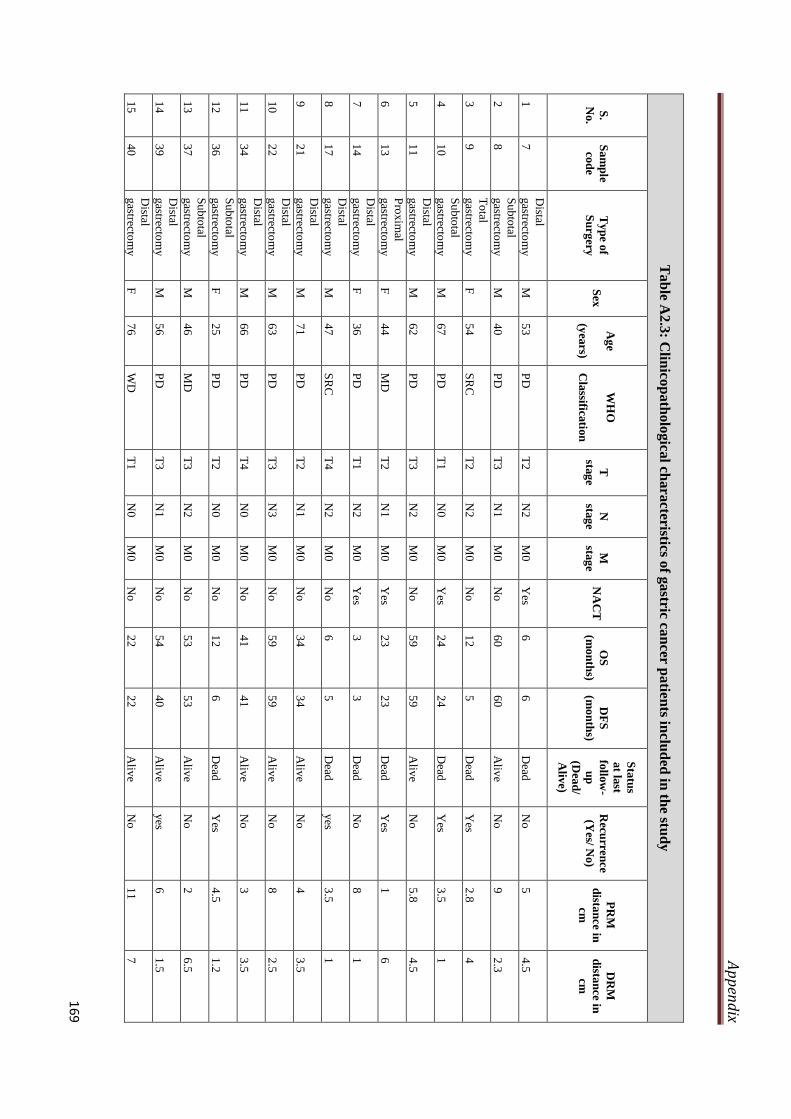
Ap
pen
dix
169
Ta
ble
A2
.3: C
linico
pa
tholo
gica
l chara
cteristics of g
astric ca
ncer p
atien
ts inclu
ded
in th
e stud
y
S.
No.
Sa
mp
le
cod
e
Ty
pe o
f
Su
rgery
S
ex
Ag
e
(yea
rs)
WH
O
Cla
ssificatio
n
T
stag
e
N
stag
e
M
stag
e N
AC
T
OS
(mo
nth
s)
DF
S
(mo
nth
s)
Sta
tus
at la
st
follo
w-
up
(Dea
d/
Aliv
e)
Recu
rren
ce
(Yes/ N
o)
PR
M
dista
nce in
cm
DR
M
dista
nce in
cm
1
7
Distal
gastrecto
my
M
5
3
PD
T
2
N2
M
0
Yes
6
6
Dead
N
o
5
4.5
2
8
Su
bto
tal
gastrecto
my
M
4
0
PD
T
3
N1
M
0
No
6
0
60
Aliv
e
No
9
2
.3
3
9
To
tal
gastrecto
my
F
5
4
SR
C
T2
N
2
M0
No
1
2
5
Dead
Y
es 2
.8
4
4
10
Su
bto
tal
gastrecto
my
M
6
7
PD
T
1
N0
M
0
Yes
24
24
Dead
Y
es 3
.5
1
5
11
Distal
gastrecto
my
M
6
2
PD
T
3
N2
M
0
No
5
9
59
Aliv
e
No
5
.8
4.5
6
13
Pro
xim
al
gastrecto
my
F
4
4
MD
T
2
N1
M
0
Yes
23
23
Dead
Y
es 1
6
7
14
Distal
gastrecto
my
F
3
6
PD
T
1
N2
M
0
Yes
3
3
Dead
N
o
8
1
8
17
Distal
gastrecto
my
M
4
7
SR
C
T4
N
2
M0
No
6
5
D
ead
yes
3.5
1
9
21
Distal
gastrecto
my
M
7
1
PD
T
2
N1
M
0
No
3
4
34
Aliv
e
No
4
3
.5
10
22
Distal
gastrecto
my
M
6
3
PD
T
3
N3
M
0
No
5
9
59
Aliv
e
No
8
2
.5
11
34
Distal
gastrecto
my
M
6
6
PD
T
4
N0
M
0
No
4
1
41
Aliv
e
No
3
3
.5
12
36
Su
bto
tal
gastrecto
my
F
2
5
PD
T
2
N0
M
0
No
1
2
6
Dead
Y
es 4
.5
1.2
13
37
Su
bto
tal
gastrecto
my
M
4
6
MD
T
3
N2
M
0
No
5
3
53
Aliv
e
No
2
6
.5
14
39
Distal
gastrecto
my
M
5
6
PD
T
3
N1
M
0
No
5
4
40
Aliv
e
yes
6
1.5
15
40
Distal
gastrecto
my
F
7
6
WD
T
1
N0
M
0
No
2
2
22
Aliv
e
No
1
1
7

Ap
pen
dix
170
16
42
Distal
gastrecto
my
M
5
1
PD
T
4
N0
M
1
No
1
2
12
Dead
Y
es 6
1
17
45
Distal
gastrecto
my
M
4
6
PD
T
2
N0
M
0
Yes
25
23
Dead
Y
es 2
.8
6
18
46
Distal
gastrecto
my
F
6
1
PD
T
4
N2
M
0
No
2
9
10
Dead
Y
es 6
2
19
47
To
tal
gasterecto
my
M
5
5
PD
T
4
N0
M
1
No
1
2
12
Dead
N
o
10
.5
9.5
20
48
Distal
gastrecto
my
F
5
0
PD
T
1
N0
M
0
No
4
3
43
Aliv
e
No
3
1
.5
21
49
Distal
gastrecto
my
F
2
9
PD
T
4
N3
M
0
No
1
1
D
ead
No
1
4
2.8
22
50
Distal
gastrecto
my
M
3
6
PD
T
4
N0
M
0
Yes
22
17
Dead
yes
6.5
1
.5
23
51
Distal
gastrecto
my
M
4
8
PD
T
3
N1
M
0
Yes
9
6
Dead
yes
9
3
24
52
Pro
xim
al
gastrecto
my
M
7
4
MD
T
3
N0
M
0
Yes
59
59
Aliv
e
No
1
.4
6
25
53
Distal
gastrecto
my
M
4
1
PD
T
3
N0
M
0
No
4
5
45
Aliv
e
No
1
1
10
26
54
Oeso
ph
ago
-
gastrecto
my
M
6
0
MD
T
3
N0
M
0
Yes
50
50
Aliv
e
No
0
.5
7
27
55
Distal
gastrecto
my
M
6
0
MD
T
1
N0
M
0
No
3
0
30
Aliv
e
No
1
7
.5
28
56
Distal rad
ical
gastrecto
my
M
7
9
PD
T
4
N2
M
0
No
1
1
D
ead
No
3
.5
3
29
57
Wed
ge
resection
F
5
0
PD
T
2
N0
M
0
No
4
6
46
Aliv
e
No
1
.5
1.5
30
58
Distal
gastrecto
my
M
5
8
MD
T
1
N1
M
0
No
1
1
D
ead
No
1
0
2.8
31
59
To
tal
gasterecto
my
F
5
7
PD
T
3
N1
M
0
No
6
6
D
ead
No
2
3
32
60
Distal
gastrecto
my
M
5
5
PD
T
4
N3
M
0
No
1
4
14
Aliv
e
No
6
.5
1.5
33
61
Distal
gastrecto
my
F
3
6
PD
T
3
N0
M
0
No
4
3
43
Aliv
e
No
1
2
2.5
34
62
To
tal
gasterecto
my
M
7
2
MD
T
4
N1
M
0
No
1
1
11
Dead
Y
es 9
1
6
35
70
Distal
gastrecto
my
F
3
8
SR
C
T2
N
0
M0
No
5
8
58
Aliv
e
No
1
2.5
1

Ap
pen
dix
171
36
71
Su
bto
tal
radical
gastrecto
my
M
7
3
MD
T
2
N1
M
0
No
5
6
56
Aliv
e
No
4
4
37
73
Su
bto
tal
gastrecto
my
M
4
0
PD
T
3
N1
M
0
No
6
0
60
Aliv
e
No
9
2
.3
38
74
Su
bto
tal
pro
xim
al
gastrecto
my
M
5
3
SR
C
T1
N
0
M0
No
6
0
60
Aliv
e
No
1
2
7
39
75
Su
bto
tal
gastrecto
my
M
5
2
PD
T
3
N0
M
0
No
1
1
D
ead
No
3
.5
1.5
40
76
Distal
gastrecto
my
M
5
1
PD
T
3
N1
M
0
No
1
1
A
live
No
6
2
41
77
Distal
gastrecto
my
F
6
7
MD
T
4
N1
M
0
No
5
7
57
Aliv
e
No
3
4
42
78
Rad
ical gastrec
M
4
6
SR
C
T4
N
2
M0
No
3
1
31
Dead
Y
es 6
1
.5
43
79
Su
bto
tal
gastrecto
my
M
5
3
PD
T
2
N2
M
0
Yes
56
56
Aliv
e
No
1
0
2.5
44
80
Distal o
r
sub
total
gastrecto
my
M
66
MD
T
3
N1
M
0
Yes
6
6
Aliv
e
No
2
.5
5.5
45
81
Distal
gastrecto
my
M
4
7
SR
C
T3
N
0
M0
Yes
28
28
Aliv
e
No
2
.5
0.7
46
82
Distal
gastrecto
my
M
3
7
WD
T
1
N0
M
0
No
5
3
53
Aliv
e
No
4
3
.8
47
83
Oeso
ph
ago
-
gastrecto
my
M
5
7
PD
T
3
N1
M
0
Yes
50
6
Aliv
e
yes
0.5
6
48
84
Distal
Gastrecto
my
M
34
PD
T
1
N1
M
0
No
4
9
49
Aliv
e
No
1
.5
7.5
49
85
Distal
gastrecto
my
M
7
2
PD
T
4
N1
M
0
No
5
5
D
ead
No
4
.5
3
50
86
Su
bto
tal
gastrecto
my
M
6
0
PD
T
4
N0
M
0
No
1
5
15
Aliv
e
No
7
1
.2
51
87
Distal
gastrecto
my
M
7
5
MD
T
2
N2
M
0
No
2
2
D
ead
No
6
4
.5
52
88
To
tal
gastrecto
my
F
4
7
PD
T
3
N3
M
0
Yes
2
2
Dead
N
o
0.5
4
53
90
Su
bto
tal
gastrecto
my
M
7
5
PD
T
4
N3
M
0
No
1
1
D
ead
No
0
.5
5
54
91
Distal
gastrecto
my
F
6
2
SR
C
T3
N
1
M0
No
4
7
47
Aliv
e
No
6
9

Ap
pen
dix
172
55
92
Distal
gastrecto
my
M
5
2
PD
T
4
N0
M
0
No
4
9
49
Aliv
e
No
2
4
.8
56
93
Distal
gastrecto
my
M
6
6
SR
C
T4
N
3
M0
No
1
2
6
Dead
yes
3
1.3
57
94
Pro
xim
al
gastrecto
my
M
5
5
MD
T
3
N1
M
0
Yes
16
16
Aliv
e
No
5
.5
7
58
95
Oeso
ph
ago
-
gastrecto
my
M
2
9
PD
T
4
N1
M
0
Yes
34
34
Aliv
e
No
1
3
.5
59
96
Distal
gastrecto
my
F
5
2
MD
T
3
N0
M
0
Yes
1
1
Dead
N
o
7
1.4
60
97
Distal
gastrecto
my
M
7
4
MD
T
2
N0
M
0
Yes
1
1
Dead
N
o
3
8
61
98
Distal
gastrecto
my
F
3
7
PD
T
2
N3
M
0
Yes
9
9
Aliv
e
No
7
3
62
99
Distal
gastrecto
my
M
6
1
PD
T
2
N1
M
0
No
3
6
36
Aliv
e
No
2
2
63
10
0
Distal
gastrecto
my
M
6
1
PD
T
3
N0
M
0
Yes
28
25
Dead
yes
6
1.2
64
10
2
Distal
gastrecto
my
M
6
4
SR
C
T4
N
2
M0
No
3
3
D
ead
No
3
.5
1.5
65
10
3
Distal
gastrecto
my
M
6
3
MD
T
1
N2
M
0
No
5
5
D
ead
No
7
.5
3.3
66
10
4
Distal
gastrecto
my
M
5
2
PD
T
3
N0
M
0
No
2
7
27
Dead
yes
10
0.7
67
10
5
Distal
gastrecto
my
M
6
2
PD
T
3
N0
M
0
No
2
6
26
Aliv
e
No
6
5
68
10
6
Su
bto
tal
gastrecto
my
F
6
2
PD
T
3
N0
M
0
Yes
19
19
Aliv
e
Yes
5.5
5
.5
69
10
7
Distal
gastrecto
my
M
6
8
MD
T
3
N1
M
0
No
4
7
47
Aliv
e
No
4
6
70
10
8
Distal
gastrecto
my
M
4
9
PD
T
1
N0
M
0
Yes
46
46
Aliv
e
No
4
1
0
71
10
9
Distal
gastrecto
my
M
5
6
PD
T
3
N3
M
0
Yes
13
9
Aliv
e
Yes
3.8
0
.5
72
11
0
Distal
gastrecto
my
M
4
2
MD
T
2
N0
M
0
Yes
44
44
Aliv
e
No
7
2
73
11
1
To
tal
gastrecto
my
M
7
7
PD
T
4
N3
M
0
Yes
1
1
Dead
N
o
7.5
4
.5
74
11
2
Distal
gastrecto
my
F
6
3
PD
T
4
N1
M
0
No
1
1
11
Dead
yes
4
6.5
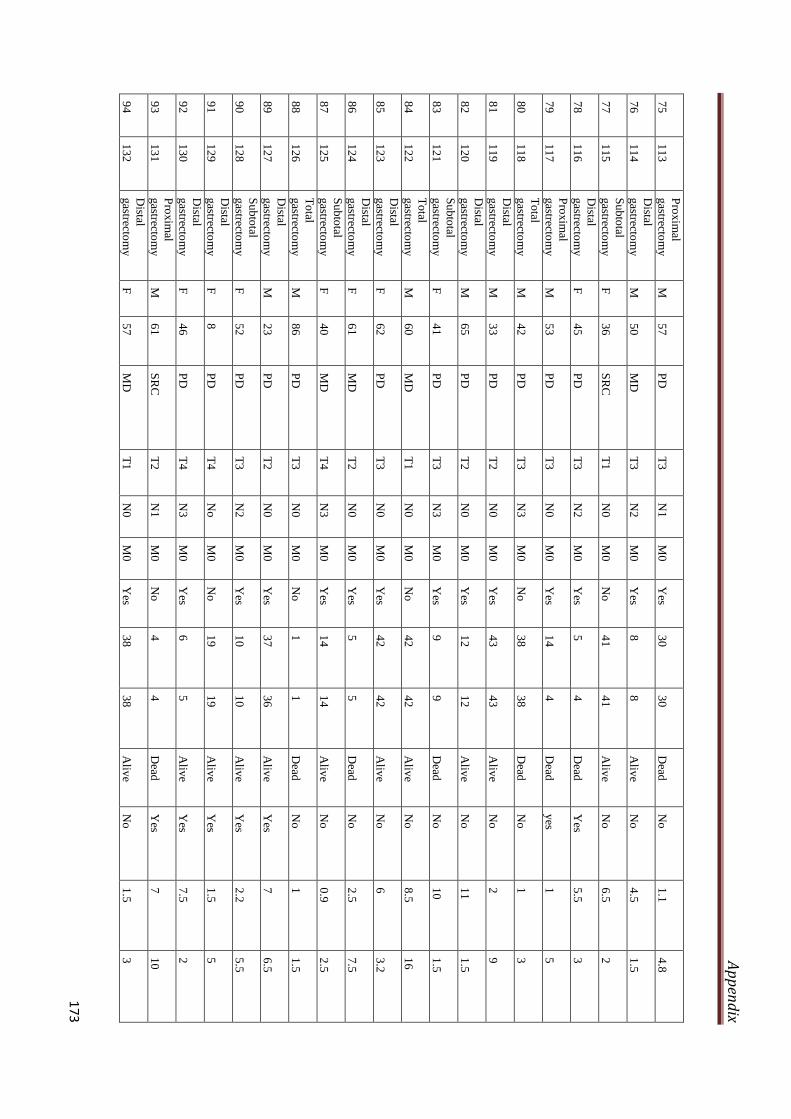
Ap
pen
dix
173
75
11
3
Pro
xim
al
gastrecto
my
M
5
7
PD
T
3
N1
M
0
Yes
30
30
Dead
N
o
1.1
4
.8
76
11
4
Distal
gastrecto
my
M
5
0
MD
T
3
N2
M
0
Yes
8
8
Aliv
e
No
4
.5
1.5
77
11
5
Su
bto
tal
gastrecto
my
F
3
6
SR
C
T1
N
0
M0
No
4
1
41
Aliv
e
No
6
.5
2
78
11
6
Distal
gastrecto
my
F
4
5
PD
T
3
N2
M
0
Yes
5
4
Dead
Y
es 5
.5
3
79
11
7
Pro
xim
al
gastrecto
my
M
5
3
PD
T
3
N0
M
0
Yes
14
4
Dead
yes
1
5
80
11
8
To
tal
gastrecto
my
M
4
2
PD
T
3
N3
M
0
No
3
8
38
Dead
N
o
1
3
81
11
9
Distal
gastrecto
my
M
3
3
PD
T
2
N0
M
0
Yes
43
43
Aliv
e
No
2
9
82
12
0
Distal
gastrecto
my
M
6
5
PD
T
2
N0
M
0
Yes
12
12
Aliv
e
No
1
1
1.5
83
12
1
Su
bto
tal
gastrecto
my
F
4
1
PD
T
3
N3
M
0
Yes
9
9
Dead
N
o
10
1.5
84
12
2
To
tal
gastrecto
my
M
6
0
MD
T
1
N0
M
0
No
4
2
42
Aliv
e
No
8
.5
16
85
12
3
Distal
gastrecto
my
F
6
2
PD
T
3
N0
M
0
Yes
42
42
Aliv
e
No
6
3
.2
86
12
4
Distal
gastrecto
my
F
6
1
MD
T
2
N0
M
0
Yes
5
5
Dead
N
o
2.5
7
.5
87
12
5
Su
bto
tal
gastrecto
my
F
4
0
MD
T
4
N3
M
0
Yes
14
14
Aliv
e
No
0
.9
2.5
88
12
6
To
tal
gastrecto
my
M
8
6
PD
T
3
N0
M
0
No
1
1
D
ead
No
1
1
.5
89
12
7
Distal
gastrecto
my
M
2
3
PD
T
2
N0
M
0
Yes
37
36
Aliv
e
Yes
7
6.5
90
12
8
Su
bto
tal
gastrecto
my
F
5
2
PD
T
3
N2
M
0
Yes
10
10
Aliv
e
Yes
2.2
5
.5
91
12
9
Distal
gastrecto
my
F
8
P
D
T4
N
o
M0
No
1
9
19
Aliv
e
Yes
1.5
5
92
13
0
Distal
gastrecto
my
F
4
6
PD
T
4
N3
M
0
Yes
6
5
Aliv
e
Yes
7.5
2
93
13
1
Pro
xim
al
gastrecto
my
M
6
1
SR
C
T2
N
1
M0
No
4
4
D
ead
Yes
7
10
94
13
2
Distal
gastrecto
my
F
5
7
MD
T
1
N0
M
0
Yes
38
38
Aliv
e
No
1
.5
3

Ap
pen
dix
174
95
13
3
Distal
gastrecto
my
M
3
2
PD
T
2
N2
M
0
Yes
13
7
Dead
Y
es 5
1
.3
96
13
4
Pro
xim
al
gastrecto
my
M
4
3
MD
T
2
N1
M
0
No
1
0
10
Dead
Y
es 0
.3
3.5
97
13
5
Distal
gastrecto
my
M
7
9
PD
T
2
N0
M
0
No
5
6
56
Aliv
e
No
1
0
1.5
98
13
6
Distal
gastrecto
my
M
2
9
PD
T
4
N3
M
0
Yes
12
6
Dead
yes
5.5
2
99
13
7
Distal
gastrecto
my
F
5
1
MD
T
3
N3
M
0
Yes
6
1
Dead
yes
5.5
2
10
0
13
8
Su
bto
tal
gastrecto
my
F
4
4
PD
T
2
N0
M
0
Yes
26
5
Dead
yes
0.5
7
10
1
13
9
Distal
gastrecto
my
M
6
6
MD
T
3
N0
M
0
Yes
31
31
Aliv
e
No
3
8
.5

Ap
pen
dix
175
Ta
ble
A2
.4: S
core fo
r Imm
un
oh
istoch
emistry
an
aly
sis
S. No.
Sample code
Tu
mo
r
Pro
xim
al resectio
n m
arg
in (P
RM
) D
istal rese
ction
ma
rgin
(DR
M)
H3S10ph IHC
H-score
phMSK1 IHC
H-score
β-a
ctin IH
C sco
re
H3S10ph IHC
H-score
phMSK1 IHC
H-score
β-a
ctin IH
C sco
re
H3S10ph IHC
H-score
phMSK1 IHC
H-score
β-a
ctin IH
C sco
re
Epithelial cells
Inflammatory
cells
Epithelial cells
Inflammatory
cells
Epithelial cells
Inflammatory
cells
1
7
12
0
8
0
8
0
2
8
15
5
17
0
3
6
40
40
2
5
12
0
3
9
23
0
10
0
20
0
60
14
9
4
10
11
0
4
7
9
0
1
20
2
5
5
11
90
3
0
6
0
6
13
50
5
5
3
0
7
14
25
0
20
0
35
10
0
44
8
17
80
2
7
5
3
2
6
7
0
9
21
15
0
2
7
9
0
2
6
1
30
10
22
90
2
7
3
0
3
7
8
0
11
34
19
0
1
80
1
90
12
36
16
0
2
7
9
0
3
7
1
55
13
37
60
2
7
6
2
1
0
2
5
14
39
54
4
7
4
0
6
0
4
7
15
40
8
2
8
5
5
16
42
25
0
13
5
2
7
11
5
2
7
1
10
17
45
11
5
2
7
1
10
5
0
2
7
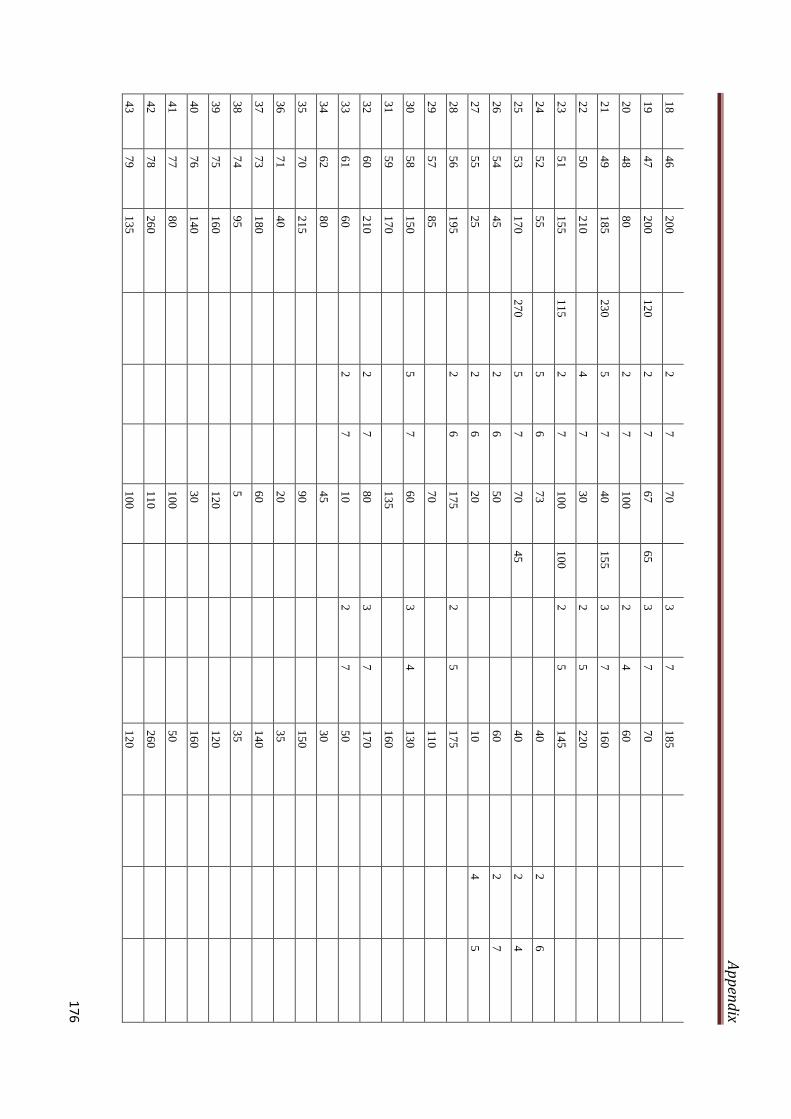
Ap
pen
dix
176
18
46
20
0
2
7
7
0
3
7
1
85
19
47
20
0
12
0
2
7
67
65
3
7
70
20
48
80
2
7
1
00
2
4
6
0
21
49
18
5
23
0
5
7
40
15
5
3
7
16
0
22
50
21
0
4
7
3
0
2
5
2
20
23
51
15
5
11
5
2
7
10
0
10
0
2
5
14
5
24
52
55
5
6
7
3
4
0
2
6
25
53
17
0
27
0
5
7
70
45
40
2
4
26
54
45
2
6
5
0
6
0
2
7
27
55
25
2
6
2
0
1
0
4
5
28
56
19
5
2
6
1
75
2
5
1
75
29
57
85
7
0
1
10
30
58
15
0
5
7
6
0
3
4
1
30
31
59
17
0
1
35
1
60
32
60
21
0
2
7
8
0
3
7
1
70
33
61
60
2
7
1
0
2
7
5
0
34
62
80
4
5
3
0
35
70
21
5
9
0
1
50
36
71
40
2
0
3
5
37
73
18
0
6
0
1
40
38
74
95
5
35
39
75
16
0
1
20
1
20
40
76
14
0
3
0
1
60
41
77
80
1
00
5
0
42
78
26
0
1
10
2
60
43
79
13
5
1
00
1
20

Ap
pen
dix
177
44
80
12
0
1
10
7
5
45
81
28
0
2
20
2
00
46
82
20
1
8
2
0
47
83
60
6
0
3
0
48
84
11
0
1
05
2
0
49
85
10
0
5
0
8
0
50
86
18
5
7
0
1
60
51
87
14
0
6
5
1
30
52
88
16
5
1
50
1
40
53
90
22
0
3
00
8
0
54
91
22
0
7
1
1
10
55
92
55
4
0
2
0
56
93
30
0
2
30
2
85
57
94
90
4
0
1
00
58
95
20
0
2
50
2
00
59
96
60
2
5
5
4
60
97
25
1
0
5
61
98
12
0
4
5
1
00
62
99
60
7
0
7
0
63
10
0
17
0
1
15
2
00
64
10
2
28
5
2
50
2
10
65
10
3
40
2
0
1
00
66
10
4
18
5
9
5
1
70
67
10
5
19
0
7
5
1
20
68
10
6
16
0
1
40
7
0
69
10
7
35
3
0
2
4

Ap
pen
dix
178
70
10
8
10
0
1
00
2
0
71
10
9
16
0
1
00
1
40
72
11
0
50
3
5
1
00
73
11
1
19
0
7
0
5
5
74
11
2
21
0
1
70
1
50
75
11
3
18
0
2
10
9
0
76
11
4
50
1
5
2
0
77
11
5
19
5
3
0
1
10
78
11
6
17
0
1
20
1
45
79
11
7
14
0
1
40
4
0
80
11
8
70
1
00
7
0
81
11
9
65
3
5
1
0
82
12
0
13
0
5
5
1
35
83
12
1
11
0
2
0
1
00
84
12
2
40
1
4
1
0
85
12
3
75
1
5
4
0
86
12
4
30
1
2
2
87
12
5
90
7
2
3
0
88
12
6
15
0
1
50
1
50
89
12
7
12
0
4
0
5
0
90
12
8
19
0
1
80
1
05
91
12
9
20
5
1
30
1
20
92
13
0
19
0
7
0
1
90
93
13
1
30
0
7
5
1
60
94
13
2
50
6
0
4
0
95
13
3
14
0
5
0
1
10

Ap
pen
dix
179
96
13
4
60
1
00
7
0
97
13
5
63
3
0
5
0
98
13
6
16
0
9
5
1
40
99
13
7
70
6
0
8
0
10
0
13
8
10
0
8
0
2
0
10
1
13
9
30
3
5
1
0
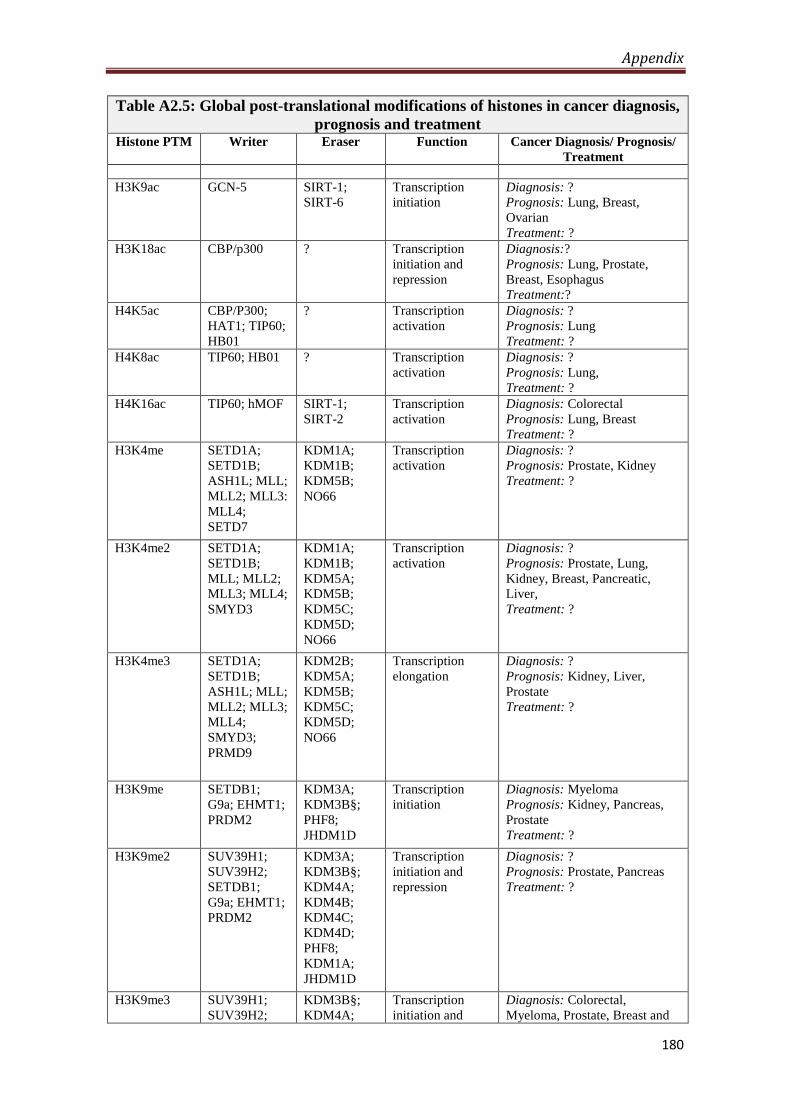
Appendix
180
Table A2.5: Global post-translational modifications of histones in cancer diagnosis,
prognosis and treatment Histone PTM Writer Eraser Function Cancer Diagnosis/ Prognosis/
Treatment
H3K9ac GCN-5 SIRT-1;
SIRT-6
Transcription
initiation
Diagnosis: ?
Prognosis: Lung, Breast,
Ovarian
Treatment: ?
H3K18ac CBP/p300 ? Transcription
initiation and
repression
Diagnosis:?
Prognosis: Lung, Prostate,
Breast, Esophagus
Treatment:?
H4K5ac CBP/P300;
HAT1; TIP60;
HB01
? Transcription
activation
Diagnosis: ?
Prognosis: Lung
Treatment: ?
H4K8ac TIP60; HB01 ? Transcription
activation
Diagnosis: ?
Prognosis: Lung,
Treatment: ?
H4K16ac TIP60; hMOF SIRT-1;
SIRT-2
Transcription
activation
Diagnosis: Colorectal
Prognosis: Lung, Breast
Treatment: ?
H3K4me SETD1A;
SETD1B;
ASH1L; MLL;
MLL2; MLL3:
MLL4;
SETD7
KDM1A;
KDM1B;
KDM5B;
NO66
Transcription
activation
Diagnosis: ?
Prognosis: Prostate, Kidney
Treatment: ?
H3K4me2 SETD1A;
SETD1B;
MLL; MLL2;
MLL3; MLL4;
SMYD3
KDM1A;
KDM1B;
KDM5A;
KDM5B;
KDM5C;
KDM5D;
NO66
Transcription
activation
Diagnosis: ?
Prognosis: Prostate, Lung,
Kidney, Breast, Pancreatic,
Liver,
Treatment: ?
H3K4me3 SETD1A;
SETD1B;
ASH1L; MLL;
MLL2; MLL3;
MLL4;
SMYD3;
PRMD9
KDM2B;
KDM5A;
KDM5B;
KDM5C;
KDM5D;
NO66
Transcription
elongation
Diagnosis: ?
Prognosis: Kidney, Liver,
Prostate
Treatment: ?
H3K9me SETDB1;
G9a; EHMT1;
PRDM2
KDM3A;
KDM3B§;
PHF8;
JHDM1D
Transcription
initiation
Diagnosis: Myeloma
Prognosis: Kidney, Pancreas,
Prostate
Treatment: ?
H3K9me2 SUV39H1;
SUV39H2;
SETDB1;
G9a; EHMT1;
PRDM2
KDM3A;
KDM3B§;
KDM4A;
KDM4B;
KDM4C;
KDM4D;
PHF8;
KDM1A;
JHDM1D
Transcription
initiation and
repression
Diagnosis: ?
Prognosis: Prostate, Pancreas
Treatment: ?
H3K9me3 SUV39H1;
SUV39H2;
KDM3B§;
KDM4A;
Transcription
initiation and
Diagnosis: Colorectal,
Myeloma, Prostate, Breast and
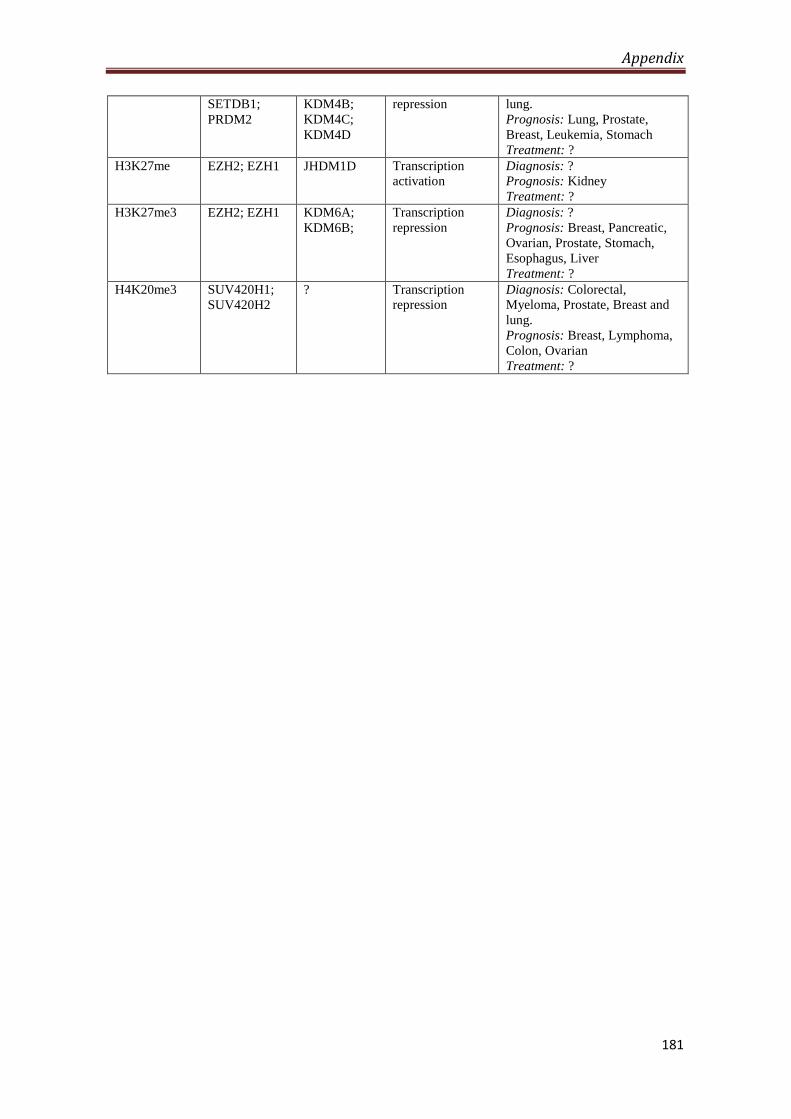
Appendix
181
SETDB1;
PRDM2
KDM4B;
KDM4C;
KDM4D
repression lung.
Prognosis: Lung, Prostate,
Breast, Leukemia, Stomach
Treatment: ?
H3K27me EZH2; EZH1
JHDM1D
Transcription
activation
Diagnosis: ?
Prognosis: Kidney
Treatment: ?
H3K27me3 EZH2; EZH1
KDM6A;
KDM6B;
Transcription
repression
Diagnosis: ?
Prognosis: Breast, Pancreatic,
Ovarian, Prostate, Stomach,
Esophagus, Liver
Treatment: ?
H4K20me3 SUV420H1;
SUV420H2
? Transcription
repression
Diagnosis: Colorectal,
Myeloma, Prostate, Breast and
lung.
Prognosis: Breast, Lymphoma,
Colon, Ovarian
Treatment: ?
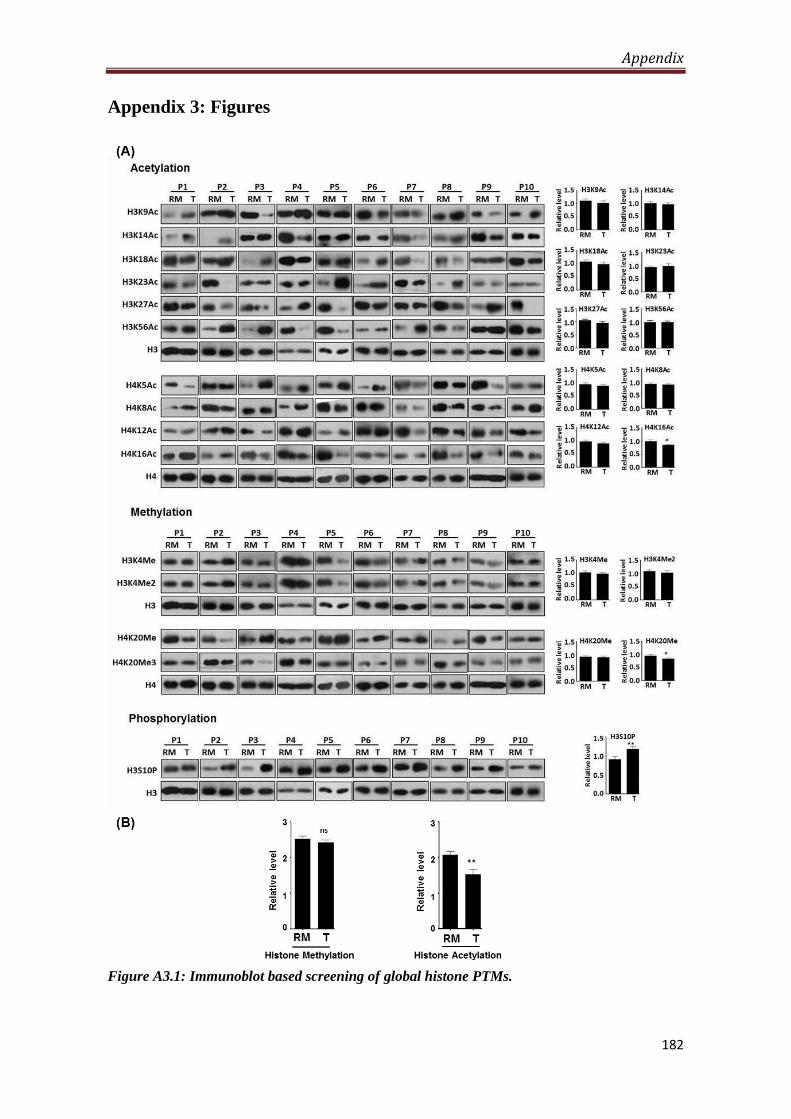
Appendix
182
Appendix 3: Figures
Figure A3.1: Immunoblot based screening of global histone PTMs.
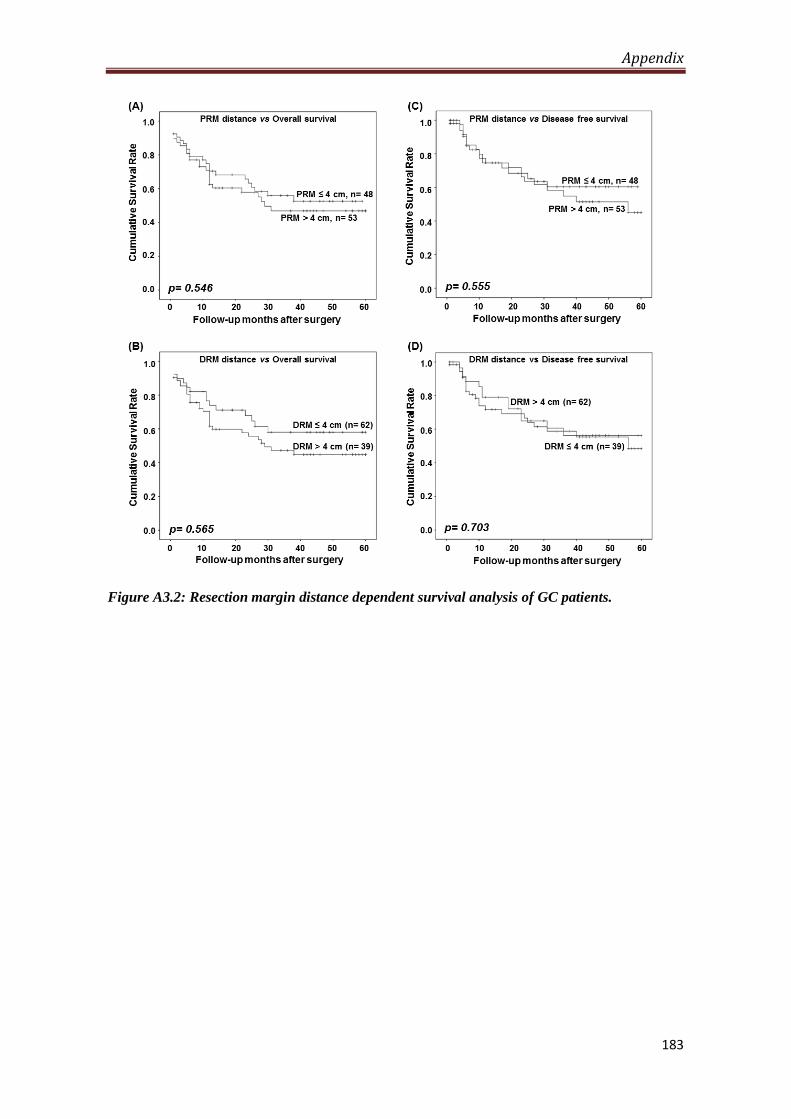
Appendix
183
Figure A3.2: Resection margin distance dependent survival analysis of GC patients.

Published Manuscript(s)
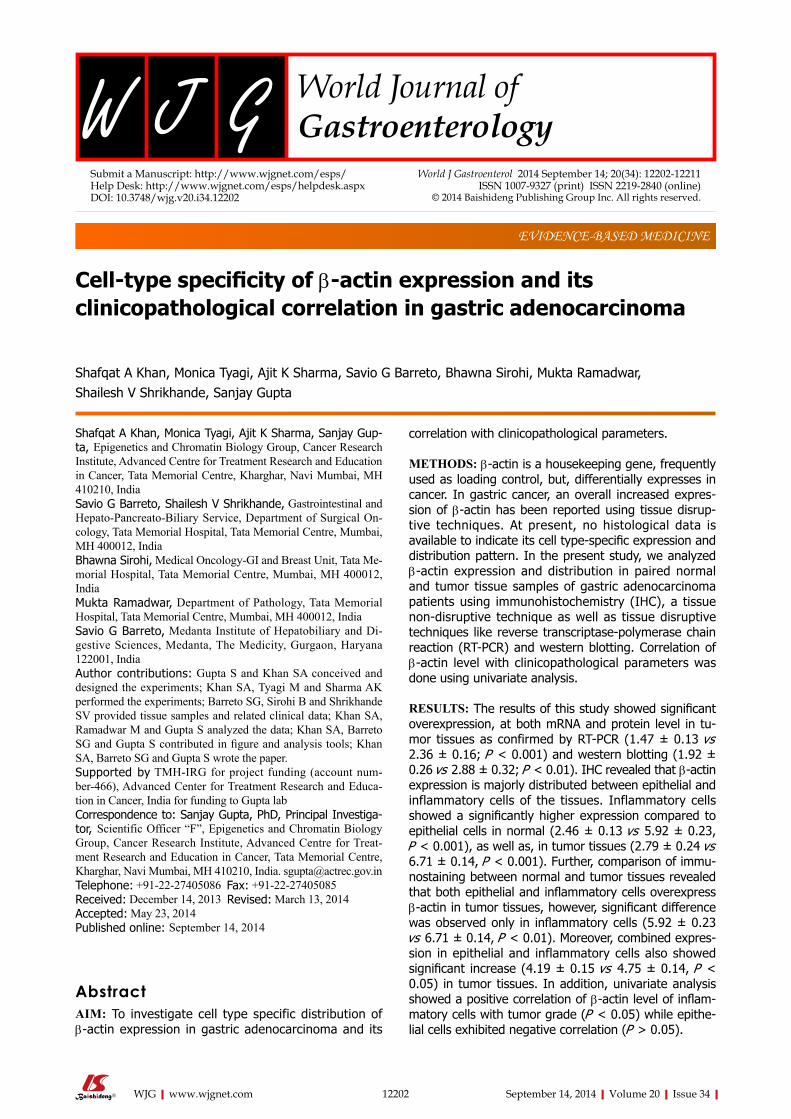
Submit a Manuscript: http://www.wjgnet.com/esps/Help Desk: http://www.wjgnet.com/esps/helpdesk.aspxDOI: 10.3748/wjg.v20.i34.12202
World J Gastroenterol 2014 September 14; 20(34): 12202-12211 ISSN 1007-9327 (print) ISSN 2219-2840 (online)
© 2014 Baishideng Publishing Group Inc. All rights reserved.
12202 September 14, 2014|Volume 20|Issue 34|WJG|www.wjgnet.com
BRIEF ARTICLE
Cell-type specificity of β-actin expression and its clinicopathological correlation in gastric adenocarcinoma
Shafqat A Khan, Monica Tyagi, Ajit K Sharma, Savio G Barreto, Bhawna Sirohi, Mukta Ramadwar, Shailesh V Shrikhande, Sanjay Gupta
Shafqat A Khan, Monica Tyagi, Ajit K Sharma, Sanjay Gup-ta, Epigenetics and Chromatin Biology Group, Cancer Research Institute, Advanced Centre for Treatment Research and Education in Cancer, Tata Memorial Centre, Kharghar, Navi Mumbai, MH 410210, IndiaSavio G Barreto, Shailesh V Shrikhande, Gastrointestinal and Hepato-Pancreato-Biliary Service, Department of Surgical On-cology, Tata Memorial Hospital, Tata Memorial Centre, Mumbai, MH 400012, IndiaBhawna Sirohi, Medical Oncology-GI and Breast Unit, Tata Me-morial Hospital, Tata Memorial Centre, Mumbai, MH 400012, India Mukta Ramadwar, Department of Pathology, Tata Memorial Hospital, Tata Memorial Centre, Mumbai, MH 400012, India Savio G Barreto, Medanta Institute of Hepatobiliary and Di-gestive Sciences, Medanta, The Medicity, Gurgaon, Haryana 122001, IndiaAuthor contributions: Gupta S and Khan SA conceived and designed the experiments; Khan SA, Tyagi M and Sharma AK performed the experiments; Barreto SG, Sirohi B and Shrikhande SV provided tissue samples and related clinical data; Khan SA, Ramadwar M and Gupta S analyzed the data; Khan SA, Barreto SG and Gupta S contributed in figure and analysis tools; Khan SA, Barreto SG and Gupta S wrote the paper.Supported by TMH-IRG for project funding (account num-ber-466), Advanced Center for Treatment Research and Educa-tion in Cancer, India for funding to Gupta labCorrespondence to: Sanjay Gupta, PhD, Principal Investiga-tor, Scientific Officer “F”, Epigenetics and Chromatin Biology Group, Cancer Research Institute, Advanced Centre for Treat-ment Research and Education in Cancer, Tata Memorial Centre, Kharghar, Navi Mumbai, MH 410210, India. [email protected]: +91-22-27405086 Fax: +91-22-27405085Received: December 14, 2013 Revised: March 13, 2014Accepted: May 23, 2014Published online: September 14, 2014
AbstractAIM: To investigate cell type specific distribution of β-actin expression in gastric adenocarcinoma and its
correlation with clinicopathological parameters.
METHODS: β-actin is a housekeeping gene, frequently used as loading control, but, differentially expresses in cancer. In gastric cancer, an overall increased expres-sion of β-actin has been reported using tissue disrup-tive techniques. At present, no histological data is available to indicate its cell type-specific expression and distribution pattern. In the present study, we analyzed β-actin expression and distribution in paired normal and tumor tissue samples of gastric adenocarcinoma patients using immunohistochemistry (IHC), a tissue non-disruptive technique as well as tissue disruptive techniques like reverse transcriptase-polymerase chain reaction (RT-PCR) and western blotting. Correlation of β-actin level with clinicopathological parameters was done using univariate analysis.
RESULTS: The results of this study showed significant overexpression, at both mRNA and protein level in tu-mor tissues as confirmed by RT-PCR (1.47 ± 0.13 vs 2.36 ± 0.16; P < 0.001) and western blotting (1.92 ± 0.26 vs 2.88 ± 0.32; P < 0.01). IHC revealed that β-actin expression is majorly distributed between epithelial and inflammatory cells of the tissues. Inflammatory cells showed a significantly higher expression compared to epithelial cells in normal (2.46 ± 0.13 vs 5.92 ± 0.23, P < 0.001), as well as, in tumor tissues (2.79 ± 0.24 vs 6.71 ± 0.14, P < 0.001). Further, comparison of immu-nostaining between normal and tumor tissues revealed that both epithelial and inflammatory cells overexpress β-actin in tumor tissues, however, significant difference was observed only in inflammatory cells (5.92 ± 0.23 vs 6.71 ± 0.14, P < 0.01). Moreover, combined expres-sion in epithelial and inflammatory cells also showed significant increase (4.19 ± 0.15 vs 4.75 ± 0.14, P < 0.05) in tumor tissues. In addition, univariate analysis showed a positive correlation of β-actin level of inflam-matory cells with tumor grade (P < 0.05) while epithe-lial cells exhibited negative correlation (P > 0.05).
EVIDENCE-BASED MEDICINE
CONCLUSION: In gastric cancer, β-actin showed an overall higher expression predominantly contributed by inflammatory or tumor infiltrating immune cells of the tissue microenvironment and correlates with tumor grade.
© 2014 Baishideng Publishing Group Inc. All rights reserved.
Key words: Gastric cancer; β-actin; Immunohistochem-istry; Epithelial cells; Inflammatory cells; Tumor infiltrat-ing immune cells; Adjacent mucosa; Resection margin
Core tip: Clinical implications of β-actin have been ig-nored despite the reports of its differential expression in cancer. The present study provides first histological evidence of an overall increase in β-actin expression in gastric cancer compared to histologically normal adja-cent mucosa. Inflammatory and epithelial cells of tumor tissues showed differential pattern of β-actin expres-sion and correlated with tumor grade. Further, overex-pression of β-actin was predominantly contributed by inflammatory cells, suggesting further extensive studies to use β-actin as a diagnostic and prognostic biomarker and target of direct or indirect chemotherapeutic inter-vention.
Khan SA, Tyagi M, Sharma AK, Barreto SG, Sirohi B, Ramad-war M, Shrikhande SV, Gupta S. Cell-type specificity of β-actin expression and its clinicopathological correlation in gastric ad-enocarcinoma. World J Gastroenterol 2014; 20(34): 12202-12211 Available from: URL: http://www.wjgnet.com/1007-9327/full/v20/i34/12202.htm DOI: http://dx.doi.org/10.3748/wjg.v20.i34.12202
INTRODUCTIONGastric cancer (GC) incidence and mortality is decreasing over several decades, however, it still remains the fourth most common type of cancer and the second leading cause of cancer related deaths worldwide[1]. In India, there are limited epidemiological studies on gastric cancer which also suffers from the juvenile state of cancer reg-istries and under-reporting of cases. However, similar to global trend, Indian registries have also observed statisti-cally significant reducing trend in stomach cancer cases in last 20-years with approximately 35675 estimated case in 2001; about 3.91% of global incidence[2,3]. A radical D2 gastrectomy and more recently radical surgery along with perioperative chemotherapy holds the best prospect of a cure in gastric cancer[4,5]. However, delayed presentation and thus diagnosis owing to the non-specific symptoms often preclude the possibility of a curative surgical resec-tion making palliative chemotherapy and other measures as the treatment mainstay in these patients. The develop-ment of chemoresistance[6] is also an increasingly appre-ciated phenomenon contributing to the poor outcomes in the disease. Therefore, an improved understanding of
GC molecular biology to ascertain new potential tumor biomarkers useful to guide patient management and de-velop new therapeutic options is essential.
β-actin is a housekeeping gene and an obligatory part of the cell cytoskeleton. It expresses in almost all eukary-otic cells and is involved in controlling basic housekeep-ing functions such as development and maintenance of cell shape, cell migration, cell division, growth and signal-ing. It also plays a critical role in transcriptional regula-tion, mRNA transport, mRNA processing and chromatin remodeling[7,8]. Further, β-actin is also one of the most commonly used endogenous reference loading controls in laboratory techniques to normalize gene and protein expressions as it is believed to have constant expression levels in different cellular, experimental and physiological conditions. However, growing evidences have demon-strated its differential expression in certain situations like growth, ageing, differentiation, developmental stages and diseases like asthma, Alzheimer’s disease, congenital heart disease and cancer[9].
In comparison to normal, an overall differential ex-pression of β-actin is reported in multiple cancers[10-16]. The methodologies used in earlier tissue based studies make it difficult to answer, which specific cell type out of the heterogeneous population of cells in a tissue, is responsible for altered expression of β-actin in cancer. To date, no histological studies have been conducted to provide informations about the pattern of β-actin ex-pression and distribution in different cell types of the normal and tumor tissues. Such information of β-actin expression in a tissue will provide a better understanding of its role in carcinogenesis, its correlation with clini-copathological parameters and its potential to be used as a tumor biomarker or therapeutic target. β-actin po-lymerization or remodeling plays a crucial role in a cell’s physiology and drugs altering the dynamics of β-actin have been studied as potential chemotherapeutic agent, however, clinical implications of these drugs are yet to be established[17-19]. The present study aimed to provide histological evidence of β-actin expression and distribu-tion in specific cell types of gastric adenocarcinoma and its correlation with clinicopathological parameters. A total 31 paired (from the same patient) tumor and cor-responding adjacent histopathologically normal mucosa tissue samples were analyzed using reverse transcription polymerase chain reaction (RT-PCR), western blotting and immunohistochemistry (IHC). We report, an overall higher expression of β-actin in gastric cancer at both mRNA and protein level. Further, as per the best of our knowledge, IHC analysis revealed it for the first time that overall higher expression of β-actin in gastric cancer is majorly contributed by tumor inflammatory cells (5.92 ± 0.23 vs 6.71 ± 0.14, P < 0.01), though, tumor epithelial cells (2.46 ± 0.13 vs 2.79 ± 0.24, P > 0.05) also showed overexpression. Moreover, univariate analysis showed a positive correlation between β-actin levels of inflamma-tory cells and tumor grade (P < 0.05) while epithelial cells exhibited a negative correlation (P > 0.05).
Khan SA et al . Cell-type specific β-actin expression in GC
12203 September 14, 2014|Volume 20|Issue 34|WJG|www.wjgnet.com
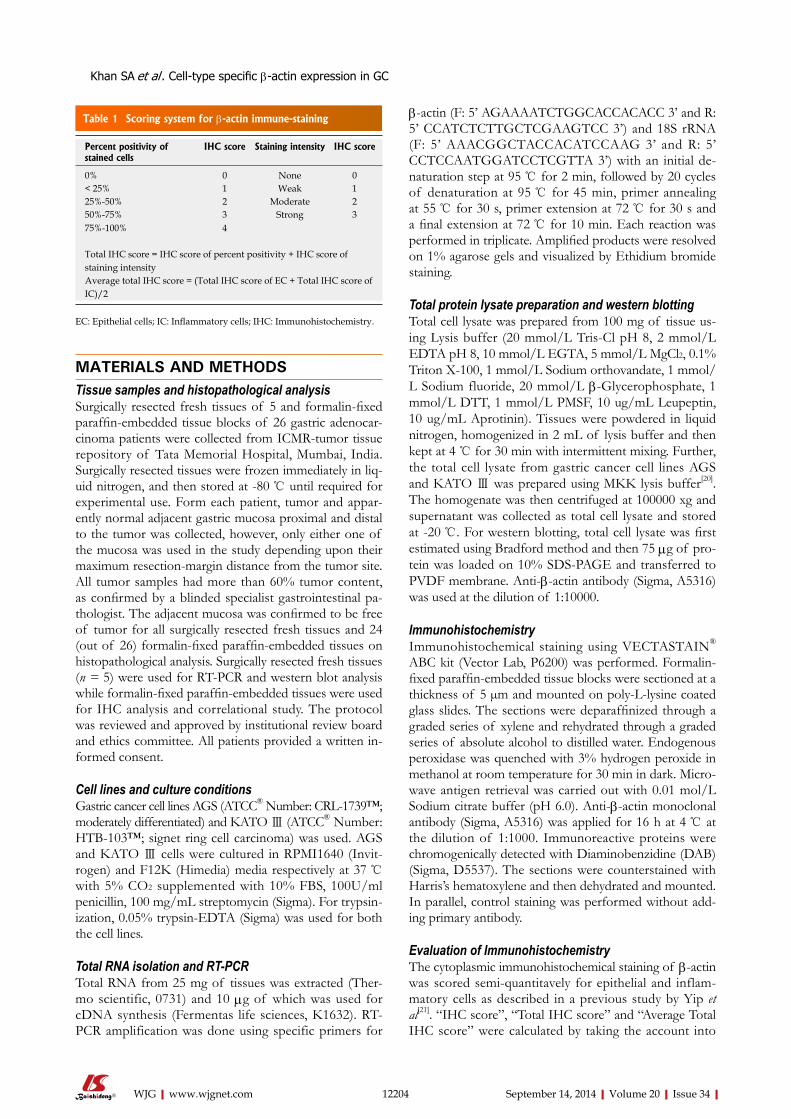
MATERIALS AND METHODSTissue samples and histopathological analysisSurgically resected fresh tissues of 5 and formalin-fixed paraffin-embedded tissue blocks of 26 gastric adenocar-cinoma patients were collected from ICMR-tumor tissue repository of Tata Memorial Hospital, Mumbai, India. Surgically resected tissues were frozen immediately in liq-uid nitrogen, and then stored at -80 ℃ until required for experimental use. Form each patient, tumor and appar-ently normal adjacent gastric mucosa proximal and distal to the tumor was collected, however, only either one of the mucosa was used in the study depending upon their maximum resection-margin distance from the tumor site. All tumor samples had more than 60% tumor content, as confirmed by a blinded specialist gastrointestinal pa-thologist. The adjacent mucosa was confirmed to be free of tumor for all surgically resected fresh tissues and 24 (out of 26) formalin-fixed paraffin-embedded tissues on histopathological analysis. Surgically resected fresh tissues (n = 5) were used for RT-PCR and western blot analysis while formalin-fixed paraffin-embedded tissues were used for IHC analysis and correlational study. The protocol was reviewed and approved by institutional review board and ethics committee. All patients provided a written in-formed consent.
Cell lines and culture conditionsGastric cancer cell lines AGS (ATCC® Number: CRL-1739™; moderately differentiated) and KATO Ⅲ (ATCC® Number: HTB-103™; signet ring cell carcinoma) was used. AGS and KATO Ⅲ cells were cultured in RPMI1640 (Invit-rogen) and F12K (Himedia) media respectively at 37 ℃ with 5% CO2 supplemented with 10% FBS, 100U/ml penicillin, 100 mg/mL streptomycin (Sigma). For trypsin-ization, 0.05% trypsin-EDTA (Sigma) was used for both the cell lines.
Total RNA isolation and RT-PCRTotal RNA from 25 mg of tissues was extracted (Ther-mo scientific, 0731) and 10 µg of which was used for cDNA synthesis (Fermentas life sciences, K1632). RT-PCR amplification was done using specific primers for
β-actin (F: 5’ AGAAAATCTGGCACCACACC 3’ and R: 5’ CCATCTCTTGCTCGAAGTCC 3’) and 18S rRNA (F: 5’ AAACGGCTACCACATCCAAG 3’ and R: 5’ CCTCCAATGGATCCTCGTTA 3’) with an initial de-naturation step at 95 ℃ for 2 min, followed by 20 cycles of denaturation at 95 ℃ for 45 min, primer annealing at 55 ℃ for 30 s, primer extension at 72 ℃ for 30 s and a final extension at 72 ℃ for 10 min. Each reaction was performed in triplicate. Amplified products were resolved on 1% agarose gels and visualized by Ethidium bromide staining.
Total protein lysate preparation and western blottingTotal cell lysate was prepared from 100 mg of tissue us-ing Lysis buffer (20 mmol/L Tris-Cl pH 8, 2 mmol/L EDTA pH 8, 10 mmol/L EGTA, 5 mmol/L MgCl2, 0.1% Triton X-100, 1 mmol/L Sodium orthovandate, 1 mmol/L Sodium fluoride, 20 mmol/L β-Glycerophosphate, 1 mmol/L DTT, 1 mmol/L PMSF, 10 ug/mL Leupeptin, 10 ug/mL Aprotinin). Tissues were powdered in liquid nitrogen, homogenized in 2 mL of lysis buffer and then kept at 4 ℃ for 30 min with intermittent mixing. Further, the total cell lysate from gastric cancer cell lines AGS and KATO Ⅲ was prepared using MKK lysis buffer[20]. The homogenate was then centrifuged at 100000 xg and supernatant was collected as total cell lysate and stored at -20 ℃. For western blotting, total cell lysate was first estimated using Bradford method and then 75 µg of pro-tein was loaded on 10% SDS-PAGE and transferred to PVDF membrane. Anti-β-actin antibody (Sigma, A5316) was used at the dilution of 1:10000.
ImmunohistochemistryImmunohistochemical staining using VECTASTAIN® ABC kit (Vector Lab, P6200) was performed. Formalin-fixed paraffin-embedded tissue blocks were sectioned at a thickness of 5 µm and mounted on poly-L-lysine coated glass slides. The sections were deparaffinized through a graded series of xylene and rehydrated through a graded series of absolute alcohol to distilled water. Endogenous peroxidase was quenched with 3% hydrogen peroxide in methanol at room temperature for 30 min in dark. Micro-wave antigen retrieval was carried out with 0.01 mol/L Sodium citrate buffer (pH 6.0). Anti-β-actin monoclonal antibody (Sigma, A5316) was applied for 16 h at 4 ℃ at the dilution of 1:1000. Immunoreactive proteins were chromogenically detected with Diaminobenzidine (DAB) (Sigma, D5537). The sections were counterstained with Harris’s hematoxylene and then dehydrated and mounted. In parallel, control staining was performed without add-ing primary antibody.
Evaluation of ImmunohistochemistryThe cytoplasmic immunohistochemical staining of β-actin was scored semi-quantitavely for epithelial and inflam-matory cells as described in a previous study by Yip et al[21]. “IHC score”, “Total IHC score” and “Average Total IHC score” were calculated by taking the account into
12204 September 14, 2014|Volume 20|Issue 34|WJG|www.wjgnet.com
Table 1 Scoring system for β-actin immune-staining
Percent positivity of stained cells
IHC score Staining intensity IHC score
0% 0 None 0< 25% 1 Weak 125%-50% 2 Moderate 250%-75% 3 Strong 375%-100% 4
Total IHC score = IHC score of percent positivity + IHC score of staining intensityAverage total IHC score = (Total IHC score of EC + Total IHC score of IC)/2
EC: Epithelial cells; IC: Inflammatory cells; IHC: Immunohistochemistry.
Khan SA et al . Cell-type specific β-actin expression in GC
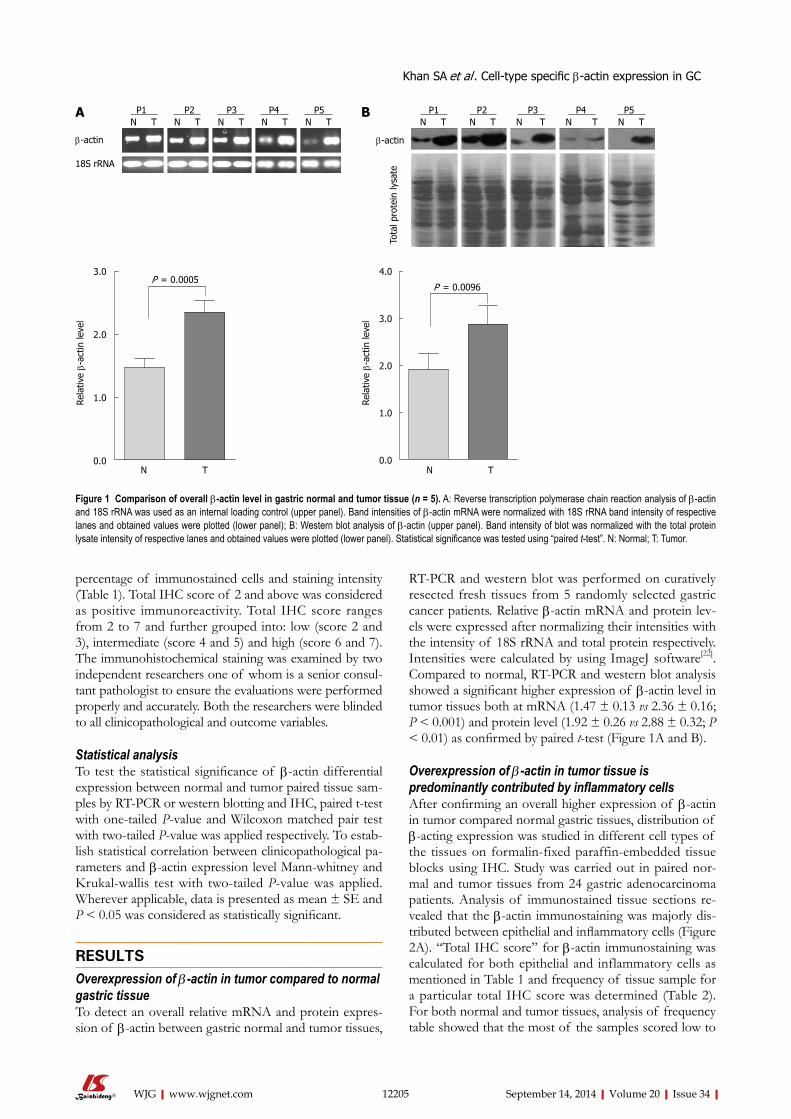
RT-PCR and western blot was performed on curatively resected fresh tissues from 5 randomly selected gastric cancer patients. Relative β-actin mRNA and protein lev-els were expressed after normalizing their intensities with the intensity of 18S rRNA and total protein respectively. Intensities were calculated by using ImageJ software[22]. Compared to normal, RT-PCR and western blot analysis showed a significant higher expression of β-actin level in tumor tissues both at mRNA (1.47 ± 0.13 vs 2.36 ± 0.16; P < 0.001) and protein level (1.92 ± 0.26 vs 2.88 ± 0.32; P < 0.01) as confirmed by paired t-test (Figure 1A and B).
Overexpression of β-actin in tumor tissue is predominantly contributed by inflammatory cellsAfter confirming an overall higher expression of β-actin in tumor compared normal gastric tissues, distribution of β-acting expression was studied in different cell types of the tissues on formalin-fixed paraffin-embedded tissue blocks using IHC. Study was carried out in paired nor-mal and tumor tissues from 24 gastric adenocarcinoma patients. Analysis of immunostained tissue sections re-vealed that the β-actin immunostaining was majorly dis-tributed between epithelial and inflammatory cells (Figure 2A). “Total IHC score” for β-actin immunostaining was calculated for both epithelial and inflammatory cells as mentioned in Table 1 and frequency of tissue sample for a particular total IHC score was determined (Table 2). For both normal and tumor tissues, analysis of frequency table showed that the most of the samples scored low to
percentage of immunostained cells and staining intensity (Table 1). Total IHC score of 2 and above was considered as positive immunoreactivity. Total IHC score ranges from 2 to 7 and further grouped into: low (score 2 and 3), intermediate (score 4 and 5) and high (score 6 and 7). The immunohistochemical staining was examined by two independent researchers one of whom is a senior consul-tant pathologist to ensure the evaluations were performed properly and accurately. Both the researchers were blinded to all clinicopathological and outcome variables.
Statistical analysisTo test the statistical significance of β-actin differential expression between normal and tumor paired tissue sam-ples by RT-PCR or western blotting and IHC, paired t-test with one-tailed P-value and Wilcoxon matched pair test with two-tailed P-value was applied respectively. To estab-lish statistical correlation between clinicopathological pa-rameters and β-actin expression level Mann-whitney and Krukal-wallis test with two-tailed P-value was applied. Wherever applicable, data is presented as mean ± SE and P < 0.05 was considered as statistically significant.
RESULTSOverexpression of β-actin in tumor compared to normal gastric tissueTo detect an overall relative mRNA and protein expres-sion of β-actin between gastric normal and tumor tissues,
12205 September 14, 2014|Volume 20|Issue 34|WJG|www.wjgnet.com
P1 P2 P3 P4 P5N T N T N T N T N T
β-actin
18S rRNA
P1 P2 P3 P4 P5N T N T N T N T N T
β-actin
Tota
l pro
tein
lysa
te
BA
3.0
2.0
1.0
0.0
Rela
tive β-
actin
leve
l
P = 0.0005
N T
4.0
3.0
2.0
1.0
0.0
Rela
tive β-
actin
leve
l
P = 0.0096
N T
Figure 1 Comparison of overall β-actin level in gastric normal and tumor tissue (n = 5). A: Reverse transcription polymerase chain reaction analysis of β-actin and 18S rRNA was used as an internal loading control (upper panel). Band intensities of β-actin mRNA were normalized with 18S rRNA band intensity of respective lanes and obtained values were plotted (lower panel); B: Western blot analysis of β-actin (upper panel). Band intensity of blot was normalized with the total protein lysate intensity of respective lanes and obtained values were plotted (lower panel). Statistical significance was tested using “paired t-test”. N: Normal; T: Tumor.
Khan SA et al . Cell-type specific β-actin expression in GC

Tota
l IH
C sc
ore
intermediate “total IHC score” for β-actin immunostain-ing of epithelial cells while in case of inflammatory cells most of the samples scored Intermediate to high “total IHC score”.
Comparison of “total IHC scores” showed that inflammatory cells express significantly higher level of β-actin compared to the epithelial cells in both normal (2.46 ± 0.13 vs 5.29 ± 0.23, P < 0.001) and tumor (2.76 ± 0.24 vs 6.70 ± 0.14, P < 0.001) tissues as confirmed by
Mann-whitney test (Figure 2B). Furthermore, tumor tis-sues express relatively higher level of β-actin compared to normal in both epithelial and inflammatory cells, however, difference between epithelial cells was not sig-nificant (2.46 ± 0.13 vs 2.79 ± 0.24, P > 0.05) whereas in-flammatory cells differed significantly (5.92 ± 0.23 vs 6.71 ± 0.14, P < 0.01) as confirmed by Wilcoxon matched-pair test (Figure 2B).
As overall β-actin level in a tissue will be a combined
12206 September 14, 2014|Volume 20|Issue 34|WJG|www.wjgnet.com
Normal Tumor
CB
A
8
6
4
2
0EC IC Normal
N T EC + IC
P = 0.00011P = 0.00011
P = 0.09422
P = 0.00352
EC IC Tumor
Avg.
tot
al I
HC
scor
e
6
4
2
0
P = 0.02182
Figure 2 Histological analysis of β-actin in gastric normal and tumor tissues (n = 24). “Total IHC score” and “Average total IHC score” were calculated as de-scribed in Table 1. A: Representative pictures of β-actin immuno-staining of normal (left panel) and tumor (right panel) tissues showed β-actin expression is majorly distributed between epithelial (red arrow) and inflammatory (blue arrow) cells. The image is taken at 20 × magnification; B: “Total IHC score” of EC and IC of normal (N) and tumor (T) tissues were plotted; C: “Average total IHC score” for normal and tumor tissues were plotted. 1Mann-Whitney test; 2Wilcoxon matched pair test. IHC: Immunohistochemistry; EC: Epithelial cells; IC: Inflammatory cells.
Table 2 Frequency of samples with respect to total immunohistochemistry score of β-actin n (%)
β-actin immune-positive cells in tissues Total IHC score (n = 24)
Low Intermediate High
2 3 4 5 6 7
Epithelial cells Normal tissue 15 (63) 7 (29) 2 (8) 0 (0) 0 (0) 0 (0)Tumor tissue 16 (67) 2 (8) 3 (13) 3 (13) 0 (0) 0 (0)
Inflammatory cells
Normal tissue 0 (0) 0 (0) 3 (13) 7 (29) 3 (13) 11 (46)Tumor tissue 0 (0) 0 (0) 1 (4) 0 (0) 4 (17) 19 (79)
IHC: Immunohistochemistry.
Khan SA et al . Cell-type specific β-actin expression in GC
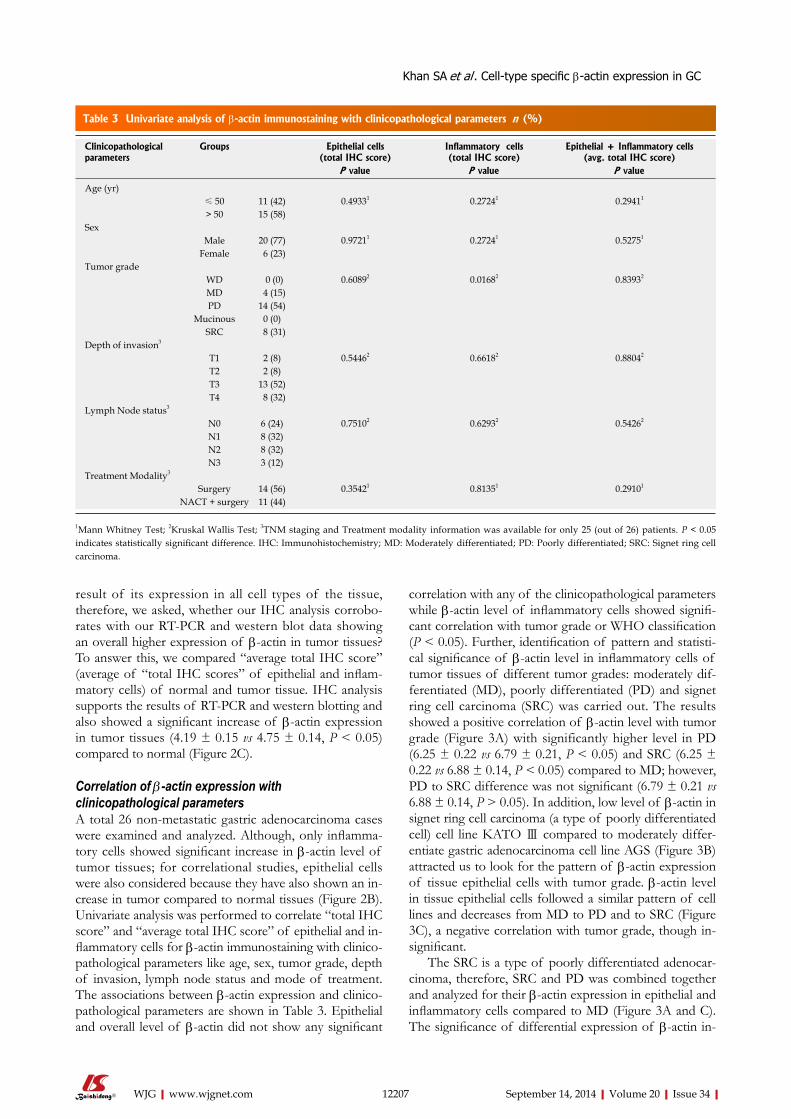
result of its expression in all cell types of the tissue, therefore, we asked, whether our IHC analysis corrobo-rates with our RT-PCR and western blot data showing an overall higher expression of β-actin in tumor tissues? To answer this, we compared “average total IHC score” (average of “total IHC scores” of epithelial and inflam-matory cells) of normal and tumor tissue. IHC analysis supports the results of RT-PCR and western blotting and also showed a significant increase of β-actin expression in tumor tissues (4.19 ± 0.15 vs 4.75 ± 0.14, P < 0.05) compared to normal (Figure 2C).
Correlation of β-actin expression with clinicopathological parametersA total 26 non-metastatic gastric adenocarcinoma cases were examined and analyzed. Although, only inflamma-tory cells showed significant increase in β-actin level of tumor tissues; for correlational studies, epithelial cells were also considered because they have also shown an in-crease in tumor compared to normal tissues (Figure 2B). Univariate analysis was performed to correlate “total IHC score” and “average total IHC score” of epithelial and in-flammatory cells for β-actin immunostaining with clinico-pathological parameters like age, sex, tumor grade, depth of invasion, lymph node status and mode of treatment. The associations between β-actin expression and clinico-pathological parameters are shown in Table 3. Epithelial and overall level of β-actin did not show any significant
correlation with any of the clinicopathological parameters while β-actin level of inflammatory cells showed signifi-cant correlation with tumor grade or WHO classification (P < 0.05). Further, identification of pattern and statisti-cal significance of β-actin level in inflammatory cells of tumor tissues of different tumor grades: moderately dif-ferentiated (MD), poorly differentiated (PD) and signet ring cell carcinoma (SRC) was carried out. The results showed a positive correlation of β-actin level with tumor grade (Figure 3A) with significantly higher level in PD (6.25 ± 0.22 vs 6.79 ± 0.21, P < 0.05) and SRC (6.25 ± 0.22 vs 6.88 ± 0.14, P < 0.05) compared to MD; however, PD to SRC difference was not significant (6.79 ± 0.21 vs 6.88 ± 0.14, P > 0.05). In addition, low level of β-actin in signet ring cell carcinoma (a type of poorly differentiated cell) cell line KATO Ⅲ compared to moderately differ-entiate gastric adenocarcinoma cell line AGS (Figure 3B) attracted us to look for the pattern of β-actin expression of tissue epithelial cells with tumor grade. β-actin level in tissue epithelial cells followed a similar pattern of cell lines and decreases from MD to PD and to SRC (Figure 3C), a negative correlation with tumor grade, though in-significant.
The SRC is a type of poorly differentiated adenocar-cinoma, therefore, SRC and PD was combined together and analyzed for their β-actin expression in epithelial and inflammatory cells compared to MD (Figure 3A and C). The significance of differential expression of β-actin in-
12207 September 14, 2014|Volume 20|Issue 34|WJG|www.wjgnet.com
Table 3 Univariate analysis of β-actin immunostaining with clinicopathological parameters n (%)
Clinicopathological parameters
Groups Epithelial cells (total IHC score)
Inflammatory cells (total IHC score)
Epithelial + Inflammatory cells (avg. total IHC score)
P value P value P value
Age (yr)≤ 50 11 (42) 0.49331 0.27241 0.29411
> 50 15 (58)Sex
Male 20 (77) 0.97211 0.27241 0.52751
Female 6 (23)Tumor grade
WD 0 (0) 0.60892 0.01682 0.83932
MD 4 (15)PD 14 (54)
Mucinous 0 (0)SRC 8 (31)
Depth of invasion3
T1 2 (8) 0.54462 0.66182 0.88042
T2 2 (8)T3 13 (52)T4 8 (32)
Lymph Node status3
N0 6 (24) 0.75102 0.62932 0.54262
N1 8 (32)N2 8 (32)N3 3 (12)
Treatment Modality3
Surgery 14 (56) 0.35421 0.81351 0.29101
NACT + surgery 11 (44)
1Mann Whitney Test; 2Kruskal Wallis Test; 3TNM staging and Treatment modality information was available for only 25 (out of 26) patients. P < 0.05 indicates statistically significant difference. IHC: Immunohistochemistry; MD: Moderately differentiated; PD: Poorly differentiated; SRC: Signet ring cell carcinoma.
Khan SA et al . Cell-type specific β-actin expression in GC

KATO
Ⅲ
creased both in case of inflammatory cells (P = 0.0168 to P = 0.0051) and epithelial cells (P = 0.6089 to P = 0.3922), further confirming the association of β-actin expression with tumor grade in gastric adenocarcinoma.
DISCUSSIONβ-actin has been reported to be differentially expressed in multiple cancers[10-16] and suggested as a possible target for chemotherapy[17-19]. These studies signify the potential of β-actin to be considered as a tumor biomarker. Till date, only overall level of varying expression of β-actin in cancer has been reported at the mRNA and protein level by “tissue disruptive techniques”, where whole tis-sue with heterogeneous population of cells crushed and lysed, therefore, observed differential level of β-actin can not be attributed to a specific cell type. The present study, along with tissue disruptive techniques (RT-PCR and western blotting) provides histological evidences (IHC) of differential expression and distribution of β-actin in different cell types of gastric adenocarcinoma.
β-actin overexpression in tumor compared to normal tissues at mRNA level was most consistent and signifi-cant as evident by comparing P-values of RT-PCR (1.47 ± 0.13 vs 2.36 ± 0.16; P < 0.001) and western blot (1.92 ± 0.26 vs 2.88 ± 0.32; P < 0.01) analysis (Figure 1A and B). Therefore, the significant overexpression of β-actin at mRNA level in gastric cancer suggests its deregula-tion at the level of transcription or mRNA turnover. Earlier reports have also shown β-actin overexpression in colorectal, pancreatic, esophageal, hepatic and gas-tric cancers patients using tissue disruptive techniques. Molecular mechanism of β-actin transcription control is still unclear, however, CpG island hypermethylation of β-actin promoter has been found to be a negative regulator of expression[23]. Further, rapid upregulation in β-actin transcription in response to mitogenic stimuli including epidermal growth factor (EGF), transforming growth factor-β (TGF-β), and platelet derived growth factor[24-26] have also been reported. In addition, miR-145, miR-206 and miR-466a are known to target and degrade β-actin mRNA, therefore, playing a critical role in alter-ing its mRNA turnover[27-30]. Functionally, β-actin plays a predominant role in cell migration as its overexpression is observed in cells with metastatic potential compared to non-metastatic or cells with less metastatic potential; for example, metastatic variants of human colon adenocar-cinoma cell line LS180[15], hepatoma morris 5123[31] and human invasive melanoma cells[32] overexpress β-actin. Collectively, our results along with the existing literature suggest, β-actin transcription is tightly regulated in a nor-mal cell, required for its diverse and critical functions in cell’s physiology and its deregulation may have an impor-tant role in carcinogenesis.
Immunohistochemistry analysis (n = 24) shows an overall increase (4.19 ± 0.15 vs 4.75 ± 0.14, P< 0.05) in β-actin expression in tumor compared to normal gastric
12208 September 14, 2014|Volume 20|Issue 34|WJG|www.wjgnet.com
Tota
l IH
C sc
ore
A
8
6
4
2
0MD PD SRC PD + SRC Inflammatory cells
P = 0.00511
P = 0.04891
P = 0.78441
P = 0.01281
P = 0.01682
Figure 3 Correlation of β-actin expression with tumor grade. A: “Total IHC scores” of β-actin immunostaining in inflammatory cells were correlated with tumor grade; B: β-actin expression between gastric cancer cell lines AGS and KATO Ⅲ was analyzed using western blotting (right panel). Blot intensities were normalized with the intensity of total protein lysate of respective lanes and obtained values from three independent experiments were plotted (left panel); C: “Total IHC scores” of β-actin immunostaining in epithelial cells were correlated with tumor grade. 1Mann-Whitney test; 2Kruskal-Wallis test.
0.5
0.4
0.3
0.2
0.1
0.0
Rela
tive β-
actin
leve
l
β-actin
Tota
l pro
tein
lysa
te
AGS
KATO
Ⅲ
AGS
B
5
4
3
2
1
0
Tota
l IH
C sc
ore
P = 0.39221
P = 0.60892
MD PD SRC PD + SRC Epithelial cells
C
Khan SA et al . Cell-type specific β-actin expression in GC

adenocarcinoma tissues (Figure 2C), this is in conjunction with β-actin profile observed by western blotting (Fig-ure 1B). Further, the expression of the β-actin is mainly distributed between epithelial and inflammatory cells of the tissues with significantly higher level in inflamma-tory cells than their corresponding epithelial cells both in normal (2.46 ± 0.13 vs 5.92 ± 0.23, P <0.001) and tumor tissues (2.79 ± 0.24 vs 6.71 ± 0.14, P < 0.001) (Figure 2A and B). Both epithelial and inflammatory cells of tumor overexpressed β-actin compared to normal tissues, how-ever, only inflammatory cells showed significant increase (5.92 ± 0.23 vs 6.71 ± 0.14, P < 0.01). The increased expression of β-actin of inflammatory cells is in strong correlation with chronic inflammation in gastric cancer[33] which leads to the homing of large number of inflam-matory cells with higher level of β-actin required for im-mediate cytoskeleton rearrangement for the formation of membrane protrusions at the time of their migration[34-36]. This observation is important as inflammation is a key component of the tumor microenvironment, promotes tumor development and being considered as a hallmark of cancer[37,38].
Further, univariate analysis showed β-actin level of tumor inflammatory cells positively correlates (P < 0.05) with tumor grade or poorer differentiation of gastric can-cer while epithelial cells showed an inverse correlation (P > 0.05) (Figure 3A and C). The insignificant correlation of epithelial cells can be attributed to low number of moderately differentiated gastric adenocarcinoma tissue samples (n = 4) with high range of “total IHC score” (3.5 ± 1.5). This correlation indicates toward an important role of β-actin in tumor dedifferentiation. The chronic inflammation in gastric cancer, predominantly caused by Helicobacter pylori infection, is known to promote poorer tumor differentiation and CpG-island hypermethyl-ation[33,39,40] and β-actin promoter hypermethylation downregulates the gene expression[23]. Therefore, the positive correlation of β-actin level of tumor inflamma-tory cells with tumor grade may be due to the persistent inflammation in tumor micro-environment. On the other hand, hypermethylation of β-actin promoter may be a cause of negative correlation of β-actin level of tumor epithelial with tumor grade. Low level of β-actin in gas-tric adenocarcinoma cell line KATO Ⅲ (signet ring cell carcinoma, a type of poorly differentiated cell) compared to AGS (moderately differentiated) (Figure 3B), further strengthens the observation that β-actin level of tumor epithelial cells negatively correlates with poorer tumor differentiation.
In summary, to the best of our knowledge, present study provides first histological evidence of cell type spe-cific distribution of β-actin in normal and tumor gastric tissues. The significant increase in β-actin expression in tumor tissues is due to inflammation, an initial char-acteristic in the stage of gastric cancer progression and positively correlates with tumor grade. Therefore, β-actin may represent a promising biomarker in early diagnosis and prognosis of gastric cancer. However, further studies are needed to explore the relationship of cell type spe-
cific differential expression of β-actin with its functional implications in carcinogenesis and to be used as a chemo-therapeutic target.
ACKNOWLEDGMENTSTMH-IRG for project funding (account number-466); Advanced Center for Treatment Research and Education in Cancer, India for funding to Gupta lab; Tumor Tis-sue Repository of Indian Council Medical Research for providing tissue samples and related clinical data. SAK, MT, AKS thanks DBT, CSIR and ICMR, respectively for doctorate fellowship.
COMMENTSBackgroundOn one side β-actin has been a renowned internal equal loading control for RNA and protein expression studies, on the other side reports of its differential expression in growth, ageing, differentiation, development as well as diseases like asthma, Alzheimer’s disease, congenital heart disease and cancer is in-creasing progressively. Further, there is an emerging view of the use of β-actin as a potential direct or indirect target for chemotherapy. Therefore, the study of this “so called” housekeeping gene in cancer becomes as important as any other molecule involved in this critical disease.Research frontiersValidation of housekeeping genes as an internal loading control, role of actin in biological process important in carcinogenesis, investigation of actin binding proteins specifying its function and identifying new chemotherapy targets affect-ing actin cytoskeleton directly or indirectly are the major research areas which is related to the article.Innovations and breakthroughsDifferential expression of β-actin has been reported in a number of physiologi-cal conditions along with its overexpression in multiple cancers. Now days, on-cology research is emphasizing on tumor microenvironment, the present study provides first histological proof of β-actin overexpression but differentially in different cell types in gastric cancer. The histology based investigation provides evidence that β-actin overexpression in gastric cancer is predominantly con-tributed by the infiltrating inflammatory cells in between tumor epithelial cells. In addition, a significant correlation was observed between β-actin expression and tumor grade which emphasizes the role of β-actin in carcinogenesis.ApplicationsThe findings of the present study strengthen the area of actin biology and emphasize on the fact that conventional housekeeping genes should not be chosen as internal loading control without validation. This article provides impe-tus to further study of β-actin expression in different cancers and implicate the findings to understand the role of β-actin in carcinogenesis. It also encourages us to find prognostic and diagnostic value of β-actin in cancer along with as a direct or indirect target for chemotherapeutic intervention similarly as other cytoskeletal element such as microtubules.TerminologyTissue disruptive and non-disruptive techniques: A tumor tissue is comprised of heterogeneous population of cells. Therefore, crush and/or homogenizing a tis-sue for genomics, proteomic and expression studies is defined as tissue disrup-tive technique. This technique does not give specific information about the type of cells contributing to the results and therefore can be misleading. On the other hand, tissue non-disruptive techniques like histology based immunohistochem-istry provide information at the level of specific cell type.Peer reviewIn the present study, the authors revealed an overall increase in β-actin expres-sion in gastric cancer compared to histologically normal adjacent mucosa. They revealed that inflammatory and epithelial cells of tumor tissues showed differen-tial pattern of β-actin expression and correlated with tumor grade. Overexpres-sion of β-actin was predominantly contributed by inflammatory cells. According to the results, they concluded that β-actin might be a promising biomarker of gastric cancer and chemotherapeutic target. They showed interesting and valu-
12209 September 14, 2014|Volume 20|Issue 34|WJG|www.wjgnet.com
COMMENTS
Khan SA et al . Cell-type specific β-actin expression in GC

able data in this paper.
REFERENCES1 Siegel R, Naishadham D, Jemal A. Cancer statistics, 2013. CA
Cancer J Clin 2013; 63: 11-30 [PMID: 23335087 DOI: 10.3322/caac.21166]
2 Dikshit RP, Mathur G, Mhatre S, Yeole BB. Epidemiological review of gastric cancer in India. Indian J Med Paediatr Oncol 2011; 32: 3-11 [PMID: 21731209 DOI: 10.4103/0971-5851.81883]
3 Yeole BB. Trends in cancer incidence in esophagus, stomach, colon, rectum and liver in males in India. Asian Pac J Cancer Prev 2008; 9: 97-100 [PMID: 18439085]
4 Shrikhande SV, Shukla PJ, Qureshi S, Siddachari R, Upas-ani V, Ramadwar M, Kakade AC, Hawaldar R. D2 lymph-adenectomy for gastric cancer in Tata Memorial Hospital: Indian data can now be incorporated in future international trials. Dig Surg 2006; 23: 192-197 [PMID: 16837811 DOI: 10.1159/000094537]
5 Shrikhande SV, Barreto SG, Talole SD, Vinchurkar K, An-naiah S, Suradkar K, Mehta S, Goel M. D2 lymphadenectomy is not only safe but necessary in the era of neoadjuvant che-motherapy. World J Surg Oncol 2013; 11: 31 [PMID: 23375104 DOI: 10.1186/1477-7819-11-31]
6 Rosado JO, Henriques JP, Bonatto D. A systems pharmacol-ogy analysis of major chemotherapy combination regimens used in gastric cancer treatment: predicting potential new protein targets and drugs. Curr Cancer Drug Targets 2011; 11: 849-869 [PMID: 21762077]
7 Hofmann WA, de Lanerolle P. Nuclear actin: to polymerize or not to polymerize. J Cell Biol 2006; 172: 495-496 [PMID: 16476772 DOI: 10.1083/jcb.200601095]
8 Hofmann WA. Cell and molecular biology of nuclear actin. Int Rev Cell Mol Biol 2009; 273: 219-263 [PMID: 19215906 DOI: 10.1016/S1937-6448(08)01806-6]
9 Ruan W, Lai M. Actin, a reliable marker of internal control? Clin Chim Acta 2007; 385: 1-5 [PMID: 17698053 DOI: 10.1016/j.cca.2007.07.003]
10 Atkins H, Anderson PJ. Actin and tubulin of normal and leukaemic lymphocytes. Biochem J 1982; 207: 535-539 [PMID: 7165706]
11 Lupberger J, Kreuzer KA, Baskaynak G, Peters UR, le Cout-re P, Schmidt CA. Quantitative analysis of beta-actin, beta-2-microglobulin and porphobilinogen deaminase mRNA and their comparison as control transcripts for RT-PCR. Mol Cell Probes 2002; 16: 25-30 [PMID: 12005444 DOI: 10.1006/mcpr.2001.0392]
12 Rubie C, Kempf K, Hans J, Su T, Tilton B, Georg T, Brittner B, Ludwig B, Schilling M. Housekeeping gene variability in normal and cancerous colorectal, pancreatic, esophageal, gastric and hepatic tissues. Mol Cell Probes 2005; 19: 101-109 [PMID: 15680211 DOI: 10.1016/j.mcp.2004.10.001]
13 Leavitt J, Leavitt A, Attallah AM. Dissimilar modes of ex-pression of beta- and gamma-actin in normal and leukemic human T lymphocytes. J Biol Chem 1980; 255: 4984-4987 [PMID: 6966280]
14 Blomberg J, Andersson M, Fäldt R. Differential pattern of oncogene and beta-actin expression in leukaemic cells from AML patients. Br J Haematol 1987; 65: 83-86 [PMID: 3468999]
15 Nowak D, Skwarek-Maruszewska A, Zemanek-Zboch M, Malicka-Błaszkiewicz M. Beta-actin in human colon adeno-carcinoma cell lines with different metastatic potential. Acta Biochim Pol 2005; 52: 461-468 [PMID: 15940343]
16 Xu J, Zhang Z, Chen J, Liu F, Bai L. Overexpression of β-actin is closely associated with metastasis of gastric cancer. Hepa-togastroenterology 2013; 60: 620-623 [PMID: 23635433 DOI: 10.5754/hge11038]
17 Stournaras C, Stiakaki E, Koukouritaki SB, Theodoropoulos PA, Kalmanti M, Fostinis Y, Gravanis A. Altered actin po-lymerization dynamics in various malignant cell types: evi-
dence for differential sensitivity to cytochalasin B. Biochem Pharmacol 1996; 52: 1339-1346 [PMID: 8937443]
18 Hemstreet GP, Rao J, Hurst RE, Bonner RB, Waliszewski P, Grossman HB, Liebert M, Bane BL. G-actin as a risk factor and modulatable endpoint for cancer chemoprevention tri-als. J Cell Biochem Suppl 1996; 25: 197-204 [PMID: 9027619]
19 Jordan MA, Wilson L. Microtubules and actin filaments: dynamic targets for cancer chemotherapy. Curr Opin Cell Biol 1998; 10: 123-130 [PMID: 9484604]
20 Staples CJ, Owens DM, Maier JV, Cato AC, Keyse SM. Cross-talk between the p38alpha and JNK MAPK pathways mediated by MAP kinase phosphatase-1 determines cellular sensitivity to UV radiation. J Biol Chem 2010; 285: 25928-25940 [PMID: 20547488 DOI: 10.1074/jbc.M110.117911]
21 Yip WK, Leong VC, Abdullah MA, Yusoff S, Seow HF. Overexpression of phospho-Akt correlates with phosphory-lation of EGF receptor, FKHR and BAD in nasopharyngeal carcinoma. Oncol Rep 2008; 19: 319-328 [PMID: 18202777]
22 Schneider CA, Rasband WS, Eliceiri KW. NIH Image to Im-ageJ: 25 years of image analysis. Nat Methods 2012; 9: 671-675 [PMID: 22930834]
23 Quitschke WW, Lin ZY, DePonti-Zilli L, Paterson BM. The beta actin promoter. High levels of transcription de-pend upon a CCAAT binding factor. J Biol Chem 1989; 264: 9539-9546 [PMID: 2722849]
24 Leof EB, Proper JA, Getz MJ, Moses HL. Transforming growth factor type beta regulation of actin mRNA. J Cell Physiol 1986; 127: 83-88 [PMID: 3457016 DOI: 10.1002/jcp.1041270111]
25 Keski-Oja J, Raghow R, Sawdey M, Loskutoff DJ, Postleth-waite AE, Kang AH, Moses HL. Regulation of mRNAs for type-1 plasminogen activator inhibitor, fibronectin, and type I procollagen by transforming growth factor-beta. Divergent responses in lung fibroblasts and carcinoma cells. J Biol Chem 1988; 263: 3111-3115 [PMID: 3125175]
26 Elder PK, Schmidt LJ, Ono T, Getz MJ. Specific stimulation of actin gene transcription by epidermal growth factor and cycloheximide. Proc Natl Acad Sci USA 1984; 81: 7476-7480 [PMID: 6334309]
27 Takagi T, Iio A, Nakagawa Y, Naoe T, Tanigawa N, Akao Y. Decreased expression of microRNA-143 and -145 in human gastric cancers. Oncology 2009; 77: 12-21 [PMID: 19439999 DOI: 10.1159/000218166]
28 Szczyrba J, Löprich E, Wach S, Jung V, Unteregger G, Barth S, Grobholz R, Wieland W, Stöhr R, Hartmann A, Wullich B, Grässer F. The microRNA profile of prostate carcinoma obtained by deep sequencing. Mol Cancer Res 2010; 8: 529-538 [PMID: 20353999 DOI: 10.1158/1541-7786.MCR-09-0443]
29 Adams BD, Furneaux H, White BA. The micro-ribonucleic acid (miRNA) miR-206 targets the human estrogen receptor-alpha (ERalpha) and represses ERalpha messenger RNA and protein expression in breast cancer cell lines. Mol En-docrinol 2007; 21: 1132-1147 [PMID: 17312270 DOI: 10.1210/me.2007-0022]
30 Sikand K, Singh J, Ebron JS, Shukla GC. Housekeeping gene selection advisory: glyceraldehyde-3-phosphate dehydro-genase (GAPDH) and β-actin are targets of miR-644a. PLoS One 2012; 7: e47510 [PMID: 23091630 DOI: 10.1371/journal.pone.0047510]
31 Popow A, Nowak D, Malicka-Błaszkiewicz M. Actin cyto-skeleton and beta-actin expression in correlation with higher invasiveness of selected hepatoma Morris 5123 cells. J Physiol Pharmacol 2006; 57 Suppl 7: 111-123 [PMID: 17228099]
32 Goidin D, Mamessier A, Staquet MJ, Schmitt D, Berthier-Vergnes O. Ribosomal 18S RNA prevails over glyceralde-hyde-3-phosphate dehydrogenase and beta-actin genes as internal standard for quantitative comparison of mRNA lev-els in invasive and noninvasive human melanoma cell sub-populations. Anal Biochem 2001; 295: 17-21 [PMID: 11476540 DOI: 10.1006/abio.2001.5171]
33 Fox JG, Wang TC. Inflammation, atrophy, and gastric cancer. J Clin Invest 2007; 117: 60-69 [PMID: 17200707 DOI:
12210 September 14, 2014|Volume 20|Issue 34|WJG|www.wjgnet.com
Khan SA et al . Cell-type specific β-actin expression in GC

10.1172/JCI30111]34 Peckham M, Miller G, Wells C, Zicha D, Dunn GA. Specific
changes to the mechanism of cell locomotion induced by overexpression of beta-actin. J Cell Sci 2001; 114: 1367-1377 [PMID: 11257002]
35 Pollard TD, Borisy GG. Cellular motility driven by assembly and disassembly of actin filaments. Cell 2003; 112: 453-465 [PMID: 12600310]
36 Bunnell TM, Burbach BJ, Shimizu Y, Ervasti JM. β-Actin specifically controls cell growth, migration, and the G-actin pool. Mol Biol Cell 2011; 22: 4047-4058 [PMID: 21900491 DOI: 10.1091/mbc.E11-06-0582]
37 Colotta F, Allavena P, Sica A, Garlanda C, Mantovani A. Cancer-related inflammation, the seventh hallmark of cancer: links to genetic instability. Carcinogenesis 2009; 30: 1073-1081 [PMID: 19468060 DOI: 10.1093/carcin/bgp127]
38 Coussens LM, Werb Z. Inflammatory cells and cancer: think different! J Exp Med 2001; 193: F23-F26 [PMID: 11257144]
39 Maekita T, Nakazawa K, Mihara M, Nakajima T, Yanaoka K, Iguchi M, Arii K, Kaneda A, Tsukamoto T, Tatematsu M, Tamura G, Saito D, Sugimura T, Ichinose M, Ushijima T. High levels of aberrant DNA methylation in Helicobacter pylori-infected gastric mucosae and its possible association with gastric cancer risk. Clin Cancer Res 2006; 12: 989-995 [PMID: 16467114 DOI: 10.1158/1078-0432.CCR-05-2096]
40 Etoh T, Kanai Y, Ushijima S, Nakagawa T, Nakanishi Y, Sa-sako M, Kitano S, Hirohashi S. Increased DNA methyltrans-ferase 1 (DNMT1) protein expression correlates significantly with poorer tumor differentiation and frequent DNA hyper-methylation of multiple CpG islands in gastric cancers. Am J Pathol 2004; 164: 689-699 [PMID: 14742272 DOI: 10.1016/S0002-9440(10)63156-2]
P- Reviewer: Han X, Lobo MDT, Osawa S S- Editor: Ma YJ L- Editor: A E- Editor: Zhang DN
12211 September 14, 2014|Volume 20|Issue 34|WJG|www.wjgnet.com
Khan SA et al . Cell-type specific β-actin expression in GC

© 2014 Baishideng Publishing Group Inc. All rights reserved.
Published by Baishideng Publishing Group Inc8226 Regency Drive, Pleasanton, CA 94588, USA
Telephone: +1-925-223-8242Fax: +1-925-223-8243
E-mail: [email protected] Desk: http://www.wjgnet.com/esps/helpdesk.aspx
http://www.wjgnet.com
I S S N 1 0 0 7 - 9 3 2 7
9 7 7 1 0 07 9 3 2 0 45
3 4

Global histone post-translational modifications and cancer: Biomarkers for diagnosis, prognosis and treatment?
Shafqat Ali Khan, Divya Reddy, Sanjay Gupta
Shafqat Ali Khan, Divya Reddy, Sanjay Gupta, Epigenetics and Chromatin Biology Group, Gupta Laboratory, Cancer Research Centre, Advanced Centre for Treatment Research and Education in Cancer, Tata Memorial Centre, Navi Mumbai 410210, India
Author contributions: Khan SA and Gupta S contributed to the conception, design and major portion of the manuscript writing; Reddy D contributed in manuscript writing and editing.
Conflict-of-interest statement: No potential conflicts of interest relevant to this article were reported.
Open-Access: This article is an open-access article which was selected by an in-house editor and fully peer-reviewed by external reviewers. It is distributed in accordance with the Creative Commons Attribution Non Commercial (CC BY-NC 4.0) license, which permits others to distribute, remix, adapt, build upon this work non-commercially, and license their derivative works on different terms, provided the original work is properly cited and the use is non-commercial. See: http://creativecommons.org/licenses/by-nc/4.0/
Correspondence to: Dr. Sanjay Gupta, PhD, Principal Investigator, Epigenetics and Chromatin Biology Group, Gupta Laboratory, Cancer Research Centre, Advanced Centre for Treatment Research and Education in Cancer, Tata Memorial Centre, Sector 22, Navi Mumbai 410210, India. [email protected]: +91-022-27405086
Received: June 1, 2015Peer-review started: June 2, 2015First decision: June 18, 2015Revised: September 21, 2015Accepted: October 1, 2015Article in press: October 8, 2015Published online: November 26, 2015
AbstractGlobal alterations in epigenetic landscape are now reco-gnized as a hallmark of cancer. Epigenetic mechanisms
such as DNA methylation, histone modifications, nucleosome positioning and non-coding RNAs are proven to have strong association with cancer. In particular, covalent post-translational modifications of histone proteins are known to play an important role in chromatin remodeling and thereby in regulation of gene expression. Further, histone modifications have also been associated with different aspects of carcinogenesis and have been studied for their role in the better management of cancer patients. In this review, we will explore and discuss how histone modifications are involved in cancer diagnosis, prognosis and treatment.
Key words: Epigenetics; Cancer; Diagnosis; Prognosis; Histone post-translational modifications; Treatment
© The Author(s) 2015. Published by Baishideng Publishing Group Inc. All rights reserved.
Core tip: The purpose of the review is to describe the potential of histone post-translational modifications in the field of cancer.
Khan SA, Reddy D, Gupta S. Global histone post-translational modifications and cancer: Biomarkers for diagnosis, prognosis and treatment? World J Biol Chem 2015; 6(4): 333-345 Available from: URL: http://www.wjgnet.com/1949-8454/full/v6/i4/333.htm DOI: http://dx.doi.org/10.4331/wjbc.v6.i4.333
INTRODUCTIONCancer is a manifestation of both genetic and epigenetic alterations leading to the genomic instability and thus affecting several classes of genes, such as oncogenes, tumor suppressor genes, apoptotic genes and DNA repair genes. The field of cancer genetics which include the study of point mutation, deletion, insertion, gene amplification, chromosomal deletion/inversion/translocation, and allelic
REVIEW
333 November 26, 2015|Volume 6|Issue 4|WJBC|www.wjgnet.com
World J Biol Chem 2015 November 26; 6(4): 333-345 ISSN 1949-8454 (online)
© 2015 Baishideng Publishing Group Inc. All rights reserved.
World Journal ofBiological ChemistryW J B C
Submit a Manuscript: http://www.wjgnet.com/esps/Help Desk: http://www.wjgnet.com/esps/helpdesk.aspxDOI: 10.4331/wjbc.v6.i4.333

loss/gain has got the attention of most cancer researchers in the last few decades. However, the appreciation of cancer epigenetics is more recent as several studies have now shown that in addition to numerous genetic alterations human cancers also harbor global epigenetic abnormalities[1,2].
Epigenetics, was initially defined by C. H. Waddington as “the causal interactions between genes and their products, which bring the phenotype into being”[3]. With time, the definition of epigenetics has evolved and is implicated in a wide variety of biological processes. The current definition is “the study of heritable changes in gene expression that occur independent of changes in the primary DNA sequence”. Epigenetic mechanisms include DNA methylation[4], noncoding RNA[5,6], histone variants[7] and histone post translational modifications (PTMs). These mechanisms together alter the local structural dynamics of chromatin to regulate the functioning of the genome, mostly by regulating its accessibility and compactness. All together, these mechanisms govern the chromatin architecture and gene function in various cell types, developmental and disease states[2,8-12]. Disru-ption in the proper maintenance of these heritable epigenetic mechanisms can result in activation or inhibition of various critical cell signaling pathways thus leading to disease states such as cancer[1,13]. Epigenetic mechanisms also cooperate with genetic alteration and work together at all stages of cancer development from initiation to progression[14]. Unlike genetic alterations, epigenetic changes are reversible in nature and can be potentially restored back to their original state by epigenetic therapy. These findings have inspired many studies aimed to understand the role of epigenetics in tumorigenesis and further explore its utility in cancer diagnosis, prognosis and therapy[15]. In recent years, research focus has been shifted to understand various post translational modifications for gaining deeper insights in to the functioning of histone/chromatin associated proteins. Information about the PTMs and the related modifying enzymes is available in the database HIstome: The Histone Infobase (http://www.actrec.gov.in/histome/)[16]. This review will discuss the role of histone post-translational modifications and its utility in cancer diagnosis, prognosis and treatment.
HISTONE PTMS: A DYNAMIC PROCESSHistones are highly conserved and basic proteins with a globular C-terminal domain and an unstructured N-terminal tail[17]. They are also the most important proteins for converting a linear naked genome in to physiologically sensible architecture, chromatin. Nucle-osomes are fundamental units of chromatin, consisting an octamer of H2A, H2B, H3 and H4 (two each) around which 146 base pairs of DNA is wrapped-. There are sequence variants of these histones which are expressed and incorporated into chromatin in a context dependent manner in normal and disease related processes. In cancer, histone H2A variants, H2A.1, H2A.
Z and macroH2A have also been reported to express aberrantly[18-20]. Also, histones proteins can undergo a variety of PTMs some of which are methylation (me), acetylation (ac), ubiquitylation (ub), sumoylation (su) and phosphorylation (ph) on specific amino acid (Figure 1)[10]. Apart from these modifications, histones are also known to undergo homocysteinylation, crotonylation and glucosylation amongst others[21]. These histone modifications occur at several degrees, for example, methylation can be of monomethyl (me), dimethyl (me2) and trimethyl (me3).
Histone PTMs are added and removed from histones by enzymes called “writers” and “erasers” respectively. Histone acetyltransferases (HATs), histone methyltransferases (HMTs) and histone kinases are the examples of “writers” which add acetyl, methyl and phosphoryl groups, whereas histone deacetylases (HDACs), histone demethylases (HDMs) and histone phosphatases are examples of “erasers” which remove acetyl, methyl and phosphoryl groups, respectively (Figure 2)[22-24]. Histone-modifying enzymes are also known to interact with each other as well as other chromatin related proteins thus influencing key cellular processes such as transcription, replication and repair[10].
The mechanism behind the regulation of key cellular processes by histone post-translational modifications is not fully understood; however, it can be generalized into two categories. First, the addition of any PTM on histone protein affects inter/intra-nucleosomal interactions and their binding to DNA by steric hindrance or charge interactions. Second, addition of these PTMs to histone proteins inhibits or facilitates the binding of various proteins to chromatin[10]. These mechanisms allow a vast range of flexibility in regulating chromatin dynamics and signaling transmission and thereby regulating the gene expression. As an example of first mechanism, histone acetylation is proposed to be associated with chromatin relaxation and transcription activation, H4K16ac inhibits the formation of compact 30 nm fibers and higher order chromatin structures[25,26]. As an example of second mechanism, evolutionarily conserved specialized proteins, termed “histone readers,” possess the ability to specifically bind certain histone modifications and affects a defined nuclear process such as transcription, DNA repair and replication, etc. (Figure 2). For example, through its evolutionary conserved chromodomain heterochromatin protein 1 recognize and gets recruited to H3K9me3 and leads to the formation of compact chromatin which in turn inhibits the access of the transcriptional machinery[27,28]. Moreover, the fact that there are different variants of each histone protein differing from few to many amino acids adds another level of complexity in functional aspects of histone PTMs. Such complicated and multilayered regulatory mechanisms of cellular processes through histone modifications have led to the hypothesis of “histone code” where a set of histone variants and modifications together perform a specific function[29]. However, due to its complexity histone code is still not fully understood[30]. Further, the status of one histone modification also regulates that of another by
334 November 26, 2015|Volume 6|Issue 4|WJBC|www.wjgnet.com
Khan SA et al . Global histone post-translational modifications and cancer
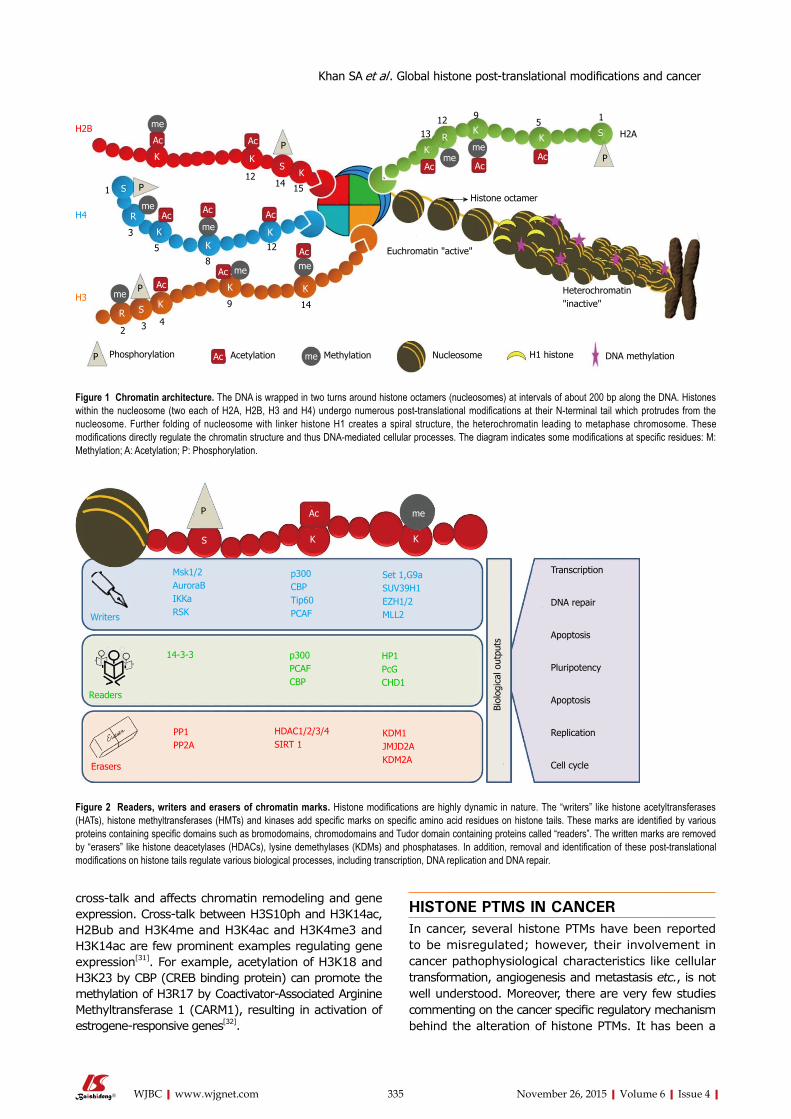
cross-talk and affects chromatin remodeling and gene expression. Cross-talk between H3S10ph and H3K14ac, H2Bub and H3K4me and H3K4ac and H3K4me3 and H3K14ac are few prominent examples regulating gene expression[31]. For example, acetylation of H3K18 and H3K23 by CBP (CREB binding protein) can promote the methylation of H3R17 by Coactivator-Associated Arginine Methyltransferase 1 (CARM1), resulting in activation of estrogene-responsive genes[32].
HISTONE PTMS IN CANCERIn cancer, several histone PTMs have been reported to be misregulated; however, their involvement in cancer pathophysiological characteristics like cellular transformation, angiogenesis and metastasis etc., is not well understood. Moreover, there are very few studies commenting on the cancer specific regulatory mechanism behind the alteration of histone PTMs. It has been a
335 November 26, 2015|Volume 6|Issue 4|WJBC|www.wjgnet.com
Khan SA et al . Global histone post-translational modifications and cancer
Phosphorylation Acetylation Methylation Nucleosome H1 histone DNA methylation
Heterochromatin "inactive"
Euchromatin "active"
Histone octamer
H2A
PAcAc
meme
SKK
KR
P
15912
13
Ac
Ac
KS
K
1512
14
12
KK
Ac Ac
Ac
Acmeme
K K
149
me
meAc
Ac
P
P
K
S
K
Ac
me
R
85
3
1
3 42
R
meKS
H2B
H4
H3
P Ac me
Figure 1 Chromatin architecture. The DNA is wrapped in two turns around histone octamers (nucleosomes) at intervals of about 200 bp along the DNA. Histones within the nucleosome (two each of H2A, H2B, H3 and H4) undergo numerous post-translational modifications at their N-terminal tail which protrudes from the nucleosome. Further folding of nucleosome with linker histone H1 creates a spiral structure, the heterochromatin leading to metaphase chromosome. These modifications directly regulate the chromatin structure and thus DNA-mediated cellular processes. The diagram indicates some modifications at specific residues: M: Methylation; A: Acetylation; P: Phosphorylation.
AcP
KS K
me
Writers
Readers
Erasers
Msk1/2AuroraBIKKaRSK
p300CBPTip60PCAF
Set 1,G9aSUV39H1EZH1/2MLL2
14-3-3 p300PCAFCBP
HP1PcGCHD1
PP1PP2A
HDAC1/2/3/4SIRT 1
KDM1JMJD2AKDM2A
Biol
ogic
al o
utpu
ts
Transcription
DNA repair
Apoptosis
Pluripotency
Apoptosis
Replication
Cell cycle
Figure 2 Readers, writers and erasers of chromatin marks. Histone modifications are highly dynamic in nature. The “writers” like histone acetyltransferases (HATs), histone methyltransferases (HMTs) and kinases add specific marks on specific amino acid residues on histone tails. These marks are identified by various proteins containing specific domains such as bromodomains, chromodomains and Tudor domain containing proteins called “readers”. The written marks are removed by “erasers” like histone deacetylases (HDACs), lysine demethylases (KDMs) and phosphatases. In addition, removal and identification of these post-translational modifications on histone tails regulate various biological processes, including transcription, DNA replication and DNA repair.
336 November 26, 2015|Volume 6|Issue 4|WJBC|www.wjgnet.com
of physical symptoms, body fluids and fecal samples. A sensitive and specific diagnostic marker is not only useful in early diagnosis, but also helps in assessing the risk of developing the disease. Advances in the technology have enabled investigators to isolate metabolites, proteins and DNA from body fluids and fecal material and correlate them with pathophysiological symptoms of diseases including cancer.
Decades of research have discovered a battery of markers for cancer diagnosis; however, only few could reach to clinics because of issues of sensitivity and specificity. Therefore, at one side there is a need to improve techniques and on the other hand discovery of new markers is of immense importance. The discovery of the presence of DNA in fecal and urine samples[46] and circulating nucleosomes in serum[47,48] has led to the foundation of identifying epigenetic markers such as DNA methylation and histone posttranslational modification for cancer diagnosis. Ahlquist et al[49] demonstrated the recovery of DNA from frozen fecal samples of colorectal cancer patients which was followed by other investigators showing matching DNA methylation patterns between DNA from tissue and fecal samples of gastric and colorectal cancer patients[50-52]. Methylation pattern of DNA isolated from urine samples was also used to diagnose bladder and prostate cancer[53-57]. All these methylation studies have successfully detected global hypomethylation and gene specific hypermethylation of DNA, as established from tissue based studies.
Presence of histone proteins is not known in fecal and urine samples; therefore, histone posttranslational modifications have been utilized as cancer diagnostic markers using circulating nucleosomes (cNUCs) in serum samples. Two histone methylation marks, H3K9me3 and H4K20me3, the hallmarks of pericentric heterochromatin[58], were investigated in circulating nucleosomes by subsequent studies. Gezer et al[59] investigated the correlation between the H3K9me3 and H4K20me3 of cNUCs in healthy subjects and patients with colorectal cancer (CRC) and multiple myeloma and found low levels of these PTMs in cancer. Sera of patients with malignant tumors including colorectal, lung, breast, ovarian, renal, prostate cancer, and lymphoma showed high level of nucleosome concentration compared with those of healthy persons and patients with benign diseases[60]. Further, the same group showed high level ALU115 DNA sequence associated H3K9Me in multiple myeloma patients compared to healthy individuals[61]. ChIP based analysis of circulating nucleosomes in serum samples by Gloria et al reported a low level of H3K9me3 and H4K20me3 in patients with colorectal, pancreatic, breast and lung cancer compared to healthy control[62,63]. Moreover, H3K9me3 and H4K20me3 have been found to be lower at the pericentromeric satellite Ⅱ repeat in patients with CRC when compared with healthy controls or patients with multiple myeloma. In summary, identification of histone PTMs from serum isolated circulating nucleosomes have open the doors of immense possibility that blood samples collected by
decade when global loss of H4K16ac and H4K20me3 was reported for their association with cancer and considered as a common hallmark of tumor cells[33]. However, still there are no reports of their direct involvement in cellular transformation or any other cancer characteristics. Despite of the awareness of hMOF (human Male absent Of First) and HDAC4 as writer and eraser of H4K16ac, it is a recent development that low expression of hMOF has been implicated for its loss in gastric cancer[34]. Moving on to histone methylation, Lin et al[35] showed histone lysine demethylase KDM1A mediated loss of H3K4me2 is associated with epithelial to mesenchymal transition (EMT) in human breast cancer cells. Loss of H3ac, H3K9me3 and H3S10ph is observed at the promoters of Sfrp2, Sfrp5 and Wnt5a during genistein induced development of colon cancer in the rat model system[36]. Alterations in methylation patterns of H3K9 and H3K27 are related to aberrant gene silencing in many cancers[37,38]. Tissue microarrays done to compare the levels of H2B ub1 levels in normal mammary epithelial tissue as well as benign, malignant, and metastatic breast cancer samples have clearly shown a sequential decrease in H2B monoubiquitination with breast cancer progression and metastasis in comparision with normal epithelia[39]. A very important discovery has been made in term of phosphorylation of H3S10 as the only histone marks directly associated with cellular transformation. The knockdown and mutant (S10A) of histone H3 suppressed LMP1-induced proliferation of nasopharyngeal carcinoma cell line CNE1[40]. H3S10P has been reported to increase and has been established as indispensable for cellular transformation[41,42]. Cellular transformation by v-src constitutively activated phosphorylation of histone H3 at Ser10 in a transformation-specific manner; while, non-transforming mutant of v-src did not activate H3 phosphorylation[43]. Further, Mitogen- and stress-activated kinase 1 (MSK1) has been shown to phosphorylate H3S10 in TPA and EGF mediated cellular transformation[44]. Unpublished data from our lab has also shown increase in H3S10ph in gastric cancer, which is regulated by p38-MAPK/MSK1 pathway.
It has now been clear that acetylation, methylation and phosphorylation of histones are the most studied histone marks. In cancer, most of the studies have been done for these modifications with respect to the identification of their enzymes, regulation, effect on cellular physiology and as well as molecular biological markers for the disease management. The National Institute of Health defines a biological marker (biomarker) as a biological molecule found in blood, other body fluids, or tissues that are an objective indicator of normal or abnormal process, or of a condition or disease[45]. From the next part of the review we will see how histone acetylation, methylation and phosphorylation can be exploited as biomarkers for cancer diagnosis, prognosis and treatment.
HISTONE PTMS IN CANCER DIAGNOSISDiagnosis of a disease majorly depends on the analysis
Khan SA et al . Global histone post-translational modifications and cancer

337 November 26, 2015|Volume 6|Issue 4|WJBC|www.wjgnet.com
cancer patients can also be used for histone PTM based cancer diagnosis.
HISTONE PTMS IN CANCER PROGNOSISIn cancer, to date, histones PTMs have been mostly studied for their potential as prognostic marker (Table 1). The first report in this area strongly suggested the utility of histone PTMs in cancer diagnosis and showed loss of H4K16ac and H4K20me3 in several cancers and establish these two marks as a hallmark of tumor and establishes the correlation of H4K16ac with tumor progression[33]. Further, loss of H4K20me3 is as also detected in various cancer animal models[64,65]. A study on prostate cancer showed a positive correlation of H3K18ac, H4K12ac and H4R3me2 with increasing tumor grade[66]. Another
study on prostate cancer showed independently of other clinical and pathologic parameters, high rate of tumor recurrence in low-grade prostate carcinoma patients with low level of H3K4me2[66]. Loss of H3K4me2/me3 is reported in various neoplastic tissues such as non-small cell lung cancer, breast cancer, renal cell carcinoma and pancreatic adenocarcinoma serving as a predictor of clinical outcomes[67-72].
Acetylation of histone H3K9 has shown ambiguous results with the increase in some and decrease in other cancers. Decrease of H3K9ac has been linked with tumor progression, histological grading and clinical stage in prostate and ovarian tumors, hence is coupled with a poor prognosis for these patients[66,73-75]. Patients with non-small cell lung adenocarcinoma exhibited better prognosis on the reduction of the H3K9ac expression
Khan SA et al . Global histone post-translational modifications and cancer
Table 1 Global post-translational modifications of histones in cancer
Histone PTM Writer Eraser Function Cancer Diagnosis/ Prognosis/ Treatment
H3K9ac GCN-5 SIRT-1; SIRT-6 Transcription initiation
Diagnosis: ?Prognosis: Lung, breast, ovarianTreatment: ?
H3K18ac CBP/p300 ? Transcription initiation and repression
Diagnosis: ?Prognosis: Lung, prostate, breast, esophagusTreatment: ?
H4K5ac CBP/P300; HAT1; TIP60; HB01
? Transcription activation
Diagnosis: ?Prognosis: LungTreatment: ?
H4K8ac TIP60; HB01 ? Transcription activation
Diagnosis: ?Prognosis: Lung, Treatment: ?
H4K16ac TIP60; hMOF SIRT-1; SIRT-2 Transcription activation
Diagnosis: ColorectalPrognosis: Lung, breastTreatment: ?
H3K4me SETD1A; SETD1B; ASH1L; MLL; MLL2; MLL3: MLL4; SETD7
KDM1A; KDM1B; KDM5B; NO66
Transcription activation
Diagnosis: ?Prognosis: Prostate, kidneyTreatment: ?
H3K4me2 SETD1A; SETD1B; MLL; MLL2; MLL3; MLL4; SMYD3
KDM1A; KDM1B; KDM5A; KDM5B; KDM5C; KDM5D; NO66
Transcription activation
Diagnosis: ?Prognosis: Prostate, lung, kidney, breast, pancreatic, liver,Treatment: ?
H3K4me3 SETD1A; SETD1B; ASH1L; MLL; MLL2; MLL3; MLL4; SMYD3; PRMD9
KDM2B; KDM5A; KDM5B; KDM5C; KDM5D; NO66
Transcription elongation
Diagnosis: ?Prognosis: Kidney, liver, prostateTreatment: ?
H3K9me SETDB1; G9a; EHMT1; PRDM2
KDM3A; KDM3B§; PHF8; JHDM1D
Transcription initiation
Diagnosis: MyelomaPrognosis: Kidney, pancreas, prostateTreatment: ?
H3K9me2 SUV39H1; SUV39H2; SETDB1; G9a; EHMT1; PRDM2
KDM3A; KDM3B§; KDM4A; KDM4B; KDM4C; KDM4D; PHF8; KDM1A; JHDM1D
Transcription initiation and repression
Diagnosis: ?Prognosis: Prostate, pancreasTreatment: ?
H3K9me3 SUV39H1; SUV39H2; SETDB1; PRDM2
KDM3B§; KDM4A; KDM4B; KDM4C; KDM4D
Transcription initiation and repression
Diagnosis: Colorectal, myeloma, prostate, breast and lungPrognosis: Lung, prostate, breast, leukemia, stomach Treatment: ?
H3K27me EZH2; EZH1 JHDM1D Transcription activation
Diagnosis: ?Prognosis: KidneyTreatment: ?
H3K27me3 EZH2; EZH1 KDM6A; KDM6B; Transcription repression
Diagnosis: ?Prognosis: Breast, pancreatic, ovarian, prostate, stomach, Esophagus, LiverTreatment: ?
H4K20me3 SUV420H1; SUV420H2 ? Transcription repression
Diagnosis: Colorectal, myeloma, prostate, breast and lungPrognosis: Breast, lymphoma, colon, ovarianTreatment: ?
PTM: Post translational modification.

338 November 26, 2015|Volume 6|Issue 4|WJBC|www.wjgnet.com
level[68,76]. In contrast, increase in H3K9ac levels was reported in liver cancer[73]. Methylation of the same residue K9 of histone H3 requires loss of H3K9ac and is also linked to number of cancers. An association with the increase in methylation of H3K9 and aberrant gene silencing, has been found in many cancers[37,77] and its high level is associated with poor prognosis in gastric adenocarcinoma patients[77]. However, in patients with acute myeloid leukemia decrease in H3K9me3 has been found to be associated with better prognosis[78]. Decrease in H3K18ac is correlated with poor prognosis in prostate, pancreatic, lung, breast and kidney cancers[66,69,71]. It has also shown a strong correlation with tumor grade, signifying its importance in tumor progression[69]. In this regard, Kurdistani laboratory has confirmed that oncogenic transformation by the adenovirus protein E1a is associated with drastic changes in the global H3K18 acetylation pattern[79,80]. In addition, H3K18 hypoacetylation has been associated with an high risk of tumor recurrence in low-grade prostate cancer patients[66]. However, in contrast to this, low expression of H3K18ac has been correlated with a better prognosis for esophageal squamous cell carcinoma and glioblastoma patients[76,81]. This suggests that a single histone modification could predict differential prognosis in different cancers depending on it tissue specificity.
Another histone mark, H3K27me3 has been evalu-ated as a prognostic factor in patients with prostate, breast, ovarian, pancreatic and esophageal cancer[81-84], however, some of the results are perplexing and need further investigation. High level of H3K27me3 correlates with poor prognosis in esophageal cancers[81,84]. On the other hand H3K27me3 showed a negative correlation with overall survival time in breast, prostate, ovarian and pancreatic cancer patients[83]. Zhang et al[85] have identified many genes like oncogenes, tumor suppressor genes, cell cycle regulators, and genes involved in cell adhesion with significant differences in H3K27me3 pattern in gastric cancer samples in comparison to adjacent non-neoplastic gastric tissues. Further they were able to correlate changes in H3K27me3 to gene expression pattern of MMP15, UNC5B, and SHH. In non-small cell lung cancer enhanced H3K27me3 was correlated with longer overall survival (OS) and better prognosis. Moreover, both univariate and multivariate analyses indicated that H3K27me3 level was a significant and independent predictor of better survival[86]. Recently, a study showed K27M mutations of histone H3.3 variants in 31% pediatric glioblastoma tumors suggesting another level of complexity in alteration of histone PTMs in cancer which is independent of histone modifying enzymes[87]. Mass spectrometry based analysis showed high level of H3K27ac in colorectal cancer than the corresponding normal mucosa[88]. Immunohistochemical analysis on metachronous liver metastasis of colorectal carcinomas by Tamagawa et al[89] has correlated H3K4me2 and H3K9ac with the tumor histological type. In addition, lower levels of H3K4me2 correlated with a poor survival rate and also found to be an independent prognostic
factor. Recently DNA damage mark γH2AX also have shown
its prognostic value. In triple negative breast tumors, high level of γH2AX was associated poor overall survival[90] and which was further found to be associated with shorter telomere length[91]. In colorectal cancer a high γH2AX expression in CRC tissues was associated with tumor stage and perineurial invasion. Furthermore, a high γH2AX expression was associated with poor distant metastasis-free survival (DMFS) and OS. Cox regression analysis also revealed that γH2AX was an independent predictor of DMFS and OS. A high γH2AX expression in CRC tissues is associated with a more malignant cancer behavior, as well as poor patient survival[92]. ELISA based analysis in glioblastoma multiformes tumors showed the high level of H3T6ph,H3S10p and H3Y41ph as signatures associated with a poor overall survival[93]. Increase in H3S10ph has been associated with poor prognosis in several cancers including glioblastoma multiformes[93], cutaneous nodular melanoma[94], cutaneous melanoma[95], breast cancer[96,97], esophageal squamous cell carcinoma[98], gastric cancer[99,100], melanoma[101] and nasopharyngeal carcinoma[40].
HISTONE PTM’S IN CANCER TREATMENTReversible nature of epigenetic changes or mechanisms has drawn major attention of scientific community to study the molecular mechanism regulating the alteration in epigenetic marks, specifically the histone post-translational modifications. Such efforts have led to the discovery of several histone modifying enzymes[102] and their chemical inhibitors[103] which has emerged as an attractive strategy in cancer treatment. Targeting these enzymes can reactivate epigenetically silenced tumor-suppressor genes by modulating the levels of histone posttranslational modifications[104]. Further, these drugs have also given additional advantage in the area of combinatorial chemotherapy[105,106].
Histone acetyl-transferases and histone deacetylases as the targetsLoss of histone acetylation has a strong correlation with aberrant gene silencing in cancer. Treatment with HDAC inhibitors reactivate silenced tumor suppressor genes by increasing histone acetylation levels and act as anti-tumorigenic agent by promoting growth arrest, apoptosis and cell differentiation[107]. Additionally, HDACi have shown their potential in reversing chemoresistance and induce antiproliferative effects on a number of cancer cell lines[108-113]. However, the question still remains whether the promise shown in the above studies by HDAC inhibitors are mainly due to their potency to alter epigenetic mechanisms or mere its effect on key cellular growth regulatory pathways.
Initial results upon treatment with HDACi like valproic acid and phenylbutyrate, as a single agent against hema-tologic malignancies were not encouraging[81]. However, the field showed much promise with the development of more
Khan SA et al . Global histone post-translational modifications and cancer
339 November 26, 2015|Volume 6|Issue 4|WJBC|www.wjgnet.com
potent HDACi such as the class-specific inhibitors (entinostat and romidepsin) and the pan HDAC inhibitors (vorinostat, belinostat and panobinostat). The field however gained boost when in a landmark Phase IIb multicenter trial, Yu et al[82] have shown vorinostat as effective treatment modality for refractory cutaneous T-cell lymphoma. Further, in Phase Ⅱ multi-institutional trial, romidepsin has also been shown to have significant and durable efficacy against cutaneous T-cell lymphoma[83]. Due to their great successes in many studies, HDACi romidepsin and vorinostat have been approved by FDA as the treatment regime of cutaneous T-cell lymphoma, and romidepsin also for the treatment of relapsed peripheral T-cell lymphoma[84]. Since then many other HDACi have been under study of phase Ⅰ and/or Ⅱ trials as monotherapy, including belinostat, panobinostat, entinostat, chidamide, SB939 and LAQ824 in various cancers like ovarian, lung, soft tissue carcinoma, non-small-cell lung and breast[114-121]. However, unlike that of earlier success in treatment of lymphomas the majority of the results among solid tumor patients have been disappointing. In spite of achieving only intermittent anecdotal clinical responses, HDACi been related with severe toxicities.
Interactions between different epigenetic mechanisms have led to the foundation of research on combinatorial approach of cancer treatment using epigenetic drugs. Indeed, combinations of DNA methyltransferase and histone deacetylase inhibitors appear to synergize effectively in the reactivation of epigenetically silenced genes[107,122-124]. Such combinatorial approaches of cancer treatment have been found to be more effective than treatment with a single therapeutic agent. For example, treatment with 5-Aza-CdR and trichostatin-A in combination led to the derepression of certain putative tumor suppressor genes unlike individual treatments[107]. Pre-treatment of HDAC inhibitor SAHA relaxes the chromatin sensitizes cells to DNA damage induced by Topoisomerase Ⅱ inhibitor[125]. Similarly pretreatment of valproic acid act in synergy with epirubicine and reduces the tumor volume in breast cancer mouse model[126].
Furthermore, synergistic activity of decitabine and HDACi sodium phenylbutyrate was shown to decrease the lung cancer formation by more than 50% in comparison with decitabine alone in a murine model based study by Belinsky et al[124]. The same group also reported that the combination of HDACi entinostat with the DNMTi azacitidine was able to decrease tumor size and reduce the growth of K-ras/p53 mutant lung adenocarcinomas orthotopic engrafted in immunocompromised nude rats[127]. In another case HDACi sodium butyrate reduces the cell proliferation of MCF-7 cell when combine with vitamin-A[128].
Histone methyl-transferases and histone demethylases as the targetsStudies on histone methylation and their modifiers have been slow. Only few histone methylases (HMT) and demethylases (HDM) and their inhibitors have been discovered. However, studies on histone methylation
could be more fruitful for their therapeutic potential because the less redundancy in HMTs and HDM compared to HATs and HDACs in targeting specific amino acid residue of histone[129]. This property of HMTs and HDMs provides exciting opportunities with more tailored treatment, while potentially minimizing side effects.
LSD1/KDM1 was among the first identified histone demethylases selectively targeting H3K4me1 and H3K4me2[130] and mediate gene repression. LSD1 has been reported to be overexpressed in many cancers like brain, breast, and prostate, thus thought to be a promising target for drug therapy[130-132]. Small molecules such as SL11144 and tranylcypromine have been developed to inhibit LSD1[133,134], Since then have shown to restore expression many silenced tumor suppressors like secreted frizzled-related protein and GATA transcription factors in many cancer cell lines. They have also been shown to possess antitumor activity in a study involving neuroblastoma xenografts model[132]. However, similar to HDACi, HDM and HMT inhibitors also have off-target effects on H3K9me2 and DNMT1 thus limiting their use[135] and further in-depth studies are required. EZH2 is another methyltransferase responsible for H3K27me3 leads to gene silencing by promoting DNA methylation[136]. EZH2 is overexpressed in head and neck, breast, and prostate cancers[137] and can be targeted by a hydrolase inhibitor called 3-deazaneplanocin A (DZNep). It induces differentiation as well as apoptosis in cancer cell lines and xenografts by countering EZH2 and inhibiting H3K27 trimethylation[138,139], while sparing normal cells.
Histone kinases and phosphatases as the targetsCompared to histone acetylation and methylation, the effort of regulating histone phosphorylation by targeting kinases and phosphatases for therapeutic uses is new. High level of several histone H3 phosphorylations such as H3S10ph, H3T6ph has been reported in a number of cancers. Unpublished data from our lab shows increase of H3S10ph in cisplatin resistance gastric cancer cell lines AGS and KATOIII. Our observation further supported the finding that p38 MAPK pathway mediated increase in H3S10ph in response to cisplatin treatment[140] in HeLa and MCF7 cells. Pacaud et al[93] recently reported that the kinase inhibitors like Enzastaurin (PKC-beta inhibitor), AZD1152 (Aurora-B inhibitor) and AZD1480 (Jak2 inhibitor) increases the cell death of TMZ-Irrad resistant GBM and decreases H3T3ph, H3S10ph and H3Y41ph respectively. Further, H89 (MSK1 inhibitor) treatment reduces the TPA and EGF mediated cellular transformation and by decreasing H3S10ph[44]. All these studies represent the potential of regulating histone phosphorylation for therapeutic use in cancer; however, these observations need to be further explored.
Despite of all this progress in the utilization of histone PTMs in chemotherapeutic interventions, a very little is known about their utility in monitoring the response to chemotherapy. For this purpose, levels of cNUCs and their modifications can be utilized. Because, circulating nucleosomes in serum are a result of apoptosis of
Khan SA et al . Global histone post-translational modifications and cancer

340 November 26, 2015|Volume 6|Issue 4|WJBC|www.wjgnet.com
actively dividing cells; therefore, after chemotherapy/radiotherapy increase in the circulating nucleosomes correlates with progressive disease and decrease was associated with disease regression. Increase in the concentration of serum nucleosomes has been shown at 24-72 h after the first application of chemotherapy and 6-24 h after the start of radiotherapy[60]. Thus, the concentration of nucleosomes in serum might be a useful tool for monitoring the biochemical responses during antitumor therapy, particularly for the early estimation of therapeutic efficacy. Histone modifications such as H4K16ac for example, can be utilized in this regard as its loss has been reported in several cancers and also chemosensitize cancer cells[33,69,141]. Histone modifications like H3K27me3 have indeed showed perplexing results when analyzed with respect to various cancers. This can be attributed to tissue type, and indeed histone PTMs are known to be showing their abundance in a tissue specific manner[142]. This might be as because many writers and erasers utilize co-factors or substrates like acetyl CoA, SAM, NAD+, FAD+ or ATP which are crucial metabolites in core pathways of intermediary metabolism[143]. The cellular concentrations of these metabolites fluctuate with the metabolic status of the cells and thus, the activity of these enzymes gets affected thus the histone PTMs.
CONCLUSION AND FUTURE DIRECTIONSThe role of histone modifications in governing cellular functions has been not yet fully understood. However, with increased research over the past decade, all the organisms studied so far (from yeast to man) have bought to light the importance of chromatin environment especially histone PTMs in development and disease. These observations have revolutionized the field of epigenetics and have challenged the old hypothesis of the genetic code being the sole determinant of the pathophysiology of any disease. In cancer, especially this is further established with the discovery of small molecule inhibitors targeting histone modifying enzymes, which can restore the expression of various genes to normal and can induce apoptosis of transformed cells. The best studied examples of these drugs are HDACi, which have proven to be highly effective anticancer drugs, thus are in clinics. Although the exact nature of the mechanism by which these drugs act is not understood yet, still these drugs are faring better against cancer. Future studies need to be directed more towards understanding these mechanisms and increasing the potency of these drugs. Though many histone PTMs are known to change during cancer, less is understood regarding the significance and mechanistic details of the change observed. Much of the work done in this direction has been hindered due to technical limitations. However with the advent of new technologies, and also decrease in the cost of high throughput technologies like ChIP-seq and TMA amongst other global approaches, it is a matter of time we have more knowledge of these mechanisms. Also, new targets for development of more potent drugs need
to be explored by careful understanding of an already existing chromatin atlas of various cancer cell lines and tissues. Further work in the next decade may gain deeper understanding of the global patterns of histone posttranslational modifications and their corresponding changes which will hopefully reveal many molecular targets that can be employed as new weapons in long fought battle against cancer.
ACKNOWLEDGMENTSThe authors would like to thank Asmita Sharda and Prathamesh Amnekar, members of “Epigenetics and Chromatin Biology Group” for their contribution in editing and figures of the manuscript. SAK was supported by DBT, India and DR is supported by CSIR, India for their doctoral fellowships.
REFERENCES1 Jones PA, Baylin SB. The fundamental role of epigenetic events in
cancer. Nat Rev Genet 2002; 3: 415-428 [PMID: 12042769 DOI: 10.1038/nrg816]
2 Jones PA, Baylin SB. The epigenomics of cancer. Cell 2007; 128: 683-692 [PMID: 17320506 DOI: 10.1016/j.cell.2007.01.029]
3 Waddington CH. The epigenotype. 1942. Int J Epidemiol 2012; 41: 10-13 [PMID: 22186258 DOI: 10.1093/ije/dyr184]
4 Kulis M, Esteller M. DNA methylation and cancer. Adv Genet 2010; 70: 27-56 [PMID: 20920744 DOI: 10.1016/B978-0-12-380866-0.60002-2]
5 Castelo-Branco G, Bannister AJ. The epigenetics of cancer: from non-coding RNAs to chromatin and beyond. Brief Funct Genomics 2013; 12: 161-163 [PMID: 23709460 DOI: 10.1093/bfgp/elt020]
6 Beckedorff FC, Amaral MS, Deocesano-Pereira C, Verjovski-Almeida S. Long non-coding RNAs and their implications in cancer epigenetics. Biosci Rep 2013; 33: e00061 [PMID: 23875687 DOI: 10.1042/BSR20130054]
7 Vardabasso C, Hasson D, Ratnakumar K, Chung CY, Duarte LF, Bernstein E. Histone variants: emerging players in cancer biology. Cell Mol Life Sci 2014; 71: 379-404 [PMID: 23652611 DOI: 10.1007/s00018-013-1343-z]
8 Bernstein BE, Meissner A, Lander ES. The mammalian epigenome. Cell 2007; 128: 669-681 [PMID: 17320505 DOI: 10.1016/j.cell.2007.01.033]
9 Suzuki MM, Bird A. DNA methylation landscapes: provocative insights from epigenomics. Nat Rev Genet 2008; 9: 465-476 [PMID: 18463664 DOI: 10.1038/nrg2341]
10 Kouzarides T. Chromatin modifications and their function. Cell 2007; 128: 693-705 [PMID: 17320507 DOI: 10.1016/j.cell.2007.02.005]
11 Zhang B, Pan X, Cobb GP, Anderson TA. microRNAs as oncogenes and tumor suppressors. Dev Biol 2007; 302: 1-12 [PMID: 16989803 DOI: 10.1016/j.ydbio.2006.08.028]
12 Jiang C, Pugh BF. Nucleosome positioning and gene regulation: advances through genomics. Nat Rev Genet 2009; 10: 161-172 [PMID: 19204718 DOI: 10.1038/nrg2522]
13 Egger G, Liang G, Aparicio A, Jones PA. Epigenetics in human disease and prospects for epigenetic therapy. Nature 2004; 429: 457-463 [PMID: 15164071 DOI: 10.1038/nature02625]
14 Jones PA, Laird PW. Cancer epigenetics comes of age. Nat Genet 1999; 21: 163-167 [PMID: 9988266 DOI: 10.1038/5947]
15 Yoo CB, Jones PA. Epigenetic therapy of cancer: past, present and future. Nat Rev Drug Discov 2006; 5: 37-50 [PMID: 16485345 DOI: 10.1038/nrd1930]
16 Khare SP, Habib F, Sharma R, Gadewal N, Gupta S, Galande S. HIstome-a relational knowledgebase of human histone proteins and histone modifying enzymes. Nucleic acids research 2011; 40:
Khan SA et al . Global histone post-translational modifications and cancer
341 November 26, 2015|Volume 6|Issue 4|WJBC|www.wjgnet.com
D337-D342 [DOI: 10.1093/nar/gkr1125]17 Luger K, Mäder AW, Richmond RK, Sargent DF, Richmond TJ.
Crystal structure of the nucleosome core particle at 2.8 A resolution. Nature 1997; 389: 251-260 [PMID: 9305837 DOI: 10.1038/38444]
18 Kapoor A, Goldberg MS, Cumberland LK, Ratnakumar K, Segura MF, Emanuel PO, Menendez S, Vardabasso C, Leroy G, Vidal CI, Polsky D, Osman I, Garcia BA, Hernando E, Bernstein E. The histone variant macroH2A suppresses melanoma progression through regulation of CDK8. Nature 2010; 468: 1105-1109 [PMID: 21179167 DOI: 10.1038/nature09590]
19 Khare SP, Sharma A, Deodhar KK, Gupta S. Overexpression of histone variant H2A.1 and cellular transformation are related in N-nitrosodiethylamine-induced sequential hepatocarcinogenesis. Exp Biol Med (Maywood) 2011; 236: 30-35 [PMID: 21239733 DOI: 10.1258/ebm.2010.010140]
20 Rangasamy D. Histone variant H2A.Z can serve as a new target for breast cancer therapy. Curr Med Chem 2010; 17: 3155-3161 [PMID: 20666725]
21 Tan M, Luo H, Lee S, Jin F, Yang JS, Montellier E, Buchou T, Cheng Z, Rousseaux S, Rajagopal N, Lu Z, Ye Z, Zhu Q, Wysocka J, Ye Y, Khochbin S, Ren B, Zhao Y. Identification of 67 histone marks and histone lysine crotonylation as a new type of histone modification. Cell 2011; 146: 1016-1028 [PMID: 21925322 DOI: 10.1016/j.cell.2011.08.008]
22 Haberland M, Montgomery RL, Olson EN. The many roles of histone deacetylases in development and physiology: implications for disease and therapy. Nat Rev Genet 2009; 10: 32-42 [PMID: 19065135 DOI: 10.1038/nrg2485]
23 Shi Y. Histone lysine demethylases: emerging roles in development, physiology and disease. Nat Rev Genet 2007; 8: 829-833 [PMID: 17909537 DOI: 10.1038/nrg2218]
24 Baek SH. When signaling kinases meet histones and histone modifiers in the nucleus. Mol Cell 2011; 42: 274-284 [PMID: 21549306 DOI: 10.1016/j.molcel.2011.03.022]
25 Shogren-Knaak M, Ishii H, Sun JM, Pazin MJ, Davie JR, Peterson CL. Histone H4-K16 acetylation controls chromatin structure and protein interactions. Science 2006; 311: 844-847 [PMID: 16469925 DOI: 10.1126/science.1124000]
26 Shogren-Knaak M, Peterson CL. Switching on chromatin: mechanistic role of histone H4-K16 acetylation. Cell Cycle 2006; 5: 1361-1365 [PMID: 16855380]
27 Bannister AJ, Zegerman P, Partridge JF, Miska EA, Thomas JO, Allshire RC, Kouzarides T. Selective recognition of methylated lysine 9 on histone H3 by the HP1 chromo domain. Nature 2001; 410: 120-124 [PMID: 11242054 DOI: 10.1038/35065138]
28 Daujat S, Zeissler U, Waldmann T, Happel N, Schneider R. HP1 binds specifically to Lys26-methylated histone H1.4, whereas simultaneous Ser27 phosphorylation blocks HP1 binding. J Biol Chem 2005; 280: 38090-38095 [PMID: 16127177 DOI: 10.1074/jbc.C500229200]
29 Jenuwein T, Allis CD. Translating the histone code. Science 2001; 293: 1074-1080 [PMID: 11498575 DOI: 10.1126/science.1063127]
30 Chi P, Allis CD, Wang GG. Covalent histone modifications--miswritten, misinterpreted and mis-erased in human cancers. Nat Rev Cancer 2010; 10: 457-469 [PMID: 20574448 DOI: 10.1038/nrc2876]
31 Lee JS, Smith E, Shilatifard A. The language of histone crosstalk. Cell 2010; 142: 682-685 [PMID: 20813257 DOI: 10.1016/j.cell.2010.08.011]
32 Daujat S, Bauer UM, Shah V, Turner B, Berger S, Kouzarides T. Crosstalk between CARM1 methylation and CBP acetylation on histone H3. Curr Biol 2002; 12: 2090-2097 [PMID: 12498683]
33 Fraga MF, Ballestar E, Villar-Garea A, Boix-Chornet M, Espada J, Schotta G, Bonaldi T, Haydon C, Ropero S, Petrie K, Iyer NG, Pérez-Rosado A, Calvo E, Lopez JA, Cano A, Calasanz MJ, Colomer D, Piris MA, Ahn N, Imhof A, Caldas C, Jenuwein T, Esteller M. Loss of acetylation at Lys16 and trimethylation at Lys20 of histone H4 is a common hallmark of human cancer. Nat Genet 2005; 37: 391-400 [PMID: 15765097 DOI: 10.1038/ng1531]
34 Zhu L, Yang J, Zhao L, Yu X, Wang L, Wang F, Cai Y, Jin J.
Expression of hMOF, but not HDAC4, is responsible for the global histone H4K16 acetylation in gastric carcinoma. Int J Oncol 2015; 46: 2535-2545 [PMID: 25873202 DOI: 10.3892/ijo.2015.2956]
35 Lin T, Ponn A, Hu X, Law BK, Lu J. Requirement of the histone demethylase LSD1 in Snai1-mediated transcriptional repression during epithelial-mesenchymal transition. Oncogene 2010; 29: 4896-4904 [PMID: 20562920 DOI: 10.1038/onc.2010.234]
36 Zhang Y, Li Q, Chen H. DNA methylation and histone modifications of Wnt genes by genistein during colon cancer development. Carcinogenesis 2013; 34: 1756-1763 [PMID: 23598468 DOI: 10.1093/carcin/bgt129]
37 Nguyen CT, Weisenberger DJ, Velicescu M, Gonzales FA, Lin JC, Liang G, Jones PA. Histone H3-lysine 9 methylation is associated with aberrant gene silencing in cancer cells and is rapidly reversed by 5-aza-2’-deoxycytidine. Cancer Res 2002; 62: 6456-6461 [PMID: 12438235]
38 Valk-Lingbeek ME, Bruggeman SW, van Lohuizen M. Stem cells and cancer; the polycomb connection. Cell 2004; 118: 409-418 [PMID: 15315754 DOI: 10.1016/j.cell.2004.08.005]
39 Prenzel T, Begus-Nahrmann Y, Kramer F, Hennion M, Hsu C, Gorsler T, Hintermair C, Eick D, Kremmer E, Simons M, Beissbarth T, Johnsen SA. Estrogen-dependent gene transcription in human breast cancer cells relies upon proteasome-dependent monoubiquitination of histone H2B. Cancer Res 2011; 71: 5739-5753 [PMID: 21862633 DOI: 10.1158/0008-5472.CAN-11-1896]
40 Li B, Huang G, Zhang X, Li R, Wang J, Dong Z, He Z. Increased phosphorylation of histone H3 at serine 10 is involved in Epstein-Barr virus latent membrane protein-1-induced carcinogenesis of nasopharyngeal carcinoma. BMC Cancer 2013; 13: 124 [PMID: 23496845 DOI: 10.1186/1471-2407-13-124]
41 Chadee DN, Hendzel MJ, Tylipski CP, Allis CD, Bazett-Jones DP, Wright JA, Davie JR. Increased Ser-10 phosphorylation of histone H3 in mitogen-stimulated and oncogene-transformed mouse fibroblasts. J Biol Chem 1999; 274: 24914-24920 [PMID: 10455166]
42 Choi HS, Choi BY, Cho YY, Mizuno H, Kang BS, Bode AM, Dong Z. Phosphorylation of histone H3 at serine 10 is indispensable for neoplastic cell transformation. Cancer Res 2005; 65: 5818-5827 [PMID: 15994958 DOI: 10.1158/0008-5472.CAN-05-0197]
43 Tange S, Ito S, Senga T, Hamaguchi M. Phosphorylation of histone H3 at Ser10: its role in cell transformation by v-Src. Biochem Biophys Res Commun 2009; 386: 588-592 [PMID: 19540193 DOI: 10.1016/j.bbrc.2009.06.082]
44 Kim HG, Lee KW, Cho YY, Kang NJ, Oh SM, Bode AM, Dong Z. Mitogen- and stress-activated kinase 1-mediated histone H3 phosphorylation is crucial for cell transformation. Cancer Res 2008; 68: 2538-2547 [PMID: 18381464 DOI: 10.1158/0008-5472.CAN-07-6597]
45 De Gruttola VG, Clax P, DeMets DL, Downing GJ, Ellenberg SS, Friedman L, Gail MH, Prentice R, Wittes J, Zeger SL. Considerations in the evaluation of surrogate endpoints in clinical trials. summary of a National Institutes of Health workshop. Control Clin Trials 2001; 22: 485-502 [PMID: 11578783]
46 Machiels BM, Ruers T, Lindhout M, Hardy K, Hlavaty T, Bang DD, Somers VA, Baeten C, von Meyenfeldt M, Thunnissen FB. New protocol for DNA extraction of stool. Biotechniques 2000; 28: 286-290 [PMID: 10683738]
47 Leon SA, Shapiro B, Sklaroff DM, Yaros MJ. Free DNA in the serum of cancer patients and the effect of therapy. Cancer Res 1977; 37: 646-650 [PMID: 837366]
48 Matei DE, Nephew KP. Epigenetic therapies for chemoresensitization of epithelial ovarian cancer. Gynecol Oncol 2010; 116: 195-201 [PMID: 19854495 DOI: 10.1016/j.ygyno.2009.09.043]
49 Ahlquist DA, Skoletsky JE, Boynton KA, Harrington JJ, Mahoney DW, Pierceall WE, Thibodeau SN, Shuber AP. Colorectal cancer screening by detection of altered human DNA in stool: feasibility of a multitarget assay panel. Gastroenterology 2000; 119: 1219-1227 [PMID: 11054379]
50 Leung WK, To KF, Man EP, Chan MW, Bai AH, Hui AJ, Chan FK, Lee JF, Sung JJ. Detection of epigenetic changes in fecal DNA as a molecular screening test for colorectal cancer: a feasibility study.
Khan SA et al . Global histone post-translational modifications and cancer
342 November 26, 2015|Volume 6|Issue 4|WJBC|www.wjgnet.com
Clin Chem 2004; 50: 2179-2182 [PMID: 15502094 DOI: 10.1373/clinchem.2004.039305]
51 Leung WK, To KF, Man EP, Chan MW, Hui AJ, Ng SS, Lau JY, Sung JJ. Detection of hypermethylated DNA or cyclooxygenase-2 messenger RNA in fecal samples of patients with colorectal cancer or polyps. Am J Gastroenterol 2007; 102: 1070-1076 [PMID: 17378912 DOI: 10.1111/j.1572-0241.2007.01108.x]
52 Li WH, Zhang H, Guo Q, Wu XD, Xu ZS, Dang CX, Xia P, Song YC. Detection of SNCA and FBN1 methylation in the stool as a biomarker for colorectal cancer. Dis Markers 2015; 2015: 657570 [PMID: 25802477 DOI: 10.1155/2015/657570]
53 Scher MB, Elbaum MB, Mogilevkin Y, Hilbert DW, Mydlo JH, Sidi AA, Adelson ME, Mordechai E, Trama JP. Detecting DNA methylation of the BCL2, CDKN2A and NID2 genes in urine using a nested methylation specific polymerase chain reaction assay to predict bladder cancer. J Urol 2012; 188: 2101-2107 [PMID: 23083854 DOI: 10.1016/j.juro.2012.08.015]
54 Chung W, Bondaruk J, Jelinek J, Lotan Y, Liang S, Czerniak B, Issa JP. Detection of bladder cancer using novel DNA methylation biomarkers in urine sediments. Cancer Epidemiol Biomarkers Prev 2011; 20: 1483-1491 [PMID: 21586619 DOI: 10.1158/1055-9965.EPI-11-0067]
55 Hoque MO, Begum S, Topaloglu O, Chatterjee A, Rosenbaum E, Van Criekinge W, Westra WH, Schoenberg M, Zahurak M, Goodman SN, Sidransky D. Quantitation of promoter methylation of multiple genes in urine DNA and bladder cancer detection. J Natl Cancer Inst 2006; 98: 996-1004 [PMID: 16849682 DOI: 10.1093/jnci/djj265]
56 Reinert T. Methylation markers for urine-based detection of bladder cancer: the next generation of urinary markers for diagnosis and surveillance of bladder cancer. Adv Urol 2012; 2012: 503271 [PMID: 22761614 DOI: 10.1155/2012/503271]
57 Olkhov-Mitsel E, Zdravic D, Kron K, van der Kwast T, Fleshner N, Bapat B. Novel multiplex MethyLight protocol for detection of DNA methylation in patient tissues and bodily fluids. Sci Rep 2014; 4: 4432 [PMID: 24651255 DOI: 10.1038/srep04432]
58 Barski A, Cuddapah S, Cui K, Roh TY, Schones DE, Wang Z, Wei G, Chepelev I, Zhao K. High-resolution profiling of histone methylations in the human genome. Cell 2007; 129: 823-837 [PMID: 17512414 DOI: 10.1016/j.cell.2007.05.009]
59 Gezer U, Mert U, Ozgur E, Yoruker EE, Holdenrieder S, Dalay N. Correlation of histone methyl marks with circulating nucleosomes in blood plasma of cancer patients. Oncol Lett 2012; 3: 1095-1098 [PMID: 22783398 DOI: 10.3892/ol.2012.600]
60 Holdenrieder S, Stieber P, Bodenmüller H, Busch M, Fertig G, Fürst H, Schalhorn A, Schmeller N, Untch M, Seidel D. Nucleosomes in serum of patients with benign and malignant diseases. Int J Cancer 2001; 95: 114-120 [PMID: 11241322]
61 Deligezer U, Akisik EE, Erten N, Dalay N. Sequence-specific histone methylation is detectable on circulating nucleosomes in plasma. Clin Chem 2008; 54: 1125-1131 [PMID: 18487283 DOI: 10.1373/clinchem.2007.101766]
62 Leszinski G, Gezer U, Siegele B, Stoetzer O, Holdenrieder S. Relevance of histone marks H3K9me3 and H4K20me3 in cancer. Anticancer Res 2012; 32: 2199-2205 [PMID: 22593510]
63 Gezer U, Ustek D, Yörüker EE, Cakiris A, Abaci N, Leszinski G, Dalay N, Holdenrieder S. Characterization of H3K9me3- and H4K20me3-associated circulating nucleosomal DNA by high-throughput sequencing in colorectal cancer. Tumour Biol 2013; 34: 329-336 [PMID: 23086575 DOI: 10.1007/s13277-012-0554-5]
64 Tryndyak VP, Kovalchuk O, Pogribny IP. Loss of DNA methylation and histone H4 lysine 20 trimethylation in human breast cancer cells is associated with aberrant expression of DNA methyltransferase 1, Suv4-20h2 histone methyltransferase and methyl-binding proteins. Cancer Biol Ther 2006; 5: 65-70 [PMID: 16322686]
65 Bagnyukova TV, Tryndyak VP, Montgomery B, Churchwell MI, Karpf AR, James SR, Muskhelishvili L, Beland FA, Pogribny IP. Genetic and epigenetic changes in rat preneoplastic liver tissue induced by 2-acetylaminofluorene. Carcinogenesis 2008; 29: 638-646 [PMID: 18204080 DOI: 10.1093/carcin/bgm303]
66 Seligson DB, Horvath S, Shi T, Yu H, Tze S, Grunstein M, Kurdistani SK. Global histone modification patterns predict risk of prostate cancer recurrence. Nature 2005; 435: 1262-1266 [PMID: 15988529 DOI: 10.1038/nature03672]
67 Seligson DB, Horvath S, McBrian MA, Mah V, Yu H, Tze S, Wang Q, Chia D, Goodglick L, Kurdistani SK. Global levels of histone modifications predict prognosis in different cancers. Am J Pathol 2009; 174: 1619-1628 [PMID: 19349354 DOI: 10.2353/ajpath.2009.080874]
68 Barlési F, Giaccone G, Gallegos-Ruiz MI, Loundou A, Span SW, Lefesvre P, Kruyt FA, Rodriguez JA. Global histone modifications predict prognosis of resected non small-cell lung cancer. J Clin Oncol 2007; 25: 4358-4364 [PMID: 17906200 DOI: 10.1200/JCO.2007.11.2599]
69 Elsheikh SE, Green AR, Rakha EA, Powe DG, Ahmed RA, Collins HM, Soria D, Garibaldi JM, Paish CE, Ammar AA, Grainge MJ, Ball GR, Abdelghany MK, Martinez-Pomares L, Heery DM, Ellis IO. Global histone modifications in breast cancer correlate with tumor phenotypes, prognostic factors, and patient outcome. Cancer Res 2009; 69: 3802-3809 [PMID: 19366799 DOI: 10.1158/0008-5472.CAN-08-3907]
70 Ellinger J, Kahl P, Mertens C, Rogenhofer S, Hauser S, Hartmann W, Bastian PJ, Büttner R, Müller SC, von Ruecker A. Prognostic relevance of global histone H3 lysine 4 (H3K4) methylation in renal cell carcinoma. Int J Cancer 2010; 127: 2360-2366 [PMID: 20162570 DOI: 10.1002/ijc.25250]
71 Manuyakorn A, Paulus R, Farrell J, Dawson NA, Tze S, Cheung-Lau G, Hines OJ, Reber H, Seligson DB, Horvath S, Kurdistani SK, Guha C, Dawson DW. Cellular histone modification patterns predict prognosis and treatment response in resectable pancreatic adenocarcinoma: results from RTOG 9704. J Clin Oncol 2010; 28: 1358-1365 [PMID: 20142597 DOI: 10.1200/JCO.2009.24.5639]
72 Rajendran G, Shanmuganandam K, Bendre A, Muzumdar D, Goel A, Shiras A. Epigenetic regulation of DNA methyltransferases: DNMT1 and DNMT3B in gliomas. J Neurooncol 2011; 104: 483-494 [PMID: 21229291 DOI: 10.1007/s11060-010-0520-2]
73 Bai X, Wu L, Liang T, Liu Z, Li J, Li D, Xie H, Yin S, Yu J, Lin Q, Zheng S. Overexpression of myocyte enhancer factor 2 and histone hyperacetylation in hepatocellular carcinoma. J Cancer Res Clin Oncol 2008; 134: 83-91 [PMID: 17611778 DOI: 10.1007/s00432-007-0252-7]
74 Mohamed MA, Greif PA, Diamond J, Sharaf O, Maxwell P, Montironi R, Young RA, Hamilton PW. Epigenetic events, remodelling enzymes and their relationship to chromatin organization in prostatic intraepithelial neoplasia and prostatic adenocarcinoma. BJU Int 2007; 99: 908-915 [PMID: 17378849 DOI: 10.1111/j.1464-410X.2006.06704.x]
75 Zhen L, Gui-lan L, Ping Y, Jin H, Ya-li W. The expression of H3K9Ac, H3K14Ac, and H4K20TriMe in epithelial ovarian tumors and the clinical significance. Int J Gynecol Cancer 2010; 20: 82-86 [PMID: 20057286 DOI: 10.1111/IGC.0b013e3181ae3efa]
76 Liu BL, Cheng JX, Zhang X, Wang R, Zhang W, Lin H, Xiao X, Cai S, Chen XY, Cheng H. Global histone modification patterns as prognostic markers to classify glioma patients. Cancer Epidemiol Biomarkers Prev 2010; 19: 2888-2896 [PMID: 20978174 DOI: 10.1158/1055-9965.EPI-10-0454]
77 Park YS, Jin MY, Kim YJ, Yook JH, Kim BS, Jang SJ. The global histone modification pattern correlates with cancer recurrence and overall survival in gastric adenocarcinoma. Ann Surg Oncol 2008; 15: 1968-1976 [PMID: 18470569 DOI: 10.1245/s10434-008-9927-9]
78 Müller-Tidow C, Klein HU, Hascher A, Isken F, Tickenbrock L, Thoennissen N, Agrawal-Singh S, Tschanter P, Disselhoff C, Wang Y, Becker A, Thiede C, Ehninger G, zur Stadt U, Koschmieder S, Seidl M, Müller FU, Schmitz W, Schlenke P, McClelland M, Berdel WE, Dugas M, Serve H. Profiling of histone H3 lysine 9 trimethylation levels predicts transcription factor activity and survival in acute myeloid leukemia. Blood 2010; 116: 3564-3571 [PMID: 20498303 DOI: 10.1182/blood-2009-09-240978]
79 Ferrari R, Pellegrini M, Horwitz GA, Xie W, Berk AJ, Kurdistani SK. Epigenetic reprogramming by adenovirus e1a. Science 2008;
Khan SA et al . Global histone post-translational modifications and cancer

343 November 26, 2015|Volume 6|Issue 4|WJBC|www.wjgnet.com
321: 1086-1088 [PMID: 18719284 DOI: 10.1126/science.1155546]80 Horwitz GA, Zhang K, McBrian MA, Grunstein M, Kurdistani
SK, Berk AJ. Adenovirus small e1a alters global patterns of histone modification. Science 2008; 321: 1084-1085 [PMID: 18719283 DOI: 10.1126/science.1155544]
81 Tzao C, Tung HJ, Jin JS, Sun GH, Hsu HS, Chen BH, Yu CP, Lee SC. Prognostic significance of global histone modifications in resected squamous cell carcinoma of the esophagus. Mod Pathol 2009; 22: 252-260 [PMID: 18953329 DOI: 10.1038/modpathol.2008.172]
82 Yu J, Yu J, Rhodes DR, Tomlins SA, Cao X, Chen G, Mehra R, Wang X, Ghosh D, Shah RB, Varambally S, Pienta KJ, Chinnaiyan AM. A polycomb repression signature in metastatic prostate cancer predicts cancer outcome. Cancer Res 2007; 67: 10657-10663 [PMID: 18006806 DOI: 10.1158/0008-5472.CAN-07-2498]
83 Wei Y, Xia W, Zhang Z, Liu J, Wang H, Adsay NV, Albarracin C, Yu D, Abbruzzese JL, Mills GB, Bast RC, Hortobagyi GN, Hung MC. Loss of trimethylation at lysine 27 of histone H3 is a predictor of poor outcome in breast, ovarian, and pancreatic cancers. Mol Carcinog 2008; 47: 701-706 [PMID: 18176935 DOI: 10.1002/mc.20413]
84 He LR, Liu MZ, Li BK, Rao HL, Liao YJ, Guan XY, Zeng YX, Xie D. Prognostic impact of H3K27me3 expression on locoregional progression after chemoradiotherapy in esophageal squamous cell carcinoma. BMC Cancer 2009; 9: 461 [PMID: 20028503 DOI: 10.1186/1471-2407-9-461]
85 Zhang L, Zhong K, Dai Y, Zhou H. Genome-wide analysis of histone H3 lysine 27 trimethylation by ChIP-chip in gastric cancer patients. J Gastroenterol 2009; 44: 305-312 [PMID: 19267258 DOI: 10.1007/s00535-009-0027-9]
86 Chen X, Song N, Matsumoto K, Nanashima A, Nagayasu T, Hayashi T, Ying M, Endo D, Wu Z, Koji T. High expression of trimethylated histone H3 at lysine 27 predicts better prognosis in non-small cell lung cancer. Int J Oncol 2013; 43: 1467-1480 [PMID: 23969945 DOI: 10.3892/ijo.2013.2062]
87 Schwartzentruber J, Korshunov A, Liu XY, Jones DT, Pfaff E, Jacob K, Sturm D, Fontebasso AM, Quang DA, Tönjes M, Hovestadt V, Albrecht S, Kool M, Nantel A, Konermann C, Lindroth A, Jäger N, Rausch T, Ryzhova M, Korbel JO, Hielscher T, Hauser P, Garami M, Klekner A, Bognar L, Ebinger M, Schuhmann MU, Scheurlen W, Pekrun A, Frühwald MC, Roggendorf W, Kramm C, Dürken M, Atkinson J, Lepage P, Montpetit A, Zakrzewska M, Zakrzewski K, Liberski PP, Dong Z, Siegel P, Kulozik AE, Zapatka M, Guha A, Malkin D, Felsberg J, Reifenberger G, von Deimling A, Ichimura K, Collins VP, Witt H, Milde T, Witt O, Zhang C, Castelo-Branco P, Lichter P, Faury D, Tabori U, Plass C, Majewski J, Pfister SM, Jabado N. Driver mutations in histone H3.3 and chromatin remodelling genes in paediatric glioblastoma. Nature 2012; 482: 226-231 [PMID: 22286061 DOI: 10.1038/nature10833]
88 Karczmarski J, Rubel T, Paziewska A, Mikula M, Bujko M, Kober P, Dadlez M, Ostrowski J. Histone H3 lysine 27 acetylation is altered in colon cancer. Clin Proteomics 2014; 11: 24 [PMID: 24994966 DOI: 10.1186/1559-0275-11-24]
89 Tamagawa H, Oshima T, Shiozawa M, Morinaga S, Nakamura Y, Yoshihara M, Sakuma Y, Kameda Y, Akaike M, Masuda M, Imada T, Miyagi Y. The global histone modification pattern correlates with overall survival in metachronous liver metastasis of colorectal cancer. Oncol Rep 2012; 27: 637-642 [PMID: 22076537 DOI: 10.3892/or.2011.1547]
90 Nagelkerke A, van Kuijk SJ, Sweep FC, Nagtegaal ID, Hoogerbrugge N, Martens JW, Timmermans MA, van Laarhoven HW, Bussink J, Span PN. Constitutive expression of γ-H2AX has prognostic relevance in triple negative breast cancer. Radiother Oncol 2011; 101: 39-45 [PMID: 21840613 DOI: 10.1016/j.radonc.2011.07.009]
91 Nagelkerke A, van Kuijk SJ, Martens JW, Sweep FC, Hoogerbrugge N, Bussink J, Span PN. Poor prognosis of constitutive γ-H2AX expressing triple-negative breast cancers is associated with telomere length. Biomark Med 2015; 9: 383-390 [PMID: 25808442 DOI: 10.2217/bmm.15.2]
92 Lee YC, Yin TC, Chen YT, Chai CY, Wang JY, Liu MC, Lin
YC, Kan JY. High expression of phospho-H2AX predicts a poor prognosis in colorectal cancer. Anticancer Res 2015; 35: 2447-2453 [PMID: 25862913]
93 Pacaud R, Cheray M, Nadaradjane A, Vallette FM, Cartron PF. Histone H3 phosphorylation in GBM: a new rational to guide the use of kinase inhibitors in anti-GBM therapy. Theranostics 2015; 5: 12-22 [PMID: 25553095 DOI: 10.7150/thno.8799]
94 Ladstein RG, Bachmann IM, Straume O, Akslen LA. Prognostic importance of the mitotic marker phosphohistone H3 in cutaneous nodular melanoma. J Invest Dermatol 2012; 132: 1247-1252 [PMID: 22297638 DOI: 10.1038/jid.2011.464]
95 Tetzlaff MT, Curry JL, Ivan D, Wang WL, Torres-Cabala CA, Bassett RL, Valencia KM, McLemore MS, Ross MI, Prieto VG. Immunodetection of phosphohistone H3 as a surrogate of mitotic figure count and clinical outcome in cutaneous melanoma. Mod Pathol 2013; 26: 1153-1160 [PMID: 23558574 DOI: 10.1038/modpathol.2013.59]
96 Skaland I, Janssen EA, Gudlaugsson E, Klos J, Kjellevold KH, Søiland H, Baak JP. Validating the prognostic value of proliferation measured by Phosphohistone H3 (PPH3) in invasive lymph node-negative breast cancer patients less than 71 years of age. Breast Cancer Res Treat 2009; 114: 39-45 [PMID: 18373192 DOI: 10.1007/s10549-008-9980-x]
97 Skaland I, Janssen EA, Gudlaugsson E, Klos J, Kjellevold KH, Søiland H, Baak JP. Phosphohistone H3 expression has much stronger prognostic value than classical prognosticators in invasive lymph node-negative breast cancer patients less than 55 years of age. Mod Pathol 2007; 20: 1307-1315 [PMID: 17917671 DOI: 10.1038/modpathol.3800972]
98 Nakashima S, Shiozaki A, Ichikawa D, Komatsu S, Konishi H, Iitaka D, Kubota T, Fujiwara H, Okamoto K, Kishimoto M, Otsuji E. Anti-phosphohistone H3 as an independent prognostic factor in human esophageal squamous cell carcinoma. Anticancer Res 2013; 33: 461-467 [PMID: 23393337]
99 Uguen A, Conq G, Doucet L, Talagas M, Costa S, De Braekeleer M, Marcorelles P. Immunostaining of phospho-histone H3 and Ki-67 improves reproducibility of recurrence risk assessment of gastrointestinal stromal tumors. Virchows Arch 2015; 467: 47-54 [PMID: 25823616 DOI: 10.1007/s00428-015-1763-2]
100 Takahashi H, Murai Y, Tsuneyama K, Nomoto K, Okada E, Fujita H, Takano Y. Overexpression of phosphorylated histone H3 is an indicator of poor prognosis in gastric adenocarcinoma patients. Appl Immunohistochem Mol Morphol 2006; 14: 296-302 [PMID: 16932020]
101 Nielsen PS, Riber-Hansen R, Jensen TO, Schmidt H, Steiniche T. Proliferation indices of phosphohistone H3 and Ki67: strong prognostic markers in a consecutive cohort with stage I/II melanoma. Mod Pathol 2013; 26: 404-413 [PMID: 23174936 DOI: 10.1038/modpathol.2012.188]
102 Marmorstein R, Trievel RC. Histone modifying enzymes: structures, mechanisms, and specificities. Biochim Biophys Acta 2009; 1789: 58-68 [PMID: 18722564 DOI: 10.1016/j.bbagrm.2008.07.009]
103 Cole PA. Chemical probes for histone-modifying enzymes. Nat Chem Biol 2008; 4: 590-597 [PMID: 18800048 DOI: 10.1038/nchembio.111]
104 Espino PS, Drobic B, Dunn KL, Davie JR. Histone modifications as a platform for cancer therapy. J Cell Biochem 2005; 94: 1088-1102 [PMID: 15723344 DOI: 10.1002/jcb.20387]
105 Balch C, Nephew KP. Epigenetic targeting therapies to overcome chemotherapy resistance. Adv Exp Med Biol 2013; 754: 285-311 [PMID: 22956507 DOI: 10.1007/978-1-4419-9967-2_14]
106 Li SY, Sun R, Wang HX, Shen S, Liu Y, Du XJ, Zhu YH, Jun W. Combination therapy with epigenetic-targeted and chemotherapeutic drugs delivered by nanoparticles to enhance the chemotherapy response and overcome resistance by breast cancer stem cells. J Control Release 2015; 205: 7-14 [PMID: 25445694 DOI: 10.1016/j.jconrel.2014.11.011]
107 Cameron EE, Bachman KE, Myöhänen S, Herman JG, Baylin SB. Synergy of demethylation and histone deacetylase inhibition in the re-expression of genes silenced in cancer. Nat Genet 1999; 21:
Khan SA et al . Global histone post-translational modifications and cancer
344 November 26, 2015|Volume 6|Issue 4|WJBC|www.wjgnet.com
103-107 [PMID: 9916800 DOI: 10.1038/5047]108 Cacan E, Ali MW, Boyd NH, Hooks SB, Greer SF. Inhibition of
HDAC1 and DNMT1 modulate RGS10 expression and decrease ovarian cancer chemoresistance. PLoS One 2014; 9: e87455 [PMID: 24475290 DOI: 10.1371/journal.pone.0087455]
109 Hehlgans S, Storch K, Lange I, Cordes N. The novel HDAC inhibitor NDACI054 sensitizes human cancer cells to radiotherapy. Radiother Oncol 2013; 109: 126-132 [PMID: 24060178 DOI: 10.1016/j.radonc.2013.08.023]
110 Hubaux R, Vandermeers F, Crisanti MC, Kapoor V, Burny A, Mascaux C, Albelda SM, Willems L. Preclinical evidence for a beneficial impact of valproate on the response of small cell lung cancer to first-line chemotherapy. Eur J Cancer 2010; 46: 1724-1734 [PMID: 20451370 DOI: 10.1016/j.ejca.2010.03.021]
111 Munster PN, Troso-Sandoval T, Rosen N, Rifkind R, Marks PA, Richon VM. The histone deacetylase inhibitor suberoylanilide hydroxamic acid induces differentiation of human breast cancer cells. Cancer Res 2001; 61: 8492-8497 [PMID: 11731433]
112 Louis M, Rosato RR, Brault L, Osbild S, Battaglia E, Yang XH, Grant S, Bagrel D. The histone deacetylase inhibitor sodium butyrate induces breast cancer cell apoptosis through diverse cytotoxic actions including glutathione depletion and oxidative stress. Int J Oncol 2004; 25: 1701-1711 [PMID: 15547708]
113 Said TK, Moraes RC, Sinha R, Medina D. Mechanisms of suberoylanilide hydroxamic acid inhibition of mammary cell growth. Breast Cancer Res 2001; 3: 122-133 [PMID: 11250759 DOI: 10.1186/bcr284]
114 Dizon DS, Blessing JA, Penson RT, Drake RD, Walker JL, Johnston CM, Disilvestro PA, Fader AN. A phase II evaluation of belinostat and carboplatin in the treatment of recurrent or persistent platinum-resistant ovarian, fallopian tube, or primary peritoneal carcinoma: a Gynecologic Oncology Group study. Gynecol Oncol 2012; 125: 367-371 [PMID: 22366594 DOI: 10.1016/j.ygyno.2012.02.019]
115 Tarhini AA, Zahoor H, McLaughlin B, Gooding WE, Schmitz JC, Siegfried JM, Socinski MA, Argiris A. Phase I trial of carboplatin and etoposide in combination with panobinostat in patients with lung cancer. Anticancer Res 2013; 33: 4475-4481 [PMID: 24123018]
116 Cassier PA, Lefranc A, Amela EY, Chevreau C, Bui BN, Lecesne A, Ray-Coquard I, Chabaud S, Penel N, Berge Y, Dômont J, Italiano A, Duffaud F, Cadore AC, Polivka V, Blay JY. A phase II trial of panobinostat in patients with advanced pretreated soft tissue sarcoma. A study from the French Sarcoma Group. Br J Cancer 2013; 109: 909-914 [PMID: 23922114 DOI: 10.1038/bjc.2013.442]
117 Witta SE, Jotte RM, Konduri K, Neubauer MA, Spira AI, Ruxer RL, Varella-Garcia M, Bunn PA, Hirsch FR. Randomized phase II trial of erlotinib with and without entinostat in patients with advanced non-small-cell lung cancer who progressed on prior chemotherapy. J Clin Oncol 2012; 30: 2248-2255 [PMID: 22508830 DOI: 10.1200/JCO.2011.38.9411]
118 Yardley DA, Ismail-Khan RR, Melichar B, Lichinitser M, Munster PN, Klein PM, Cruickshank S, Miller KD, Lee MJ, Trepel JB. Randomized phase II, double-blind, placebo-controlled study of exemestane with or without entinostat in postmenopausal women with locally recurrent or metastatic estrogen receptor-positive breast cancer progressing on treatment with a nonsteroidal aromatase inhibitor. J Clin Oncol 2013; 31: 2128-2135 [PMID: 23650416 DOI: 10.1200/JCO.2012.43.7251]
119 Dong M, Ning ZQ, Xing PY, Xu JL, Cao HX, Dou GF, Meng ZY, Shi YK, Lu XP, Feng FY. Phase I study of chidamide (CS055/HBI-8000), a new histone deacetylase inhibitor, in patients with advanced solid tumors and lymphomas. Cancer Chemother Pharmacol 2012; 69: 1413-1422 [PMID: 22362161 DOI: 10.1007/s00280-012-1847-5]
120 Zorzi AP, Bernstein M, Samson Y, Wall DA, Desai S, Nicksy D, Wainman N, Eisenhauer E, Baruchel S. A phase I study of histone deacetylase inhibitor, pracinostat (SB939), in pediatric patients with refractory solid tumors: IND203 a trial of the NCIC IND program/C17 pediatric phase I consortium. Pediatr Blood Cancer 2013; 60: 1868-1874 [PMID: 23893953 DOI: 10.1002/pbc.24694]
121 de Bono JS, Kristeleit R, Tolcher A, Fong P, Pacey S, Karavasilis
V, Mita M, Shaw H, Workman P, Kaye S, Rowinsky EK, Aherne W, Atadja P, Scott JW, Patnaik A. Phase I pharmacokinetic and pharmacodynamic study of LAQ824, a hydroxamate histone deacetylase inhibitor with a heat shock protein-90 inhibitory profile, in patients with advanced solid tumors. Clin Cancer Res 2008; 14: 6663-6673 [PMID: 18927309 DOI: 10.1158/1078-0432.CCR-08-0376]
122 Shi H, Wei SH, Leu YW, Rahmatpanah F, Liu JC, Yan PS, Nephew KP, Huang TH. Triple analysis of the cancer epigenome: an integrated microarray system for assessing gene expression, DNA methylation, and histone acetylation. Cancer Res 2003; 63: 2164-2171 [PMID: 12727835]
123 Yang X, Phillips DL, Ferguson AT, Nelson WG, Herman JG, Davidson NE. Synergistic activation of functional estrogen receptor (ER)-alpha by DNA methyltransferase and histone deacetylase inhibition in human ER-alpha-negative breast cancer cells. Cancer Res 2001; 61: 7025-7029 [PMID: 11585728]
124 Belinsky SA, Klinge DM, Stidley CA, Issa JP, Herman JG, March TH, Baylin SB. Inhibition of DNA methylation and histone deacetylation prevents murine lung cancer. Cancer Res 2003; 63: 7089-7093 [PMID: 14612500]
125 Marchion DC, Bicaku E, Daud AI, Richon V, Sullivan DM, Munster PN. Sequence-specific potentiation of topoisomerase II inhibitors by the histone deacetylase inhibitor suberoylanilide hydroxamic acid. J Cell Biochem 2004; 92: 223-237 [PMID: 15108350 DOI: 10.1002/jcb.20045]
126 Marchion DC, Bicaku E, Daud AI, Sullivan DM, Munster PN. In vivo synergy between topoisomerase II and histone deacetylase inhibitors: predictive correlates. Mol Cancer Ther 2005; 4: 1993-2000 [PMID: 16373714 DOI: 10.1158/1535-7163.MCT-05-0194]
127 Belinsky SA, Grimes MJ, Picchi MA, Mitchell HD, Stidley CA, Tesfaigzi Y, Channell MM, Liu Y, Casero RA, Baylin SB, Reed MD, Tellez CS, March TH. Combination therapy with vidaza and entinostat suppresses tumor growth and reprograms the epigenome in an orthotopic lung cancer model. Cancer Res 2011; 71: 454-462 [PMID: 21224363 DOI: 10.1158/0008-5472.CAN-10-3184]
128 Andrade FO, Nagamine MK, Conti AD, Chaible LM, Fontelles CC, Jordão Junior AA, Vannucchi H, Dagli ML, Bassoli BK, Moreno FS, Ong TP. Efficacy of the dietary histone deacetylase inhibitor butyrate alone or in combination with vitamin A against proliferation of MCF-7 human breast cancer cells. Braz J Med Biol Res 2012; 45: 841-850 [PMID: 22714808]
129 Mack GS. To selectivity and beyond. Nat Biotechnol 2010; 28: 1259-1266 [PMID: 21139608 DOI: 10.1038/nbt.1724]
130 Metzger E, Wissmann M, Yin N, Müller JM, Schneider R, Peters AH, Günther T, Buettner R, Schüle R. LSD1 demethylates repressive histone marks to promote androgen-receptor-dependent transcription. Nature 2005; 437: 436-439 [PMID: 16079795 DOI: 10.1038/nature04020]
131 Lim S, Janzer A, Becker A, Zimmer A, Schüle R, Buettner R, Kirfel J. Lysine-specific demethylase 1 (LSD1) is highly expressed in ER-negative breast cancers and a biomarker predicting aggressive biology. Carcinogenesis 2010; 31: 512-520 [PMID: 20042638 DOI: 10.1093/carcin/bgp324]
132 Schulte JH, Lim S, Schramm A, Friedrichs N, Koster J, Versteeg R, Ora I, Pajtler K, Klein-Hitpass L, Kuhfittig-Kulle S, Metzger E, Schüle R, Eggert A, Buettner R, Kirfel J. Lysine-specific demethylase 1 is strongly expressed in poorly differentiated neuroblastoma: implications for therapy. Cancer Res 2009; 69: 2065-2071 [PMID: 19223552 DOI: 10.1158/0008-5472.CAN-08-1735]
133 Huang Y, Stewart TM, Wu Y, Baylin SB, Marton LJ, Perkins B, Jones RJ, Woster PM, Casero RA. Novel oligoamine analogues inhibit lysine-specific demethylase 1 and induce reexpression of epigenetically silenced genes. Clin Cancer Res 2009; 15: 7217-7228 [PMID: 19934284 DOI: 10.1158/1078-0432.CCR-09-1293]
134 Wu Y, Steinbergs N, Murray-Stewart T, Marton LJ, Casero RA. Oligoamine analogues in combination with 2-difluoromethylornithine synergistically induce re-expression of aberrantly silenced tumour-suppressor genes. Biochem J 2012; 442: 693-701 [PMID: 22132744 DOI: 10.1042/BJ20111271]
Khan SA et al . Global histone post-translational modifications and cancer
345 November 26, 2015|Volume 6|Issue 4|WJBC|www.wjgnet.com
135 Wang J, Hevi S, Kurash JK, Lei H, Gay F, Bajko J, Su H, Sun W, Chang H, Xu G, Gaudet F, Li E, Chen T. The lysine demethylase LSD1 (KDM1) is required for maintenance of global DNA methylation. Nat Genet 2009; 41: 125-129 [PMID: 19098913 DOI: 10.1038/ng.268]
136 Bracken AP, Dietrich N, Pasini D, Hansen KH, Helin K. Genome-wide mapping of Polycomb target genes unravels their roles in cell fate transitions. Genes Dev 2006; 20: 1123-1136 [PMID: 16618801 DOI: 10.1101/gad.381706]
137 Albert M, Helin K. Histone methyltransferases in cancer. Semin Cell Dev Biol 2010; 21: 209-220 [PMID: 19892027 DOI: 10.1016/j.semcdb.2009.10.007]
138 Gannon OM, Merida de Long L, Endo-Munoz L, Hazar-Rethinam M, Saunders NA. Dysregulation of the repressive H3K27 trimethylation mark in head and neck squamous cell carcinoma contributes to dysregulated squamous differentiation. Clin Cancer Res 2013; 19: 428-441 [PMID: 23186778 DOI: 10.1158/1078-0432.CCR-12-2505]
139 Tan J, Yang X, Zhuang L, Jiang X, Chen W, Lee PL, Karuturi RK, Tan PB, Liu ET, Yu Q. Pharmacologic disruption of Polycomb-repressive complex 2-mediated gene repression selectively induces apoptosis in cancer cells. Genes Dev 2007; 21: 1050-1063 [PMID: 17437993 DOI: 10.1101/gad.1524107]
140 Wang D, Lippard SJ. Cisplatin-induced post-translational modification of histones H3 and H4. J Biol Chem 2004; 279: 20622-20625 [PMID: 15010460 DOI: 10.1074/jbc.M402547200]
141 Füllgrabe J, Hajji N, Joseph B. Cracking the death code: apoptosis-related histone modifications. Cell Death Differ 2010; 17: 1238-1243 [PMID: 20467440 DOI: 10.1038/cdd.2010.58]
142 Garcia BA, Thomas CE, Kelleher NL, Mizzen CA. Tissue-specific expression and post-translational modification of histone H3 variants. J Proteome Res 2008; 7: 4225-4236 [PMID: 18700791 DOI: 10.1021/pr800044q]
143 Gut P, Verdin E. The nexus of chromatin regulation and intermediary metabolism. Nature 2013; 502: 489-498 [PMID: 24153302 DOI: 10.1038/nature12752]
P- Reviewer: Cui YP, Freire-De-Lima CG, Hong YR, Pajares MA S- Editor: Song XX L- Editor: A E- Editor: Lu YJ
Khan SA et al . Global histone post-translational modifications and cancer

© 2015 Baishideng Publishing Group Inc. All rights reserved.
Published by Baishideng Publishing Group Inc8226 Regency Drive, Pleasanton, CA 94588, USA
Telephone: +1-925-223-8242Fax: +1-925-223-8243
E-mail: [email protected] Desk: http://www.wjgnet.com/esps/helpdesk.aspx
http://www.wjgnet.com


![Garcia-Gimenez et al manuscript FRBM[1]digital.csic.es/bitstream/10261/116940/4/histone... · 2019-02-21 · Epigenetics, Histones, Carbonylation, poly(ADP-ribosyl)ation, cell proliferation](https://static.cupdf.com/doc/110x72/5fa237bfceb2131c3f44010f/garcia-gimenez-et-al-manuscript-frbm1-2019-02-21-epigenetics-histones-carbonylation.jpg)


