Energy Security in aEnergy Security in a
Resource Constrained WorldResource Constrained World
Presented by: Erica Johnson
Chief Officer: Customer Network Business
Eskom
27 October 2008
AMEU Conference

Presentation Themes
Global Resource Constraints – regional energy constraints understood within the global context
Current South African energy position – understanding the hard realities
Climate change and technology options - a range of choices but at what cost
Closer to home – what’s happening in electricity supply
In conclusion – what’s the current opportunity for South Africa

Global Energy Trends

Global energy market trends
• Energy market is huge – 10% of worlds GDP or $ 6 trillion pa
• Energy demand increasing rapidly
• Leading innovators, technologists and financiers moving into energy – next potential boom will dwarf information technology
• Slowly moving to the true cost of energy – new economic models, full life cycle costing & impacts
• Incremental change rather than revolutionary, but things can change rapidly
Hydro, 2%Nuclear, 5%
Coal, 28%
Gas, 22%
Oil, 33%
Other, 2%
Biomass & Waste,
9%
Global projected energy growth trends
Mega tonne of oil equivalent (Mtoe)
200511,429 Mtoe
203017,721 Mtoe
Growth:
6,292 Mtoe = 55%
1.8% p.a
Source: IEA World Energy Outlook 2007 Reference Scenario
Biomass &
Waste, 10%
Hydro, 2%
Nuclear, 6%
Coal, 25%
Gas, 21%
Oil, 35%
Other, 1%
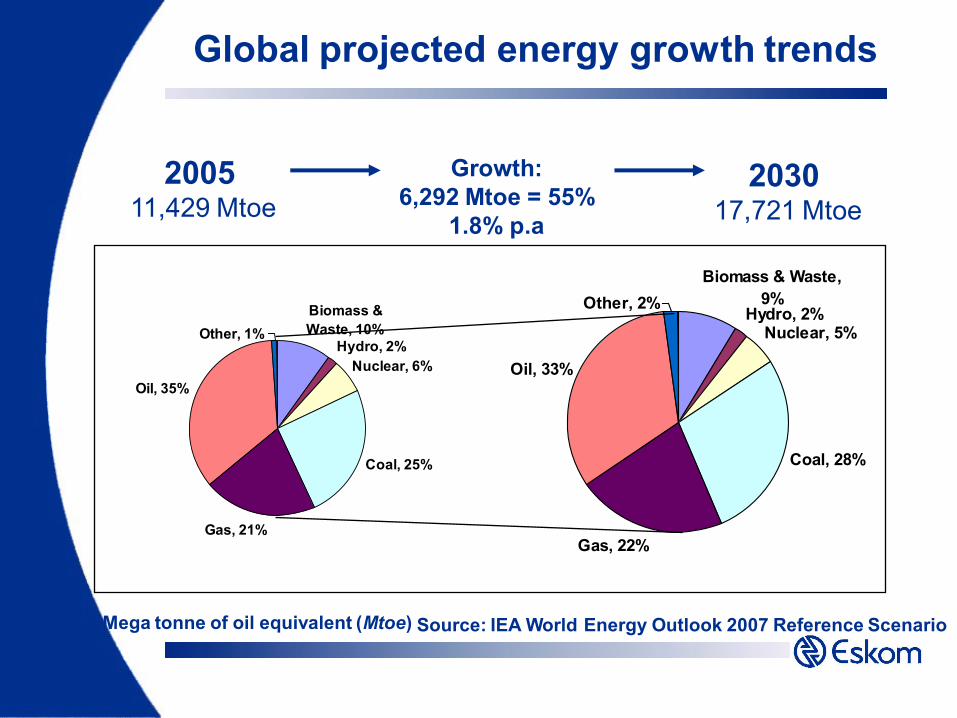
Global energy trends leading to
resource constraints
• Demand Growth– Global usage patterns have changed and will accelerate
– Substantial economic growth in Asia, overtaking European and North American energy demand
• Improvements in energy intensity will soften impact of growth
• Supply limitations– There is a finite supply of fossil fuels
– The Hubbert peak proposition
• Point in time where fossil fuel production in a region peaks before going into decline
• The peak has occurred in specific regions
• Debate regarding the global peak – is it approaching or has it already been reached?
South African Energy Position

Regional comparisons of Energy Intensity
Source: EPRI, WRI (2005), Earthtrends data web site
South Africa’s energy intensity grew from 1990 to 2000 before dipping by
2004 due to growth in the tertiary sectors(finance, retail etc) relative to energy
intensive primary sectors (manufacturing and mining)
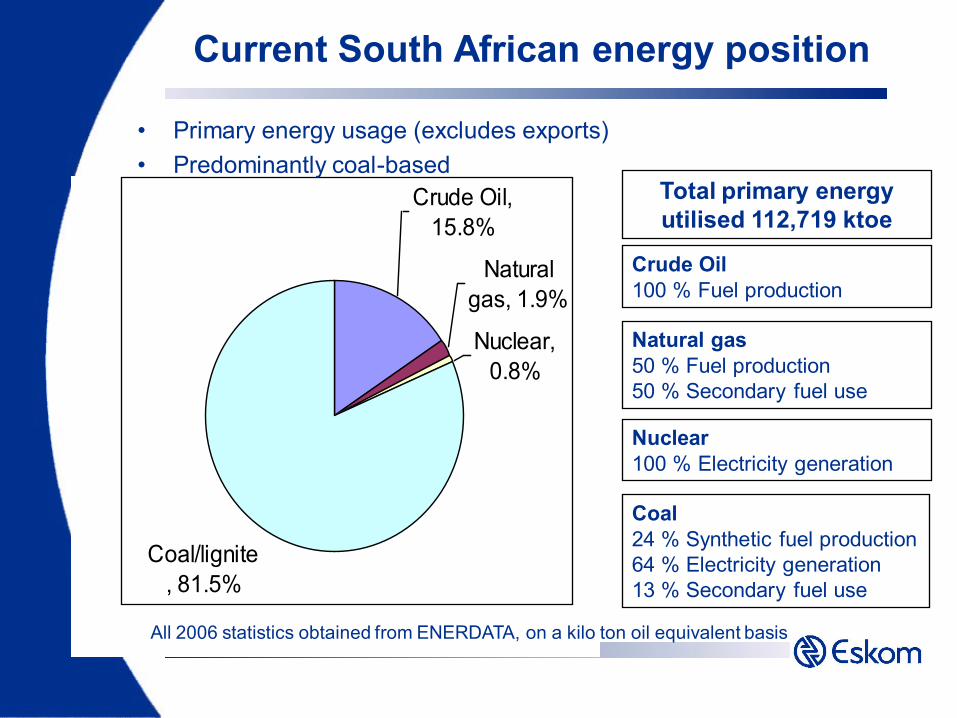
Crude Oil,
15.8%
Natural
gas, 1.9%
Nuclear,
0.8%
Coal/lignite
, 81.5%
Current South African energy position
• Primary energy usage (excludes exports)
• Predominantly coal-based
All 2006 statistics obtained from ENERDATA, on a kilo ton oil equivalent basis
Coal
24 % Synthetic fuel production
64 % Electricity generation
13 % Secondary fuel use
Crude Oil
100 % Fuel production
Natural gas
50 % Fuel production
50 % Secondary fuel use
Nuclear
100 % Electricity generation
Total primary energy
utilised 112,719 ktoe
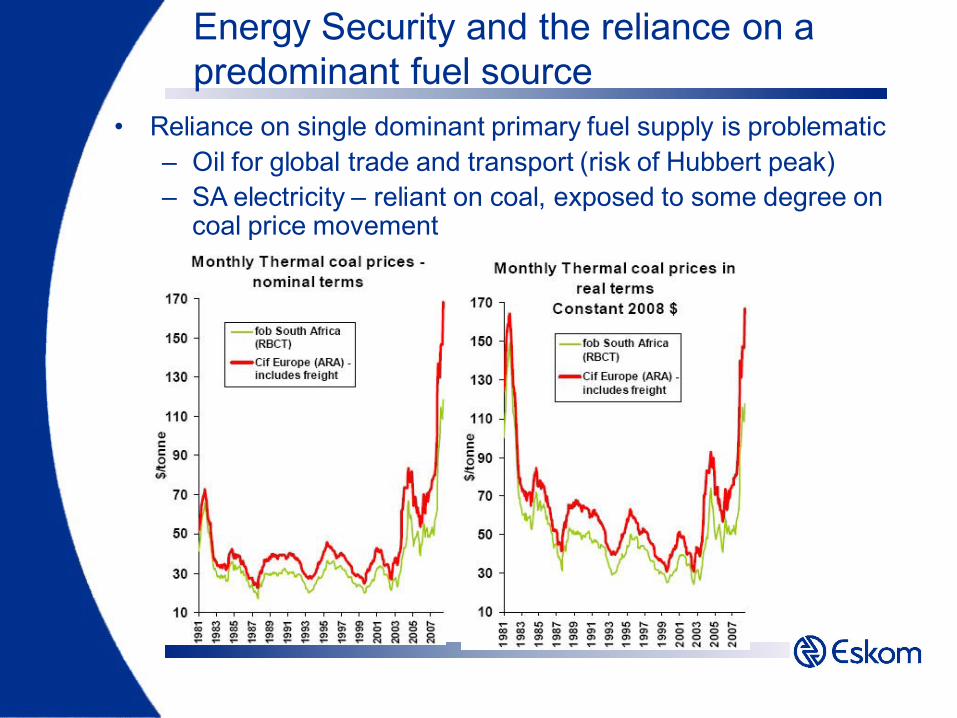
Energy Security and the reliance on a
predominant fuel source
Source: EPRI, Macquarie Research
• Reliance on single dominant primary fuel supply is problematic
– Oil for global trade and transport (risk of Hubbert peak)
– SA electricity – reliant on coal, exposed to some degree on coal price movement
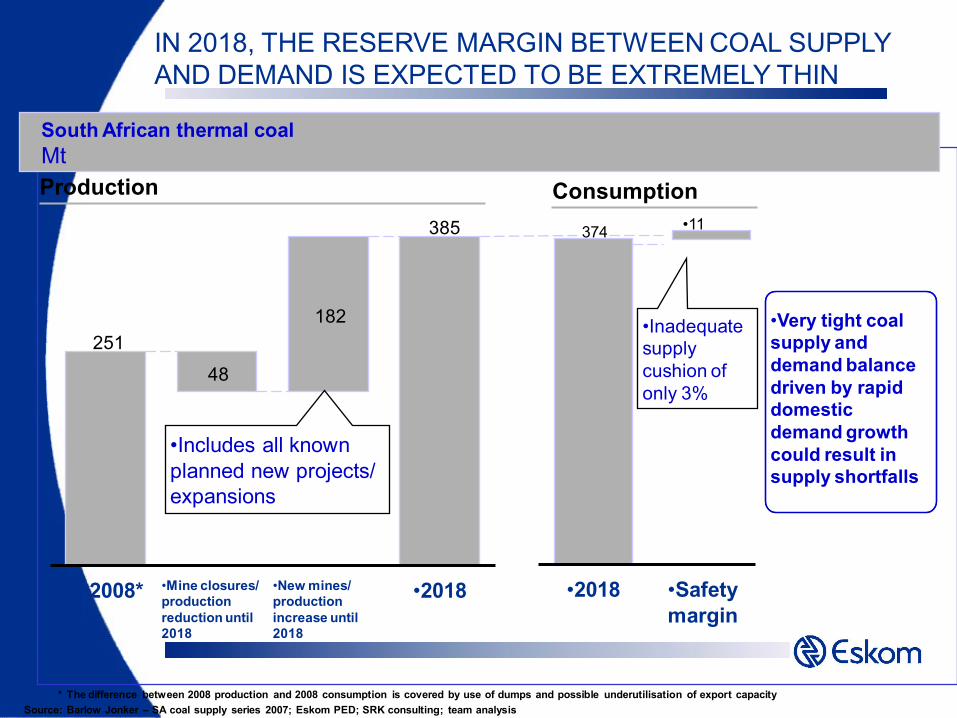
IN 2018, THE RESERVE MARGIN BETWEEN COAL SUPPLY
AND DEMAND IS EXPECTED TO BE EXTREMELY THIN
South African thermal coal
Mt
•2008* •Mine closures/
production
reduction until
2018
•New mines/
production
increase until
2018
•2018
•11
•2018 •Safety
margin
Production Consumption
* The difference between 2008 production and 2008 consumption is covered by use of dumps and possible underutilisation of export capacity
Source: Barlow Jonker – SA coal supply series 2007; Eskom PED; SRK consulting; team analysis
•Very tight coal
supply and
demand balance
driven by rapid
domestic
demand growth
could result in
supply shortfalls
48
182
385
251
•Includes all known
planned new projects/
expansions
374
•Inadequate
supply
cushion of
only 3%

SA energy economy change drivers
• Electricity generation and new build programme
– Low grade coal no longer cheap
– Global competition for equipment supply and scare skills
– Rising costs of current electricity production
– Daunting environmental costs and global pressure on Eskom to reduce carbon footprint
– Huge capital requirements for new plant.
– Funding access limitations in the current global credit crunch?
– Government financial support required and tariffs need to increase substantially
– Coal and classic nuclear the only short/medium term viable options
– Rapid build program and investment in new mines required
• But the opportunity to fundamentally shift the energy landscape lies in these multitude of change drivers…..

Looking to the Future

Long-Term Electricity Demand Forecasts
Long term forecasts - national + foreign
30000
40000
50000
60000
70000
80000
90000
2005 2010 2015 2020 2025
MW
Position
Moderate
Additional 40 000MW added to current capacity
56 710MW
77 960MWEskom position based on 4%
electricity growth supporting
6% GDP growth
Eskom moderate position
2.3% electricity growth
based GDP growth of 4%

Climate Change• IPCC links fossil fuel burning to global
warming
– Focus on shifting primary energy from fossil fuels
– Expected that SA will have Kyoto II obligations on emissions
– DME targets for renewable energy production
– ISEP-11 includes 1620MW of renewable capacity
– Base load nuclear power stations present an opportunity to limit the carbon emissions
• Adaptation has to start now!
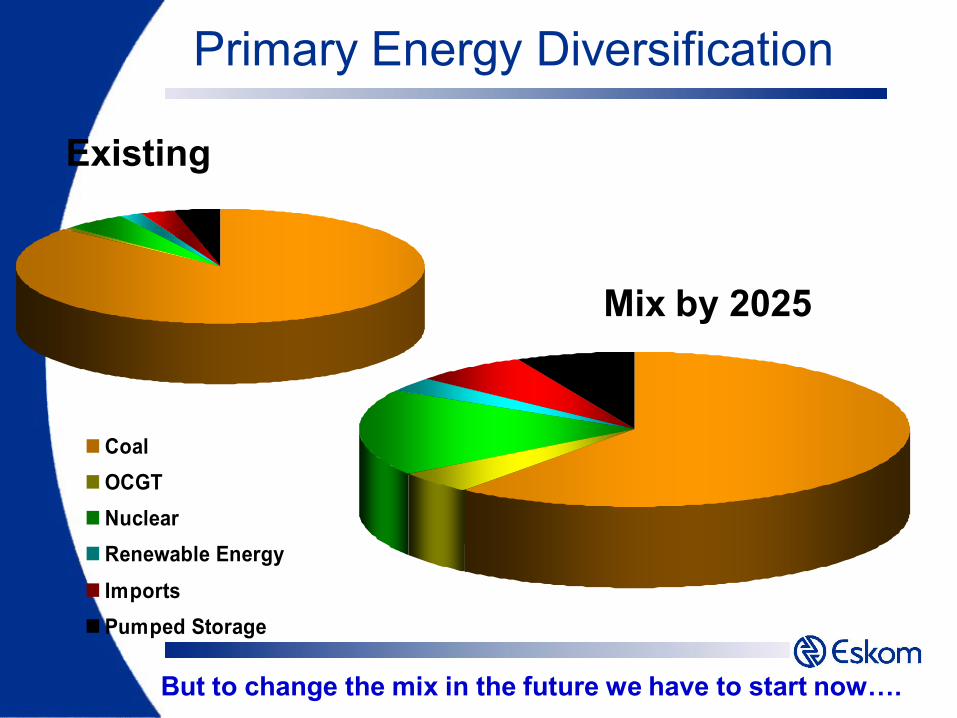
Primary Energy Diversification
Coal
OCGT
Nuclear
Renewable Energy
Imports
Pumped Storage
Existing
Mix by 2025
But to change the mix in the future we have to start now….

Technology Options
Efficiency
Transmission
Renewables
Nuclear
Coal
Gas turbines
Pumped storage

Technology Options
• Developing countries moving to green solutions
• Wind power has come of age – growing at 30% pa
• Carbon capture may make coal ok – expensive and risky
• Nuclear – maybe they can overcome the image problem
• Photo Voltaic is getting steadily cheaper – reduces network needs and opens up distributed power provision
• Geothermal – potential, but extraction still tricky
• Biofuels – smart crops and processes likely with potential for an agrarian revolution in poor equatorial regions

Technology Challenges• Renewable options
– Hydro: run of river (less
predictable) versus damming
rivers (environmental and
social impacts)
– Wind: costly and highly
unpredictable (impact on
system stability)
– Solar: costly and weather-
dependent
– Progress is being made
(technology wise) – will it be
enough?
Palmiet Pump Storage

Technology Challenges• Diversification of resources
– Energy White Paper calls for diversification of primary energy,
relevant for energy security
– Only alternative fuel source possibilities in South Africa
• Natural gas
– Limited local potential for natural gas currently (piped or
imported LNG)
– A very expensive choice but with a lower carbon emissions
footprint than coal
• Nuclear programme
– Historically nuclear power not competitive with coal
– Politically and socially unpalatable (post Chernobyl and 3
Mile Island)
– Climate change and carbon taxes may make nuclear viable
• Issues of storage of spent fuel remain and self-sufficiency in fuel
production remain

…we need to push the energy conversion frontier…..
Carbon Capture and
Storage HVDC
Transmission
Ocean
Current
Energy
Solar Thermal
Advanced
efficiency
Regional
Hydro
Power
Advanced
Nuclear
Underground
Coal gasification
Biomass
Cogeneration
Technology opportunities under development
Reliability of Electricity Supply in South Africa

Impact of 3000 MW reduction
20000
22000
24000
26000
28000
30000
32000
34000
36000
38000
40000
42000
44000
46000
480001
98
8
19
89
19
90
19
91
19
92
19
93
19
94
19
95
19
96
19
97
19
98
19
99
20
00
20
01
20
02
20
03
20
04
20
05
20
06
20
07
20
08
20
09
20
10
20
11
20
12
Peak D
em
an
d a
nd
Cap
acit
y
Actual Peak Demand Expected Peak DemandActual Peak Demand less Load Reductions Expected Peak Demand less Load ReductionsInstalled Capacity Operational CapacityOperational plus Contingency Capacity
Historical Growth in Electricity Demand
-4
-2
0
2
4
6
8
10
12
14
16
18
20
03 05 07 09 11 13 15
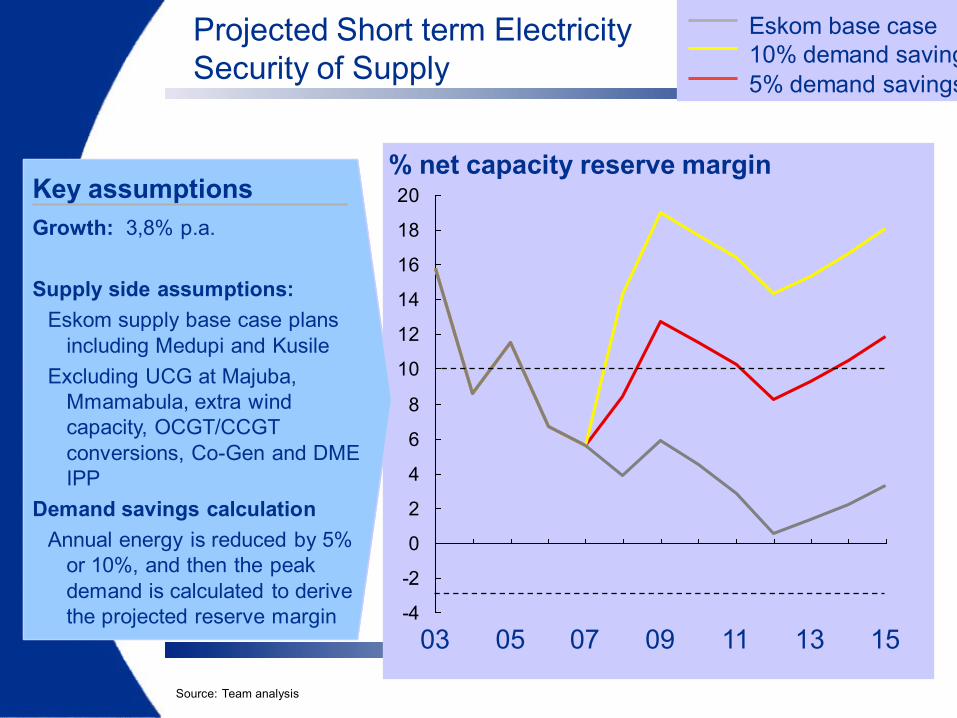
Projected Short term Electricity
Security of Supply
Eskom base case
10% demand savings
5% demand savings
% net capacity reserve marginKey assumptions
Growth: 3,8% p.a.
Supply side assumptions:
Eskom supply base case plans
including Medupi and Kusile
Excluding UCG at Majuba,
Mmamabula, extra wind
capacity, OCGT/CCGT
conversions, Co-Gen and DME
IPP
Demand savings calculation
Annual energy is reduced by 5%
or 10%, and then the peak
demand is calculated to derive
the projected reserve margin
Source: Team analysis

Long Term Adequacy Plans• Eskom plans (ISEP-11)
– >40GW new build by 2026 (up to
20GW nuclear)
– Ten year build plan
• Two coal-fired base load
stations
• A third base load station yet to
be approved
• Two pump-storage schemes
• Meeting renewable energy
targets
• Emergency peaking plant
• Demand-side management
– Risk of growth not materialising
• Short term mitigation measures
may have long term economic
impact
Ankerlig
OCGT
Medupi
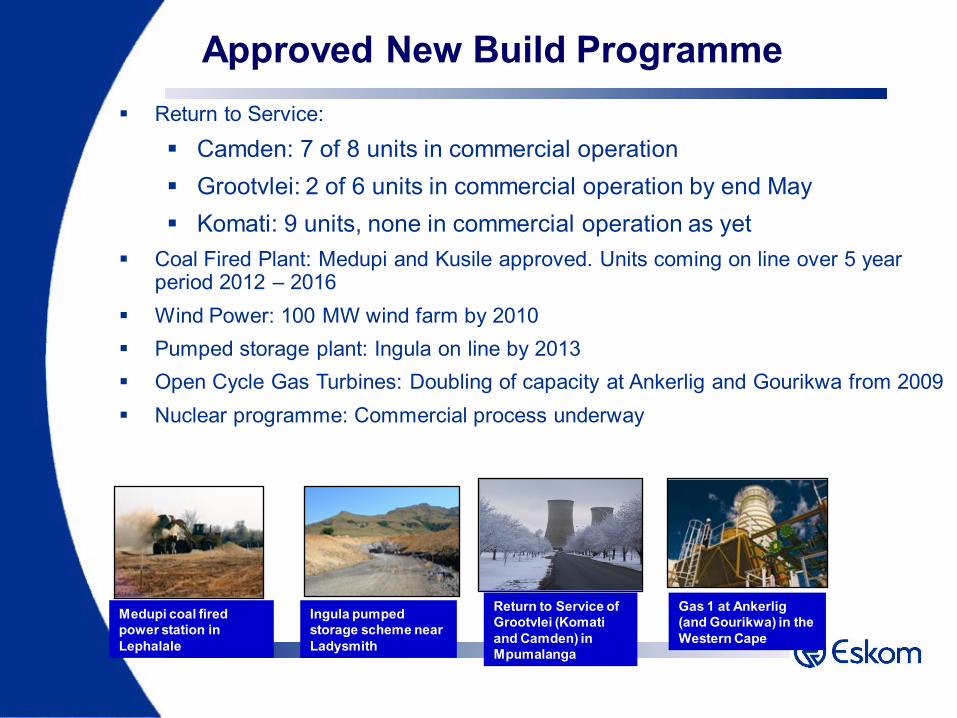
Approved New Build Programme
Return to Service:
Camden: 7 of 8 units in commercial operation
Grootvlei: 2 of 6 units in commercial operation by end May
Komati: 9 units, none in commercial operation as yet
Coal Fired Plant: Medupi and Kusile approved. Units coming on line over 5 year period 2012 – 2016
Wind Power: 100 MW wind farm by 2010
Pumped storage plant: Ingula on line by 2013
Open Cycle Gas Turbines: Doubling of capacity at Ankerlig and Gourikwa from 2009
Nuclear programme: Commercial process underway
Medupi coal fired
power station in
Lephalale
Ingula pumped
storage scheme near
Ladysmith
Return to Service of
Grootvlei (Komati
and Camden) in
Mpumalanga
Gas 1 at Ankerlig
(and Gourikwa) in the
Western Cape
Short Term Mitigation• Until new build kicks in (2012+) require short term mitigation of
intense demand management
– For short-term security of supply
– To adapt to the increased costs of current production
– To optimise the need for long-term build
• Power Conservation Programme (PCP)
– Growth Management
• Limits new projects (>20MVA) until system can
accommodate additional demand
– Energy Conservation Scheme (ECS)
• Mandatory reductions in consumption since voluntary
reductions have not been successful thus far
• Require 10% savings to ensure adequate security margins
and continued economic growth

Short-term Mitigation
• Demand Management
– Pricing
• Expansion plan requires significant capital injection
• Debt costs on top of increased fuel costs
• Lead to substantial price increases
• 2008/09 approved increase was 27,5% nominal
• Higher price increases required over next few years
– Energy efficiency and conservation
• Least cost mechanism to improve security of supply
• Low historic electricity cost has lead to wastage
• Price increases may prompt increased efficiency
• Programmes required to ensure savings are realised
• Conservation less about using energy more efficiently,
but using energy less

Short Term Mitigation
• Supply side options being pursued
– Pilot National Co-generation Programme (PNCP)
• Eskom buying energy from co-generation facilities
• Short term contracts
– Medium Term Power Purchase Programme (MTPPP)
• Eskom buying energy from any producer that can
meet the price parameters published by Eskom
• 10 year contracts
– Multi-site baseload IPP
• Eskom buying energy from successful bidders in
tender expiring end of 2009
• Long term contracts
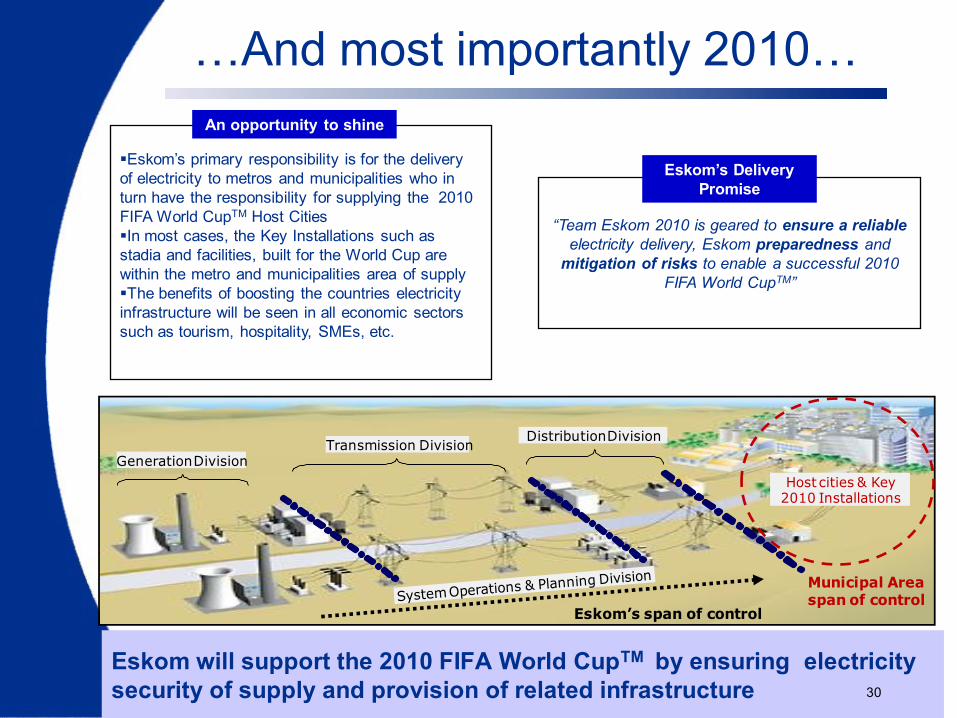
Eskom will support the 2010 FIFA World CupTM by ensuring electricity
security of supply and provision of related infrastructure 30
Generation DivisionTransmission Division
Distribution Division
Host cities & Key 2010 Installations
Eskom’s span of control
Municipal Area span of control
Eskom’s primary responsibility is for the delivery
of electricity to metros and municipalities who in
turn have the responsibility for supplying the 2010
FIFA World CupTM Host Cities
In most cases, the Key Installations such as
stadia and facilities, built for the World Cup are
within the metro and municipalities area of supply
The benefits of boosting the countries electricity
infrastructure will be seen in all economic sectors
such as tourism, hospitality, SMEs, etc.
An opportunity to shine
“Team Eskom 2010 is geared to ensure a reliable
electricity delivery, Eskom preparedness and
mitigation of risks to enable a successful 2010
FIFA World CupTM”
Eskom’s Delivery
Promise
…And most importantly 2010…

In Conclusion

Conclusion….
• The global energy landscape has changed irrevocably with the shift in demand patterns from the developing world
• The rapid local energy changes we are experiencing are not temporary - they are permanent and we must adapt to survive
• There is an opportunity to change the energy intensity of the South African economy
• The South African economy has a huge growth opportunity with the large-scale investments required in the energy sector
• SA electricity costs are artificially low and need to adjust to reflect our new constrained resource environment
• The supply constraints possibly a ‘blessing in disguise’ to get SA to confront more basic energy challenges
Thank YouThank You