Economic-emission unitcommitment solution for wind
integrated hybrid systemYajvender Pal Verma
Department of Electrical and Electronics Engineeringat University Institute of Engineering and Technology,
Panjab University, Chandigarh, India, and
Ashwani KumarDepartment of Electrical Engineering at National Institute of Technology,
Kurukshetra, India
Abstract
Purpose – With the inclusion of significant wind power into the power system, the unit commitment(UC) has become challenging due to frequent variations in wind power, load and requirement ofreserves with sufficient ramp rate. The pumped storage units with lesser startup time and cost cantake care of these sudden variations and reduce their impact on power system operation. The aim ofthis paper is to provide a solution model for UC problem in a hybrid power system.
Design/methodology/approach – The model developed has been implemented through GAMSoptimization tool with CONOPT solver. The model has been called into MATLAB platform by usingGAMS-MATLAB interfacing to obtain solutions.
Findings – The model provides an efficient operating schedule for conventional units and pumpedstorage units to minimize operating cost and emission. The effects of wind power and load profiles onemission, operating cost and reserve with enough ramping capabilities have been minimized with theuse of pumped storage unit. The commitment schedule of thermal and pumped storage units havebeen obtained with significant wind power integrated into the system for best cost commitment (BCC)and for a combined objective of cost and emission minimization.
Originality/value – This paper finds that the operating cost and emission in a commitment problemcan be reduced significantly during variable wind and load conditions in a hybrid system. The modelproposed provides operational schedules of conventional and pumped storage units with variablewind power and load conditions throughout operating horizon. The coordinated optimizationapproach has been implemented on a hybrid system with IEEE-30 bus system.
Keywords Hybrid system, Wind power, Emission, Pumped storage unit
Paper type Research paper
Nomenclature
A. SetN ¼ Set of indices of the thermal unitsT ¼ Set of time intervals (h)NW ¼ Set of wind units.
B. Parameters and constantsai,bi,ci ¼ Cost coefficients of thermal unit iPmax,i ¼ Maximum generation of unit i at
hour t in MW
Pmin,i ¼ Minimum generation of unit i athour t in MW
SHi,t ¼ Shut-down cost of unit i at hour tSTCi,t ¼ Startup cost of unit i at hour tai, bi,gi ¼ Emission coefficient of thermal
unit iDt ¼ Demand on system at hour t in
MWUSi,t ¼ Up-reserve contribution of
thermal unit i at hour t in MW
The current issue and full text archive of this journal is available at
www.emeraldinsight.com/1750-6220.htm
Economic-emission UC
solution
287
International Journal of Energy SectorManagement
Vol. 5 No. 2, 2011pp. 287-306
q Emerald Group Publishing Limited1750-6220
DOI 10.1108/17506221111146039
DSi,t ¼ Down-reserve contribution ofthermal unit i at hour t in MW
SR ¼ System up-spinning reserverequirement without wind in MW
r % ¼ Percentage of total actual windpower generation
d % ¼ Percentage of maximum unitcapacity
URi ¼ Ramp-up rate for thermalgenerator i in MW
DRi ¼ Ramp-down rate for thermalgenerator i in MW
Wr ¼ WECS-rated output in MWVc ¼ Cut in wind speed in m/sVr ¼ Rated wind speeding m/sVo ¼ Cut-out speed in m/sVi,t ¼ Wind speed at hour t for unit I in
m/sPDmin,t ¼ Minimum value of generation by
pumped storage unit in MW attime t
PDmax,t ¼ Maximum value of generation bypumped storage unit in MW attime t
PD1min,t ¼ Minimum value of power usedto pump the water in time t inMW
PD1max,t ¼ Maximum value of power usedto pump the water in time t inMW
PLmin,t ¼ Minimum reservoir level at time tin MWh
PLmax,t ¼ Maximum reservoir level at time tin MWh
PL 0 ¼ Initial reservoir level in MWhPL T ¼ Final reservoir level in MWhhh ¼ Generation efficiency of pumped
storage unithp ¼ Pumping efficiency of pumped
storage unitM ¼ Time step in h
C. VariablesOC ( *) ¼ Operating cost function of
thermal units in $/hPwt ¼ Total wind power output at hour
t by all units in MWPi,t ¼ Power generated (MW) by
thermal unit i in time tEmCi,t ¼ Emission value of unit i at hour t
in lb per hCost ¼ Total system cost in $/hPLt ¼ Pond level at different time
intervals MWhPDt ¼ Power generated by pumped
storage unit in MW at hour tPD1t ¼ Power used for pumping water in
MW at hour tHi ¼ Price penalty factor for unit i
D. Binary variablesUi,t ¼ Unit status ON or OFFvi,t ¼ Startup decisionwi,t ¼ Shutdown decision
1. IntroductionIn the past decade, the number of installed wind turbines worldwide has increasedrapidly. The reason is the emphasis on the deployment of less carbon intensive and moresustainable electricity sources, due to their less harmful effects on climate, loweroperating cost and issues like air quality, etc. Under Kyoto Protocol, governmentsagreed on and accepted CO2 reduction targets in order to counter climate change. TheCO2 emission trading has also been implemented since 2005 in Europe as policyinstrument to meet the reduction targets. Other than carbon trading Kyoto Protocol alsoproposes joint implementation and clean development mechanism to help developedcountries achieve their emission reduction targets. As a consequence, renewable energysources are becoming important portion of generation mix in many countries and windenergy sources in particular have gained considerable momentum. The scheduling ofconventional generation units has become very challenging as well as important due tostochastic nature of the wind and uncertain load pattern which not only affect thesystem operation but also play vital role in issues like carbon trading,emission reduction targets, etc. In such situations, hybrid systems can be very usefuland reliable when there is high penetration of renewable sources particularly wind.
IJESM5,2
288
Unit commitment problem for one such system has been solved by Pappala et al. (2008)using adaptive particle swarm optimization for varying wind and load conditions butignored emission factor in the formulation.
In order to meet the uncertainty due to wind and load demand, the best option is tocombine generation of wind units with other units, which has instant availability andleast startup cost. That is why hydro/pumped storage units are one of the best optionswhich can be considered. The operational strategies to enhance the wind energyeconomic gains in hours ahead operation by utilization of water storage ability isproposed by Castronuovo and Lopes (2004). Water storage capabilities of pumpedstorage units have been demonstrated with a combination of hydro-thermal (Guan et al.,1994). The second option is to use thermal plants with wind as they supply the majorportion of energy demand worldwide despite high operational and maintenance cost andmajor source of harmful gas emission. The technical capabilities of thermal generationsystem for balancing wind power were investigated along with the impacts of wind onthermal unit commitment. It also includes assessment of the benefits of wind powerprediction on operating cost and emission savings, etc. (Ummels et al., 2009). Theoverestimation and underestimation of wind also affect the dispatch. A case study ispresented by Hetzer et al. (2008) taking two conventional and two wind power generatorswhere the stochastic wind speed characteristics have been used by Weibull probabilitydensity function. Chen (2007) applied simulated annealing to the wind thermalscheduling considering additional physical and operational constraints to reach acompromise between the system security and operating cost. Scheduling throughscenario generation technique is preferred over keeping reserves to maintain the securityof the system intact during volatility as the reserves are not always sufficient to meet therequired ramp rate at the time of need (Wang et al., 2008). The scheduling problem canalso have multi-objectives such as operating cost, reliability, environmental impact andcustomer preferences, etc. thereby it is essential to frame and solve a multi-objectiveproblem, whereby each objective is taken care of properly. In order to deal with suchsituations, a pareto-optimization method is used by Al-Awami et al. (2009) and Raglendand Padhy (2006). The different aspects of unit commitment problem in conventionalunits with wind power have been addressed through stochastic programming andscenario reduction techniques which include system security/reserve management(Ruiz et al., 2009), market issues like optimal bidding (Gonzalez et al., 2008) and betterschedule than deterministic solution for operational cost and reserves (Tuohy et al., 2009).
This paper presents a model for a hybrid system comprising thermal, wind andpumped storage (PS) units for variable load and wind power conditions with an objectiveof operating cost and emission reduction. One of the objectives included in the problemformulation is the environmental emission cost. As there is growing concern towardsenvironment, it is a very important factor in deciding the scheduling of the thermal unitsin generation mix. It’s essential to analyze the effects of wind power on emission cost inany system before making a schedule for the dispatch of thermal units. It has been foundthat the amount of emission that takes place during starting of thermal units and highramp rate conditions is also quite significant as compared to the emission reducedbecause of the wind power integration into the generation mix. Hence, PS units in thesesituations cannot only avoid starting of additional units but also can take care of highramp rate required to meet the system volatilities. The intermittent nature of wind isconsidered by considering the wind power obtained from different scenarios for a 24 h
Economic-emission UC
solution
289
operating time period (Wang et al., 2008). The paper is structured as follows. In Section 2,problem formulation with an objective of operating cost and emission minimizationis presented. Besides active power limits of thermal units, other system constraints havealso been considered. The proposed model helps in identifying the best operationalstrategies in emission-constrained hybrid system of wind-thermal plants with PSprovision. The pumped unit operation, reservoir level, emission, during deviation ofwind power from its scheduled value along with a varying load demand have beeninvestigated through CONOPT solver in GAMS. Section 3 presents the discussion onresults obtained by applying the model on test system. Finally, in Section 4, theconclusions are drawn.
2. Problem formulation2.1 Mathematical formulationThe unit commitment problem is an optimization problem which helps in determiningthe schedule of generation of various units (on/off) during each interval of the schedulingperiod. This paper addresses the scheduling of conventional, PS units with systemoperational constraints and wind power uncertainty. The problem formulation isbi-objective consisting of two components. The first component calculates fuel cost,startup and shutdown costs of thermal units, and the other component incorporatesprice penalty factor blended with emission. The penalty factor blending with emission inthe objective function encourages the use of PS units with varying wind conditions inhybrid system. Hence it is impossible to obtain the minimum at the same point when theobjective functions are independently optimized, i.e. minimum fuel cost and minimumemission. A gain in one objective function is due to a sacrifice in the other objectivefunction. The approach here aims to find the best compromised solution from thenon-dominated solution set, considering the two objectives simultaneously.The proposed model consists of three components:
(1) thermal units;
(2) wind power units; and
(3) PS units.
2.2 Thermal unitsThe fuel cost of the thermal units is generally given by the second-order polynomialfunction given below:
OCðPi;tÞ ¼ ai þ bi*Pi;t þ c*i P
2i;t ð1Þ
where ai, bi, ci, are the cost coefficients of thermal unit i. The real power generation Pi,t
should be within limits equation (18).The startup cost of the thermal units dependsupon the time the unit has been off prior to startup. The startup cost is given by thefollowing exponential cost curve:
STCi ¼ si þ di 1 2 exp2Toff ;i
ti
� �� �ð2Þ
Where si , di are the hot and cold startup costs, respectively, ti is the unit cooling timeconstant and T off,i is the time for which unit had been off. The shutdown cost (SHi)of the units have also been considered. The model also includes the logical constraintsfixing initial status of all the units to on position. The other constraints in the model are
IJESM5,2
290
ramp rates of units, if units remains in operation for two successive hours (21) andramp down rate limits (22), unit’s up spinning reserve contribution (25) and unit’s downspinning reserve contribution (26). The emission as another important factor withthe thermal units has been considered to be minimized. The emission cost has beenincluded in the objective function and a Pareto-optimal solution is sought.
2.3 Wind power unitThe wind power generators require no fuel hence, the operational cost of wind unitshas been assumed to be 0. The wind power contribution into the system depends uponthe prediction of wind speed. There are different forecasting approaches available(Sanchez, 2006). Statistics and time series analysis gives good prediction for short-termforecasting. The wind energy conversion system (WECS) output can be characterizedas a random variable through a transformation from wind speed to the output power.The generation of all the units of a wind farm is considered as single entity. The windpower curve constraints are expressed as follows:
Pwk;t ¼ 0; for V i;t # Vc and V i;t s Vo ð3Þ
Pwk;t ¼ WrðVi;t 2 VcÞ
ðVr 2 Vi;tÞfor V i;t $ Vc and Vi;t # Vr ð4Þ
Pwk;t ¼ Wr; for V i;t $ Vr and Vi;t # Vo ð5Þ
Hence from wind curve constraints its clear that:. there is no wind power production up to cut-in speed equation (3);. a linear power output relationship between cut-in and rated wind speed equation (4);
and. a constant rated output between the rated wind speed and cut-out wind speed
equation (5).
The power output with wind speed greater than cut-out wind speed is zero. The WECSpower output is a mixed random variable between two discrete values as the rated valueand zero value. This can be explained from the output of equations (3)-(5). The windspeed distribution has been expressed as normally distributed N(m, s2) with WECSoutput as its expected value (m) and percentage ofm as its deviation (s). This Monte Carlosimulation has been used in considering the wind power volatility and few scenarios aregenerated. The numbers of scenario have been applied and two scenarios one withhighest and other with comparable lower probability has been considered and presentedin this paper. If wind power generation deviates from the predicted value the variation iscompensated by thermal units by using spinning and non-spinning reserve leading tohigher cost and emission. This can affect cost quite significantly and thus to limit theeffect of wind power that will be used in the hybrid system is decided by putting someconstraints. The amount of wind power being used out of predicted value is decided bythe constraints given as below:
Pwt ¼XNWk
Pwk;t ð6Þ
Economic-emission UC
solution
291
Pwt #
PTt Ui;t*USi;t 2 SR
r%ð7Þ
Pwt #
PTt U i;t*DSi;t
r%ð8Þ
The output of the entire wind farm is taken together at a particular time periodequation (6). The maximum up and down spinning reserve contribution is given byequations (7)-(8). However, there is no limit for the maximum of minimum wind powergeneration, as during extreme conditions PS units will compensate those. However,with hybrid system this is taken care of by the pump storage units. During high windpower generation, the PS unit works as motor and lift the water to the upper reservoirand use it when the demand on the system increases or when the wind powergeneration is lower than the predicted value. The constraints of the PS unit are alsoincluded in the model to seek the best generation pattern for conventional as well as PSunit during wind power volatilities. The lower generation can be compensated by thespinning reserves; however, without PS units higher wind power has to be curtailed asit can lead to congestion problem in the system. With PS units during sufficient windpower and low demand situations the tendency of the PS unit is to store water inreservoir and keep it for future usage when wind power is low or demand rises, thusreducing impact of variations on conventional units.
2.4 Pumped storage unitThe PS units play an important role in load dispatch as they cater to the threat tosecurity and reliability of the system because of wind power uncertainty. The plantsconsist of a reservoir where the water is lifted from another source (river, lake andother reservoir, etc.). The variables associated to the PS plant are expressed in terms ofenergy. Thus, in each operating interval, the state of the reservoir will be determinedon the basis of the energy stored in them at the end of the period. The volume capacityof the reservoir will be expressed as maximum and minimum energy level that can bestored in the reservoir. The multiple PS plants can be considered however; in thismodel its only one PS plant that has been taken for study. The daily operation of PS ismodeled as below:
PLtþ1 ¼ PLt þM* hp*PD1t 2PDt
hh
� �ð9Þ
PDMin;t # PDt # min PDmax ;t;hh*PLt
M
� �ð10Þ
PD1Min;t # PD1t # PD1max ;t ð11Þ
PLMin;t # PLt # PLmax ;t ð12Þ
PLð0Þ ¼ PL0 ð13Þ
PLðTÞ ¼ PLT ð14Þ
At the beginning of the (t þ 1) interval, the available water in the reservoir is theinitial value in the (t)th interval plus the water pumped by the pumped unit,
IJESM5,2
292
minus the amount of water used for generation of power supplied to the grid. Thereservoir level is given by equation (9), which clearly depends on the efficiency of unitas motoring or generating operation. Equations (10) and (11) force the PS units to abidethe limits during their operation as generator or as motor for pumping water to theupper reservoir. The reservoirs maximum and minimum storage capacity limit isdefined using equation (12). The initial level and final levels of a reservoir is kept sameeither maximum or minimum in this model as expressed in equations (13) and (14).
2.5 Objective functionThe overall objective is to minimize the total operating cost and emission generation bythe thermal units. The bi-objective problem consisting of economic and environmentaldispatch is formulated as:
MinXTt
XNi
½OCðPi;tÞ*Ui;t þ Ui;tð1 2 Ui;t21Þ*STCi;t þ wi;t*SHi;t þ H*EmCi;t� ð15Þ
The function is subjected to a set of constraints as given below:. System hourly power balance, i.e. total power generation must be equal to load in
each time steps:
XNi
Pi;t*Ui;t þ Pwt þ PDt 2 PD1t ¼ Dt ð16Þ
. Reserve constraint on the system:
XNi
P maxi;t*Ui;t þ Pwt þ PDt 2 PD1t $ Dt þ SR þ r%*Pwt ð17Þ
. Power generation by thermal units should be within maximum and minimum limit:
P mini # Pi;t # P maxi ð18Þ
. The system up-spinning reserve requirements:
XTt
Ui;t*USi;t $ SR þ r%*Pwt ;t [ T;;i [ N ð19Þ
. System down spinning requirement:
XTt
U i;t * $ DSi;tr%*Pwt; ;t [ T;;i [ N ð20Þ
. Ramping up constraints of thermal unit:
Pi;t 2 Pi;t21 $ URi ;t [ T;;i [ N ð21Þ
. Ramping down constraints of thermal unit:
Pi;t 2 Pi;t21 # DRi ;t [ T;;i [ N ð22Þ
Economic-emission UC
solution
293
. Thermal unit’s maximum up/down reserve contribution constraints:
US maxi;t ¼ d%*P maxi ;t [ T;;i [ N ð23Þ
DS maxi;t ¼ d%*P maxi ;t [ T;;i [ N ð24Þ
. Thermal unit’s up/down spinning reserve contribution constraints:
USi;t ¼ minðUS maxi;t; ðP maxi 2 Pi;tÞÞ ;t [ T;;i [ N ð25Þ
DSi;t ¼ minðDS maxi;t; ðPi;t 2 P miniÞÞ ;t [ T;;i [ N ð26Þ
. Minimum up and down time constraints:
Ton;iðt21Þ 2 Ton;i
� �* Ui;t21 2 Ui;t
� �$ 0 ð27Þ
Toff ;iðt21Þ 2 Toff ;i
� �* Ui;t 2 Ui;t21
� �$ 0 ð28Þ
The other constraints in the model are included from wind units (equations (3)-(8)) andPS units (equation (9)-(14)). The price penalty factor is included in the objective functionblended with emission caused by conventional units in different scheduling timeintervals. The aim is to optimize the two conflicting cost functions simultaneously; one,the operating cost of thermal units, PS units and wind units in hybrid system, andsecond, the emission caused by the thermal units. The emission generation by thethermal units in generating the required power is given by the quadratic function givenbelow:
EmCi;t ¼XNi
ai þ bi*Pi;t þ gi*Pi;2t ð29Þ
The scheduling has to be done in such a way so that emission is also minimized alongwith operating cost. The same is included in the objective function by blending theemission with a price penalty factor. The penalty factor Hi is the ratio betweenmaximum fuel cost and maximum emission value of corresponding generator:
Hi ¼OCðPmax ;iÞ
EmCðPmax ;iÞ; ;i [ N ð30Þ
The price penalty factor for a load demand is calculated as follows:. Find the value of H from (30) for all units.. Arrange the values of H in the ascending order.. Add the maximum generation of unit in the order of H such that
PP maxi $ Dt .
. The H associated with last unit in this process will be the price penalty factor.
This bi-objective helps in reducing the emission as well maximum utilization of cleanerenergy sources with least operating cost.
IJESM5,2
294
3. Test case and resultsThe proposed model has been applied on IEEE-30 bus system data. It has been assumedthat the PS unit as given in Table I along with wind power units are available in theexisting system. The operation of the existing system is being combined with PS unitsand the wind power units. The aim of the study is to find the commitment scheduleswhen renewable are combined with such existing systems. Because of uncertainties ofwind power generation its essential to keep certain amount of power as spinning reserveand in this study its kept a fraction of wind power (r%) generation along with minimumfrom thermal units (Chen, 2007). The maximum up/down spinning reserve contributionsfrom a single thermal unit has been taken (d ¼ 10 per cent). The wind generator cannotprovide any reserve, however, PS unit can act as reserve in the absence of wind powerand thereby avoids the starting of additional thermal units. Thus, unit commitment isdone in such a way which not only has a provision to provide reserve for thermalgeneration but also to accommodate the additional requirement due to wind powerintegration. It increases the cost but enhances the reliability of the system. The rampingrate both up and down of the thermal units are also important, as major fluctuation inwind and in load should be accommodated by the ramping capability of thermal units.In this model, the up and down ramp rates have been used and generators cannot changegeneration by 25 per cent in subsequent intervals. The wind power available is obtainedfrom the wind power curves and treated as single wind unit. For each of them it ispossible to find the output envelope for a various generating units in a hybrid systemincorporating stochastic behavior of wind. The simulations study for this hybrid systemas proposed in model have been carried out using MATLAB environment andinterfacing with GAMS using CONOPT solver.
3.1 IEEE-30 bus systemThe system consists of six thermal units given in given in Appendix I. The PS generationfacility as given in Table I is used with thermal spinning reserve of 20 MW. It is assumedthat the reservoir start with empty and it will not keep storage at the endof the 24 h operating time horizon. However, optimum level of reservoir level can also beobtained at the end of 24 h operating time.
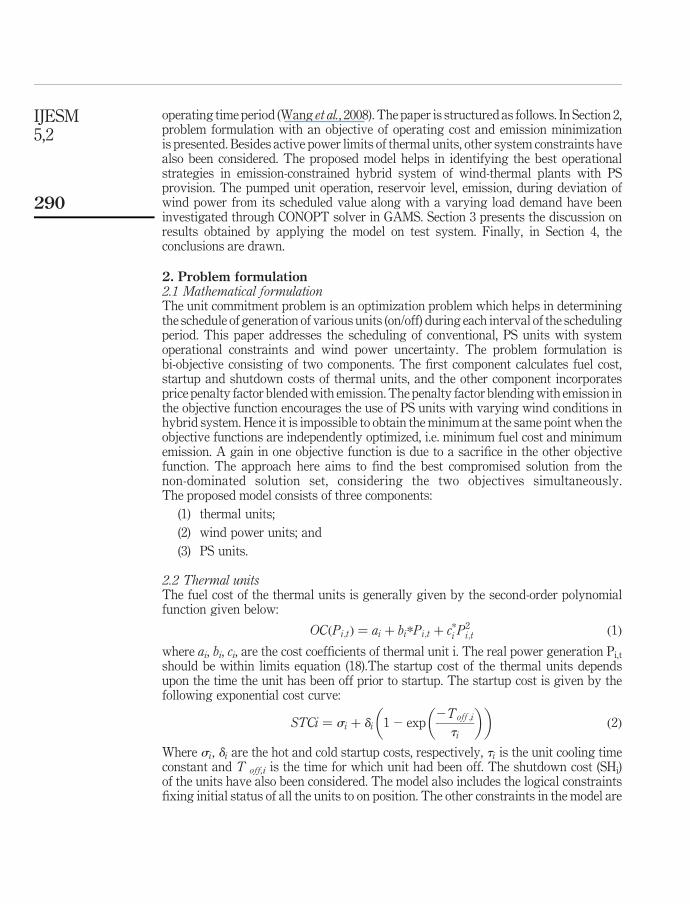
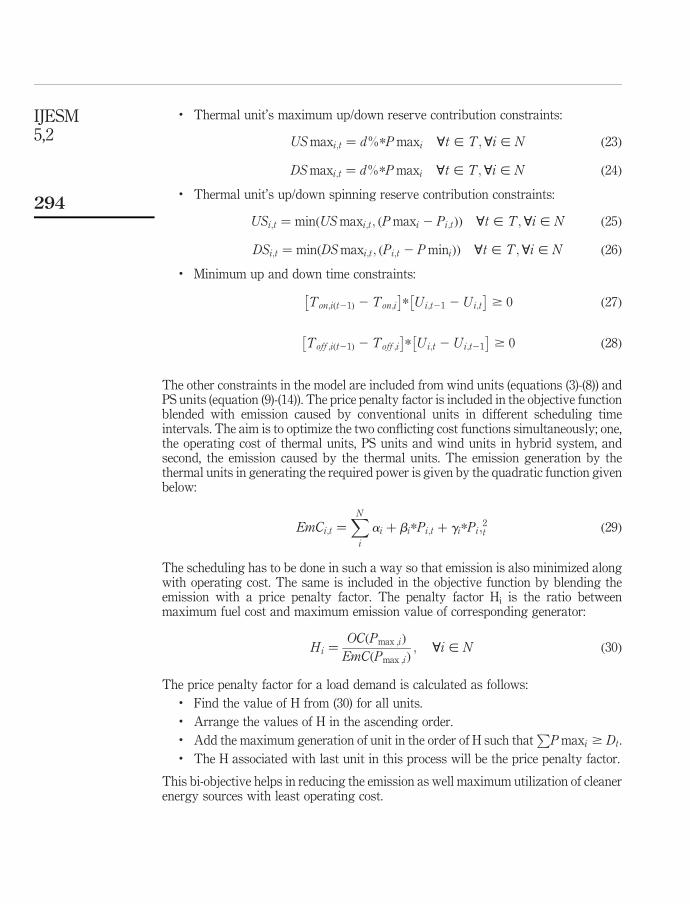
In the generation mix, the wind energy source is also included and the number ofwind power generation scenarios has been applied and couple of them is beingdiscussed, one with highest probability (scenario 1) and other randomly selectedscenario as obtained from Monte Carlo simulation as shown in Figure 1.
The cut in wind speed (Vc), rated wind speed (Vr), cut out wind speed (Vo) and ratedwind power (Wr) have been taken as 5, 15, 40 m/s and 50 MW, respectively. Thesenumbers are not for a specific turbine but reflective of general numbers on a meter persecond basis (Sayler et al., 2006). The wind power output has been calculated by WECSfor average wind speed obtained from different wind scenarios. The joint operation ofthermal-wind and PS with an objective function as given in equation (15) has beenanalyzed. The thermal units are available for production during the entire time horizon
S. no.PLMax.(MWh)
PLMin.(MWh)
PD Max.(MW)
PD1 Max.(MW)
PL0
(MWh)PLT
(MWh) hL(%) hh hp
1 200 0 40 40 0 0 73.5 0.844 0.871
Table I.Pumped storage unit data
for IEEE-30 bus system
Economic-emission UC
solution
295
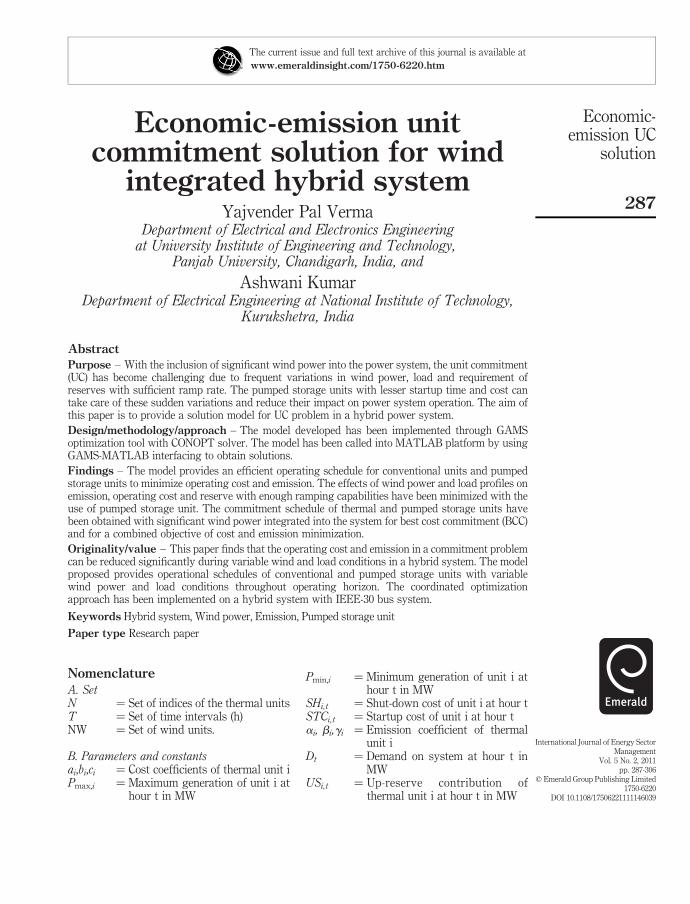
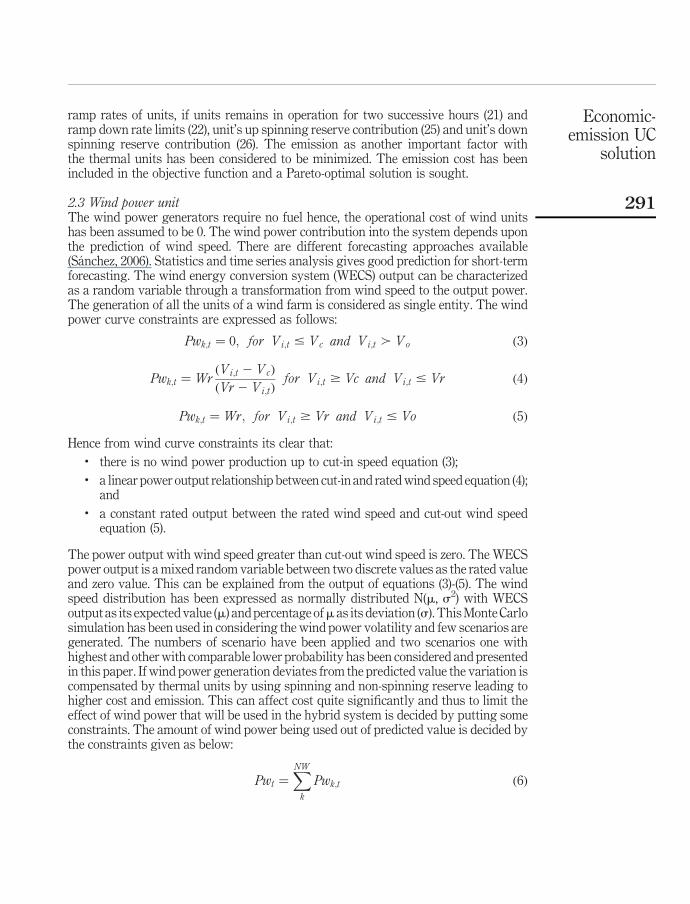
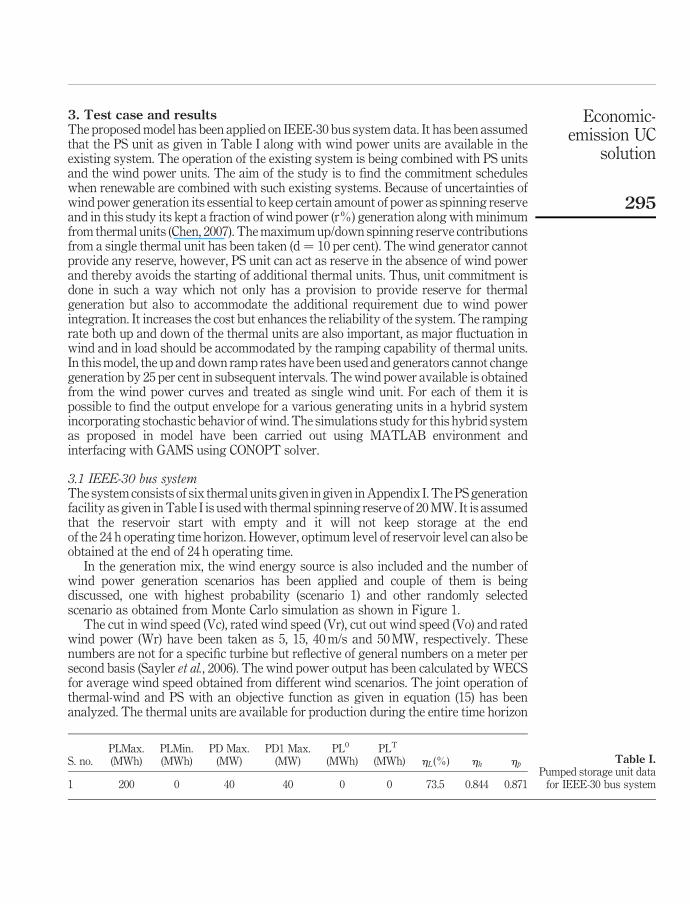
of optimization. The PS units operate in generation mode whenever the available windpower is low or load demand is high. In Figure 2 during operating hours 4-6, as thewind power available is lesser, the PS unit starts generation.
As wind power increases from 6 h onwards, the (PS) unit acts in pump mode andtends to store water for future usage as and when wind power availability is belowestimation or load demand is high. The same is reflected at 14-21 of operating timehorizon.
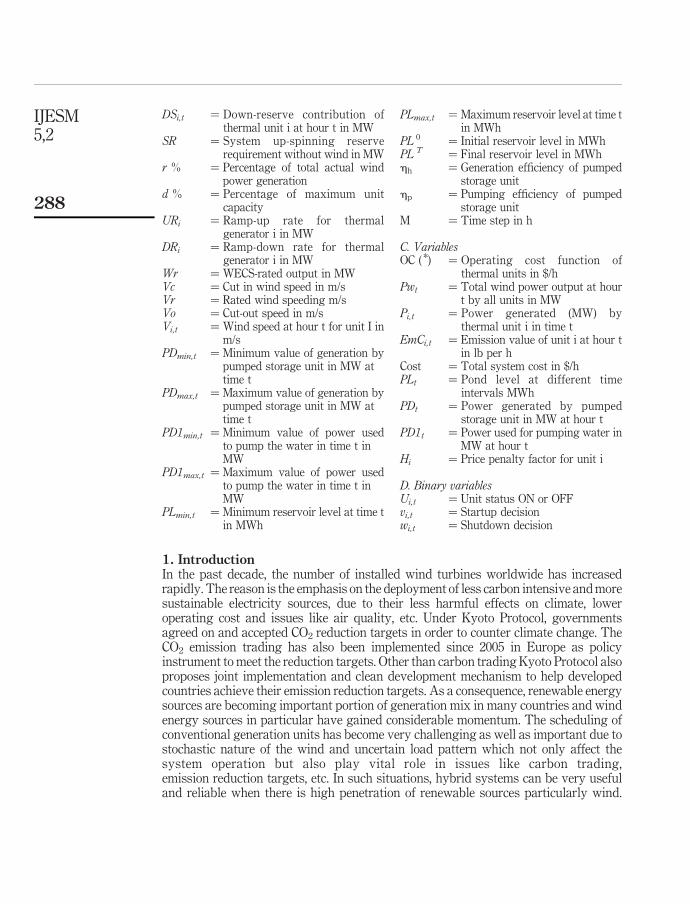
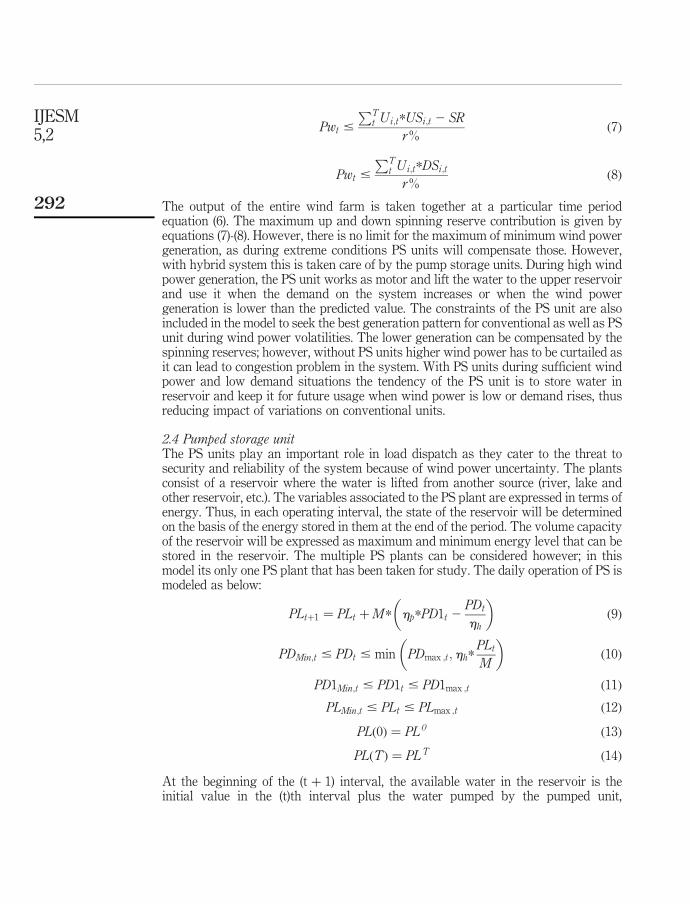
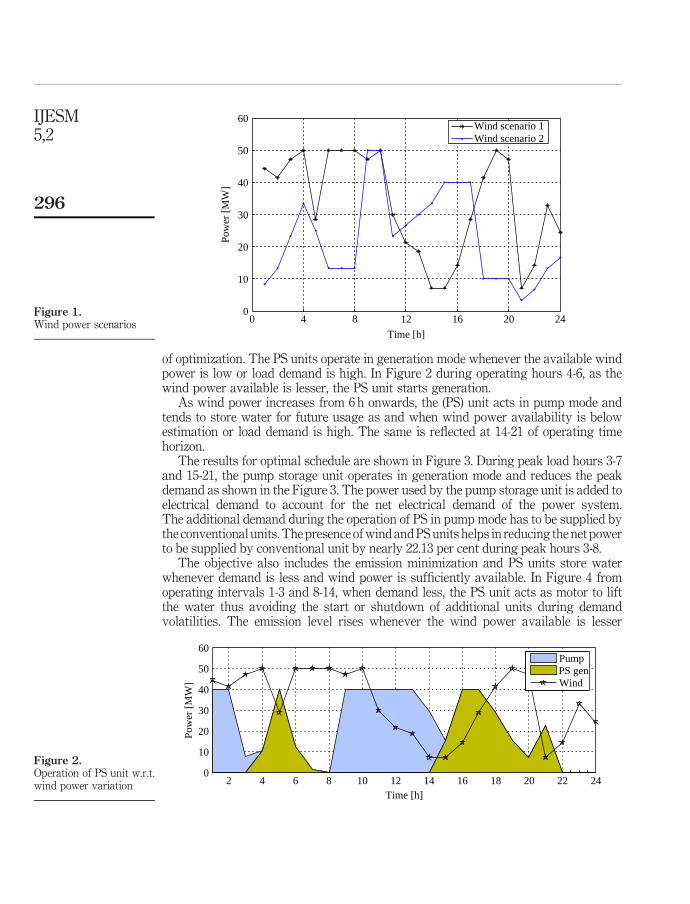
The results for optimal schedule are shown in Figure 3. During peak load hours 3-7and 15-21, the pump storage unit operates in generation mode and reduces the peakdemand as shown in the Figure 3. The power used by the pump storage unit is added toelectrical demand to account for the net electrical demand of the power system.The additional demand during the operation of PS in pump mode has to be supplied bythe conventional units. The presence of wind and PS units helps in reducing the net powerto be supplied by conventional unit by nearly 22.13 per cent during peak hours 3-8.
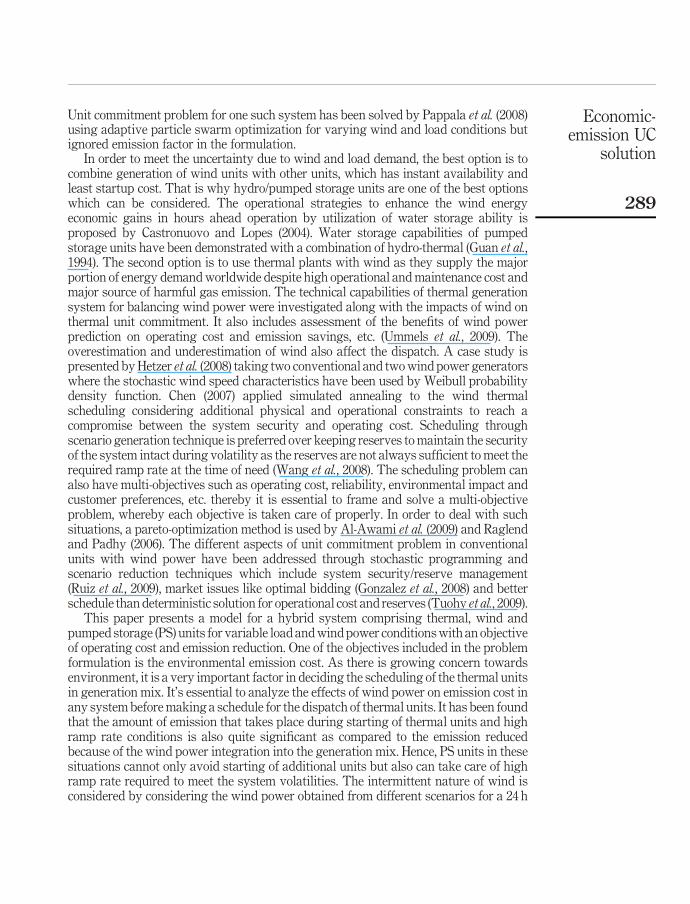
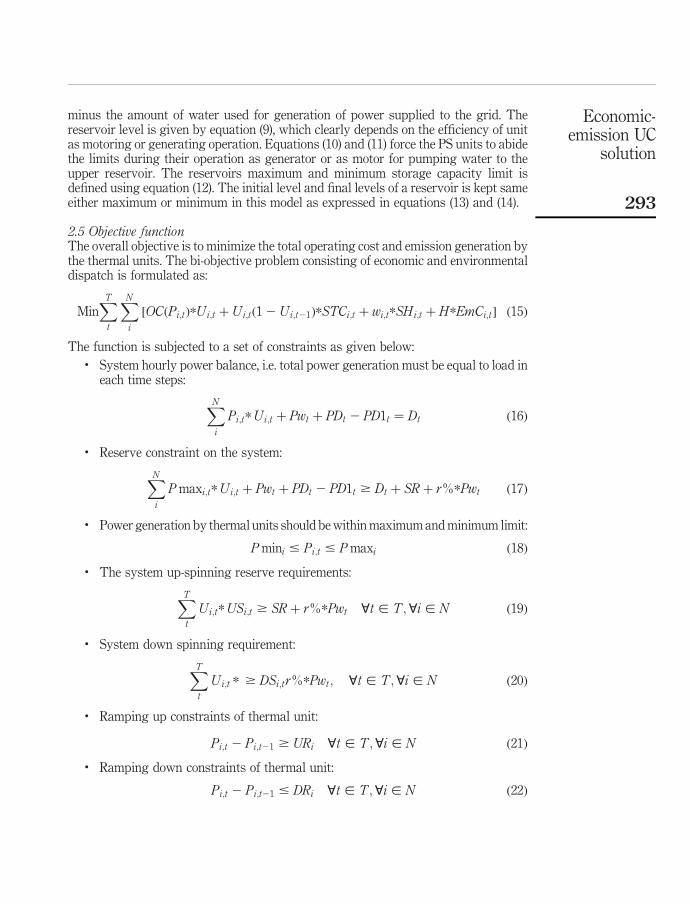
The objective also includes the emission minimization and PS units store waterwhenever demand is less and wind power is sufficiently available. In Figure 4 fromoperating intervals 1-3 and 8-14, when demand less, the PS unit acts as motor to liftthe water thus avoiding the start or shutdown of additional units during demandvolatilities. The emission level rises whenever the wind power available is lesser
Figure 1.Wind power scenarios
0 4 8 12 16 20 240
10
20
30
40
50
60
Time [h]
Pow
er [
MW
]
Wind scenario 1Wind scenario 2
Figure 2.Operation of PS unit w.r.t.wind power variation 2 4 6 8 10 12 14 16 18 20 22 24
0
10
20
30
40
50
60
Time [h]
Pow
er [
MW
]
PumpPS genWind
IJESM5,2
296
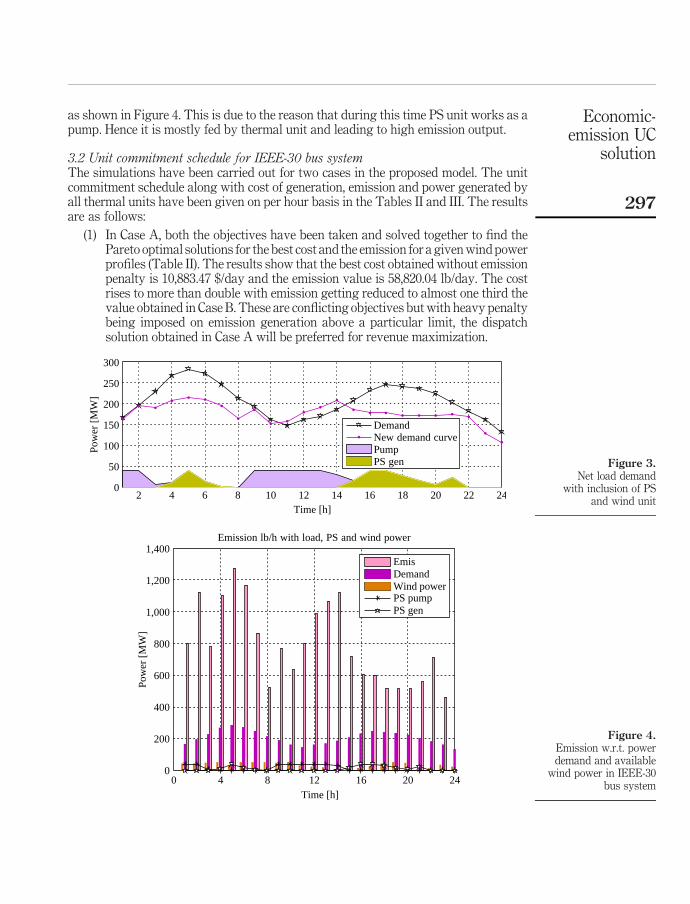
as shown in Figure 4. This is due to the reason that during this time PS unit works as apump. Hence it is mostly fed by thermal unit and leading to high emission output.
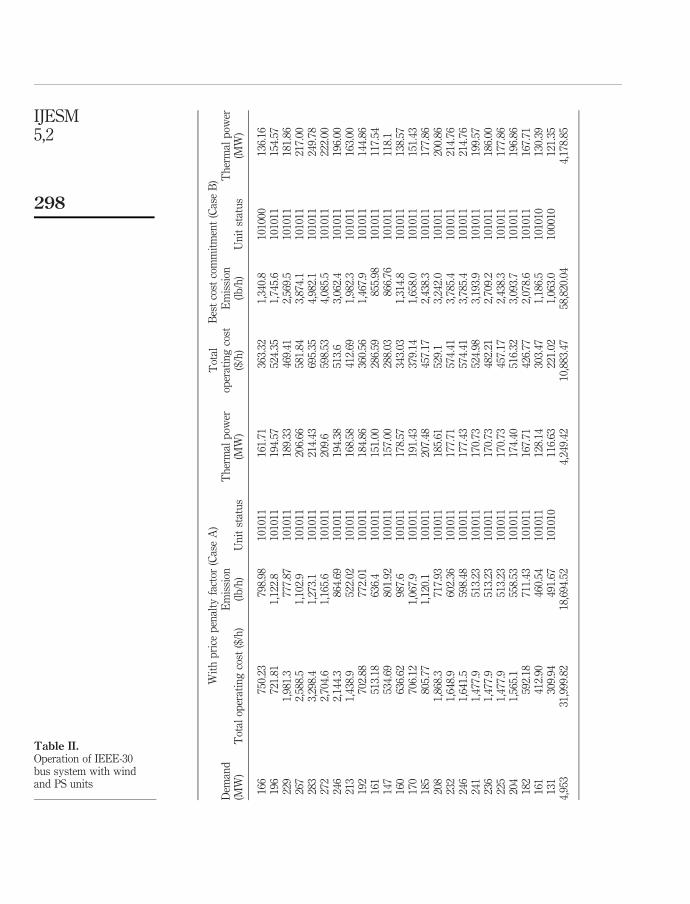
3.2 Unit commitment schedule for IEEE-30 bus systemThe simulations have been carried out for two cases in the proposed model. The unitcommitment schedule along with cost of generation, emission and power generated byall thermal units have been given on per hour basis in the Tables II and III. The resultsare as follows:
(1) In Case A, both the objectives have been taken and solved together to find thePareto optimal solutions for the best cost and the emission for a given wind powerprofiles (Table II). The results show that the best cost obtained without emissionpenalty is 10,883.47 $/day and the emission value is 58,820.04 lb/day. The costrises to more than double with emission getting reduced to almost one third thevalue obtained in Case B. These are conflicting objectives but with heavy penaltybeing imposed on emission generation above a particular limit, the dispatchsolution obtained in Case A will be preferred for revenue maximization.
Figure 3.Net load demand
with inclusion of PSand wind unit
2 4 6 8 10 12 14 16 18 20 22 240
50
100
150
200
250
300
Time [h]
Pow
er [
MW
]
DemandNew demand curvePumpPS gen
Figure 4.Emission w.r.t. powerdemand and available
wind power in IEEE-30bus system
0 4 8 12 16 20 240
200
400
600
800
1,000
1,200
1,400
Time [h]
Pow
er [
MW
]
Emission lb/h with load, PS and wind power
EmisDemandWind powerPS pumpPS gen
Economic-emission UC
solution
297
Wit
hp
rice
pen
alty
fact
or(C
ase
A)
Bes
tco
stco
mm
itm
ent
(Cas
eB
)D
eman
d(M
W)
Tot
alop
erat
ing
cost
($/h
)E
mis
sion
(lb
/h)
Un
itst
atu
sT
her
mal
pow
er(M
W)
Tot
alop
erat
ing
cost
($/h
)E
mis
sion
(lb
/h)
Un
itst
atu
sT
her
mal
pow
er(M
W)
166
750.
2379
8.98
1010
1116
1.71
363.
321,
340.
810
1000
136.
1619
672
1.81
1,12
2.8
1010
1119
4.57
524.
351,
745.
610
1011
154.
5722
91,
981.
377
7.87
1010
1118
9.33
469.
412,
569.
510
1011
181.
8626
72,
588.
51,
102.
910
1011
206.
6658
1.84
3,87
4.1
1010
1121
7.00
283
3,29
8.4
1,27
3.1
1010
1121
4.43
695.
354,
982.
110
1011
249.
7827
22,
704.
61,
165.
610
1011
209.
659
8.53
4,08
5.5
1010
1122
2.00
246
2,14
4.3
864.
6910
1011
194.
3851
3.6
3,06
2.4
1010
1119
6.00
213
1,43
8.9
522.
0210
1011
168.
5841
2.69
1,98
2.3
1010
1116
3.00
192
702.
8877
2.01
1010
1118
4.86
360.
561,
467.
910
1011
144.
8616
151
3.18
636.
410
1011
151.
0028
6.59
855.
9810
1011
117.
5414
753
4.69
801.
9210
1011
157.
0028
8.03
866.
7610
1011
118.
116
063
6.62
987.
610
1011
178.
5734
3.03
1,31
4.8
1010
1113
8.57
170
706.
121,
067.
910
1011
191.
4337
9.14
1,65
8.0
1010
1115
1.43
185
805.
771,
120.
110
1011
207.
4845
7.17
2,43
8.3
1010
1117
7.86
208
1,86
8.3
717.
9310
1011
185.
6152
9.1
3,24
2.0
1010
1120
0.86
232
1,64
8.9
602.
3610
1011
177.
7157
4.41
3,78
5.4
1010
1121
4.76
246
1,64
1.5
598.
4810
1011
177.
4357
4.41
3,78
5.4
1010
1121
4.76
241
1,47
7.9
513.
2310
1011
170.
7352
4.98
3,19
3.9
1010
1119
9.57
236
1,47
7.9
513.
2310
1011
170.
7348
2.21
2,70
9.2
1010
1118
6.00
225
1,47
7.9
513.
2310
1011
170.
7345
7.17
2,43
8.3
1010
1117
7.86
204
1,56
5.1
558.
5310
1011
174.
4051
6.32
3,09
3.7
1010
1119
6.86
182
592.
1871
1.43
1010
1116
7.71
426.
772,
078.
610
1011
167.
7116
141
2.90
460.
5410
1011
128.
1430
3.47
1,18
6.5
1010
1013
0.39
131
309.
9449
1.67
1010
1011
6.63
221.
021,
063.
010
0010
121.
354,
953
31,9
99.8
218
,694
.52
4,24
9.42
10,8
83.4
758
,820
.04
4,17
8.85
Table II.Operation of IEEE-30bus system with windand PS units
IJESM5,2
298
Wit
hp
rice
pen
alty
fact
or(C
ase
A)
Bes
tC
ost
Com
mit
men
t(C
ase
B)
Dem
and
(MW
)T
otal
oper
atin
gco
st($
/h)
Em
issi
on(l
b/h
)U
Csc
hed
ule
Th
erm
alp
ower
(MW
)
Tot
alop
erat
ing
cost
($/h
)E
mis
sion
(lb
/h)
UC
sch
edu
leT
her
mal
pow
er(M
W)
166
769.
884
6.26
1010
1116
644
3.17
2,51
1.2
1010
0018
0.75
196
729.
971,
225.
310
1011
196
682.
572,
891.
710
1011
196
229
3,76
8.7
1,74
9.9
0010
1123
7.6
626.
13,
843.
310
1011
229
267
5,75
2.4
2,82
5.0
1010
1126
776
2.16
4,99
9.7
1010
1126
728
37,
913.
23,
435.
610
1011
283
830.
75,
021.
710
1011
283
272
6,07
53,
008.
910
1011
272
783.
175,
006.
310
1011
272
246
4,46
0.8
2,12
1.6
1010
1124
668
3.48
4,59
7.3
1010
1124
621
32,
873.
21,
257.
900
1011
214.
556
9.41
3,60
1.4
1010
1121
319
270
8.66
1,10
4.9
1010
1119
250
0.96
2,91
8.4
1010
1119
216
155
382
9.82
1010
1116
140
6.83
1,92
4.6
1010
1116
114
748
9.95
723.
6710
1011
147
366.
551,
536.
710
1011
147
160
548.
3882
6.32
1010
1116
040
3.9
1,89
6.2
1010
1116
017
059
5.86
883.
0810
1011
170
433.
452,
190.
910
1011
170
185
674.
7398
2.63
1010
1118
547
9.11
2,67
5.2
1010
1118
520
82,
670.
51,
148.
500
1011
209.
655
2.2
3,51
5.7
1010
1120
823
23,
718.
51,
714.
410
1011
232
632.
474,
519.
410
1011
232
246
4,46
0.8
2,12
1.6
1010
1124
668
1.39
4,97
8.8
1010
1124
624
14,
184.
71,
970.
510
1011
241
663.
624,
929.
110
1011
241
236
3,91
9.8
1,82
5.7
1010
1123
664
6.24
4,69
9.3
1010
1123
622
53,
375.
91,
529.
310
1011
225
608.
644,
213.
310
1011
225
204
2,48
6.5
1,04
8.1
1010
1120
453
9.22
3,36
110
1011
204
182
657.
1497
0.97
1010
1118
246
0.75
2,74
3.6
1010
1018
4.25
161
553.
2485
5.97
1010
1116
138
8.21
2,25
6.7
1010
1016
6.61
131
412.
0769
4.99
1010
1014
0.99
308.
381,
703.
610
0010
144.
144,
953
62,3
52.8
35,7
00.9
14,
974.
6913
,452
.68
82,5
35.1
4,98
8.75
Table III.Operation of IEEE-30
bus system without windand PS units
Economic-emission UC
solution
299
(2) In Case B, the best cost commitment (BCC) has been obtained by ignoring theprice penalty factor H in objective function during entire operating intervals.
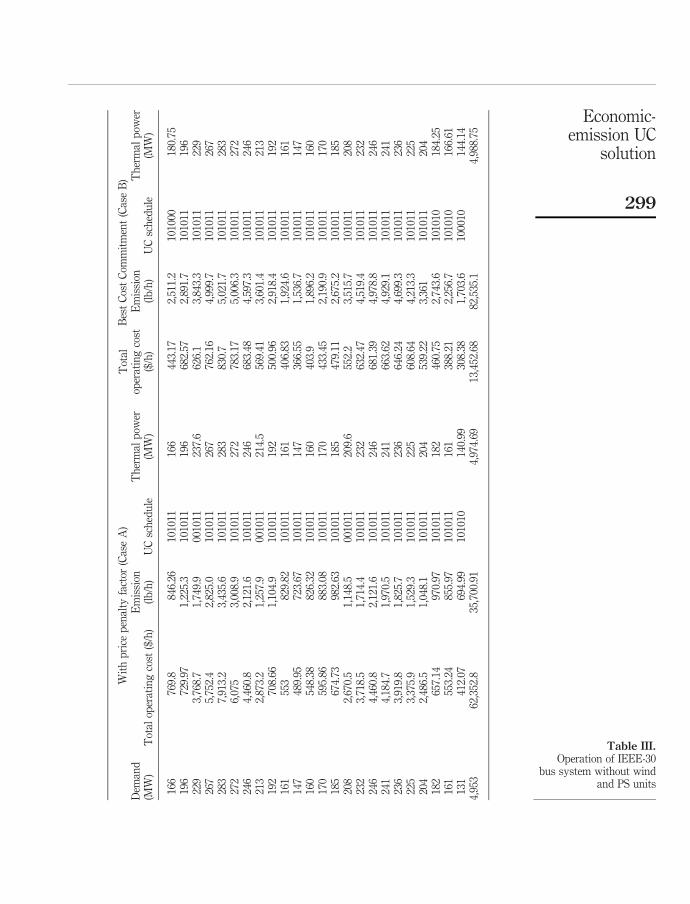
To illustrate the impact of incorporating wind and PS units into the system on existingutility generation scheduling problem, a comparison of commitment schedulesconsidering wind and PS unit’s capacity and without incorporating them has beenobtained. The Table III gives the unit commitment schedule along with cost ofgeneration, emission and power generated by all thermal units for each hour withoutincorporating wind and PS unit into the generation mix.
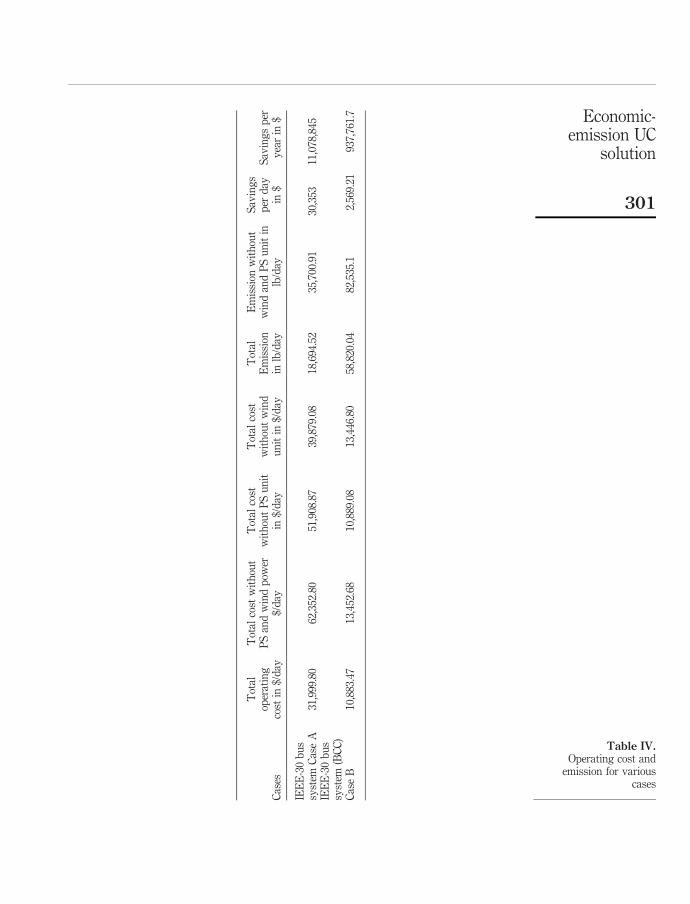
The inclusion of wind power and PS generation capacity will bring down the cost andemission by 48.68 and 47.63 per cent, respectively, but wind uncertainty will result intoswitching of few units. The switching is minimized because of the inclusion of PS unitwhich acts as back up in the event of sudden wind and load variations. The reserverequirement which is needed also can be supplied by PS unit in these conditionsotherwise thermal units are expected to meet the increased reserve requirement. This isalso attributed to the fact that there is unit’s minimum up/down time and thus can affectthe operation during wind power and load variations and may affect the switchingof unit and thus increase the cost slightly as unit may have to increase the generationdespite being costly rather than to switch on the units. The Table IV gives comparisonof cost involved along with emission caused by including wind and PS unit. The resultsare tabulated for both Cases A and B. The effects of wind unit and PS unit as individualentity have also been given. The saving in cost in dollars on per day and per year basishas been obtained. On the basis of these result the decision about the integration ofrenewables and the amount to be integrated can be taken. The results show that in casethe penalty is imposed on emission the integration of wind power units despiteuncertainty is profitable. The addition of PS units helps in reducing the effects of windpower variability on system operation and on operating cost as a whole.
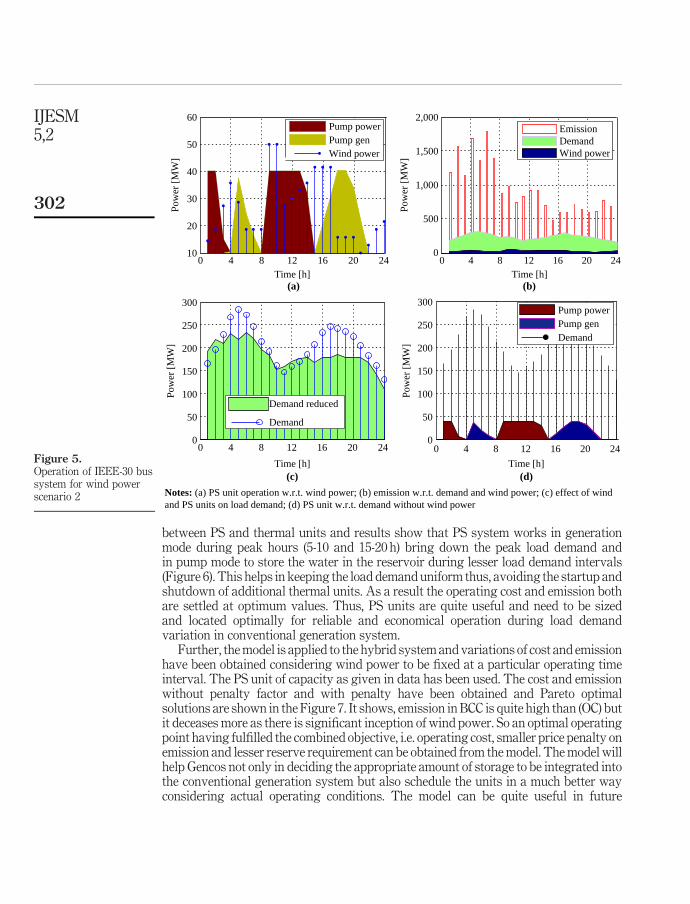
3.3 Hybrid system operation with different wind profileThe model has been applied to IEEE-30 bus system under various wind power scenariosand one having lesser probability and wide variations (wind power 2) is shown inFigure 1. The model works satisfactorily for different wind power conditions with PSunit used as given in Table I. In Figure 5(a), the PS unit operation with the system showsthat PS units generates power whenever wind power is low and pump the water whensufficient wind power is available. Thus, due to bi-objective problem in the model, the PSunits also help in smoothening the load curve and not putting pressure of switching onof the additional thermal units. In Figure 5(b), the emission level with demand and windpower is given. It also shows that model tends to keep wind power profile in mindas emission goes up slightly whenever wind power is less which otherwise would havebeen very high for the load demand in case PS unit and wind power are not available.In Figure 5(c) the load demand is flattened by PS and wind power unit when used incombination with thermal units. The effectiveness of the model is also demonstrated byFigure 5(d) which shows that if it is used without wind power, PS unit generates duringhigh load hours and lifts water during low load hours.
3.4 System operation without wind powerThe model has also been tested to extreme condition when the wind power is unavailablethroughout the operating time horizon. In this situation too there is perfect coordination
IJESM5,2
300
Cas
es
Tot
alop
erat
ing
cost
in$/
day
Tot
alco
stw
ith
out
PS
and
win
dp
ower
$/d
ay
Tot
alco
stw
ith
out
PS
un
itin
$/d
ay
Tot
alco
stw
ith
out
win
du
nit
in$/
day
Tot
alE
mis
sion
inlb
/day
Em
issi
onw
ith
out
win
dan
dP
Su
nit
inlb
/day
Sav
ing
sp
erd
ayin
$S
avin
gs
per
yea
rin
$
IEE
E-3
0b
us
syst
emC
ase
A31
,999
.80
62,3
52.8
051
,908
.87
39,8
79.0
818
,694
.52
35,7
00.9
130
,353
11,0
78,8
45IE
EE
-30
bu
ssy
stem
(BC
C)
Cas
eB
10,8
83.4
713
,452
.68
10,8
89.0
813
,446
.80
58,8
20.0
482
,535
.12,
569.
2193
7,76
1.7
Table IV.Operating cost and
emission for variouscases
Economic-emission UC
solution
301
between PS and thermal units and results show that PS system works in generationmode during peak hours (5-10 and 15-20 h) bring down the peak load demand andin pump mode to store the water in the reservoir during lesser load demand intervals(Figure 6). This helps in keeping the load demand uniform thus, avoiding the startup andshutdown of additional thermal units. As a result the operating cost and emission bothare settled at optimum values. Thus, PS units are quite useful and need to be sizedand located optimally for reliable and economical operation during load demandvariation in conventional generation system.
Further, the model is applied to the hybrid system and variations of cost and emissionhave been obtained considering wind power to be fixed at a particular operating timeinterval. The PS unit of capacity as given in data has been used. The cost and emissionwithout penalty factor and with penalty have been obtained and Pareto optimalsolutions are shown in the Figure 7. It shows, emission in BCC is quite high than (OC) butit deceases more as there is significant inception of wind power. So an optimal operatingpoint having fulfilled the combined objective, i.e. operating cost, smaller price penalty onemission and lesser reserve requirement can be obtained from the model. The model willhelp Gencos not only in deciding the appropriate amount of storage to be integrated intothe conventional generation system but also schedule the units in a much better wayconsidering actual operating conditions. The model can be quite useful in future
Figure 5.Operation of IEEE-30 bussystem for wind powerscenario 2
Time [h]
Time [h]
Notes: (a) PS unit operation w.r.t. wind power; (b) emission w.r.t. demand and wind power; (c) effect of windand PS units on load demand; (d) PS unit w.r.t. demand without wind power
(c)
0 4 8 12 16 20 24
Pow
er [
MW
]
0
50
100
150
200
250
300
Demand reduced
Demand
0 4 8 12 16 20 2410
20
30
40
50
60
(a)
Pow
er [
MW
]
Pump powerPump genWind power
Time [h]
Pow
er [
MW
]
0 4 8 12 16 20 240
500
1,000
1,500
2,000
(b)
EmissionDemandWind power
Time [h]
Pow
er [
MW
]
0 4 8 12 16 20 240
50
100
150
200
250
300
(d)
Pump powerPump genDemand
IJESM5,2
302
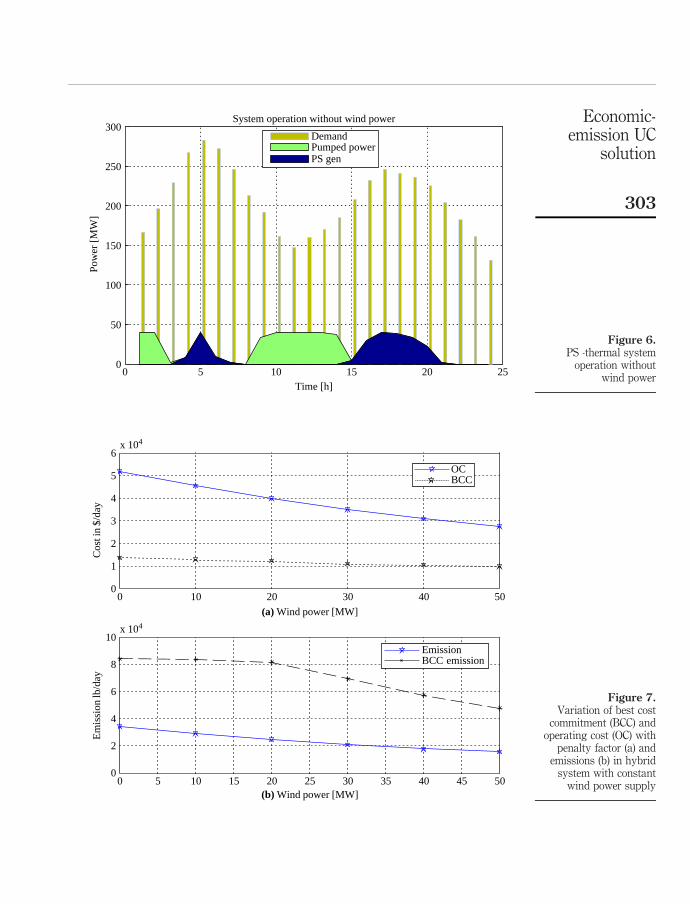
Figure 6.PS -thermal system
operation withoutwind power
0 5 10 15 20 250
50
100
150
200
250
300System operation without wind power
Time [h]
Pow
er [
MW
]
DemandPumped powerPS gen
Figure 7.Variation of best cost
commitment (BCC) andoperating cost (OC) with
penalty factor (a) andemissions (b) in hybrid
system with constantwind power supply
0 10 20 30 40 500
1
2
3
4
5
6x 10⁴
(a) Wind power [MW]
Cos
t in
$/da
y
OCBCC
0 5 10 15 20 25 30 35 40 45 500
2
4
6
8
10x 104
(b) Wind power [MW]
Em
issi
on lb
/day
EmissionBCC emission
Economic-emission UC
solution
303
planning and expansion of the existing system. For that the optimal size and location ofrenewable to be connected into the generation mix has to be obtained before investmentand it can be a scope for the future work.
4. ConclusionThis paper proposes a new model for the optimal solution of a multi-objective unitcommitment problem in a hybrid system when significant wind power is beingintegrated. The model takes care of the load and wind power variations by suitablydeciding the operation of PS units in generation and pump mode and thus, lowering thepeak load demand. With almost negligible operating cost and without any emissiongeneration from wind-PS units, the optimal commitment schedules for theconventional units have been obtained. The dispatch schedule will also reduce thereserve requirement of the system when combined with the wind-PS system. The studyhas been carried out for actual operating conditions in variable wind power and systemload profile with PS unit and provides Pareto-optimal solutions for cost and emission inthe hybrid system. The balance between operating cost and emission impacts is foundoptimum. Thus, the model can help integrating significant amount of wind energy intothe system more efficiently and effectively under constrained conditions.
References
Al-Awami, A.T., Sortomme, E. and El-Sharkawi, M.A. (2009), “Optimizingeconomic/environmental dispatch with wind and thermal units”, Proceedings of IEEEConference, pp. 1-6.
Castronuovo, E.D. and Lopes, J.A.P. (2004), “Optimal operation and hydro storage sizing of awind-hydro power plant”, Electrical Power & Energy Systems, Vol. 26, pp. 771-8.
Chen, C.L. (2007), “Simulated annealing-based optimal wind-thermal coordination scheduling”,IET Gen. Transm. Distrib., Vol. 1 No. 3, pp. 447-55.
Gonzalez, J.G., Muela, R.M.R., Santos, L.M. and Gonzalez, A.M. (2008), “Stochastic jointoptimization of wind generation and pumped-storage units in an electricity market”,IEEE Transaction on Power Systems, Vol. 23 No. 2, pp. 460-8.
Guan, X., Luh, P.B. and Rogan, P. (1994), “Optimization-based scheduling of hydrothermal powersystems with pumped-storage units”, IEEE Transaction on Power Systems, Vol. 9 No. 2,pp. 1023-31.
Hetzer, J., Yu, D.C. and Bhattarai, K. (2008), “An economic dispatch model incorporating windpower”, IEEE Transaction on Energy Conversion, Vol. 23 No. 2, pp. 603-11.
J.P. Sayler & Associates (2006), available at: www.windturbinewarehouse.com
Pappala, V.S., Erlich, I. and Singh, S.N. (2008), “Unit commitment under wind power and demanduncertainties”, paper presented at IEEE GM.
Raglend, I.J. and Padhy, N.P. (2006), “Solutions to practical unit commitment problems withoperational, power flow and environmental constraints”, IEEE Conference, pp. 1-8.
Ruiz, P.A., Phil brick, C.R., Zak, E., Cheung, K.W. and Sauer, P.W. (2009), “Uncertaintymanagement in the unit commitment problem”, IEEE Transaction on Power Systems,Vol. 24 No. 2, pp. 642-51.
Sanchez, I. (2006), “Short-term prediction of wind energy production”, Int. J. of Forecast., Vol. 22,pp. 43-56.
IJESM5,2
304
Tuohy, A., Meibom, P., Denny, E. and O’Malley, M. (2009), “Unit commitment for systems withsignificant wind penetration”, IEEETransaction onPower Systems, Vol. 24 No. 2, pp. 592-601.
Ummels, B.C., Gibescu, M., Pelgrum, E., Kling, W. and Brand, A. (2009), “Impacts of wind poweron thermal generation unit commitment and dispatch”, IEEE Transaction on EnergyConversion, Vol. 22 No. 1, pp. 44-51.
Wang, J., Shahidehpour, M. and Li, Z. (2008), “Security-constrained unit commitment with volatilewind power generation”, IEEE Transaction on Power Systems, Vol. 23 No. 3, pp. 1319-27.
Further reading
Angarita, J.M. and Usaola, J.G. (2007), “Combining hydro-generation and wind energy biddings andoperation on electricity spot markets”,Electrical Power SystemsResearch, Vol. 77, pp. 391-400.
Bathurst, G.N. and Strbac, G. (2003), “Value of combining energy storage and wind in short-termenergy and balancing markets”, Electrical Power System Research, Vol. 67, pp. 1-8.
Brooke, A., Kendrick, D., Meeraus, A., Raman, R. and Rosenthal, R.E. (1998), GAMS: A User’sGuide, GAMS Development Corporation, Washington, DC.
Castronuovo, E.D. and Lopes, J.A.P. (2004), “On the optimization of the daily operation of awind-hydro power plant”, IEEE Transaction on Power Systems, Vol. 19 No. 3, pp. 1599-606.
Li, F. and Kuri, B. (2005), “Generation scheduling in a system with wind power”, Proceedings ofIEEE/Power Engineering Society Transmission and Distribution Conference Exhibition:Asia Pacific, pp. 1-6.
(The Appendix follows overleaf.)
About the authorsYajvender Pal Verma received his Bachelor’s degree in Electrical Engineering from NITHamirpur in 2000 with Honors and his Master’s degree in Power Systems from PanjabUniversity, Chandigarh in 2002. He is presently working as an Assistant Professor in theDepartment of Electrical and Electronics Engineering at UIET Panjab University, Chandigarh.His research interests include distributed generation, wind power integration, power systemrestructuring, and power system optimization. Yajvender Pal Verma is the corresponding authorand can be contacted at: [email protected]
Ashwani Kumar received his Bachelor’s degree in Electrical Engineering from Pant NagarUniversity in 1988 and his Master’s degree in Power Systems from Panjab University, Chandigarh in1994, with Honors. He received his PhD from the Indian Institute of Technology-Kanpur in 2003. He ispresently working as an Associate Professor in the Department of Electrical Engineering atNIT-Kurukshetra, Haryana. His research interests include power system restructuring, power systemoptimization, FACTS applications to power systems, distributed generation and renewable energy.
To purchase reprints of this article please e-mail: [email protected] visit our web site for further details: www.emeraldinsight.com/reprints
Economic-emission UC
solution
305
Appendix
Sta
rtu
pco
stG
enn
o.M
ax.
MW
Min
.M
Wg
ba
a ($)
b($
/M
Wh
)c
($/
MW
h2)
Min
.U
pT
ime
(h)
Min
.d
own
Tim
e(h
)S
hu
tdow
nco
st($
)C
old
star
t(h
)H
ot($
)C
old
($)
120
050
0.01
,26
20.
9022
.983
02.
00.
00,3
751
150
270
176
280
200.
0,20
02
0.10
25.3
130
1.7
0.01
,750
22
601
7418
73
5015
0.0,
270
20.
0125
.505
01.
00.
06,2
501
130
150
113
435
100.
0,29
12
0.00
524
.90
03.
250.
00,8
241
285
111
026
75
3010
0.0,
290
20.
004
24.7
00
3.0
0.02
,500
21
521
7218
06
4012
0.0,
271
20.
005
25.3
00
3.0
0.02
,500
11
301
4011
3
Table AI.Data for IEEE-30bus system
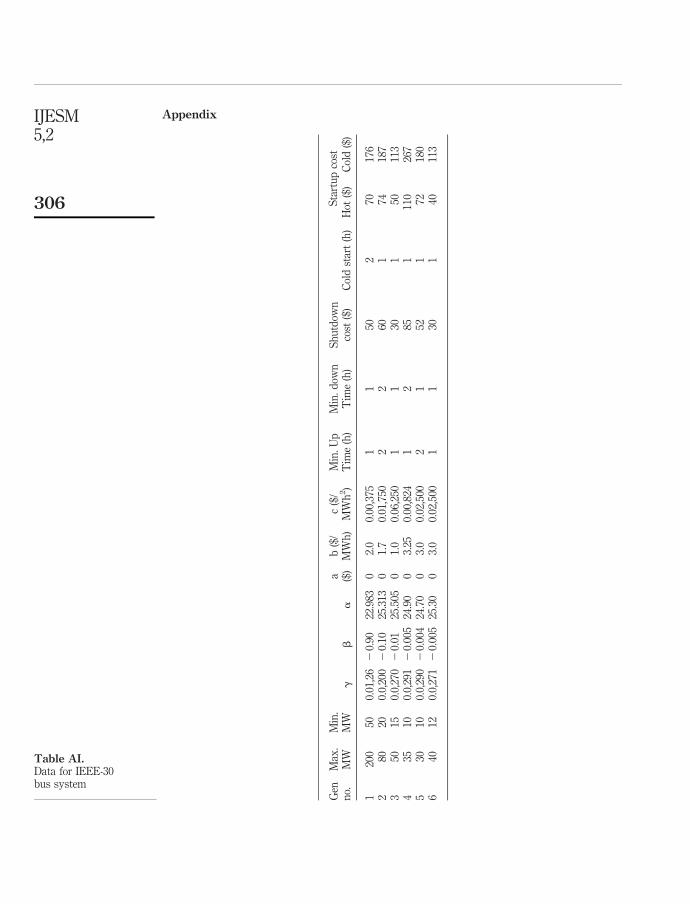
IJESM5,2
306