1
EARLY WARNING STRATEGIES FOR GOVERNMENTS: NAVIGATING THROUGH TROUBLED TIMES
KANSAS GOVERNMENT FINANCE OFFICERS ASSOCIATION
OCTOBER 18, 2013
Nancy L. Zielke, Senior Director
Alvarez & Marsal Public Sector Services
Nancy L. Zielke
1
Senior Director
Alvarez & Marsal
Public Sector Services, LLC
Prior to joining Alvarez & Marsal, Ms. Zielke worked in state and local governments where she served in senior financial and administrative
positions (University of Missouri - Kansas City; Unified Government of Wyandotte County/City of Kansas City, Kansas; Kansas City Board of
Public Utilities; and the State of Kansas). During her public sector career she led significant organizational change management and process
improvement initiatives; redesigned a budgeting for excellence with responsibility centered management; improved procurement practices;
consolidated governmental operations including shared services; developed competitive economic development incentive policies;
outsourced programs and services; and restructured the financial and operational elements of local governments.
Since joining A&M, Ms. Zielke has been a key project leader on numerous public sector financial and operational improvement
analyses/studies including: State of LA Department of Revenue; State of South Carolina Department of Employment & Workforce and
Department of Health and Human Services; Unified Government of Wyandotte County//Kansas City, Kansas, Maricopa County Community
College; San Jacinto Community College; Detroit Public Schools; Pittsburgh Public Schools; Humble Texas Independent Schools District;
Kansas City Kansas Board of Public Utilities; Cities of Harrisburg, PA; Leawood, KS; Overland Park, KS; Olathe, KS; Louisburg, KS;
Riverside, MO; Louisburg, KS; Lees’ Summit, MO; Huntsville, TX; Seabrook, TX; and numerous other governments.
She has been a key project lead on various distressed municipal government financial advisory service projects assisting in measuring the
financial health of communities and the development of strategic initiatives to address operating shortfalls. Ms. Zielke has recently served as
the acting Deputy CFO for Detroit Public Schools and Interim Director of Planning and Budget for the South Carolina Department of Health
and Human Services overseeing transformation of these entities’ budget planning and financial reporting operations.
Ms. Zielke received an undergraduate degree in business administration, with concentrations in economics and marketing, from Adrian
College, and a master's degree in public administration from the University of Kansas. As an author and speaker, she has made numerous
presentations on a wide variety of topics, including strategies for business process improvement, leadership, and best practices in budgeting
and resource allocation strategies. She is holds a certification as an Emergency Manager from Michigan State University.
Ms. Zielke has been a member of Government Finance Officers Association (GFOA), where she served on the Executive Board for six years
and was the elected 2004-2005 National President of GFOA. She is a member of Women in Public Finance, GFOA, Alpha Kappa Psi, and the
Kansas University City Management in Training Association and formerly active in the National Institute of Government Purchasing
Association and the National Association of College & University Business Officers. She serves as an advisor to the GFOA Governmental
Budgeting and Fiscal Policy Standing Committee and a reviewer for the GFOA Awards for Excellence Program.
Nancy Zielke is a Senior Director with Alvarez & Marsal Public Sector Services, LLC.
With more than 25 years of public sector experience, Ms. Zielke brings deep expertise
in state and local government budgeting; operational and financial improvement
strategies; and fiscal sustainability planning within complex government organizations.
Specializing in providing restructuring and business advice to troubled public sector
entities and creditor groups on governmental financial and operational issues, her
primary areas of focus include: cost structure and revenue enhancement analysis,
financial and operational management, budget redesign and reporting processes, cash
flow forecasting, financial modeling, debt capacity analysis, and evaluation of strategic
alternatives.

2
© Copyright 2013 Alvarez & Marsal Holdings, LLC. All rights reserved. ALVAREZ & MARSAL®,
® and A&M® are trademarks of Alvarez & Marsal Holdings, LLC.
PRESENTATION OUTLINE
I. Governments in Distress
II. Lessons Learned to Navigate Through Financial Difficulty
Develop Monitoring Systems to Track Financial Health
Provide Timely Reporting of Financial Results
Understand Cash and Financial Position
Prioritize Government Services and Operational Reviews
Provide for Accountability in Financial Management
Be Willing to Spend Money to Save Money
III. Conclusions & Wrap-up Questions
2
WHAT KEEPS A FINANCE OFFICER UP AT NIGHT:
Could I have seen this coming?
Was there an important ratio or audit note I
missed?
Are there other entities facing this same issue?
What can I learn from other distressed cities?
3
3
GOVERNMENTS IN FISCAL DISTRESS
GOVERNING estimates that only one of every 1,668 eligible general-purpose local
governments (0.06 percent) filed for bankruptcy protection over the past five years.
Excluding filings later dismissed, only one of every 2,710 eligible localities filed since 2008.
GOVERNING reported as of October 7, 2013 that since 2010, 36 cities, counties, and
special districts have filed for bankruptcy.
Eight General-Purpose Local Government Bankruptcy Filings
-- City of Detroit, MI
-- City of San Bernardino, CA
-- Town of Mammoth Lakes, CA (Dismissed)
-- City of Stockton, CA
-- Jefferson County, AL
-- City of Harrisburg, PA (Dismissed)
-- City of Central Falls, RI
-- Boise County, ID (Dismissed)
28 additional utilities, water districts, hospital authorities, and other municipal units
have also gone bankrupt in the wake of the financial crisis.
At the same time, local governments are challenged by external and internal sources of
fiscal distress, many of which cannot be controlled by the local government.
While a number of cities and counties across the U.S. are in financial distress, the
number that have filed for bankruptcy remains “rare.”
4
MEASURING THE FISCAL HEALTH OF LOCAL GOVERNMENTS
Common Symptoms Leading to Fiscal Distress
5
Not living within its means - excess
spending within Operating Funds
Poor budgeting, accounting and interim
financial reporting
Fluctuations and changes in property
values, collections and retail sales tax
base
Lack of political willingness or ability to
raise revenues and reduce costs (Nice
to Have’s versus Must Have’s)
Internal borrowing practices
Unfunded pension funds and other post
employment benefits
Lack of financial forecasting on
collective bargaining agreements
Loss of population (industry,
businesses, residential and school
enrollment)
Inability to forecast and manage cash
Weak management and political leadership
Frequent changes in government officials
Lack of financial policies
Major disclosure and internal control issues
Lack of monitoring of revenue collections
Political unawareness of community needs
Use of one-time funds to pay for ongoing
expenses
Management issues with the maintenance
of federal funds
Borrowing to cover cash flow needs – living
on your credit card
Lack of long-term forecasts and
contingency plans
Making commitments in good times that
are not sustainable
4
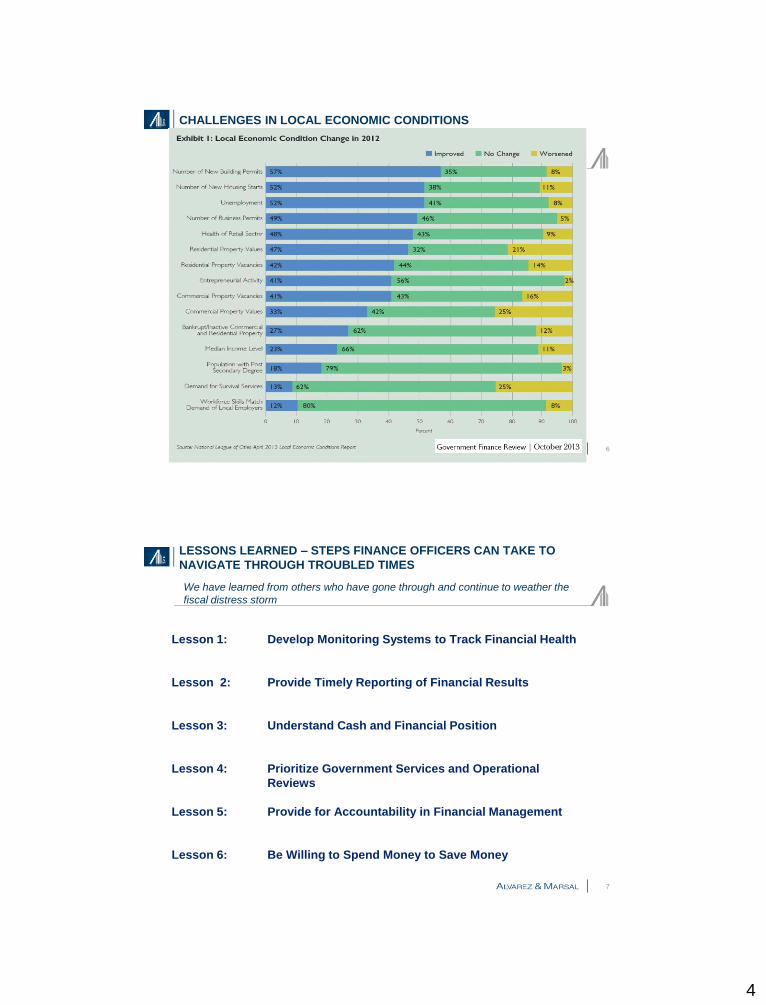
CHALLENGES IN LOCAL ECONOMIC CONDITIONS
6
LESSONS LEARNED – STEPS FINANCE OFFICERS CAN TAKE TO
NAVIGATE THROUGH TROUBLED TIMES
Lesson 1: Develop Monitoring Systems to Track Financial Health
Lesson 2: Provide Timely Reporting of Financial Results
Lesson 3: Understand Cash and Financial Position
Lesson 4: Prioritize Government Services and Operational
Reviews
Lesson 5: Provide for Accountability in Financial Management
Lesson 6: Be Willing to Spend Money to Save Money
We have learned from others who have gone through and continue to weather the
fiscal distress storm
7
5
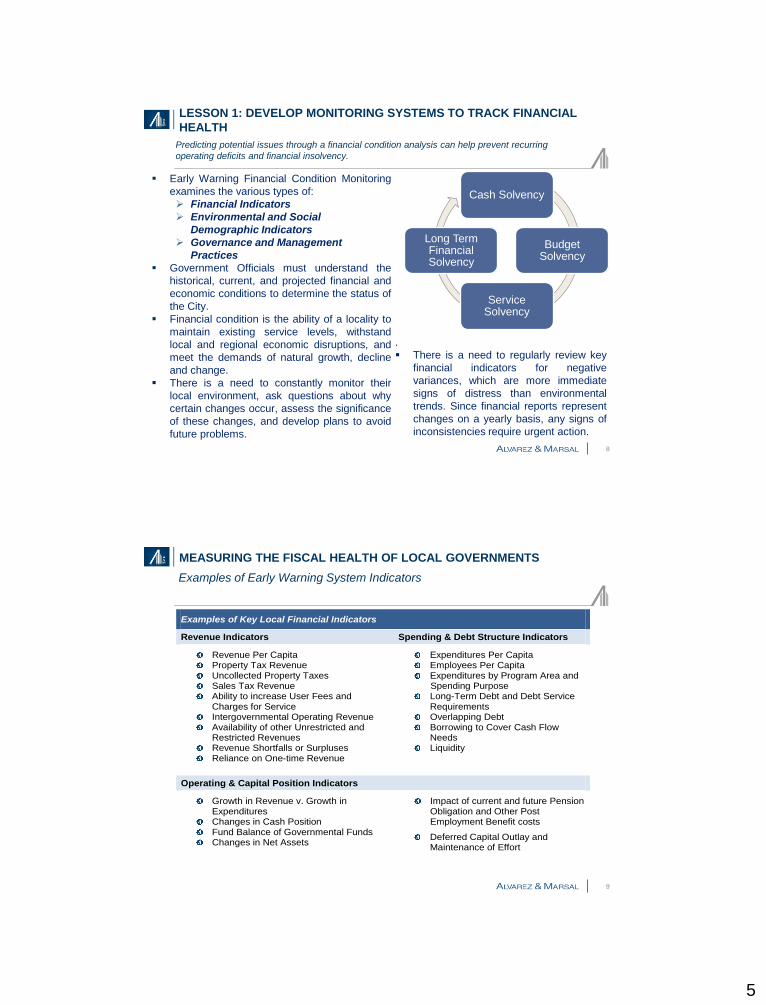
LESSON 1: DEVELOP MONITORING SYSTEMS TO TRACK FINANCIAL
HEALTH
Predicting potential issues through a financial condition analysis can help prevent recurring
operating deficits and financial insolvency.
8
Cash Solvency
Budget Solvency
Service Solvency
Long Term Financial Solvency
Early Warning Financial Condition Monitoring
examines the various types of:
Financial Indicators
Environmental and Social
Demographic Indicators
Governance and Management
Practices
Government Officials must understand the
historical, current, and projected financial and
economic conditions to determine the status of
the City.
Financial condition is the ability of a locality to
maintain existing service levels, withstand
local and regional economic disruptions, and
meet the demands of natural growth, decline
and change.
There is a need to constantly monitor their
local environment, ask questions about why
certain changes occur, assess the significance
of these changes, and develop plans to avoid
future problems.
.
There is a need to regularly review key
financial indicators for negative
variances, which are more immediate
signs of distress than environmental
trends. Since financial reports represent
changes on a yearly basis, any signs of
inconsistencies require urgent action.
MEASURING THE FISCAL HEALTH OF LOCAL GOVERNMENTS
Examples of Early Warning System Indicators
9
Examples of Key Local Financial Indicators
Revenue Indicators Spending & Debt Structure Indicators
Revenue Per Capita Property Tax Revenue Uncollected Property Taxes Sales Tax Revenue Ability to increase User Fees and
Charges for Service Intergovernmental Operating Revenue Availability of other Unrestricted and
Restricted Revenues Revenue Shortfalls or Surpluses Reliance on One-time Revenue
Expenditures Per Capita Employees Per Capita Expenditures by Program Area and
Spending Purpose Long-Term Debt and Debt Service
Requirements Overlapping Debt Borrowing to Cover Cash Flow
Needs Liquidity
Operating & Capital Position Indicators
Growth in Revenue v. Growth in Expenditures
Changes in Cash Position Fund Balance of Governmental Funds Changes in Net Assets
Impact of current and future Pension Obligation and Other Post Employment Benefit costs
Deferred Capital Outlay and Maintenance of Effort

6
MEASURING THE FISCAL HEALTH OF LOCAL GOVERNMENTS
Fiscal Health Warning Signs
10
Examples of Early Warning System Indicators
Examples of Key Environmental & Social Demographic Indicators
Community & Social Demographic Indicators
Population Losses and Density Personal Income Per Capita Income and Poverty Household $ Local Inflation
Housing and Residential Community Crime Rate Employment and Taxpayer Base Business Activity
Examples of Key Governance & Management Practices
Restrictions on Fiscal Powers Interim Financial Reporting Long Range Plan Collective Bargaining Agreement
Availability of Financial Policies Unqualified Audit Opinion and Internal
Control Issues Annual Budget and Capital Plans
MEASURING THE FISCAL HEALTH OF LOCAL GOVERNMENTS
Examples of Early Warning System Additional Indicators for Schools & Local
Education Agencies
11
Examples of Key Local Financial and Academic Program Indicators
Revenue and Spending Indicators
Fund Balance Ratio
Expenditure to Revenue Ratio
Days Cash on Hand Debt Ratio
Debt Ratio
Long Term Debt Margin
School Mill Ratio
Market Value to Personal Income Aid Ratio
Cost Per Program Area (i.e., Instruction, Academic Support, etc.)
Cost Per Student (i.e., Regular, Special, and Adult Education
Cost Per Value (i.e., Sq. Ft., Bus Ride, etc.)
Academic Performance and Operational Indicators
Enrollment Growth
Student Credit Hour Growth
Student Attendance
Behavior Infractions
Course Performance
Adequate Yearly Progress
Participation Rates in Annual Assessments
Graduation Rates
7
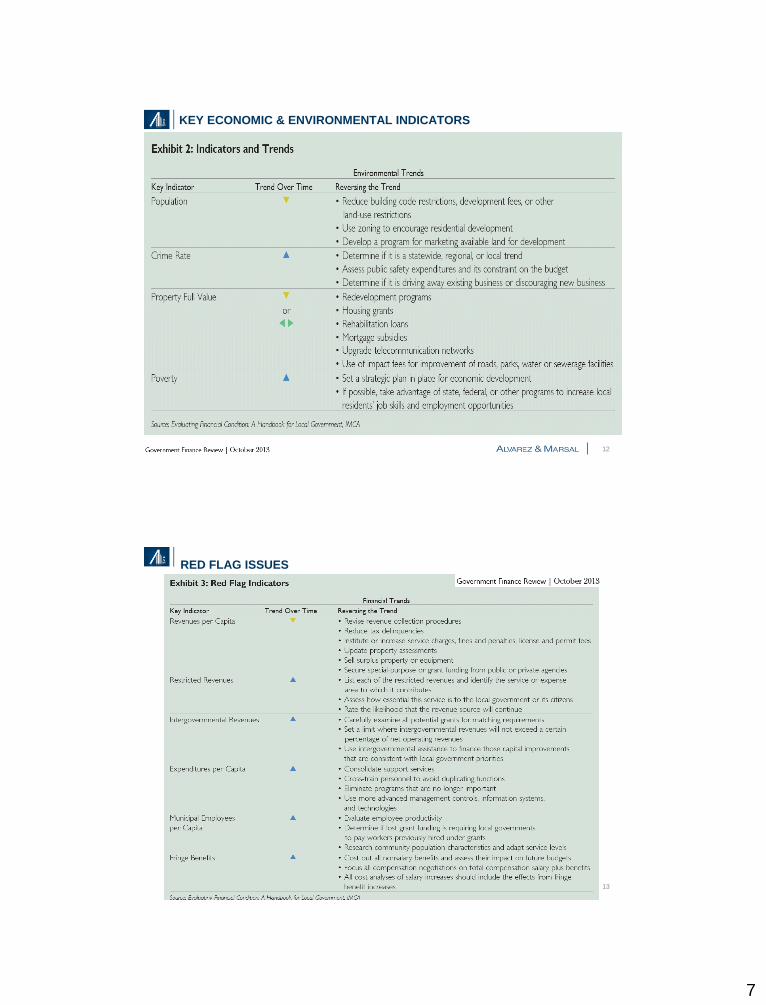
KEY ECONOMIC & ENVIRONMENTAL INDICATORS
12
RED FLAG ISSUES
13
8
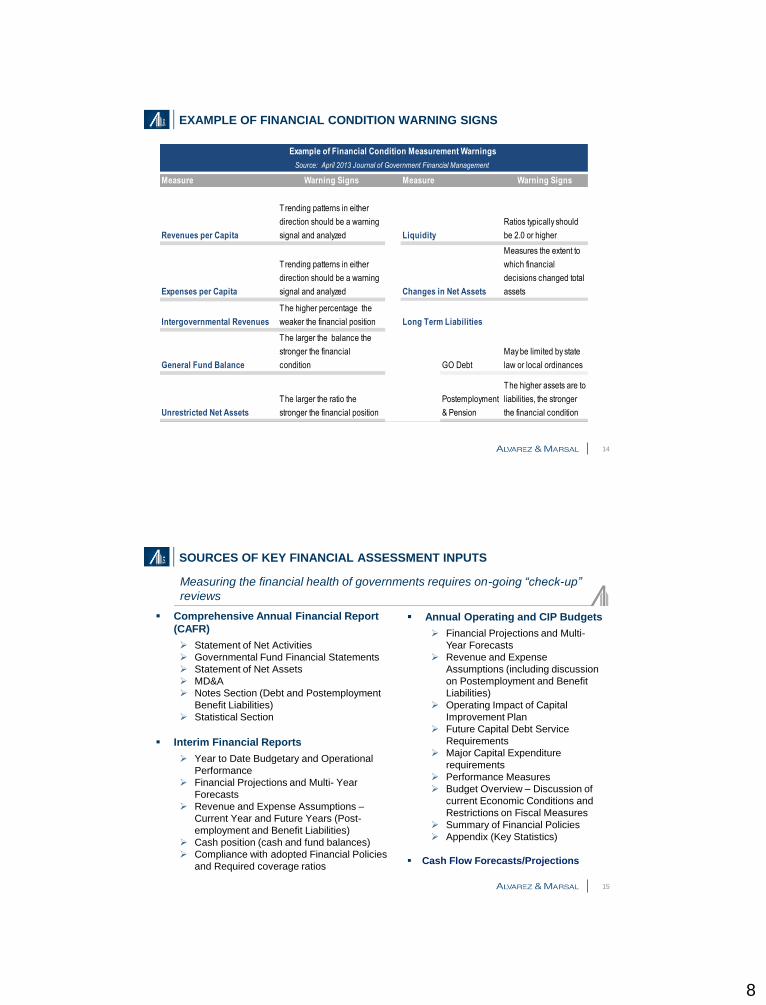
EXAMPLE OF FINANCIAL CONDITION WARNING SIGNS
14
Example of Financial Condition Measurement Warnings
Source: April 2013 Journal of Government Financial Management
Measure Warning Signs Measure Warning Signs
Revenues per Capita
Trending patterns in either
direction should be a warning
signal and analyzed Liquidity
Ratios typically should
be 2.0 or higher
Expenses per Capita
Trending patterns in either
direction should be a warning
signal and analyzed Changes in Net Assets
Measures the extent to
which financial
decisions changed total
assets
Intergovernmental Revenues
The higher percentage the
weaker the financial position Long Term Liabilities
General Fund Balance
The larger the balance the
stronger the financial
condition GO Debt
May be limited by state
law or local ordinances
Unrestricted Net Assets
The larger the ratio the
stronger the financial position
Postemployment
& Pension
The higher assets are to
liabilities, the stronger
the financial condition
SOURCES OF KEY FINANCIAL ASSESSMENT INPUTS
Comprehensive Annual Financial Report
(CAFR)
Statement of Net Activities
Governmental Fund Financial Statements
Statement of Net Assets
MD&A
Notes Section (Debt and Postemployment
Benefit Liabilities)
Statistical Section
Interim Financial Reports
Year to Date Budgetary and Operational
Performance
Financial Projections and Multi- Year
Forecasts
Revenue and Expense Assumptions –
Current Year and Future Years (Post-
employment and Benefit Liabilities)
Cash position (cash and fund balances)
Compliance with adopted Financial Policies
and Required coverage ratios
Measuring the financial health of governments requires on-going “check-up”
reviews
15
Annual Operating and CIP Budgets
Financial Projections and Multi-
Year Forecasts
Revenue and Expense
Assumptions (including discussion
on Postemployment and Benefit
Liabilities)
Operating Impact of Capital
Improvement Plan
Future Capital Debt Service
Requirements
Major Capital Expenditure
requirements
Performance Measures
Budget Overview – Discussion of
current Economic Conditions and
Restrictions on Fiscal Measures
Summary of Financial Policies
Appendix (Key Statistics)
Cash Flow Forecasts/Projections
9
EXAMPLE OF DASHBOARD – CITY OF STOCKTON
16
Description
Per Capita Income of the City compared to the State
average determines the wealth within the municipality. Per
capita income as an important measure of a City’s ability to
meet its financial obligations.
The measure reflects the community’s ability to pay taxes.
Generally, the higher the per capita income, the more
property taxes, sales taxes, user fees, and business taxes
the City can generate. If income is distributed evenly, a
higher per capita income may mean a lower dependency on
governmental services, depending on the mix of services
provided.
A decline in per capita income results in loss of consumer
purchasing power and can provide advance notice that
businesses, especially in the retail sector, will suffer a
decline that can ripple through the rest of the City’s
economy.
Formula
City Per Capita Income
State Per Capita Income
Income Per Capita
Warning Trend
Above 120% Per Capita Not in Stress (Green)
Between 70 and 120% Nearing or Moderate
Stress (Yellow)
Below 70% Distressed (Red)
Analysis & Trend
The City of Stockton has had per capita income levels
between 70 and 72% since 2001. This ratio is near the
lower end of the nearing to moderate per capita levels
and nearing the distressed level.
This indicator received a yellow rating
Calendar Year - As of January 1
2006 2007 2008 2009 2010 2011
Income Per Capita
Stockton Per Capita Income 29,383$ 31,012$ 31,250$ 29,995$ 30,251$ 31,013$
CA Per Capita Income 41,518$ 43,211$ 44,003$ 41,034$ 41,893$ 43,647$
Ratio 70.8% 71.8% 71.0% 73.1% 72.2% 71.1%
Source: Federal Reserve Economic Data (January 1 of each year)
$-
$10,000
$20,000
$30,000
$40,000
$50,000
2001 2002 2003 2004 2005 2006 2007 2008 2009 2010 2011
Local to State Per Capita Income
CA Per Capita Income Stockton Per Capita Income
74.8% 75.6% 75.7% 74.4% 71.9% 70.8% 71.8% 71.0% 73.1% 72.2% 71.1%
EXAMPLE OF DASHBOARD – EXAMPLE
17
Description
Each year, a certain percentage of property taxes are not
collected because of property owners’ inability to pay, intentional
deferral of payments, deficiencies in collection methods, policies
and procedures, or a declining economy. Property taxes are
collected by the county and distributed based on the amount
levied by separate taxing entities.
If the percentage of uncollected property taxes increases over
time, it may indicate a decline in the City’s overall economic
health.
Warning Trend
Increasing amount of uncollected property taxes as a percentage
of net property tax levy.
An uncollectible rate of 2% or 3% per year normal. If the
delinquency rate rises for two consecutive years or more to 5% to
8%, it may signal potential problems in the stability of the property
tax base or collection methods.
Formula
Uncollected property taxes
Net property tax levy
Uncollected Property Taxes
Analysis & Trend
The City’s delinquent property taxes have ranged
from a low of 1% in 2006 to a high of 5.6% in
2010. In most years the delinquent property taxes
have ranged between 1% and 3%.
The warning trend was observed since 2007 for
this indicator. The credit rating agencies consider
an uncollectible rate of 2% or 3% per year
normal. If the delinquency rate rises for two
consecutive years or more to 5% to 8%, it may
signal potential problems in the stability of the
property tax base or collection methods.
This indicator received a red rating
FY 2006 FY 2007 FY 2008 FY 2009 FY 2010
Delinquent Property Tax 93,980$ 328,568$ 325,421$ 430,202$ 561,968$
Net Property Tax Levy 8,990,268$ 9,409,338$ 9,409,228$ 10,354,161$ 10,276,906$
% of Net Property Tax Levy 1.0% 3.5% 3.5% 4.2% 5.5%
10
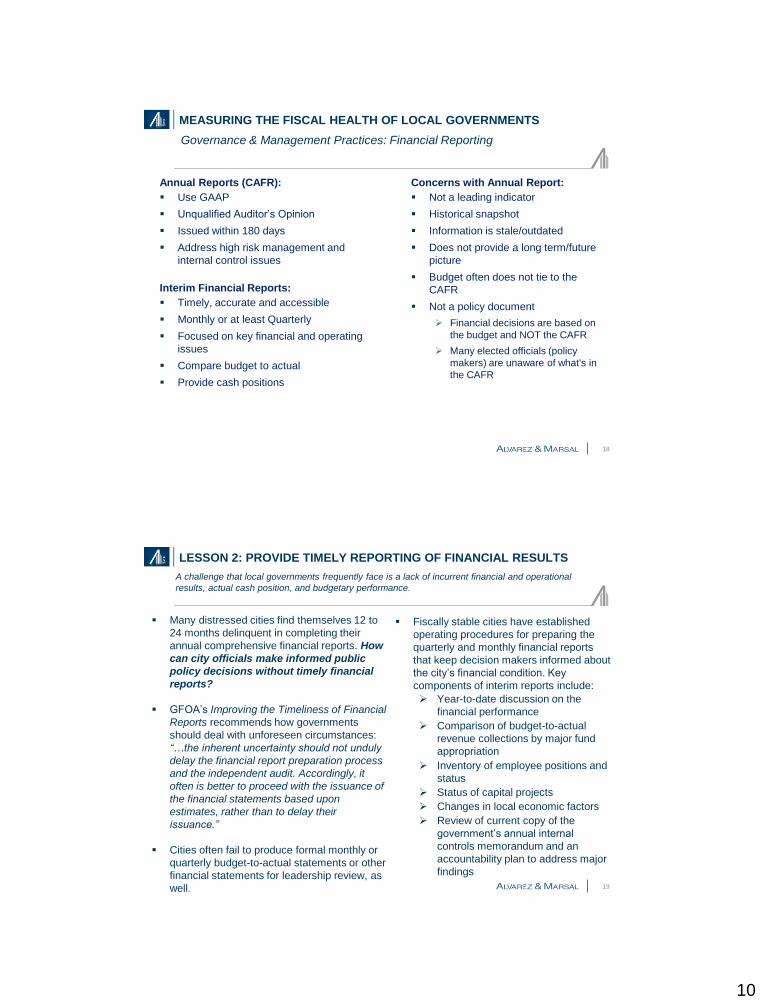
MEASURING THE FISCAL HEALTH OF LOCAL GOVERNMENTS
Annual Reports (CAFR):
Use GAAP
Unqualified Auditor’s Opinion
Issued within 180 days
Address high risk management and
internal control issues
Interim Financial Reports:
Timely, accurate and accessible
Monthly or at least Quarterly
Focused on key financial and operating
issues
Compare budget to actual
Provide cash positions
Fiscal Health Warning Signs
18
Concerns with Annual Report:
Not a leading indicator
Historical snapshot
Information is stale/outdated
Does not provide a long term/future
picture
Budget often does not tie to the
CAFR
Not a policy document
Financial decisions are based on
the budget and NOT the CAFR
Many elected officials (policy
makers) are unaware of what's in
the CAFR
Governance & Management Practices: Financial Reporting
LESSON 2: PROVIDE TIMELY REPORTING OF FINANCIAL RESULTS
A challenge that local governments frequently face is a lack of incurrent financial and operational
results, actual cash position, and budgetary performance.
19
Many distressed cities find themselves 12 to
24 months delinquent in completing their
annual comprehensive financial reports. How
can city officials make informed public
policy decisions without timely financial
reports?
GFOA’s Improving the Timeliness of Financial
Reports recommends how governments
should deal with unforeseen circumstances:
“…the inherent uncertainty should not unduly
delay the financial report preparation process
and the independent audit. Accordingly, it
often is better to proceed with the issuance of
the financial statements based upon
estimates, rather than to delay their
issuance.”
Cities often fail to produce formal monthly or
quarterly budget-to-actual statements or other
financial statements for leadership review, as
well.
Fiscally stable cities have established
operating procedures for preparing the
quarterly and monthly financial reports
that keep decision makers informed about
the city’s financial condition. Key
components of interim reports include:
Year-to-date discussion on the
financial performance
Comparison of budget-to-actual
revenue collections by major fund
appropriation
Inventory of employee positions and
status
Status of capital projects
Changes in local economic factors
Review of current copy of the
government’s annual internal
controls memorandum and an
accountability plan to address major
findings
11
LESSON 3: UNDERSTAND CASH AND FINANCIAL POSITION
Processes must be established that inform officials when revenues and expenses occur – a
lesson several distressed organizations have learned the hard way.
In normal government operations, revenues and expenses are not evenly distributed over a
12-month period.
Cash flow projections help identify variances in revenues and expenses and the overall cash
position, which is a leading indicator of fiscal health. Without current financial information,
actual cash position, and budgetary performance information, effective management of
operations will prove difficult.
GFOA’s best practice, Use of Cash Flow Forecasts in Treasury Operations recommends
integrating operational cash flow forecasts into a government’s financial policies. Specific
elements should be incorporated in the development of cash flow forecasts, according to
Use of Cash Flow Forecasts in Treasury Operations.
Cash flow forecasts should include inflows and outflows for a defined period (typically weekly
or monthly) by each major fund group, with input from city department heads about the
timing of planned expenditures. Doing so ensures that the jurisdiction will have adequate
funds on hand to address departmental needs, while at the same time maximizing the return
on available cash.
While local governments approve annual budgets, regular ongoing review and analysis of the
organization’s financial cash position is frequently overlooked.
20
LESSON 4: PRIORITIZE GOVERNMENT SERVICES AND OPERATIONAL
REVIEWS
Jurisdictions need to look for creative ways of addressing their financial problems.
21
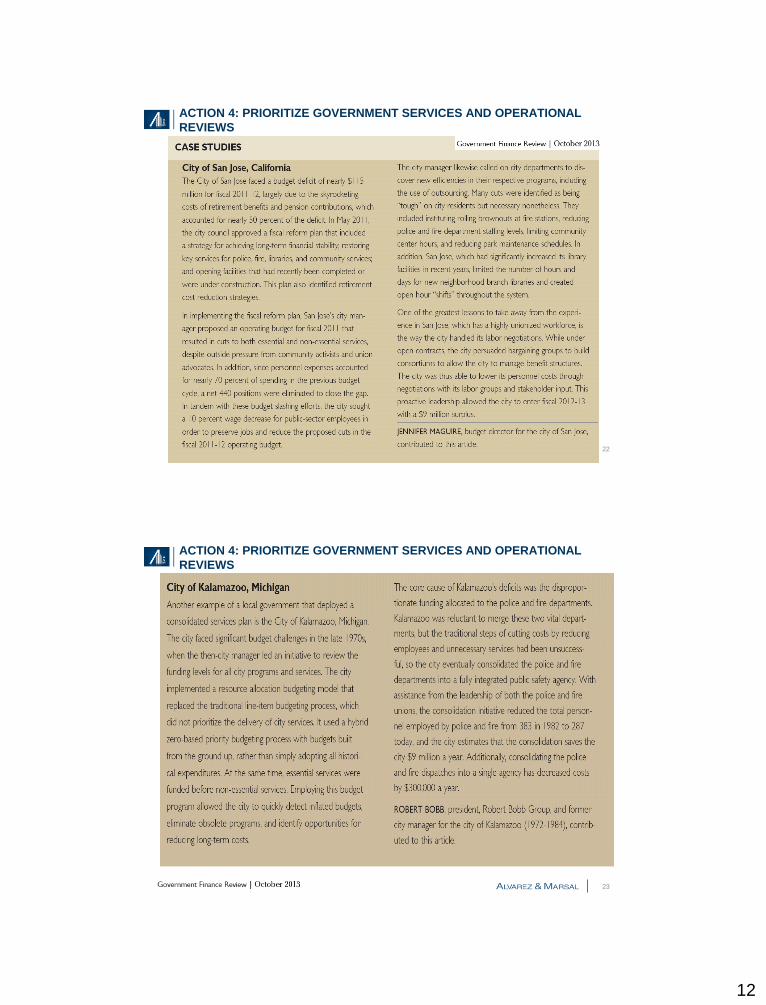
A GFOA whitepaper, “Zero-Based Budgeting: Modern Experiences and
Current Perspectives,” outlines approaches governments can use to
develop budgets, especially during times of fiscal distress.
Case Study Examples:
City of San Jose, California
City of Kalamazoo, Michigan
12
22
ACTION 4: PRIORITIZE GOVERNMENT SERVICES AND OPERATIONAL
REVIEWS
23
ACTION 4: PRIORITIZE GOVERNMENT SERVICES AND OPERATIONAL
REVIEWS
13
LESSON 5: PROVIDE FOR ACCOUNTABILITY IN FINANCIAL
MANAGEMENT
Revenue and expenditure policies foster a complete understanding of revenue sources
and thus provide a basis for prudent planning, but they are often missing from the critical
checklist.
Best practices promote that governments should have detailed financial management
policies in place to support sustainable and accountable organizations.
Financial planning policies which address both the need for a long-term view and the
fundamental principle of a balanced budget.
Revenue policies which seek stability to avoid potential service disruptions caused by
revenue shortfalls. Understanding the revenue stream is essential to prudent planning.
Expenditure policies lead to fiscal stability by ensuring prudent planning for
expenditures of jurisdictions, which define ongoing public service commitment.
Governments must use transparency and accountability in monitoring and reporting
financial results. In many instances, local governments have approved policies but fail to
follow them.
Finance offices need to monitor and report the outcomes of approved policies and make
adjustments as needed.
Without approved financial and management policy safeguards, there is no basis for
sustainable financial stewardship.
24
MEASURING THE FISCAL HEALTH OF LOCAL GOVERNMENTS
Expenditure Policies
Debt Capacity, Issuance, and
Management
Reserve or Stabilization Accounts
OPEB and Pension Liabilities
Cost Recovery
Business Preparedness and Continuity
Policies
Annual Budget Plan
Capital Improvements Plan
Long-Term Fiscal Forecasts
Cash Flow Plan
Contingency Plan
Fiscal Health Warning Signs
25
Financial Planning Policies
Balanced Budget
Long-Range Planning
Asset Inventory
Cash Management
Revenue Policies
Revenue Diversification
Fees and Charges
Use of One-time Revenues
Use of Unpredictable Revenues
Fund Balance
Governance & Management Practices: Examples of Financial Policies and Plans
14
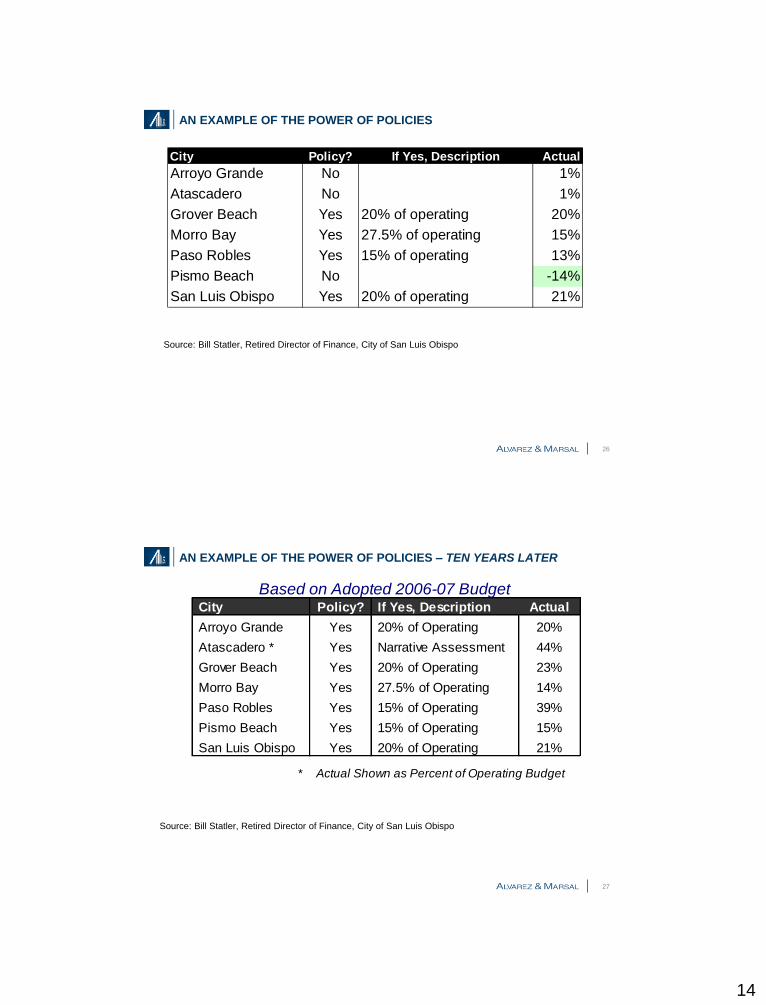
AN EXAMPLE OF THE POWER OF POLICIES
City Policy? If Yes, Description Actual
Arroyo Grande No 1%
Atascadero No 1%
Grover Beach Yes 20% of operating 20%
Morro Bay Yes 27.5% of operating 15%
Paso Robles Yes 15% of operating 13%
Pismo Beach No -14%
San Luis Obispo Yes 20% of operating 21%
Source: Bill Statler, Retired Director of Finance, City of San Luis Obispo
26
AN EXAMPLE OF THE POWER OF POLICIES – TEN YEARS LATER
City Policy? If Yes, Description Actual
Arroyo Grande Yes 20% of Operating 20%
Atascadero * Yes Narrative Assessment 44%
Grover Beach Yes 20% of Operating 23%
Morro Bay Yes 27.5% of Operating 14%
Paso Robles Yes 15% of Operating 39%
Pismo Beach Yes 15% of Operating 15%
San Luis Obispo Yes 20% of Operating 21%
* Actual Shown as Percent of Operating Budget
Based on Adopted 2006-07 Budget
Source: Bill Statler, Retired Director of Finance, City of San Luis Obispo
27
15
MEASURING THE FISCAL HEALTH OF LOCAL GOVERNMENTS
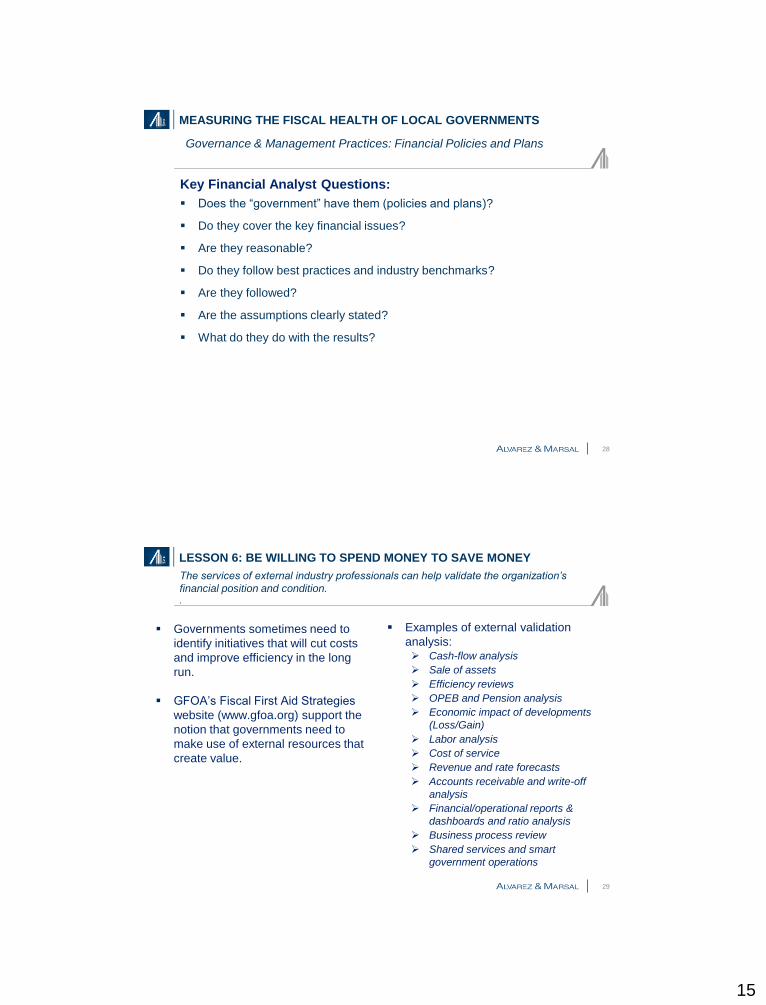
Key Financial Analyst Questions:
Does the “government” have them (policies and plans)?
Do they cover the key financial issues?
Are they reasonable?
Do they follow best practices and industry benchmarks?
Are they followed?
Are the assumptions clearly stated?
What do they do with the results?
Fiscal Health Warning Signs
28
Governance & Management Practices: Financial Policies and Plans
LESSON 6: BE WILLING TO SPEND MONEY TO SAVE MONEY
Governments sometimes need to
identify initiatives that will cut costs
and improve efficiency in the long
run.
GFOA’s Fiscal First Aid Strategies
website (www.gfoa.org) support the
notion that governments need to
make use of external resources that
create value.
The services of external industry professionals can help validate the organization’s
financial position and condition. .
29
Examples of external validation
analysis: Cash-flow analysis
Sale of assets
Efficiency reviews
OPEB and Pension analysis
Economic impact of developments
(Loss/Gain)
Labor analysis
Cost of service
Revenue and rate forecasts
Accounts receivable and write-off
analysis
Financial/operational reports &
dashboards and ratio analysis
Business process review
Shared services and smart
government operations
16
SUMMARY & CONCLUSIONS
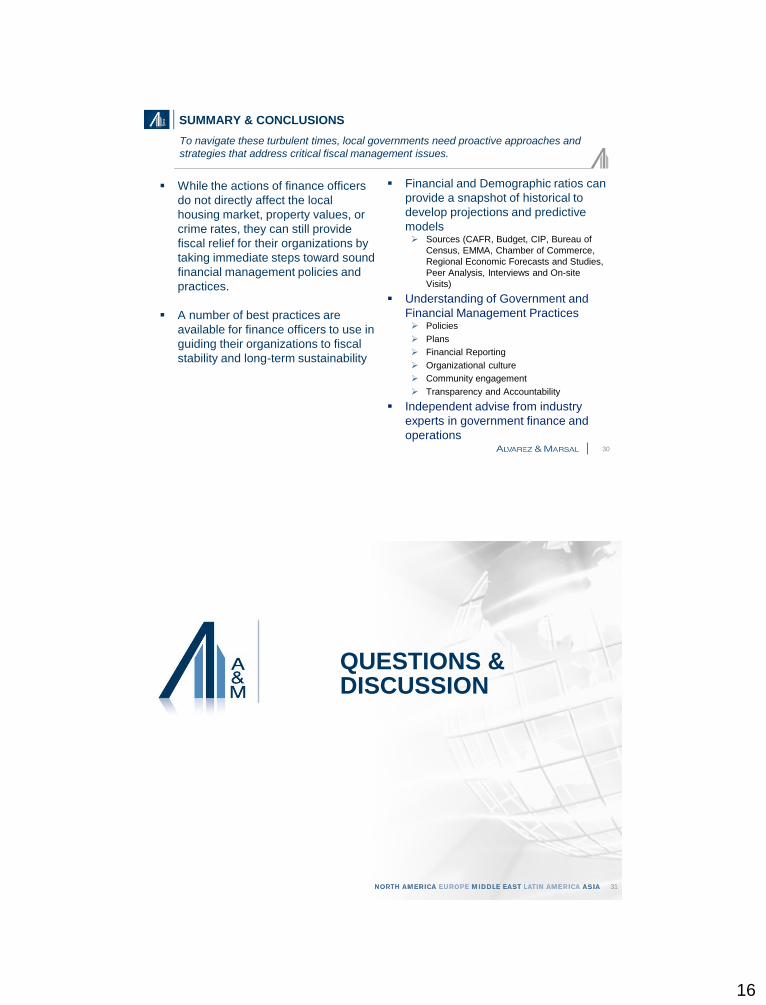
While the actions of finance officers
do not directly affect the local
housing market, property values, or
crime rates, they can still provide
fiscal relief for their organizations by
taking immediate steps toward sound
financial management policies and
practices.
A number of best practices are
available for finance officers to use in
guiding their organizations to fiscal
stability and long-term sustainability
To navigate these turbulent times, local governments need proactive approaches and
strategies that address critical fiscal management issues.
30
Financial and Demographic ratios can
provide a snapshot of historical to
develop projections and predictive
models Sources (CAFR, Budget, CIP, Bureau of
Census, EMMA, Chamber of Commerce,
Regional Economic Forecasts and Studies,
Peer Analysis, Interviews and On-site
Visits)
Understanding of Government and
Financial Management Practices Policies
Plans
Financial Reporting
Organizational culture
Community engagement
Transparency and Accountability
Independent advise from industry
experts in government finance and
operations
QUESTIONS & DISCUSSION
31
17
A&M OVERVIEW
32
For nearly three decades, Alvarez & Marsal has set the standard for working with
organizations to tackle complex business issues, boost operating performance and maximize
stakeholder value.
About A&M Founded in 1983 by co-CEOs Tony Alvarez II and Bryan Marsal
2,200+ professionals
42 cities; 18 nations; 4 continents
300+ Managing Directors
North America New York (Global HQ)
Atlanta
Birmingham
Boston
Charlotte
Chicago
Dallas
Denver
Detroit
Houston
Kansas City
Los Angeles
Miami
Nashville
Philadelphia
Phoenix
San Antonio
San Francisco
Seattle
Toronto
Vancouver
Washington, D.C.
Europe and the Middle East London (European HQ)
Amsterdam
Athens
Dubai
Madrid
Milan
Latin America São Paulo (Latin American HQ)
Bogotá
Asia Hong Kong (Asian HQ)
Mumbai
Mexico City
Moscow
Munich
Paris
Warsaw
PUBLIC SECTOR SERVICES
33
Alvarez & Marsal helps public sector entities identify new ways to overcome challenges and
implement sustainable change – pioneering an approach based on operational and financial
improvement principles that have proven powerful in the private sector.
As the only traditional
restructuring firm with a
dedicated Public Sector
practice, A&M helps public
sector entities identify new
ways to overcome
challenges and implement
sustainable change.
A&M Public Sector
professionals – qualified
experts with an average of
20 to 25 years of
experience – have
extensive experience
managing critical
performance improvement
initiatives, combined with a
profound personal
commitment to assist
organizations in
overcoming the hurdles of
service delivery in
resource-constrained
environments.
Examples of Representative Public Sector Experience
Unified Government of Wyandotte County /
Kansas City, KS
Kansas City Board of Public Utilities
City of Leawood, KS
City of Overland Park, KS
City of Olathe, KS
City of Louisburg, KS
City of Houston, TX
City of Huntsville, TX
City of Seabrook, TX
Los Angeles Unified School District
State of Louisiana Department of Revenue
City of Stockton, CA (Creditor Representation)
City of Mammoth Lakes, CA (Creditor
Representation)
Jefferson County, AL (Creditor Representation)
City Council of Harrisburg, PA
Government of Guam (Third Party Fiduciary
Agent)
Government of U.S. Virgin Islands (Third Party
Fiduciary Agent)
New Orleans Public Schools
St. Louis Public Schools
Detroit Public Schools
District of Columbia Public Schools
New York City Department of Education
State of North Carolina – Department of HHS
State of South Carolina – Department of HHS
State of Pennsylvania – Department of Public
Welfare
State of South Carolina – Department of
Employment & Workforce
State of Alabama DOT
U.S. Army Corps of Engineers and U.S. Air
Force
Chicago Transit Authority
U.S. Environmental Protection Agency
U.S. Department of Energy
Washington DC Planning and Economic
Development
City of Jacksonville, FL
Multiple Education Focused Philanthropies
U.S. Department of Education
Maricopa County Community College District
Baltimore City Schools
City of Lees’ Summit, MO
City of Riverside, MO
City of Independence, MO
Pittsburgh, Pennsylvania Public Schools
Fairfax County, VA
City of Greenwood, MO
Charleston, South Carolina Public Schools
33
18
OUR APPROACH TO MUNICIPAL SOLVENCY & LIQUIDITY ANALYSIS
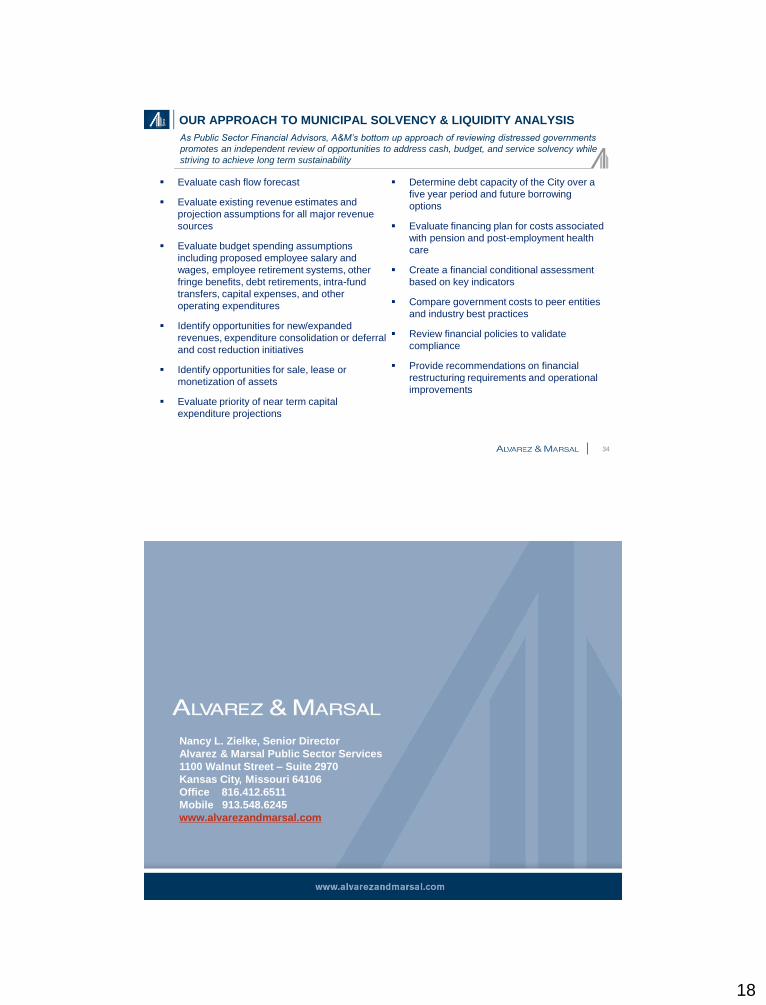
Evaluate cash flow forecast
Evaluate existing revenue estimates and
projection assumptions for all major revenue
sources
Evaluate budget spending assumptions
including proposed employee salary and
wages, employee retirement systems, other
fringe benefits, debt retirements, intra-fund
transfers, capital expenses, and other
operating expenditures
Identify opportunities for new/expanded
revenues, expenditure consolidation or deferral
and cost reduction initiatives
Identify opportunities for sale, lease or
monetization of assets
Evaluate priority of near term capital
expenditure projections
As Public Sector Financial Advisors, A&M’s bottom up approach of reviewing distressed governments
promotes an independent review of opportunities to address cash, budget, and service solvency while
striving to achieve long term sustainability
34
Determine debt capacity of the City over a
five year period and future borrowing
options
Evaluate financing plan for costs associated
with pension and post-employment health
care
Create a financial conditional assessment
based on key indicators
Compare government costs to peer entities
and industry best practices
Review financial policies to validate
compliance
Provide recommendations on financial
restructuring requirements and operational
improvements
Nancy L. Zielke, Senior Director
Alvarez & Marsal Public Sector Services
1100 Walnut Street – Suite 2970
Kansas City, Missouri 64106
Office 816.412.6511
Mobile 913.548.6245
www.alvarezandmarsal.com