Eagle Ford play map

EIA Map of Eagle Ford Shale Play

Dallas-Fort Worth Eagle Ford dip cross section

Southwest to Northeast cross section of Eagle Ford Unconformity

Detail Upper Eagle Ford Structure Map

Eagle Ford multiple target zones Austin Chalk-Upper + Lower Eagle Ford

Eagle Ford 18 month oil and condensate cums

Eagle Ford oil-condensate EUR map
Major Eagle Ford-Faults

Eagle Ford Shale Surface Faults
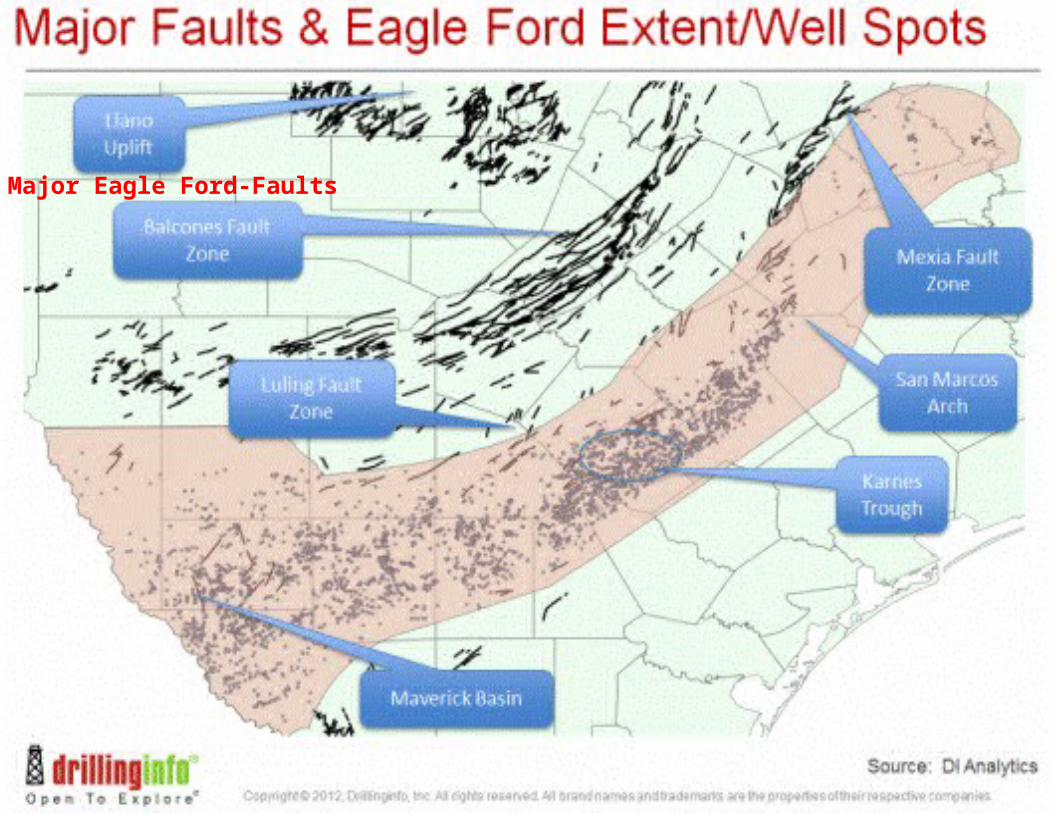
interval isopach Eagle Ford shale

Eagle Ford thickness and oil-gas condensate-dry gas windows
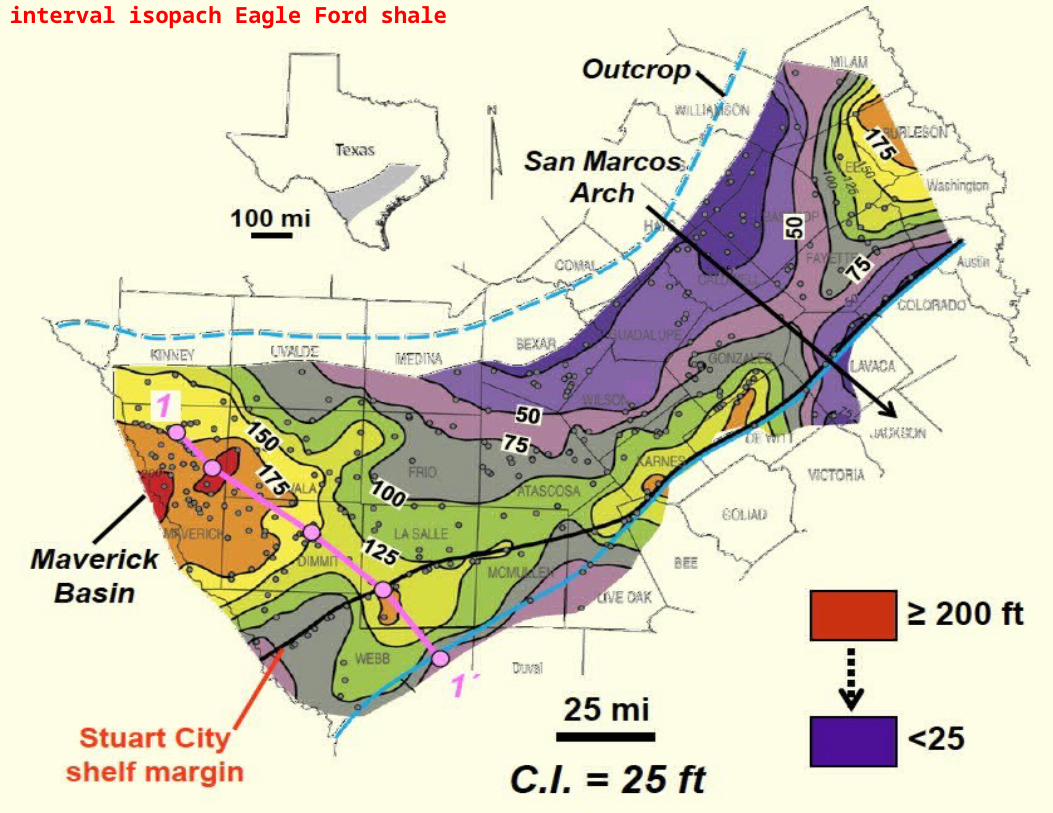
Detail Eagle Ford thickness + outcrops

Eagle Ford oil-condensate gas-gas windows
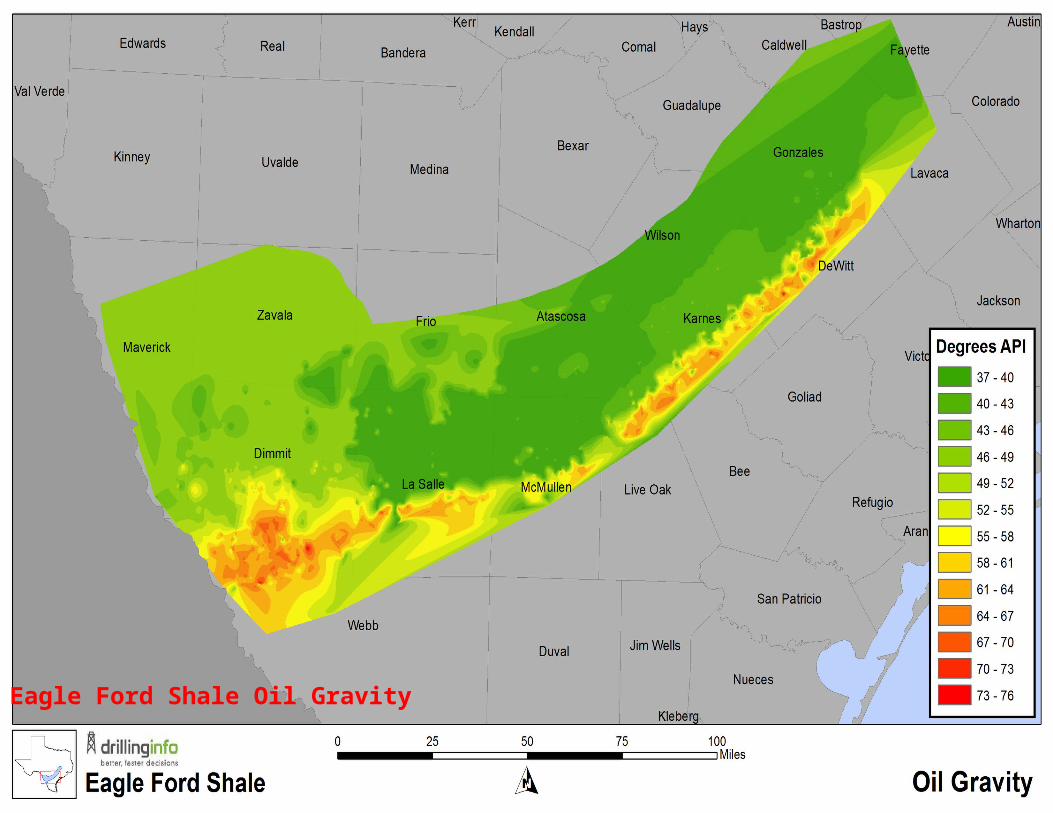
Eagle Ford Shale Oil Gravity
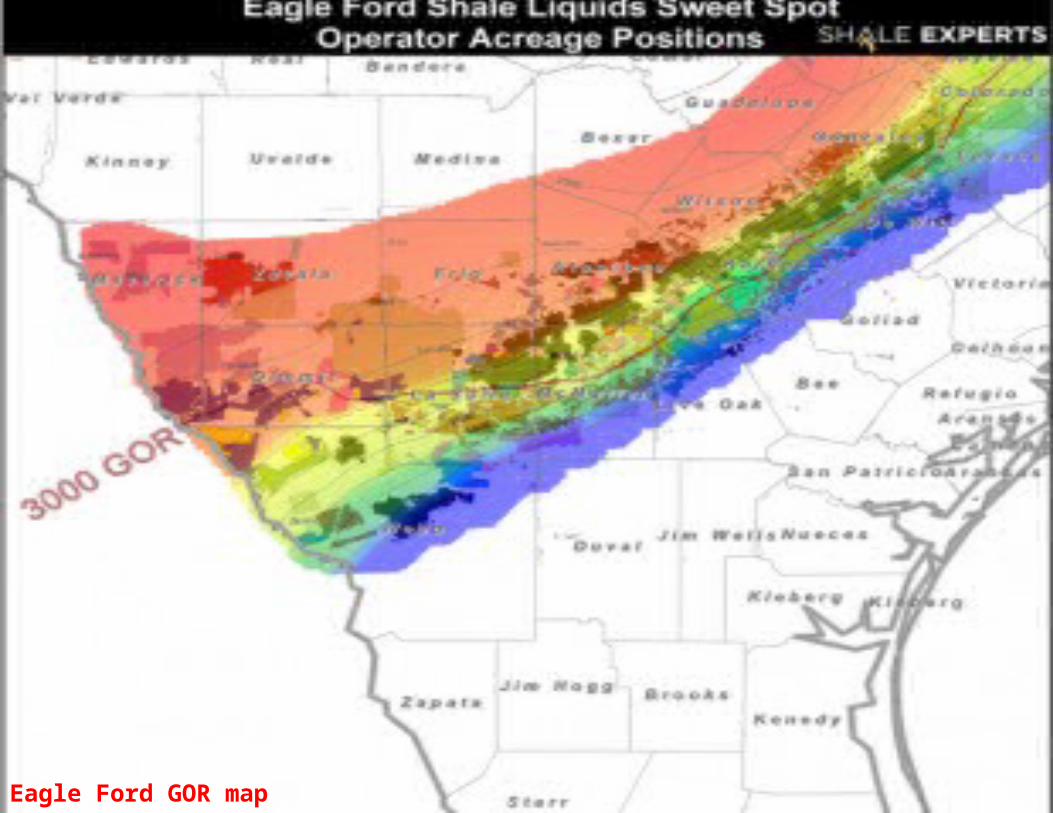
Eagle Ford GOR map

Eagle Ford players since 6-1-2008
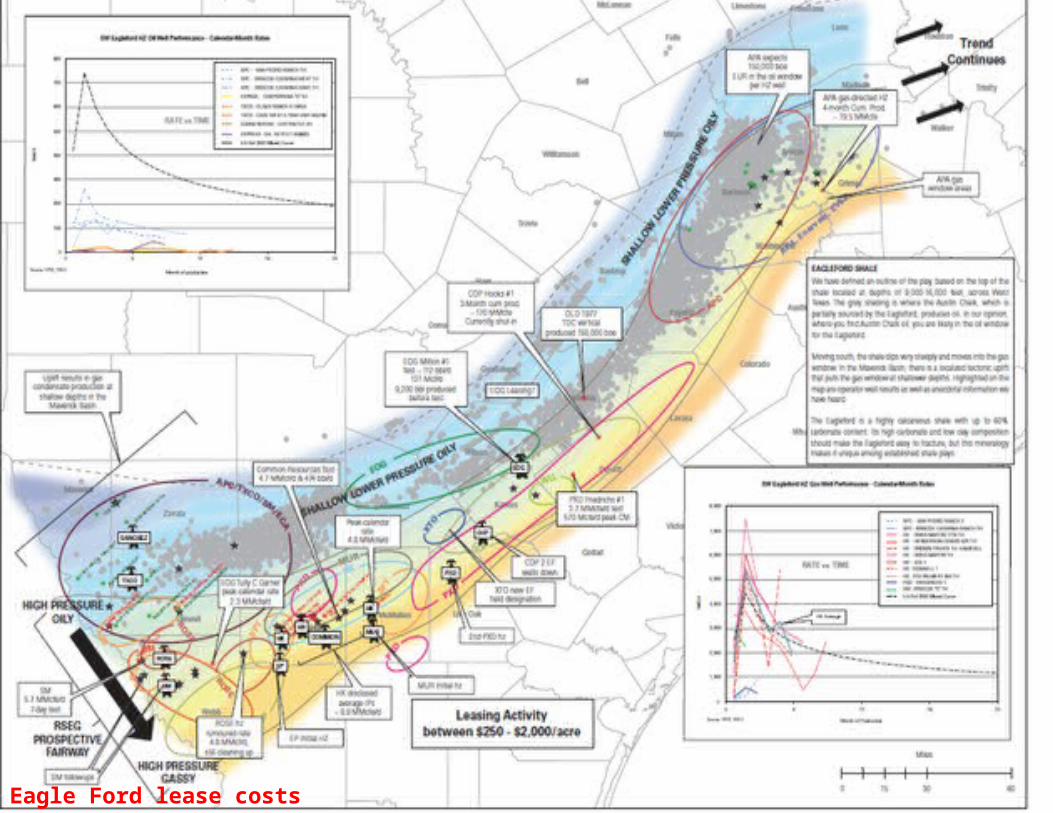
Eagle Ford lease costs

Chesapeake Eagle Ford acreage map
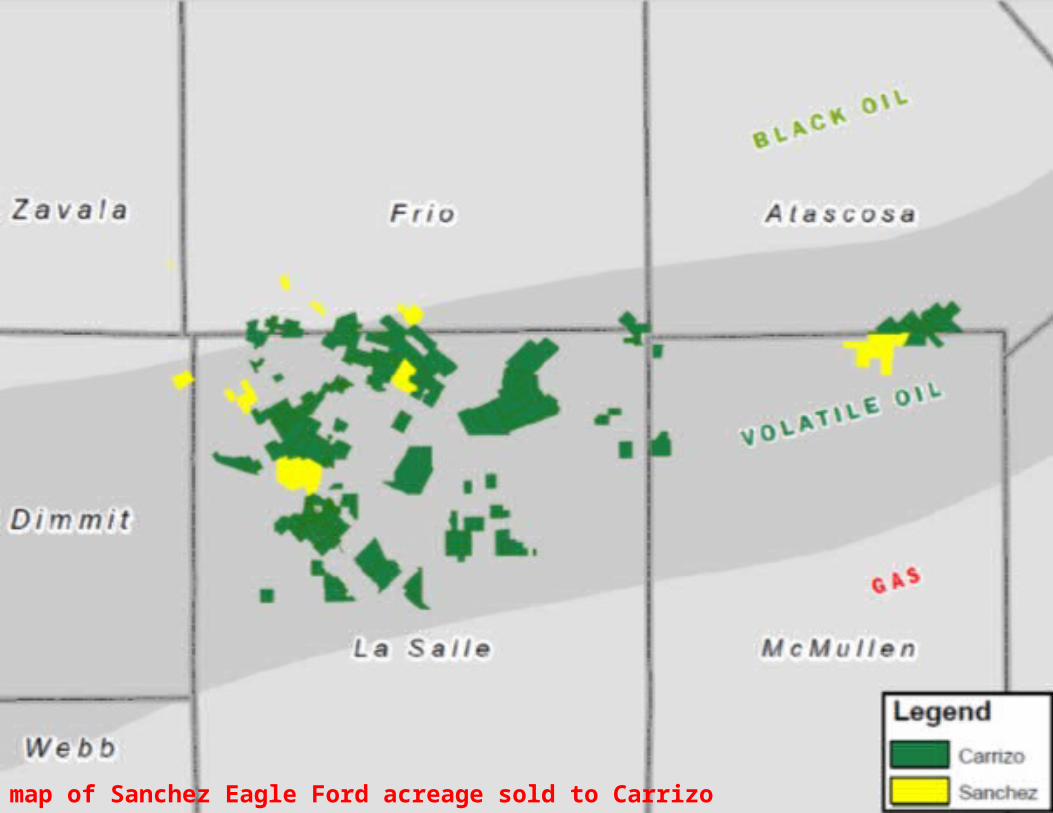
map of Sanchez Eagle Ford acreage sold to Carrizo
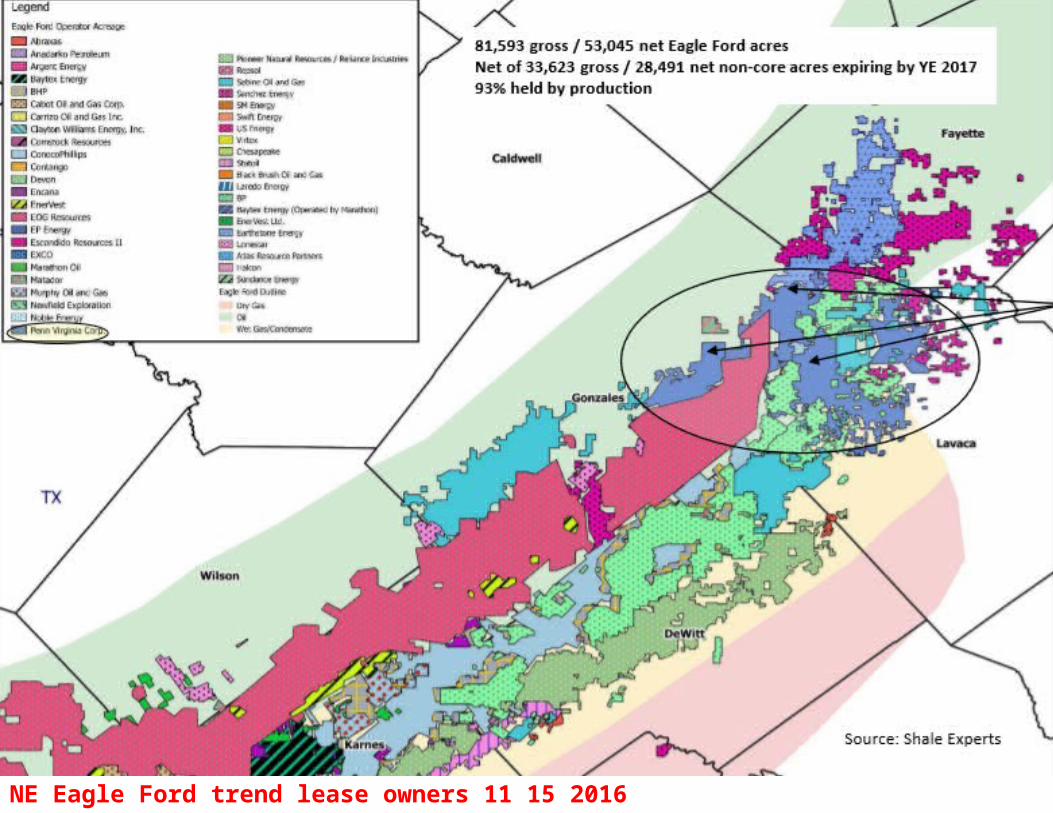
NE Eagle Ford trend lease owners 11 15 2016
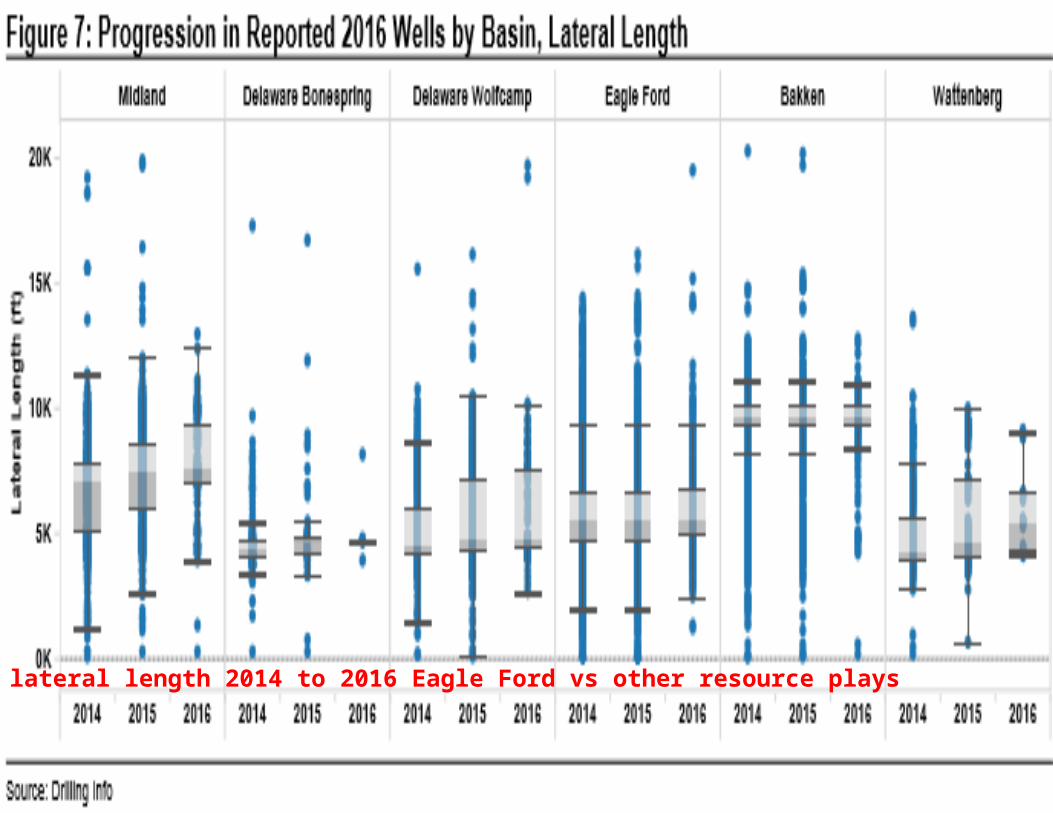
lateral length 2014 to 2016 Eagle Ford vs other resource plays
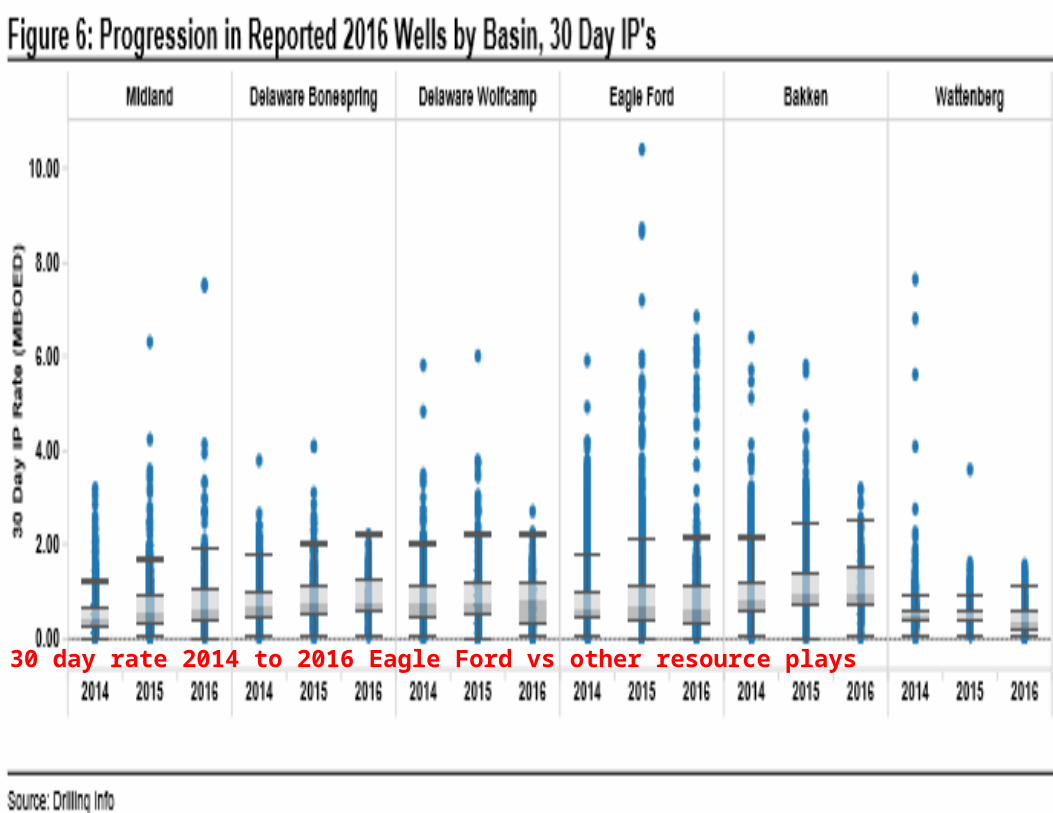
30 day rate 2014 to 2016 Eagle Ford vs other resource plays
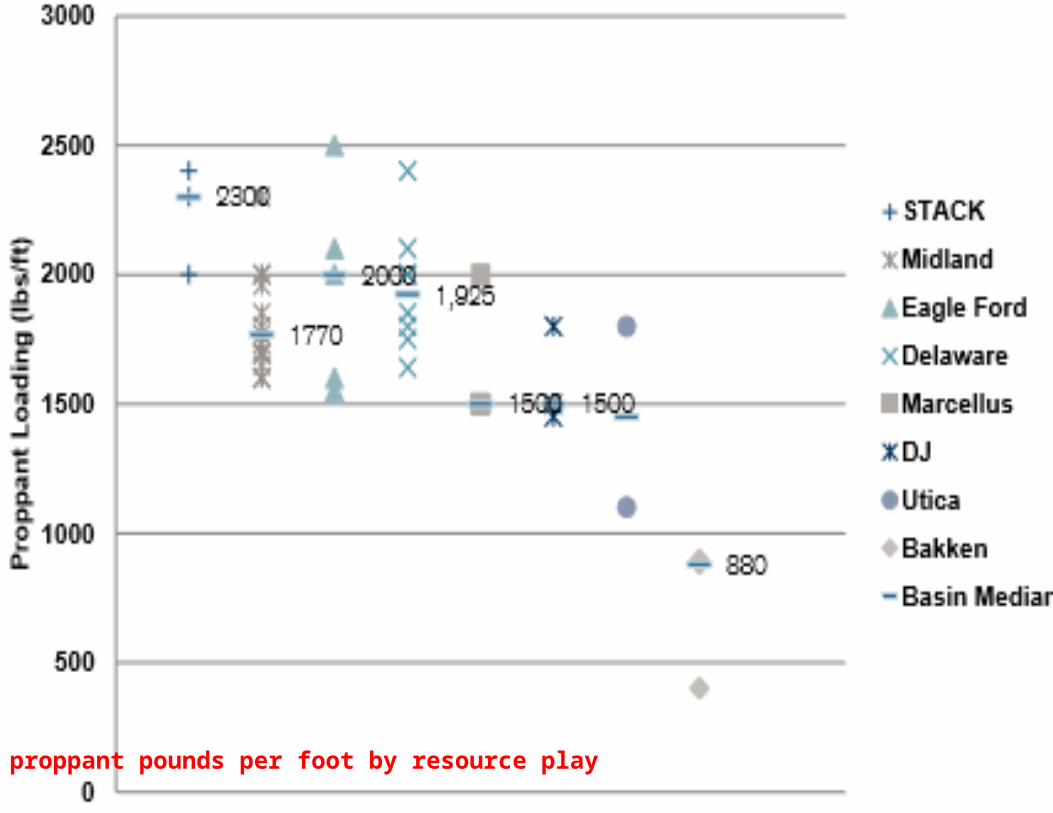
proppant pounds per foot by resource play

Wood Mackenzie average millions of pounds of proppant per well for resource plays 2012-2016
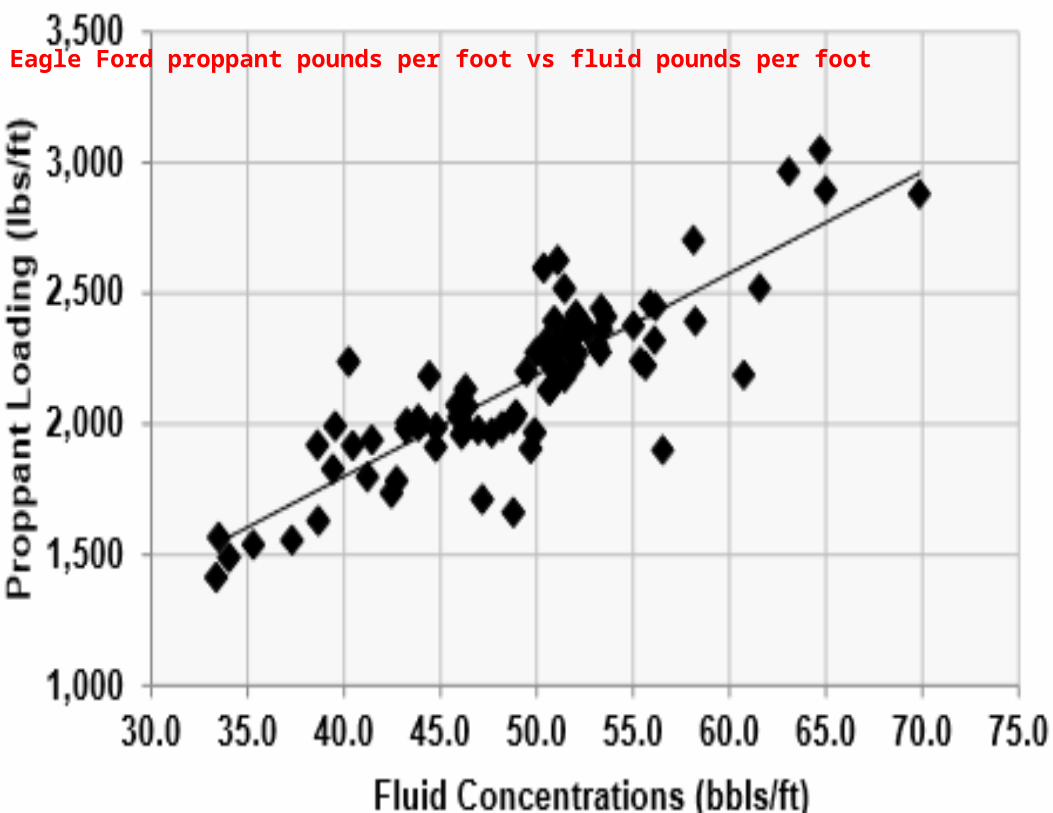
Eagle Ford proppant pounds per foot vs fluid pounds per foot
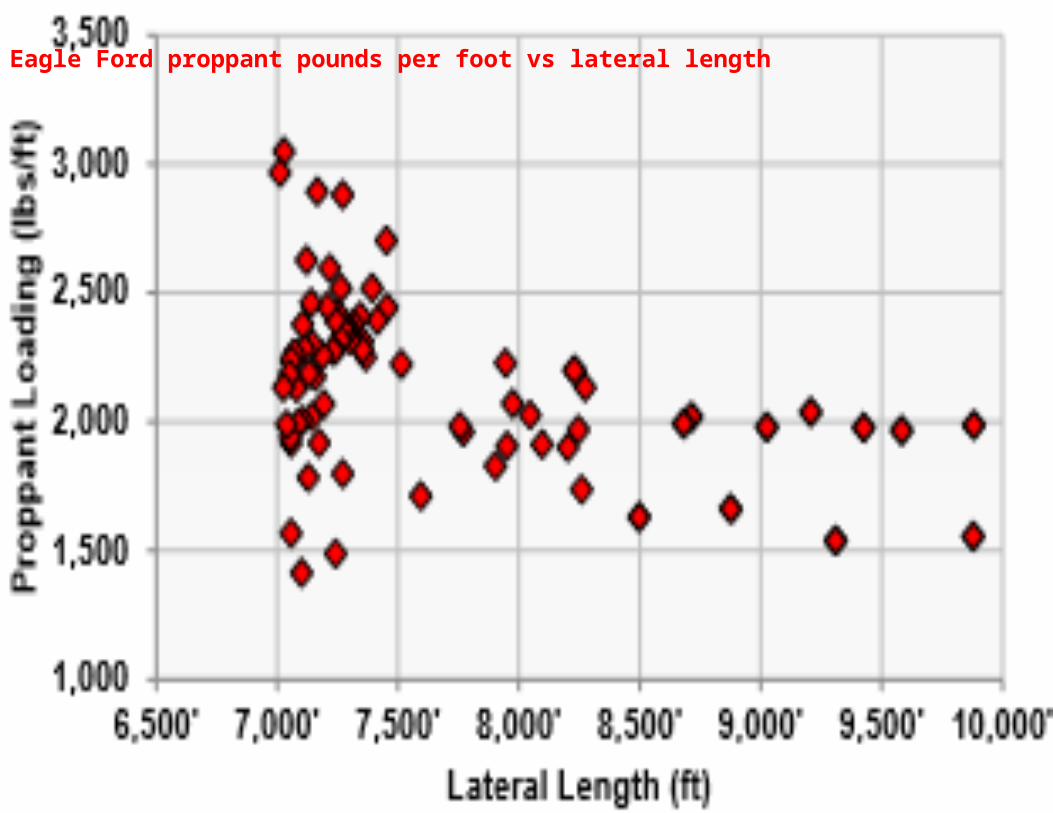
Eagle Ford proppant pounds per foot vs lateral length

Eagle Ford proppant pounds per foot vs completion date 2014 to 2016
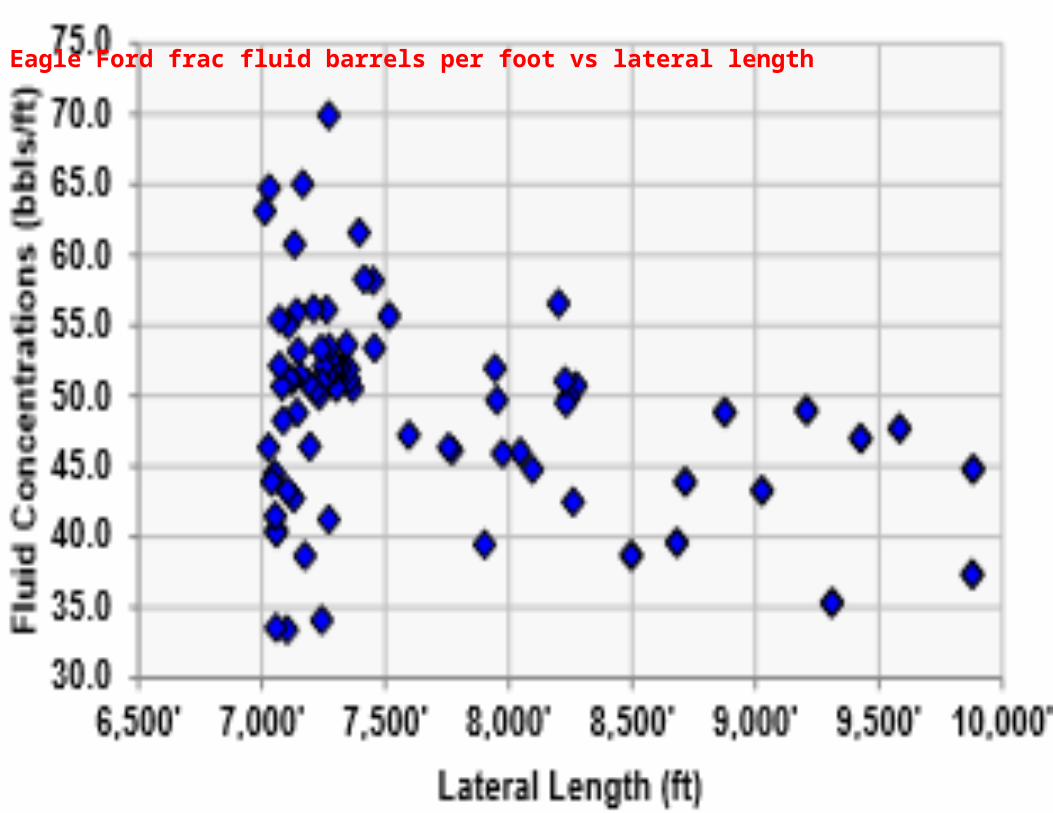
Eagle Ford frac fluid barrels per foot vs lateral length

Eagle Ford frac fluid barrels per foot vs completion date 2014 to 2016
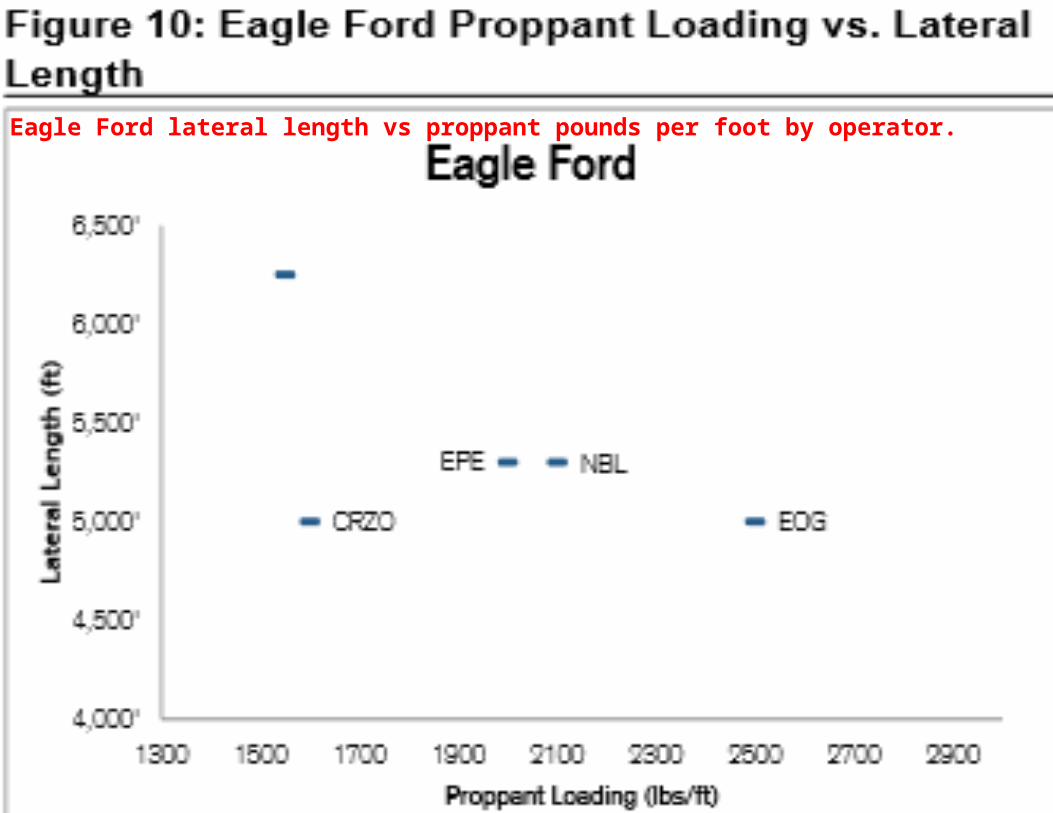
Eagle Ford lateral length vs proppant pounds per foot by operator.
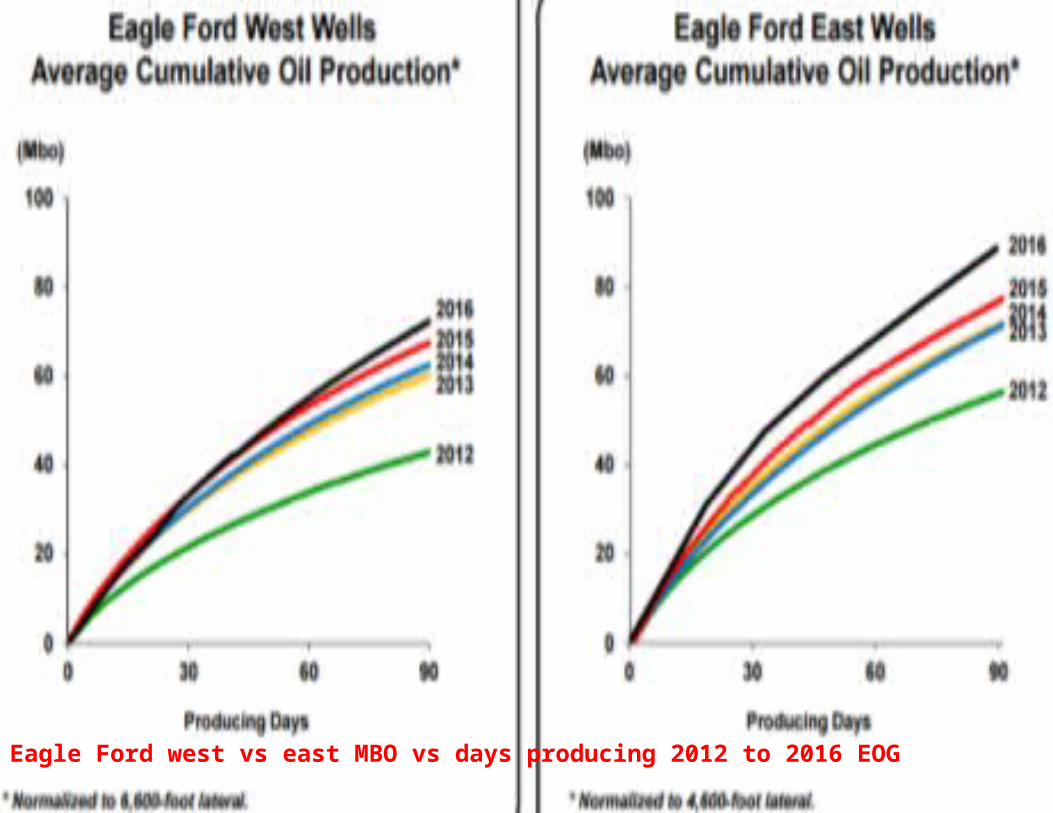
Eagle Ford west vs east MBO vs days producing 2012 to 2016 EOG

Penn Virginia slickwater Eagle Ford type curve, EUR and rate of return 11 15 2016

IPs recent Penn Virginia slickwater Eagle Ford wells 11 15 2016
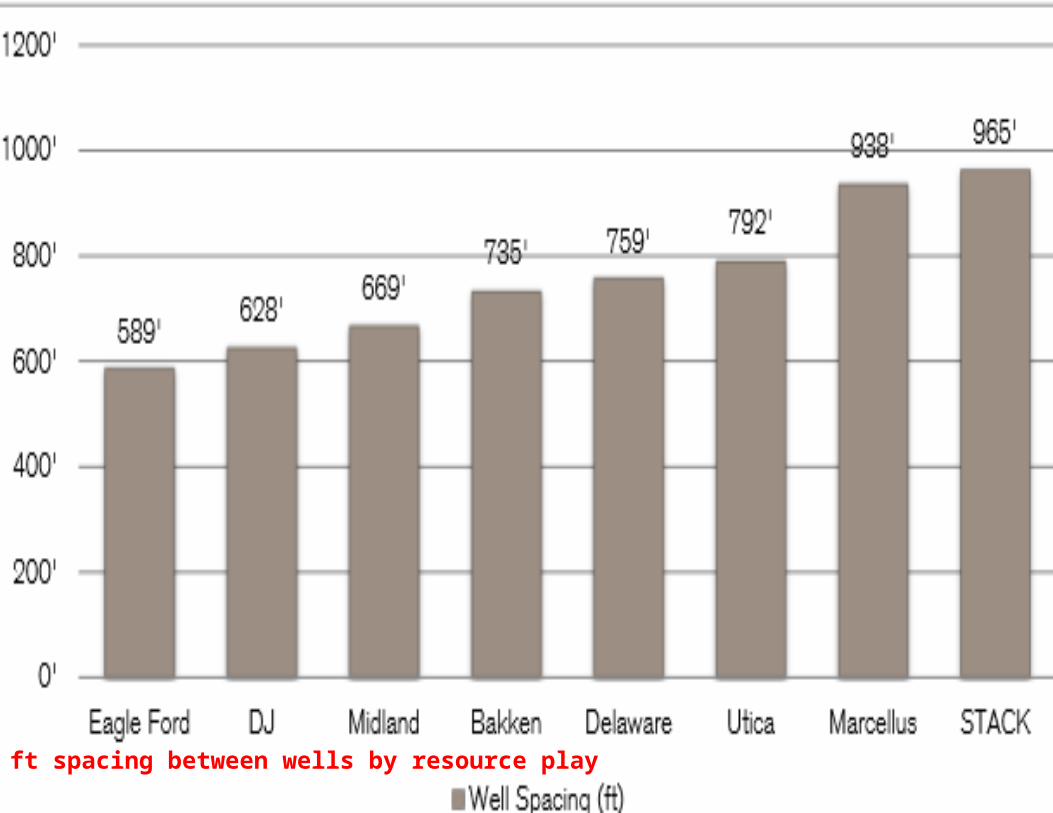
ft spacing between wells by resource play

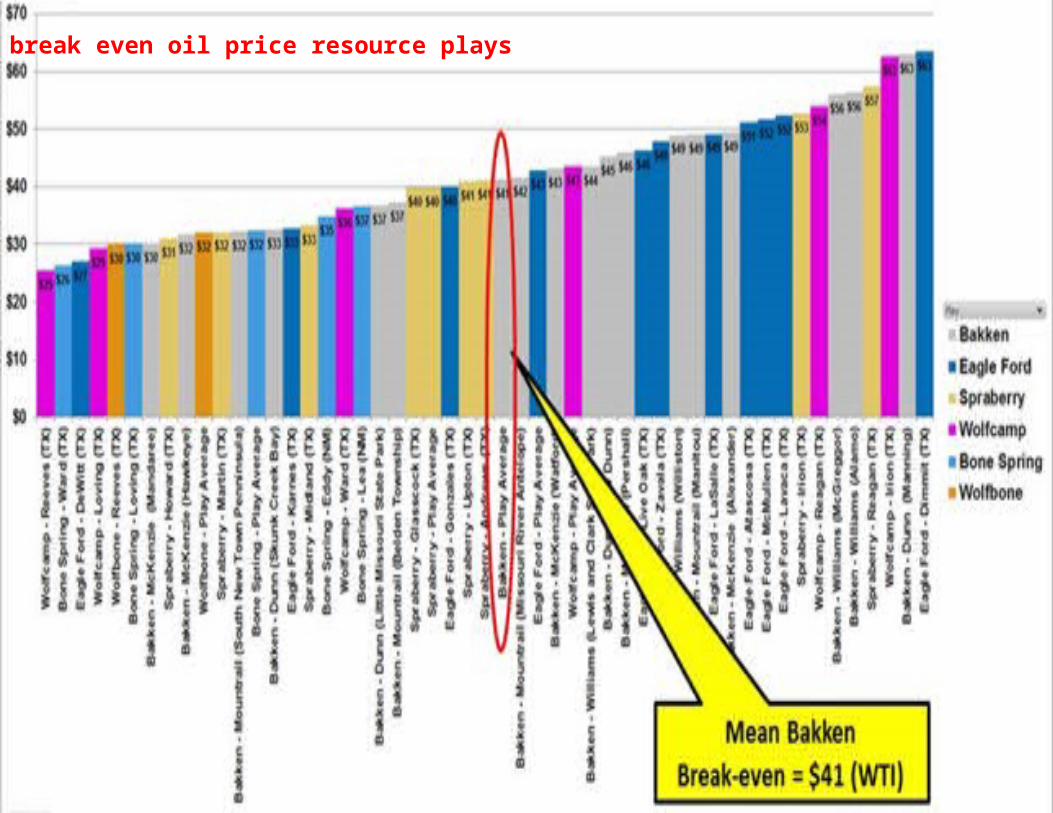
break even oil price resource plays
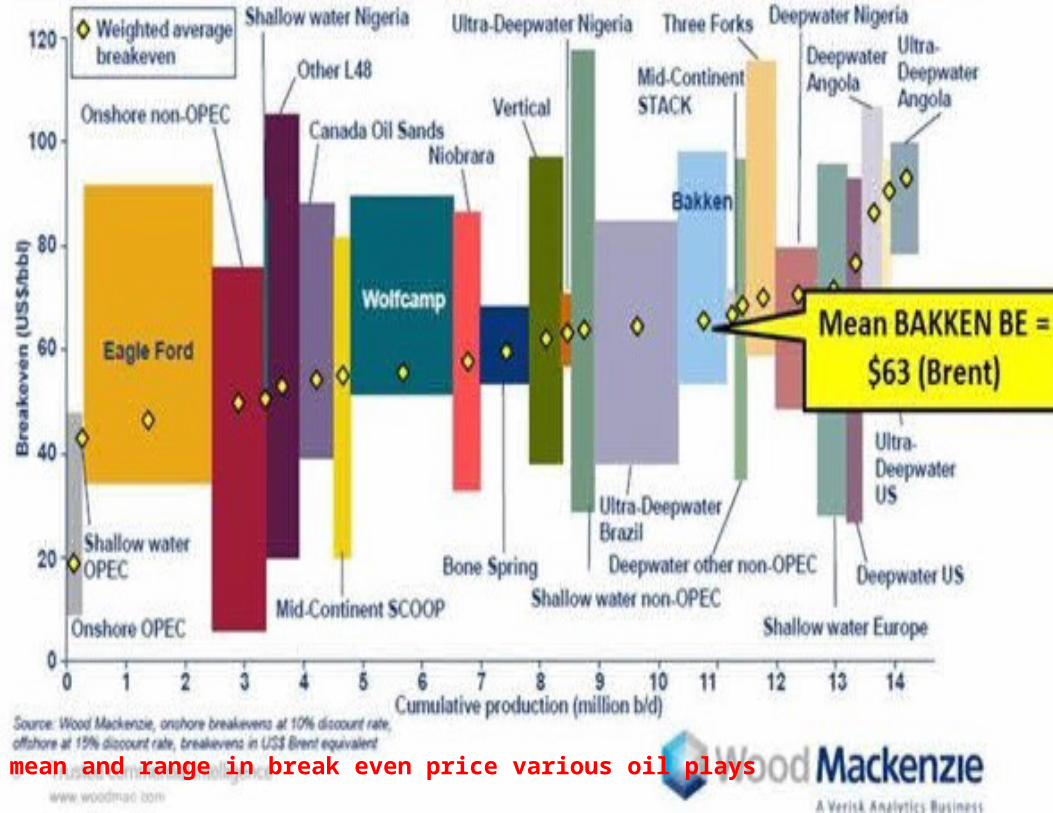
mean and range in break even price various oil plays
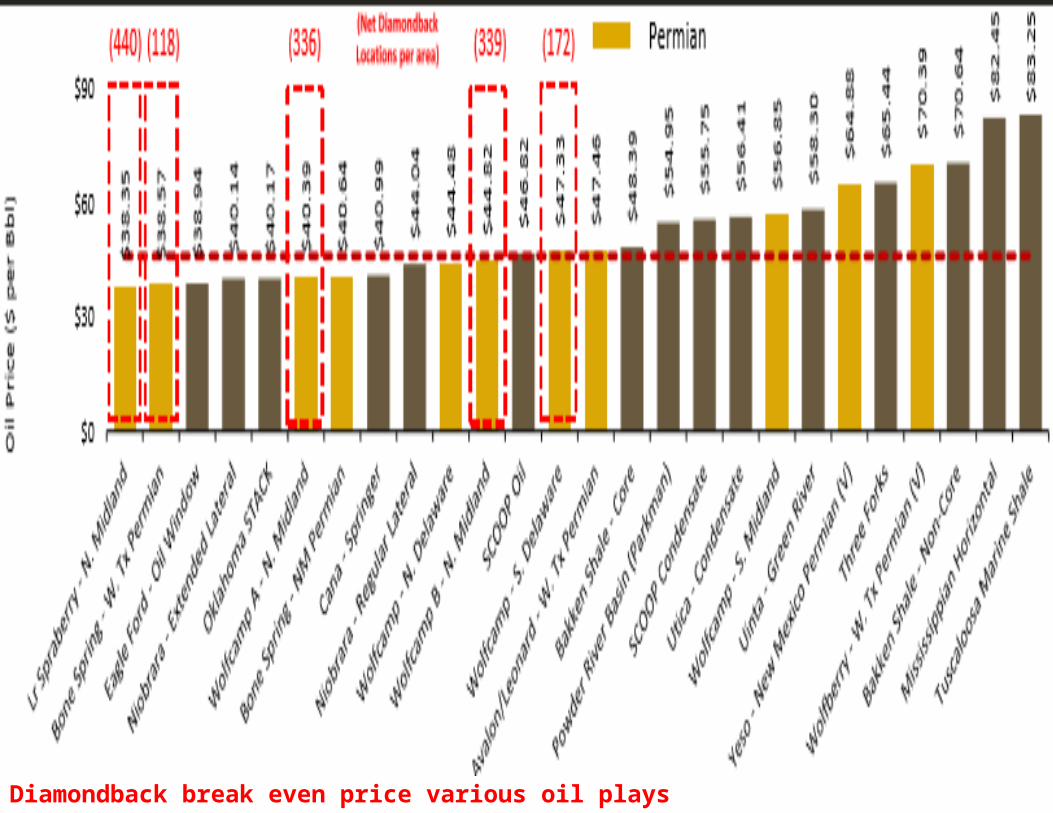
Diamondback break even price various oil plays
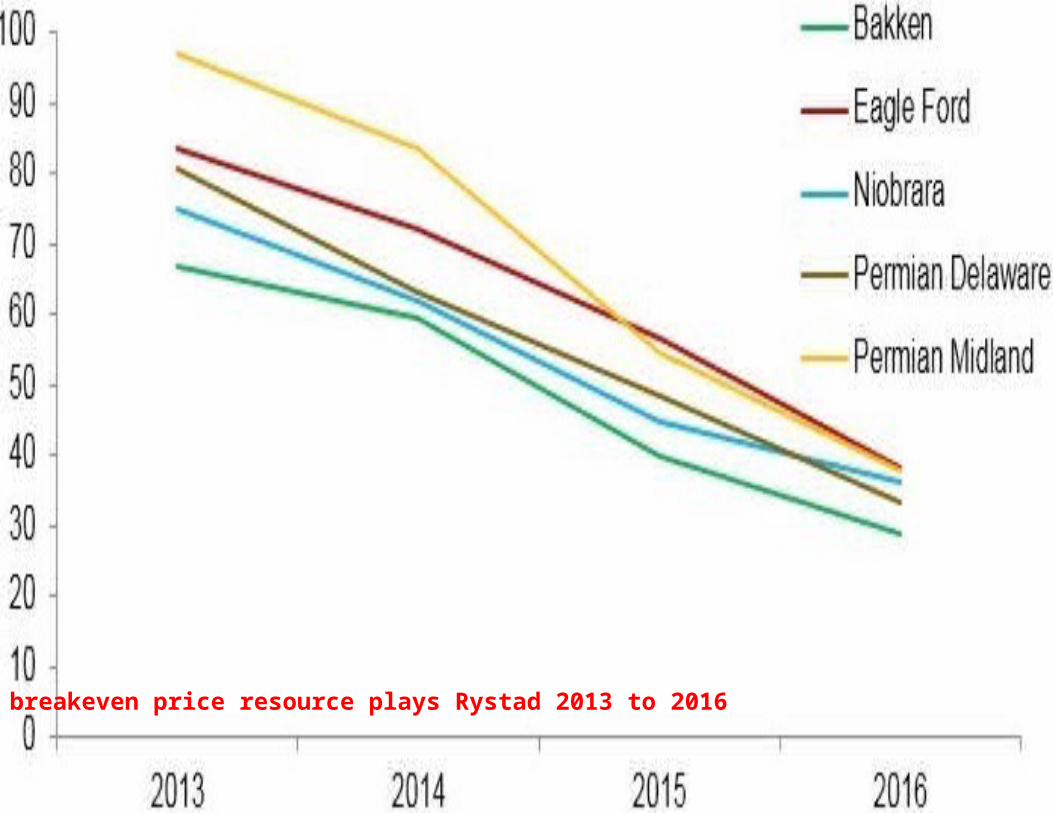
breakeven price resource plays Rystad 2013 to 2016
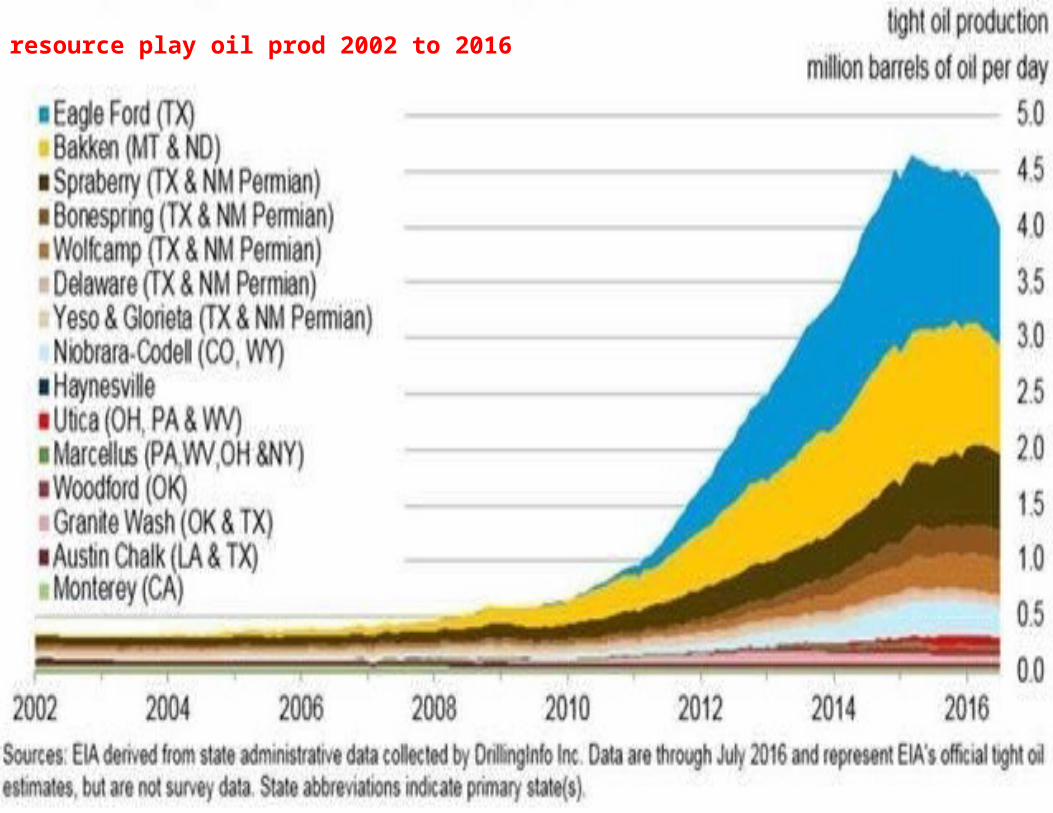
resource play oil prod 2002 to 2016
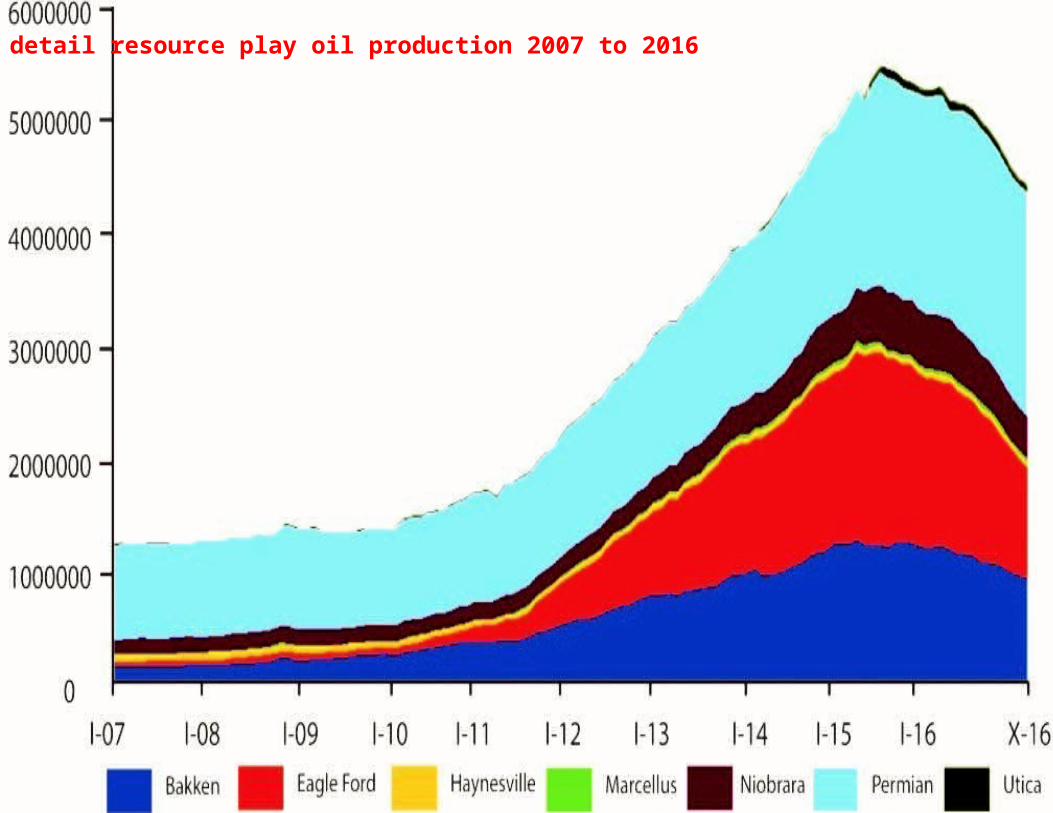
detail resource play oil production 2007 to 2016
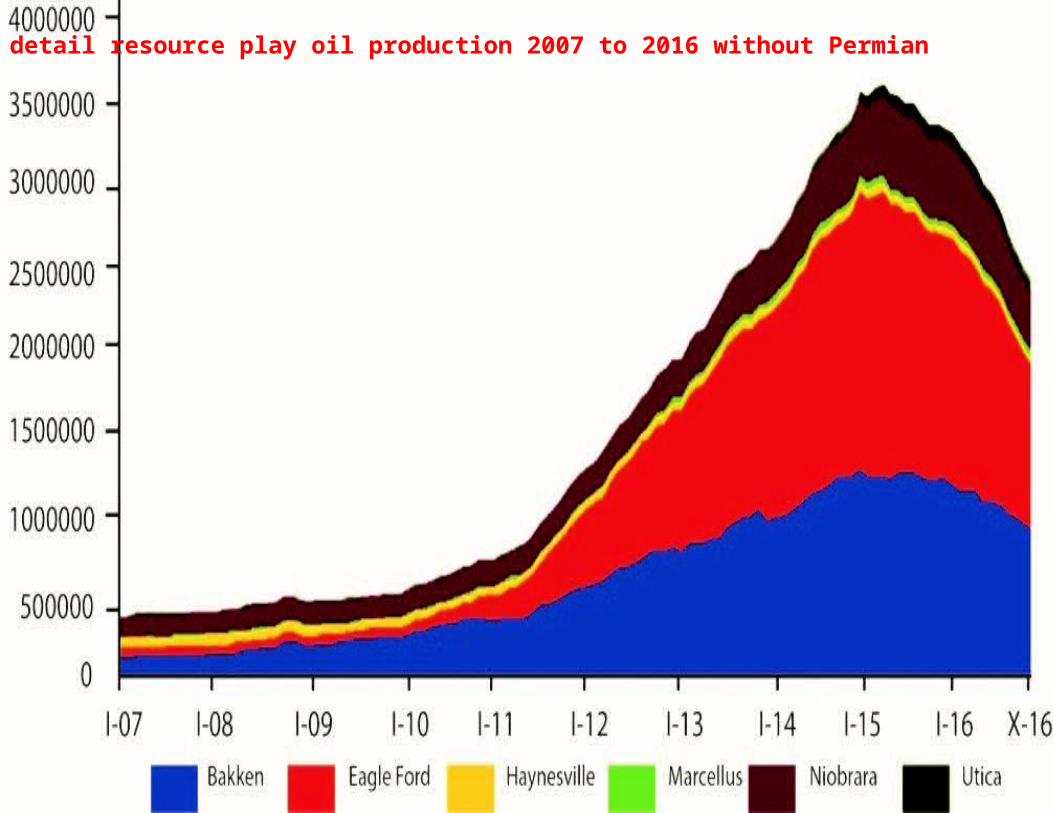
detail resource play oil production 2007 to 2016 without Permian
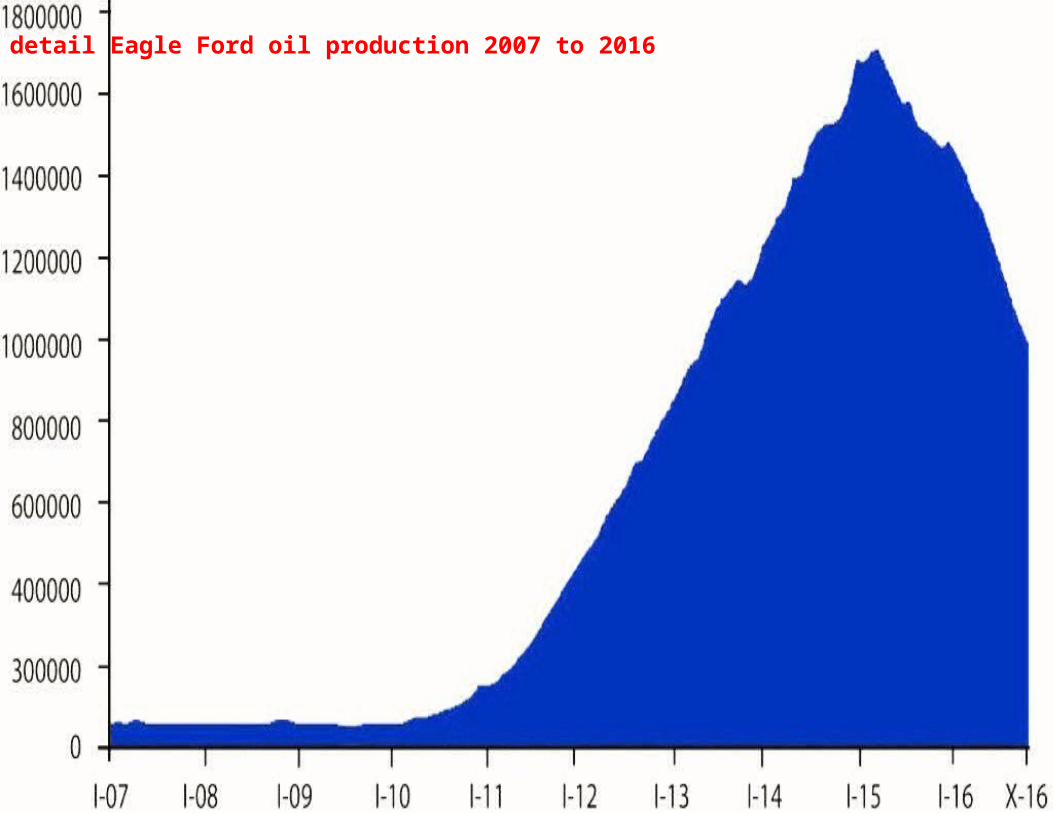
detail Eagle Ford oil production 2007 to 2016
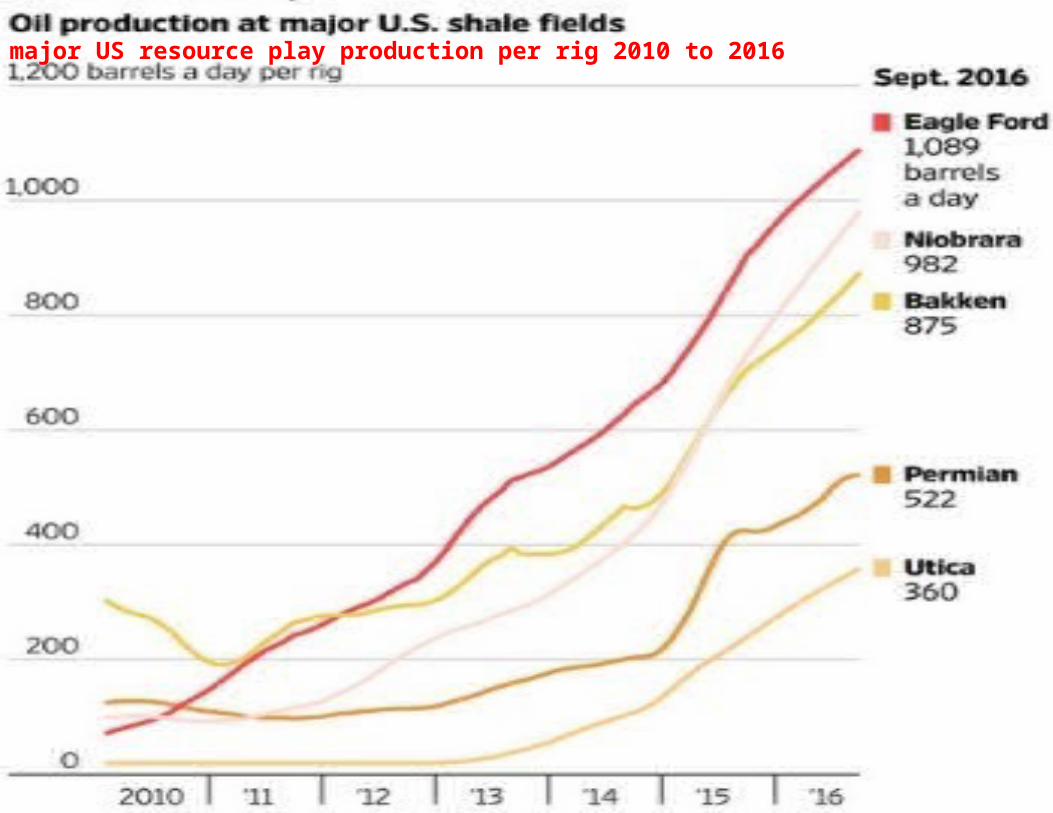
major US resource play production per rig 2010 to 2016

SPRE + IHS US oil prod forecast by resource play to end 2018

EIA drilled uncompleted wells 2013 to 2016
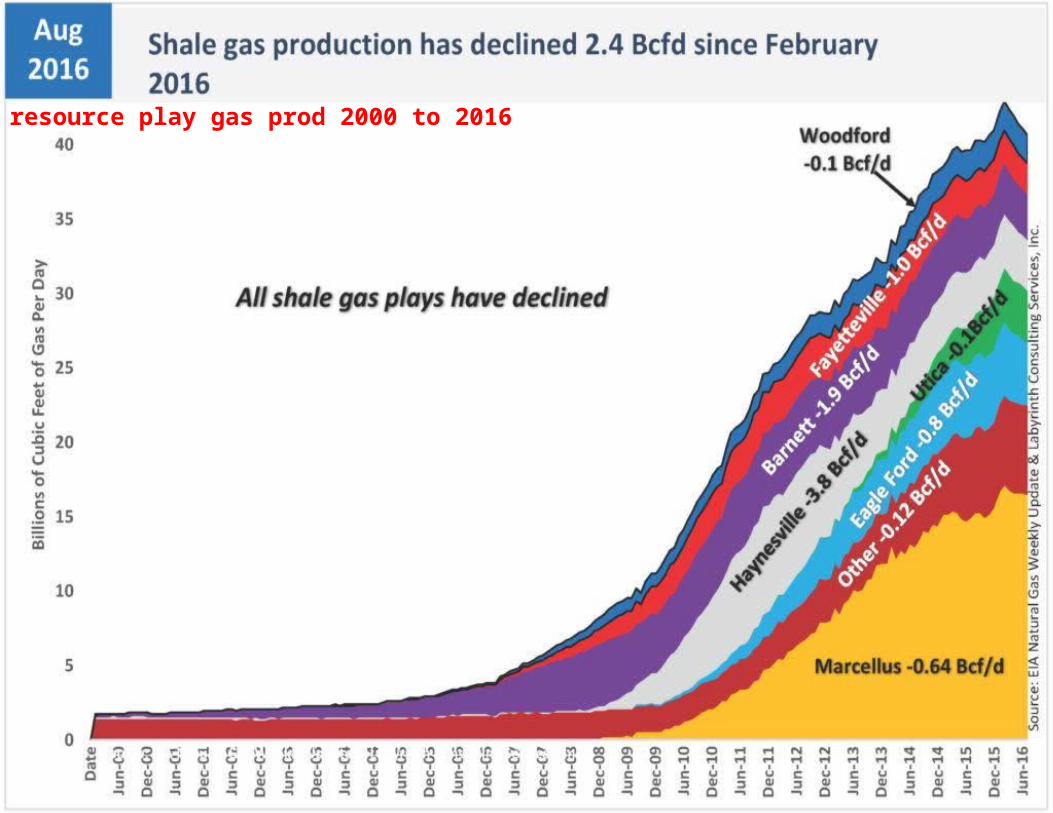
resource play gas prod 2000 to 2016
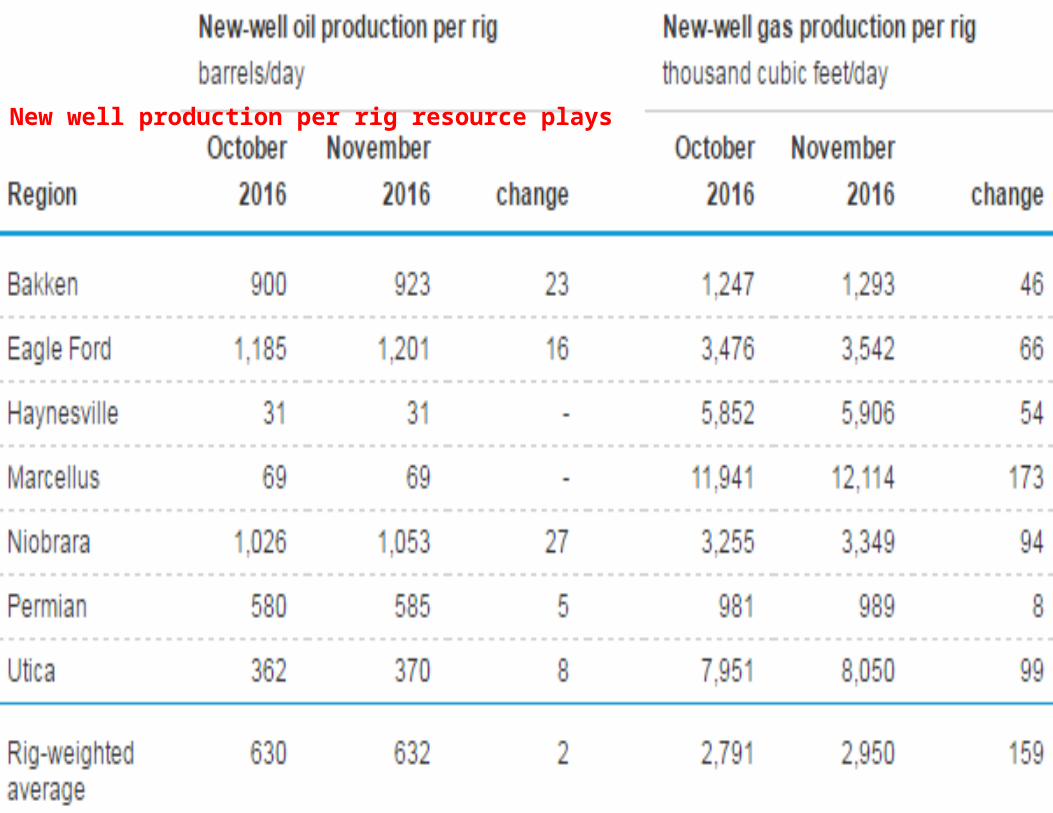
New well production per rig resource plays

2014 to 2016 rig count Permian=red Eagle Ford=green TX rigs=gold Total US rigs=blue