Successful Completion Optimization of the Eagle Ford Shale Supplement to SPE Paper 170764 Presented at the Society of Petroleum Engineers Annual Technical Conference and Exhibition Amsterdam, The Netherlands October 27-29, 2014

Welcome message from author
This document is posted to help you gain knowledge. Please leave a comment to let me know what you think about it! Share it to your friends and learn new things together.
Transcript

Successful Completion
Optimization of the
Eagle Ford Shale
Supplement to SPE Paper 170764
Presented at the Society of Petroleum Engineers
Annual Technical Conference and Exhibition
Amsterdam, The Netherlands
October 27-29, 2014

Forward-Looking Statements
Except for historical information contained herein, the statements, charts and graphs in this
presentation are forward-looking statements that are made pursuant to the Safe Harbor Provisions
of the Private Securities Litigation Reform Act of 1995. Forward-looking statements and the
business prospects of Pioneer are subject to a number of risks and uncertainties that may cause
Pioneer's actual results in future periods to differ materially from the forward-looking statements.
These risks and uncertainties include, among other things, volatility of commodity prices, product
supply and demand, competition, the ability to obtain environmental and other permits and the
timing thereof, other government regulation or action, the ability to obtain approvals from third
parties and negotiate agreements with third parties on mutually acceptable terms, completion of
planned divestitures, litigation, the costs and results of drilling and operations, availability of
equipment, services, resources and personnel required to perform the Company's drilling and
operating activities, access to and availability of transportation, processing, fractionation and
refining facilities, Pioneer's ability to replace reserves, implement its business plans or complete its
development activities as scheduled, access to and cost of capital, the financial strength of
counterparties to Pioneer's credit facility and derivative contracts and the purchasers of Pioneer's
oil, NGL and gas production, uncertainties about estimates of reserves and resource potential and
the ability to add proved reserves in the future, the assumptions underlying production forecasts,
quality of technical data, environmental and weather risks, including the possible impacts of
climate change, the risks associated with the ownership and operation of the Company’s industrial
sand mining and oilfield services businesses and acts of war or terrorism. These and other risks are
described in Pioneer's 10-K and 10-Q Reports and other filings with the Securities and Exchange
Commission. In addition, Pioneer may be subject to currently unforeseen risks that may have a
materially adverse impact on it. Pioneer undertakes no duty to publicly update these statements
except as required by law.
Please see the Appendix slides included in this presentation for other important information.
2
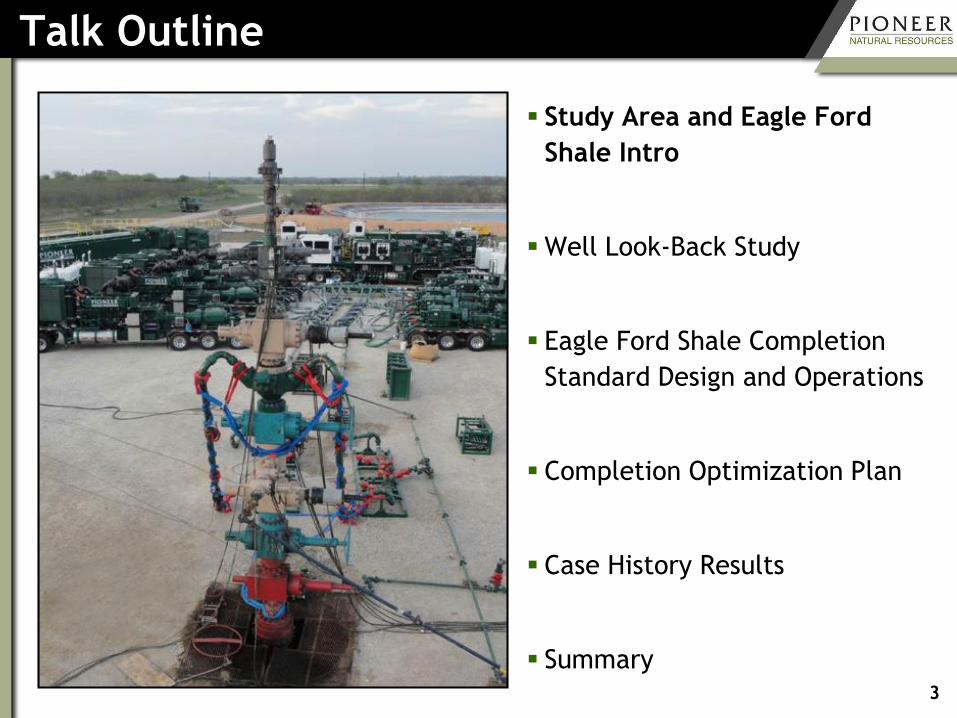
Talk Outline
Study Area and Eagle Ford
Shale Intro
Well Look-Back Study
Eagle Ford Shale Completion
Standard Design and Operations
Completion Optimization Plan
Case History Results
Summary3
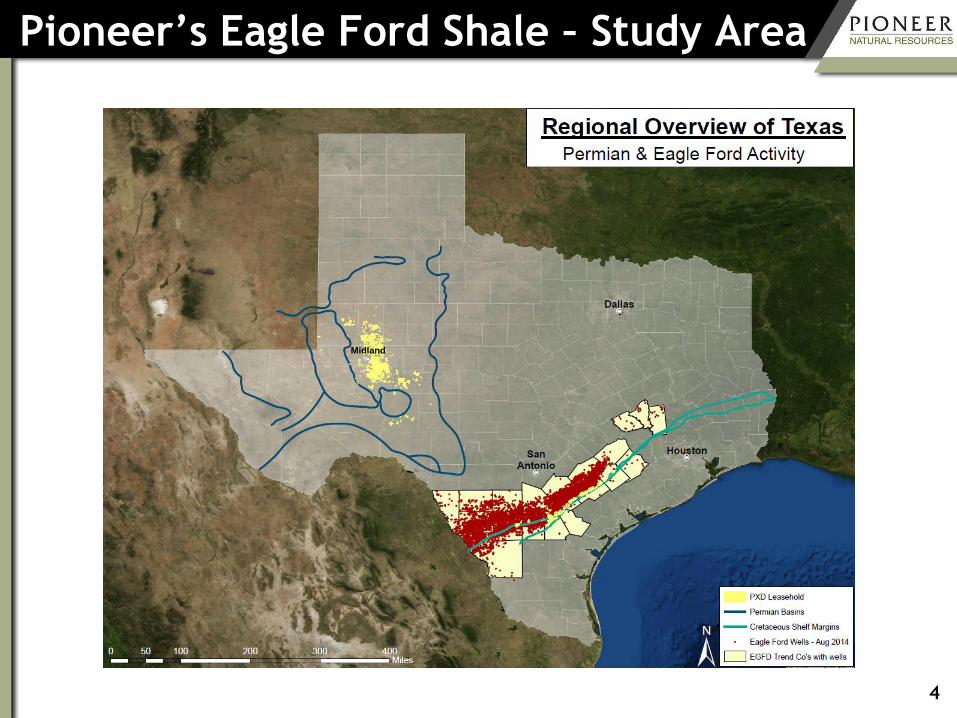
Pioneer’s Eagle Ford Shale – Study Area
Next Study Area
Permian Midland Basin
Spraberry/Wolfcamp
Study Area
Eagle Ford
4
Midland

Talk Outline
Study Area and Eagle Ford Shale
Intro
Well Look-Back Study
Eagle Ford Shale Completion
Standard Design and Operations
Completion Optimization Plan
Case History Results
Summary5
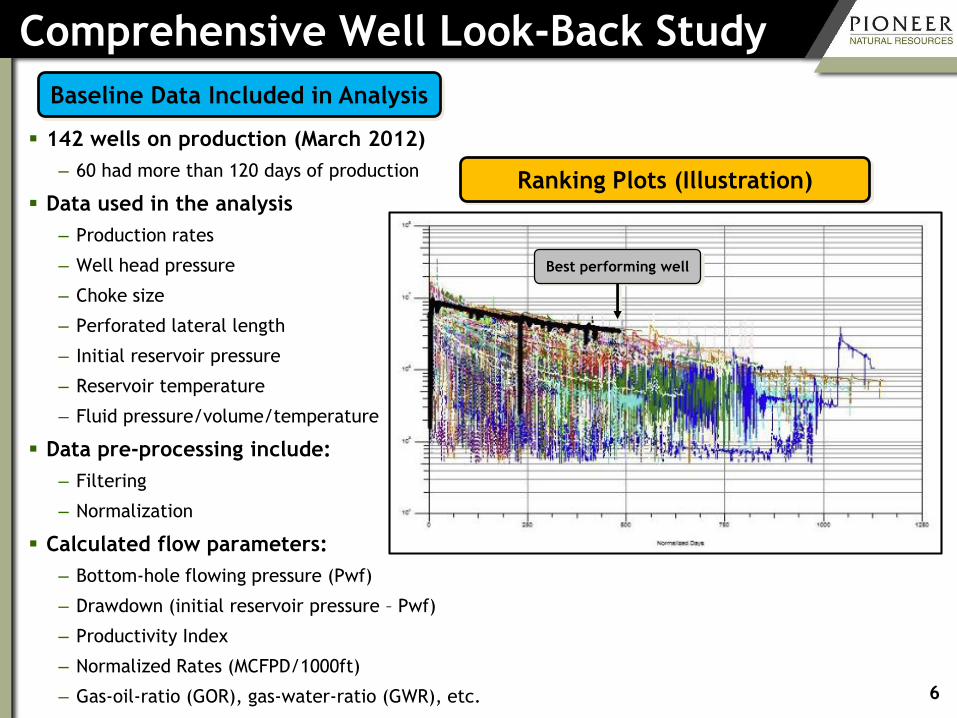
Comprehensive Well Look-Back Study
142 wells on production (March 2012)
– 60 had more than 120 days of production
Data used in the analysis
– Production rates
– Well head pressure
– Choke size
– Perforated lateral length
– Initial reservoir pressure
– Reservoir temperature
– Fluid pressure/volume/temperature
Data pre-processing include:
– Filtering
– Normalization
Calculated flow parameters:
– Bottom-hole flowing pressure (Pwf)
– Drawdown (initial reservoir pressure – Pwf)
– Productivity Index
– Normalized Rates (MCFPD/1000ft)
– Gas-oil-ratio (GOR), gas-water-ratio (GWR), etc.
Ranking Plots (Illustration)
Baseline Data Included in Analysis
Best performing well
6
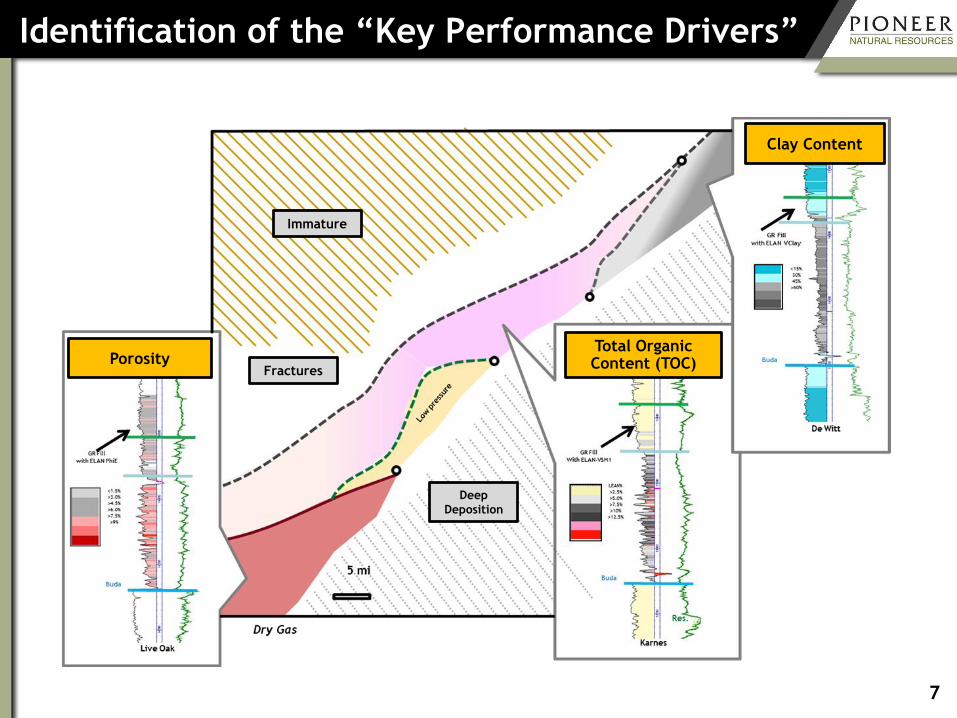
Identification of the “Key Performance Drivers”
Deep
Deposition
Immature
Total Organic Content (TOC)
FracturesPorosity
Clay Content
7

Talk Outline
Study Area and Eagle Ford Shale
Intro
Well Look-Back Study
Eagle Ford Shale Completion
Standard Design and Operations
Completion Optimization Plan
Case History Results
Summary8
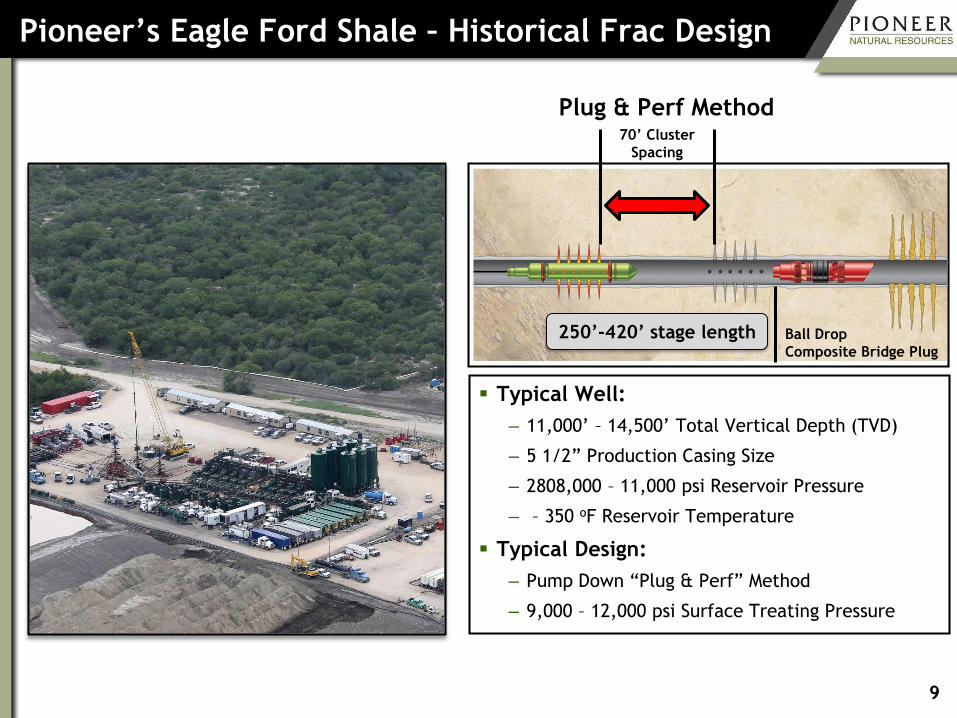
Pioneer’s Eagle Ford Shale – Historical Frac Design
Typical Well:
– 11,000’ – 14,500’ Total Vertical Depth (TVD)
– 5 1/2” Production Casing Size
– 2808,000 – 11,000 psi Reservoir Pressure
– – 350 oF Reservoir Temperature
Typical Design:
– Pump Down “Plug & Perf” Method
– 9,000 – 12,000 psi Surface Treating Pressure
420’ stage length
Plug & Perf Method70’ Cluster
Spacing
Ball Drop
Composite Bridge Plug
250’-420’ stage length
9
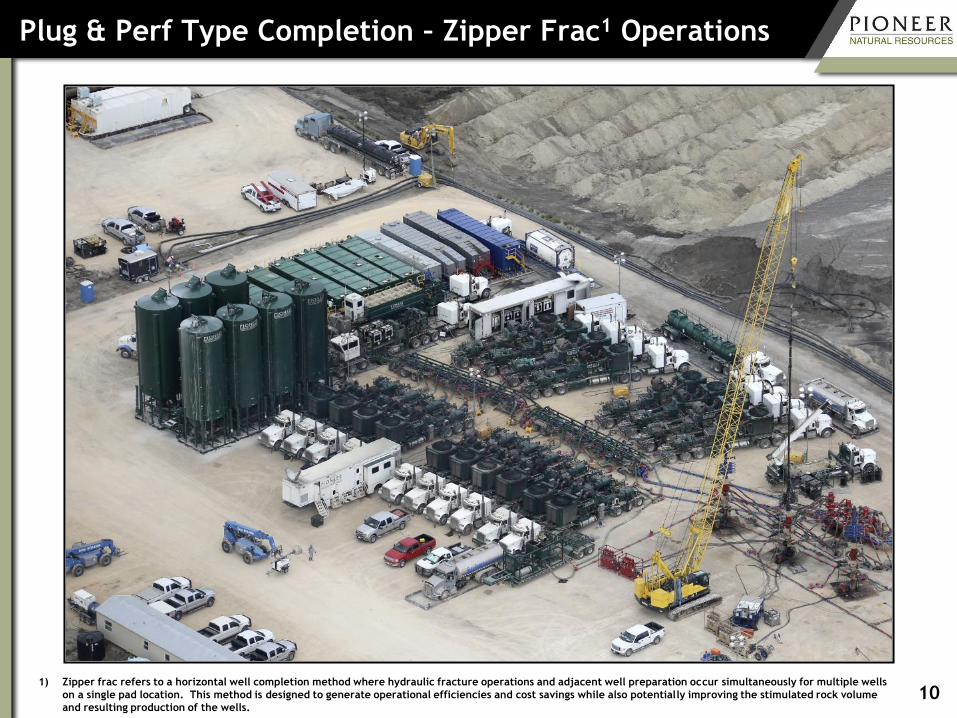
Plug & Perf Type Completion – Zipper Frac1 Operations
101) Zipper frac refers to a horizontal well completion method where hydraulic fracture operations and adjacent well preparation occur simultaneously for multiple wells
on a single pad location. This method is designed to generate operational efficiencies and cost savings while also potentially improving the stimulated rock volume
and resulting production of the wells.
Talk Outline
Study Area and Eagle Ford Shale
Intro
Well Look-Back Study
Eagle Ford Shale Completion
Standard Design and Operations
Completion Optimization Plan
Case History Results
Summary11
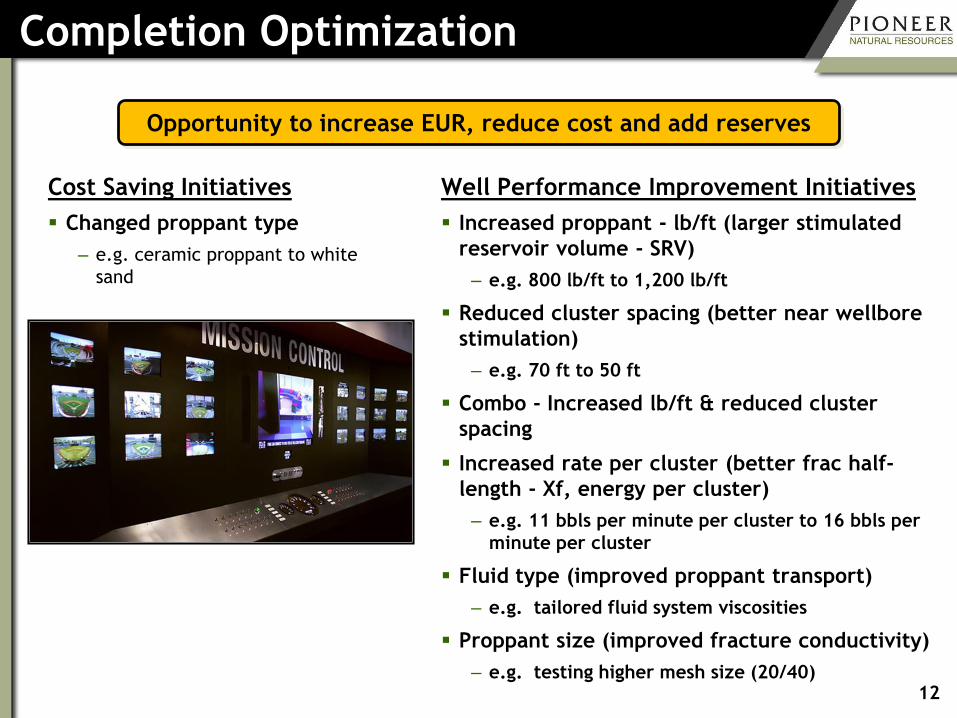
Completion Optimization
Cost Saving Initiatives
Changed proppant type
– e.g. ceramic proppant to white
sand
Well Performance Improvement Initiatives
Increased proppant - lb/ft (larger stimulated
reservoir volume - SRV)
– e.g. 800 lb/ft to 1,200 lb/ft
Reduced cluster spacing (better near wellbore
stimulation)
– e.g. 70 ft to 50 ft
Combo - Increased lb/ft & reduced cluster
spacing
Increased rate per cluster (better frac half-
length - Xf, energy per cluster)
– e.g. 11 bbls per minute per cluster to 16 bbls per
minute per cluster
Fluid type (improved proppant transport)
– e.g. tailored fluid system viscosities
Proppant size (improved fracture conductivity)
– e.g. testing higher mesh size (20/40)
Opportunity to increase EUR, reduce cost and add reserves
12
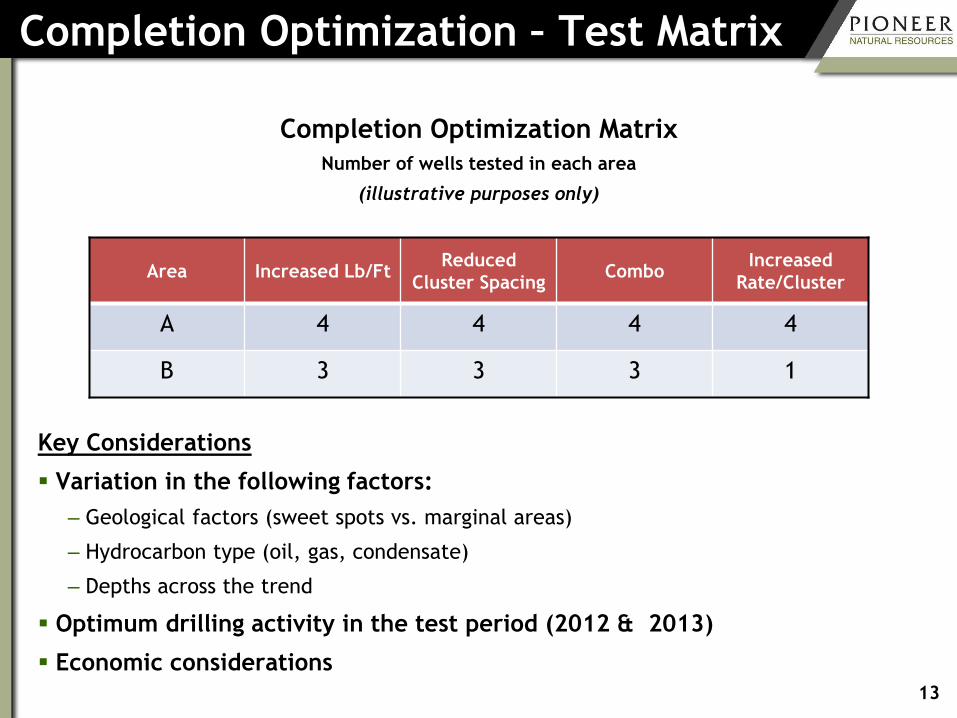
Completion Optimization – Test Matrix
Key Considerations
Variation in the following factors:
– Geological factors (sweet spots vs. marginal areas)
– Hydrocarbon type (oil, gas, condensate)
– Depths across the trend
Optimum drilling activity in the test period (2012 & 2013)
Economic considerations
Completion Optimization Matrix
Number of wells tested in each area
(illustrative purposes only)
Area Increased Lb/FtReduced
Cluster SpacingCombo
Increased
Rate/Cluster
A 4 4 4 4
B 3 3 3 1
13
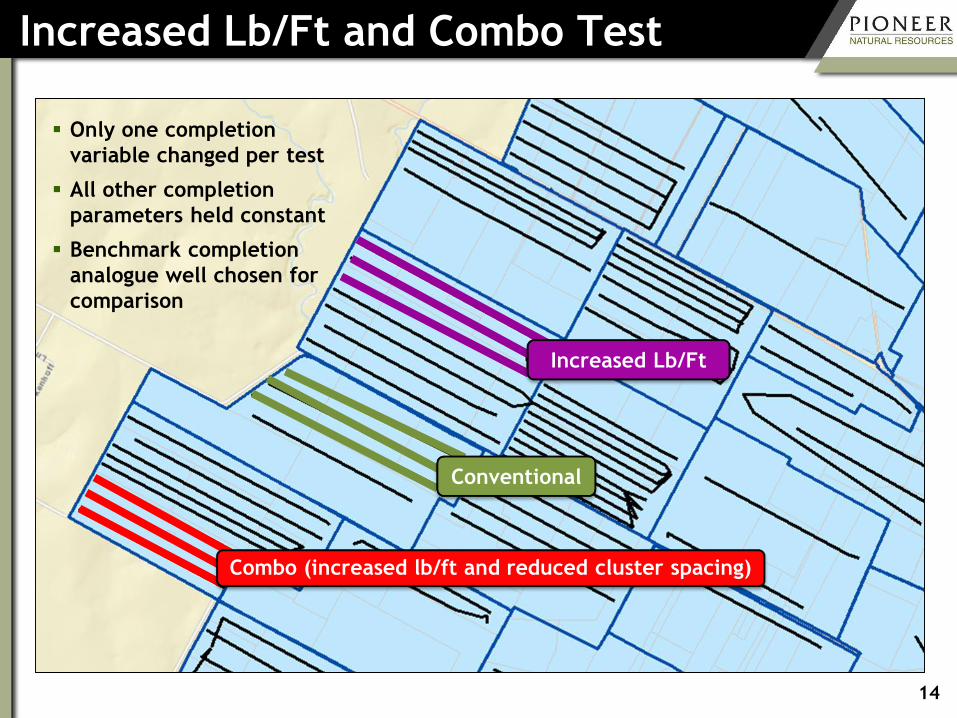
Increased Lb/Ft and Combo Test
Only one completion
variable changed per test
All other completion
parameters held constant
Benchmark completion
analogue well chosen for
comparison
Conventional
Increased Lb/Ft
Combo (increased lb/ft and reduced cluster spacing)
14
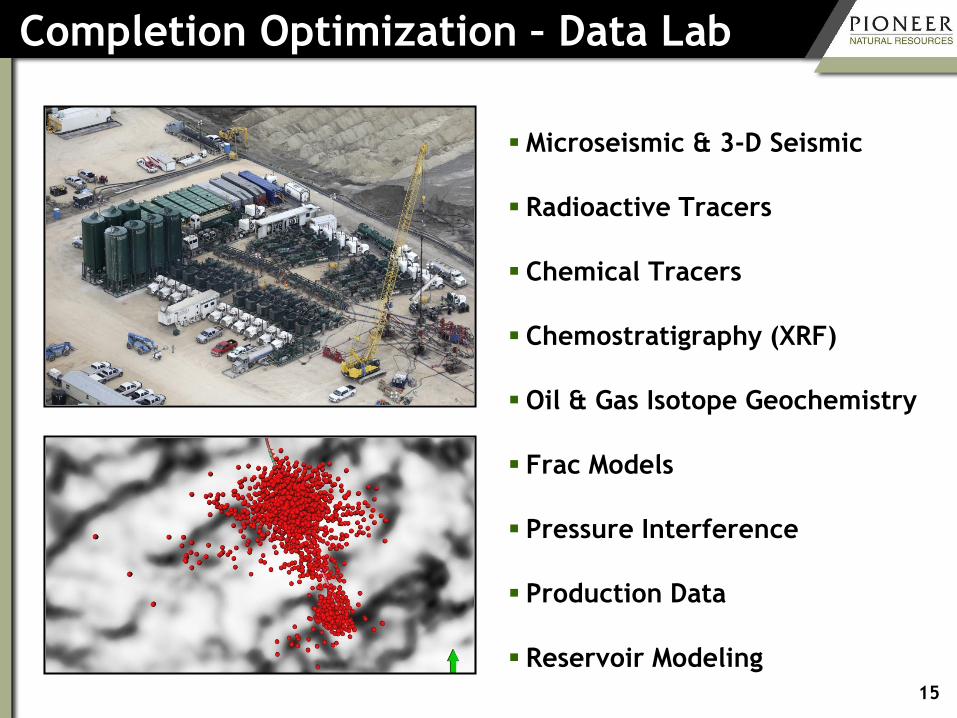
Completion Optimization – Data Lab
Microseismic & 3-D Seismic
Radioactive Tracers
Chemical Tracers
Chemostratigraphy (XRF)
Oil & Gas Isotope Geochemistry
Frac Models
Pressure Interference
Production Data
Reservoir Modeling
15

Talk Outline
Study Area and Eagle Ford Shale
Intro
Well Look-Back Study
Eagle Ford Shale Completion
Standard Design and Operations
Completion Optimization Plan
Case History Results
Summary16
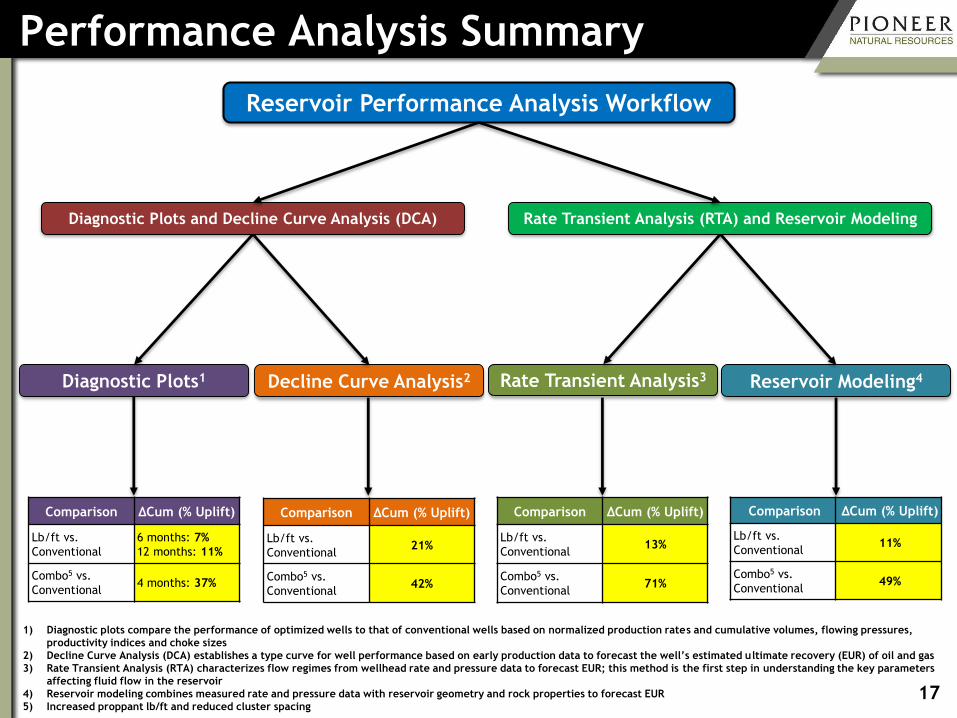
Performance Analysis Summary
Reservoir Performance Analysis Workflow
Diagnostic Plots1 Decline Curve Analysis2 Rate Transient Analysis3 Reservoir Modeling4
Comparison ΔCum (% Uplift)
Lb/ft vs.
Conventional
6 months: 7%
12 months: 11%
Combo5 vs.
Conventional4 months: 37%
Comparison ΔCum (% Uplift)
Lb/ft vs.
Conventional21%
Combo5 vs.
Conventional42%
Comparison ΔCum (% Uplift)
Lb/ft vs.
Conventional13%
Combo5 vs.
Conventional71%
Comparison ΔCum (% Uplift)
Lb/ft vs.
Conventional11%
Combo5 vs.
Conventional49%
Diagnostic Plots and Decline Curve Analysis (DCA) Rate Transient Analysis (RTA) and Reservoir Modeling
1) Diagnostic plots compare the performance of optimized wells to that of conventional wells based on normalized production rates and cumulative volumes, flowing pressures,
productivity indices and choke sizes
2) Decline Curve Analysis (DCA) establishes a type curve for well performance based on early production data to forecast the well’s estimated ultimate recovery (EUR) of oil and gas
3) Rate Transient Analysis (RTA) characterizes flow regimes from wellhead rate and pressure data to forecast EUR; this method is the first step in understanding the key parameters
affecting fluid flow in the reservoir
4) Reservoir modeling combines measured rate and pressure data with reservoir geometry and rock properties to forecast EUR
5) Increased proppant lb/ft and reduced cluster spacing17
0
10
20
30
40
50
60
70
80
0 100 200 300 400 500 600
Norm
alized C
um
ula
tive P
roducti
on (
MBO
E/1
000')
Normalized Days
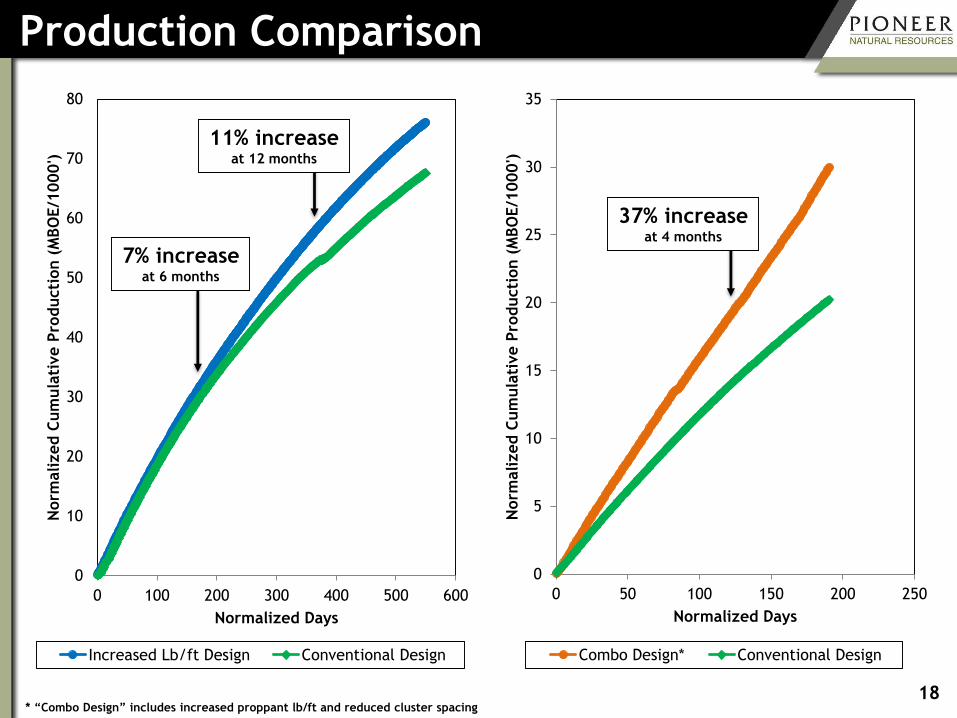
Increased Lb/ft Design Conventional Design
0
5
10
15
20
25
30
35
0 50 100 150 200 250
Norm
alized C
um
ula
tive P
roducti
on (
MBO
E/1
000')
Normalized Days
Combo Design* Conventional Design
Production Comparison
7% increaseat 6 months
11% increaseat 12 months
* “Combo Design” includes increased proppant lb/ft and reduced cluster spacing18
37% increaseat 4 months
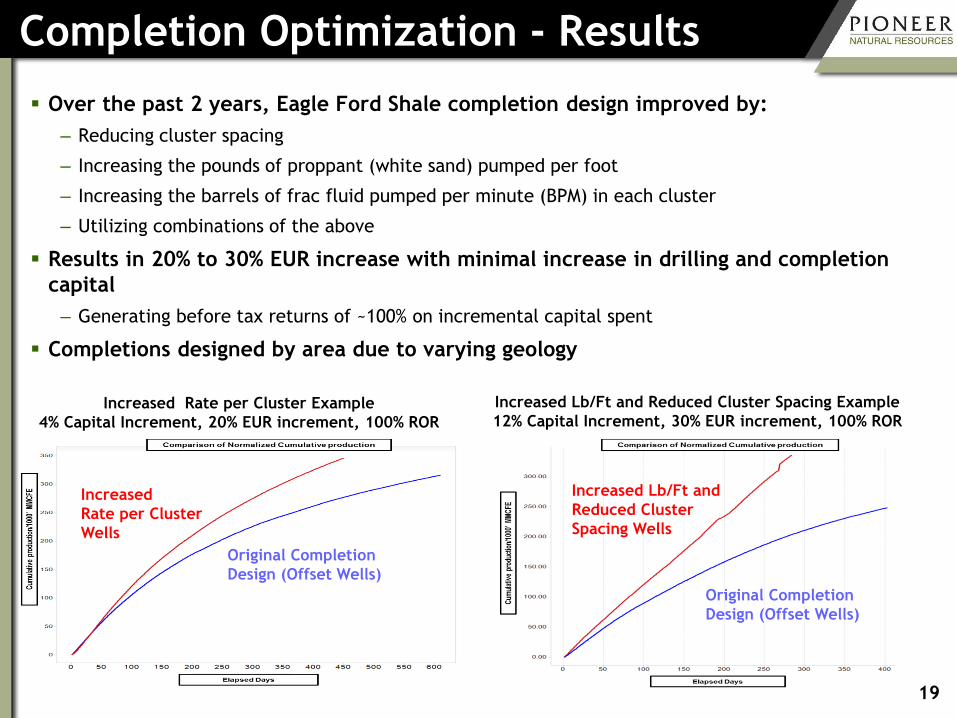
Completion Optimization - Results
Over the past 2 years, Eagle Ford Shale completion design improved by:
– Reducing cluster spacing
– Increasing the pounds of proppant (white sand) pumped per foot
– Increasing the barrels of frac fluid pumped per minute (BPM) in each cluster
– Utilizing combinations of the above
Results in 20% to 30% EUR increase with minimal increase in drilling and completion
capital
– Generating before tax returns of ~100% on incremental capital spent
Completions designed by area due to varying geology
Increased Rate per Cluster Example
4% Capital Increment, 20% EUR increment, 100% ROR
Increased Lb/Ft and Reduced Cluster Spacing Example
12% Capital Increment, 30% EUR increment, 100% ROR
Increased
Rate per Cluster
Wells
Original Completion
Design (Offset Wells)
Increased Lb/Ft and
Reduced Cluster
Spacing Wells
Original Completion
Design (Offset Wells)
19
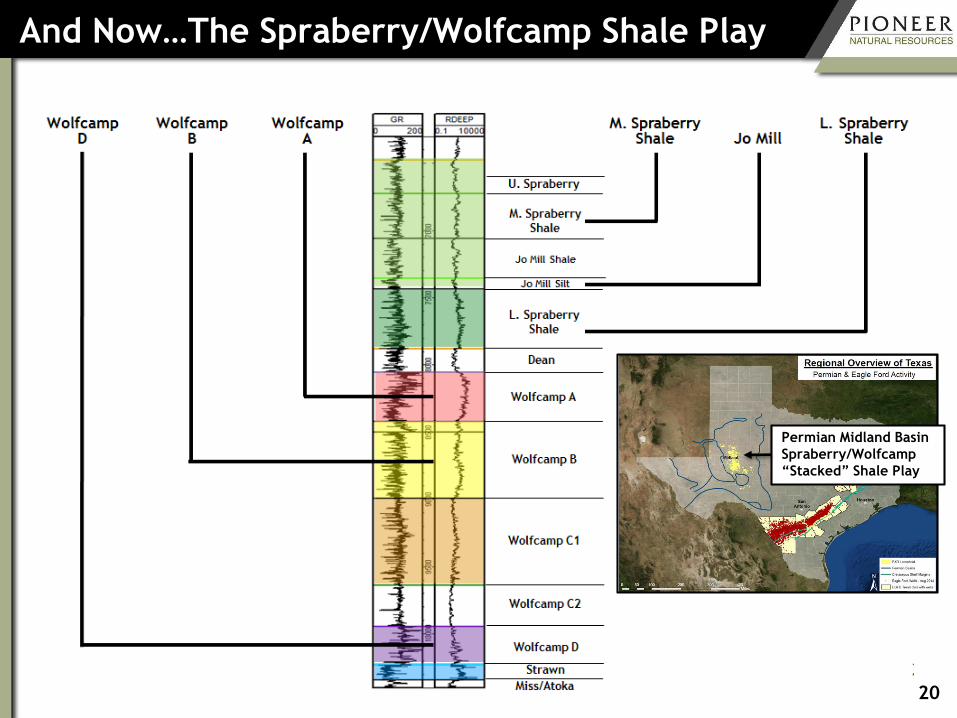
And Now…The Spraberry/Wolfcamp Shale Play
Permian Midland Basin
Spraberry/Wolfcamp
“Stacked” Shale Play
20

Talk Outline
Study Area and Eagle Ford Shale
Intro
Well Look-Back Study
Eagle Ford Shale Completion
Standard Design and Operations
Completion Optimization Plan
Case History Results
Summary21
Summary
Maintaining the base completion design was critical to properly
evaluate and understand reservoir changes across the trend in the
Eagle Ford Shale play
Increased rate per cluster initiative became part of our standard
completions; expect a 20% - 30% increase in EUR in the Eagle Ford
Shale (Jaripatke et al. 2013)
Increased lb/ft and combo designs resulted in EUR increases ranging
from 10% - 40% depending on the area of the trend and are a part of
the current Eagle Ford Shale completion design
One recipe does not fit all!
This methodology is now being implemented in the Permian Midland
Basin Spraberry/Wolfcamp “stacked” shale play22

Reference Material
To access SPE Paper 170764, please
follow the link to OnePetro.org:
SPE 170764 on OnePetro.org
23

24
Certain Reserve Information
Cautionary Note to U.S. Investors --The SEC prohibits oil and gas companies, in their
filings with the SEC, from disclosing estimates of oil or gas resources other than
“reserves,” as that term is defined by the SEC. In this news release, Pioneer includes
estimates of quantities of oil and gas using certain terms, such as “resource potential,”
“net recoverable resource potential,” “resource base,” “estimated ultimate recovery,”
“EUR,” “oil-in-place” or other descriptions of volumes of reserves, which terms include
quantities of oil and gas that may not meet the SEC’s definitions of proved, probable
and possible reserves, and which the SEC's guidelines strictly prohibit Pioneer from
including in filings with the SEC. These estimates are by their nature more speculative
than estimates of proved reserves and accordingly are subject to substantially greater
risk of being recovered by Pioneer. U.S. investors are urged to consider closely the
disclosures in the Company’s periodic filings with the SEC. Such filings are available
from the Company at 5205 N. O'Connor Blvd., Suite 200, Irving, Texas 75039, Attention:
Investor Relations, and the Company’s website at www.pxd.com. These filings also can
be obtained from the SEC by calling 1-800-SEC-0330.
Related Documents