© 2018 by MIP
Advisor
TPr. Hj Ihsan Zainal Mokhtar
Editor-in-Chief
Professor Dato’ Dr. Mansor Ibrahim
International Islamic University Malaysia (IIUM)
Local Editorial Board Members
Professor Dato’ Dr. Alias Abdullah - International Islamic University Malaysia (IIUM)
Professor Dr. Ho Chin Siong - Universiti Teknologi Malaysia (UTM)
Professor Dr. Jamilah Mohamad - Universiti Malaya (UM)
Professor Dr. Ruslan Rainis - Universiti Sains Malaysia (USM)
Professor Dr. Ahmad Nazri Muhamad Ludin - Universiti Teknologi Malaysia (UTM)
Professor Dr. Dasimah Omar - Universiti Teknologi Mara (UITM)
Professor Dr. Suhana Shamsuddin – Malaysia Institute of Planner (MIP)
Assoc. Prof. Dr. Jamalunlaili Abdullah - Universiti Teknologi Mara (UITM)
Assoc. Prof. Dr. M. Zainora Asmawi - International Islamic University Malaysia (IIUM)
Assoc. Prof. Dr. Nurwati Badarulzaman - Universiti Sains Malaysia (USM)
Assoc. Prof. Dr. Mariana Mohamed Osman - International Islamic University Malaysia (IIUM)
Assoc. Prof. Dr. Syahriah Bachok - International Islamic University Malaysia (IIUM)
Datin Paduka Dr. Halimaton Saadiah Hashim - Malaysia Institute of Planner (MIP)
Assoc. Prof. Dr. Oliver Ling Hoon Leh - Universiti Teknologi Mara (UiTM)
Dr. Chua Rhan See - Jabatan Perancang Bandar dan Desa (JPBD)
Khairiah Talha - Malaysia Institute of Planner (MIP)
Ishak Ariffin - Malaysia Institute of Planner (MIP)
Assoc. Prof. Dr. Azizan Marzuki - Universiti Sains Malaysia (USM)
International Editorial Board
Professor Emeritus Dr. Richard E. Klosterman - University of Akron / Whatif? Inc., USA
Professor Dr. Stephen Hamnett - University of South Australia, Adelaide, Australia
Professor Dr. Kiyoshi Kobayashi - University of Kyoto, Japan
Assoc. Prof. Dr. Belinda Yuen - University of Singapore, Singapore
Dr. Davide Geneletti - University of Trento, Italy
Dr. Boy Kombaitan - Institut Teknologi Bandung, Indonesia
PLANNING MALAYSIA Journal of the Malaysian Institute of Planners
© 2018 by MIP ii
Editorial & Business Correspondence
PLANNING MALAYSIA
Journal of the Malaysian Institute of Planners
B-01-02, Jalan SS7/13B, Aman Seri, Kelana Jaya
47301, Petaling Jaya, Selangor Darul Ehsan, MALAYSIA
Tel: +603 78770637 Fax: +603 78779636 Email: [email protected]
www.planningmalaysia.org
Copyright © MIP, 2018
All rights reserved.
No part of this publication may be reproduced, stored in a retrieval system, or transmitted in any
form or by any means, electronic, mechanical, photocopying, or otherwise without the prior
permission of the publisher.
The views expressed in this publication are those of the author(s) and do not necessarily represent
the views of MIP.
This journal is a refereed journal.
All articles were reviewed by two or three unanimous referees identified by the Institute (MIP).
Published By
Malaysian Institute of Planners
ISSN Number
1675-6215
e-ISSN
0128-0945
iii © 2018 by MIP
CONTENTS
1. Healthy Lifestyle of Urban Residents. Case Study: Sri Pahang Public Housing,
Bangsar, Kuala Lumpur, Malaysia
By: Oliver Ling Hoon Leh, Nur Hidayah Shaharom, Marlyana Azyyati Marzukhi, &
Sharifah Zannierah Syed Marzuki
1 - 12
2. Prioritizing the Physical Security Elements of Gated Community Housing Using the
Analytical Hierarchy Process (AHP)
By: Zurinah Tahir & Jalaluddin Abdul Malek
13 – 23
3. Illegal House Renovations: Improving the Renovation Guidelines of a Local
Authority Through Public Participation
By: Yazid Sarkom
24 - 35
4. Rural Development and the Level of Public Facilities Provision for Youth in Malaysia
By: Dasimah Omar, Kamarul Ariff Omar, Zuriyati Kamaludin, Saberi Othman, & Zaharah Mohd Yusoff
36 – 45
5. Assessment of Learning with Nature in Preschool
By: Syaida Farizah Saleh, Nurul Syala Abdul Latip, & Asiah Abdul Rahim
46 – 56
6. Satisfaction of Residents on the Redevelopment of Natural Disaster Area. Case Study:
Kuala Krai, Kelantan, Malaysia
By: Oliver Ling Hoon Leh, Muhammad Shamsul Azdhar Zulkapli, Kwong Qi Jie, &
Nurul Ashikin Mabahwi
57 – 68
7. Developing A 3-D GIS Model for Urban Planning. Case Study: Ampang Jaya,
Malaysia
By: Mimi Zaleha Abdul Ghani, Yazid Sarkom, & Zalina Samadi
69 – 82
8. Evaluation of Infill Building Block in Heritage Schools in Kuala Lumpur
By: Mohd Amirul Hakim Zamri & Jamalunlaili Abdullah
83 – 96
9. Gahai Agropolitan Project in Eradicating Poverty: Multidimensional Poverty Index
By: Mohd Khairi Ismail, Chamhuri Siwar, & Rospidah Ghazali
97 – 108
10. Assessing Urban Public Transportation Institutional Framework in Klang Valley
By: Noor Ashikin Abd Rahman, Yusfida Ayu Abdullah, Na’asah Nasrudin, & Zaharah
Mohd Yusoff
109 – 120
11. Use Pattern and Activities: The Evaluation of Malaysian Green Open Space Design
By: Nurhayati Abdul Malek & Amanina Nashar
121 – 131
12. Post Occupancy Evaluation Model: Adaptive Measure Towards Sustainable
Neighborhood Development
By: Rostam Yaman, Suwattana Thadaniti, Noraini Ahmad, Jamalunlaili Abdullah, & Farrah Zuhaira Ismail
132 – 142
© 2018 by MIP iv
13. Temporary Planning Permission in Development Control System for Urban
Development
By: Mohammad Yusup, Ahmad Fuzi Arshad, Marlyana Azyyati Marzukhi, & Yusfida
Ayu Abdullah
143 – 155
14. Lost Space in Urban Core Areas of Kuala Lumpur in Relations to Physical Urban
Environment
By: Nurul Shakila Khalid, Sabirah Hilal, Na’asah Nasrudin, & Marlyana Azzyati
Marzukhi
156 – 170
15.
-
Preference of Residential Typologies of Urban Malaysians
By: Lim Poh Im & Chang Yun Fah
171 – 181
16. Promoting Rural Tourism in Perak Tengah District Through the Expanding of
Heritage Interpretation and Presentation
By: Siti Norlizaiha Harun
182 – 196
17. The Demand of Recreational Facilities in Neighbourhood Parks: Visitors’
Perspectives
By: Ahmad Nazrin Aris Anuar & Nur Hafidzah Muhamadan
197 – 207
18. Exploring Possible Usage for Elevated Highway Interstitial Spaces: A Case Study of
DUKE and AKLEH, Kuala Lumpur
By: Mohamed Ikhwan Nasir Mohamed Anuar & Raziah Ahmad
208 – 220
19. GIS-Based Regression Analysis of The Relationship Between Ecological Footprint
and Economic Development of Selected Countries
By: M. Rafee Majid & Musarrat Zaman
221 – 232
20. Evaluating Travel Time and Passenger Ridership of University Shuttle Bus Service
By: Nur Syahira Zulkefly & Abdul Azeez Kadar Hamsa
233 – 247
21. Developing Malaysian Roadside Tree Species Selection Model in Urban Areas
By: Ramly Hasan, Noriah Othman, & Faridah Ismail
248 – 260
22. Assessing A Walkable Environment in Jalan Tuanku Abdul Rahman, Kuala Lumpur,
Malaysia
By: Na’asah Nasrudin, Muna Sarimin, & Norhayati Ibrahim
261 – 273
23. The Defensible Space Concept in Neighbourhood Park Case Study: Taman Tasik
Puchong Perdana, Selangor, Malaysia
By: Marlyana Azyyati Marzukhi, Mohd Aizzat Afiq, Oliver Ling Hoon Leh,
& Yusfida Ayu Abdullah
274 – 284
24. NCIA-AMB Masuk Kampung Project: A Paradigm of Opportunities and Challenges
for Sustainable Rural Development
By: Sana Malik, Faiqa Khilat, Fariha Tariq, & Kamal Arifin
285 – 296
25. Multi-Dimensional Human Interaction in Open Spaces
By: Filzani Illia Ibrahim, Dasimah Omar, & Nik Hanita Nik Mohamad
297 – 307
v © 2018 by MIP
26. Meeting Housing Needs of The Poor and Needy Muslims Through Zakat and Wakaf
By: Khairuddin Abdul Rashid, Puteri Nur Farah Naadia Mohd Fauzi, & Sharina
Farihah Hasan
308 – 319
27. Identification of Strategies for Urban Agriculture Development: A SWOT Analysis
By: Pushpawani Ramaloo, Chamhuri Siwar, Choong-Yeun Liong & Anizan Isahak
320 – 331
28. Historic Building Information Modelling (HBIM) For Malaysian Construction
Industry
By: Maisarah Ali, Kamsiah Mohd Ismail, Khairusy Syakirin Has-Yun Hashim, Saifulnizam Suhaimi, & Muhammad Hadi Mustafa
332 – 343
29. Ecological Friendly Applied Technology to Negotiate the Dilemma Between
Environmental Protection and Urban Development
By: Ariva Sugandi Permana & Ahmad Nazri Muhamad Ludin
344 – 356
30. Impediments to Home Ownership: Perception of Low and Middle-Income Tenants in
Selangor
By: Yong Kun Hing & Kuppusamy Singaravelloo
357 – 368
Notes to contributors and guidelines for manuscript submission
Ethics Statement
© 2018 by MIP vi
MIP Council Members
2017 - 2019 Session
President
TPr. Hj Ihsan Zainal Mokhtar (305/94)
Immediate Past President
TPr. Hj Md Nazri Mohd Noordin (301/94)
Vice President
Datin TPr. Hjh Noraida Saludin (468/02)
TPr. Mohamad Nazri Jaafar (168/86)
Honorary Secretary
Datin TPr. Hjh Mazrina Dato' Abdul Khalid (559/09)
Honorary Treasury
TPr. Mohd Zamri Husin (430/01)
Council Members
TPr. Lee Lih Shyan (267/92)
TPr. Hj Abdul Hamid Akub (450/01)
TPr. Hj Nik Mohd Ruiz Ahmad Fakhrul Razy (570/10)
Assoc. Prof. TPr. Dr. Saniah Ahmad Zaki (397/98)
TPr. Mohammad Fauzi Ahmad (418/99)
TPr. Mahani Mohd Yasin (614/12)
TPr. Nurul Sheema Abd Rahman (633/14)
TPr. Saiful Azman Abd Rashid (474/03)
TPr. Wan Andery Wan Mahmood (572/10
TPr. Fathuddin Kamaruddin (656/16)
Co-opted Members
TPr. Victor Lai Wee Peng (502/05) - Chairman, MIP Sarawak & Sabah Chapter
TPr. Cheah Lye Aik (432/01) - Chairman, MIP Northern Branch
TPr. Abd Halim Ali Hassan (407/89) - Chairman, MIP Southern Branch
TPr. Philipose Philip (127/84)
Dato' TPr. Mohd Zaki Ibrahim (197/88)
Assoc Prof. TPr. Dr. Mariana Mohamed Osman (581/11)
TPr. Hj Mohd Asri Husin (259/91)
TPr. Ishak Ariffin (239/90)
Pn. Rozita Hamit
Hon. Auditors
TPr. Hj Lokman Omar (211/88)
Assoc. Prof. TPr. Hj Ahmad Suhaimi Ismail (245/91)
1Associate Professor at Universiti Teknologi MARA, Malaysia. Email: [email protected] 1
PLANNING MALAYSIA:
Journal of the Malaysian Institute of Planners
VOLUME 16 ISSUE 3 (2018) Page 1 - 12
HEALTHY LIFESTYLE OF URBAN RESIDENTS.
CASE STUDY: SRI PAHANG PUBLIC HOUSING, BANGSAR,
KUALA LUMPUR, MALAYSIA
Oliver Ling Hoon Leh1, Nur Hidayah Shaharom2, Marlyana Azyyati Marzukhi3, &
Sharifah Zannierah Syed Marzuki4
1,2,3Faculty of Architecture, Planning and Surveying,
UNIVERSITI TEKNOLOGI MARA, MALAYSIA
4Faculty of Business and Management,
UNIVERSITI TEKNOLOGI MARA, MALAYSIA
Abstract
The natural ecosystems are increasingly being replaced by urban built-up area
due to fast urbanisation. The urban development pressure brought urban areas to
the uncontrolled built environment which, in turn, significantly compromises the
quality of public spaces and facilities. Furthermore, the urban environment
discourages active living. Thus, research on the relationship between urbanisation
and physical health is rapidly coming to the force. Urbanisation can have
detrimental effects, particularly on physical health, which further attributed to
unsustainable urban development. A study was carried out at Sri Pahang Public
Housing (Flat), Kuala Lumpur with the aim to investigate the healthy lifestyle
among residents and the relationship with the public facilities available at study
area for the physical activity. Data was obtained through questionnaire survey.
The relationship between healthy lifestyle particularly the level of physical
activity and the facilities in the study area was analysed using correlation test. It
was found that most of the respondents were physically inactive and their healthy
lifestyle can be related to the planning aspects of facilities in the study area.
Keywords: exercise, facility, physical activity, quality, safety, satisfaction
Oliver Ling Hoon Leh, Nur Hidayah Shaharom, Marlyana Azyyati Marzukhi, & Sharifah Zannierah Syed Marzuki
Healthy Lifestyle of Urban Residents. Case Study: Sri Pahang Public Housing, Bangsar, Kuala Lumpur, Malaysia
© 2018 by MIP 2
INTRODUCTION
Environmental risk factors played a crucial role in contributing more than 80%
of the diseases globally (WHO, 2007), especially in urban areas. This is due to
the urban settlements are more polluted with lower environmental quality and
health condition as compared to rural settlements (Mohamed Musthafa, Ling,
Omar, & Subramaniam, 2015; Ling, Mohamed Musthafa, & Mohamed, 2014).
Due to the issue of environmental quality, communicable diseases such as
Tuberculosis (TB) has become one of environmental health concerns in Malaysia.
The notification rate of TB has increased from 72 per 100,000 population in 2011
to 81 per 100,000 population in 2014 (Abdul Rasam, Shariff, & Dony, 2016).
Recently, non-communicable diseases (NCD) has also become the latest health
concern in Malaysian urban areas. NCD was always associated with unhealthy
lifestyle especially physical inactivity (Ling, Mohamed Musthafa, & Omar 2015;
Mohamed Musthafa et al., 2015). The urban environment discourages active
living due to lack of quality lighting, lack of access to open space, sports and
recreational facilities, low quality of houses and neighbourhoods, and poor
aesthetics (Edwards & Tsouros, 2006).
Physical inactivity, combined with poor diet, contributed to the unhealthy
lifestyle of urban dwellers. Physical inactivity has been identified as the fourth
leading risk factor for global mortality (6% of deaths globally) (WHO, 2010), and
it increases the risk of NCDs. In Malaysia, 71% of death are NCD related,
particularly cardiovascular diseases (CVD), diabetes, cancer, and chronic
respiratory diseases. Malaysia has also recorded 17% of the risk of premature
death from target NCDs (WHO, 2017a). Furthermore, from 1996 to 2006,
Malaysia saw a dramatic increase in the prevalence of behaviour-linked diseases,
including a 43% increase in hypertension, 88% increase in diabetes and 250%
increase in obesity. The alarming rise of NCDs in Malaysia is largely due to poor
lifestyle choices which include unhealthy behaviours regarding food, physical
activity, sleep and peace of mind (Anusha, 2016). Only 40% Malaysians adopted
healthy lifestyle by making sports as a culture (Bernama, 2016). These factors
affected the NCD and affected by lifestyle choices that are often influenced by
economic development and urban living (WHO, 2017b).
Urban area, particularly the study area (Sri Pahang Public Housing) was
developed with limited public facilities that encourage active lifestyle (physical
exercise) among residents. This might affect the healthy lifestyle of residents.
Thus, a study was carried out with the aim to investigate the healthy lifestyle
among residents and the relationship with the public facilities available at study
area for the conduct of physical activity.
LITERATURE REVIEW
Urban areas attract people through the provision of job opportunities, urban
services and urban lifestyles. Due to the high rate of in-migration, urban areas are
PLANNING MALAYSIA
Journal of the Malaysia Institute of Planners (2018)
3 © 2018 by MIP
pressured to provide more houses, more retail and other facilities, more roads to
accommodate the increasing traffic volume, and more waste disposal or treatment
facilities for the increasing waste volume. All of these demands pressure urban
areas to increase their densities as well as their size and reduce the green fields.
The natural ecosystems are increasingly being replaced by built-up area due to
fast urbanisation (Li, Wang, Paulussen, & Liu, 2005). Rapid urbanisation may
also compromises the quality of public spaces. As urban density increases, the
mean wind speed exponentially decreases (Zainol, Abdul Razak, Ali, Qi, & Zaki,
2017). It will also affect the thermal comfort among pedestrians, resulting in less
people walking as pedestrian., and hence, increasing the level of physical activity.
Thus, urbanisation can have detrimental effects, particularly on physical health,
which further attributed to unsustainable urban development (Fisher, Andersen,
Loft, & Pedersen, 2017).
Globally, research have been carried out in relation to urban land use and
activities, healthy lifestyle (especially physical activity), and health/well-being
(Richardson, Pearce, Mitchell, & Kingham, 2013; Soga, et al., 2017; Lau,
Goodloe, Eatman-Williams, Dudovitz, & Wentz, 2018; Sarkar & Webster, 2017).
In New Zealand, for instance, it was found that neighbourhood design and land
use pattern affect health where residents of the greenest urban neighbourhoods
had significantly lower risks of having poor mental health than those in the least
green areas, suggesting a dose-response relationship (Richardson et al., 2013). In
fact, individuals residing in neighbourhoods with more than 15% green space
coverage had similarly reduced CVD risks. Meanwhile, the least green
neighbourhoods have certain other characteristics (e.g., high population density,
or urban centres) that also relate to CVD risk (Richardson et al., 2013). According
to Schram-Bijkerk, Otte, Dirven and Breure (2018), urban gardens provide
opportunities for physical activity and allow people to consume home grown fruit
and vegetables. Urban gardens may also reduce stress levels of gardeners and
improve social cohesion. In this way, they can help to prevent health problems.
Also, research in Japan revealed that allotment gardeners, as compared to non-
gardeners, reported better perceived general health, subjective health complaints,
mental health and social cohesion (Soga et al., 2017).
RESEARCH METHOD
Study Area
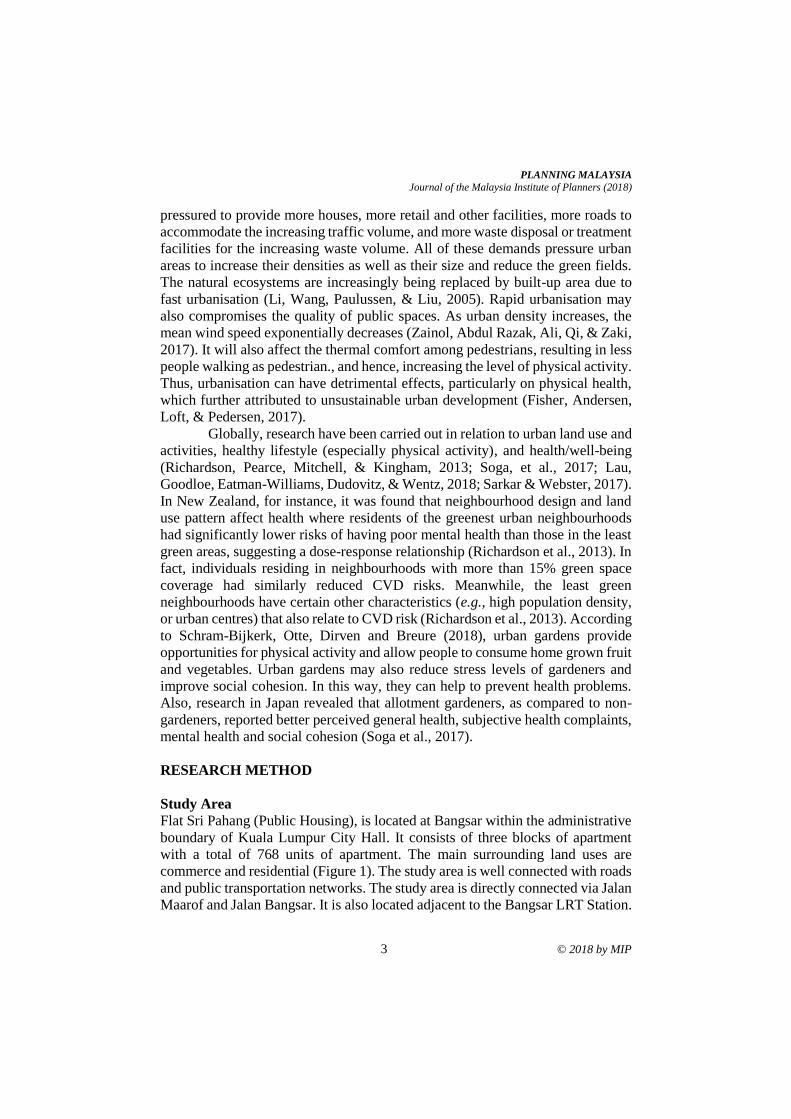
Flat Sri Pahang (Public Housing), is located at Bangsar within the administrative
boundary of Kuala Lumpur City Hall. It consists of three blocks of apartment
with a total of 768 units of apartment. The main surrounding land uses are
commerce and residential (Figure 1). The study area is well connected with roads
and public transportation networks. The study area is directly connected via Jalan
Maarof and Jalan Bangsar. It is also located adjacent to the Bangsar LRT Station.
Oliver Ling Hoon Leh, Nur Hidayah Shaharom, Marlyana Azyyati Marzukhi, & Sharifah Zannierah Syed Marzuki
Healthy Lifestyle of Urban Residents. Case Study: Sri Pahang Public Housing, Bangsar, Kuala Lumpur, Malaysia
© 2018 by MIP 4
Figure 1: Location of study area (Flat Sri Pahang)
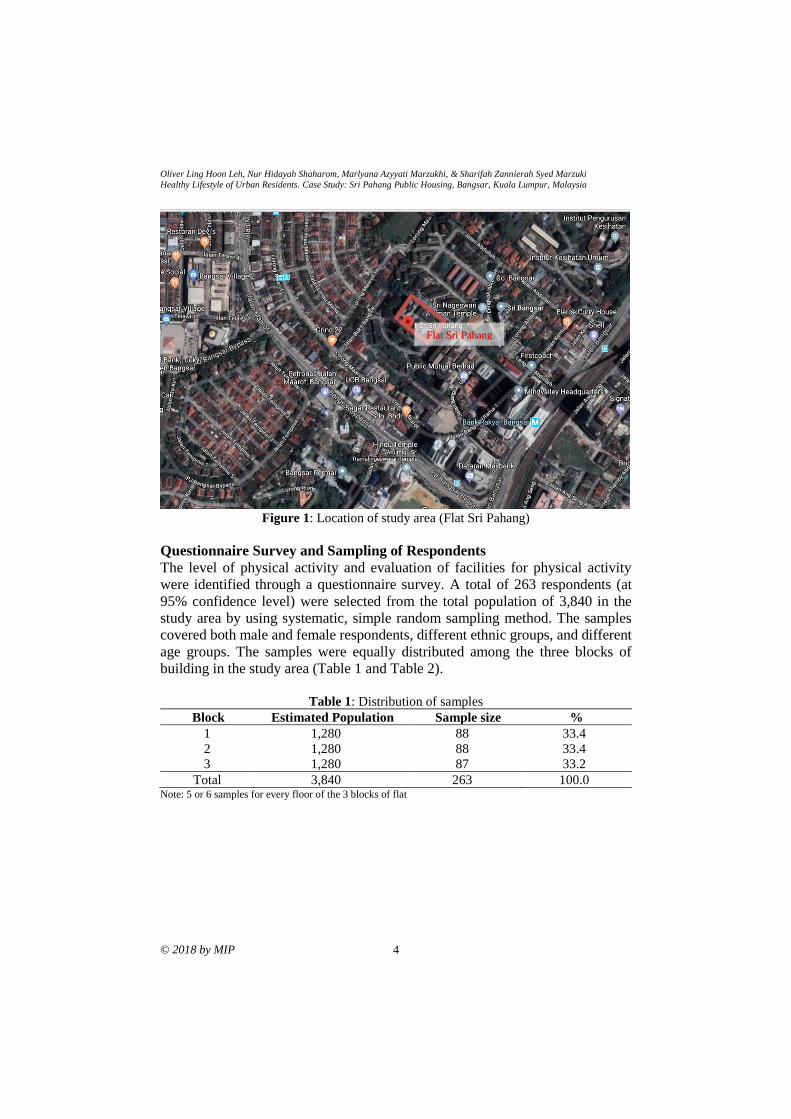
Questionnaire Survey and Sampling of Respondents
The level of physical activity and evaluation of facilities for physical activity
were identified through a questionnaire survey. A total of 263 respondents (at
95% confidence level) were selected from the total population of 3,840 in the
study area by using systematic, simple random sampling method. The samples
covered both male and female respondents, different ethnic groups, and different
age groups. The samples were equally distributed among the three blocks of
building in the study area (Table 1 and Table 2).
Table 1: Distribution of samples
Block Estimated Population Sample size %
1 1,280 88 33.4
2 1,280 88 33.4
3 1,280 87 33.2
Total 3,840 263 100.0 Note: 5 or 6 samples for every floor of the 3 blocks of flat
Flat Sri Pahang
PLANNING MALAYSIA
Journal of the Malaysia Institute of Planners (2018)
5 © 2018 by MIP
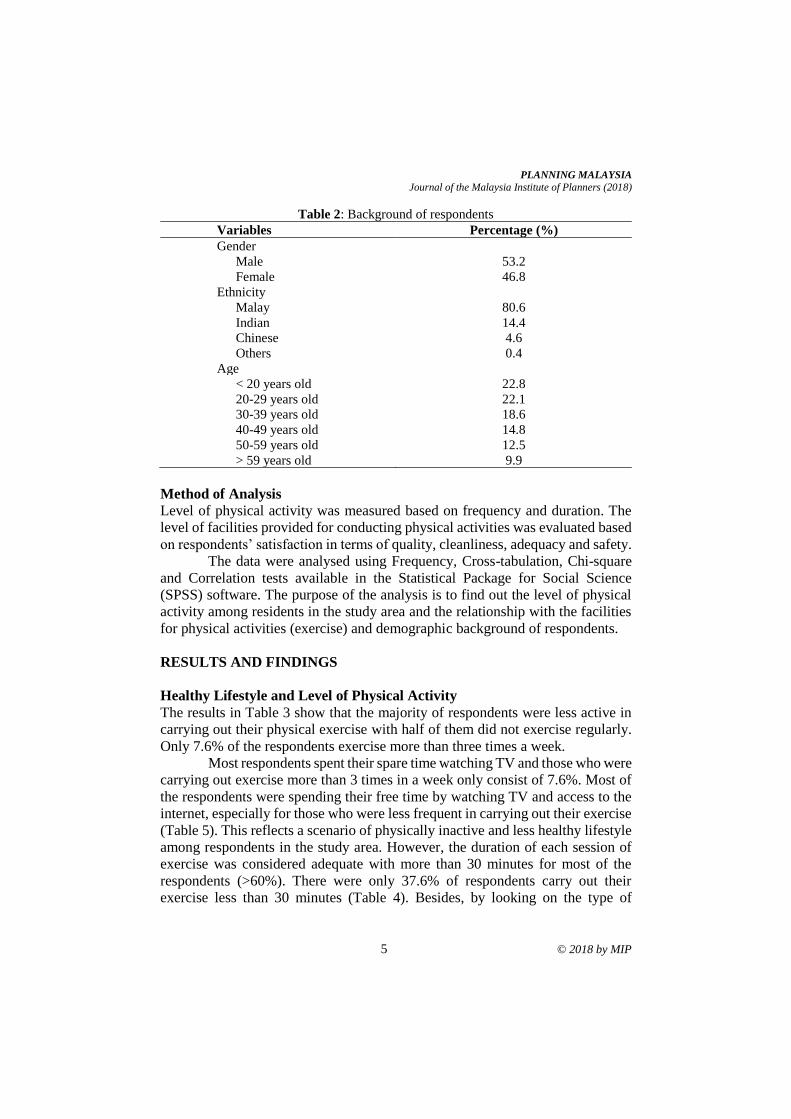
Table 2: Background of respondents
Variables Percentage (%)
Gender
Male
Female
53.2
46.8
Ethnicity
Malay
Indian
Chinese
Others
80.6
14.4
4.6
0.4
Age
< 20 years old
20-29 years old
30-39 years old
40-49 years old
50-59 years old
> 59 years old
22.8
22.1
18.6
14.8
12.5
9.9
Method of Analysis
Level of physical activity was measured based on frequency and duration. The
level of facilities provided for conducting physical activities was evaluated based
on respondents’ satisfaction in terms of quality, cleanliness, adequacy and safety.
The data were analysed using Frequency, Cross-tabulation, Chi-square
and Correlation tests available in the Statistical Package for Social Science
(SPSS) software. The purpose of the analysis is to find out the level of physical
activity among residents in the study area and the relationship with the facilities
for physical activities (exercise) and demographic background of respondents.
RESULTS AND FINDINGS
Healthy Lifestyle and Level of Physical Activity
The results in Table 3 show that the majority of respondents were less active in
carrying out their physical exercise with half of them did not exercise regularly.
Only 7.6% of the respondents exercise more than three times a week.
Most respondents spent their spare time watching TV and those who were
carrying out exercise more than 3 times in a week only consist of 7.6%. Most of
the respondents were spending their free time by watching TV and access to the
internet, especially for those who were less frequent in carrying out their exercise
(Table 5). This reflects a scenario of physically inactive and less healthy lifestyle
among respondents in the study area. However, the duration of each session of
exercise was considered adequate with more than 30 minutes for most of the
respondents (>60%). There were only 37.6% of respondents carry out their
exercise less than 30 minutes (Table 4). Besides, by looking on the type of
Oliver Ling Hoon Leh, Nur Hidayah Shaharom, Marlyana Azyyati Marzukhi, & Sharifah Zannierah Syed Marzuki
Healthy Lifestyle of Urban Residents. Case Study: Sri Pahang Public Housing, Bangsar, Kuala Lumpur, Malaysia
© 2018 by MIP 6
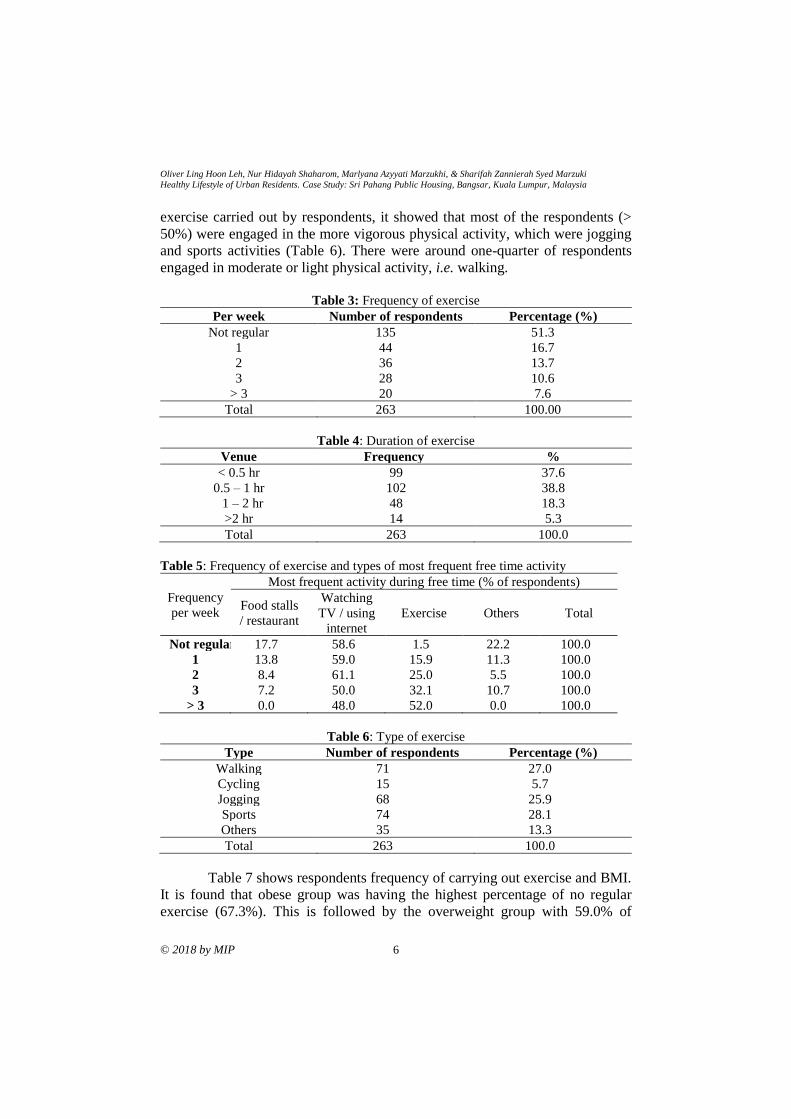
exercise carried out by respondents, it showed that most of the respondents (>
50%) were engaged in the more vigorous physical activity, which were jogging
and sports activities (Table 6). There were around one-quarter of respondents
engaged in moderate or light physical activity, i.e. walking.
Table 3: Frequency of exercise
Per week Number of respondents Percentage (%)
Not regular 135 51.3
1 44 16.7
2 36 13.7
3 28 10.6
> 3 20 7.6
Total 263 100.00
Table 4: Duration of exercise
Venue Frequency %
< 0.5 hr 99 37.6
0.5 – 1 hr 102 38.8
1 – 2 hr 48 18.3
>2 hr 14 5.3
Total 263 100.0
Table 5: Frequency of exercise and types of most frequent free time activity
Frequency
per week
Most frequent activity during free time (% of respondents)
Food stalls
/ restaurant
Watching
TV / using
internet
Exercise Others Total
Not regular 17.7 58.6 1.5 22.2 100.0
1 13.8 59.0 15.9 11.3 100.0
2 8.4 61.1 25.0 5.5 100.0
3 7.2 50.0 32.1 10.7 100.0
> 3 0.0 48.0 52.0 0.0 100.0
Table 6: Type of exercise
Type Number of respondents Percentage (%)
Walking 71 27.0
Cycling 15 5.7
Jogging 68 25.9
Sports 74 28.1
Others 35 13.3
Total 263 100.0
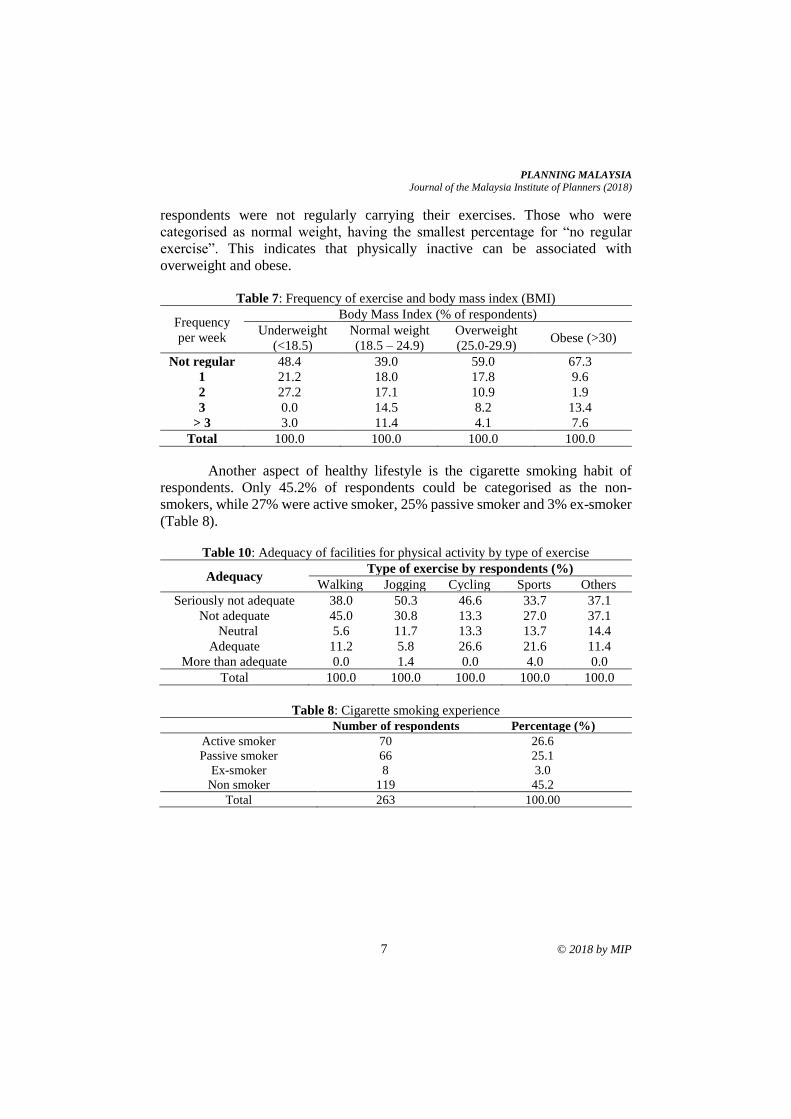
Table 7 shows respondents frequency of carrying out exercise and BMI.
It is found that obese group was having the highest percentage of no regular
exercise (67.3%). This is followed by the overweight group with 59.0% of
PLANNING MALAYSIA
Journal of the Malaysia Institute of Planners (2018)
7 © 2018 by MIP
respondents were not regularly carrying their exercises. Those who were
categorised as normal weight, having the smallest percentage for “no regular
exercise”. This indicates that physically inactive can be associated with
overweight and obese.
Table 7: Frequency of exercise and body mass index (BMI)
Frequency
per week
Body Mass Index (% of respondents)
Underweight
(<18.5)
Normal weight
(18.5 – 24.9)
Overweight
(25.0-29.9) Obese (>30)
Not regular 48.4 39.0 59.0 67.3
1 21.2 18.0 17.8 9.6
2 27.2 17.1 10.9 1.9
3 0.0 14.5 8.2 13.4
> 3 3.0 11.4 4.1 7.6
Total 100.0 100.0 100.0 100.0
Another aspect of healthy lifestyle is the cigarette smoking habit of
respondents. Only 45.2% of respondents could be categorised as the non-
smokers, while 27% were active smoker, 25% passive smoker and 3% ex-smoker
(Table 8).
Table 10: Adequacy of facilities for physical activity by type of exercise
Adequacy Type of exercise by respondents (%)
Walking Jogging Cycling Sports Others
Seriously not adequate 38.0 50.3 46.6 33.7 37.1
Not adequate 45.0 30.8 13.3 27.0 37.1
Neutral 5.6 11.7 13.3 13.7 14.4
Adequate 11.2 5.8 26.6 21.6 11.4
More than adequate 0.0 1.4 0.0 4.0 0.0
Total 100.0 100.0 100.0 100.0 100.0
Table 8: Cigarette smoking experience
Number of respondents Percentage (%)
Active smoker 70 26.6
Passive smoker 66 25.1
Ex-smoker 8 3.0
Non smoker 119 45.2
Total 263 100.00
Oliver Ling Hoon Leh, Nur Hidayah Shaharom, Marlyana Azyyati Marzukhi, & Sharifah Zannierah Syed Marzuki
Healthy Lifestyle of Urban Residents. Case Study: Sri Pahang Public Housing, Bangsar, Kuala Lumpur, Malaysia
© 2018 by MIP 8
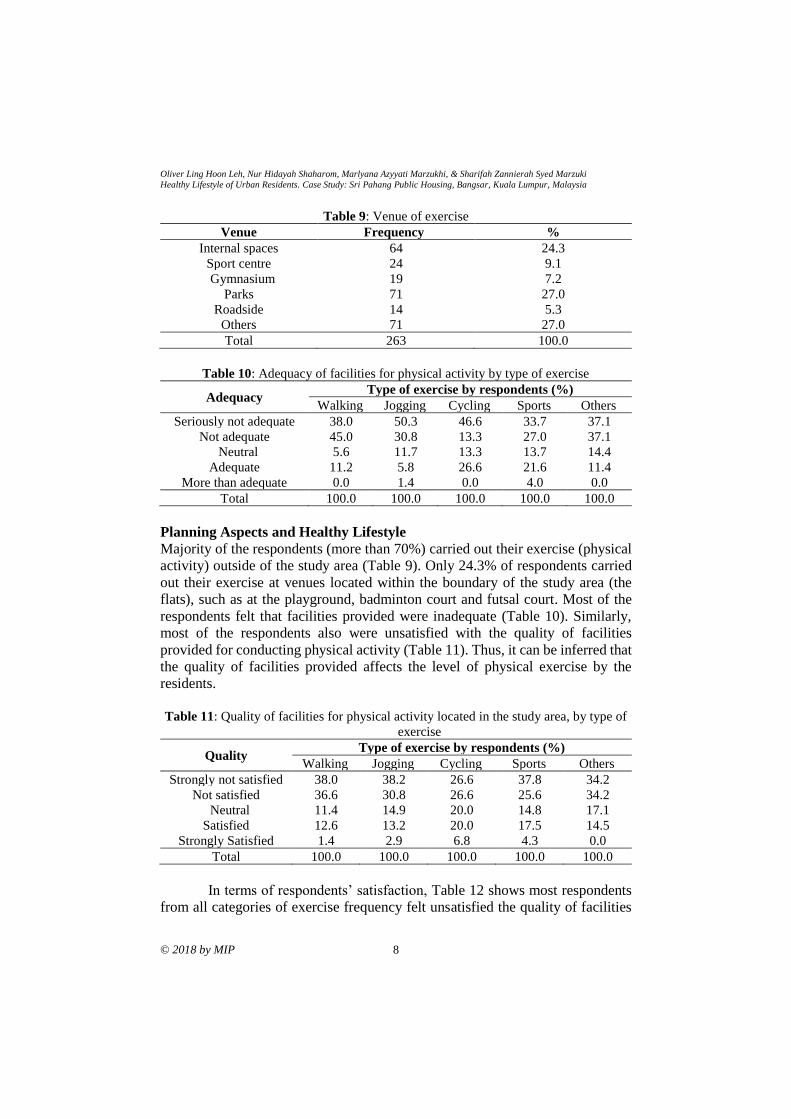
Table 9: Venue of exercise
Venue Frequency %
Internal spaces 64 24.3
Sport centre 24 9.1
Gymnasium 19 7.2
Parks 71 27.0
Roadside 14 5.3
Others 71 27.0
Total 263 100.0
Table 10: Adequacy of facilities for physical activity by type of exercise
Adequacy Type of exercise by respondents (%)
Walking Jogging Cycling Sports Others
Seriously not adequate 38.0 50.3 46.6 33.7 37.1
Not adequate 45.0 30.8 13.3 27.0 37.1
Neutral 5.6 11.7 13.3 13.7 14.4
Adequate 11.2 5.8 26.6 21.6 11.4
More than adequate 0.0 1.4 0.0 4.0 0.0
Total 100.0 100.0 100.0 100.0 100.0
Planning Aspects and Healthy Lifestyle
Majority of the respondents (more than 70%) carried out their exercise (physical
activity) outside of the study area (Table 9). Only 24.3% of respondents carried
out their exercise at venues located within the boundary of the study area (the
flats), such as at the playground, badminton court and futsal court. Most of the
respondents felt that facilities provided were inadequate (Table 10). Similarly,
most of the respondents also were unsatisfied with the quality of facilities
provided for conducting physical activity (Table 11). Thus, it can be inferred that
the quality of facilities provided affects the level of physical exercise by the
residents.
Table 11: Quality of facilities for physical activity located in the study area, by type of
exercise
Quality Type of exercise by respondents (%)
Walking Jogging Cycling Sports Others
Strongly not satisfied 38.0 38.2 26.6 37.8 34.2
Not satisfied 36.6 30.8 26.6 25.6 34.2
Neutral 11.4 14.9 20.0 14.8 17.1
Satisfied 12.6 13.2 20.0 17.5 14.5
Strongly Satisfied 1.4 2.9 6.8 4.3 0.0
Total 100.0 100.0 100.0 100.0 100.0
In terms of respondents’ satisfaction, Table 12 shows most respondents
from all categories of exercise frequency felt unsatisfied the quality of facilities
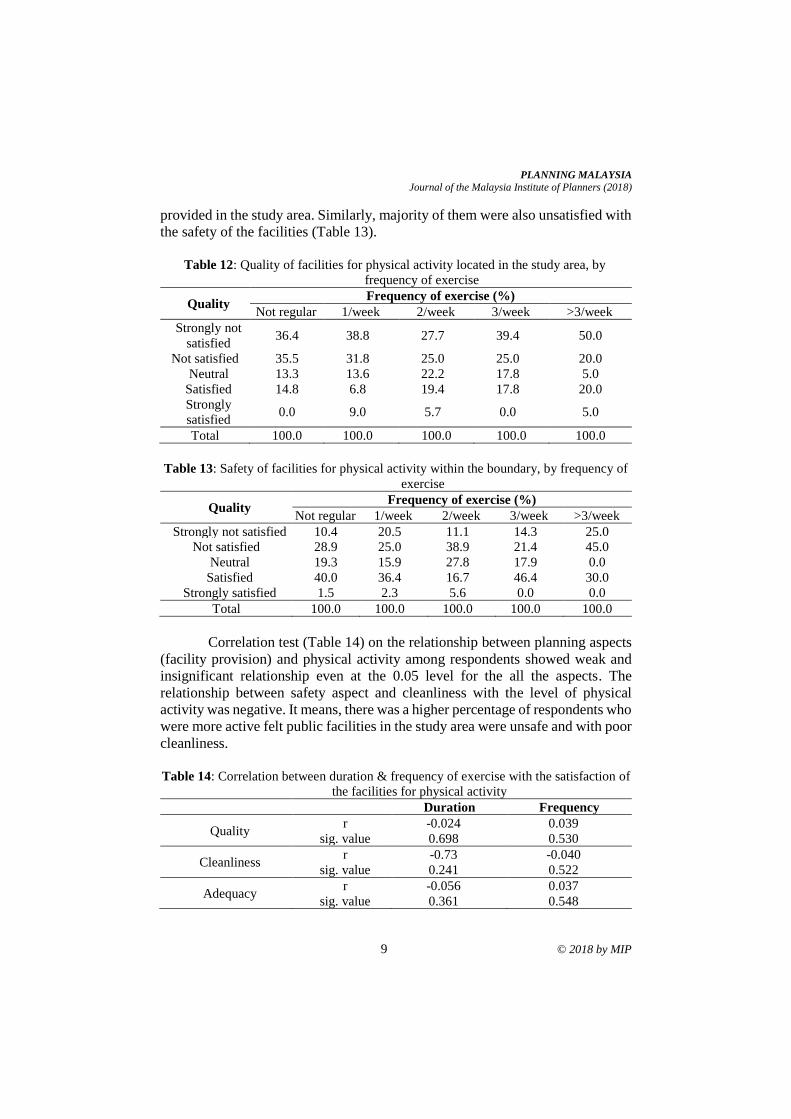
PLANNING MALAYSIA
Journal of the Malaysia Institute of Planners (2018)
9 © 2018 by MIP
provided in the study area. Similarly, majority of them were also unsatisfied with
the safety of the facilities (Table 13).
Table 12: Quality of facilities for physical activity located in the study area, by
frequency of exercise
Quality Frequency of exercise (%)
Not regular 1/week 2/week 3/week >3/week
Strongly not
satisfied 36.4 38.8 27.7 39.4 50.0
Not satisfied 35.5 31.8 25.0 25.0 20.0
Neutral 13.3 13.6 22.2 17.8 5.0
Satisfied 14.8 6.8 19.4 17.8 20.0
Strongly
satisfied 0.0 9.0 5.7 0.0 5.0
Total 100.0 100.0 100.0 100.0 100.0
Table 13: Safety of facilities for physical activity within the boundary, by frequency of
exercise
Quality Frequency of exercise (%)
Not regular 1/week 2/week 3/week >3/week
Strongly not satisfied 10.4 20.5 11.1 14.3 25.0
Not satisfied 28.9 25.0 38.9 21.4 45.0
Neutral 19.3 15.9 27.8 17.9 0.0
Satisfied 40.0 36.4 16.7 46.4 30.0
Strongly satisfied 1.5 2.3 5.6 0.0 0.0
Total 100.0 100.0 100.0 100.0 100.0
Correlation test (Table 14) on the relationship between planning aspects
(facility provision) and physical activity among respondents showed weak and
insignificant relationship even at the 0.05 level for the all the aspects. The
relationship between safety aspect and cleanliness with the level of physical
activity was negative. It means, there was a higher percentage of respondents who
were more active felt public facilities in the study area were unsafe and with poor
cleanliness.
Table 14: Correlation between duration & frequency of exercise with the satisfaction of
the facilities for physical activity
Duration Frequency
Quality r
sig. value
-0.024
0.698
0.039
0.530
Cleanliness r
sig. value
-0.73
0.241
-0.040
0.522
Adequacy r
sig. value
-0.056
0.361
0.037
0.548
Oliver Ling Hoon Leh, Nur Hidayah Shaharom, Marlyana Azyyati Marzukhi, & Sharifah Zannierah Syed Marzuki
Healthy Lifestyle of Urban Residents. Case Study: Sri Pahang Public Housing, Bangsar, Kuala Lumpur, Malaysia
© 2018 by MIP 10
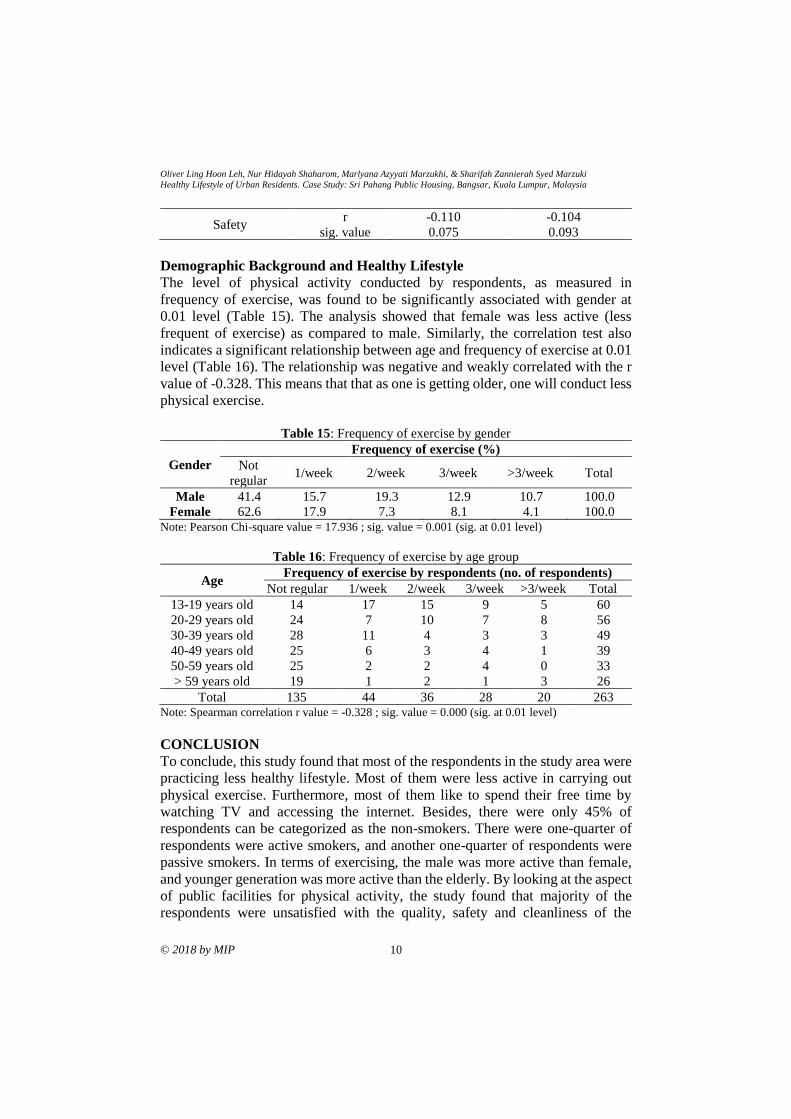
Safety r
sig. value
-0.110
0.075
-0.104
0.093
Demographic Background and Healthy Lifestyle
The level of physical activity conducted by respondents, as measured in
frequency of exercise, was found to be significantly associated with gender at
0.01 level (Table 15). The analysis showed that female was less active (less
frequent of exercise) as compared to male. Similarly, the correlation test also
indicates a significant relationship between age and frequency of exercise at 0.01
level (Table 16). The relationship was negative and weakly correlated with the r
value of -0.328. This means that that as one is getting older, one will conduct less
physical exercise.
Table 15: Frequency of exercise by gender
Gender
Frequency of exercise (%)
Not
regular 1/week 2/week 3/week >3/week Total
Male 41.4 15.7 19.3 12.9 10.7 100.0
Female 62.6 17.9 7.3 8.1 4.1 100.0 Note: Pearson Chi-square value = 17.936 ; sig. value = 0.001 (sig. at 0.01 level)
Table 16: Frequency of exercise by age group
Age Frequency of exercise by respondents (no. of respondents)
Not regular 1/week 2/week 3/week >3/week Total
13-19 years old 14 17 15 9 5 60
20-29 years old 24 7 10 7 8 56
30-39 years old 28 11 4 3 3 49
40-49 years old 25 6 3 4 1 39
50-59 years old 25 2 2 4 0 33
> 59 years old 19 1 2 1 3 26
Total 135 44 36 28 20 263 Note: Spearman correlation r value = -0.328 ; sig. value = 0.000 (sig. at 0.01 level)
CONCLUSION
To conclude, this study found that most of the respondents in the study area were
practicing less healthy lifestyle. Most of them were less active in carrying out
physical exercise. Furthermore, most of them like to spend their free time by
watching TV and accessing the internet. Besides, there were only 45% of
respondents can be categorized as the non-smokers. There were one-quarter of
respondents were active smokers, and another one-quarter of respondents were
passive smokers. In terms of exercising, the male was more active than female,
and younger generation was more active than the elderly. By looking at the aspect
of public facilities for physical activity, the study found that majority of the
respondents were unsatisfied with the quality, safety and cleanliness of the
PLANNING MALAYSIA
Journal of the Malaysia Institute of Planners (2018)
11 © 2018 by MIP
facilities. This could be one of the reasons why majority of them conduct their
physical exercises at venues outside of the study area.
Further study should be carried out to extend the investigation of
urbanisation, planning and design aspects in relation to the healthy lifestyle,
especially the physical activities of urban dwellers.
ACKNOWLEDGEMENT
The authors would like to thank Universiti Teknologi MARA (UiTM) for the
support and Ministry of Higher Education Malaysia for partly funding the study
through the FRGS grant (FRGS/1/2014/SS06/UITM/02/3). The authors would
also like to thank all the departments, organisations, and individuals who had
contributed to this study.
REFERENCES Abdul Rasam, A. R., Shariff, N. M., & Dony, J. F. (2016). Identifying high-risk
population of tuberculosis using environmental factors and GIS based multi-
criteria decision making method. The International Archives of the
Photogrammetry, Remote Sensing and Spatial Information Sciences, XLII-4/W1,
9-13.
Anusha, T. (2016, June 12). Helping Malaysians be healthier. The Star. Retrieved from
https://www.thestar.com.my/news/nation/2016/06/12/helping-malaysians-be-
healthier-both-carrots-and-sticks-are-needed-to-empower-and-incentivise-
malays/
Bernama (2016, August 29). Only 40% of Malaysians practise a healthy lifestyle: Khairy.
The Sun Daily. Retrieved from http://www.thesundaily.my/news/1953395
Edwards, P., & Tsouros, A. D. (2006). Promoting physical activity and active living in
urban environments: The role of local governments. Copenhagen: WHO
Regional Office for Europe.
Fisher, J. E., Andersen, Z. J., Loft, S., & Pedersen, M. (2017). Opportunities and
challenges within urban health and sustainable development. Current Opinion
in Environmental Sustainability, 25, 77-83.
Lau, C., Goodloe, J., Eatman-Williams, J., Dudovitz, R., & Wentz, S. (2018).
Dancetricians: A street dance intervention to improve physical activity self-
efficacy and motivation among urban minority school children. Pediatrics,
141(1).
Li, F., Wang, R., Paulussen, J. & Liu, X. (2005). Comprehensive concept planning of
urban greening based on ecological principles: a case study in Beijing, China.
Landscape and Urban Planning, 72(4), 325-336.
Ling, O. H. L., Mohamed Musthafa, S. N. A., & Mohamed, N. (2014). Air quality and
land use in urban region of Petaling Jaya, Shah Alam and Klang, Malaysia.
EnvironmentAsia, 7(1), 134-144.
Ling, O. H. L., Mohamed Musthafa, S. N. A, & Omar, D. (2015). Environmental health
relation to urban planning and human physical activity. The Malaysian Journal
of Analytical Sciences, 19(4), 896-903.
Oliver Ling Hoon Leh, Nur Hidayah Shaharom, Marlyana Azyyati Marzukhi, & Sharifah Zannierah Syed Marzuki
Healthy Lifestyle of Urban Residents. Case Study: Sri Pahang Public Housing, Bangsar, Kuala Lumpur, Malaysia
© 2018 by MIP 12
Mohamed Musthafa, S. N. A., Ling, O. H. L., Omar, D., & Subramaniam, K. (2015).
Theoretical review on environmental health in relation to neighbourhood
planning and human physical activity. Procedia - Social and Behavioural
Sciences, 201, 325-332.
Richardson, E. A., Pearce, J., Mitchell, R., & Kingham, S. (2013). Role of physical
activity in the relationship between urban green space and health. Public Health,
127(4), 318-324.
Sarkar, C., & Webster, C. (2017). Healthy cities of tomorrow: The case for large scale
built environment – health studies. Journal of Urban Health, 94(1), 4-19.
Schram-Bijkerk, D., Otte, P., Dirven, L., & Breure, A. M. (2018). Indicators to support
healthy urban gardening in urban management. Science of the Total
Environment, 621, 863-871.
Soga, M., Cox, D. T. C., Yamaura, Y., Gaston, K. J., Kurisu, K., & Hanaki, K. (2017).
Health benefits of urban allotment gardening: improved physical and
psychological well-being and social integration. International Journal of
Environmental Research and Public Health, 14(1), 71.
World Health Organization [WHO] (2007). Preventing disease through healthy
environments: Towards an estimate of the environmental burden of disease.
Available at http://www.who.int.
World Health Organization [WHO] (2010). Global recommendations on physical activity
for health. Geneva: Author.
World Health Organization [WHO] (2017a). Noncommunicable Diseases Progress
Monitor 2017. Geneva: Author.
World Health Organization [WHO] (2017b). Non-communicable diseases fact sheet.
Retrieved from http://www.who.int/mediacentre/factsheets/fs355/en/
Zainol, M. A., Abdul Razak, A., Ali, N. M., Qi, J. K., & Zaki, S. A. (2017). Effect of
upstream building configurations on mean wind speed ratio at urban pedestrian
level using LES. Pertanika Journal of Science & Technology, 25(S), 227-286.
1Senior Lecturer at Universiti Kebangsaan Malaysia. Email: [email protected] 13
PLANNING MALAYSIA:
Journal of the Malaysian Institute of Planners
VOLUME 16 ISSUE 3 (2018) Page 13 – 23
PRIORITIZING THE PHYSICAL SECURITY ELEMENTS OF GATED
COMMUNITY HOUSING USING THE ANALYTICAL HIERARCHY
PROCESS (AHP)
Zurinah Tahir1 & Jalaluddin Abdul Malek2
1,2Faculty of Social Sciences and Humanities
UNIVERSITI KEBANGSAAN MALAYSIA
Abstract
The concept of gated community housing is a feature of contemporary housing
development. Housing developers promote this concept through an emphasis on
security in gated housing. House owners today favour fenced-in residences, not
only for their homes, but also for the entire housing development, including
recreational areas and other facilities. The aim of this study is to prioritize the
elements of physical security in a gated community housing development. The
methodology employed a quantitative approach using the Analytical Hierarchy
Process (AHP) in ascertaining the weightage for each element deemed important
in the planning of secure gated community housing, with focus on the elements
of access, fencing, CCTV installation, lighting, guardhouse and landscape, which
are the principal elements that serve to enforce security in the protected
community. The results of this study showed that two principal elements, namely
access to the property (entry/exit points) and protective fencing, were deemed the
most important in providing security in gated community housing. Accordingly,
these aspects should be accorded particular attention in the planning of gated
communities in the future and be factored into the strategy to enhance security.
Gated community housing and guarded neighbourhoods employing such a
strategy would be quite effective in providing security to residents.
Keywords: security element, gated community, planning, housing, AHP
Zurinah Tahir & Jalaluddin Abdul Malek
Prioritizing the Physical Security Elements of Gated Community Housing Using the Analytical Hierarchy Process (AHP)
© 2018 by MIP 14
INTRODUCTION
The growth of gated community housing has become an urban phenomenon, with
such housing schemes gaining popularity in recent years (Furlan & Petruccioli,
2016; Abdullah, Mohd Daniar, Osman, & Bachok, 2017). Gated communities
had their beginnings in the 1970s, and they quickly became a contributing factor
to social stratification. Feelings of insecurity by residents, fear of crime, and
inadequate assurance of safety by the government, all added to the push by
housing developers to promote this type of housing lifestyle (Smigiel, 2014).
Rising crime rates in the city and fear of being the victims of crime were the main
reasons for residents moving into gated community housing. The promise of high
security in such guarded communities assuaged the fears of many city dwellers.
A community surrounded by protective walls and fences in surroundings free
from vandalism generated a perception of safety and privacy (El-Ekhteyar &
Furlan, 2016). The notion of enhanced privacy projected an aura of exclusivity
that resulted in such property rising in value.
The well-received concept of the gated community led to increasing
development of residential areas protected by walls or fences. The gated
community concept which restricts access to public traffic is the preferred
lifestyle of its residents. It offers them a desirable identity and status while
addressing the problems of rising crime rate in the cities. At present, many
residential areas that were not originally gated have been converted into guarded
properties and communities. Even residents in terrace houses in low-density
communities in Skudai and Johor Bahru areas that used to be freely accessible,
are now contemplating adopting the gated community concept. Surroundings that
encompass both urban living and natural environment serve as a draw to the gated
community concept, especially where such a property is also seen as a
recreational and vacation retreat (Zurinah & Jalaluddin, 2017). Nevertheless,
much of the demand for this kind of housing comes from those who value
security, even though other factors such as the facilities and landscaped
surroundings provided by the housing developer are also relevant. The physical
elements of security are regarded as paramount to the maintenance of safety and
the curbing of crime. In this regard, important elements of security, when
accorded proper consideration, play important roles in ensuring the development
of a community that is safe, robust and sustainable, leading to equitable and
desired social development. The present study seeks to establish the priority
among the various elements of physical security in a gated community so that
such selected characteristics may be incorporated into their development to
address the problems of crime that is on the rise in many cities. Elements of
physical security in a gated community are important factors in crime control.
Several issues frequently arise concerning the physical planning of gated
communities and guarded neighborhoods, such as the construction of
unauthorised guard houses, the size of fences or the construction of physical
PLANNING MALAYSIA
Journal of the Malaysia Institute of Planners (2018)
15 © 2018 by MIP
barriers to meet security requirements. Many constructions within gated
communities do not incorporate the basic principles of crime prevention through
environmental design in drawing up security elements to control crime.
Identifying priorities in the planning of physical safety elements in the
development of the gated community is essential to increase the level of planning
of physical safety and public security in the development of the gated community
as a security requirement. Hence the aim of this study is to focus on the planning
of physical safety elements in the development of gated community housing.
RESEARCH BACKGROUND
Demand for Gated Communities Cities
The rise in demand for gated communities in cities is due to the perceived
superior quality of life associated with such housing (Polanska, 2010). Gated
communities are located within fences and walls that serve as barriers, while
adequate lighting a security and alarm system, and uniformed security personnel
at entrances prevent unauthorized entry complete the picture of a protected and
secure haven.
The housing developer examines the security needs of the community
and addresses these requirements at the stage when aspects of security are being
planned (Wilson-Doenges, 2000). One obvious way to inject high security in a
housing scheme is through implementation of the gated community. Blakely and
Snyder (1997) note that the developer of a gated community would usually
emphasize the concept of a ‘community’ to promote the project. Many purchasers
of properties in gated communities are, in fact, attracted to the concept of living
in and being part of a planned ‘community’ (Wilson-Doenges, 2000). There is
the perception that members of a community would be more co-operative in
looking after shared property while safeguarding territoriality.
The burgeoning development of gated communities in the country in
recent years has resulted in various urban residential areas being closed off to
traffic. Clement and Grant (2012) characterize gated communities or settlements
by their sharing of private roads while allowing only restricted access. The denial
of access to non-residents who have no specific business or purpose to be in the
area should deter criminals from targeting the residents. Normally, a security post
would be situated at the access gate to enable security personnel to screen visitors.
For this purpose, round-the-clock security can be provided by teams of security
guards on rotating shifts. The presence of a security post is indicative of the
housing developer having taken cognizance of the residents’ desire for
heightened security in the area.
The security guardhouse is normally located at the main entrance of the
gated community with separate lanes for residents and visitors. The guardhouse
could be equipped with automatic gates, CCTV cameras and monitors, and
Zurinah Tahir & Jalaluddin Abdul Malek
Prioritizing the Physical Security Elements of Gated Community Housing Using the Analytical Hierarchy Process (AHP)
© 2018 by MIP 16
continuously manned by security guards on shift duty to monitor entry into the
property (Zurinah & Khadijah, 2011). Residents, on the other hand, would be
given pass cards that can activate the automatic gates and doors to the foyers of
their apartment buildings. Car stickers affixed to the windscreens of vehicles are
another way to restrict unauthorized vehicular traffic. Besides this, each point of
entry would be equipped with an intercom system and video camera to monitor
the movement of visitors. Although some public roads and other amenities may
be, strictly speaking, public-owned, non-residents in a gated community are not
allowed to use them. Because of the high costs of maintaining security, it is not
uncommon in some places like the United States to have guard posts actually
unmanned. The guardhouses and dummy CCTV cameras are installed only as a
deterrent to outsiders by giving the appearance of security personnel on duty.
Besides deterring crime, regulating vehicular traffic into a guarded community
also benefits children in the community by providing them with a safe
environment (Blakely & Snyder, 1997). Parents, who would otherwise be
apprehensive, can allow their children to be out on their own, on walkways, at
playgrounds, swimming pools, club houses and open recreational spaces, without
fear and anxiety of their being harmed by outsiders (Zurinah & Jalaluddin, 2018).
Physical Security Elements in the Development of a Gated Community
The elements of security are of utmost importance in planning gated community
housing (Zurinah & Jalaluddin, 2017). The foremost principle in designing a
gated community is a focus on the elements of security; this involves integrated
approaches encompassing the quality of the surroundings, protection of the
natural environment, lighting, access and maintenance of pedestrian walkways,
open spaces and their upkeep. The design of a gated community should take into
consideration overall surveillance, territoriality, social spaces, management and
maintenance, and physical security (Armitage, Monchuk, & Rogerson, 2011).
The present study is focused on selected elements of physical security in the
development of gated communities.
The level of security which a gated community enjoys serves as an
indicator of the physical safety of a residential area. Physical characteristics that
account for security include the environment (common places), security walls and
fences in the gated community. A strategy commonly adopted by the project
developer to enhance security is the implementation of physical security
measures that restrict access, such as walls, fences, guard houses (Lai, 2016) or
electronically operated gates. According to Reynald (2009), opportunities for the
commitment of crime depend largely on the dimension of territoriality manifested
in the form of actual physical barriers that may also serve symbolically to show
that the area within is a protected area. Besides perimeter walls, other dimensions
of territoriality, actual or symbolic, also serve as visible deterrents.
PLANNING MALAYSIA
Journal of the Malaysia Institute of Planners (2018)
17 © 2018 by MIP
With its many security installations such as walls, alarms, CCTV
surveillance and security personnel, the gated community arguably provides a
safer living environment compared to other residential areas. An intercom system
connects residents to the guardhouse so that security personnel can verify the
guests arriving at the gate; the security personnel can also be immediately alerted
of any emergency or suspected intrusion so that they can come to the assistance
of the affected residents. The gated community places emphasis on security by
rendering it a private area, out of bounds to non-residents. In an assessment by
Landman (2012:249) on the entry into and exit from gated communities, control
of the gates is frequently by in-house personnel, although it is sometimes
contracted out to commercial security companies. Lighting, another important
element of physical security, varies in terms of intensity, colour, direction and
contrast. In this regard, the appropriate specifications of physical security can go
a long way to improving surveillance and the perception of security to reduce the
threat of criminal activity (Ekblom, 2011).
CCTVs increase effectiveness in maintaining security. Security
personnel need only to keep tab of activity displayed on the TV monitors, thus
cutting down on the frequency of patrols (Zurinah & Jalaluddin, 2017). Normally,
cameras are installed at entrance and exit points, but they may also be installed in
other locations where people and vehicles are scanned and recorded. Such
recordings would assist the police in apprehending the suspect in the event of a
crime reported in the gated community. Nevertheless, if the CCTV system is to
be used as a preventive measure, rather than as an investigative aid after the event,
security personnel would have to be assigned to the TV monitor to detect wrong-
doing in real time.
The mechanism involved in crime reduction calls for attention to be paid
to physical changes, where necessary, in the re-structuring of the layout of the
existing housing area, such as by deviating or closing some roads (Armitage et
al., 2010). Nonetheless, such efforts are often insufficient to deter crime
completely because criminals shy away from obvious security installations or the
eyes of neighbours, preferring routes that provide shelter from detection, such as
walls, vegetation and landscape features, poorly lighted areas and so forth. Hence,
a battery of more concrete elements of physical security is required to fight crime
within the gated community in the city. In their article, Wallis and Ford (1981)
listed four principal aspects in living that would help to curb crime. These are a
physical infrastructure program, a management plan, role of the police and social
interaction. In terms of physical infrastructure, it is necessary to increase lighting
in the residential area to remove blind spots that are vulnerable to crime (Witten
et al., 2012), set up a guardhouse with CCTV camera facilities, set up a perimeter
buffer, to close certain roads traversing the gated community, to erect security
fences/walls, to build up the image of the community, and to landscape the
surroundings (Zurinah & Jalaluddin, 2017).
Zurinah Tahir & Jalaluddin Abdul Malek
Prioritizing the Physical Security Elements of Gated Community Housing Using the Analytical Hierarchy Process (AHP)
© 2018 by MIP 18
METHOD OF STUDY
This study was undertaken using the Analytical Hierarchy Process (AHP) where
the principle of comparative value was applied to ascertain the relative
importance of each criterion contributing to physical security in a gated
community. The AHP approach involves calculating the weightage that is
systematically assigned to arrive at the best decision in priority setting when
organizing and analysing variables in complex situations. The essential criteria
were selected based on previous research and from feedback obtained from 464
questionnaire respondents who were residents in five housing estates in the Johor
Bahru area that had adopted the gated community concept, viz. Taman Adda
Height, Bandar Dato’ Onn, Taman Setia Indah, Taman Setia Tropika, and Taman
Seri Austin. The data obtained were collated by five researchers with expertise in
the elements of physical security in gated communities. Two of the experts were
from the Federal Department of Town and Country Planning Peninsular Malaysia
and the Majlis Bandaraya Johor Bahru Town and Country Planning Department,
while three others were from housing developer companies with knowledge on
security set-ups in gated communities. The AHP technique was used to determine
the weightage assigned to each criterion under consideration for the physical
security of gated community housing. The determination of the final score for
each criterion was based on the outcome of the questionnaires submitted by
selected residents of gated communities and their interviews with the panel of
experts. Data for the various criteria were then compared using the Pair-wise
Comparison Method (PCM), whereby two criteria at a time were picked for a
head-to-head comparison.
FINDINGS AND DISCUSSION
Findings from this study provided an indication of the perception of residents
towards the six selected elements of physical security in Gated Communities, viz.
access, fencing, CCTV installation, lighting, guardhouse, and landscape.
Responses received from residents who offered their views on the relative
importance of the elements of security in a gated community were processed
using the AHP. The results of the analysis were as follows:
Prioritizing the Elements of Physical Security
A pairwise comparison of the criteria was used to determine the weightage
attached to each criterion, thereby indicating its relative importance among the
criteria studied in the AHP analysis. Each criterion was compared with all other
criteria, one pair at a time, and the results were computed with the aid of the
Microsoft Excel program. The relative importance of one criterion over another
with which it was compared was ranked on a scale from 1 to 9, with rank 1
indicating that the two criteria were ‘of equal importance’ and rank 9 indicating
that one criterion was ‘extremely more important’ than the other.
PLANNING MALAYSIA
Journal of the Malaysia Institute of Planners (2018)
19 © 2018 by MIP
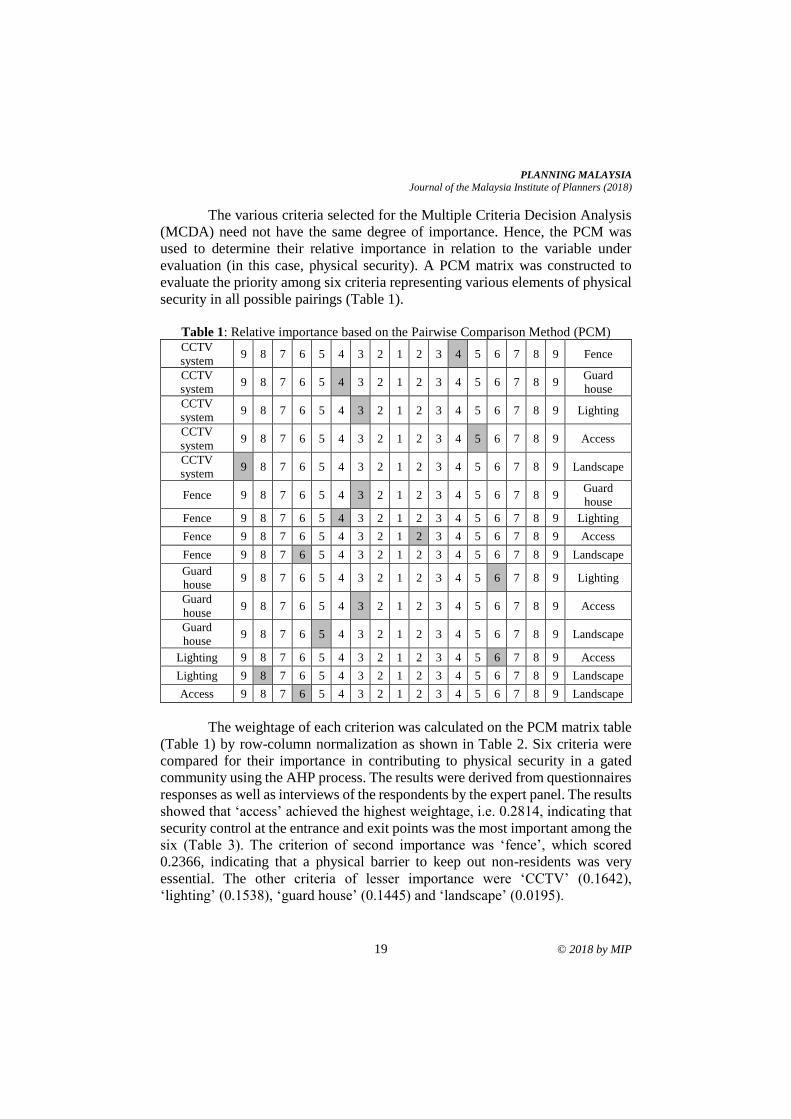
The various criteria selected for the Multiple Criteria Decision Analysis
(MCDA) need not have the same degree of importance. Hence, the PCM was
used to determine their relative importance in relation to the variable under
evaluation (in this case, physical security). A PCM matrix was constructed to
evaluate the priority among six criteria representing various elements of physical
security in all possible pairings (Table 1).
Table 1: Relative importance based on the Pairwise Comparison Method (PCM) CCTV
system 9 8 7 6 5 4 3 2 1 2 3 4 5 6 7 8 9 Fence
CCTV
system 9 8 7 6 5 4 3 2 1 2 3 4 5 6 7 8 9
Guard
house
CCTV
system 9 8 7 6 5 4 3 2 1 2 3 4 5 6 7 8 9 Lighting
CCTV
system 9 8 7 6 5 4 3 2 1 2 3 4 5 6 7 8 9 Access
CCTV
system 9 8 7 6 5 4 3 2 1 2 3 4 5 6 7 8 9 Landscape
Fence 9 8 7 6 5 4 3 2 1 2 3 4 5 6 7 8 9 Guard
house
Fence 9 8 7 6 5 4 3 2 1 2 3 4 5 6 7 8 9 Lighting
Fence 9 8 7 6 5 4 3 2 1 2 3 4 5 6 7 8 9 Access
Fence 9 8 7 6 5 4 3 2 1 2 3 4 5 6 7 8 9 Landscape
Guard
house 9 8 7 6 5 4 3 2 1 2 3 4 5 6 7 8 9 Lighting
Guard
house 9 8 7 6 5 4 3 2 1 2 3 4 5 6 7 8 9 Access
Guard
house 9 8 7 6 5 4 3 2 1 2 3 4 5 6 7 8 9 Landscape
Lighting 9 8 7 6 5 4 3 2 1 2 3 4 5 6 7 8 9 Access
Lighting 9 8 7 6 5 4 3 2 1 2 3 4 5 6 7 8 9 Landscape
Access 9 8 7 6 5 4 3 2 1 2 3 4 5 6 7 8 9 Landscape
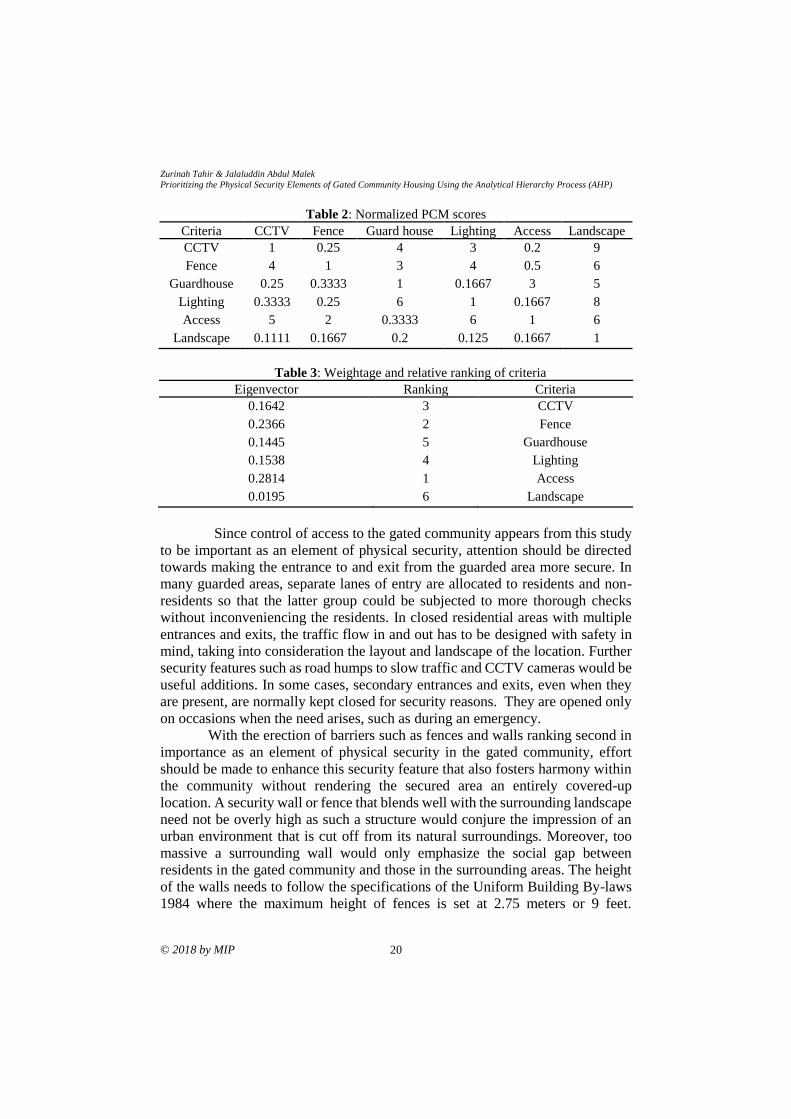
The weightage of each criterion was calculated on the PCM matrix table
(Table 1) by row-column normalization as shown in Table 2. Six criteria were
compared for their importance in contributing to physical security in a gated
community using the AHP process. The results were derived from questionnaires
responses as well as interviews of the respondents by the expert panel. The results
showed that ‘access’ achieved the highest weightage, i.e. 0.2814, indicating that
security control at the entrance and exit points was the most important among the
six (Table 3). The criterion of second importance was ‘fence’, which scored
0.2366, indicating that a physical barrier to keep out non-residents was very
essential. The other criteria of lesser importance were ‘CCTV’ (0.1642),
‘lighting’ (0.1538), ‘guard house’ (0.1445) and ‘landscape’ (0.0195).
Zurinah Tahir & Jalaluddin Abdul Malek
Prioritizing the Physical Security Elements of Gated Community Housing Using the Analytical Hierarchy Process (AHP)
© 2018 by MIP 20
Table 2: Normalized PCM scores
Criteria CCTV Fence Guard house Lighting Access Landscape
CCTV 1 0.25 4 3 0.2 9
Fence 4 1 3 4 0.5 6
Guardhouse 0.25 0.3333 1 0.1667 3 5
Lighting 0.3333 0.25 6 1 0.1667 8
Access 5 2 0.3333 6 1 6
Landscape 0.1111 0.1667 0.2 0.125 0.1667 1
Table 3: Weightage and relative ranking of criteria
Eigenvector Ranking Criteria
0.1642 3 CCTV
0.2366 2 Fence
0.1445 5 Guardhouse
0.1538 4 Lighting
0.2814 1 Access
0.0195 6 Landscape
Since control of access to the gated community appears from this study
to be important as an element of physical security, attention should be directed
towards making the entrance to and exit from the guarded area more secure. In
many guarded areas, separate lanes of entry are allocated to residents and non-
residents so that the latter group could be subjected to more thorough checks
without inconveniencing the residents. In closed residential areas with multiple
entrances and exits, the traffic flow in and out has to be designed with safety in
mind, taking into consideration the layout and landscape of the location. Further
security features such as road humps to slow traffic and CCTV cameras would be
useful additions. In some cases, secondary entrances and exits, even when they
are present, are normally kept closed for security reasons. They are opened only
on occasions when the need arises, such as during an emergency.
With the erection of barriers such as fences and walls ranking second in
importance as an element of physical security in the gated community, effort
should be made to enhance this security feature that also fosters harmony within
the community without rendering the secured area an entirely covered-up
location. A security wall or fence that blends well with the surrounding landscape
need not be overly high as such a structure would conjure the impression of an
urban environment that is cut off from its natural surroundings. Moreover, too
massive a surrounding wall would only emphasize the social gap between
residents in the gated community and those in the surrounding areas. The height
of the walls needs to follow the specifications of the Uniform Building By-laws
1984 where the maximum height of fences is set at 2.75 meters or 9 feet.
PLANNING MALAYSIA
Journal of the Malaysia Institute of Planners (2018)
21 © 2018 by MIP
According to guidelines laid down for the construction of walls or fencing of a
gated community, these structures have to be 50% open to allow visibility of the
housing area from the outside, so that it is not unduly secluded from the rest of
the neighbourhood.
The feature that ranked third in importance for security was the close
circuit TV camera. Residents in a gated community felt that the overt presence
of CCTV cameras served as a good deterrent against criminal activities.
Maleficent activities in different locations around the housing area could be
monitored in real time and images captured could be used to prosecute wrong
doers.
Next, the element of ‘lighting’ in the housing area was ranked fourth in
priority. Good lighting at night deters crime and enhances security, especially for
pedestrians. Adequate lighting is especially important in vulnerable places such
as back lanes and dark, secluded areas (Witten et al., 2012). Good lighting
complements CCTV recording because there needs to be adequate lighting to
enable the capture of recognizable facial features from a distance of 10 meters in
a video recording.
Further down the list of importance of elements of physical security is
the guard house. This is of course related to the criterion of highest importance
‘access’ since the guard house is commonly located at the access point allowing
security personnel to screen visitors to the gated community. Nevertheless, this
structure should not be located in such a way that it obstructs free flow of traffic.
In this regard, one that is sited on the road shoulder would be functional and
practical. The guard house is also used as a base station for surveillance patrols.
In considering physical security, the element of landscape should not be
neglected. Gated communities are commonly located in pleasant, green and safe
surroundings. In a passive way, a properly planned natural landscape has a
calming effect on the residents. The need for security notwithstanding, the
housing development should blend into the natural surroundings so that both
aesthetics and security are preserved. The layout of the land and the vegetation
play a part in the decision to install specific security measures. For example, the
topography of the land might give rise to blind spots that, unless remedied, escape
the CCTV camera or are off the route of routine patrols. Overly thick vegetation
should be avoided as it may shield criminals from the prying eyes of security
guards and CCTV cameras. Constant maintenance to take advantage of the
existing landscape is a means by which to reduce crime. The topography and
vegetation within a gated community should not, therefore, obstruct the view
from inside the fence looking out, or from outside the fence looking in. Security
personnel should have an unobstructed view of the area under surveillance. Trees
and plants should not be located too close to the fencing and they should not be
taller than the fence to provide an opportunity for intruders to circumvent the
fencing barrier.
Zurinah Tahir & Jalaluddin Abdul Malek
Prioritizing the Physical Security Elements of Gated Community Housing Using the Analytical Hierarchy Process (AHP)
© 2018 by MIP 22
CONCLUSION
Incorporating security measures in a gated community encompasses various
elements of physical security. Residents in a gated community expect to enjoy a
feeling of security and well-being in a well-guarded area with limited access to
outsiders. In this regard, particular attention needs to be placed on specific
elements of physical security, prioritized according to their relative importance.
The results of the present study showed adequate control of access to the housing
area to be the most important criterion. This was followed by the need for a
physical perimeter barrier such as a fence or wall. Other elements contributing to
security, ranked in order of their importance, were CCTV surveillance, good
lighting, the guard house, and lastly, the landscape, both natural and planted. The
findings of this study would be useful in the planning of gated communities. Such
a residential option is likely to continue to gain popularity in the future in view
of the demand for living areas that are secure and that provide quality life style.
New house buyers expect well-designed houses in an environment that offers
quality living where various services and facilities are included in an exclusive
package, and where a high level of physical security is assured. This study
highlights the important criteria in physical security that need to be taken into
consideration when embarking on such developments.
ACKNOWLEDGEMENT
This research was supported by a GGPM Grant (GGPM-2017-077). We would
like to thank anonymous reviewers for their valuable suggestions to improve this
article.
REFERENCES Abdullah, M. F., Mohd Daniar, N. A., Osman, M. M., & Bachok, S. (2017). Assessment
of gated community and guarded neighbourhood from public perspective.
Advanced Science Letters, 23(7), 6057-6059.
Armitage, R., Colquhoun, I., Ekblom, P., Monchuk, L., Pease, K., & Rogerson, M.
(2010). Residential design and crime – final report. London: CABE and Home
Office.
Armitage, R., Monchuk, L., & Rogerson, M. (2011). It looks good, but what is it like to
live there? Exploring the impact of innovative housing design on crime.
European Journal on Criminal Policy and Research, 17(1), 29-54.
Blakely, E. J., & Snyder, M. G. (1997). Divided we fall: Gated and walled communities
in the United State. In N. Ellin (Ed.), Architecture of fear (pp. 101-114). New
York: Princeton Architectural Press.
Clement, R., & Grant, J. L. (2012). Enclosing paradise: The design of gated communities
in Barbados. Journal of Urban Design, 17(1), 43-60.
Ekblom, P. (2011). Deconstructing CPTED… and reconstructing it for practice,
knowledge management and research. European Journal on Criminal Policy
and Research, 1(17), 7-28.
El-Ekhteyar, E., & Furlan, R. (2016). Sense of community in gated communities in Doha:
PLANNING MALAYSIA
Journal of the Malaysia Institute of Planners (2018)
23 © 2018 by MIP
The case of Al-Ein Compound in Ein Khaled Neighborhood. American Journal
of Sociological Research, 6(5), 126-134.
Furlan, R., & Petruccioli, A. (2016). Affordable housing for middle income expats in
qatar: strategies for implementing livability and urban form. International
Journal of Architectural Research, 10(3), 138-151.
Lai, L. W. C. (2016). “Stone walls do not a prison make, nor iron bars a cage”: The
institutional and communitarian possibilities of “gated communities”. Land Use
Policy, 54, 378-385.
Landman, K. (2012). Reconsidering crime and urban fortification in South Africa. In V.
Cecatto, (Ed.), Urban fabric of crime and fear (pp. 239-264). London: Springer.
Polanska, D. V. (2010). The emergence of gated communities in post-communist urban
context: And the reasons for their increasing popularity. Journal Housing and
the Built Environment, 25, 295-312.
Reynald, D. M. (2009). Guardianship in action: Developing a new tool for measurement.
Crime Prevention and Community Safety: An International Journal, 11(1), 1-20.
Smigiel, C. (2014). Reprint of “The production of segregated urban landscapes: A critical
analysis of gated communities in Sofia”. Cities, 36, 182-192.
Wallis, A., & Ford, D. (1980). Crime prevention through environmental design: An
operational handbook. United States of America: U. S. Department of Justice.
Wilson-Doenges, G. (2000). An exploration of sense of community and fear of crime in
gated communities. Environment and Behavior, 32(5), 597.
Witten, K., Blakely, T., Bagheri, N., Badland, H., Ivory, V., Pearce, J.,…& Schofield, G.
(2012). Neighborhood built environment and transport and leisure physical
activity: Findings using objective exposure and outcome measures in New
Zealand. Environmental Health Perspectives, 120(7), 971-977.
Zurinah Tahir & Khadijah Hussin. (2011). Security features in the gated community
housing development. International Conference on Management (ICM 2011)
Proceeding (pp. 397-404).
Zurinah Tahir & Jalaluddin Abdul Malek. (2017). Elements of security for a gated and
guarded community in the context of smart living. e-Bangi Journal, 12(3), 009.
Zurinah Tahir & Jalaluddin Abdul Malek. (2018). Kesesuaian lokasi pembangunan
perumahan komuniti berpagar di Johor Bharu. GEOGRAFIA: Malaysian
Journal of Society and Space, 14(2), 125-135.
1Senior Lecturer at Universiti Teknologi MARA, Malaysia. Email: [email protected] 24
PLANNING MALAYSIA:
Journal of the Malaysian Institute of Planners
VOLUME 16 ISSUE 3 (2018) Page 24 – 35
ILLEGAL HOUSE RENOVATIONS: IMPROVING THE RENOVATION
GUIDELINES OF A LOCAL AUTHORITY THROUGH PUBLIC
PARTICIPATION
Yazid Sarkom1
1Faculty of Architecture, Planning and Surveying
UNIVERSITI TEKNOLOGI MARA, MALAYSIA
Abstract
Illegal house renovations have created numerous problems to local councils in
Malaysia. Enforcement work have cost unnecessary financial burden to local
councils as well as losses to the house owners. Hence, this research is aimed at
investigating the issues associated with illegal house renovations in a local
council and exploring the responses from the local council’s stakeholders on the
possibility of involving the public in reframing the house renovation guidelines.
A qualitative research method of focus group discussion was held among the
related stakeholders in Ampang Jaya Municipal Council (MPAJ). The findings
indicated that the problems with illegal renovations are mainly due to the
unsuitable guideline itself, the level of understanding of the public, the
unrestrained small contractors and the complicated enforcement procedures. The
council’s stakeholders also agreed that more community involvement is
encouraged in restructuring the existing renovation guideline, but not to the extent
of giving the public all the rights to decide the final outcome.
Keywords: illegal house renovation, renovation guideline, public participation
PLANNING MALAYSIA
Journal of the Malaysia Institute of Planners (2018)
25 © 2018 by MIP
INTRODUCTION
An illegal building renovation is a building refurbishment or extension without
approved renovation plans by the local council or a renovation work that does not
adhere to the approved renovation plan. Approved building plans are important
to confirm the safety and health of the users and public. This paper aims to
investigate the issues of illegal house renovations and the role of public
participation in reforming renovation guidelines. A case study was conducted in
the Ampang Jaya Municipal Council (MPAJ), Selangor, a neighboring local
council to the capital city of Malaysia, Kuala Lumpur. MPAJ is a local council
that has evolved from a small tin mining town in a Klang Valley to become a
locality of 600,000 people in the year 2009 (MPAJ official portal). Being the
eight most densely inhabited local Authority in Malaysia (Jaafar 2004), MPAJ
was chosen as a case study to investigate the issue due to its diversity in the social
and economic status of the residents. To achieve the aim, the objectives of this
study are initiated by attempting to investigate whether the building renovation
guidelines of the local council reflect the needs of the community. Subsequently,
the study seeks to gauge the stance of the stakeholders on the need of public
involvement in drawing up the renovation guidelines; and lastly, the study
attempts to explore the public participation models that can enhance the process
of house renovation guidelines.
RESEARCH BACKGROUND
Studies in several parts of the world on house renovation compliance with the
local authority’s requirements have found out several reasons for non-
compliance. A research conducted in Old Salt, Jordan by Alnsour and Meaton
(2009) revealed that the diversity in the social and financial status of a community
as well as the level of understanding of the regulation affects the obedience to
building regulations. Meanwhile, Rukwaro (2009), in his study in Nairobi, Kenya
revealed that incompatible building guidelines with the community’s necessity
contributed to illegal building works. He also cited that Elaziah (1988) exposed
that the ineffective administration of enforcement works within the departments
of a local authority also contribute to the public’s confusion. Yau and Chiu (2015)
however, concluded that rising building penalty and enforcement are more
suitable to contain the issues of illegal building renovations in Hong Kong.
While building control is important to protect the safety of the public, some
studies suggested that the regulation also causes unnecessary burdens to the
people (Burby, Malizia, & May, 1999). The British government had organized a
thorough evaluation covering all aspects of building regulations to stimulate the
construction industry and to improve the economy (The Guardian, 2012). On the
same note, the American president, Mr. Donald Trump has also recognized these
circumstances and had issued an Executive Order (EO) 13777 on 24 February,
2017 to the American government agencies to evaluate the existing American
Yazid Sarkom
Illegal House Renovations: Improving the Renovation Guidelines of a Local Authority Through Public Participation
© 2018 by MIP 26
regulations to make them less burdensome to the public (Office of the Federal
Register, 2017). The EO subsequently required the relevant departments to
conduct public comment inputs. In Malaysia, the government has launched a new
program called National Transformation 2050 “TN50” on 19 January 2017.
Many of the government agencies have embarked on the new program which
calls for more public engagements. For example, the police force has initiated a
community engagement programme called “Talk to Us” which has obtained a
very good feedback from the community (Bernama, 2017).
Building renovation guidelines in local authorities regulate house
renovations in Malaysia. While state authorities in Malaysia have the Town and
Country Planning Act (Act 172) for new housing projects, renovation guidelines
are mainly left by the state planning authorities to local authorities to formulate.
For example, the Manual Guideline and Selangor State Planning Standards
(JPBD Selangor, 2010) states the planning requirements of new buildings, but
does not state clearly the requirements for building renovations. Thus, local
authorities set the renovation guidelines according to the local requirements as
long as not to contravene with the Road, Drainage and Building Act (Act 133)
and the Uniform Building By-laws (UBBL) 1984.
The state planning department has also incorporated public participation
in their planning processes, as required by Act 172. However, the approach has
not transformed much, although many new forms of public participation have
been developed (Maidin, 2011). Act 172 only allows the public to give opinions
and responses while the local authority’s committee will decide the final
outcome. So, this study will inquire the stakeholders on whether the public should
be involved in the framing of the renovation guidelines and to what extent should
they be allowed to participate.
RESEARCH METHODOLOGY
A qualitative research of focus group discussion was conducted in MPAJ
consisted of stakeholders involved in the approval of house renovation plan.
There were five directors and two deputy directors from MPAJ, representing
Planning Department, Building Department, Engineering Department, Legal
Department, Valuation and Asset Management Department, Enforcement
Department and Urban Management Department. Others in attendance were an
architect, an engineer, two registered building draftsmen and a MPAJ local
councilor. The discussion took place at the MPAJ main office building and the
session lasted for about 2 hours and 15 minutes. The medium of discussion is
mainly Malay language with English language used intermittently. The group
was guided by a set of key themes according to the three objectives of this study.
However, the participants were allowed to develop their own views and
judgments with minimal intervention along the session. The focus group
discussion was aided by a visual presentation and was digitally recorded by using
PLANNING MALAYSIA
Journal of the Malaysia Institute of Planners (2018)
27 © 2018 by MIP
two audio-recorders and the audio recordings were then transcribed into English
language text.
FINDINGS AND RESULTS
From the focus group discussion, several key issues have been discovered in
relation to the topics outlined in the focus group process. For the purpose of data
analysis, the issues raised throughout the discussion were then rearranged
according to the following categories.
Issues Associated with House Renovations in MPAJ
The Renovation Guidelines
There were several problems raised with regards to the existing renovation
guideline itself. In the first place, the term “guideline” was questioned by
participant A. He argued that a procedure in a local council can only become a
guideline if it was endorsed by the State Government. However, participant B
explained that as practiced by many local councils, the local rules still apply since
local councils have the power to make their own exclusive procedures as vested
to them via the Local Government Act 1976 (Act 171). This situation, however,
has created conflicting requirements and procedures of house renovation
guidelines among the local authorities in Selangor and other states in Malaysia.
When the focus group was questioned whether the renovation guidelines
has served the community’s need, participant B explained that since the formation
of MPAJ in 1992, the current MPAJ’s renovation guideline has undergone
various changes to accommodate the inspirations of the Yang Dipertua (Mayor)
of the council and local councilors of the day, or to rationalize certain irregular
issues that emerged. The Mayor and councillors keep changing due to their two-
year term appointments and they may be renewed or replaced after they have
served their terms on the council. All the renovation guideline’s changes were
endorsed by the council’s full board meeting after reviews and revisions by the
planning and building committee of MPAJ which consists of technical
departments and local councillors. However, participant C insisted that even
though the guideline was endorsed by the local council, it should tally with the
state planning guidelines. Nonetheless, as mentioned previously, the state
planning guideline is mainly for a new housing scheme, not for renovation of an
existing house. Another pertinent issue is all the changes were done without
directly involving the public consultation, thus, all the changes do not really
reflect the public needs as a whole.
Participant F informed that among the problems that the public normally
faced with the current MPAJ’s guideline is the regulation on building setback,
citing that the current setback requirement for renovation is too stringent. “If the
public knows that their proposed renovation can be approved by the council, then
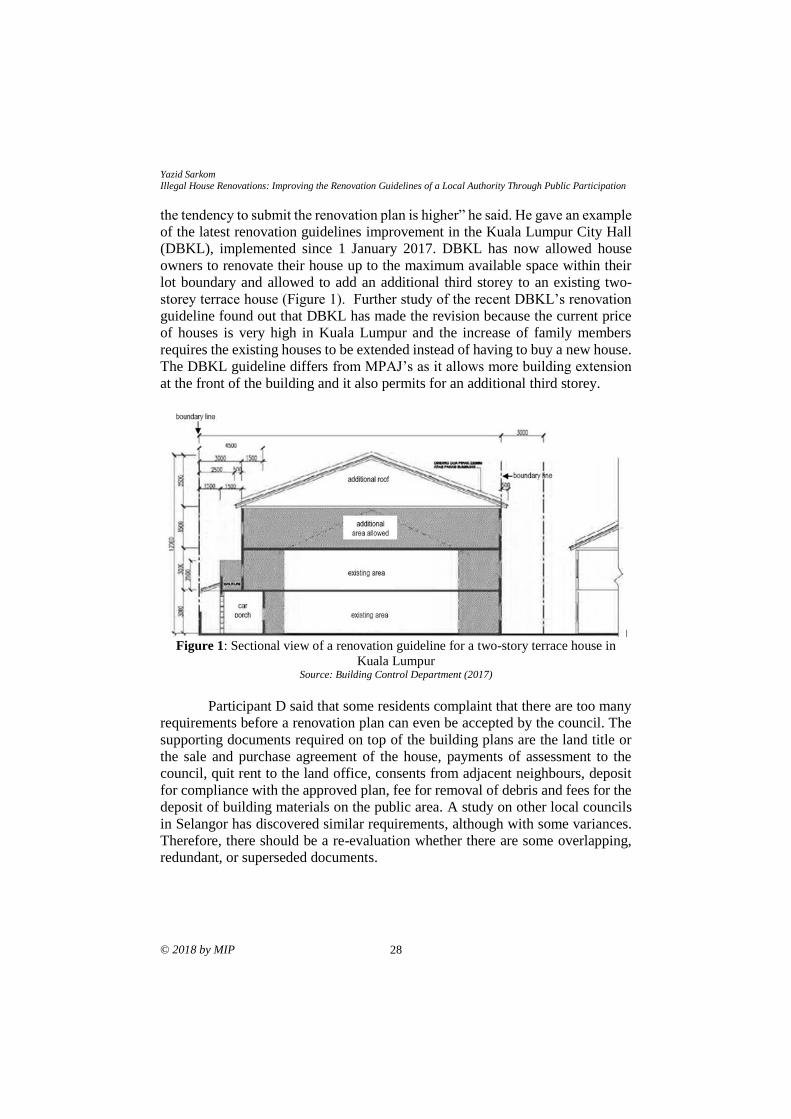
Yazid Sarkom
Illegal House Renovations: Improving the Renovation Guidelines of a Local Authority Through Public Participation
© 2018 by MIP 28
the tendency to submit the renovation plan is higher” he said. He gave an example
of the latest renovation guidelines improvement in the Kuala Lumpur City Hall
(DBKL), implemented since 1 January 2017. DBKL has now allowed house
owners to renovate their house up to the maximum available space within their
lot boundary and allowed to add an additional third storey to an existing two-
storey terrace house (Figure 1). Further study of the recent DBKL’s renovation
guideline found out that DBKL has made the revision because the current price
of houses is very high in Kuala Lumpur and the increase of family members
requires the existing houses to be extended instead of having to buy a new house.
The DBKL guideline differs from MPAJ’s as it allows more building extension
at the front of the building and it also permits for an additional third storey.
Figure 1: Sectional view of a renovation guideline for a two-story terrace house in
Kuala Lumpur Source: Building Control Department (2017)
Participant D said that some residents complaint that there are too many
requirements before a renovation plan can even be accepted by the council. The
supporting documents required on top of the building plans are the land title or
the sale and purchase agreement of the house, payments of assessment to the
council, quit rent to the land office, consents from adjacent neighbours, deposit
for compliance with the approved plan, fee for removal of debris and fees for the
deposit of building materials on the public area. A study on other local councils
in Selangor has discovered similar requirements, although with some variances.
Therefore, there should be a re-evaluation whether there are some overlapping,
redundant, or superseded documents.
PLANNING MALAYSIA
Journal of the Malaysia Institute of Planners (2018)
29 © 2018 by MIP
The Community
Some of the members of the community do not even know that they must submit
a renovation plan for their building renovation work and those who have done so
were often because they were also applying for a renovation loan from the banks
or the government, said participant B (the loan institutions normally require the
approved plan for a renovation loan approval). However, participant A stressed
that ignorance of the law is not an excuse for not abiding the law. He also added
that depending on whom the owners happen to meet, if they met a local
councillor, most probably the councillor would suggest the owner to submit
renovation plans before commencing any work. But, if they met a contractor,
probably the contractor would say they will handle everything from applying the
renovation approval and the construction work until completion. However, the
owners are normally not aware of the status of the renovation plan submission.
They are more interested to know that the construction work is progressing
uninterrupted. Most of them will only know that the renovation work is without
an approved plan after the building construction was completed and received the
summons by the court. Most of the contractors would keep the earlier notices
issued by the local council to themselves and not informing the house owners
until after the work completed. The owner then has to deal with the problem on
his own since usually it is difficult to get cooperation from the contractor when
the construction payment has been fully disbursed.
The community’s level of understanding about renovation plans was also
raised. Participant B highlighted that most members of the public are not well
versed of the technical jargons of the building plans. Sometimes, they cannot
visualise the approved building plan clearly, but as the construction is
progressing, they realise that it is not what they have imagined and changes have
to be done straight away without informing the local authority.
Having said that, the authority should not always entertain the public
complaints, said Participant B. Some house owners have not been sincere in their
applications for renovation plan approvals. They applied for small works using
standard plans provided by MPAJ but later, they renovated the house not
according to the approved plan, usually bigger than the approved one. This
situation is mainly due to cost savings, he said. For small renovations such as a
simple car porch or kitchen extension, the public can use standard plans provided
by MPAJ for a minimal fee, but for normal renovations they have to pay extra for
consultation fees to engage an architect or a building draftsman, and for two
storey renovations or above, they have to engage a structural engineer as well.
The Contractors
The occurrence of illegal renovations cannot be blamed squarely on the house
owners said participant C. He said that sometimes the owners are influenced by
the appointed contractor, especially those house owners who are staying in the
Yazid Sarkom
Illegal House Renovations: Improving the Renovation Guidelines of a Local Authority Through Public Participation
© 2018 by MIP 30
same house under renovation. When the owners observe the construction site too
often, the tendency to modify the design is higher and the contractors also
encourage the changes as they can increase the final construction cost.
Participant F lamented that small local contractors are facing stiff cost
competitions from foreign contractors (non- Malaysian). The house owners are
attracted to the lower construction costs offered by the foreign contractors even
though they know the risks that entail. The foreign contractors are normally a
group of tradesmen skilled in building construction, but without proper company
registration. They can offer lower construction cost, but when certain problems
arise, they can just disband and disappear. To encounter the problem, he
suggested local councils must assure that renovation contractors working in their
regions are registered with the Construction Industry Development Board
(CIDB).
A study on CIDB regulation revealed that it is in fact compulsory for a
construction company to register with CIDB no matter how small the company
is and the workers must also have green cards. But it seems that only CIDB and
not the local authority is responsible to enforce the company registration and the
green card regulation.
Talking about costs, participant F added that even though CIDB has
produced a standard agreement between a house owner and the contractor to
protect the owner against errant contractors or poor workmanship, most house
owners still opt to do without it as the contractors will normally charge more
construction cost if the standard agreement is used. He also suggested that every
local authority should keep a registration system of small contractors working in
their areas because there are some house owners who do not have a clue in finding
a good and reliable contractor. The registration system would then be very helpful
to the house owners and the council since the council can monitor smaller
construction companies.
The Enforcement
Issues with building control enforcement were also debated. Participant B
stressed that renovation works done by individual house owners are more difficult
to control than big projects done by housing developers because the big projects
have architects and consultants that can assure the adherence to the approved plan
since after the construction work completed they are responsible to issue the
Certificate of Completion and Compliance (CCC). Furthermore, the housing
developers must build the houses according to the approved plans since they must
also abide by the sale and purchase agreements with the house buyers. For small
projects, the role of contractors is crucial because the contractors seem to have
the upper hand over the main consultant in making most of the decision on the
site because they interact more often with the owners. The local authority,
however, views the main consultant as the party responsible for the construction.
PLANNING MALAYSIA
Journal of the Malaysia Institute of Planners (2018)
31 © 2018 by MIP
When there is a discrepancy on the site, the consultants often complaints that their
instructions are rarely followed by the owner.
Participant B added that building control enforcements in MPAJ have
faced difficulties since there are new and old housing developments, mixed
together in the nearby vicinity and there are already many houses renovated even
before the existence of MPAJ itself. As opposed to a new local authority in a new
area, such as Putrajaya, which since its inception, it has put in place the building
renovation guidelines and then the enforcement works can easily be done very
stringently since there is not much resistance from the community.
Deviations from the approved plans are quite common because of the
problems with enforcement method. Participant E explained that the enforcement
staffs will only act if the renovation work does not have the approval permit
displayed on the house front. If the approval permit is displayed, but there is a
deviation from the approved plan, they generally do not have the expertise to
determine such discrepancies. This situation happens because the enforcement
rounds are done by general duty enforcement staffs and not building department’s
technical staff.
Another issue with building control enforcement is when MPAJ decided
to bring a case to the Magistrate Court, the Deputy Public Prosecutor (DPP) of
the court will normally advise MPAJ to offer a compound to the house owner
instead of admitting the case to be heard in the court said participant B. A
compound is a form of enforcement, which the offender is offered to pay a certain
amount of penalty to MPAJ so that the case will not be tabled in the court. The
house owners will usually pay the compound and the case is considered closed,
but consequently, the illegal renovation remains standing. Furthermore, the court
very rarely issues a mandatory order of demolition for illegal house renovations
unless the renovations cause legal complaints from the immediate neighbours or
jeopardise the safety of the occupants or neighbours. Further investigation also
revealed that some local authorities prefer to issue compounds rather than
bringing the case to the court because the council will actually gain revenue from
the compounds. If the case is heard in the court and the court decides to fine the
guilty owner instead of giving a mandatory demolition order, the proceeds from
the fine will go to the court, not to the local authorities.
The Role of Public Participation
The Perception of Stakeholders on Public Participation
Participant D stressed the importance of public awareness because it is easier for
everyone if the public themselves are aware of the benefits of having an approved
plan for renovation work. He cited an example of an awareness campaign about
the strata title management on local television by The Ministry of Housing and
Local Government of Malaysia. He said the campaign has been very helpful to
Yazid Sarkom
Illegal House Renovations: Improving the Renovation Guidelines of a Local Authority Through Public Participation
© 2018 by MIP 32
educate apartment owners of the importance of paying maintenance fees. The
same can be done to inform the importance of submitting renovation plans. CIDB
can also play a role in awareness campaigns, he added. CIDB can educate the
small contractors about the procedure, the importance and benefits of having
approved renovation plans before commencing works on the site.
Participant A stated that as MPAJ already has local councillors, he
questioned whether another public participation process is needed since the
councilors themselves are the representative of the public. He also questioned
whether the public participation processes are for real or merely for the sake of
procedures because he is concerned that in the end, it is the local government law
that should also be reviewed. However, he also acknowledged that the current
trend of the government today is public engagement. Participant C added that
according to the state and federal policies, it is required that public inputs must
be included in audit verification reports and innovation competitions.
There was a conflict between the house renovation regulation and the
needs of the residents, participant D reiterated. Therefore, he really agreed that
the residents should be given opportunities to convey their ideas into the
formation of the guidelines. Participant C explained that there are two methods
of public participation in the procedure of the local plan formation in MPAJ: 1)
Focus group discussions; and 2) Resident involvements through road show
exercises. Publicity is also one of the requirements in the preparation of a local
plan and it must be advertised in local newspapers for 30 days. She also said that
renovation guidelines can also be included in one of the local plan programs by
including it in the term of references (TOR) of the focus group discussions.
However, she also cautioned whether MPAJ is ready to take the challenges if the
renovation guideline was included in the next local plan revision since MPAJ
must abide by the decision of the process. Any amendment or variation to the
agreed renovation guideline must be referred to the public first and this exercise
can be costly and time consuming.
Exploring the Public Participation Models that Can Enhance the Process of
House Renovation Guidelines
The focus group participants were explained about the relationship between
consultation techniques and levels of impact in the slide presentation. Excerpt of
the table is mentioned in Table 1. Shipley and Utz (2012) stated that public
participation models have developed over the years and the general guidelines on
the levels of community involvement suggests the expected results from different
types of public engagements in planning processes. It shows the link between the
public participation objectives and the increasing level of public impacts from
merely providing information, up to the highest level of total empowerment for
the public to make the final decision. Participant D said that at this juncture he
thought that MPAJ is not ready to let go the decision-making rights to the public
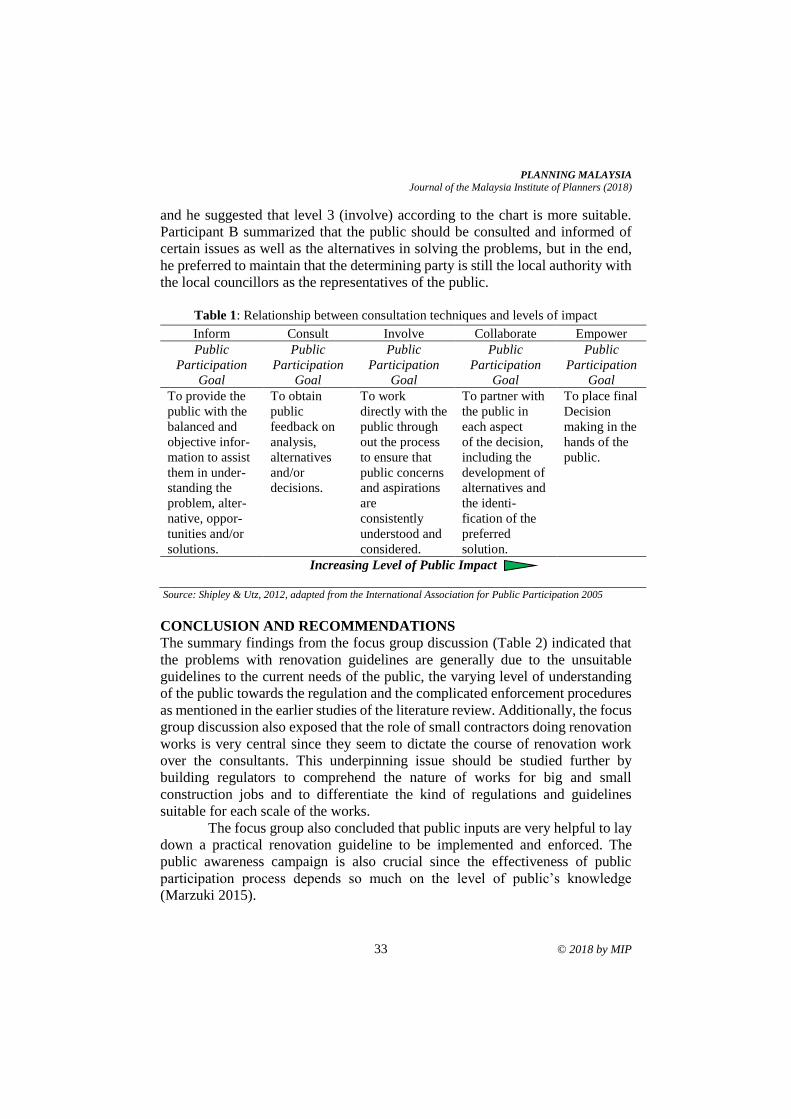
PLANNING MALAYSIA
Journal of the Malaysia Institute of Planners (2018)
33 © 2018 by MIP
and he suggested that level 3 (involve) according to the chart is more suitable.
Participant B summarized that the public should be consulted and informed of
certain issues as well as the alternatives in solving the problems, but in the end,
he preferred to maintain that the determining party is still the local authority with
the local councillors as the representatives of the public.
Table 1: Relationship between consultation techniques and levels of impact
Source: Shipley & Utz, 2012, adapted from the International Association for Public Participation 2005
CONCLUSION AND RECOMMENDATIONS
The summary findings from the focus group discussion (Table 2) indicated that
the problems with renovation guidelines are generally due to the unsuitable
guidelines to the current needs of the public, the varying level of understanding
of the public towards the regulation and the complicated enforcement procedures
as mentioned in the earlier studies of the literature review. Additionally, the focus
group discussion also exposed that the role of small contractors doing renovation
works is very central since they seem to dictate the course of renovation work
over the consultants. This underpinning issue should be studied further by
building regulators to comprehend the nature of works for big and small
construction jobs and to differentiate the kind of regulations and guidelines
suitable for each scale of the works.
The focus group also concluded that public inputs are very helpful to lay
down a practical renovation guideline to be implemented and enforced. The
public awareness campaign is also crucial since the effectiveness of public
participation process depends so much on the level of public’s knowledge
(Marzuki 2015).
Inform Consult Involve Collaborate Empower
Public
Participation
Goal
Public
Participation
Goal
Public
Participation
Goal
Public
Participation
Goal
Public
Participation
Goal
To provide the
public with the
balanced and
objective infor-
mation to assist
them in under-
standing the
problem, alter-
native, oppor-
tunities and/or
solutions.
To obtain
public
feedback on
analysis,
alternatives
and/or
decisions.
To work
directly with the
public through
out the process
to ensure that
public concerns
and aspirations
are
consistently
understood and
considered.
To partner with
the public in
each aspect
of the decision,
including the
development of
alternatives and
the identi-
fication of the
preferred
solution.
To place final
Decision
making in the
hands of the
public.
Increasing Level of Public Impact
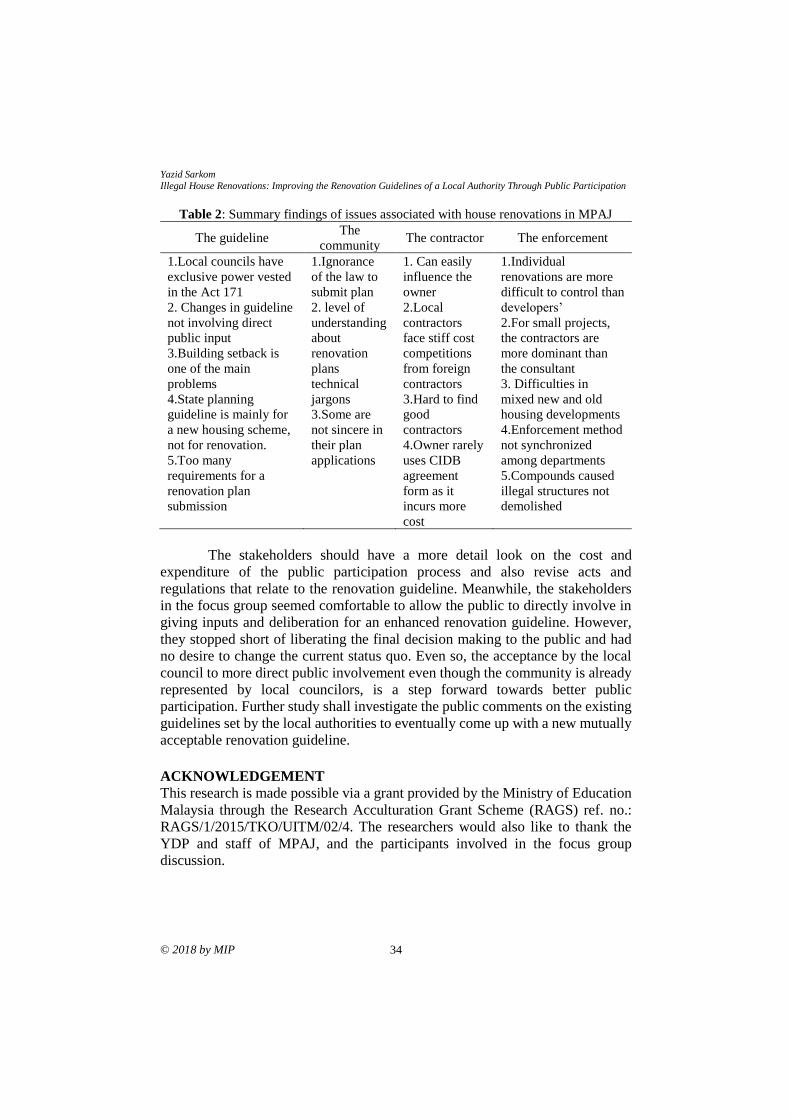
Yazid Sarkom
Illegal House Renovations: Improving the Renovation Guidelines of a Local Authority Through Public Participation
© 2018 by MIP 34
Table 2: Summary findings of issues associated with house renovations in MPAJ
The guideline The
community The contractor The enforcement
1.Local councils have
exclusive power vested
in the Act 171
2. Changes in guideline
not involving direct
public input
3.Building setback is
one of the main
problems
4.State planning
guideline is mainly for
a new housing scheme,
not for renovation.
5.Too many
requirements for a
renovation plan
submission
1.Ignorance
of the law to
submit plan
2. level of
understanding
about
renovation
plans
technical
jargons
3.Some are
not sincere in
their plan
applications
1. Can easily
influence the
owner
2.Local
contractors
face stiff cost
competitions
from foreign
contractors
3.Hard to find
good
contractors
4.Owner rarely
uses CIDB
agreement
form as it
incurs more
cost
1.Individual
renovations are more
difficult to control than
developers’
2.For small projects,
the contractors are
more dominant than
the consultant
3. Difficulties in
mixed new and old
housing developments
4.Enforcement method
not synchronized
among departments
5.Compounds caused
illegal structures not
demolished
The stakeholders should have a more detail look on the cost and
expenditure of the public participation process and also revise acts and
regulations that relate to the renovation guideline. Meanwhile, the stakeholders
in the focus group seemed comfortable to allow the public to directly involve in
giving inputs and deliberation for an enhanced renovation guideline. However,
they stopped short of liberating the final decision making to the public and had
no desire to change the current status quo. Even so, the acceptance by the local
council to more direct public involvement even though the community is already
represented by local councilors, is a step forward towards better public
participation. Further study shall investigate the public comments on the existing
guidelines set by the local authorities to eventually come up with a new mutually
acceptable renovation guideline.
ACKNOWLEDGEMENT
This research is made possible via a grant provided by the Ministry of Education
Malaysia through the Research Acculturation Grant Scheme (RAGS) ref. no.:
RAGS/1/2015/TKO/UITM/02/4. The researchers would also like to thank the
YDP and staff of MPAJ, and the participants involved in the focus group
discussion.
PLANNING MALAYSIA
Journal of the Malaysia Institute of Planners (2018)
35 © 2018 by MIP
REFERENCES Alnsour, J., & Meaton, J. (2009). Factors affecting compliance with residential standards
in the City of Old Salt, Jordan. Habitat International, 33, 301-309.
Ampang Jaya Municipal Council portal. Retrieved 28 August 2017 from http://www.
mpaj.gov.my/en/mpaj/ resources/statistics
Bernama (2017, August 1). Genovasi Malaysia training for more to improve efficiency.
The Sun Daily. Retrieved 16 Disember 2017, from https://www.the sundaily.
my/news/2017/08/01/genovasi-malaysia-training-more-improve-efficiency-
najib.
Building Control Department (2017). Renovation guideline for a two story terrace house
in Wilayah Persekutuan Kuala Lumpur. Kuala Lumpur: Kuala Lumpur City
Hall.
Burby, R. J., Malizia, E. E., & May, P. J. (1999). Beating the building code burden: Code
enforcement strategies and Central City success in capturing new housing.
College of Urban and Public Affairs (CUPA) Working Papers, 1991-2000. Paper
17.
Jaafar, J (2004). Emerging trends of urbanisation in Malaysia. Journal of Department of
Statistics, 1, 43-54.
Jabatan Perancangan Bandar dan Desa Negeri (JPBD) Selangor (2010). Manual guideline
and Selangor State planning standards (Second Edition). Selangor: Author.
Maidin, A. J. (2011). Access to public participation in the land planning and
environmental decision making process in Malaysia. International Journal of
Humanities and Social Science, 1(3), 148-169.
Marzuki, A. (2015). Challenges in the public participation and the decision making
process. Retrieved 28 August 2017, from
https://www.coursehero.com/file/29017319/2pdf/
Office of the Federal Register (US) (2017). Enforcing the regulatory reform agenda:
Department of Justice Task Force on Regulatory Reform Under E.O. 13777.
Retrieved 28 August 2017 from http://www.federalregister.gov
Rukwaro, R. W. (2009). The owner occupier democracy and violation of building by-
laws. Habitat International 33, 485-498.
Shipley, R., & Utz, S. (2012). Making it count: A review of the value and techniques for
public consultation. Journal of Planning Literature, 00(0), 1-21.
The Guardian (2012, October 26). Government orders building standards review. The
Guardian. Retrieved 28 August 2017, from
https://www.theguardian.com/politics /2012/oct/26/
government-building-standards-review-regulation.
Yau, Y., & Chiu, S. M. (2015). Combating building illegality in Hong Kong: A policy
Delphi study. Habitat International, 49, 349-356.
1Professor at Universiti Teknologi MARA, Malaysia. Email: [email protected] 36
PLANNING MALAYSIA:
Journal of the Malaysian Institute of Planners
VOLUME 16 ISSUE 3 (2018) Page 36 – 45
RURAL DEVELOPMENT AND THE LEVEL OF PUBLIC FACILITIES
PROVISION FOR YOUTH IN MALAYSIA
Dasimah Omar1, Kamarul Ariff Omar2, Zuriyati Kamaludin3, Saberi Othman4, &
Zaharah Mohd Yusoff5
1,2,3,5Faculty of Architecture, Planning and Surveying
UNIVERSITI TEKNOLOGI MARA, MALAYSIA
4UNIVERSITI PENDIDIKAN SULTAN IDRIS
Abstract
The national agenda consistently prioritised the rural development and poverty
eradications in Malaysia. The Rural Transformation Programme from 2016 till
2020 outlines six focus areas namely, Rural Infrastructure, Youth Development,
Economy, Entrepreneurship, Human Capital and Delivery System. Guided by
these principles, the strategies and programmes for rural development and
poverty eradication have focused on increasing the productivity as well as
improving the quality of life. The objective of this research is to evaluate the level
of usage and satisfaction towards facilities provided for youth living in the rural
areas. The study areas selected are Jengka, Pahang and Kota Samarahan,
Sarawak. The variables for the assessment include adequacy ratio, usage
satisfaction, accessibility and maintenance of existing public facilities. The
results were analysed to measure the level of provision of public facilities
provided for the youth who are living in rural areas. It was found that public
facilities including multipurpose hall, public library, mosque, temple and church
are provided in both study areas. However, their usage among the youth was
rather discouraging, except for mosque, musolla and church.
Keywords: youth, rural development, public facilities, utilisation, satisfaction
PLANNING MALAYSIA
Journal of the Malaysia Institute of Planners (2018)
37 © 2018 by MIP
INTRODUCTION
Malaysia has had a long and far reaching experience in developing its rural sector
and bringing down the incidence of poverty from 58.7% in 1970 to 1.6% in 2014
(Ministry of Rural Development, n.d.). The rural programmes are considered as
efficient, agile and effective. These efforts, together with the continuous growth
of the Malaysian economy have succeeded in creating job opportunities that leads
to higher income in rural areas. The Rural Transformation Programme with the
theme of Rural Modernisation was launched in 2015. The objective was to ensure
the rural areas are provided with public facilities and accessibility akin to urban
standard. Every village in Malaysia will be connected via roads, 24 hours
electricity and treated water by 2020.
Youth is indicated as a person between the age where he/she may leave
compulsory education, and the age at which he/she finds his/her first employment
(Omar, Omar, Othman, & Mohd Yusoff, 2016). In Malaysian context, there were
13.3 million youth population age between 15-40, representing 46% of the total
Malaysian population (Raja Kasim, Zulkharnain, Hashim, Wan Ibrahim, &
Yusof, 2014). However, the total number of youth involvement in youth societies
or organisation in Malaysia is only 23% or 3,157,900 million (Yeon et al., 2016).
Youth should dynamically take part in community programmes in making the
society more liveable and efficient to all age group inside the community social
hierarchy. The Malaysian Youth Policy (MYP) had replaced the National Youth
Development Policy (NYDP) 1997. Gradually, the age limit is now changing
from 15 to 30. The Secretary-General of the United Nations Population Fund said,
‘The world has the largest younger generation in history. I place great hope in
their power to shape our future’ (UNFPA, 2015). He mentioned the youth as the
hope of future since they see the world with fresh eyes and represent a staggering
amount of human potential. Yet too many of them are trapped in poverty, with
few opportunities to learn or to earn a decent living.
LITERATURE REVIEW
The public facilities provided for youth in rural areas must be in accordance with
the needs of the youth. This will encourage them to visit and utilise public
facilities provided near their settlement. Indirectly, this will increase the social
interaction among youth in rural areas.
Youth in rural communities also have another set of education-related
issues that compound economic factors (Smith, 2014). Because of distance and
inadequate transportation, rural youth have fewer opportunities for important
unstructured social interaction, creating insufficient social support for healthy
behaviours and reliance on accessible, structured public programmes (Edwards,
Miler, & Blackburn, 2011). Therefore, rural development is to urbanise the rural
area into a conducive area with excellent access to modern infrastructure,
entrepreneurship, high income, preservation of environment and cultures
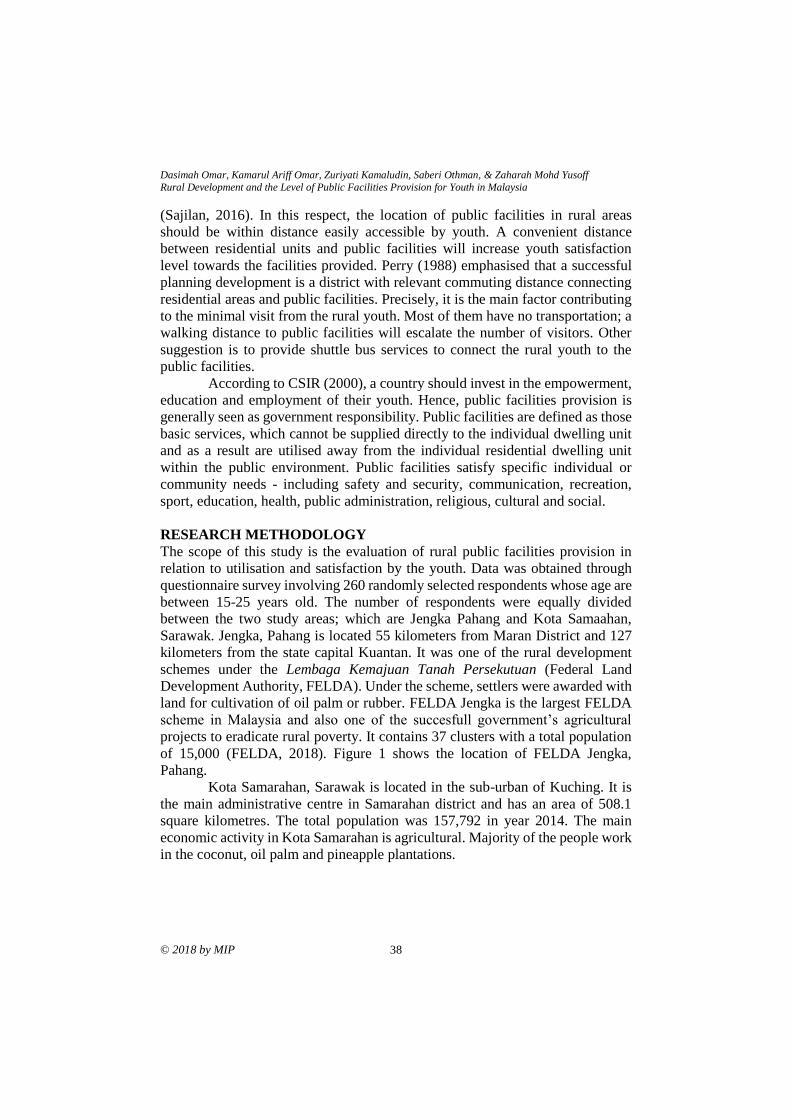
Dasimah Omar, Kamarul Ariff Omar, Zuriyati Kamaludin, Saberi Othman, & Zaharah Mohd Yusoff
Rural Development and the Level of Public Facilities Provision for Youth in Malaysia
© 2018 by MIP 38
(Sajilan, 2016). In this respect, the location of public facilities in rural areas
should be within distance easily accessible by youth. A convenient distance
between residential units and public facilities will increase youth satisfaction
level towards the facilities provided. Perry (1988) emphasised that a successful
planning development is a district with relevant commuting distance connecting
residential areas and public facilities. Precisely, it is the main factor contributing
to the minimal visit from the rural youth. Most of them have no transportation; a
walking distance to public facilities will escalate the number of visitors. Other
suggestion is to provide shuttle bus services to connect the rural youth to the
public facilities.
According to CSIR (2000), a country should invest in the empowerment,
education and employment of their youth. Hence, public facilities provision is
generally seen as government responsibility. Public facilities are defined as those
basic services, which cannot be supplied directly to the individual dwelling unit
and as a result are utilised away from the individual residential dwelling unit
within the public environment. Public facilities satisfy specific individual or
community needs - including safety and security, communication, recreation,
sport, education, health, public administration, religious, cultural and social.
RESEARCH METHODOLOGY
The scope of this study is the evaluation of rural public facilities provision in
relation to utilisation and satisfaction by the youth. Data was obtained through
questionnaire survey involving 260 randomly selected respondents whose age are
between 15-25 years old. The number of respondents were equally divided
between the two study areas; which are Jengka Pahang and Kota Samaahan,
Sarawak. Jengka, Pahang is located 55 kilometers from Maran District and 127
kilometers from the state capital Kuantan. It was one of the rural development
schemes under the Lembaga Kemajuan Tanah Persekutuan (Federal Land
Development Authority, FELDA). Under the scheme, settlers were awarded with
land for cultivation of oil palm or rubber. FELDA Jengka is the largest FELDA
scheme in Malaysia and also one of the succesfull government’s agricultural
projects to eradicate rural poverty. It contains 37 clusters with a total population
of 15,000 (FELDA, 2018). Figure 1 shows the location of FELDA Jengka,
Pahang.
Kota Samarahan, Sarawak is located in the sub-urban of Kuching. It is
the main administrative centre in Samarahan district and has an area of 508.1
square kilometres. The total population was 157,792 in year 2014. The main
economic activity in Kota Samarahan is agricultural. Majority of the people work
in the coconut, oil palm and pineapple plantations.
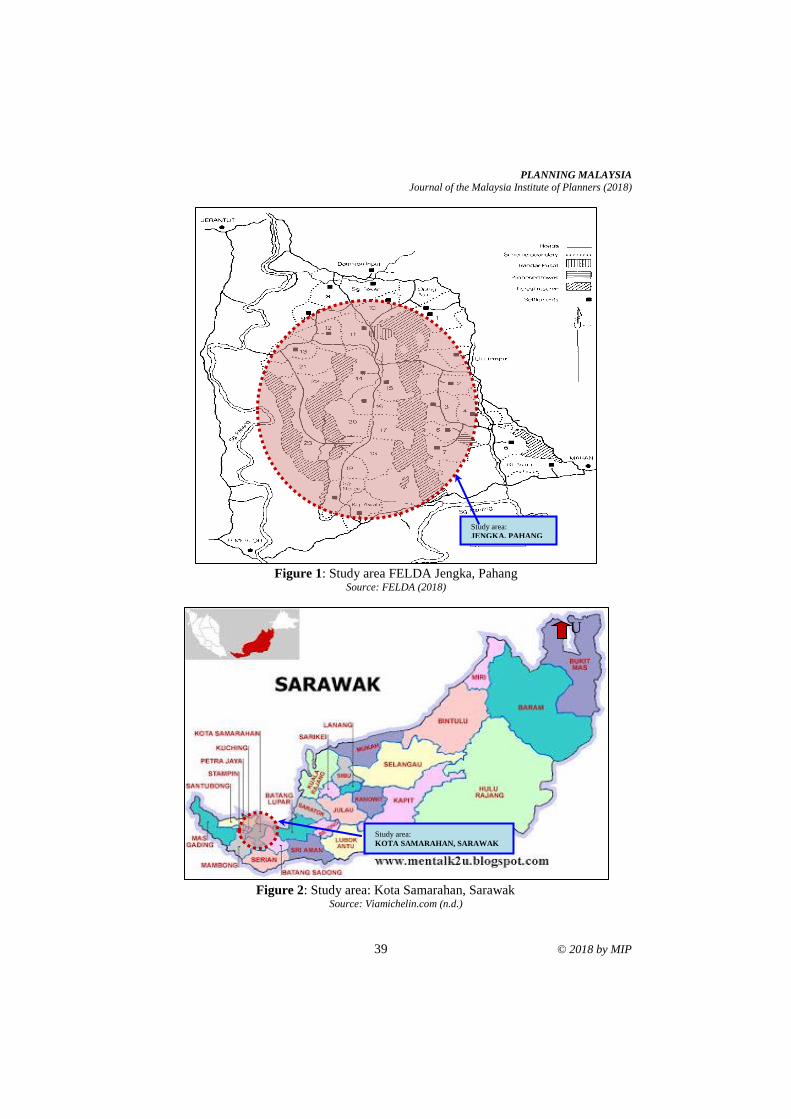
PLANNING MALAYSIA
Journal of the Malaysia Institute of Planners (2018)
39 © 2018 by MIP
Figure 1: Study area FELDA Jengka, Pahang
Source: FELDA (2018)
Figure 2: Study area: Kota Samarahan, Sarawak
Source: Viamichelin.com (n.d.)
Study area:
JENGKA, PAHANG
Study area:
KOTA SAMARAHAN, SARAWAK
U
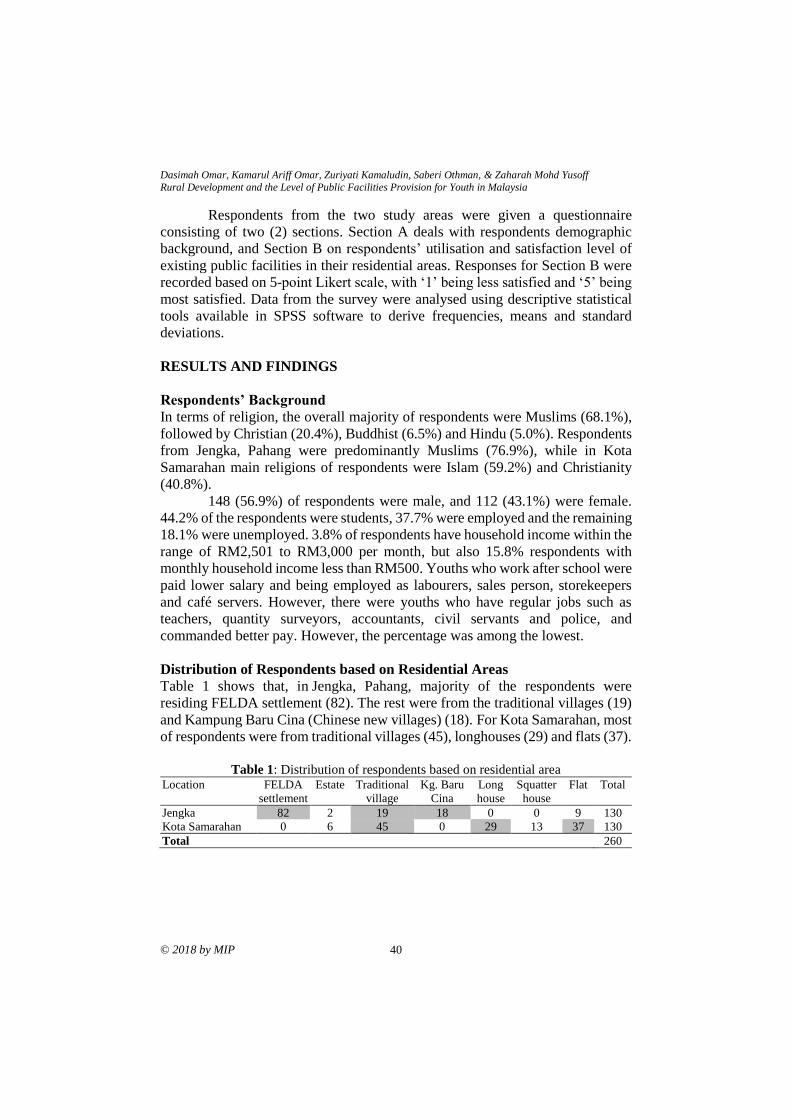
Dasimah Omar, Kamarul Ariff Omar, Zuriyati Kamaludin, Saberi Othman, & Zaharah Mohd Yusoff
Rural Development and the Level of Public Facilities Provision for Youth in Malaysia
© 2018 by MIP 40
Respondents from the two study areas were given a questionnaire
consisting of two (2) sections. Section A deals with respondents demographic
background, and Section B on respondents’ utilisation and satisfaction level of
existing public facilities in their residential areas. Responses for Section B were
recorded based on 5-point Likert scale, with ‘1’ being less satisfied and ‘5’ being
most satisfied. Data from the survey were analysed using descriptive statistical
tools available in SPSS software to derive frequencies, means and standard
deviations.
RESULTS AND FINDINGS
Respondents’ Background
In terms of religion, the overall majority of respondents were Muslims (68.1%),
followed by Christian (20.4%), Buddhist (6.5%) and Hindu (5.0%). Respondents
from Jengka, Pahang were predominantly Muslims (76.9%), while in Kota
Samarahan main religions of respondents were Islam (59.2%) and Christianity
(40.8%).
148 (56.9%) of respondents were male, and 112 (43.1%) were female.
44.2% of the respondents were students, 37.7% were employed and the remaining
18.1% were unemployed. 3.8% of respondents have household income within the
range of RM2,501 to RM3,000 per month, but also 15.8% respondents with
monthly household income less than RM500. Youths who work after school were
paid lower salary and being employed as labourers, sales person, storekeepers
and café servers. However, there were youths who have regular jobs such as
teachers, quantity surveyors, accountants, civil servants and police, and
commanded better pay. However, the percentage was among the lowest.
Distribution of Respondents based on Residential Areas Table 1 shows that, in Jengka, Pahang, majority of the respondents were
residing FELDA settlement (82). The rest were from the traditional villages (19)
and Kampung Baru Cina (Chinese new villages) (18). For Kota Samarahan, most
of respondents were from traditional villages (45), longhouses (29) and flats (37).
Table 1: Distribution of respondents based on residential area
Location FELDA
settlement
Estate Traditional
village
Kg. Baru
Cina
Long
house
Squatter
house
Flat Total
Jengka 82 2 19 18 0 0 9 130
Kota Samarahan 0 6 45 0 29 13 37 130
Total 260
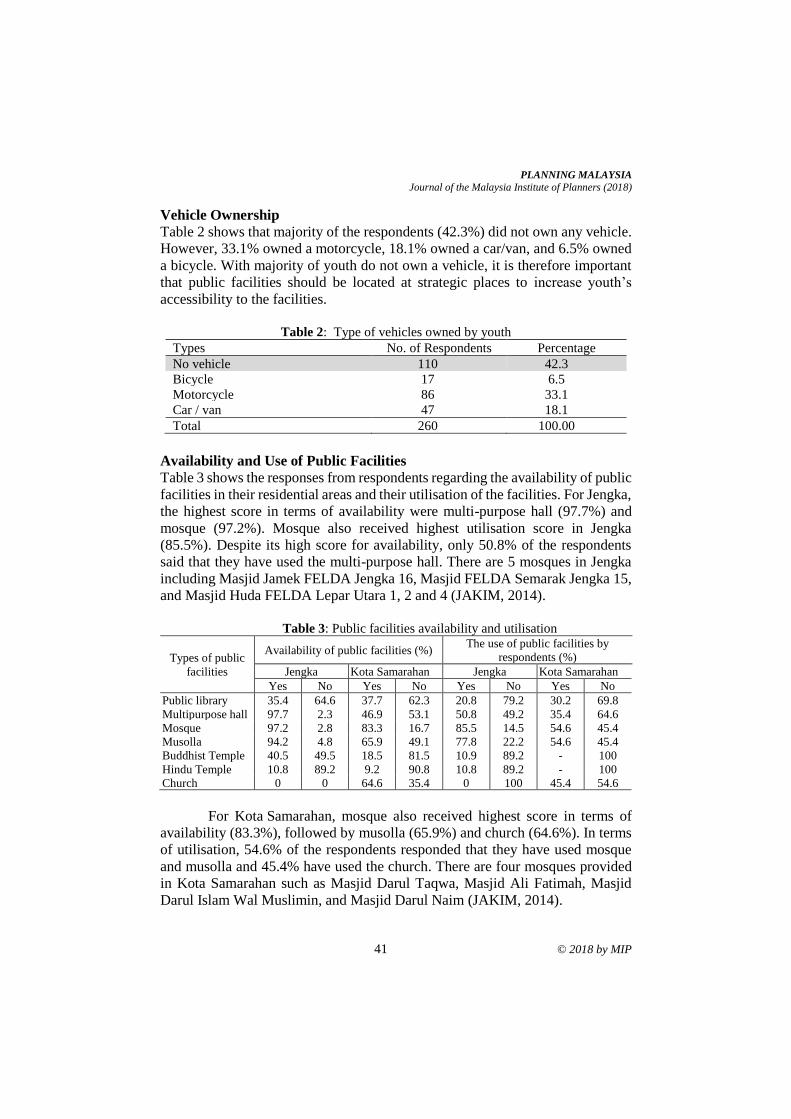
PLANNING MALAYSIA
Journal of the Malaysia Institute of Planners (2018)
41 © 2018 by MIP
Vehicle Ownership Table 2 shows that majority of the respondents (42.3%) did not own any vehicle.
However, 33.1% owned a motorcycle, 18.1% owned a car/van, and 6.5% owned
a bicycle. With majority of youth do not own a vehicle, it is therefore important
that public facilities should be located at strategic places to increase youth’s
accessibility to the facilities.
Table 2: Type of vehicles owned by youth
Types No. of Respondents Percentage
No vehicle 110 42.3
Bicycle 17 6.5
Motorcycle 86 33.1
Car / van 47 18.1
Total 260 100.00
Availability and Use of Public Facilities
Table 3 shows the responses from respondents regarding the availability of public
facilities in their residential areas and their utilisation of the facilities. For Jengka,
the highest score in terms of availability were multi-purpose hall (97.7%) and
mosque (97.2%). Mosque also received highest utilisation score in Jengka
(85.5%). Despite its high score for availability, only 50.8% of the respondents
said that they have used the multi-purpose hall. There are 5 mosques in Jengka
including Masjid Jamek FELDA Jengka 16, Masjid FELDA Semarak Jengka 15,
and Masjid Huda FELDA Lepar Utara 1, 2 and 4 (JAKIM, 2014).
Table 3: Public facilities availability and utilisation
Types of public
facilities
Availability of public facilities (%) The use of public facilities by
respondents (%)
Jengka Kota Samarahan Jengka Kota Samarahan
Yes No Yes No Yes No Yes No
Public library 35.4 64.6 37.7 62.3 20.8 79.2 30.2 69.8
Multipurpose hall 97.7 2.3 46.9 53.1 50.8 49.2 35.4 64.6
Mosque 97.2 2.8 83.3 16.7 85.5 14.5 54.6 45.4
Musolla 94.2 4.8 65.9 49.1 77.8 22.2 54.6 45.4
Buddhist Temple 40.5 49.5 18.5 81.5 10.9 89.2 - 100
Hindu Temple 10.8 89.2 9.2 90.8 10.8 89.2 - 100
Church 0 0 64.6 35.4 0 100 45.4 54.6
For Kota Samarahan, mosque also received highest score in terms of
availability (83.3%), followed by musolla (65.9%) and church (64.6%). In terms
of utilisation, 54.6% of the respondents responded that they have used mosque
and musolla and 45.4% have used the church. There are four mosques provided
in Kota Samarahan such as Masjid Darul Taqwa, Masjid Ali Fatimah, Masjid
Darul Islam Wal Muslimin, and Masjid Darul Naim (JAKIM, 2014).
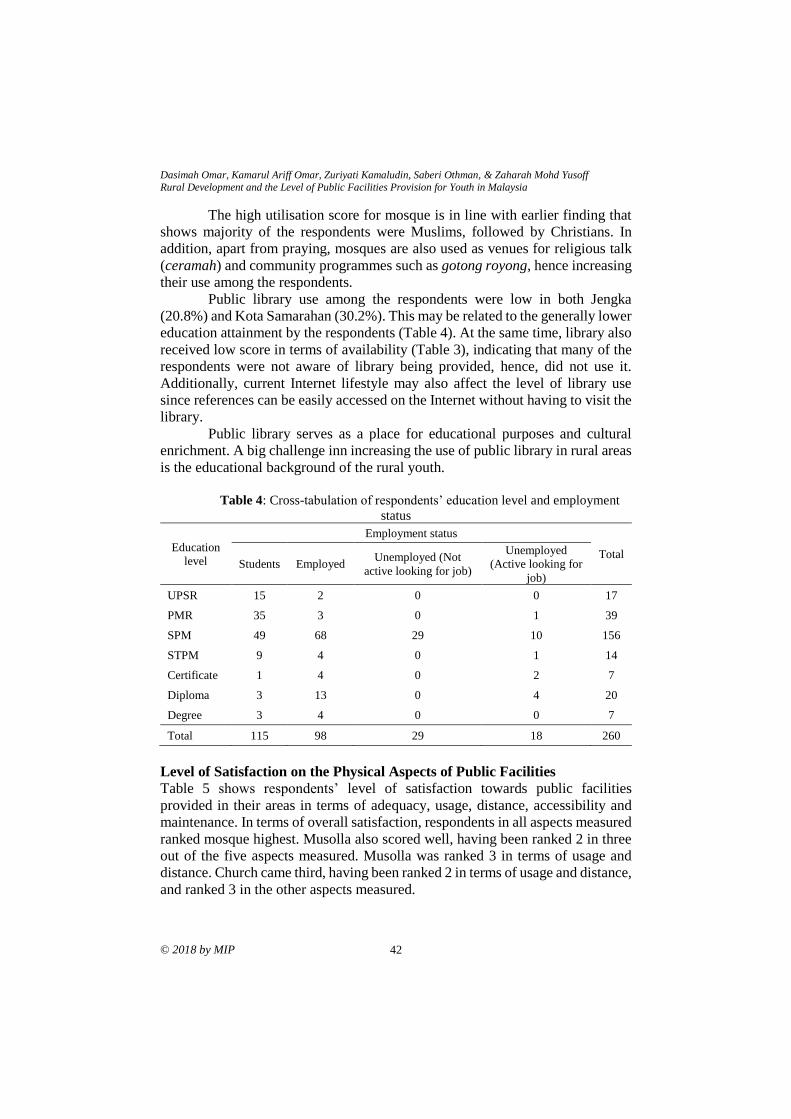
Dasimah Omar, Kamarul Ariff Omar, Zuriyati Kamaludin, Saberi Othman, & Zaharah Mohd Yusoff
Rural Development and the Level of Public Facilities Provision for Youth in Malaysia
© 2018 by MIP 42
The high utilisation score for mosque is in line with earlier finding that
shows majority of the respondents were Muslims, followed by Christians. In
addition, apart from praying, mosques are also used as venues for religious talk
(ceramah) and community programmes such as gotong royong, hence increasing
their use among the respondents.
Public library use among the respondents were low in both Jengka
(20.8%) and Kota Samarahan (30.2%). This may be related to the generally lower
education attainment by the respondents (Table 4). At the same time, library also
received low score in terms of availability (Table 3), indicating that many of the
respondents were not aware of library being provided, hence, did not use it.
Additionally, current Internet lifestyle may also affect the level of library use
since references can be easily accessed on the Internet without having to visit the
library.
Public library serves as a place for educational purposes and cultural
enrichment. A big challenge inn increasing the use of public library in rural areas
is the educational background of the rural youth.
Table 4: Cross-tabulation of respondents’ education level and employment
status
Education
level
Employment status
Total Students Employed
Unemployed (Not
active looking for job)
Unemployed
(Active looking for
job)
UPSR 15 2 0 0 17
PMR 35 3 0 1 39
SPM 49 68 29 10 156
STPM 9 4 0 1 14
Certificate 1 4 0 2 7
Diploma 3 13 0 4 20
Degree 3 4 0 0 7
Total 115 98 29 18 260
Level of Satisfaction on the Physical Aspects of Public Facilities Table 5 shows respondents’ level of satisfaction towards public facilities
provided in their areas in terms of adequacy, usage, distance, accessibility and
maintenance. In terms of overall satisfaction, respondents in all aspects measured
ranked mosque highest. Musolla also scored well, having been ranked 2 in three
out of the five aspects measured. Musolla was ranked 3 in terms of usage and
distance. Church came third, having been ranked 2 in terms of usage and distance,
and ranked 3 in the other aspects measured.
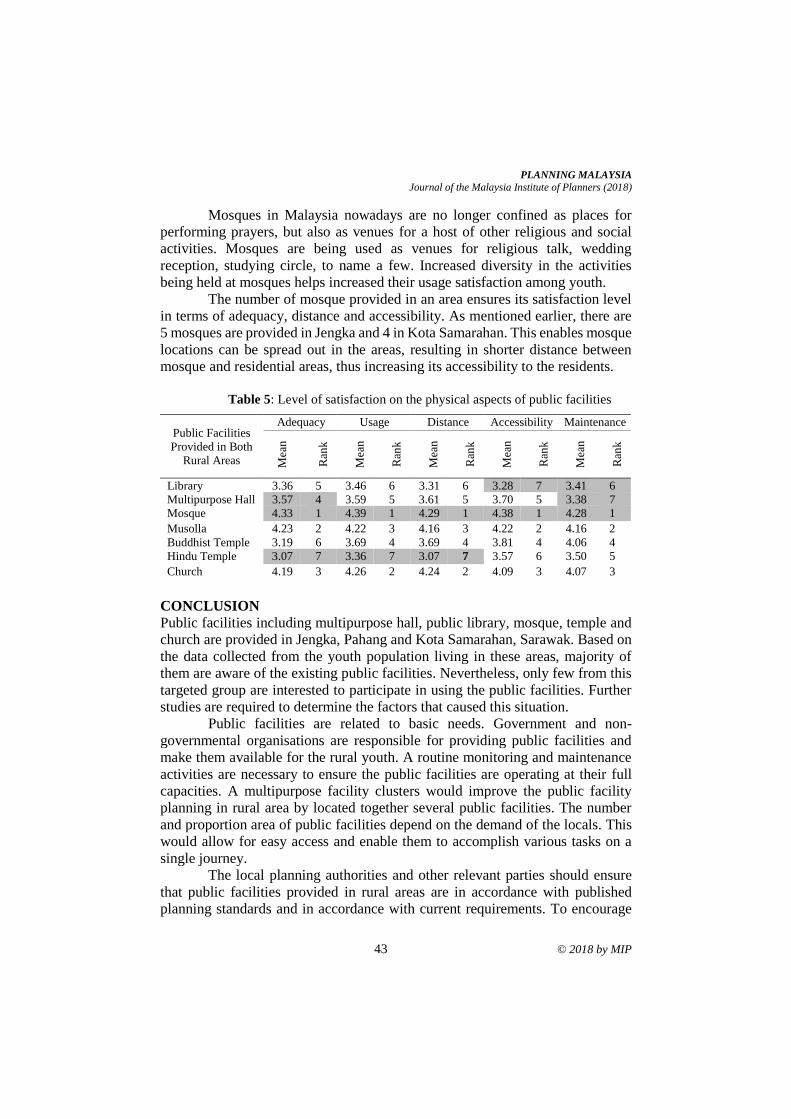
PLANNING MALAYSIA
Journal of the Malaysia Institute of Planners (2018)
43 © 2018 by MIP
Mosques in Malaysia nowadays are no longer confined as places for
performing prayers, but also as venues for a host of other religious and social
activities. Mosques are being used as venues for religious talk, wedding
reception, studying circle, to name a few. Increased diversity in the activities
being held at mosques helps increased their usage satisfaction among youth.
The number of mosque provided in an area ensures its satisfaction level
in terms of adequacy, distance and accessibility. As mentioned earlier, there are
5 mosques are provided in Jengka and 4 in Kota Samarahan. This enables mosque
locations can be spread out in the areas, resulting in shorter distance between
mosque and residential areas, thus increasing its accessibility to the residents.
Table 5: Level of satisfaction on the physical aspects of public facilities
CONCLUSION
Public facilities including multipurpose hall, public library, mosque, temple and
church are provided in Jengka, Pahang and Kota Samarahan, Sarawak. Based on
the data collected from the youth population living in these areas, majority of
them are aware of the existing public facilities. Nevertheless, only few from this
targeted group are interested to participate in using the public facilities. Further
studies are required to determine the factors that caused this situation.
Public facilities are related to basic needs. Government and non-
governmental organisations are responsible for providing public facilities and
make them available for the rural youth. A routine monitoring and maintenance
activities are necessary to ensure the public facilities are operating at their full
capacities. A multipurpose facility clusters would improve the public facility
planning in rural area by located together several public facilities. The number
and proportion area of public facilities depend on the demand of the locals. This
would allow for easy access and enable them to accomplish various tasks on a
single journey.
The local planning authorities and other relevant parties should ensure
that public facilities provided in rural areas are in accordance with published
planning standards and in accordance with current requirements. To encourage
Public Facilities
Provided in Both
Rural Areas
Adequacy Usage Distance Accessibility Maintenance
Mea
n
Ran
k
Mea
n
Ran
k
Mea
n
Ran
k
Mea
n
Ran
k
Mea
n
Ran
k
Library 3.36 5 3.46 6 3.31 6 3.28 7 3.41 6
Multipurpose Hall 3.57 4 3.59 5 3.61 5 3.70 5 3.38 7
Mosque 4.33 1 4.39 1 4.29 1 4.38 1 4.28 1
Musolla 4.23 2 4.22 3 4.16 3 4.22 2 4.16 2
Buddhist Temple 3.19 6 3.69 4 3.69 4 3.81 4 4.06 4
Hindu Temple 3.07 7 3.36 7 3.07 7 3.57 6 3.50 5
Church 4.19 3 4.26 2 4.24 2 4.09 3 4.07 3
Dasimah Omar, Kamarul Ariff Omar, Zuriyati Kamaludin, Saberi Othman, & Zaharah Mohd Yusoff
Rural Development and the Level of Public Facilities Provision for Youth in Malaysia
© 2018 by MIP 44
usage, public facilities must be located at strategic locations, close to residential
areas and easily accessible by the public. Stakeholders such as rural youth should
be engaged to hear their views to ensure that public facilities provided meet their
needs and requirements as well.
ACKNOWLEDGEMENT
This research was made possible through the Long-term Research Grant Scheme
(LRGS 2014-0006-106-42) involving a collaboration between Universiti
Pendidikan Sultan Idris Perak, Universiti Teknologi MARA Shah Alam,
Universiti Putra Malaysia and Universiti Malaysia Kelantan. Special thanks to
the supportive respondents and friends in ensuring the success of this research.
REFERENCES Council for Scientific and Industrial Research [CSIR] (2000). Guidelines for human
settlement planning and design. Pretoria: CSIR Building and Construction
Technology.
Edwards, M. B., Miller, J. L., & Blackburn, L. (2011). After-school programs for health
promotion in rural communities: Ashe County Middle School 4-H After-School
Program. Journal of Public Health Management and Practice, 17(3), 283-287.
FELDA (2018). Lembaga Kemajuan Tanah Persekutuan (FELDA) - Jengka. Retrieved
December 23, 2017 from http://www.felda.net.my/index.php/program-qurban-
perdana-felda/24-korporat/113-jengka
Jabatan Kemajuan Islam Malaysia [JAKIM] (2014). Portal rasmi masjid Malaysia.
Retrieved from http://masjid.islam.gov.my/
Ministry of Rural Development (n.d.). Data asas Malaysia 2014. Retrieved from
http://www.rurallink.gov.my/wp-content/uploads/2015/05/1-DATA-ASAS-
MALAYSIA1.pdf
Smith, D. (2014). Collaboration between rural school and public youth services librarian.
New Library World, 115(3/4), 160-174.
Omar, D., Omar, K. A., Othman, S., & Mohd Yusoff, Z. (2016). Walkability design for
Urban Public Housing Park. Environment-Behaviour Proceedings Journal, 1(3),
311-317.
Perry, C (1998). The Neighbourhood Unit (Reprint) (pp. 25-44). London:
Routledge/Thoemmes.
Raja Kasim, R. S., Zulkharnain, A., Hashim, Z., Wan Ibrahim, W. N., & Yusof, S. E.
(2014). Regenerating youth development through entrepreneurship. Procedia -
Social and Behavioral Sciences, 129, 322-327.
Sajilan, S. (2016, August). Urbanize the rural: New direction in developing
entrepreneurs for sustainable development. RRPG 7th International Conference
and Field Study in Malaysia. August 15-17, Skudai, Johor, Malaysia.
United Nations Population Fund [UNFPA] (2015, June 1). Youth empowerment,
education, employment key to future development. Retrieved from
https://www.unfpa.org/news/youth-empowerment-education-employment-key-
future-development

PLANNING MALAYSIA
Journal of the Malaysia Institute of Planners (2018)
45 © 2018 by MIP
Viamichelin.com. (n.d.). Map of Kota Samarahan - Michelin Kota Samarahan map.
Available at: https://www.viamichelin.com/web/ [Accessed December 23,
2017]
Yeon, A. L., Abdullah, S. A. J., Arshad, R., Ayub, Z. A., Azhar, A., & Suhaimi, S. (2016).
Youth knowledge on the law of youth development in Malaysia. International
Journal of Social Science and Humanity, 6(5), 336-340.
1Student at International Islamic University Malaysia Email: [email protected] 46
PLANNING MALAYSIA:
Journal of the Malaysian Institute of Planners
VOLUME 16 ISSUE 3 (2018) Page 46 – 56
ASSESSMENT OF LEARNING WITH NATURE IN PRESCHOOL
Syaida Farizah Saleh1, Nurul Syala Abdul Latip2 & Asiah Abdul Rahim3
1,3Kulliyyah of Architecture and Enviromental Design
INTERNATIONAL ISLAMIC UNIVERSITY MALAYSIA
2Faculty of Engineering and Built Environment
UNIVERSITI SAINS ISLAM MALAYSIA
Abstract
Learning with nature is a form of psychological therapy for all, including children
with disability. Beyond the psychological aspect, access to outdoor green space
can also improve social, environmental, developmental, emotional and
behavioural, and even medical outcomes. In Malaysia, studies of learning with
nature remain scarce due to the Malaysian education system’s focus on indoor
learning rather than outdoor learning. This research aimed at determining
perceptions towards the application of learning with nature among preschool
educators. Qualitative methods were used for data collection, consisting of
structured interview and field observation. Four preschools were selected as
sample. Results show that learning with nature contributes to the positive
development of the children. The approaches used to instil nature awareness
include conducive landscape, environmental activities, outdoor class activities,
outdoor free play, formal education and recreational programme outside a
preschool. These involved both outdoor and indoor spaces and facilities.
Keywords: learning with nature, indoor learning, outdoor learning, nature
awareness
PLANNING MALAYSIA
Journal of the Malaysia Institute of Planners (2018)
47 © 2018 by MIP
INTRODUCTION
Connecting children with nature contributes to their positive development.
However, children and families nowadays often have limited opportunities to
interact with the nature surrounding them. Children in modern families tend to
spend more time watching television and playing computer games than playing
outside of their houses. Modern societies seem to neglect the value of such
environment for the development of children, and even for adolescents. With
current development in the pedagogy of teaching and learning approaches in the
world, not many studies have been done on outdoor learning in Malaysia (Spalie,
Utaberta, Abdullah, Tahir, & Ani, 2011). Most studies have focused on the
development of curriculum and the delivery of knowledge, but not many
approaches have been made to analyse outdoor learning as one of the alternative
methods of learning in school design.
According to Komunitas Sekolah Alam recorded by Spalie et al. (2011), learning with nature is an approach to connect the children with nature. There are
some research done in Indonesia that show the increase of understanding and
interest up to 40% among the children that were involved with learning with
nature teaching method. This research will provide an understanding of learning
with nature from the perspective of pre-school educators in Malaysia. There are
three objectives of the research: to gain the viewpoints of preschool educators on
the importance of learning with nature; to study approaches to instil the awareness
towards nature among preschool children; and to investigate the type of facilities
and space needed for learning with nature.
LEARNING WITH NATURE According to Wilson (2011), learning during early childhood progress is
characterised by the significance of the child's innate drive to discover and learn.
In this phase of early childhood, children develop their sense of affection toward
the natural world and their insights into the needs of other creatures. The
emphasis on environmental learning at this phase is to inspire children to explore
and experience their local environment, and to encourage a sense of curiosity and
sense of their place.
Humans have been created together with the natural environment and
survive by learning how to use all the elements of the environment. The various
components of nature in the earth hold the answer to every question (Hashim &
Denan, 2014). Moss added that nature is a tool for the children to explore not just
the world, but also to explore themselves. Natural England (2012), stated that the
natural environment includes all available outdoor green area where children can
play. Such spaces allow for childhood discovery and learning, adventure and
escape, or solely know-how about the changing seasons.
Syaida Farizah Saleh, Nurul Syala Abdul Latip & Asiah Abdul Rahim
Assessment of Learning with Nature in Preschool
© 2018 by MIP 48
IMPORTANCE OF LEARNING WITH NATURE
According to Von Benzon (2017), beyond the psychological, the literature
classifies discourses relating to a wide range of benefits, or rationalities, for
offering opportunities for access to outdoor green space including the social,
environmental, developmental, emotional and behavioural, and medical contexts.
According to Ali, Rostam and Awang (2014), plants have an influence on human
psychology. Students' interactions with plants could help to lessen the negative
emotions, upsurge positive thoughts, reduces physical pressure and develops the
students' attention towards learning. Interaction with the outdoor environment
without any boundaries could diminish psychological pressure in our daily life.
Nature can ease mental stress and illness (Hashim & Denan, 2014). Natural
England (2012) stated that children will do better than usual after activities in
green settings and that the "greener" a child's play area, the less severe his or her
attention deficit symptoms.
According to Hashim & Denan (2014), nature provides a peaceful and
motivating environment and stimulate knowledge seeking, curiosity and
attentiveness. Nature aids children’s imagination in inspire design ideas.
Mirrahimi, Tawil, Abdullah, Surat and Usman (2011) added that benefits of
contacting the natural environment in learning area include boosting language
improvement, improving academic achievement, improved the scores, enhanced
opportunities for learning and increased educational performance. Natural
environments stimulate social interaction and de-stressing through exercise or
communication and provide a peaceful setting (Hashim & Denan, 2014). Wilson
(2011), said that experiences in nature can contribute to the healthy growth of a
child's body, mind, and spirit. Natural England (2012), added that children could
gain lifelong health benefits via exposure to the natural environment. In terms of
social, children can learn to work together, take responsibilities, develop self-
confidence, cooperate, and develop a relationship between student and teacher
during learning with nature (Mirrahimi et al., 2011).
It is important for children to be in an outdoor environment for the
development of motor and cognitive skills. In an outdoor environment, children
can learn through three modes of learning which are cognitive, affection, and the
evaluation of either natural or man-made things (Aziz & Said, 2012). Azlina and
Zulkiflee (2010) said that natural environment can be a source for cooperative
and imaginative play. This triggers children's curiosity and imaginative
association. Learning with nature can develop awareness towards natural
environment (Hashim & Denan, 2014). Wilson (2017) added that a feeling of
love and empathy towards nature grows out from children's regular contact with
the natural world.
PLANNING MALAYSIA
Journal of the Malaysia Institute of Planners (2018)
49 © 2018 by MIP
APPROACH TOWARDS LEARNING WITH NATURE
According to Mirrahimi et al. (2011), learning does not occur only through formal
education in the natural environment. Studies have also shown that informal
education could happen in a natural context. Informal education is an important
form of learning that occurs without teacher involvement. A school has to play
the role of providing children with opportunities to experience a wide range of
natural environments. By working together, the educational profession has the
potential to inspire and enthuse children, provide them with memorable
experiences, and empower them to make the most out of the natural spaces and
places locally and further afield (Natural England, 2012).
According to Ali et al. (2014), a conducive landscape will assist directly
or indirectly in the learning process. It will bring the children close to nature.
Environmentally related activities such as 3K programs as well as campaigns to
recycle and reuse of waste materials not only increase security, safety, and
cleanliness of the school compounds but also encourage students to love the
environment (Ali et al., 2014). It is important to provide environmental education
to create awareness about the environment among children (Acar, 2014). Acar
added that outdoor class activities such as outdoor play create learning
opportunities through trial knowledge and experience. Outdoor learning has been
used as early-stage research at several preschool institutions in Indonesia
especially in Jakarta (Spalie et al., 2011). According to Wilson (2017),
unstructured activities in nature also can develop lifelong conservation values.
This can facilitate environmentally informed and active children. Learning with
nature also can be engaged in the form of training subjects such as math, science,
language arts, environmental studies, and nutrition with the integration of core
program standards (Mirrahimi et al., 2011). Wilson (2017) said that the
recreational program outside of preschool is considered as part of free-choice
learning in which children can absorb the information that they encountered by
themselves. Children have to use all their senses to experience and appreciate the
natural environment.
FACILITIES AND SPACE NEEDED FOR LEARNING WITH NATURE
According to Mirrahimi et al. (2011), a good design for outdoor learning
connecting with nature is important to promote student's abilities in terms of both
academic achievement and social behaviours. A designed space for
environmental learning can help to create a more childlike atmosphere. Designers
pay more attention to shape and space shape combination, rather than the
capabilities of the space that are important for people (Oloumi, Mahdavinejad, &
Namvarrad, 2012). Children are easily influenced by the surrounding
environment. It affects children activities as well as children behaviour. It is
important for designers to have deep knowledge about children, the nature of
children’s relationship with the environment, the needs and demands of children,
Syaida Farizah Saleh, Nurul Syala Abdul Latip & Asiah Abdul Rahim
Assessment of Learning with Nature in Preschool
© 2018 by MIP 50
and the opportunities that can be offered through the design of the learning
environment in order to produce a high quality of learning environment for the
children (Acar, 2014).
Ali et al. (2014) have stated that landscapes function in assisting the
learning process involves the entire components of the landscape at schools and
it includes hard components such as gazebo, pergola, bench, garden tables, fish
pond, signboards, flower pots, and soft elements such as shade trees, plants, fruits,
grass, herbs, and others. The landscape should include a range of different natural
features such as sand, soil, grass, a variety of different plantings and trees. Abbas,
Othman, Puteri, Megat and Rahman (2012) added that quality of organization and
materialization of the designed physical environment of the premises correlates
with the positive developmental results of children. A contemporary design of
playgrounds did not necessarily promote greater amounts of educationally
desirable social, language, or motor behaviours. Children need to have an
environment that addresses them, challenges them, and provides something for
them to observe and think about, to make choices, to attract their attention, to
engage in their favourite activities and to give them the opportunity to meet
friends. They also need the freedom to explore and satisfy their curiosity about
the world (Aziz & Said, 2012). Learning with nature should not be limited to
outdoors. According to Mccurdy, Winterbottom, Mehta and Roberts (2010),
having windows facing towards the vegetation view is also considered as
connecting the children with nature.
Oloumi et al. (2012) have stated that children must deal with forms and
buildings and also with connection and live inside them feel comfortable, not fear
and relax. Spaces with spirited and light colour and often colours with unclear
forms (like cases generated in watercolour painting) inspire imaginary topics and
inspire feelings like kindness, sense of emotion. Challenges facing the preschool
include fear of accidents, costs, and curriculum development (Natural England,
2012). According to Von Benzon (2017), preschools nowadays are designed to
limit children's freedom of movement and ensure maximum opportunities for
surveillance of children by responsible adults. Children are enclosed by walls and
doors which totally separate them from the outside world. When designing a
space for learning with nature, high levels of management and surveillance are
often deemed necessary due to the potential risks during the learning process.
METHODOLOGY
The methodology employed in this research is a qualitative method. The two
techniques used are structured interview and visual study. The visual study
included photographing and observation checklists. The data were collected using
case studies at four preschools: IIUM Montessori Gombak; Tadika Abim Al-
Huda, Bukit Baru, Melaka; Tadika Ceriaku, Sg. Rambai, Melaka; and Al-
Baghdadi Playtime Centre, Taman Bandar Senawang, Seremban. For the
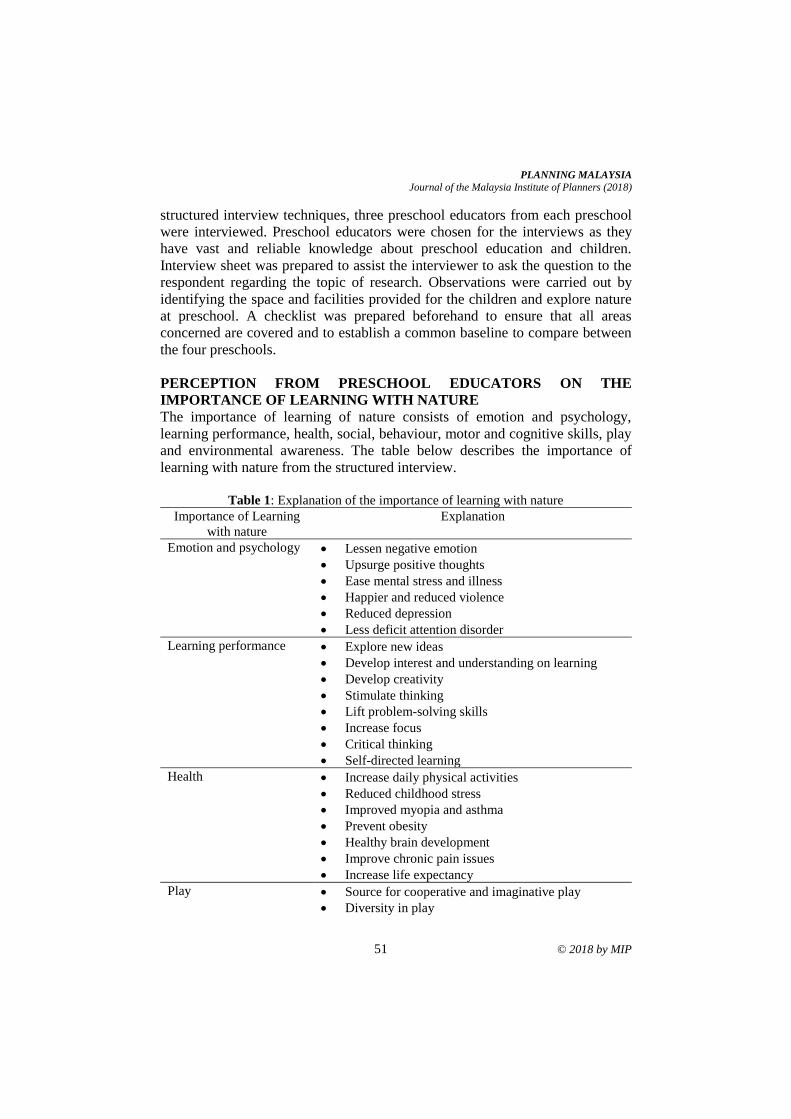
PLANNING MALAYSIA
Journal of the Malaysia Institute of Planners (2018)
51 © 2018 by MIP
structured interview techniques, three preschool educators from each preschool
were interviewed. Preschool educators were chosen for the interviews as they
have vast and reliable knowledge about preschool education and children.
Interview sheet was prepared to assist the interviewer to ask the question to the
respondent regarding the topic of research. Observations were carried out by
identifying the space and facilities provided for the children and explore nature
at preschool. A checklist was prepared beforehand to ensure that all areas
concerned are covered and to establish a common baseline to compare between
the four preschools.
PERCEPTION FROM PRESCHOOL EDUCATORS ON THE
IMPORTANCE OF LEARNING WITH NATURE
The importance of learning of nature consists of emotion and psychology,
learning performance, health, social, behaviour, motor and cognitive skills, play
and environmental awareness. The table below describes the importance of
learning with nature from the structured interview.
Table 1: Explanation of the importance of learning with nature
Importance of Learning
with nature
Explanation
Emotion and psychology • Lessen negative emotion
• Upsurge positive thoughts
• Ease mental stress and illness
• Happier and reduced violence
• Reduced depression
• Less deficit attention disorder
Learning performance
• Explore new ideas
• Develop interest and understanding on learning
• Develop creativity
• Stimulate thinking
• Lift problem-solving skills
• Increase focus
• Critical thinking
• Self-directed learning
Health
• Increase daily physical activities
• Reduced childhood stress
• Improved myopia and asthma
• Prevent obesity
• Healthy brain development
• Improve chronic pain issues
• Increase life expectancy
Play
• Source for cooperative and imaginative play
• Diversity in play
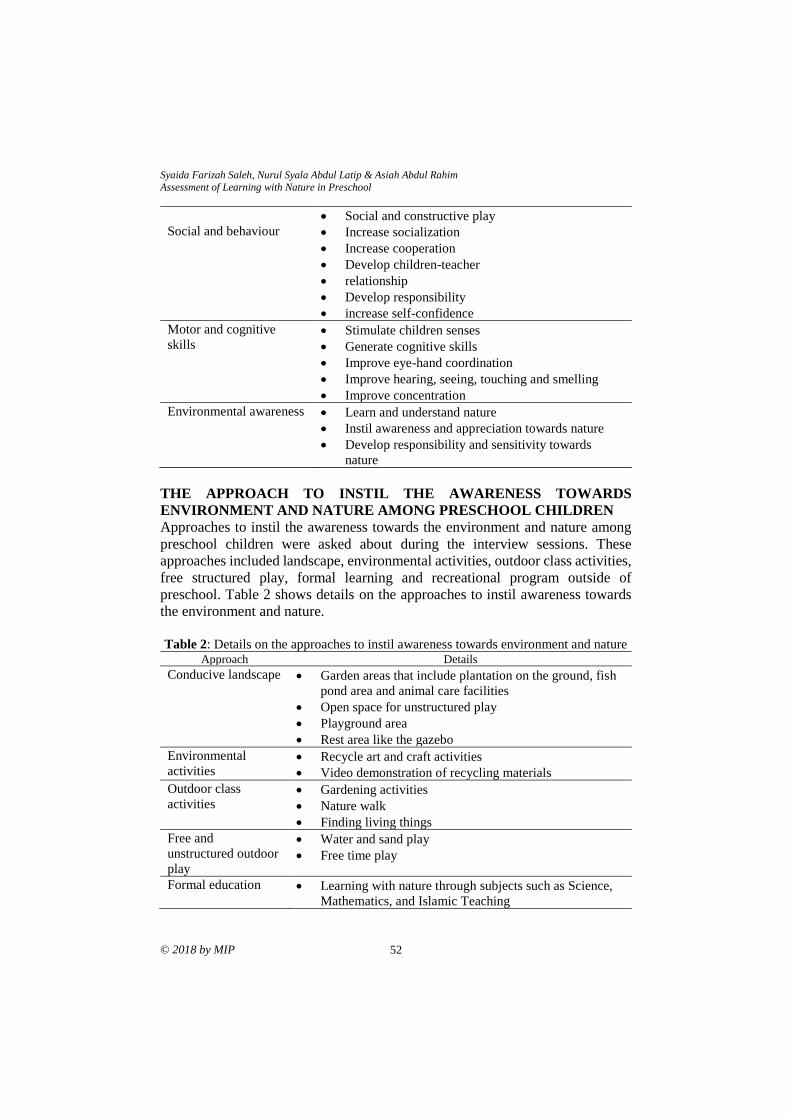
Syaida Farizah Saleh, Nurul Syala Abdul Latip & Asiah Abdul Rahim
Assessment of Learning with Nature in Preschool
© 2018 by MIP 52
• Social and constructive play
Social and behaviour
• Increase socialization
• Increase cooperation
• Develop children-teacher
• relationship
• Develop responsibility
• increase self-confidence
Motor and cognitive
skills
• Stimulate children senses
• Generate cognitive skills
• Improve eye-hand coordination
• Improve hearing, seeing, touching and smelling
• Improve concentration
Environmental awareness
• Learn and understand nature
• Instil awareness and appreciation towards nature
• Develop responsibility and sensitivity towards
nature
THE APPROACH TO INSTIL THE AWARENESS TOWARDS
ENVIRONMENT AND NATURE AMONG PRESCHOOL CHILDREN
Approaches to instil the awareness towards the environment and nature among
preschool children were asked about during the interview sessions. These
approaches included landscape, environmental activities, outdoor class activities,
free structured play, formal learning and recreational program outside of
preschool. Table 2 shows details on the approaches to instil awareness towards
the environment and nature.
Table 2: Details on the approaches to instil awareness towards environment and nature
Approach Details Conducive landscape • Garden areas that include plantation on the ground, fish
pond area and animal care facilities
• Open space for unstructured play
• Playground area
• Rest area like the gazebo
Environmental
activities • Recycle art and craft activities
• Video demonstration of recycling materials
Outdoor class
activities • Gardening activities
• Nature walk
• Finding living things
Free and
unstructured outdoor
play
• Water and sand play
• Free time play
Formal education • Learning with nature through subjects such as Science,
Mathematics, and Islamic Teaching
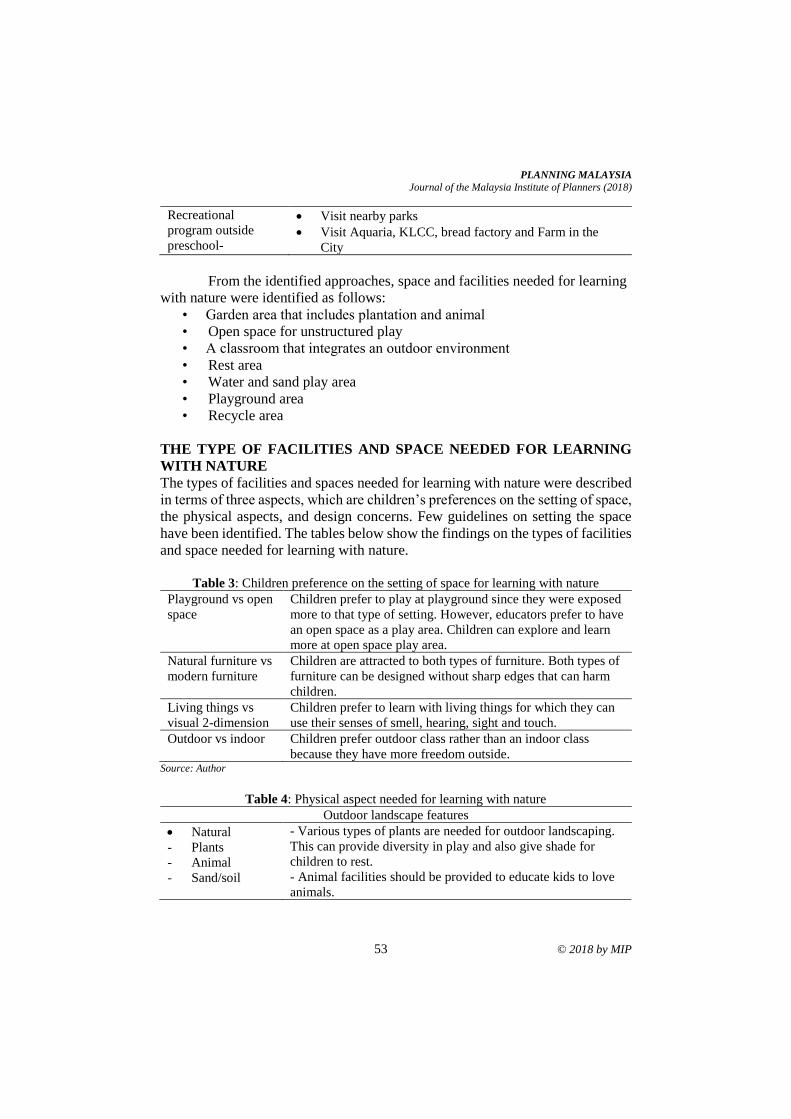
PLANNING MALAYSIA
Journal of the Malaysia Institute of Planners (2018)
53 © 2018 by MIP
Recreational
program outside
preschool-
• Visit nearby parks
• Visit Aquaria, KLCC, bread factory and Farm in the
City
From the identified approaches, space and facilities needed for learning
with nature were identified as follows:
• Garden area that includes plantation and animal
• Open space for unstructured play
• A classroom that integrates an outdoor environment
• Rest area
• Water and sand play area
• Playground area
• Recycle area
THE TYPE OF FACILITIES AND SPACE NEEDED FOR LEARNING
WITH NATURE
The types of facilities and spaces needed for learning with nature were described
in terms of three aspects, which are children’s preferences on the setting of space,
the physical aspects, and design concerns. Few guidelines on setting the space
have been identified. The tables below show the findings on the types of facilities
and space needed for learning with nature.
Table 3: Children preference on the setting of space for learning with nature
Playground vs open
space
Children prefer to play at playground since they were exposed
more to that type of setting. However, educators prefer to have
an open space as a play area. Children can explore and learn
more at open space play area.
Natural furniture vs
modern furniture
Children are attracted to both types of furniture. Both types of
furniture can be designed without sharp edges that can harm
children.
Living things vs
visual 2-dimension
Children prefer to learn with living things for which they can
use their senses of smell, hearing, sight and touch.
Outdoor vs indoor Children prefer outdoor class rather than an indoor class
because they have more freedom outside. Source: Author
Table 4: Physical aspect needed for learning with nature
Outdoor landscape features
• Natural
- Plants
- Animal
- Sand/soil
- Various types of plants are needed for outdoor landscaping.
This can provide diversity in play and also give shade for
children to rest.
- Animal facilities should be provided to educate kids to love
animals.
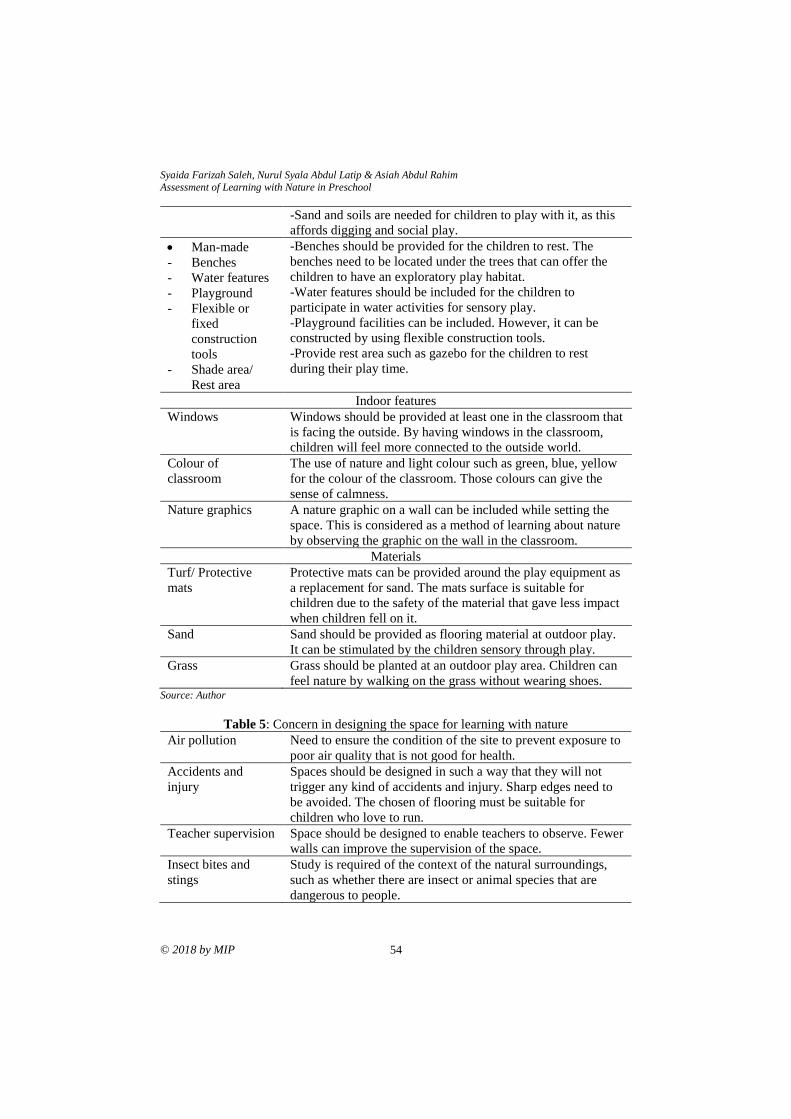
Syaida Farizah Saleh, Nurul Syala Abdul Latip & Asiah Abdul Rahim
Assessment of Learning with Nature in Preschool
© 2018 by MIP 54
-Sand and soils are needed for children to play with it, as this
affords digging and social play.
• Man-made
- Benches
- Water features
- Playground
- Flexible or
fixed
construction
tools
- Shade area/
Rest area
-Benches should be provided for the children to rest. The
benches need to be located under the trees that can offer the
children to have an exploratory play habitat.
-Water features should be included for the children to
participate in water activities for sensory play.
-Playground facilities can be included. However, it can be
constructed by using flexible construction tools.
-Provide rest area such as gazebo for the children to rest
during their play time.
Indoor features
Windows
Windows should be provided at least one in the classroom that
is facing the outside. By having windows in the classroom,
children will feel more connected to the outside world.
Colour of
classroom
The use of nature and light colour such as green, blue, yellow
for the colour of the classroom. Those colours can give the
sense of calmness.
Nature graphics A nature graphic on a wall can be included while setting the
space. This is considered as a method of learning about nature
by observing the graphic on the wall in the classroom.
Materials
Turf/ Protective
mats
Protective mats can be provided around the play equipment as
a replacement for sand. The mats surface is suitable for
children due to the safety of the material that gave less impact
when children fell on it.
Sand Sand should be provided as flooring material at outdoor play.
It can be stimulated by the children sensory through play.
Grass Grass should be planted at an outdoor play area. Children can
feel nature by walking on the grass without wearing shoes. Source: Author
Table 5: Concern in designing the space for learning with nature
Air pollution
Need to ensure the condition of the site to prevent exposure to
poor air quality that is not good for health.
Accidents and
injury
Spaces should be designed in such a way that they will not
trigger any kind of accidents and injury. Sharp edges need to
be avoided. The chosen of flooring must be suitable for
children who love to run.
Teacher supervision Space should be designed to enable teachers to observe. Fewer
walls can improve the supervision of the space.
Insect bites and
stings
Study is required of the context of the natural surroundings,
such as whether there are insect or animal species that are
dangerous to people.
PLANNING MALAYSIA
Journal of the Malaysia Institute of Planners (2018)
55 © 2018 by MIP
Secure barriers Barriers are needed to prevent children from leaving the
allowable area. Source: Author
CONCLUSION AND RECOMMENDATION
Learning with nature is important for children in many aspects such as emotion,
psychology, health, behaviour, social, motor and cognitive skills, play, and
environmental awareness. Learning with nature can be applied in both indoor
class and outdoor classes. Indoor class involve formal learning, while outdoors
involves informal learning. From this paper, the type of space and facilities that
support learning with nature were identified. All research questions were
answered with the support from the primary and secondary data. The primary
data gained from data collection is compared to the secondary data which is the
literature review to gain the final output of the research. From the discussion, the
author can conclude that learning with nature can be applied in teaching and
physical treatment approaches by instilling awareness of nature and environment
among the preschool children.
This research has only focused on the preschool educator's views on
learning with nature. Educators’ views are based on their experiences as
educators. However, parents’ views are also needed when setting the space and
facilities for learning with nature since they are who are going to decide what is
the best for their children. Thus, parents’ views of learning with nature can be
studied for future research. Additionally, the research only focuses on the
facilities and space needed for learning with nature for preschool children. The
integration of facilities and space needed for nature is not covered in this research.
Therefore, future research should examine how to design the facilities and space
of a preschool to be integrated with nature.
ACKNOWLEDGEMENT
The authors would like to acknowledge the Research Acculturation Grant
Scheme (RAGS) from the Ministry of Higher Education for the support of this
research.
REFERENCES Abbas, M. Y., Othman, M., Puteri, &, Megat, Z., & Rahman, A. (2012). Pre-school
Classroom Environment: Significant upon Childrens’ Play Behaviour? Procedia
-Social and Behavioral Sciences, 49, 47–65.
Acar, H. (2014). Learning environments for children in outdoor spaces. Procedia - Social
and Behavioral Sciences, 141, 846-853.
Ali, S. M., Rostam, K., & Awang, A. H. (2014). School landscape environments in
assisting the learning process and in appreciating the natural environment.
Procedia - Social and Behavioral Sciences, 202, 189-198.
Aziz, F., & Said, I. (2012). The trends and influential factors of children’s use of outdoor
Syaida Farizah Saleh, Nurul Syala Abdul Latip & Asiah Abdul Rahim
Assessment of Learning with Nature in Preschool
© 2018 by MIP 56
environments: A review. Procedia - Social and Behavioural Sciences, 38, 204-
212.
Azlina, W., & Zulkiflee, A. S. (2010). A pilot study: The impact of outdoor play spaces
on kindergarten children. Procedia - Social and Behavioural Sciences, 38, 275-
283.
Hashim, H. H., & Denan, Z. (2014). Importance of preserving the natural environment in
the design schools in Malaysia. Procedia - Social and Behavioural Sciences,
170, 177-186.
Mccurdy, L. E., Winterbottom, K. E., Mehta, S. S., & Roberts, J. R. (2010). Using nature
and outdoor activity to improve children’s health. YMPS, 40, 102-117.
Mirrahimi, S., Tawil, N. M., Abdullah, N. A. G., Surat, M., & Usman, I. M. S. (2011).
Developing Conducive Sustainable Outdoor Learning: The Impact of Natural
environment on Learning, Social and Emotional Intelligence. Procedia
Engineering, 20, 389–396.
Natural England (2012). Learning in the natural environment: Review of social and
economic benefits and barriers (NECR092). Retrieved from
http://publications.naturalengland.org.uk/publication/1321181
Oloumi, S., Mahdavinejad, M., & Namvarrad, A. (2012). Evaluation of outdoor
environment from the viewpoint of children. Procedia - Social and Behavioural
Sciences, 35, 431-439.
Spalie, N., Utaberta, Abdullah, Tahir, M., & Ani, C. (2011). Reconstructing sustainable
outdoor learning environment in Malaysia from the understanding of natural
school design and approaches in Indonesia. Procedia - Social and Behavioural
Sciences, 15, 3310-3315.
Von Benzon, N. (2017). Unruly children in unbounded spaces: School-based nature
experiences for urban learning disabled young people in Greater Manchester,
UK. Journal of Rural Studies, 51, 240-250.
Wilson, C. (2011). Effective approaches to connect children with nature. Wellington:
Department of Conservation. Retrieved from
http://www.doc.govt.nz/Documents/getting-involved/students-and-teachers/
effective -approaches-to-connect-children-with-nature.pdf
1Associate Professor at Universiti Teknologi MARA, Malaysia. Email: [email protected] 57
PLANNING MALAYSIA:
Journal of the Malaysian Institute of Planners
VOLUME 16 ISSUE 3 (2018) Page 57 – 68
SATISFACTION OF RESIDENTS ON THE REDEVELOPMENT
OF NATURAL DISASTER AREA. CASE STUDY: KUALA KRAI,
KELANTAN, MALAYSIA
Oliver Ling Hoon Leh1, Muhammad Shamsul Azdhar Zulkapli2,
Kwong Qi Jie3, & Nurul Ashikin Mabahwi4
1,2,3Faculty of Architecture, Planning and Surveying
UNIVERSITI TEKNOLOGI MARA, MALAYSIA
4Graduate School of Engineering and Science
SHIBAURA INSTITUTE OF TECHNOLOGY, JAPAN
Abstract
Referring to the Malaysian National Security Council, disaster is defined as a
catastrophic situation that claimed many lives and caused extensive damage to
property and potentially endangers the public peace and security. In Malaysia,
there were few natural disaster events that can be said to be among the worst ever
in terms of the number of deaths and damages. However, these occurrences were
not as severe as overseas. At the end of December 2014, there was a catastrophic
flood called as the 'Bah Kuning' was hitting the east coast of Peninsular Malaysia.
It resulted in almost 85% of the total Kuala Krai area inundated by flood water.
One of the elements in post-disaster recovery is rebuilding shelter for victims.
Regardless, it is important to research on residents’ satisfaction as it will affect
the well-being directly or indirectly. Thus, a study was carried out to evaluate the
satisfaction of residents (victims) on the “New Permanent Houses” (Rumah Kekal
Baharu, RKB) that they received from the redevelopment project. A
questionnaire survey was carried out to collect and understand respondents’
satisfaction on the redevelopment of their housing area, in specific, the quality of
their newly reconstructed houses and the supporting facilities or infrastructure in
their area. From the analysis, it was found that majority of the respondents were
satisfied with their newly redeveloped houses and the infrastructure. The
satisfaction level was associated with the locational and land ownership factors.
Keywords: disaster, flood, house, infrastructure, quality, satisfaction, security
Oliver Ling Hoon Leh, Muhammad Shamsul Azdhar Zulkapli, Kwong Qi Jie, & Nurul Ashikin Mabahwi
Satisfaction of Residents on The Redevelopment of Natural Disaster Area. Case Study: Kuala Krai, Kelantan, Malaysia
© 2018 by MIP 58
INTRODUCTION
At the end of December 2014, there was a catastrophic flood called as the 'Bah
Kuning' hitting the east coast of Peninsular Malaysia. It resulted in almost 85%
of the Kuala Krai area, especially the Kampung Manik Urai, Kampung Manjor,
Kampung Karangan, and Kampung Laloh and Dabong inundated by flood water.
Due to this massive flood, residents in this Kuala Krai area have lost their
properties and belonging. Loss of property, especially their shelters, clothes and
vehicles, as a whole has given an impact to the residents of Kuala Krai. Manik
Urai was affected the most. All residents of Manik Urai lost their homes.
After the natural disaster, there were various agencies and parties
involved in the redevelopment of Kuala Krai. These include government
agencies, private companies and non-governmental organisations (NGOs).
Redevelopment is one of the things that is very important for an area which has
suffered a natural disaster, such as massive flood. However, the issue of quality
in redevelopment should not be compromised. Thus, the satisfaction of victims
on the new houses and the infrastructure or facilities are crucial to be examined.
LITERATURE REVIEW
According to the National Security Council (2014), disaster is defined as a
catastrophic situation that claimed many lives and caused extensive damage to
property and potentially endangers the public peace and security. This often
requires handling of extensive resources, equipment, frequency and manpower
from many agencies as well as effective coordination, especially when complex
and long-term actions are needed. Incidents of natural disasters that are included
under this National Security Council’s directive are floods, storms, droughts, and
coastal erosion, landslides or disasters as a result of the storm and heavy rain. In
addition, haze events that can cause environmental emergencies that jeopardize
public order, government administration, travel and national economic activities
may also be defined as a disaster. Disasters can be divided into categories such
as air disaster, flood disaster, nuclear disaster, and radiology and marine disasters.
In Malaysia, there were few natural disaster events that can be said
among the worst ever in terms of the number of deaths and damages. However,
they were not as severe as those occurred in overseas. Malaysian geographical
factors that are beyond the line of volcanoes and earthquakes also make Malaysia
one of the safest nations from the threat of natural disasters. The number of
natural disasters that occur in Malaysia is comparatively lesser than other
countries such as countries with active volcanoes, frequent storms and so on. One
of the major disaster events in Malaysia was mudflow at Post Dipang, Kampar,
Perak State. The incident occurred on 29th August 1996 in an indigenous
settlement (Jasbindar, 2017). This catastrophic event was caused by logging
activities that had resulted the river flow to be blocked and subsequently causing
severe mud floods due to heavy rain. This incident resulted in 44 deaths while 30
PLANNING MALAYSIA
Journal of the Malaysia Institute of Planners (2018)
59 © 2018 by MIP
houses were damaged. Another major natural disaster was the Tsunami that hit
the northern coastal areas of Peninsular Malaysia, including the Penang Island
and Langkawi Island (“Mengingati Tsunami 2004”, 2014; Bernama, 2014). The
tsunami occurred on 26 December 2004. It has shocked the whole country as
Malaysian never expected to experience such disaster. The incident has caused
68 deaths in four states in Peninsular Malaysia (Penang, Kedah, Perak and
Selangor). However, in Penang alone, there were 52 individuals who lost their
lives. A total of 245 families had lost their homes. A total of 450 homes were
damaged and repaired. This incident also caused severe damage to fishing
facilities as well as affecting the income of fishermen living on the coast of
Penang and Kedah.
One of the elements in post-disaster recovery is rebuilding shelter (home)
for the victims. Regardless, it is important to research on residents’ satisfaction
of the recovery as it affects their well-being directly or indirectly. Hui and Yu
(2009) in Danquah, Attippoe and Ankrah (2014), stated that residential
satisfaction is a reflection of the degree to which the inhabitants feel that their
housing is helping them achieve their goals.
Based on the previous study in the Philippines (Carrasco, Ochiai, &
Okazaki, 2017), residents’ satisfaction with their new house after a disaster was
generally associated to the appropriateness to the locality such as thermal comfort
and construction quality. In general, the esidents’ satisfaction with their new
house after a disaster was positive. In another case, a study in Sri Lanka found
that residents were satisfied with new post-disaster housing provided for the
victims (Wijegunarathna, Wedawatta, Prasanna, & Ingirige, 2018).
Viewing from the housing construction aspects, there were
approximately 1,280 houses have been built through the floods’ affected areas in
Kelantan by the Ministry of Works (Rani, Nifa, Ismail, & Khalid, 2017).
However, as of December 2016, two years after the 2014 disastrous flood, 5% of
the victims still living in the temporary houses due to issues with land acquisition
and ownership, which has delayed the construction of permanent homes by the
Federal Government (Rani et al., 2017). With regard to that, it is necessary to find
out residents’ satisfaction of the ‘New Permanent House’ in Kelantan as the
findings will lead to better enhancement, rapidity and robustness of community
resilience.
RESEARCH METHOD
Scope of Study
This study focuses on the evaluation of satisfaction of flood victims in Kuala
Krai, Kelantan of the “New Permanent Houses” (Rumah Kekal Baharu, RKB)
that they received through post-flood redevelopment project. The redevelopment
project was aimed to rebuild new permanent houses for the victims of the massive
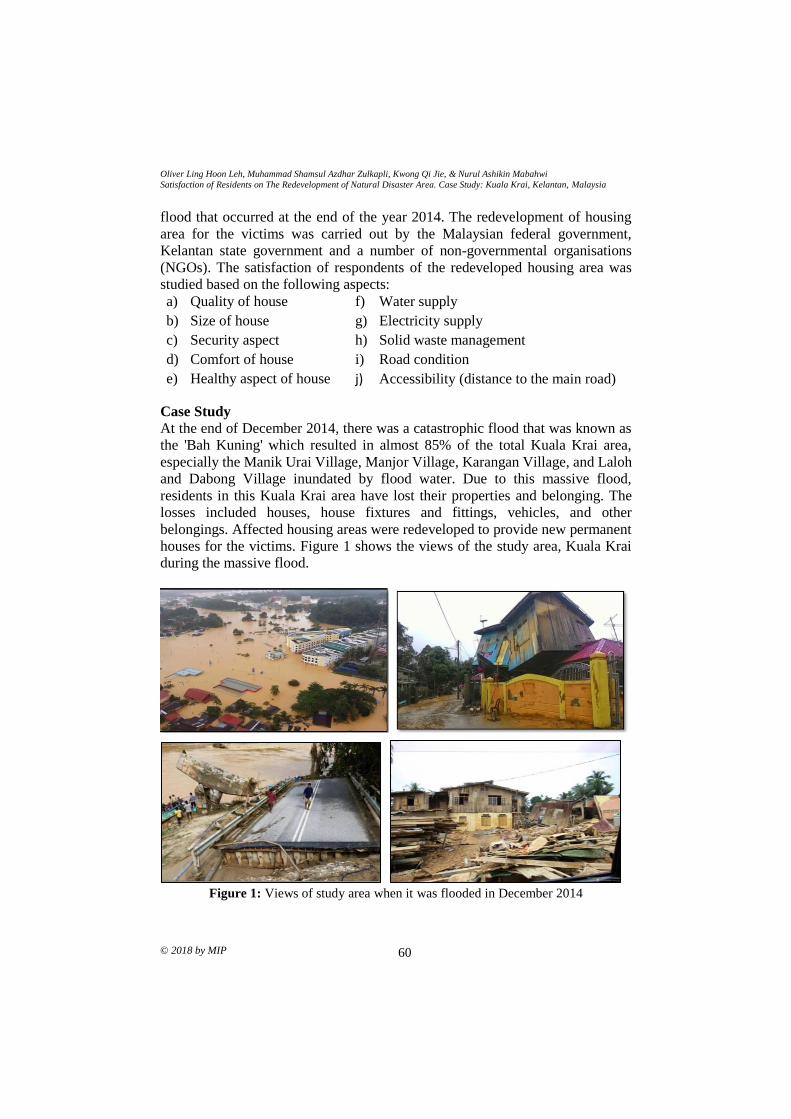
Oliver Ling Hoon Leh, Muhammad Shamsul Azdhar Zulkapli, Kwong Qi Jie, & Nurul Ashikin Mabahwi
Satisfaction of Residents on The Redevelopment of Natural Disaster Area. Case Study: Kuala Krai, Kelantan, Malaysia
© 2018 by MIP 60
flood that occurred at the end of the year 2014. The redevelopment of housing
area for the victims was carried out by the Malaysian federal government,
Kelantan state government and a number of non-governmental organisations
(NGOs). The satisfaction of respondents of the redeveloped housing area was
studied based on the following aspects:
a) Quality of house
b) Size of house
c) Security aspect
d) Comfort of house
e) Healthy aspect of house
f) Water supply
g) Electricity supply
h) Solid waste management
i) Road condition
j) Accessibility (distance to the main road)
Case Study
At the end of December 2014, there was a catastrophic flood that was known as
the 'Bah Kuning' which resulted in almost 85% of the total Kuala Krai area,
especially the Manik Urai Village, Manjor Village, Karangan Village, and Laloh
and Dabong Village inundated by flood water. Due to this massive flood,
residents in this Kuala Krai area have lost their properties and belonging. The
losses included houses, house fixtures and fittings, vehicles, and other
belongings. Affected housing areas were redeveloped to provide new permanent
houses for the victims. Figure 1 shows the views of the study area, Kuala Krai
during the massive flood.
Figure 1: Views of study area when it was flooded in December 2014
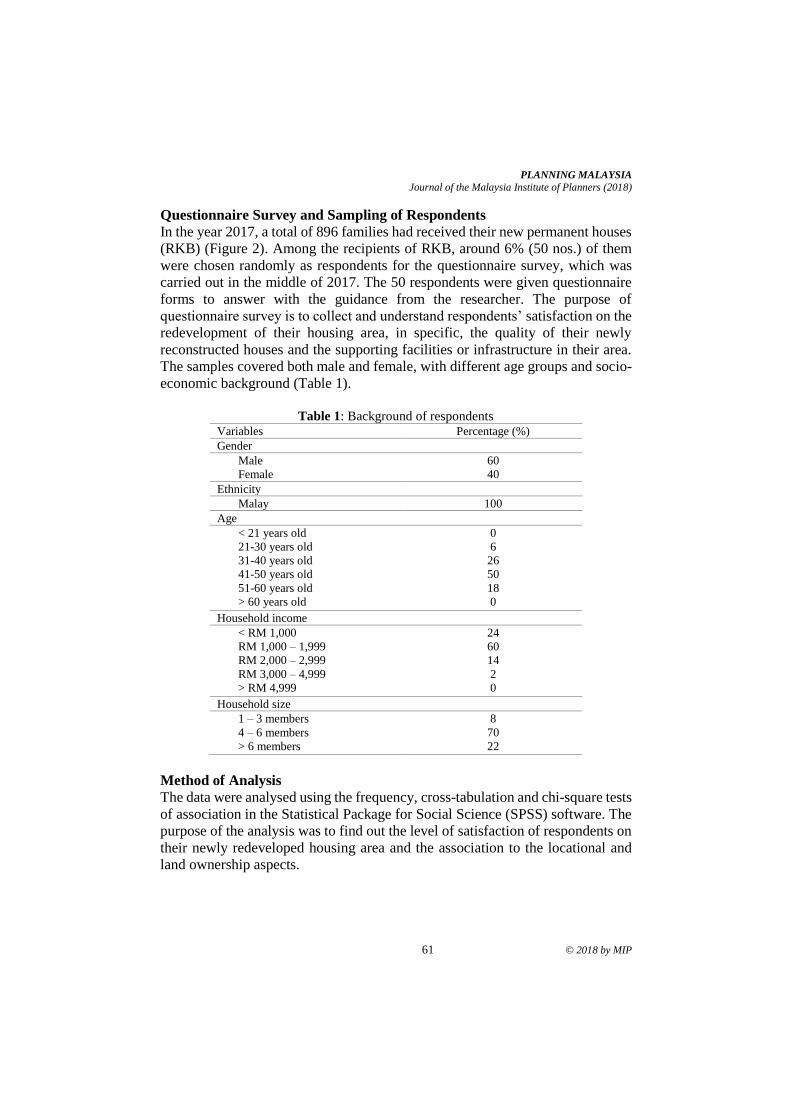
PLANNING MALAYSIA
Journal of the Malaysia Institute of Planners (2018)
61 © 2018 by MIP
Questionnaire Survey and Sampling of Respondents
In the year 2017, a total of 896 families had received their new permanent houses
(RKB) (Figure 2). Among the recipients of RKB, around 6% (50 nos.) of them
were chosen randomly as respondents for the questionnaire survey, which was
carried out in the middle of 2017. The 50 respondents were given questionnaire
forms to answer with the guidance from the researcher. The purpose of
questionnaire survey is to collect and understand respondents’ satisfaction on the
redevelopment of their housing area, in specific, the quality of their newly
reconstructed houses and the supporting facilities or infrastructure in their area.
The samples covered both male and female, with different age groups and socio-
economic background (Table 1).
Table 1: Background of respondents
Variables Percentage (%)
Gender
Male
Female
60
40
Ethnicity
Malay 100
Age
< 21 years old
21-30 years old
31-40 years old
41-50 years old
51-60 years old
> 60 years old
0
6
26
50
18
0
Household income
< RM 1,000
RM 1,000 – 1,999
RM 2,000 – 2,999
RM 3,000 – 4,999
> RM 4,999
24
60
14
2
0
Household size
1 – 3 members
4 – 6 members
> 6 members
8
70
22
Method of Analysis
The data were analysed using the frequency, cross-tabulation and chi-square tests
of association in the Statistical Package for Social Science (SPSS) software. The
purpose of the analysis was to find out the level of satisfaction of respondents on
their newly redeveloped housing area and the association to the locational and
land ownership aspects.
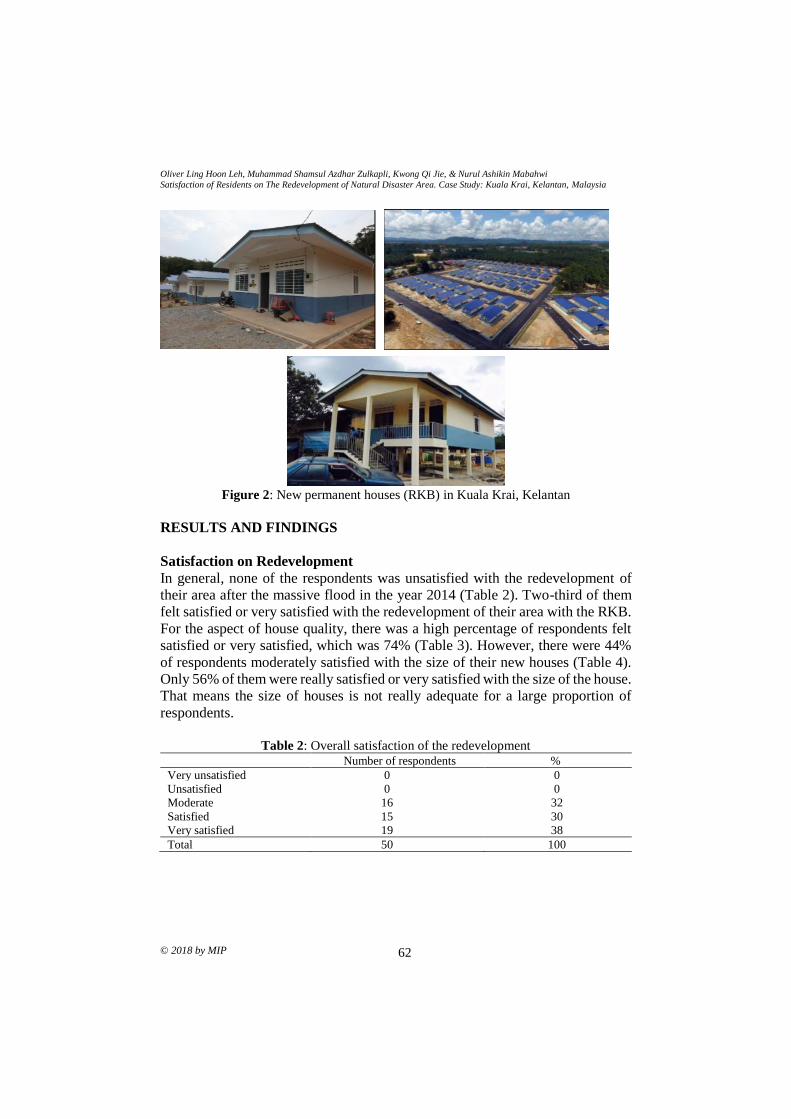
Oliver Ling Hoon Leh, Muhammad Shamsul Azdhar Zulkapli, Kwong Qi Jie, & Nurul Ashikin Mabahwi
Satisfaction of Residents on The Redevelopment of Natural Disaster Area. Case Study: Kuala Krai, Kelantan, Malaysia
© 2018 by MIP 62
Figure 2: New permanent houses (RKB) in Kuala Krai, Kelantan
RESULTS AND FINDINGS
Satisfaction on Redevelopment
In general, none of the respondents was unsatisfied with the redevelopment of
their area after the massive flood in the year 2014 (Table 2). Two-third of them
felt satisfied or very satisfied with the redevelopment of their area with the RKB.
For the aspect of house quality, there was a high percentage of respondents felt
satisfied or very satisfied, which was 74% (Table 3). However, there were 44%
of respondents moderately satisfied with the size of their new houses (Table 4).
Only 56% of them were really satisfied or very satisfied with the size of the house.
That means the size of houses is not really adequate for a large proportion of
respondents.
Table 2: Overall satisfaction of the redevelopment
Number of respondents %
Very unsatisfied 0 0
Unsatisfied 0 0
Moderate 16 32
Satisfied 15 30
Very satisfied 19 38
Total 50 100
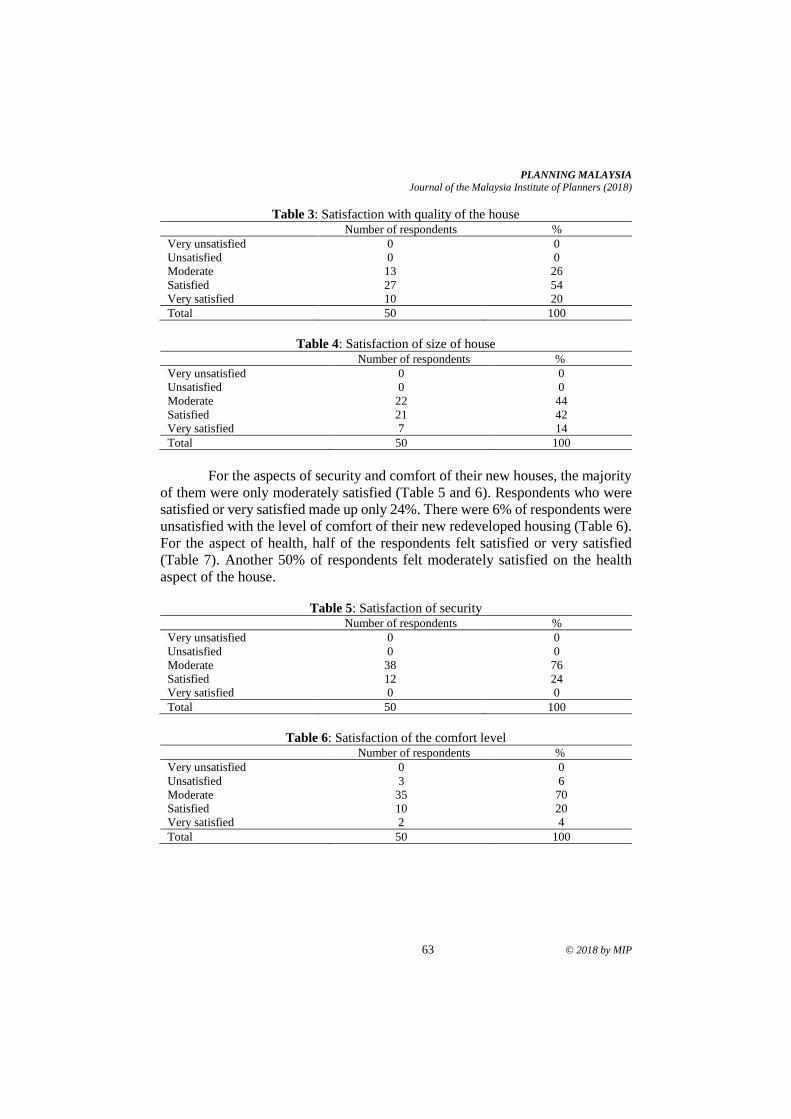
PLANNING MALAYSIA
Journal of the Malaysia Institute of Planners (2018)
63 © 2018 by MIP
Table 3: Satisfaction with quality of the house Number of respondents %
Very unsatisfied 0 0
Unsatisfied 0 0
Moderate 13 26
Satisfied 27 54
Very satisfied 10 20
Total 50 100
Table 4: Satisfaction of size of house Number of respondents %
Very unsatisfied 0 0
Unsatisfied 0 0
Moderate 22 44
Satisfied 21 42
Very satisfied 7 14
Total 50 100
For the aspects of security and comfort of their new houses, the majority
of them were only moderately satisfied (Table 5 and 6). Respondents who were
satisfied or very satisfied made up only 24%. There were 6% of respondents were
unsatisfied with the level of comfort of their new redeveloped housing (Table 6).
For the aspect of health, half of the respondents felt satisfied or very satisfied
(Table 7). Another 50% of respondents felt moderately satisfied on the health
aspect of the house.
Table 5: Satisfaction of security Number of respondents %
Very unsatisfied 0 0
Unsatisfied 0 0
Moderate 38 76
Satisfied 12 24
Very satisfied 0 0
Total 50 100
Table 6: Satisfaction of the comfort level Number of respondents %
Very unsatisfied 0 0
Unsatisfied 3 6
Moderate 35 70
Satisfied 10 20
Very satisfied 2 4
Total 50 100
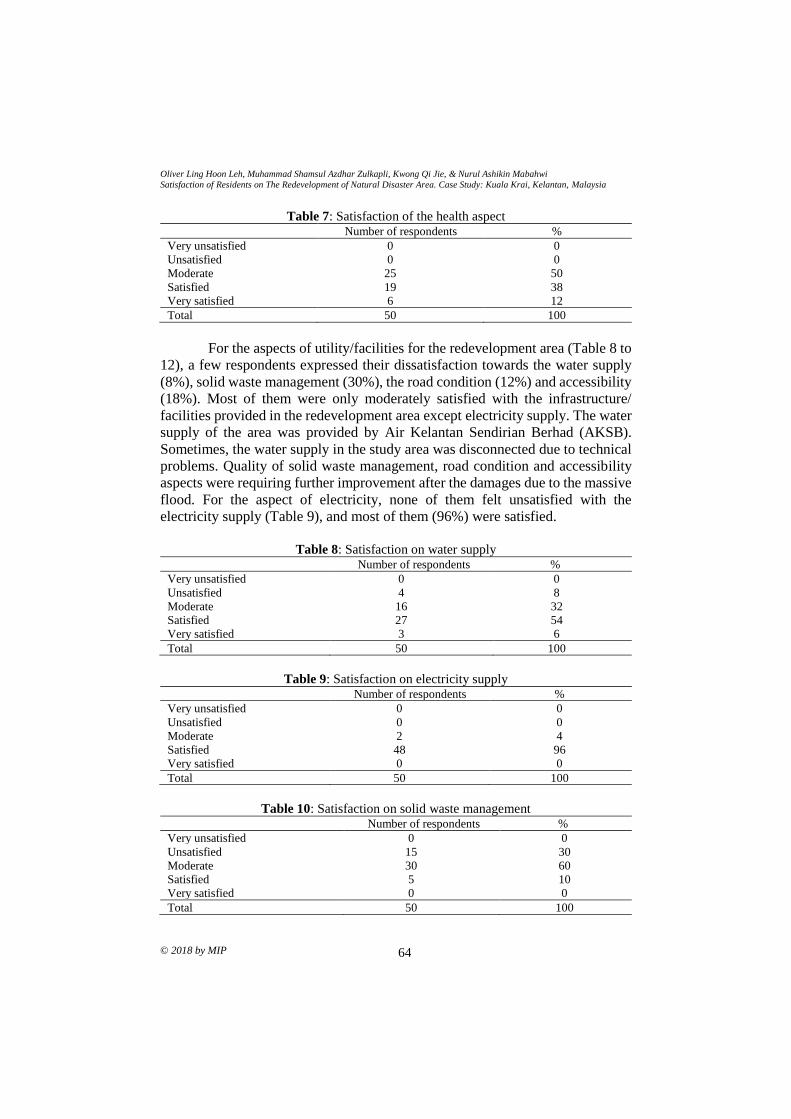
Oliver Ling Hoon Leh, Muhammad Shamsul Azdhar Zulkapli, Kwong Qi Jie, & Nurul Ashikin Mabahwi
Satisfaction of Residents on The Redevelopment of Natural Disaster Area. Case Study: Kuala Krai, Kelantan, Malaysia
© 2018 by MIP 64
Table 7: Satisfaction of the health aspect Number of respondents %
Very unsatisfied 0 0
Unsatisfied 0 0
Moderate 25 50
Satisfied 19 38
Very satisfied 6 12
Total 50 100
For the aspects of utility/facilities for the redevelopment area (Table 8 to
12), a few respondents expressed their dissatisfaction towards the water supply
(8%), solid waste management (30%), the road condition (12%) and accessibility
(18%). Most of them were only moderately satisfied with the infrastructure/
facilities provided in the redevelopment area except electricity supply. The water
supply of the area was provided by Air Kelantan Sendirian Berhad (AKSB).
Sometimes, the water supply in the study area was disconnected due to technical
problems. Quality of solid waste management, road condition and accessibility
aspects were requiring further improvement after the damages due to the massive
flood. For the aspect of electricity, none of them felt unsatisfied with the
electricity supply (Table 9), and most of them (96%) were satisfied.
Table 8: Satisfaction on water supply
Number of respondents %
Very unsatisfied 0 0
Unsatisfied 4 8
Moderate 16 32
Satisfied 27 54
Very satisfied 3 6
Total 50 100
Table 9: Satisfaction on electricity supply Number of respondents %
Very unsatisfied 0 0
Unsatisfied 0 0
Moderate 2 4
Satisfied 48 96
Very satisfied 0 0
Total 50 100
Table 10: Satisfaction on solid waste management Number of respondents %
Very unsatisfied 0 0
Unsatisfied 15 30
Moderate 30 60
Satisfied 5 10
Very satisfied 0 0
Total 50 100
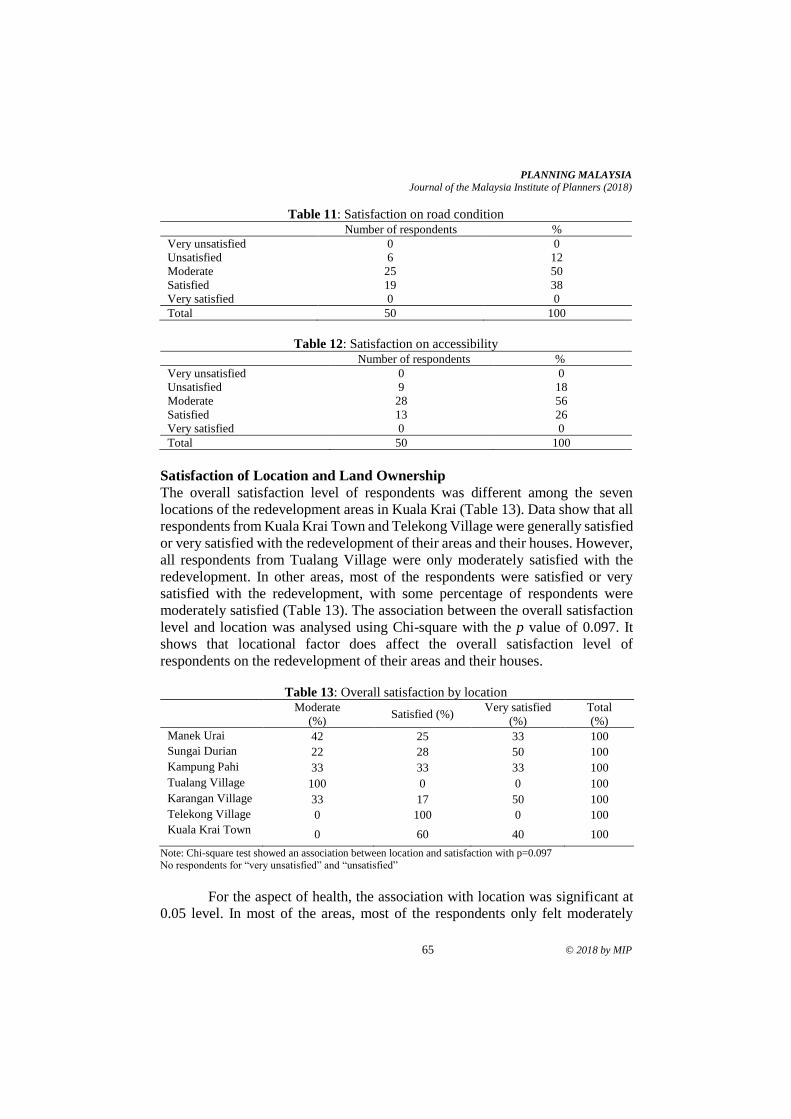
PLANNING MALAYSIA
Journal of the Malaysia Institute of Planners (2018)
65 © 2018 by MIP
Table 11: Satisfaction on road condition Number of respondents %
Very unsatisfied 0 0
Unsatisfied 6 12
Moderate 25 50
Satisfied 19 38
Very satisfied 0 0
Total 50 100
Table 12: Satisfaction on accessibility Number of respondents %
Very unsatisfied 0 0
Unsatisfied 9 18
Moderate 28 56
Satisfied 13 26
Very satisfied 0 0
Total 50 100
Satisfaction of Location and Land Ownership
The overall satisfaction level of respondents was different among the seven
locations of the redevelopment areas in Kuala Krai (Table 13). Data show that all
respondents from Kuala Krai Town and Telekong Village were generally satisfied
or very satisfied with the redevelopment of their areas and their houses. However,
all respondents from Tualang Village were only moderately satisfied with the
redevelopment. In other areas, most of the respondents were satisfied or very
satisfied with the redevelopment, with some percentage of respondents were
moderately satisfied (Table 13). The association between the overall satisfaction
level and location was analysed using Chi-square with the p value of 0.097. It
shows that locational factor does affect the overall satisfaction level of
respondents on the redevelopment of their areas and their houses.
Table 13: Overall satisfaction by location Moderate
(%) Satisfied (%)
Very satisfied
(%)
Total
(%)
Manek Urai 42 25 33 100
Sungai Durian 22 28 50 100
Kampung Pahi 33 33 33 100
Tualang Village 100 0 0 100
Karangan Village 33 17 50 100
Telekong Village 0 100 0 100
Kuala Krai Town 0 60 40 100
Note: Chi-square test showed an association between location and satisfaction with p=0.097 No respondents for “very unsatisfied” and “unsatisfied”
For the aspect of health, the association with location was significant at
0.05 level. In most of the areas, most of the respondents only felt moderately
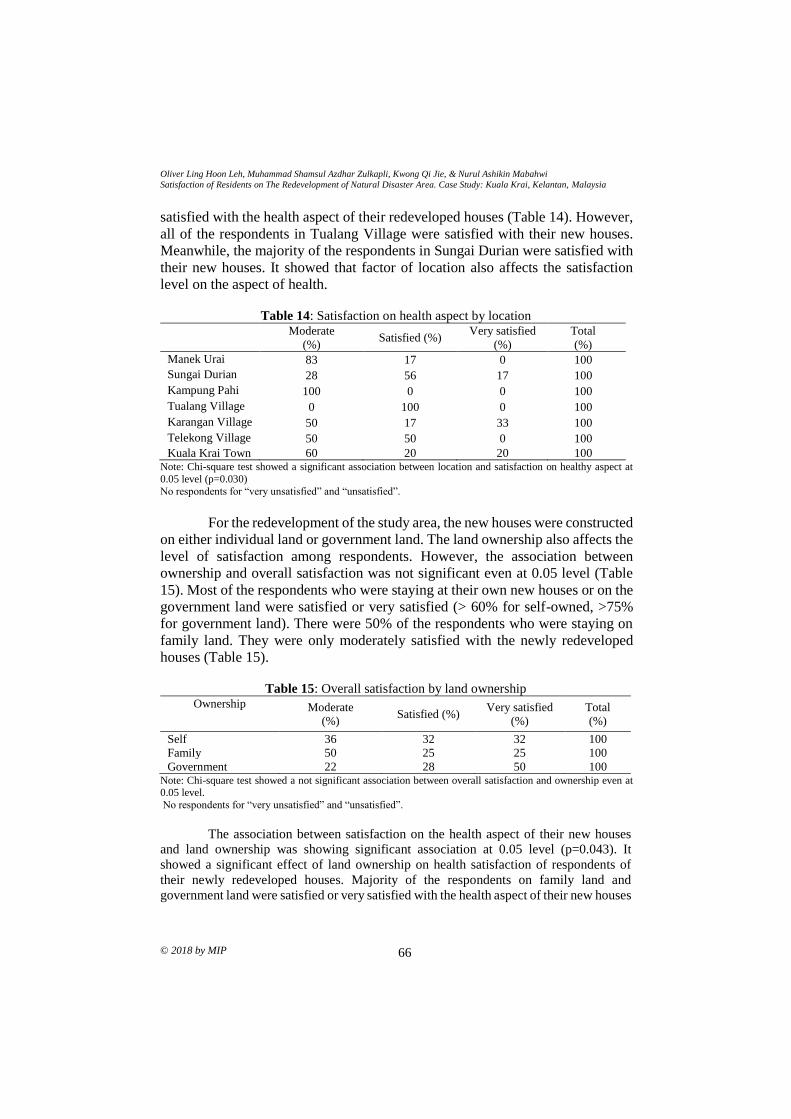
Oliver Ling Hoon Leh, Muhammad Shamsul Azdhar Zulkapli, Kwong Qi Jie, & Nurul Ashikin Mabahwi
Satisfaction of Residents on The Redevelopment of Natural Disaster Area. Case Study: Kuala Krai, Kelantan, Malaysia
© 2018 by MIP 66
satisfied with the health aspect of their redeveloped houses (Table 14). However,
all of the respondents in Tualang Village were satisfied with their new houses.
Meanwhile, the majority of the respondents in Sungai Durian were satisfied with
their new houses. It showed that factor of location also affects the satisfaction
level on the aspect of health.
Table 14: Satisfaction on health aspect by location Moderate
(%) Satisfied (%)
Very satisfied
(%)
Total
(%)
Manek Urai 83 17 0 100
Sungai Durian 28 56 17 100
Kampung Pahi 100 0 0 100
Tualang Village 0 100 0 100
Karangan Village 50 17 33 100
Telekong Village 50 50 0 100
Kuala Krai Town 60 20 20 100 Note: Chi-square test showed a significant association between location and satisfaction on healthy aspect at
0.05 level (p=0.030) No respondents for “very unsatisfied” and “unsatisfied”.
For the redevelopment of the study area, the new houses were constructed
on either individual land or government land. The land ownership also affects the
level of satisfaction among respondents. However, the association between
ownership and overall satisfaction was not significant even at 0.05 level (Table
15). Most of the respondents who were staying at their own new houses or on the
government land were satisfied or very satisfied (> 60% for self-owned, >75%
for government land). There were 50% of the respondents who were staying on
family land. They were only moderately satisfied with the newly redeveloped
houses (Table 15).
Table 15: Overall satisfaction by land ownership Ownership Moderate
(%) Satisfied (%)
Very satisfied
(%)
Total
(%)
Self 36 32 32 100
Family 50 25 25 100
Government 22 28 50 100 Note: Chi-square test showed a not significant association between overall satisfaction and ownership even at 0.05 level.
No respondents for “very unsatisfied” and “unsatisfied”.
The association between satisfaction on the health aspect of their new houses
and land ownership was showing significant association at 0.05 level (p=0.043). It
showed a significant effect of land ownership on health satisfaction of respondents of
their newly redeveloped houses. Majority of the respondents on family land and
government land were satisfied or very satisfied with the health aspect of their new houses
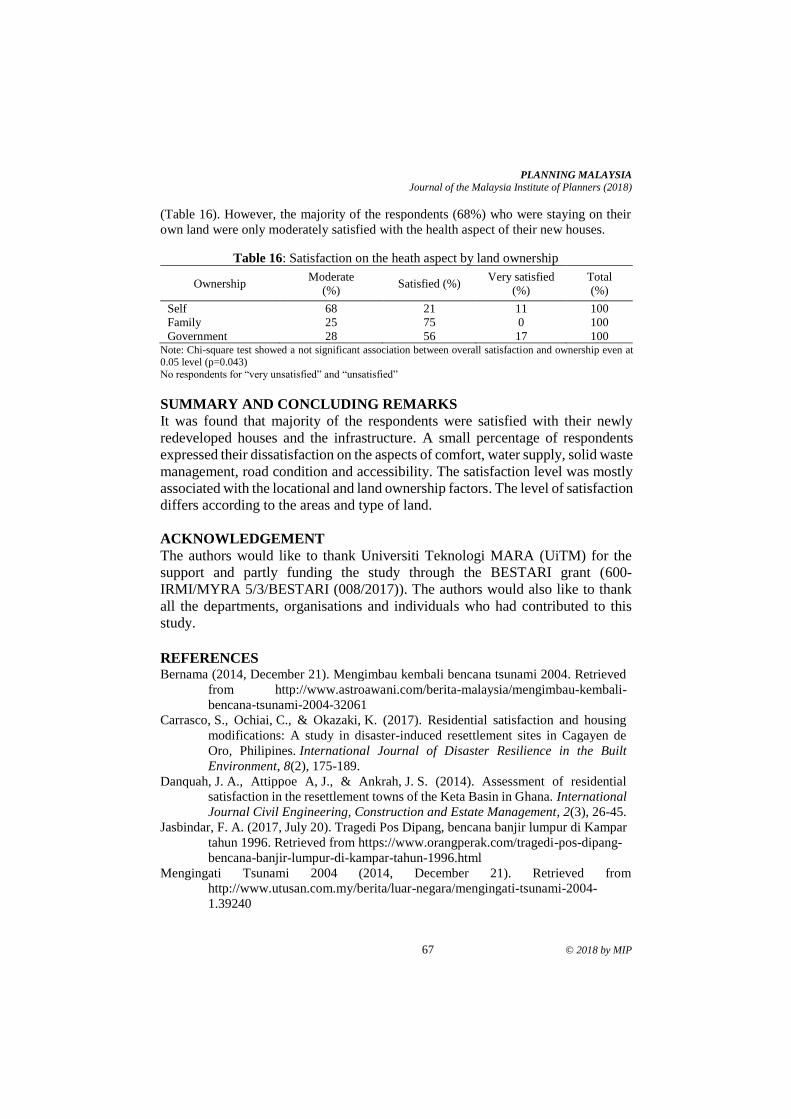
PLANNING MALAYSIA
Journal of the Malaysia Institute of Planners (2018)
67 © 2018 by MIP
(Table 16). However, the majority of the respondents (68%) who were staying on their
own land were only moderately satisfied with the health aspect of their new houses.
Table 16: Satisfaction on the heath aspect by land ownership
Ownership Moderate
(%) Satisfied (%)
Very satisfied
(%)
Total
(%)
Self 68 21 11 100
Family 25 75 0 100
Government 28 56 17 100 Note: Chi-square test showed a not significant association between overall satisfaction and ownership even at 0.05 level (p=0.043)
No respondents for “very unsatisfied” and “unsatisfied”
SUMMARY AND CONCLUDING REMARKS
It was found that majority of the respondents were satisfied with their newly
redeveloped houses and the infrastructure. A small percentage of respondents
expressed their dissatisfaction on the aspects of comfort, water supply, solid waste
management, road condition and accessibility. The satisfaction level was mostly
associated with the locational and land ownership factors. The level of satisfaction
differs according to the areas and type of land.
ACKNOWLEDGEMENT
The authors would like to thank Universiti Teknologi MARA (UiTM) for the
support and partly funding the study through the BESTARI grant (600-
IRMI/MYRA 5/3/BESTARI (008/2017)). The authors would also like to thank
all the departments, organisations and individuals who had contributed to this
study.
REFERENCES Bernama (2014, December 21). Mengimbau kembali bencana tsunami 2004. Retrieved
from http://www.astroawani.com/berita-malaysia/mengimbau-kembali-
bencana-tsunami-2004-32061
Carrasco, S., Ochiai, C., & Okazaki, K. (2017). Residential satisfaction and housing
modifications: A study in disaster-induced resettlement sites in Cagayen de
Oro, Philipines. International Journal of Disaster Resilience in the Built
Environment, 8(2), 175-189.
Danquah, J. A., Attippoe A, J., & Ankrah, J. S. (2014). Assessment of residential
satisfaction in the resettlement towns of the Keta Basin in Ghana. International
Journal Civil Engineering, Construction and Estate Management, 2(3), 26-45.
Jasbindar, F. A. (2017, July 20). Tragedi Pos Dipang, bencana banjir lumpur di Kampar
tahun 1996. Retrieved from https://www.orangperak.com/tragedi-pos-dipang-
bencana-banjir-lumpur-di-kampar-tahun-1996.html
Mengingati Tsunami 2004 (2014, December 21). Retrieved from
http://www.utusan.com.my/berita/luar-negara/mengingati-tsunami-2004-
1.39240

Oliver Ling Hoon Leh, Muhammad Shamsul Azdhar Zulkapli, Kwong Qi Jie, & Nurul Ashikin Mabahwi
Satisfaction of Residents on The Redevelopment of Natural Disaster Area. Case Study: Kuala Krai, Kelantan, Malaysia
© 2018 by MIP 68
National Security Council (2014). National Security Council Directive No. 20 – Policy
and mechanism of national disaster management and relief. Malaysia: Prime
Minister’s Department.
Rani, W. N. M. W. M., Nifa, F. A., Ismail, M. N., & Khalid, K. N. (2017). Planning for
post disaster recovery: Lesson learnt from flood events in Kelantan
Malaysia. AIP Conference Proceedings 1891, 020143. (n.p.): American Institute
of Physics.
Wijegunarathna, E., Wedawatta, G., Prasanna, L., & Ingirige, B. (2018). Long-term
satisfaction of resettled communities: An assessment of physical performance of
post-disaster housing. Procedia Engineering, 212, 1147-1154.
1Senior Lecturer at Universiti Teknologi MARA, Malaysia. Email: [email protected] 69
PLANNING MALAYSIA:
Journal of the Malaysian Institute of Planners
VOLUME 16 ISSUE 3 (2018) Page 69 – 82
DEVELOPING A 3-D GIS MODEL FOR URBAN PLANNING. CASE
STUDY: AMPANG JAYA, MALAYSIA
Mimi Zaleha Abdul Ghani1, Yazid Sarkom2 & Zalina Samadi3
1,2,3Faculty of Architecture, Planning and Surveying
UNIVERSITI TEKNOLOGI MARA, MALAYSIA
Abstract
This paper aims to explore the rich potential of interactive visualisation
environment integrating GIS for modelling urban growth and spatio-temporal
transformation of Malaysian cities. As a case study example, authors consider a
3-D GIS model of Ampang Jaya, Selangor to investigate the techniques of data
acquisition, data reconstruction from physical to digital, urban analysis and
visualisation in constructing a digital model ranging from low to high geometric
content including 2-D digital maps, digital orthographic and full volumetric
parametric modelling. The key aspect of this virtual model is how it would assist
in understanding the urban planning and design of Ampang Jaya by translating
complex spatial information that are currently used by the authorities for planning
activities such as maps, plans and written information into responsive, easily
understandable spatial information. It could serve as a new platform to
disseminate information about Ampang Jaya, bridge gaps among professionals
involved in planning processes, improve communications among decision
makers, stakeholders and the public as well as support decision making about the
spatial growth of Ampang Jaya. Demonstrations of Ampang Jaya will also
provide a clearer picture of the importance of ownership and control of 3-D
models by local councils in empowering them in decision making, for example,
in improving transparency, and avoiding misuse by project developers (Shiffer
1993; Sunesson et al., 2008). Such environment will improve the subsequent
digital models and research in the area of urban design and planning in Malaysia
where visual communication is pivotal.
Keywords: 3-D GIS, visualisation, planning support tool, communication
platform, urban planning
Mimi Zaleha Abdul Ghani, Yazid Sarkom, & Zalina Samadi
Developing a 3-D GIS Model for Urban Planning. Case Study: Ampang Jaya, Malaysia
© 2018 by MIP 70
INTRODUCTION
The general aim of Virtual Ampang Jaya is to assist planning activities in
Malaysia and promoting the advantage of a ready visualisation of complex 3-D
information. It will suggest how complex city information could be held within a
3-D environment which can be visually seen and made interactive by means of
stronger coupling; embedding the 3-D model within the functions of GIS system
as a more advanced version of weaker coupling (Batty, 2012). The planning
issues and challenges of the urban context would be considered before designing
the strategies of developing a case study involving the processes of modelling,
data acquisition, data reconstruction, and finally the 3-D visualisation that is
effective in serving a sense of understanding of a larger context of the building
and its surroundings (Herbet & Xuwei, 2015).
In addressing the spatio-temporal transformation of Malaysian cities and
towns, the government through its multimedia agency MDec is called upon to
respond to the pressing need to develop expertise in the application of digital
media in the Malaysian urban planning (Lee & Ahmad, 2000). Currently, there is
a lack of study integrating 2-D GIS and 3-D models in the context of Malaysian
planning practices, which are distinctive in terms of their policy, social and
cultural context and administration (Abdullah, Abdullah, & Ibrahim, 2009; Rafi
& Rani 2008). Set as an experimental test pad in the uptake of digital and
multimedia in Malaysia, Virtual Ampang Jaya will explore the GIS analytical and
querying capabilities with interactive visualisation environment while
demonstrating the usefulness of 3-D visualisation and GIS in planning.
MOTIVATIONS
Cities are highly complex systems and digital media offers a new understanding
of urban problems. In understanding how cities operate and informing the
planning and design process, various simulation models operating at different
spatial scales and over different temporal period have been constructed over the
last 50 years (Batty, 2012). Defined as “a city in which ICT is merged with
traditional infrastructures, coordinated and integrated using new digital
technologies” (Batty, 2012: 481), “smart cities” are amongst ambitious models
developed to control the urbanisation processes to avoid future development
failure from inefficient urban planning (Thuzar, 2012). While some adopt more
sophisticated approaches such as “unified process” for standardise and effective
system (Rong, Wu, & Shang, 2017), others use less ambitious technological
inventions such as Twitter data in developing a close and up-to-date connection
to the city of Amsterdam involving a real-time system based analysis (Arribas-
Bel, Kourtit, Nijkamp, & Steenbruggen, 2015). Such responsive spatial
information further enriches understanding of urban issues to better facilitate the
planning process to produce better result and decisions.

PLANNING MALAYSIA
Journal of the Malaysia Institute of Planners (2018)
71 © 2018 by MIP
The development of 3-D GIS is large scale and complex multi-
dimensional involving many aspects and involving theories and technologies
(Rong et al., 2017). Planning information can be easily understood and
disseminated to residents as the virtual model translates complex city information
that is usually tailored to a specific group of professionals into responsive spatial
information that will be more easily understood by layman amongst stakeholders
who are not taught to read coded information such as plans and maps. Highly
realistic model is a successful method in communicating with the public and have
been used in the Malaysian context in advertising new large cities. While
visualisation is amongst the most powerful tool for promoting urban changes, city
officials, urban planners and the general public must be able to visualise urban
plans along with all the infrastructure that already exists (Lopes & Lindström
2012). However, although studies on planning support system using 3-D
visualisation and GIS are abundant, their role in the practice of urban planning
since their emergence in the 1990s, and despite the long term use of 3-D
visualisation tools in planning, is questionable. This could relate a wider range of
problems including issues of developer and operator of the models, and whether
the models enable new kinds of processes and new levels of engagement amongst
users (Lopes & Lindström, 2012), as well as many studies in planning support
system are not integrating real-world practice as they mainly involve stand-alone
projects (Brail & Klosterman, 2001). Therefore, this study will involve real
projects and the local planning authorities to help to demonstrate the true process
and challenges of developing a 3-D visualisation and GIS model to enhance
methods of current planning and consultation processes by decision makers and
communicate with the various stakeholders including the public (Pietsch, 2000).
THE PROPOSED VIRTUAL AMPANG JAYA
As a planning support tool, 3-D modelling and visualisation can offer new ways
in addressing thes issues affecting Ampang Jaya. Various scenarios can also be
generated to study the urban impact with different sets of design parameters. As
analytical tool to study the growth and spatio-temporal transformation of Ampang
Jaya in 50 years since 1900, it will demonstrate and evaluate attributes of Ampang
Jaya by adopting the Community Taxonomy (Florida House Institute, n.d.),
according to four layers: social, economic, natural and the built environment. The
interactive visualisation viewer in ArcGlobe® will offer a more meaningful
understanding of Ampang Jaya, highlighting its urban layers that would
otherwise be limited to the form of 2-D abstract data.
Growth patterns of the city will be traced, displaying the current scenario
as well as past development involving historical, environmental and large scale
settlement patterns. By understanding the past and the present situation and
analysing spatio-temporal transformation of Ampang Jaya, users can measure
growth patterns of land use, neighbourhood and regional transportation planning,
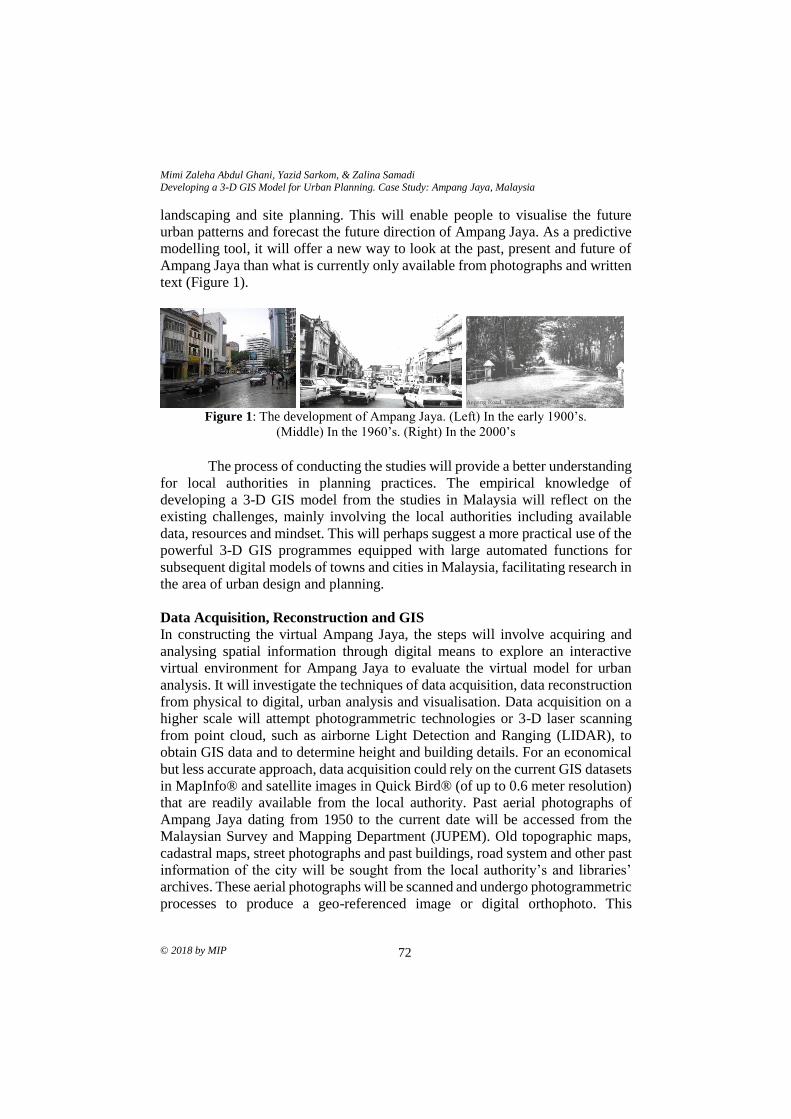
Mimi Zaleha Abdul Ghani, Yazid Sarkom, & Zalina Samadi
Developing a 3-D GIS Model for Urban Planning. Case Study: Ampang Jaya, Malaysia
© 2018 by MIP 72
landscaping and site planning. This will enable people to visualise the future
urban patterns and forecast the future direction of Ampang Jaya. As a predictive
modelling tool, it will offer a new way to look at the past, present and future of
Ampang Jaya than what is currently only available from photographs and written
text (Figure 1).
Figure 1: The development of Ampang Jaya. (Left) In the early 1900’s.
(Middle) In the 1960’s. (Right) In the 2000’s
The process of conducting the studies will provide a better understanding
for local authorities in planning practices. The empirical knowledge of
developing a 3-D GIS model from the studies in Malaysia will reflect on the
existing challenges, mainly involving the local authorities including available
data, resources and mindset. This will perhaps suggest a more practical use of the
powerful 3-D GIS programmes equipped with large automated functions for
subsequent digital models of towns and cities in Malaysia, facilitating research in
the area of urban design and planning.
Data Acquisition, Reconstruction and GIS
In constructing the virtual Ampang Jaya, the steps will involve acquiring and
analysing spatial information through digital means to explore an interactive
virtual environment for Ampang Jaya to evaluate the virtual model for urban
analysis. It will investigate the techniques of data acquisition, data reconstruction
from physical to digital, urban analysis and visualisation. Data acquisition on a
higher scale will attempt photogrammetric technologies or 3-D laser scanning
from point cloud, such as airborne Light Detection and Ranging (LIDAR), to
obtain GIS data and to determine height and building details. For an economical
but less accurate approach, data acquisition could rely on the current GIS datasets
in MapInfo® and satellite images in Quick Bird® (of up to 0.6 meter resolution)
that are readily available from the local authority. Past aerial photographs of
Ampang Jaya dating from 1950 to the current date will be accessed from the
Malaysian Survey and Mapping Department (JUPEM). Old topographic maps,
cadastral maps, street photographs and past buildings, road system and other past
information of the city will be sought from the local authority’s and libraries’
archives. These aerial photographs will be scanned and undergo photogrammetric
processes to produce a geo-referenced image or digital orthophoto. This
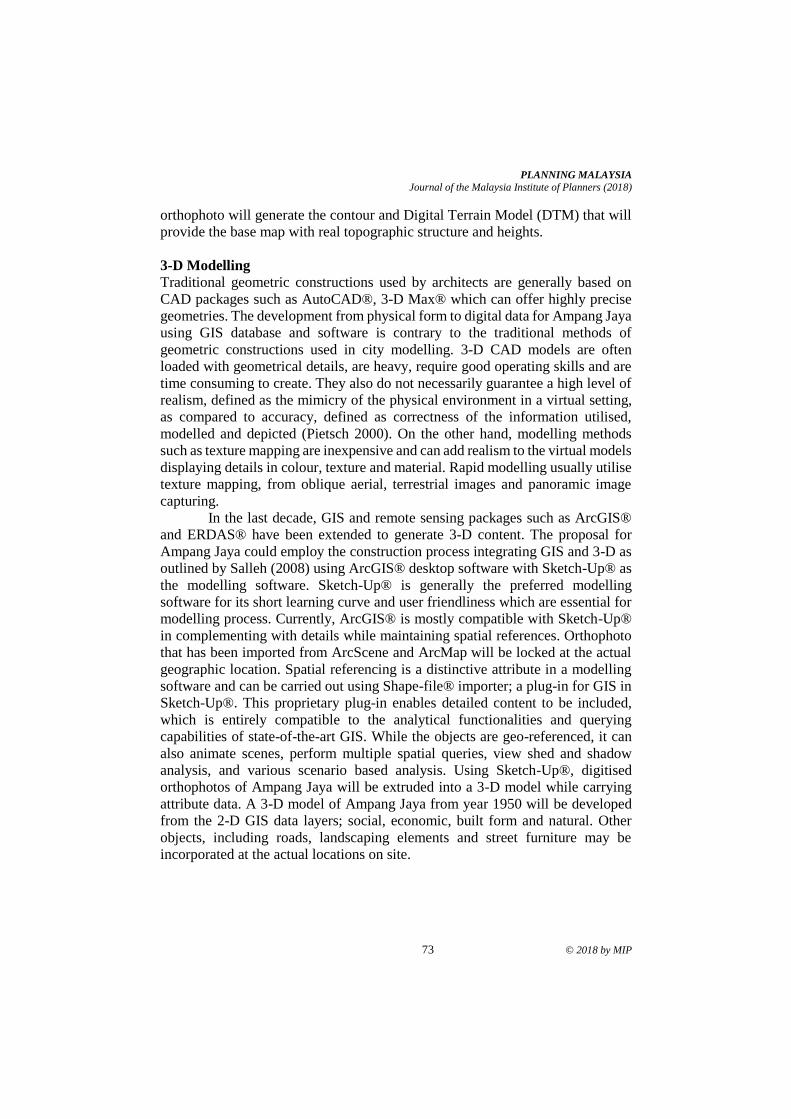
PLANNING MALAYSIA
Journal of the Malaysia Institute of Planners (2018)
73 © 2018 by MIP
orthophoto will generate the contour and Digital Terrain Model (DTM) that will
provide the base map with real topographic structure and heights.
3-D Modelling
Traditional geometric constructions used by architects are generally based on
CAD packages such as AutoCAD®, 3-D Max® which can offer highly precise
geometries. The development from physical form to digital data for Ampang Jaya
using GIS database and software is contrary to the traditional methods of
geometric constructions used in city modelling. 3-D CAD models are often
loaded with geometrical details, are heavy, require good operating skills and are
time consuming to create. They also do not necessarily guarantee a high level of
realism, defined as the mimicry of the physical environment in a virtual setting,
as compared to accuracy, defined as correctness of the information utilised,
modelled and depicted (Pietsch 2000). On the other hand, modelling methods
such as texture mapping are inexpensive and can add realism to the virtual models
displaying details in colour, texture and material. Rapid modelling usually utilise
texture mapping, from oblique aerial, terrestrial images and panoramic image
capturing.
In the last decade, GIS and remote sensing packages such as ArcGIS®
and ERDAS® have been extended to generate 3-D content. The proposal for
Ampang Jaya could employ the construction process integrating GIS and 3-D as
outlined by Salleh (2008) using ArcGIS® desktop software with Sketch-Up® as
the modelling software. Sketch-Up® is generally the preferred modelling
software for its short learning curve and user friendliness which are essential for
modelling process. Currently, ArcGIS® is mostly compatible with Sketch-Up®
in complementing with details while maintaining spatial references. Orthophoto
that has been imported from ArcScene and ArcMap will be locked at the actual
geographic location. Spatial referencing is a distinctive attribute in a modelling
software and can be carried out using Shape-file® importer; a plug-in for GIS in
Sketch-Up®. This proprietary plug-in enables detailed content to be included,
which is entirely compatible to the analytical functionalities and querying
capabilities of state-of-the-art GIS. While the objects are geo-referenced, it can
also animate scenes, perform multiple spatial queries, view shed and shadow
analysis, and various scenario based analysis. Using Sketch-Up®, digitised
orthophotos of Ampang Jaya will be extruded into a 3-D model while carrying
attribute data. A 3-D model of Ampang Jaya from year 1950 will be developed
from the 2-D GIS data layers; social, economic, built form and natural. Other
objects, including roads, landscaping elements and street furniture may be
incorporated at the actual locations on site.
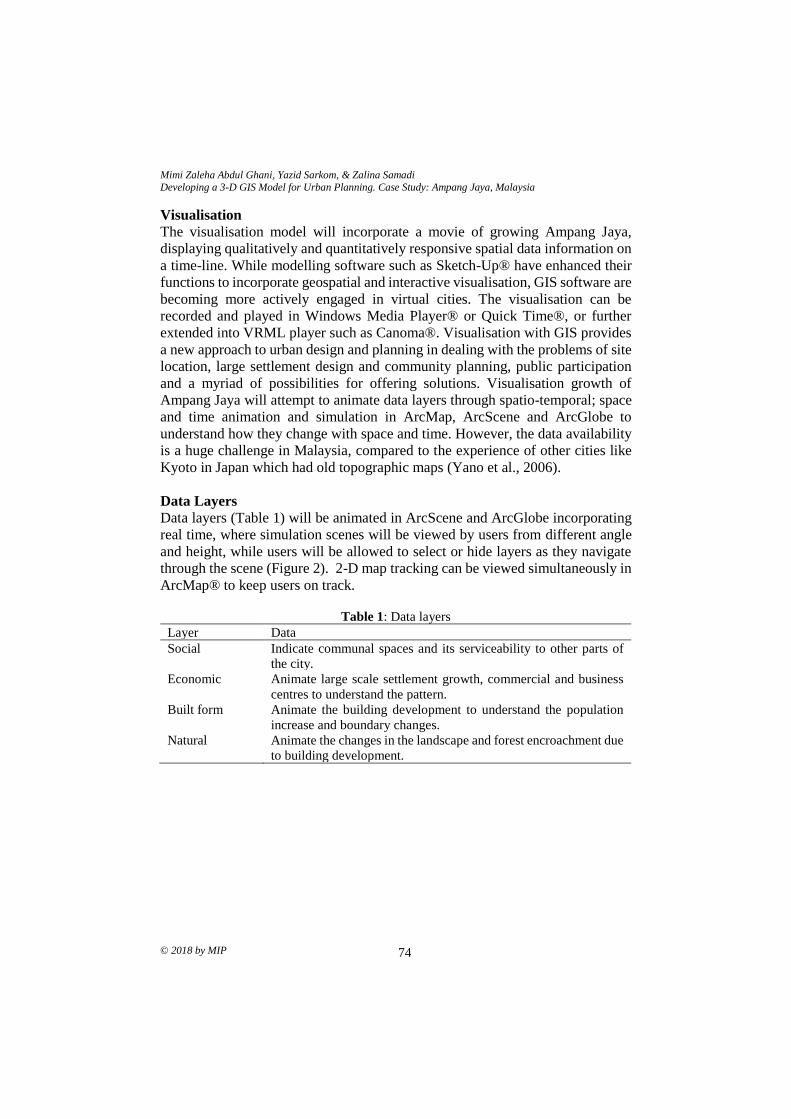
Mimi Zaleha Abdul Ghani, Yazid Sarkom, & Zalina Samadi
Developing a 3-D GIS Model for Urban Planning. Case Study: Ampang Jaya, Malaysia
© 2018 by MIP 74
Visualisation
The visualisation model will incorporate a movie of growing Ampang Jaya,
displaying qualitatively and quantitatively responsive spatial data information on
a time-line. While modelling software such as Sketch-Up® have enhanced their
functions to incorporate geospatial and interactive visualisation, GIS software are
becoming more actively engaged in virtual cities. The visualisation can be
recorded and played in Windows Media Player® or Quick Time®, or further
extended into VRML player such as Canoma®. Visualisation with GIS provides
a new approach to urban design and planning in dealing with the problems of site
location, large settlement design and community planning, public participation
and a myriad of possibilities for offering solutions. Visualisation growth of
Ampang Jaya will attempt to animate data layers through spatio-temporal; space
and time animation and simulation in ArcMap, ArcScene and ArcGlobe to
understand how they change with space and time. However, the data availability
is a huge challenge in Malaysia, compared to the experience of other cities like
Kyoto in Japan which had old topographic maps (Yano et al., 2006).
Data Layers
Data layers (Table 1) will be animated in ArcScene and ArcGlobe incorporating
real time, where simulation scenes will be viewed by users from different angle
and height, while users will be allowed to select or hide layers as they navigate
through the scene (Figure 2). 2-D map tracking can be viewed simultaneously in
ArcMap® to keep users on track.
Table 1: Data layers
Layer Data
Social Indicate communal spaces and its serviceability to other parts of
the city.
Economic Animate large scale settlement growth, commercial and business
centres to understand the pattern.
Built form Animate the building development to understand the population
increase and boundary changes.
Natural Animate the changes in the landscape and forest encroachment due
to building development.
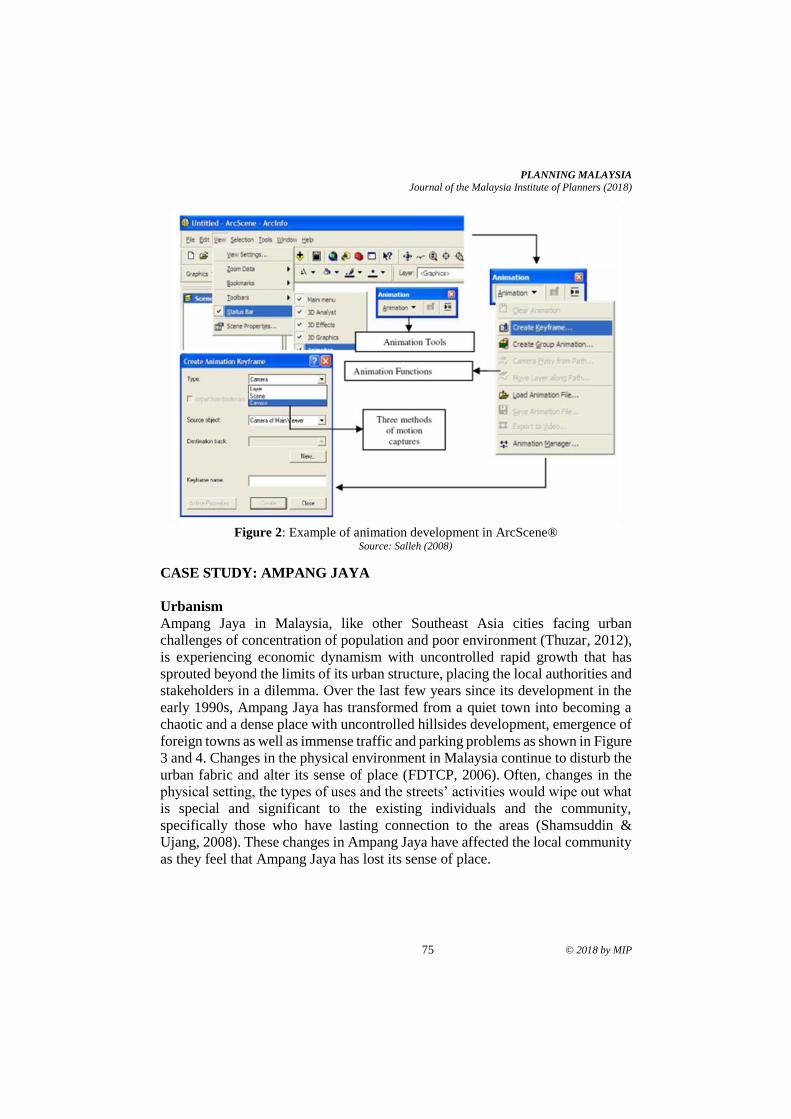
PLANNING MALAYSIA
Journal of the Malaysia Institute of Planners (2018)
75 © 2018 by MIP
Figure 2: Example of animation development in ArcScene®
Source: Salleh (2008)
CASE STUDY: AMPANG JAYA
Urbanism
Ampang Jaya in Malaysia, like other Southeast Asia cities facing urban
challenges of concentration of population and poor environment (Thuzar, 2012),
is experiencing economic dynamism with uncontrolled rapid growth that has
sprouted beyond the limits of its urban structure, placing the local authorities and
stakeholders in a dilemma. Over the last few years since its development in the
early 1990s, Ampang Jaya has transformed from a quiet town into becoming a
chaotic and a dense place with uncontrolled hillsides development, emergence of
foreign towns as well as immense traffic and parking problems as shown in Figure
3 and 4. Changes in the physical environment in Malaysia continue to disturb the
urban fabric and alter its sense of place (FDTCP, 2006). Often, changes in the
physical setting, the types of uses and the streets’ activities would wipe out what
is special and significant to the existing individuals and the community,
specifically those who have lasting connection to the areas (Shamsuddin &
Ujang, 2008). These changes in Ampang Jaya have affected the local community
as they feel that Ampang Jaya has lost its sense of place.
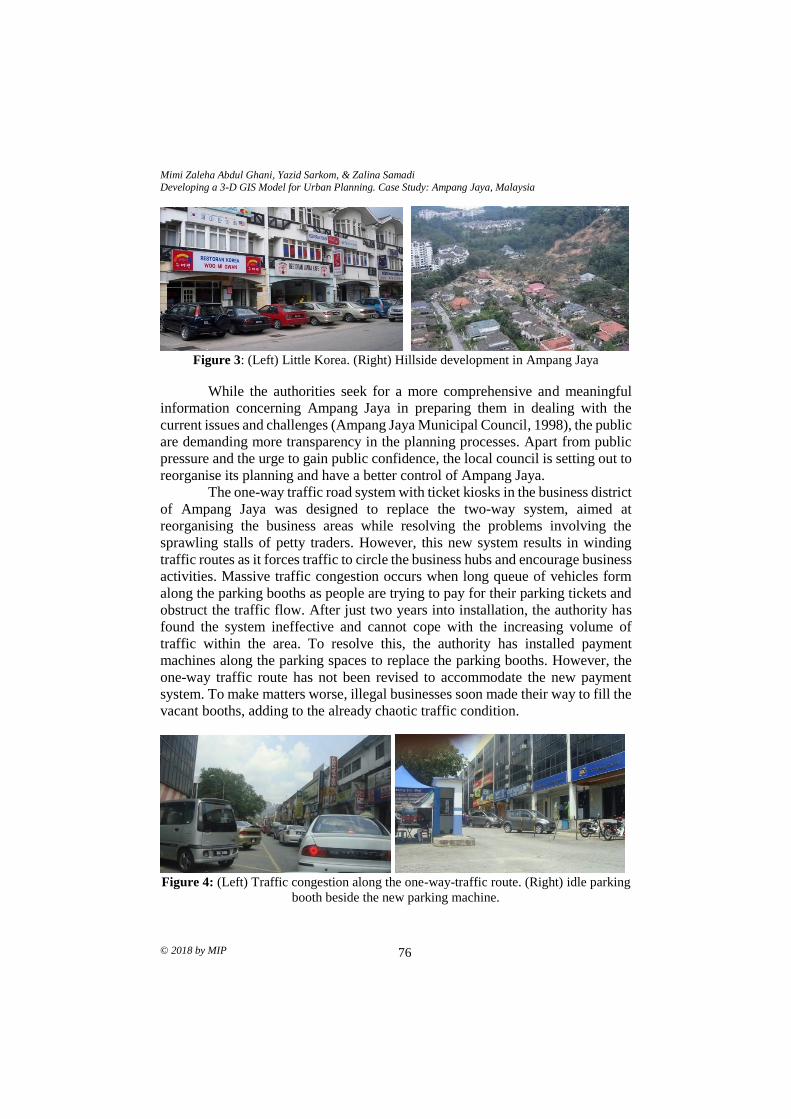
Mimi Zaleha Abdul Ghani, Yazid Sarkom, & Zalina Samadi
Developing a 3-D GIS Model for Urban Planning. Case Study: Ampang Jaya, Malaysia
© 2018 by MIP 76
Figure 3: (Left) Little Korea. (Right) Hillside development in Ampang Jaya
While the authorities seek for a more comprehensive and meaningful
information concerning Ampang Jaya in preparing them in dealing with the
current issues and challenges (Ampang Jaya Municipal Council, 1998), the public
are demanding more transparency in the planning processes. Apart from public
pressure and the urge to gain public confidence, the local council is setting out to
reorganise its planning and have a better control of Ampang Jaya.
The one-way traffic road system with ticket kiosks in the business district
of Ampang Jaya was designed to replace the two-way system, aimed at
reorganising the business areas while resolving the problems involving the
sprawling stalls of petty traders. However, this new system results in winding
traffic routes as it forces traffic to circle the business hubs and encourage business
activities. Massive traffic congestion occurs when long queue of vehicles form
along the parking booths as people are trying to pay for their parking tickets and
obstruct the traffic flow. After just two years into installation, the authority has
found the system ineffective and cannot cope with the increasing volume of
traffic within the area. To resolve this, the authority has installed payment
machines along the parking spaces to replace the parking booths. However, the
one-way traffic route has not been revised to accommodate the new payment
system. To make matters worse, illegal businesses soon made their way to fill the
vacant booths, adding to the already chaotic traffic condition.
Figure 4: (Left) Traffic congestion along the one-way-traffic route. (Right) idle parking
booth beside the new parking machine.
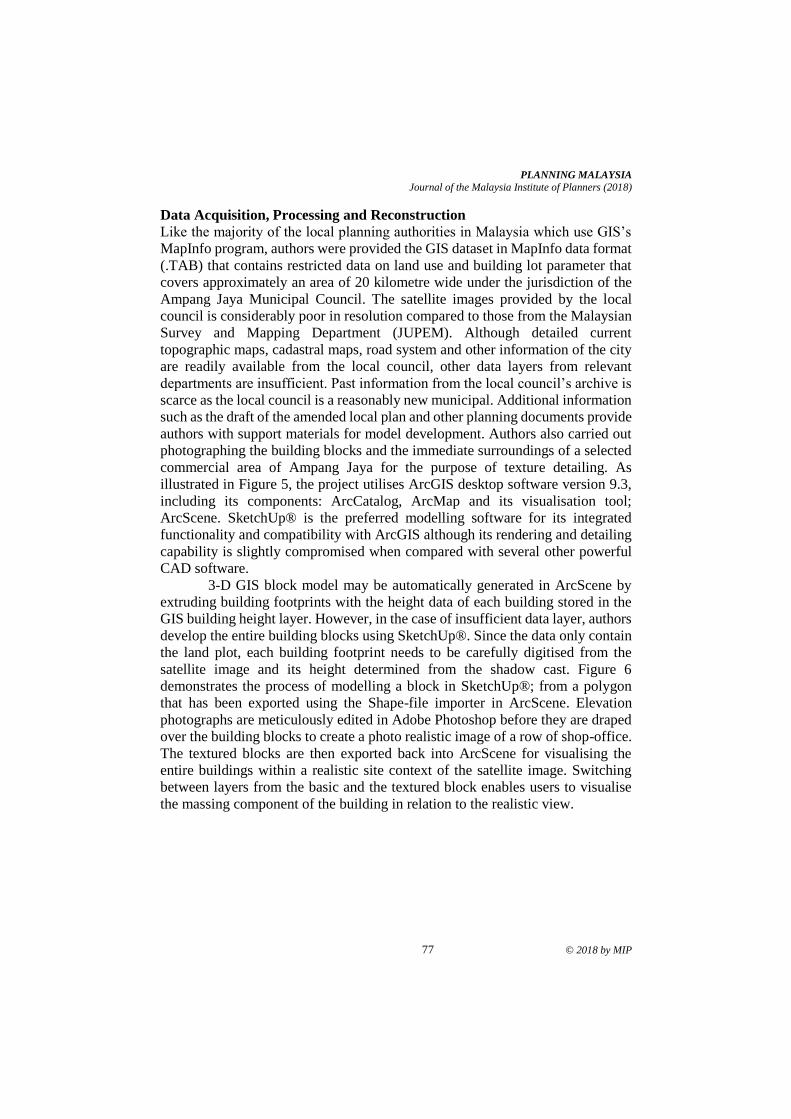
PLANNING MALAYSIA
Journal of the Malaysia Institute of Planners (2018)
77 © 2018 by MIP
Data Acquisition, Processing and Reconstruction
Like the majority of the local planning authorities in Malaysia which use GIS’s
MapInfo program, authors were provided the GIS dataset in MapInfo data format
(.TAB) that contains restricted data on land use and building lot parameter that
covers approximately an area of 20 kilometre wide under the jurisdiction of the
Ampang Jaya Municipal Council. The satellite images provided by the local
council is considerably poor in resolution compared to those from the Malaysian
Survey and Mapping Department (JUPEM). Although detailed current
topographic maps, cadastral maps, road system and other information of the city
are readily available from the local council, other data layers from relevant
departments are insufficient. Past information from the local council’s archive is
scarce as the local council is a reasonably new municipal. Additional information
such as the draft of the amended local plan and other planning documents provide
authors with support materials for model development. Authors also carried out
photographing the building blocks and the immediate surroundings of a selected
commercial area of Ampang Jaya for the purpose of texture detailing. As
illustrated in Figure 5, the project utilises ArcGIS desktop software version 9.3,
including its components: ArcCatalog, ArcMap and its visualisation tool;
ArcScene. SketchUp® is the preferred modelling software for its integrated
functionality and compatibility with ArcGIS although its rendering and detailing
capability is slightly compromised when compared with several other powerful
CAD software.
3-D GIS block model may be automatically generated in ArcScene by
extruding building footprints with the height data of each building stored in the
GIS building height layer. However, in the case of insufficient data layer, authors
develop the entire building blocks using SketchUp®. Since the data only contain
the land plot, each building footprint needs to be carefully digitised from the
satellite image and its height determined from the shadow cast. Figure 6
demonstrates the process of modelling a block in SketchUp®; from a polygon
that has been exported using the Shape-file importer in ArcScene. Elevation
photographs are meticulously edited in Adobe Photoshop before they are draped
over the building blocks to create a photo realistic image of a row of shop-office.
The textured blocks are then exported back into ArcScene for visualising the
entire buildings within a realistic site context of the satellite image. Switching
between layers from the basic and the textured block enables users to visualise
the massing component of the building in relation to the realistic view.
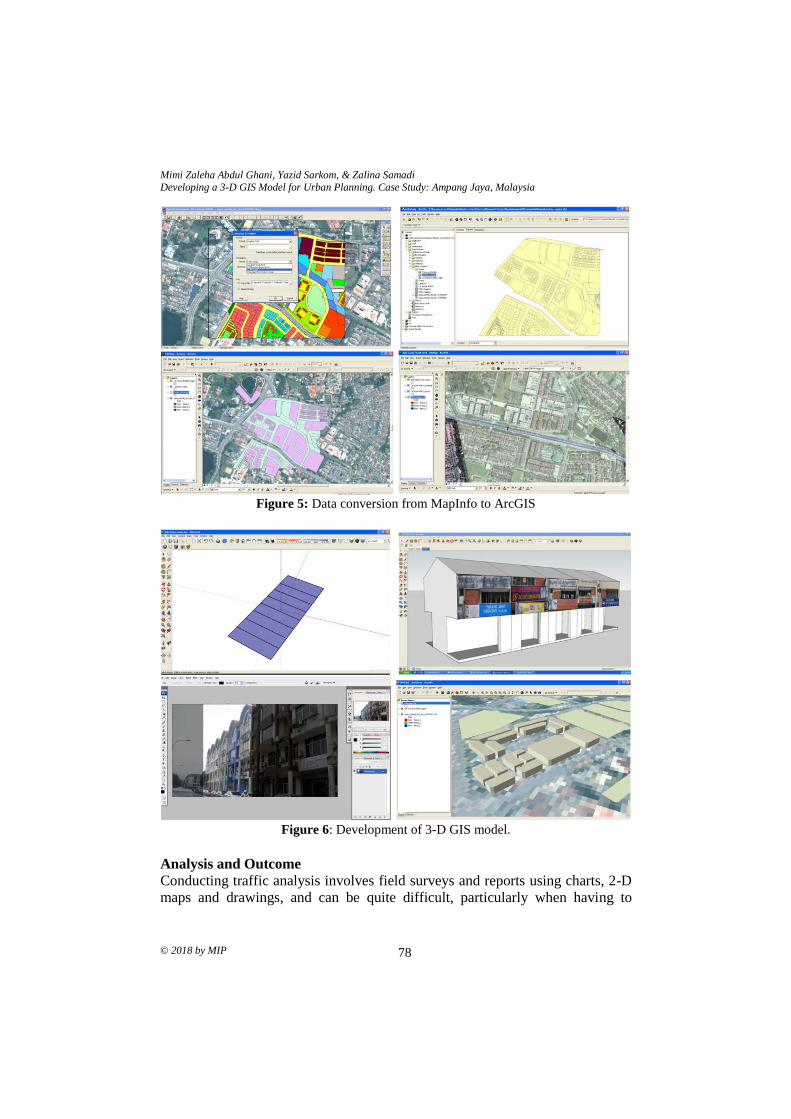
Mimi Zaleha Abdul Ghani, Yazid Sarkom, & Zalina Samadi
Developing a 3-D GIS Model for Urban Planning. Case Study: Ampang Jaya, Malaysia
© 2018 by MIP 78
Figure 5: Data conversion from MapInfo to ArcGIS
Figure 6: Development of 3-D GIS model.
Analysis and Outcome
Conducting traffic analysis involves field surveys and reports using charts, 2-D
maps and drawings, and can be quite difficult, particularly when having to
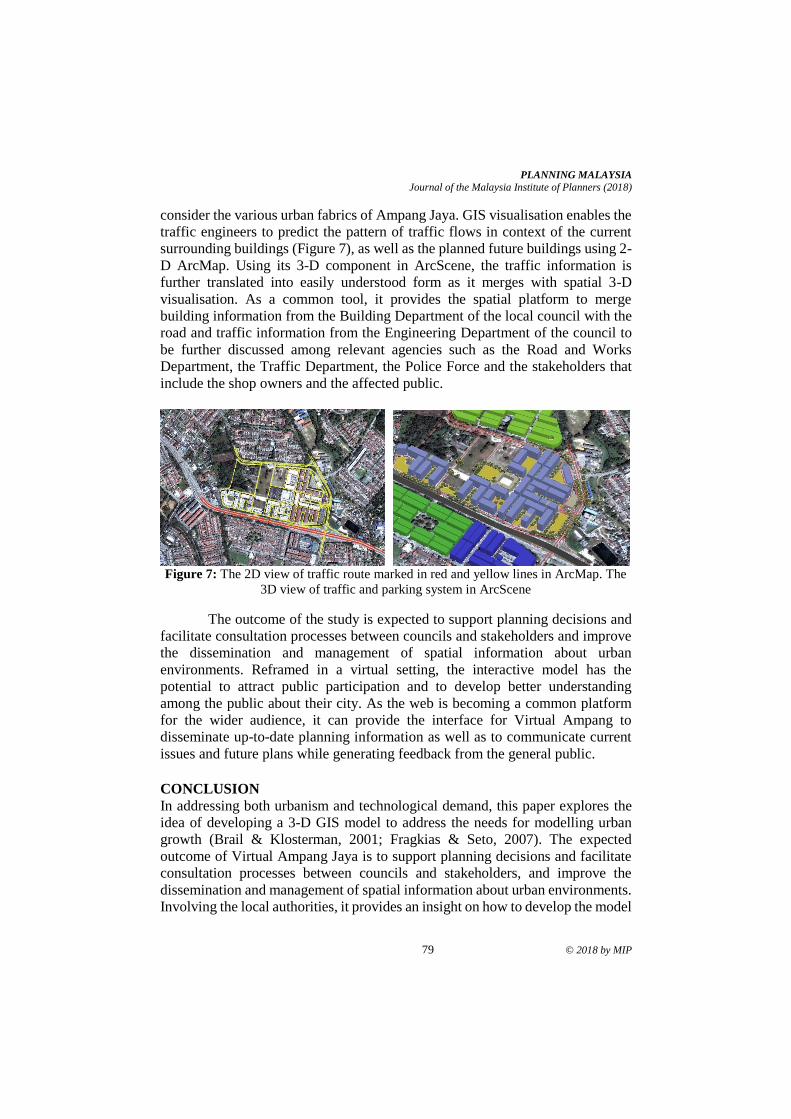
PLANNING MALAYSIA
Journal of the Malaysia Institute of Planners (2018)
79 © 2018 by MIP
consider the various urban fabrics of Ampang Jaya. GIS visualisation enables the
traffic engineers to predict the pattern of traffic flows in context of the current
surrounding buildings (Figure 7), as well as the planned future buildings using 2-
D ArcMap. Using its 3-D component in ArcScene, the traffic information is
further translated into easily understood form as it merges with spatial 3-D
visualisation. As a common tool, it provides the spatial platform to merge
building information from the Building Department of the local council with the
road and traffic information from the Engineering Department of the council to
be further discussed among relevant agencies such as the Road and Works
Department, the Traffic Department, the Police Force and the stakeholders that
include the shop owners and the affected public.
Figure 7: The 2D view of traffic route marked in red and yellow lines in ArcMap. The
3D view of traffic and parking system in ArcScene
The outcome of the study is expected to support planning decisions and
facilitate consultation processes between councils and stakeholders and improve
the dissemination and management of spatial information about urban
environments. Reframed in a virtual setting, the interactive model has the
potential to attract public participation and to develop better understanding
among the public about their city. As the web is becoming a common platform
for the wider audience, it can provide the interface for Virtual Ampang to
disseminate up-to-date planning information as well as to communicate current
issues and future plans while generating feedback from the general public.
CONCLUSION
In addressing both urbanism and technological demand, this paper explores the
idea of developing a 3-D GIS model to address the needs for modelling urban
growth (Brail & Klosterman, 2001; Fragkias & Seto, 2007). The expected
outcome of Virtual Ampang Jaya is to support planning decisions and facilitate
consultation processes between councils and stakeholders, and improve the
dissemination and management of spatial information about urban environments.
Involving the local authorities, it provides an insight on how to develop the model
Mimi Zaleha Abdul Ghani, Yazid Sarkom, & Zalina Samadi
Developing a 3-D GIS Model for Urban Planning. Case Study: Ampang Jaya, Malaysia
© 2018 by MIP 80
by translating easily understandable spatial information enabling a more
comprehensive understanding of Ampang Jaya and helping bridge the gap
between different professionals for better planning outcomes. Adopting 3-D
modelling and visualisation also correlates with the call for electronic
government (e-govt), a flagship application of the Multimedia Super Corridor
(MSC) project that aims to redesign the system of the government to bring about
fundamental changes from the society level (Lee & Ahmad, 2000), as well as
meeting global information technology expectations and future challenges. While
it may provide as a guideline for the use of computing in planning for the
authorities in Malaysia, the model can be further developed into a prototype that
may incorporate GeoImmersive videos into GIS environments. Its use for
modelling different scales of urban development can also suggest the appropriate
hardware and integration of software that are deem suitable.
While Virtual Ampang Jaya attempts to explore the GIS analytical and
querying capabilities with interactive visualisation environment, the case study is
an infant project in testing the model for analysis that integrates CAD with limited
application of GIS software with the available data commonly maintained by
planning authorities in Malaysia. Its effectiveness for urban and planning analysis
is heavily challenged by many factors, primarily data availability and accuracy
that includes lack of data layers and substandard satellite image. As a result of
these, several automated tools designed to facilitate the process cannot be
explored, for example, the extrusion technique in ArcScene. Lack of resolution
in the satellite image has made it ineffective to conduct 3-D analysis of the
buildings in context of its surroundings as the pixelated ground image from
perspective views hardly represents a virtually realistic environment.
Another issue that challenges this project is the disciplinary boundary
that demands expertise from firstly, the modelling capability that is often related
to the architects, and secondly, the GIS software application that are often used
by planners. The third expertise which involves geo-referencing; the forte of the
land surveyors, may overcome our deficiency as a higher resolution image can be
“stitched” and geo-referenced from the Google Maps. While the future of 3-D
visualisation and GIS is encouraged by the integration of these expertise, the
current developments of GIS among the planning authorities in Malaysia are
positive with the support from the Federal and State Town Planning Departments.
The future 3-D GIS model will aim to explore GIS’s powerful analytical and
querying capabilities within the interactive visualisation environment while
experimenting future possibilities with “urban parametric”. Integrating the
evolving technologies in retrieval, transmission and visualisation of 3-D data, it
will attempt the future virtual world that is capable of constantly and relatively
changing alongside the real world.
PLANNING MALAYSIA
Journal of the Malaysia Institute of Planners (2018)
81 © 2018 by MIP
ACKNOWLEDGEMENT
We would like to thank the staff from the Planning and Building Departments of
the Ampang Jaya Municipal Council for the contribution of information and data
used in this research.
REFERENCES Abdullah, M. F., Abdullah, A., & Ibrahim, M. (2009). Institutionalisation of spatial
planning and decision support system for planning and governance in Malaysia.
In A. Abdullah & D. Geneletti (Eds.), Spatial decision support for urban and
environmental planning: A collection of case studies (pp. 153-166). Shah Alam,
Malaysia: Arah Publications.
Ampang Jaya Municipal Council (1998). Ampang Jaya Structure Plan 1995-2020.
Selangor: Author.
Arribas-Bel, D., Kourtit, K., Nijkamp, P., & Steenbruggen, J. (2015). Cyber Cities: Social
media as a tool for understanding cities. Applied Spatial Analysis and Policy,
8(3) 231-247.
Batty, M. (2012). Smart cities of the future. The European Physical Journal Special
Topics, 214(1), 481-518.
Brail, R. K., & Klosterman, R. E. (2001). Planning support systems: Integrating
geographic information systems, models and visualization tools. California:
ESRI Press.
Florida House Institute (n.d.). A framework for vision-based planning: A taxonomy for
communities. Florida: Author.
Fragkias, M., & Seto, K. C. (2007). Modeling urban growth in data-sparse environments:
A new approach. Environmental and Planning B: Planning and Design, 34, 858-
883.
Herbet, G., & Xuwei, C. (2015). A comparison of usefulness of 2D and 3D
representations of urban planning. Cartography and Geographic Information
Science, 42(1), 22-32.
Federal Department of Town & Country Planning Peninsular Malaysia [FDTCP]
(2006). National urbanisation policy. Malaysia: Author.
Lee, L. M., & Ahmad, M. J. (2000, March). Local authority networked development
system. Planning Digital Conference. March 28-29, 2000, Penang, Malaysia.
Lopes, C. V., & Lindström, C. (2012). Virtual cities in urban planning: The Uppsala case
study. Journal of Theoretical and Applied Electronic Commerce Research, 7(3),
88-100.
Pietsch, S. M. (2000, September). The pursuit of realism in urban visualisation models.
Habitus 2000. September 5-9, 2000, Perth, Australia.
Rafi, A., & Rani, R. M. (2008, May). Visual Impact Assessment (VIA): A discussion on
computer-based methodologies used for urban streetscapes. International
Conference on Environment Research and Technology (ICERT 2008). May 28-
30, 2008, Penang, Malaysia.
Rong, D. Wu, P., & Shang, J. (2017). A practical method for the construction of urban
3D GIS and its application. Revista de la Facultad de Ingenieria UCV, 32(3),
279-287.
Mimi Zaleha Abdul Ghani, Yazid Sarkom, & Zalina Samadi
Developing a 3-D GIS Model for Urban Planning. Case Study: Ampang Jaya, Malaysia
© 2018 by MIP 82
Salleh, S. A. (2008). The integration of 3D GIS and virtual technology in the design and
development of GIS-based residential property marketing information system
(Master thesis). Universiti Teknologi MARA, Shah Alam, Selangor, Malaysia.
Shamsuddin, S., & Ujang, N. (2008). Making places: The role of attachment in creating
the sense of place for traditional streets in Malaysia. Habitat International,
32(3), 399-409.
Shiffer, M. J. (1993, October). Augmenting geographic information with collaborative
multimedia technologies. 11th International Symposium on Computer-Assisted
Cartography (Auto-Carto). October 30- November 1, 1993. Minneapolis,
Minnesota, USA.
Sunesson, K., Allwood, C. M., Paulin, D., Heldal, I., Roupé, M., Johansson, M., &
Westerdahl, B. (2008). Virtual reality as a new tool in the city planning process.
Tsinghua Science and Technology, 13(S1), 255-260.
Thuzar, M. (2012). Urbanization in Southeast Asia: Developing smart cities for the
future? In M. J. Montesano & Lee P. O. (Eds.), Regional Outlook: Southeast
Asia 2011-2012 (pp. 96-100). Singapore: ISEAS Publishing.
Yano, K., Nakaya, T., Isoda, Y., Takase, Y., Kawasumi, T., & Matsuoka, K. (2006,
August). Kyoto Virtual Time-Space. Annual ESRI International User
Conference. August 7-11, 2006, San Diego, California, USA.
2Professor at Universiti Teknologi MARA, Malaysia. Email: [email protected] 83
PLANNING MALAYSIA:
Journal of the Malaysian Institute of Planners
VOLUME 16 ISSUE 3 (2018) Page 83 – 96
EVALUATION OF INFILL BUILDING BLOCK IN HERITAGE
SCHOOLS IN KUALA LUMPUR
Mohd Amirul Hakim Zamri1 & Jamalunlaili Abdullah2
1,2Faculty of Architecture, Planning and Surveying
UNIVERSITI TEKNOLOGI MARA, MALAYSIA
Abstract
In Kuala Lumpur, there are a few heritage schools that are more than 100 years
old which have experienced significant infill developments since colonial era.
This study evaluates the infill building structures and proposes a suitable design
approach of infill development in heritage school. It focuses on the infill
development theory, reviews on the physical aspect of heritage school buildings
as well as related local policies and guidelines. In order to achieve the research
purpose and objectives, the study uses the qualitative methodology. The study
found that there are 2 infill design approaches, which is the complementary
design approach and contrast design approach and both can be used as long as
compatible and in harmony with the existing heritage building and site. Through
site observation survey, it was found that although infill development at St John’s
Institutions and Maxwell Secondary Schools adopted the contrast approach, the
outcome were different. Infill development at St John’s Institutions was
compatible and in harmony, while at Maxwell Secondary School was the
opposite. Therefore, this study suggests improvement on the existing infill
structures in the heritage school, either through image restoration or transfer of
facilities to future development. Other recommendation include the government
providing infill development guidelines for heritage site, encouraging private
sector to participate in heritage school conservation and development, and
controlling the height of new development within 100 meter radius from heritage
buildings.
Keywords: heritage school, urban infill, Maxwell School, St John Institution
Mohd Amirul Hakim Zamri & Jamalunlaili Abdullah
Evaluation of Infill Building Block in Heritage Schools in Kuala Lumpur
© 2018 by MIP 84
INTRODUCTION
Malaysia has diverse heritage buildings that demonstrate the features and
characteristics of local and international architecture, as well as outstanding
craftsmanship. Some are located in Kuala Lumpur, the capital and largest city in
the country. It has been estimated that the number of historical heritage buildings
in Kuala Lumpur is 8.4% of the country’s total which equals to 1,763 unit number
of buildings (Kamarul, 2008 cited by Alauddin, Ishakt, Mohd Isa, & Mohamad
Sohod, 2016). There are many colonial heritage buildings with western
architecture styles such as Moghul style for institutional buildings and Art deco
style for shophouses.
Along with other colonial buildings, heritage schools have long been
known for their unique architectural characteristics and contribution to local
historical development. They include Victoria’s Institution (established in1893),
St John’s Institution (1904), Maxwell Secondary School (1924), SMK Convent
Bukit Nanas (1899), Batu Road Prime School (1930), Methodist Girl’s School
Brickfield (1896), SMK Confucian Kuala Lumpur (1906) and Methodist Girl’s
School Kuala Lumpur (1916). These schools are considered some of the finest
examples of historical heritage buildings and sites. Thus, they should be studied
and preserved as education heritage of Malaysia.
The rapid growth of Kuala Lumpur’s population increases the demand
for new space for education facilities. Parents have always wanted to send their
children to schools with excellent academic reputations. Most of the heritage
schools in city centre such as St John’s Institution, Maxwell Secondary School
and Convent School Bukit Nanas are categorised as cluster schools by the
Malaysian Ministry of Education, which have excellent record of educational
achievements. This increased demand from parents to enrol their children into the
schools has forced the addition of learning spaces and facilities, which were built
through infill development within the compound of the existing heritage schools.
According to Center for Urban Policy Research (2006), infill
development is a key component of smart growth which usually occurs in central
cities and inner suburbs on scattered sites where there is a vacant pocket that can
be developed. However, infill development may create conflict between the new
and the old buildings or site setting where the new building's scale, details,
structure and function are alien to the old’s. The heritage schools’ infill structures
and building blocks seem to have several distinctive architecture approaches and
styles or school of thought. The new extension structure or new adjacent building
block which is connected to the existing heritage buildings seem insensitive or
not respecting the existing heritage building block (Abdullah, Ahmad Zaki, &
Syed Subli, n.d). The question is, what are the considerations or variables that are
taken into account in designing new infill building blocks of heritage schools?
Moreover, the placement of lateral extension or new infill building block
in the school physical planning development also has given significant impact to
PLANNING MALAYSIA
Journal of the Malaysia Institute of Planners (2018)
85 © 2018 by MIP
the overall heritage school image. The structural massing of infill building blocks
also plays a significant role in affecting the whole scenery of heritage school
image in which they look bigger, bolder and more prominent compared to the
heritage building block. Thus, what are the factors and forces that influenced the
heritage school physical planning over the years regarding the building placement
and the structural massing? It seems like the development of infill building
structure of heritage school does not fit the objective of heritage building
conservation set by the government.
Urban Infill Development in Historical Site Setting
According to Rotondo, Selicato, Marin and Galdeano (2018), the word ‘heritage’
was derived from Latin patri-monium, which means ‘things belonging to his
father’. It can be defined as a set of goods that have been inherited from our
fathers or previous generations, and that can be passed on to future generations.
The 19th General Assembly of the International Council on Monuments and Sites
(ICOMOS) 2017 in Delhi defined heritage as the declaration of human movement
and methods for living all through history passed on from generation to
generation. In addition, the 11th ICOMOS stated that the heritage or cultural
heritage refers to the monuments, groups of buildings and sites of heritage value,
constituting the historical built environment.
Schultz and Kasen (1991) define infill as a residential or non-residential
development that occurs on vacant land that are scattered among developed areas
of municipalities. Meanwhile, Davis (2004) defines that infill is development on
empty land in urbanized regions and redevelopment of areas that are adjacent to
urban development where all services and facilities are anticipated to have the
capacity to accommodate additional demand. Thus, urban infill can be defined as
a new development in an empty parcel or a vacant lot within the developed area,
which can be a new development, redevelopment or restoration works.
There are two approaches of infill architectural design, which are
complementary and contrast approaches. The complementary approach is the
architectural approach based on the architectural visual style theory that follow
the character of neighbouring buildings. Contrast approach is the architectural
approach based on the rationalist or systematic architectural theory which
develop the design based on the calculations, functions, moralities and the issues
of the present (Alfirevic & Somonovic-Alfirevic, 2015).
RESEARCH METHODOLOGY
This research on infill development was conducted at two heritage schools in
Kuala Lumpu, which were St John’s Institution (SJI) at Jalan Bukit Nanas and
Maxwell School (MXS) at Jalan Tun Ismail. The two schools were selected from
nine heritage schools in Kuala Lumpur using Pairwise Comparison analysis
technique based on the criteria of ‘the most significant infill development’ in
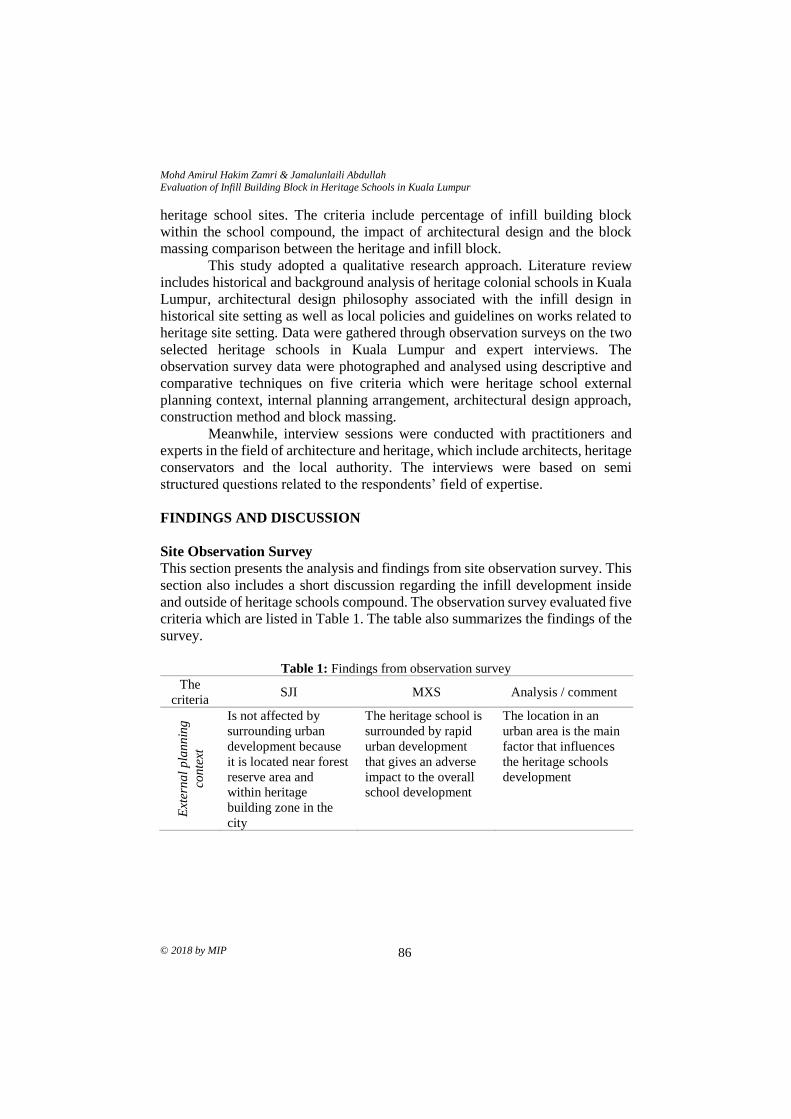
Mohd Amirul Hakim Zamri & Jamalunlaili Abdullah
Evaluation of Infill Building Block in Heritage Schools in Kuala Lumpur
© 2018 by MIP 86
heritage school sites. The criteria include percentage of infill building block
within the school compound, the impact of architectural design and the block
massing comparison between the heritage and infill block.
This study adopted a qualitative research approach. Literature review
includes historical and background analysis of heritage colonial schools in Kuala
Lumpur, architectural design philosophy associated with the infill design in
historical site setting as well as local policies and guidelines on works related to
heritage site setting. Data were gathered through observation surveys on the two
selected heritage schools in Kuala Lumpur and expert interviews. The
observation survey data were photographed and analysed using descriptive and
comparative techniques on five criteria which were heritage school external
planning context, internal planning arrangement, architectural design approach,
construction method and block massing.
Meanwhile, interview sessions were conducted with practitioners and
experts in the field of architecture and heritage, which include architects, heritage
conservators and the local authority. The interviews were based on semi
structured questions related to the respondents’ field of expertise.
FINDINGS AND DISCUSSION
Site Observation Survey
This section presents the analysis and findings from site observation survey. This
section also includes a short discussion regarding the infill development inside
and outside of heritage schools compound. The observation survey evaluated five
criteria which are listed in Table 1. The table also summarizes the findings of the
survey.
Table 1: Findings from observation survey
The
criteria SJI MXS Analysis / comment
Ext
ern
al
pla
nn
ing
con
text
Is not affected by
surrounding urban
development because
it is located near forest
reserve area and
within heritage
building zone in the
city
The heritage school is
surrounded by rapid
urban development
that gives an adverse
impact to the overall
school development
The location in an
urban area is the main
factor that influences
the heritage schools
development
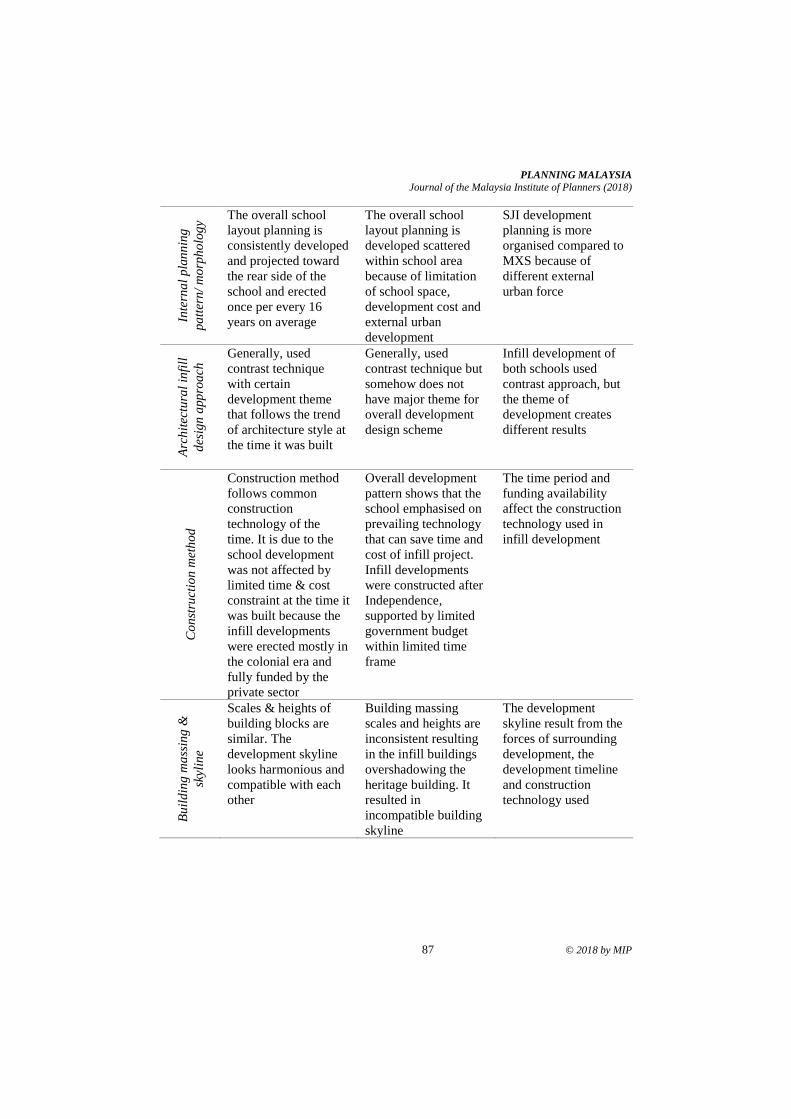
PLANNING MALAYSIA
Journal of the Malaysia Institute of Planners (2018)
87 © 2018 by MIP
Inte
rna
l p
lan
nin
g
pa
tter
n/
mo
rph
olo
gy
The overall school
layout planning is
consistently developed
and projected toward
the rear side of the
school and erected
once per every 16
years on average
The overall school
layout planning is
developed scattered
within school area
because of limitation
of school space,
development cost and
external urban
development
SJI development
planning is more
organised compared to
MXS because of
different external
urban force
Arc
hit
ectu
ral
infi
ll
des
ign
app
roa
ch Generally, used
contrast technique
with certain
development theme
that follows the trend
of architecture style at
the time it was built
Generally, used
contrast technique but
somehow does not
have major theme for
overall development
design scheme
Infill development of
both schools used
contrast approach, but
the theme of
development creates
different results
Co
nst
ruct
ion
met
ho
d
Construction method
follows common
construction
technology of the
time. It is due to the
school development
was not affected by
limited time & cost
constraint at the time it
was built because the
infill developments
were erected mostly in
the colonial era and
fully funded by the
private sector
Overall development
pattern shows that the
school emphasised on
prevailing technology
that can save time and
cost of infill project.
Infill developments
were constructed after
Independence,
supported by limited
government budget
within limited time
frame
The time period and
funding availability
affect the construction
technology used in
infill development
Bu
ild
ing
ma
ssin
g &
skyl
ine
Scales & heights of
building blocks are
similar. The
development skyline
looks harmonious and
compatible with each
other
Building massing
scales and heights are
inconsistent resulting
in the infill buildings
overshadowing the
heritage building. It
resulted in
incompatible building
skyline
The development
skyline result from the
forces of surrounding
development, the
development timeline
and construction
technology used
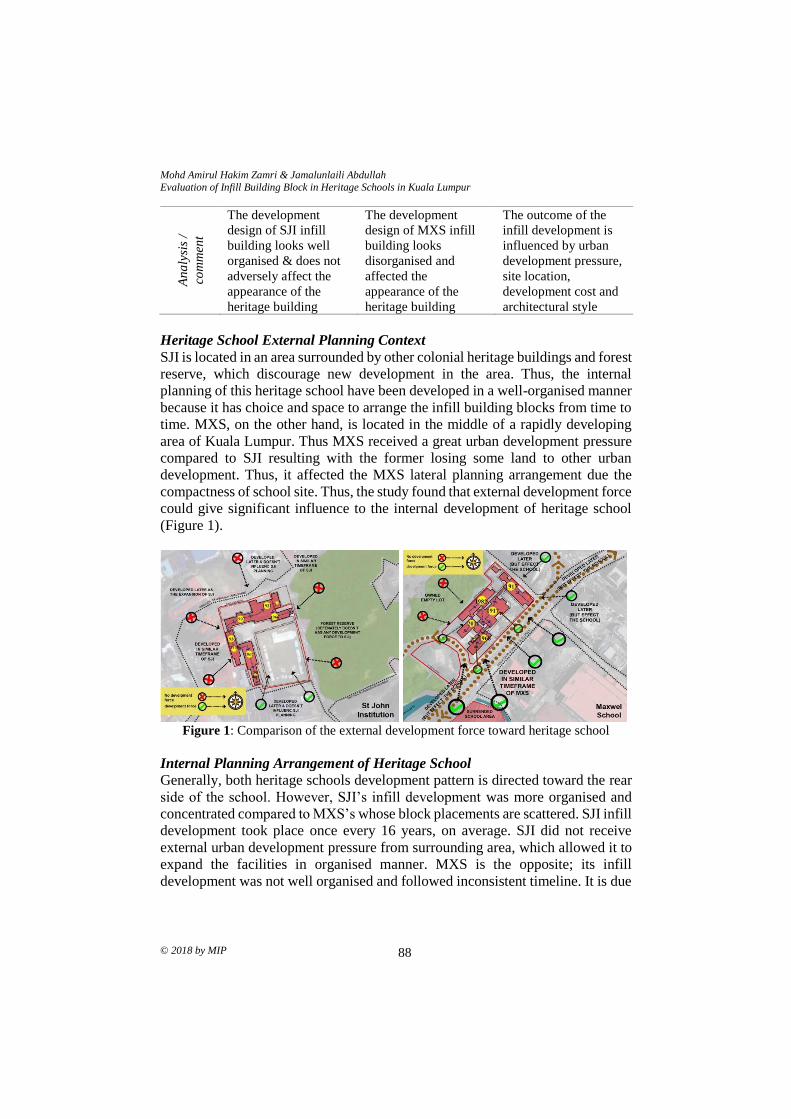
Mohd Amirul Hakim Zamri & Jamalunlaili Abdullah
Evaluation of Infill Building Block in Heritage Schools in Kuala Lumpur
© 2018 by MIP 88
An
aly
sis
/
com
men
t
The development
design of SJI infill
building looks well
organised & does not
adversely affect the
appearance of the
heritage building
The development
design of MXS infill
building looks
disorganised and
affected the
appearance of the
heritage building
The outcome of the
infill development is
influenced by urban
development pressure,
site location,
development cost and
architectural style
Heritage School External Planning Context
SJI is located in an area surrounded by other colonial heritage buildings and forest
reserve, which discourage new development in the area. Thus, the internal
planning of this heritage school have been developed in a well-organised manner
because it has choice and space to arrange the infill building blocks from time to
time. MXS, on the other hand, is located in the middle of a rapidly developing
area of Kuala Lumpur. Thus MXS received a great urban development pressure
compared to SJI resulting with the former losing some land to other urban
development. Thus, it affected the MXS lateral planning arrangement due the
compactness of school site. Thus, the study found that external development force
could give significant influence to the internal development of heritage school
(Figure 1).
Figure 1: Comparison of the external development force toward heritage school
Internal Planning Arrangement of Heritage School
Generally, both heritage schools development pattern is directed toward the rear
side of the school. However, SJI’s infill development was more organised and
concentrated compared to MXS’s whose block placements are scattered. SJI infill
development took place once every 16 years, on average. SJI did not receive
external urban development pressure from surrounding area, which allowed it to
expand the facilities in organised manner. MXS is the opposite; its infill
development was not well organised and followed inconsistent timeline. It is due
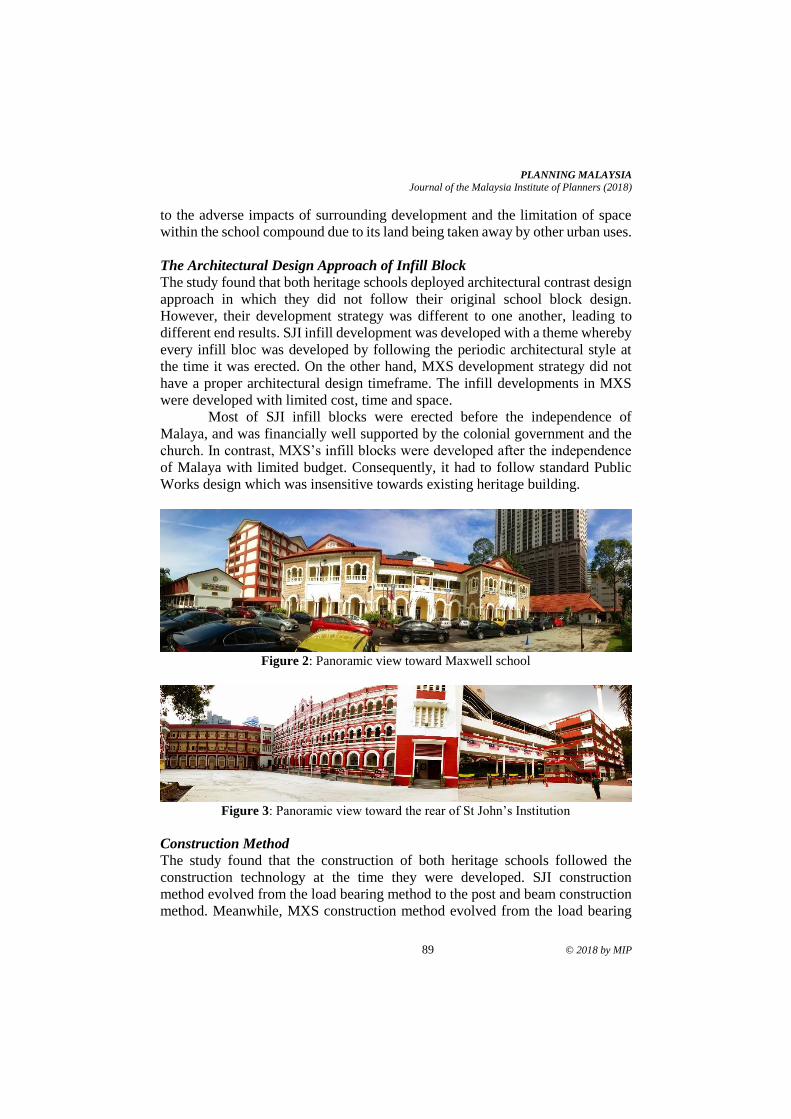
PLANNING MALAYSIA
Journal of the Malaysia Institute of Planners (2018)
89 © 2018 by MIP
to the adverse impacts of surrounding development and the limitation of space
within the school compound due to its land being taken away by other urban uses.
The Architectural Design Approach of Infill Block
The study found that both heritage schools deployed architectural contrast design
approach in which they did not follow their original school block design.
However, their development strategy was different to one another, leading to
different end results. SJI infill development was developed with a theme whereby
every infill bloc was developed by following the periodic architectural style at
the time it was erected. On the other hand, MXS development strategy did not
have a proper architectural design timeframe. The infill developments in MXS
were developed with limited cost, time and space.
Most of SJI infill blocks were erected before the independence of
Malaya, and was financially well supported by the colonial government and the
church. In contrast, MXS’s infill blocks were developed after the independence
of Malaya with limited budget. Consequently, it had to follow standard Public
Works design which was insensitive towards existing heritage building.
Figure 2: Panoramic view toward Maxwell school
Figure 3: Panoramic view toward the rear of St John’s Institution
Construction Method
The study found that the construction of both heritage schools followed the
construction technology at the time they were developed. SJI construction
method evolved from the load bearing method to the post and beam construction
method. Meanwhile, MXS construction method evolved from the load bearing
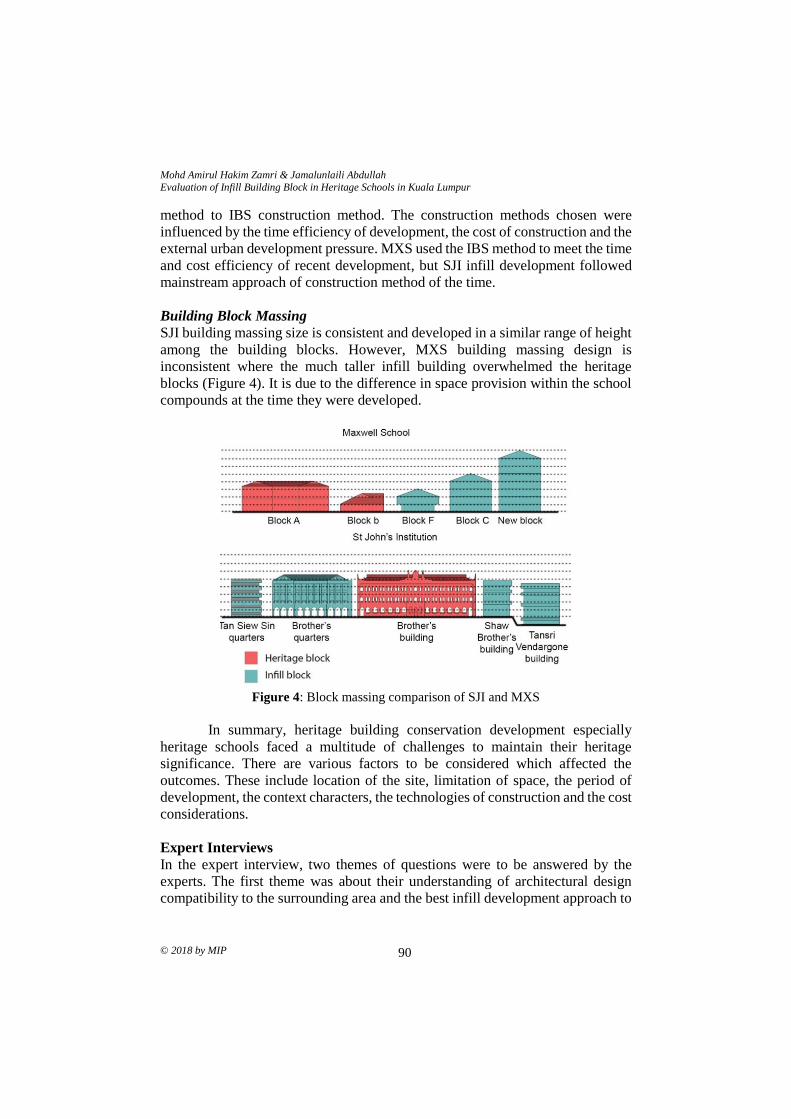
Mohd Amirul Hakim Zamri & Jamalunlaili Abdullah
Evaluation of Infill Building Block in Heritage Schools in Kuala Lumpur
© 2018 by MIP 90
method to IBS construction method. The construction methods chosen were
influenced by the time efficiency of development, the cost of construction and the
external urban development pressure. MXS used the IBS method to meet the time
and cost efficiency of recent development, but SJI infill development followed
mainstream approach of construction method of the time.
Building Block Massing
SJI building massing size is consistent and developed in a similar range of height
among the building blocks. However, MXS building massing design is
inconsistent where the much taller infill building overwhelmed the heritage
blocks (Figure 4). It is due to the difference in space provision within the school
compounds at the time they were developed.
Figure 4: Block massing comparison of SJI and MXS
In summary, heritage building conservation development especially
heritage schools faced a multitude of challenges to maintain their heritage
significance. There are various factors to be considered which affected the
outcomes. These include location of the site, limitation of space, the period of
development, the context characters, the technologies of construction and the cost
considerations.
Expert Interviews
In the expert interview, two themes of questions were to be answered by the
experts. The first theme was about their understanding of architectural design
compatibility to the surrounding area and the best infill development approach to
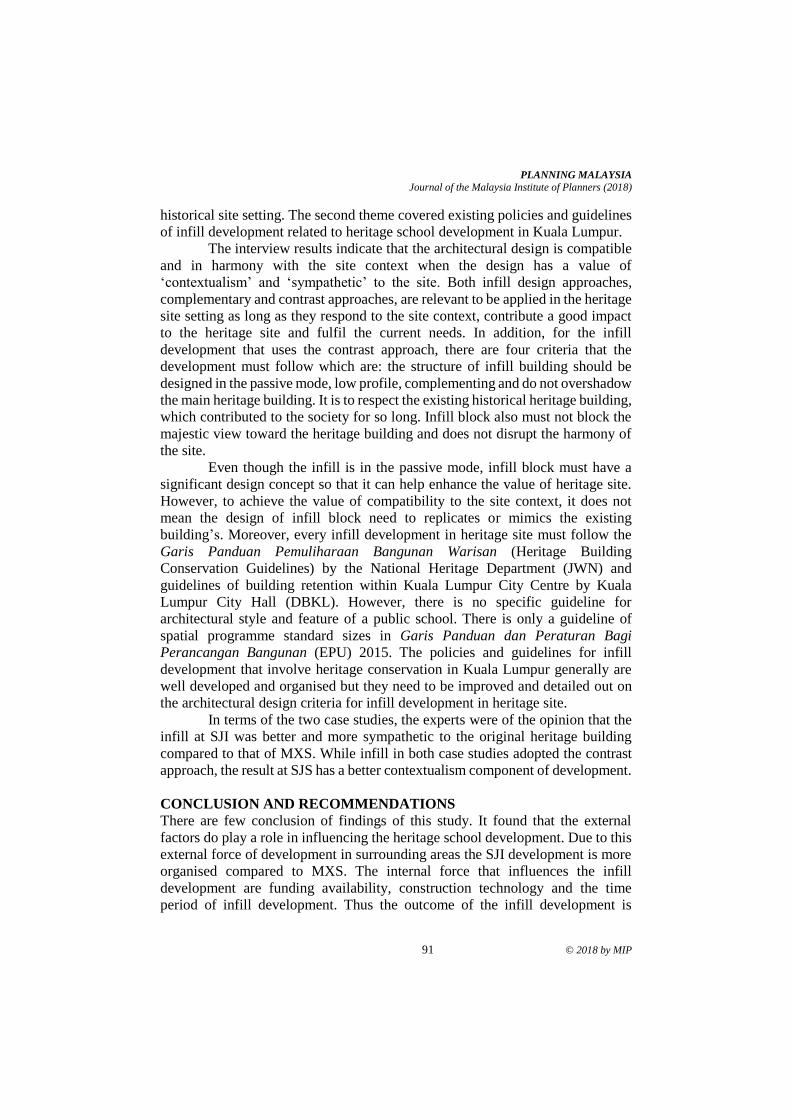
PLANNING MALAYSIA
Journal of the Malaysia Institute of Planners (2018)
91 © 2018 by MIP
historical site setting. The second theme covered existing policies and guidelines
of infill development related to heritage school development in Kuala Lumpur.
The interview results indicate that the architectural design is compatible
and in harmony with the site context when the design has a value of
‘contextualism’ and ‘sympathetic’ to the site. Both infill design approaches,
complementary and contrast approaches, are relevant to be applied in the heritage
site setting as long as they respond to the site context, contribute a good impact
to the heritage site and fulfil the current needs. In addition, for the infill
development that uses the contrast approach, there are four criteria that the
development must follow which are: the structure of infill building should be
designed in the passive mode, low profile, complementing and do not overshadow
the main heritage building. It is to respect the existing historical heritage building,
which contributed to the society for so long. Infill block also must not block the
majestic view toward the heritage building and does not disrupt the harmony of
the site.
Even though the infill is in the passive mode, infill block must have a
significant design concept so that it can help enhance the value of heritage site.
However, to achieve the value of compatibility to the site context, it does not
mean the design of infill block need to replicates or mimics the existing
building’s. Moreover, every infill development in heritage site must follow the
Garis Panduan Pemuliharaan Bangunan Warisan (Heritage Building
Conservation Guidelines) by the National Heritage Department (JWN) and
guidelines of building retention within Kuala Lumpur City Centre by Kuala
Lumpur City Hall (DBKL). However, there is no specific guideline for
architectural style and feature of a public school. There is only a guideline of
spatial programme standard sizes in Garis Panduan dan Peraturan Bagi
Perancangan Bangunan (EPU) 2015. The policies and guidelines for infill
development that involve heritage conservation in Kuala Lumpur generally are
well developed and organised but they need to be improved and detailed out on
the architectural design criteria for infill development in heritage site.
In terms of the two case studies, the experts were of the opinion that the
infill at SJI was better and more sympathetic to the original heritage building
compared to that of MXS. While infill in both case studies adopted the contrast
approach, the result at SJS has a better contextualism component of development.
CONCLUSION AND RECOMMENDATIONS
There are few conclusion of findings of this study. It found that the external
factors do play a role in influencing the heritage school development. Due to this
external force of development in surrounding areas the SJI development is more
organised compared to MXS. The internal force that influences the infill
development are funding availability, construction technology and the time
period of infill development. Thus the outcome of the infill development is
Mohd Amirul Hakim Zamri & Jamalunlaili Abdullah
Evaluation of Infill Building Block in Heritage Schools in Kuala Lumpur
© 2018 by MIP 92
influenced by the urban development pressure, site location, development cost
and architectural style.
Based on the findings of this research, several recommendations were
formulated. These recommendations may also apply to areas with similar
characteristics and problems. The recommendation is divided into two sections,
which are the recommendation on the internal planning of heritage school and the
recommendation on the development adjacent to the heritage school.
Recommendation on the Internal Planning of Heritage School
Ideal Approach to Architectural Infill Design
This study recommends using the contrast approach in heritage school infill
development. This is to differentiate the old historical buildings with the new
infill buildings, to highlight the heritage building and as a compliment or
backdrop for the historical heritage building. The building features of infill
building design have to be sensitive to the character of existing heritage buildings.
The infill building height must be within the range of existing heritage building
height, and the building façade colour have to be lighter and ‘fade’ than the
heritage building.
Adjustment to Existing Infill Buildings of Heritage Schools and Future
Planning
For the built infill buildings in SJI and MXS, some minor adjustments on the
buildings need to be carried out. These are to make the infill building façade look
more related to the heritage building. Considering practicality, school operation
and the cost of development, the approach proposed is complementary approach,
in which the large building block or structure that are still in use will not be
demolished. The adjustment works can be made either through building façade
design features, or the changes in linkage design or roofing design, and building
colour.
It is also recommended that future extension or infill development of
heritage school can only be developed toward the rear of the school area. No new
structure or building blocks should be developed at the front area of the school
which will block the view toward the heritage building block. The government
should assist the heritage school to acquire the adjacent land to develop new
facilities if the space within school compound was limited. Figure 5 shows the
recommendation for SJI and MXS for future facility expansion.
A New Guideline for the Need of Significant Architectural Values The government should add new guidelines particularly for architecture
characteristic and style of infill building and development in heritage site where
PLANNING MALAYSIA
Journal of the Malaysia Institute of Planners (2018)
93 © 2018 by MIP
it must have certain significant architectural values and design direction to
enhance the value and ambience of heritage site and building.
Allocating Development Fund for New Development on Historical Heritage
Site
The responsible ministry (The Ministry of Tourism and Culture - MOTAC)
should intervene any new development that related to the historical heritage
matters by providing extra fund and capital to that particular development to
ensure the new physical development are not damaging and deteriorating the
existing historical heritage building value and image of the site. The fund can be
allocated specifically for the façade design of new infill building construction and
the improvement of historical heritage facilities and materials. The responsible
government bodies such as the National Heritage Department also have to be
quick in identifying the potential heritage schools (building and site) to be listed
for conservation and gazetted as national heritage.
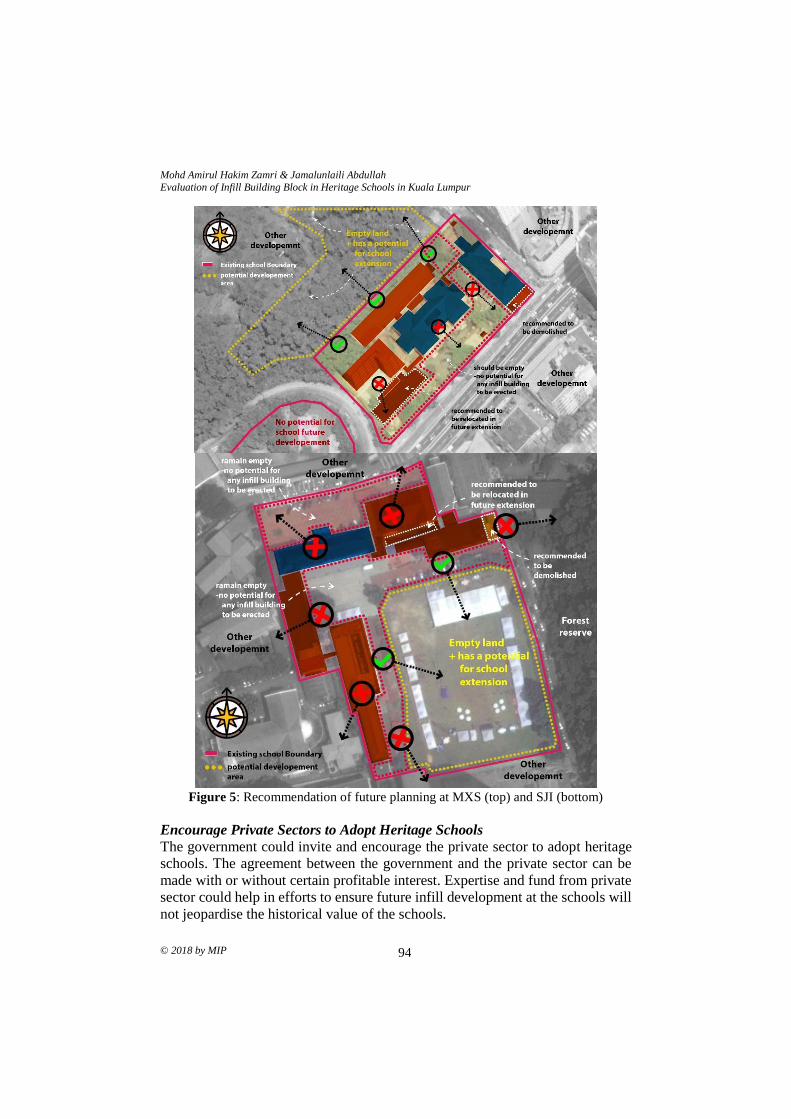
Mohd Amirul Hakim Zamri & Jamalunlaili Abdullah
Evaluation of Infill Building Block in Heritage Schools in Kuala Lumpur
© 2018 by MIP 94
Figure 5: Recommendation of future planning at MXS (top) and SJI (bottom)
Encourage Private Sectors to Adopt Heritage Schools The government could invite and encourage the private sector to adopt heritage
schools. The agreement between the government and the private sector can be
made with or without certain profitable interest. Expertise and fund from private
sector could help in efforts to ensure future infill development at the schools will
not jeopardise the historical value of the schools.
PLANNING MALAYSIA
Journal of the Malaysia Institute of Planners (2018)
95 © 2018 by MIP
Recommendation on the Development Adjacent to Heritage School
Monitor Design of Adjacent New Development Design The National Heritage Department and local authority should strictly check and
monitor the design of new urban development adjacent to heritage schools, or any
heritage sites, to ensure it complies and follows the requirement of conservation
guidelines set by government. The new urban development should be sensitive to
the existing historical heritage properties. The establishment and interest of a
heritage building preservation should not be neglected when it collides with other
urban development interest. This is because historical heritage is a national
treasure.
Control Height of Adjacent New Development Height To ensure the historical heritage school building (or other heritage buildings) can
be seen from their majestic view angle, new developments that are located within
100meter radius of heritage schools shall not be developed too high to maximise
the grand view toward the historical heritage school building. The building can
only be erected with a height that is within the height range of the heritage
building.
CONCLUSION
This paper has analysed infill development at two heritage schools in Kuala
Lumpur. It reviews on the urban infill design approaches in heritage site setting,
especially at heritage school, and the related issues. There are two types of
architectural infill design approaches that can be applied in heritage site
especially heritage schools and both design approaches can be applied as long as
they comply with the criteria of a good urban infill development design. The
heritage school development and planning arrangement are influenced by the
surrounding urban context. Thus, to ensure the sustainability of heritage schools,
all related parties should be sensitive and strive to protect and enhance these
national heritage treasures.
Mohd Amirul Hakim Zamri & Jamalunlaili Abdullah
Evaluation of Infill Building Block in Heritage Schools in Kuala Lumpur
© 2018 by MIP 96
REFERENCES Abdullah, J., Ahmad Zaki, S., & Syed Subli, S. H. (n.d). Historic educational institutions
and its potential as heritage tourism in Malaysia. Retrieved from
http://scholar.google.com.my/citations?user=t9VIzh0AAAAJ&hl=en
Alauddin, K., Ishakt, M. F., Mohd Isa, H., & Mohamad Sohod, F. (2016). The observation
of defects of school buildings over 100 years old in Perak. MATEC Web of
Conferences, 66, 00088.
Alfirevic, D., & Simonovic-Alfirevic, S. (2015). Infill architecture: Design approaches
for in-between buildings and “bond” as integrative element. Arhitektura i
Urbanizam, 2015(41), 24-39.
Center for Urban Policy Research, The State University Of New Jersey (2006). Infill
Development Standards and Policy Guide. New Jersey: New Jersey Department
of Community Affairs. Retrieved from
https://www.state.nj.us/dca/divisions/codes/.../2006
_6_rev2007_4_infill_dev_stds.pdf
Rotondo, F., Selicato, F., Marin, V., & Galdeano, J. L. (2018). Cultural territorial systems:
Landscape and cultural heritage as a key to sustainable and local development
in Eastern Europe. Cham: Springer International Publishing.
Schultz, M. S., & Kasen, V. L. (1991). Encyclopedia of community planning and
environmental management. Ann Arbor, MI: UMI Out of Print Books on
Demand, University Microfilms International.
1PhD candidate at Universiti Kebangsaan Malaysia. E-mail: [email protected] 97
PLANNING MALAYSIA:
Journal of the Malaysian Institute of Planners
VOLUME 16 ISSUE 3 (2018) Page 97 – 108
GAHAI AGROPOLITAN PROJECT IN ERADICATING POVERTY:
MULTIDIMENSIONAL POVERTY INDEX
Mohd Khairi Ismail, Chamhuri Siwar2 & Rospidah Ghazali3
Institute for Environment and Development (LESTARI)
UNIVERSITI KEBANGSAAN MALAYSIA
Abstract
The planning and development of Agropolitan Project in Malaysia began in 2007
and was aimed at eradicating extreme poverty in Malaysia. This study aims to
discuss the design and construction of Agropolitan Project in eradicating extreme
poverty among its participants. This study uses the Multidimensional Poverty
Index (MPI) found in the 11th Malaysian Plan, which includes the dimension of
education, health, living standards, and earning. In addition, this study utilizes a
survey involving 45 participants of an agropolitan project from Gahai, Lipis,
Pahang. The result shows that only 5 of the respondents fall into the multi-
dimensional poverty category, which involves 11.9 percent of the household
members. The result of this study shows that the planning and development of
Gahai Agropolitan Project, Lipis has succeeded in eradicating extreme poverty
among the project participants. Deprivation faced by the respondents based on
the MPI analysis can help policy makers in the design and construction of future
agropolitan projects.
Keywords: agropolitan, poverty, multidimensional poverty index
Mohd Khairi Ismail, Chamhuri Siwar & Rospidah Ghazali
Gahai Agropolitan Project In Eradicating Poverty: Multidimensional Poverty Index
© 2018 by MIP 98
INTRODUCTION
Malaysia’s success in eradicating poverty is indeed an amazing feat. However,
the phenomenon of poverty is still ascociated with the issue of imbalanced
development between the urban and rural areas. At the national level, poverty rate
in rural areas is higher than in urban areas, which causes the rural poor to lag far
behind in aspects of education, technology, living standard, and social and
economic opportunities (Asan, 2008). Therefore, the government has designed
and implemented various programs to alleviate rural poverty, including the Rural
Mega Leap Program (Program Lonjakan Mega Luar Bandar - PLMLB) aimed
at eliminating rural poverty by improving income and quality of life and
accelerating development in isolated and abandoned rural areas (KKLW, 2012).
The enforcement of PLMLB covers the agropolitan project implemented
by the Ministry of Rural and Regional Development (MRRD). To date, in
Malaysia, there are 11 agropolitan projects developed since 2007. The
implementation of this program enables project participants to earn around
RM900 – RM1,800 monthly, thus escaping poverty. Since agropolitan project is
a comprehensive development project, it cannot be measured solely based on the
Poverty Line Index. Therefore, this paper discusses the planning and the role that
the agropolitan project plays in eradicating poverty and measures the poverty of
project participants using the Multi-Dimensional Poverty Index (MPI).
LITERATURE REVIEW
The Basic Concept of Agropolitan Planning and Development
The weaknesses in conventional rural development model has led to the
development of an alternative rural development program (Buang, Habibah;
Hamzah, & Ratnawati, 2011). In 1974, economist John Friedman introduced the
concept of agropolitan, which prioritizes developmental planning from the lowest
tier which aims to improve the socio-economical status of the rural community.
Aside from that, agropolitan also prioritizes the developmental network between
urban and rural areas at the community level (Friedmann & Douglass, 1978;
Friedman & Weaver, 1979; Douglass, 1981; Hardoy & Satterwait, 1986).
Theoretically, agropolitan is a development program aimed at addressing the
weaknesses of the conventional development program based on the “Growth Pole
Approach”. This is beacause the conventional development method is mainly a
“top-down” approach that prioritizes competition in development rather than
cooperation for development (Murdoch, 2000; Akkoyunlu, 2015).
The key features of agropolitan are the intergrated developmental
planning which involves a complete physical infrastructure and institution, aside
from an optimal resource utilization (Buang et al., 2011). Economic activity
around the agropolitan area will contribute to the regional development. This
includes access to off-farm, non-farm, and commercial employment opportunities
PLANNING MALAYSIA
Journal of the Malaysia Institute of Planners (2018)
99 © 2018 by MIP
in the agropolitan area. According to Zulfa, Syamsul, Endang, Tajuddin and Aris
(2009), agropolitan is an attempt to establish a developmental model based on
“decolonisation”, “democratisation”, “self-empowerment”, and “reaching out”.
Friedman and Weaver (1978), on the other hand, stated that agropolitan is a
paradigm shift that emphasizes the relocation of natural resources production and
manufacturing. Now, as an alternative developmental model, agropolitan has
become the choice for several developing countries in their rural development
plan such as Indonesia, Nepal, and Malaysia (Bishna 1995; Zulfa et al., 2009;
Hayroll, Ahmad, Khairuddin, Jegak, & Jeffrey, 2010).
The Role of Agropolitan in Eradicating Extreme Poverty in Malaysia
The planning and development of agropolitan projects in Malaysia focus on the
eradication of extreme poverty in rural areas rather than the establishment of an
agricultural town as proposed by Friedman (Buang et al., 2011). According to
Hayroll et al. (2010), agropolitan aims to eradicate extreme poverty in Malaysia’s
rural areas. Under the supervision of the Prime Minister’s Department, four
ministries, including the Ministry of Rural and Regional Development (MRRD),
have been tasked to assist the government in eradicating poverty. Out of the
10,000 households categorized as extremely poor, 5,600 have been entrusted to
the KKLW while the rest are managed through the economic corridor
development projects (Hayroll et al., 2010). To date, there are 11 agropolitan
projects developed in five states namely Sarawak, Sabah, Pahang, Kedah, and
Perak, known for states having high rates of extreme poverty.
According to MRRD, the Malaysian government has allocated RM960
million for the development of agropolitan projects. The development of these
agropolitan projects are managed by various government agencies such as the
Federal Land Consolidation and Rehabilitation Authority (FELCRA), Kedah
Regional Development Authority (KEDA), South Kelantan Development
Authority (KESEDAR), Rubber Industry Smallholders Development Authority
(RISDA) and others. In addition, the agropolitan project also focuses on the
development of three key components namely physical, economy, and human
capital (Table 1). The physical component refers to the provision of basic
infrastructure and amenities such as houses, public halls, kindergartens, mosques,
business premises, electricity and water supply, etc. The economic component,
on the other hand, involves the development of “Ladang Sejahtera” with either
rubber or oil palm as its commodity crop. The third component is the
development of human resources, i.e. the provision of courses and training
programs for participants to improve their knowledge and skills.
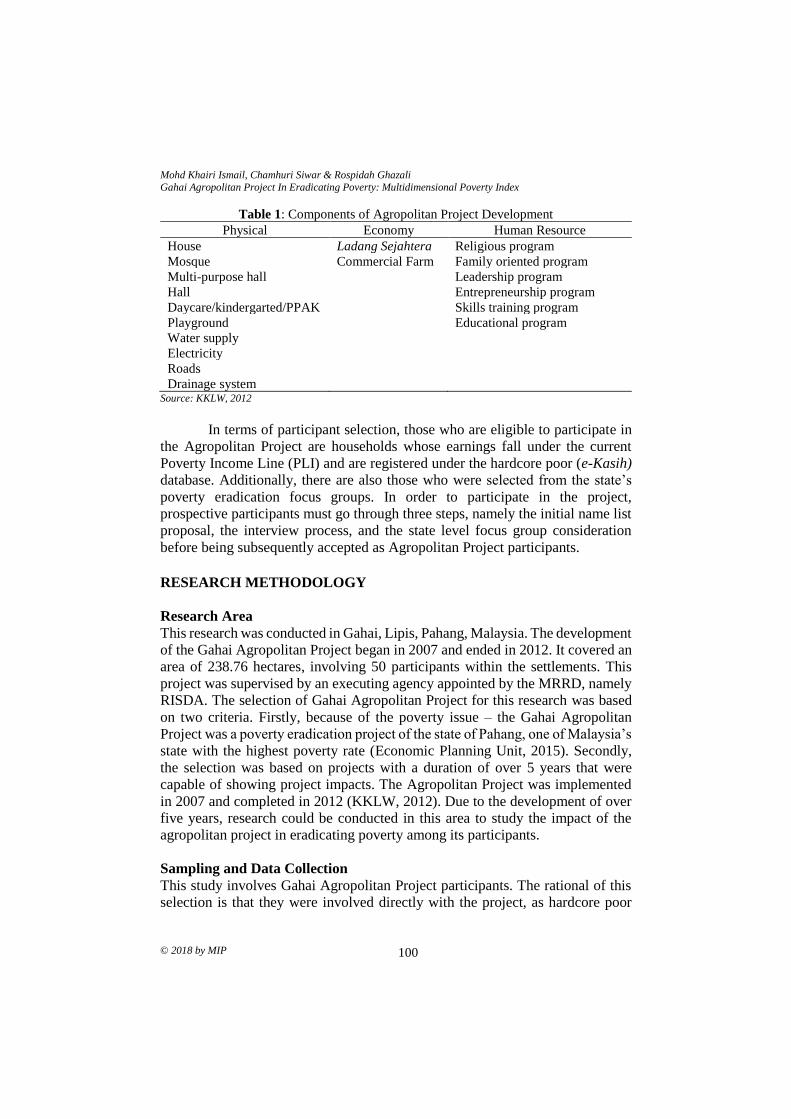
Mohd Khairi Ismail, Chamhuri Siwar & Rospidah Ghazali
Gahai Agropolitan Project In Eradicating Poverty: Multidimensional Poverty Index
© 2018 by MIP 100
Table 1: Components of Agropolitan Project Development
Physical Economy Human Resource
House Ladang Sejahtera Religious program
Mosque Commercial Farm Family oriented program
Multi-purpose hall Leadership program
Hall Entrepreneurship program
Daycare/kindergarted/PPAK Skills training program
Playground Educational program
Water supply
Electricity
Roads
Drainage system Source: KKLW, 2012
In terms of participant selection, those who are eligible to participate in
the Agropolitan Project are households whose earnings fall under the current
Poverty Income Line (PLI) and are registered under the hardcore poor (e-Kasih)
database. Additionally, there are also those who were selected from the state’s
poverty eradication focus groups. In order to participate in the project,
prospective participants must go through three steps, namely the initial name list
proposal, the interview process, and the state level focus group consideration
before being subsequently accepted as Agropolitan Project participants.
RESEARCH METHODOLOGY
Research Area
This research was conducted in Gahai, Lipis, Pahang, Malaysia. The development
of the Gahai Agropolitan Project began in 2007 and ended in 2012. It covered an
area of 238.76 hectares, involving 50 participants within the settlements. This
project was supervised by an executing agency appointed by the MRRD, namely
RISDA. The selection of Gahai Agropolitan Project for this research was based
on two criteria. Firstly, because of the poverty issue – the Gahai Agropolitan
Project was a poverty eradication project of the state of Pahang, one of Malaysia’s
state with the highest poverty rate (Economic Planning Unit, 2015). Secondly,
the selection was based on projects with a duration of over 5 years that were
capable of showing project impacts. The Agropolitan Project was implemented
in 2007 and completed in 2012 (KKLW, 2012). Due to the development of over
five years, research could be conducted in this area to study the impact of the
agropolitan project in eradicating poverty among its participants.
Sampling and Data Collection
This study involves Gahai Agropolitan Project participants. The rational of this
selection is that they were involved directly with the project, as hardcore poor
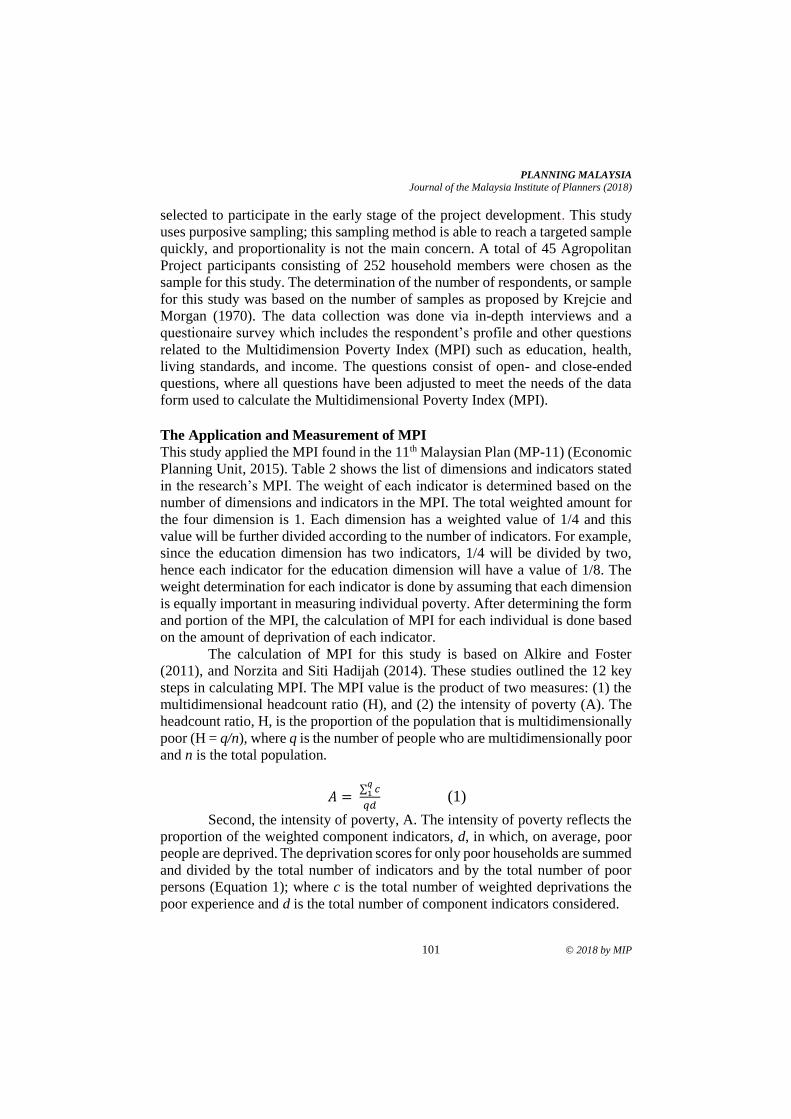
PLANNING MALAYSIA
Journal of the Malaysia Institute of Planners (2018)
101 © 2018 by MIP
selected to participate in the early stage of the project development. This study
uses purposive sampling; this sampling method is able to reach a targeted sample
quickly, and proportionality is not the main concern. A total of 45 Agropolitan
Project participants consisting of 252 household members were chosen as the
sample for this study. The determination of the number of respondents, or sample
for this study was based on the number of samples as proposed by Krejcie and
Morgan (1970). The data collection was done via in-depth interviews and a
questionaire survey which includes the respondent’s profile and other questions
related to the Multidimension Poverty Index (MPI) such as education, health,
living standards, and income. The questions consist of open- and close-ended
questions, where all questions have been adjusted to meet the needs of the data
form used to calculate the Multidimensional Poverty Index (MPI).
The Application and Measurement of MPI
This study applied the MPI found in the 11th Malaysian Plan (MP-11) (Economic
Planning Unit, 2015). Table 2 shows the list of dimensions and indicators stated
in the research’s MPI. The weight of each indicator is determined based on the
number of dimensions and indicators in the MPI. The total weighted amount for
the four dimension is 1. Each dimension has a weighted value of 1/4 and this
value will be further divided according to the number of indicators. For example,
since the education dimension has two indicators, 1/4 will be divided by two,
hence each indicator for the education dimension will have a value of 1/8. The
weight determination for each indicator is done by assuming that each dimension
is equally important in measuring individual poverty. After determining the form
and portion of the MPI, the calculation of MPI for each individual is done based
on the amount of deprivation of each indicator.
The calculation of MPI for this study is based on Alkire and Foster
(2011), and Norzita and Siti Hadijah (2014). These studies outlined the 12 key
steps in calculating MPI. The MPI value is the product of two measures: (1) the
multidimensional headcount ratio (H), and (2) the intensity of poverty (A). The
headcount ratio, H, is the proportion of the population that is multidimensionally
poor (H = q/n), where q is the number of people who are multidimensionally poor
and n is the total population.
𝐴 = ∑ 𝑐
𝑞1
𝑞𝑑 (1)
Second, the intensity of poverty, A. The intensity of poverty reflects the
proportion of the weighted component indicators, d, in which, on average, poor
people are deprived. The deprivation scores for only poor households are summed
and divided by the total number of indicators and by the total number of poor
persons (Equation 1); where c is the total number of weighted deprivations the
poor experience and d is the total number of component indicators considered.
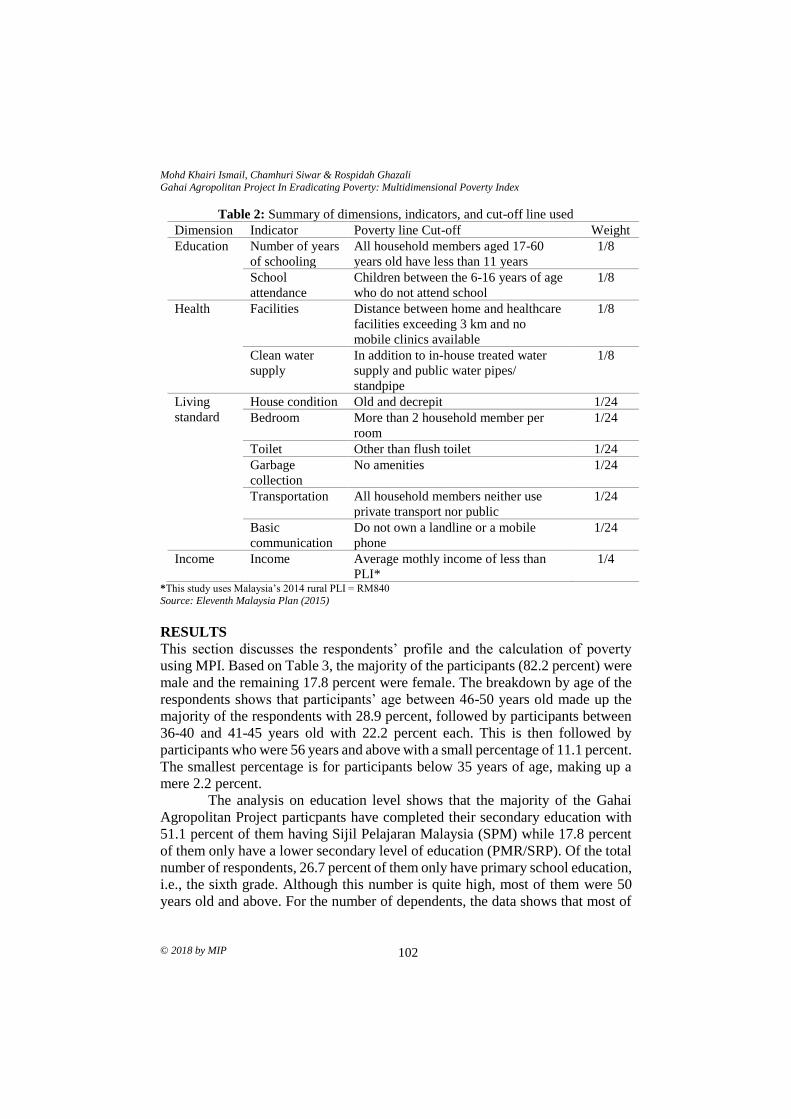
Mohd Khairi Ismail, Chamhuri Siwar & Rospidah Ghazali
Gahai Agropolitan Project In Eradicating Poverty: Multidimensional Poverty Index
© 2018 by MIP 102
Table 2: Summary of dimensions, indicators, and cut-off line used
Dimension Indicator Poverty line Cut-off Weight
Education Number of years
of schooling
All household members aged 17-60
years old have less than 11 years
1/8
School
attendance
Children between the 6-16 years of age
who do not attend school
1/8
Health
Facilities Distance between home and healthcare
facilities exceeding 3 km and no
mobile clinics available
1/8
Clean water
supply
In addition to in-house treated water
supply and public water pipes/
standpipe
1/8
Living
standard
House condition Old and decrepit 1/24
Bedroom More than 2 household member per
room
1/24
Toilet Other than flush toilet 1/24
Garbage
collection
No amenities 1/24
Transportation All household members neither use
private transport nor public
1/24
Basic
communication
Do not own a landline or a mobile
phone
1/24
Income Income Average mothly income of less than
PLI*
1/4
*This study uses Malaysia’s 2014 rural PLI = RM840
Source: Eleventh Malaysia Plan (2015)
RESULTS
This section discusses the respondents’ profile and the calculation of poverty
using MPI. Based on Table 3, the majority of the participants (82.2 percent) were
male and the remaining 17.8 percent were female. The breakdown by age of the
respondents shows that participants’ age between 46-50 years old made up the
majority of the respondents with 28.9 percent, followed by participants between
36-40 and 41-45 years old with 22.2 percent each. This is then followed by
participants who were 56 years and above with a small percentage of 11.1 percent.
The smallest percentage is for participants below 35 years of age, making up a
mere 2.2 percent.
The analysis on education level shows that the majority of the Gahai
Agropolitan Project particpants have completed their secondary education with
51.1 percent of them having Sijil Pelajaran Malaysia (SPM) while 17.8 percent
of them only have a lower secondary level of education (PMR/SRP). Of the total
number of respondents, 26.7 percent of them only have primary school education,
i.e., the sixth grade. Although this number is quite high, most of them were 50
years old and above. For the number of dependents, the data shows that most of
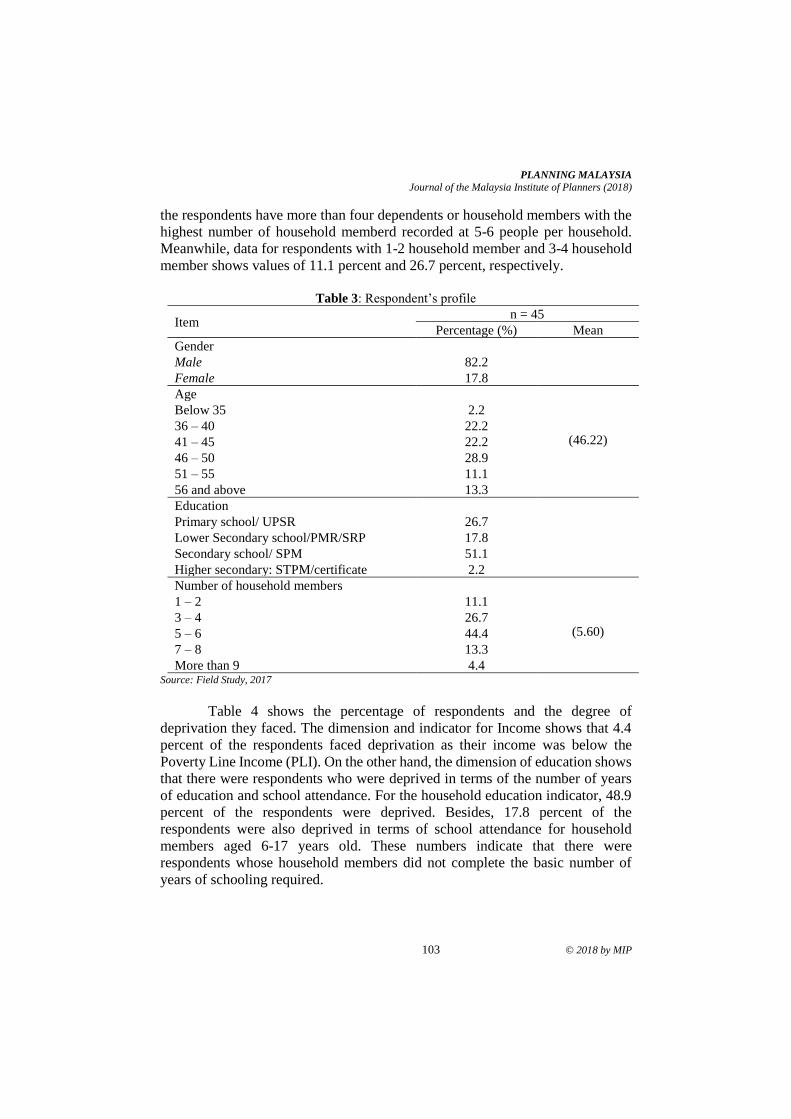
PLANNING MALAYSIA
Journal of the Malaysia Institute of Planners (2018)
103 © 2018 by MIP
the respondents have more than four dependents or household members with the
highest number of household memberd recorded at 5-6 people per household.
Meanwhile, data for respondents with 1-2 household member and 3-4 household
member shows values of 11.1 percent and 26.7 percent, respectively.
Table 3: Respondent’s profile
Item n = 45
Percentage (%) Mean
Gender
Male 82.2
Female 17.8
Age
(46.22)
Below 35 2.2
36 – 40 22.2
41 – 45 22.2
46 – 50 28.9
51 – 55 11.1
56 and above 13.3
Education
Primary school/ UPSR 26.7
Lower Secondary school/PMR/SRP 17.8
Secondary school/ SPM 51.1
Higher secondary: STPM/certificate 2.2
Number of household members
(5.60)
1 – 2 11.1
3 – 4 26.7
5 – 6 44.4
7 – 8 13.3
More than 9 4.4 Source: Field Study, 2017
Table 4 shows the percentage of respondents and the degree of
deprivation they faced. The dimension and indicator for Income shows that 4.4
percent of the respondents faced deprivation as their income was below the
Poverty Line Income (PLI). On the other hand, the dimension of education shows
that there were respondents who were deprived in terms of the number of years
of education and school attendance. For the household education indicator, 48.9
percent of the respondents were deprived. Besides, 17.8 percent of the
respondents were also deprived in terms of school attendance for household
members aged 6-17 years old. These numbers indicate that there were
respondents whose household members did not complete the basic number of
years of schooling required.

Mohd Khairi Ismail, Chamhuri Siwar & Rospidah Ghazali
Gahai Agropolitan Project In Eradicating Poverty: Multidimensional Poverty Index
© 2018 by MIP 104
Table 4: Deprivation faced by the household of the participants of the Gahai
Agropolitan Project by indicators
Deprivation faced Number of
respondents Percentage (%)
Income 2 4.4
Family members, Years of schooling 22 48.9
School attendance 8 17.8
Healthcare facilities 0 0
Clean water supply 0 0
House condition 0 0
Number of bedrooms 16 36.6
Toilet 0 0
Garbage disposal 45 100
Basic communication 0 0
Transportation 0 0 Source: Field Study, 2017
For the dimension of living standard, the analysis shows that there were
respondents who were deprived in two of the indicators, namely the number of
bedrooms and garbage collection service. The result shows that all respondents
faced the problem of garbage disposal service indicator. Aside from that, 36.6
percent of the participants were also deprived in the number of bedrooms
indicator. For the health dimension, there was no reported deprivation in terms of
health facilities and clean water supply.
Table 4 shows the percentage of respondents and the deficiency they
faced in the multi dimensions stated, while Table 5 shows the number of
deprivation faced by the respondents. To be considered poor in terms of MPI, the
maximum number of indicators deprivation faced by the respondents is four.
Respondents who experienced deprivation in one or two indicators were the
highest percentage at 33.3 percent for both. Meanwhile, deprivation in three or
four indicators were at 22.2 percent and 11.1 percent, respectively.
Table 5: Percentage of Gahai Agropolitan Project Household that faced deprivation
based on the number of indicators
Number of deprived indicator Number of respondent Percentage (%)
1 15 33.3
2 15 33.3
3 10 22.2
4 5 11.1 Source: Field Study, 2017
According to Alkire and Foster (2011), individuals can be classified as
multidimensionally poor if they experienced deprivation in more than 1/3 of the
total number of indicators found in the MPI. For the purpose of this study, a
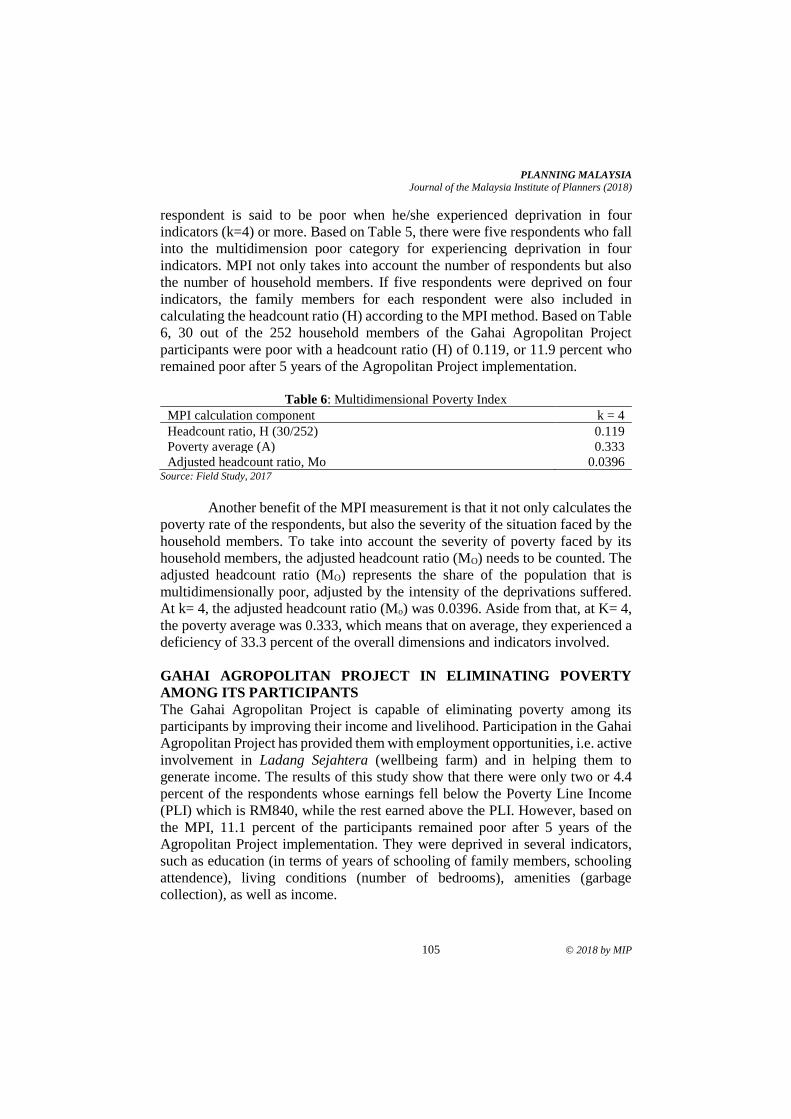
PLANNING MALAYSIA
Journal of the Malaysia Institute of Planners (2018)
105 © 2018 by MIP
respondent is said to be poor when he/she experienced deprivation in four
indicators (k=4) or more. Based on Table 5, there were five respondents who fall
into the multidimension poor category for experiencing deprivation in four
indicators. MPI not only takes into account the number of respondents but also
the number of household members. If five respondents were deprived on four
indicators, the family members for each respondent were also included in
calculating the headcount ratio (H) according to the MPI method. Based on Table
6, 30 out of the 252 household members of the Gahai Agropolitan Project
participants were poor with a headcount ratio (H) of 0.119, or 11.9 percent who
remained poor after 5 years of the Agropolitan Project implementation.
Table 6: Multidimensional Poverty Index
MPI calculation component k = 4
Headcount ratio, H (30/252) 0.119
Poverty average (A) 0.333
Adjusted headcount ratio, Mo 0.0396 Source: Field Study, 2017
Another benefit of the MPI measurement is that it not only calculates the
poverty rate of the respondents, but also the severity of the situation faced by the
household members. To take into account the severity of poverty faced by its
household members, the adjusted headcount ratio (MO) needs to be counted. The
adjusted headcount ratio (MO) represents the share of the population that is
multidimensionally poor, adjusted by the intensity of the deprivations suffered.
At k= 4, the adjusted headcount ratio (Mo) was 0.0396. Aside from that, at K= 4,
the poverty average was 0.333, which means that on average, they experienced a
deficiency of 33.3 percent of the overall dimensions and indicators involved.
GAHAI AGROPOLITAN PROJECT IN ELIMINATING POVERTY
AMONG ITS PARTICIPANTS
The Gahai Agropolitan Project is capable of eliminating poverty among its
participants by improving their income and livelihood. Participation in the Gahai
Agropolitan Project has provided them with employment opportunities, i.e. active
involvement in Ladang Sejahtera (wellbeing farm) and in helping them to
generate income. The results of this study show that there were only two or 4.4
percent of the respondents whose earnings fell below the Poverty Line Income
(PLI) which is RM840, while the rest earned above the PLI. However, based on
the MPI, 11.1 percent of the participants remained poor after 5 years of the
Agropolitan Project implementation. They were deprived in several indicators,
such as education (in terms of years of schooling of family members, schooling
attendence), living conditions (number of bedrooms), amenities (garbage
collection), as well as income.
Mohd Khairi Ismail, Chamhuri Siwar & Rospidah Ghazali
Gahai Agropolitan Project In Eradicating Poverty: Multidimensional Poverty Index
© 2018 by MIP 106
Gahai Agropolitan Project has enhanced the development of the rural
hardcore poor community by improving their livelihood. Project participants has
enjoyed a much better life since they now own better homes along with complete
basic amenities. Human capital development also helped to improve their skills,
which makes it useful in their everyday lives. For example, their involvement in
entrepreneurship, leadership and skills courses can benefit them in the long run,
in terms of widening employment opportunities and access to information and
knowledge. Therefore, this project should be continued to remove poverty in total
specifically for the Gahai Agropolitan Project.
The success of the Gahai Agropolitan Project in eliminating poverty
should be expanded to rural areas particularly in states that show high poverty
rate such as Sabah, Terengganu, Pahang and Kelantan. In addition, the selection
of project participants should be reassessed whereby participants should not be
limited to the extreme poor category alone but also all the households that are
categorized as poor. This need is in line with the efforts of the government in
eliminating poverty holistically.
CONCLUSION
Since its inception in 2007, participants of the Gahai Agropolitan Project, Lipis
have enjoyed a fairly comfortable life through the provision of basic amenities
and support in their daily lives. Participants have also earned higher revenue
through active participation in the Agropolitan Project. The results of this study
show that 11.1 percent of the participants of the Gahai Agropolitan Project
experienced multidimensional poverty or only 11.9 percent of the household
members remained poor after 5 years of the Agropolitan Project implementation.
This clearly indicates that the Gahai Agropolitan Project has been able to
eradicate poverty among its participants.
The application of the MPI has been able to provide a more accurate
measurement of the participants poverty since it takes into account financial and
non-financial aspects, while providing information on the deprivation that the
project participants have experienced from the aspects of dimensions and
indicators. The deprivation data from the dimensions and indicators are vital to
policy makers in their decision making especially in planning and developing
future agropolitan and rural development projects in Malaysia.
Additionally, the findings of this study show that future planning and
development of the agropolitan project should focus on the dimensions and
indicators with the highest degree of deprivation among its participants and their
household members, such as garbage disposal facilities, housing, and education.
As for garbage collection, since the Gahai Agropolitan Project was located in the
rural area, it did not fall under the jurisdication of any urban agencies, and thus
such facilities could not be provided to its participants. However, this facilities
need to be provided since it is one of the crucial indicators in the Multidimension
PLANNING MALAYSIA
Journal of the Malaysia Institute of Planners (2018)
107 © 2018 by MIP
Poverty Index as found in the Eleventh Malaysian Plan. Therefore, the proposal
for these facilities can be forwarded to the responsible party. Similarly, for other
indicators, the necessary step to overcome any shortcomings can be taken since
all aspects of deprivation have now been made aware to the policy makers and
implementors.
ACKNOWLEDGEMENT
The authors would like to thank the Universiti Kebangsaan Malaysia Mainstream
Research Grant (UKM-AP-2014-17) and the Universiti Kebangsaan Malaysia
Research University Grant (UKM-GUP-2015-050) for funding the fieldwork and
other research activites related to this project.
REFERENCES Akkoyunlu, S. (2015). The potential of rural-urban linkages for sustainable development
and trade. International Journal of Sustainable Development & World Policy,
4(2), 20.
Alkire, S. & Foster, J. (2011). Counting and multidimensional poverty measures.
Journal of Public Economics, 95(7–8), 476-487.
Asan A. G. H. (2008). Pembangunan wilayah dan alam sekitar: Cabaran dalam
merealisasikan Rancangan Malaysia Kesembilan. Sintok: Penerbit UUM.
Bhisna, N. B. (1995). Promoting small towns for rural development: A view from Nepal,
Asia Pacific Population Journal, 10(2), 27-50.
Buang, A., Habibah, A., Hamzah, J., & Ratnawati, Y. S. (2011). The agropolitan way of
re-empowering the rural poor. World Applied Sciences Journal, 13, 1-6.
Douglas, M. (1981). Thailand: Territorial dissolution and alternative regional
development for the central plains. In W. Stohr & D.R.F. Taylors (Eds),
Planning from above or below? (pp. 183-208). Chichester: John Wiley.
Economic Planning Unit (2015). Eleventh Malaysia plan, 2016-2020: Anchoring growth
on people. Putrajaya: Prime Minister’s Department.
Friedmann, J., & Douglass, M. (1978). Agropolitan development: towards a new strategy
for regional planning in Asia. In F. Lo & K. Salih (Eds), Growth pole strategy
for regional development policy (pp. 163-192). Oxford: Pergamon Press.
Friedmann, J., & Weaver, C. (1979). Territory and function. London: Edward Arnold.
Hardoy, J. E., & Satterthwaite, D. (1986). Shelter, infrastructure and services in Third
World cities. Habitat international, 10(3), 245-284.
Hayroll, A. M. S., Ahmad, F. A. N., Khairuddin, I., Jegak, U., & Jeffrey L. D. (2010).
Agriculture project as an economic development tool to boost socio-economic
level of poor community: The case of agropolitan project in Malaysia. African
Journal of Business Management, 4(11), 2354-2361.
Kementerian Luar Bandar dan Wilayah (KKLW) (2012). Garis panduan pengurusan
ladang sejahtera projek agropolitan di bawah Program Lonjakan Mega Luar
Bandar (PLMLB). Putrajaya: Author.
Krejcie, R. V., & Morgan, D. W. (1970). Determining sample size for research activities.
Educational and Psychological Measurement, 30(3), 607-610.

Mohd Khairi Ismail, Chamhuri Siwar & Rospidah Ghazali
Gahai Agropolitan Project In Eradicating Poverty: Multidimensional Poverty Index
© 2018 by MIP 108
Murdoch, J. (2000). Networks - A new paradigm of rural development? Journal of Rural
Studies, 16(4), 407-419.
Norzita, J., & Siti Hadijah, C. M. (2014). Realiti kemiskinan: Satu kajian teoritikal. Jurnal
Ekonomi Malaysia, 48(1), 167-177.
Zulfa, F. I., Syamsul, M., Endang, G. S., Tajuddin, B., & Aris, M. (2009). Agroindustry
based agropolitan institutional design with analytical network process. Jurnal
Teknologi Pertanian, 19(3), 130-137.
2Senior Lecturer at Universiti Teknologi MARA, Malaysia. E-mail: [email protected] 109
PLANNING MALAYSIA:
Journal of the Malaysian Institute of Planners
VOLUME 16 ISSUE 3 (2018) Page 109 – 120
ASSESSING URBAN PUBLIC TRANSPORTATION INSTITUTIONAL
FRAMEWORK IN KLANG VALLEY
Noor Ashikin Abd Rahman1, Yusfida Ayu Abdullah2, Na’asah Nasrudin3, &
Zaharah Mohd Yusoff4
1, 2, 3, 4Faculty of Architecture, Planning and Surveying
UNIVERSITI TEKNOLOGI MARA, MALAYSIA
Abstract
This study has a special interest in urban public transportation institutional
framework in the Klang Valley, Malaysia. The notions for the topic were
developed from issues regarding institutional framework in delivering urban
public transportation. Although the current urban public transport in Klang
Valley has improved, there are still issues concerning the institutional framework.
To date, there is no single regulator or agency with the express and overriding
responsibilities for strategic management of the public transport system in Klang
Valley. The purpose of this study is therefore to assess the current urban public
transportation institutional and governance framework especially towards urban
mobility. To achieve this, the study employs the content analysis and case study
method, using the purposive sampling approach for expert interviews in gaining
the data from participants of related agencies. It examines the importance of
public transportation frameworks and present status of current transport
development, as well as the roles of urban transportation agencies involved in
delivering urban public transport. Results demonstrated that urban public
transportation is delivered through multiple agencies with separate roles, not
counting the inconsistency of various policies. Hence, the expectation of this
study is to suggest practical approaches to improve the current institutional
framework of urban public transportation.
Keywords: urban public transportation, institutional framework, governance,
Klang Valley
Noor Ashikin Abd Rahman, Yusfida Ayu Abdullah, Na’asah Nasrudin, & Zaharah Mohd Yusoff
Assessing Urban Public Transportation Institutional Framework in Klang Valley
© 2018 by MIP 110
INTRODUCTION
Issues regarding urban public transportation in Malaysia as reported by many
academic researchers, news, agencies and experts in the field have remain as one
of the national concerns although the country is heading to becoming a well-
developed country by 2020. Trends in urban transportation have constantly
changed over the years. Urban dwellers in developing countries require and
demand mobility and accessibility at the same rates of growth of these urban
areas. Often, this demand is accommodated by the increased number of private
vehicles. The traffic issues are always associated with private vehicles especially
in developing city such as the Federal Territory of Kuala Lumpur. Development
of a country is closely linked with the transportation system facilities and it will
have a positive impact on the economic growth and social fabric of a country.
An efficient and a comprehensive network transport system between
cities is needed in strengthening the focal points of trade and human. The public
perception of the existing public transport system in Malaysia has been declining
over the years. The challenges in transforming the public transport system into
the mode of choice are not limited in increasing infrastructure and its capacity.
The integrated and comprehensive approach is required as it is also about
improving the regulatory framework, planning structure and the level of services
delivered (Abdul Aziz & Mohd Amin, 2012).
A city like Kuala Lumpur (KL) within the Klang Valley would easily be
communicated if the traffic flow ran smoothly and orderly with integration
between the public transport systems, and when planning is carried out in
accordance with the criteria and guidelines of the existing planning structure
(Abd. Rahman & Abdullah, 2016). Cities should be able to provide an efficient
urban structure and equitable society which all members can easily gain access
to all amenities and enjoy the maximum benefits of city life.
Klang Valley residents, particularly in the City of Kuala Lumpur are
expected to reach 10 million people by 2020 when it had attained the status of
Greater Kuala Lumpur. This will lead to an increased in vehicle ownership,
intensified mobility and accessibility, which potentially result in high urban
traffic congestion, fostering travel time, higher demands for parking spaces in
city centre and multiplied rates of injury as well as fatality which will all beget to
environmental degradation. Hence, many public transport advocators in
developing cities would argue for the switch of private vehicles to public
transportation to overcome these negative effects of transportation (Economic
Planning Unit, 2014).
The context of this paper focuses on the deliverable of public transport
management and also on institutional and governance framework for urban public
transportation. Institutional and governance framework and their related
networks are critical as to how well urban transport infrastructure and services
especially on public transport are planned, appraised, delivered and operated.
PLANNING MALAYSIA
Journal of the Malaysia Institute of Planners (2018)
111 © 2018 by MIP
Well-functioning institutions are essential in creating and maintaining good
quality infrastructure and services for urban mobility. The integration of land use
and transport planning is also necessary to ensure the efficacy of urban mobility
systems (UN Habitat, 2013).
Since transportation infrastructure crosses municipal boundaries,
therefore cooperation among federal, state and local government is very
important. The public transport planning and enforcement framework are seen
fragmented because they involve multiple authorities. All authorities have
delivered their large mandates but there is none single regulator or agency with
the express and overriding responsibilities for strategic management of the public
transport system (Suruhanjaya Pengangkutan Awam Darat, 2012). Currently,
there is no single coordinating body for the Klang Valley region or metropolitan
region which includes Kuala Lumpur, Shah Alam, Petaling Jaya, Subang Jaya,
Ampang, Selayang and Kajang even though the responsibility for transport is
shared among various agencies directly or indirectly.
METHODOLOGY
This study focuses on reviewing the concept and practice of urban public
transportation management and analysis of the urban public transport institutional
framework and governance using content analysis approach. Additionally, it
applies case study method to investigate the existing institutional framework for
urban transportation and policy, including its delivery and management of public
transportation by the government and related agencies in the Klang Valley.
Klang Valley was chosen as a case study because it comprises several
cities functioning as satellite city to the capital of Malaysia, Kuala Lumpur (KL).
The cities include Shah Alam, Petaling Jaya, Subang Jaya, Ampang, Selayang
and Kajang. Klang Valley was also selected because of the challenges it faces to
accommodate additional private cars every year with the total cumulative of
motor vehicles about 91% of public cars, 1% of public transport and another 8%
of others (Ministry of Works, 2014). The upsurge of motor vehicles is faster than
the population growth. It was highlighted that Klang Valley requires a suitable
and complete network system which provides road accessibility and high quality
public transportation service in major routes that provides a seamless
transportation system (Abd. Rahman & Abdullah, 2016). In addition, the public
transport modal share remains low at 17% as compared to the target of 25% in
2014 (Ministry of Transport, 2014). In supporting the sustainable transport
system, these criteria should be emphasised. Hence, the institutional framework
structure which encompasses the administration at the federal, state and local
levels is crucial in public transport development. Further to that, the general process of this research contains five stages
including preliminary study, literature review, data collection, analysis and
findings and recommendation (Figure 1). This research also engaged expert
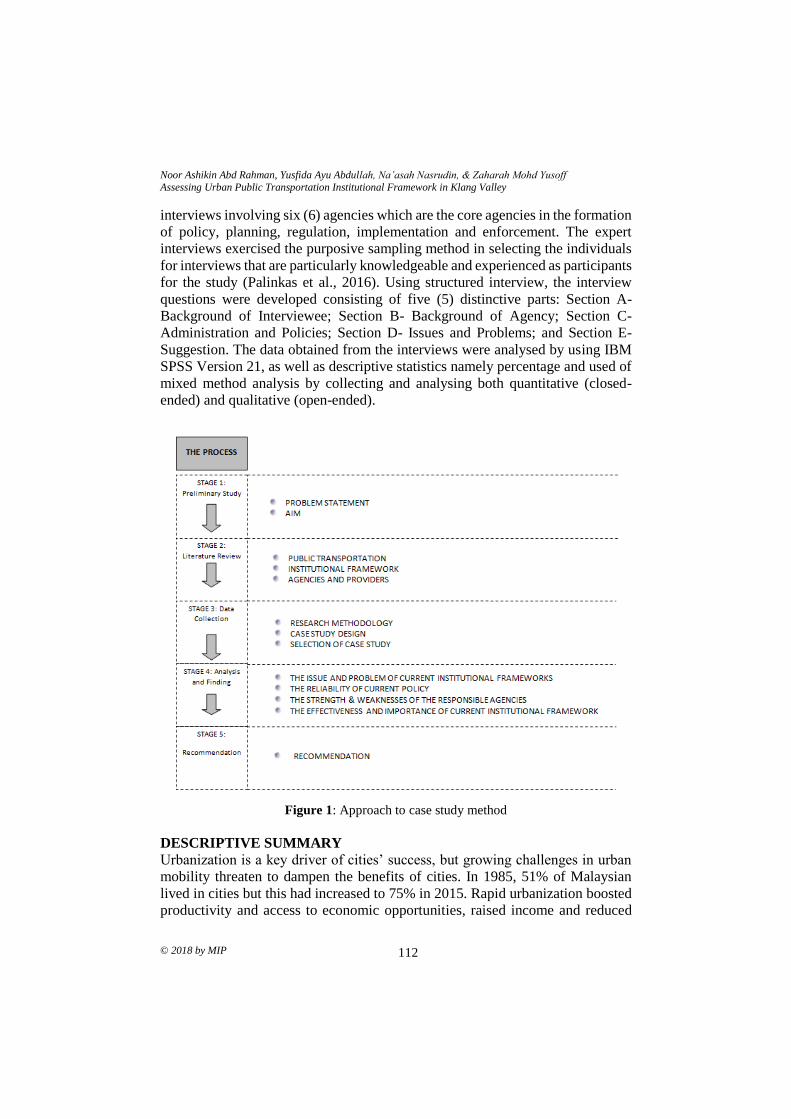
Noor Ashikin Abd Rahman, Yusfida Ayu Abdullah, Na’asah Nasrudin, & Zaharah Mohd Yusoff
Assessing Urban Public Transportation Institutional Framework in Klang Valley
© 2018 by MIP 112
interviews involving six (6) agencies which are the core agencies in the formation
of policy, planning, regulation, implementation and enforcement. The expert
interviews exercised the purposive sampling method in selecting the individuals
for interviews that are particularly knowledgeable and experienced as participants
for the study (Palinkas et al., 2016). Using structured interview, the interview
questions were developed consisting of five (5) distinctive parts: Section A-
Background of Interviewee; Section B- Background of Agency; Section C-
Administration and Policies; Section D- Issues and Problems; and Section E-
Suggestion. The data obtained from the interviews were analysed by using IBM
SPSS Version 21, as well as descriptive statistics namely percentage and used of
mixed method analysis by collecting and analysing both quantitative (closed-
ended) and qualitative (open-ended).
Figure 1: Approach to case study method
DESCRIPTIVE SUMMARY
Urbanization is a key driver of cities’ success, but growing challenges in urban
mobility threaten to dampen the benefits of cities. In 1985, 51% of Malaysian
lived in cities but this had increased to 75% in 2015. Rapid urbanization boosted
productivity and access to economic opportunities, raised income and reduced
PLANNING MALAYSIA
Journal of the Malaysia Institute of Planners (2018)
113 © 2018 by MIP
poverty, but at same time have increased road congestions in Malaysian cities,
including insufficient public transit and dissatisfaction of public transport
provision (Sander, 2015).
Over the past few years, urban development receives pressure from the
economic growth and increasing population growth. Public transport is one of the
main problems of the people in cities because it has direct impacts on their daily
lives. This is corroborated by the number of articles and news about public
transportation published in the media such as Malaysian Digest (2015),
TallyPress.Com (2016), The Star (2017) and many more (Abd. Rahman &
Abdullah, 2016). A critical issue particularly in the Klang Valley area is the
overloading of inward-outwards traffic flow of central Kuala Lumpur that
demands for the need of efficient and effective public transport service supply.
More than 4 million passengers per week use public transport in Kuala Lumpur
and the Klang Valley. It is a concerning pressure towards public transport services
and indicates the need for better services (Jaafar, Ponrahono, Bachok, Ibrahim, &
Osman, 2014).
Malaysia is also experiencing rapid development in order to achieve
Vision 2020, thus, an efficient transportation system is needed to enhance the
productivity and encourages economic activities, thereby increasing the national
output and competitiveness (Economic Planning Unit, 2015). Kuala Lumpur
itself is a booming city facing immense challenges in trying to accommodate
additional private cars every year and the increased motor vehicles are faster than
the population growth (Economic Planning Unit, 2014). The city struggles with
air pollution and traffic congestion thus reduces the Quality of Good Life
(McKinsey & Company, 2013). It is just not enough to rely on the factors of
convenience to encourage the behaviour of using public transport. Individuals,
however, still prefer to purchase private car instead of using public transport
(Public Transport User Associations, 2010). Public were seen as reluctant of
being in a crowded train with strangers (Department for Transport, 2011). It is
for these reasons that the policy makers should learn to understand the unique
needs of the general public especially in terms of their dependency on private
vehicles before committing to new major projects related to transportation.
Public transportation is, therefore, a cornerstone of a nation’s economy
which provides a transit medium for daily mobility and the link between the
people and their jobs, education and entertainment. Service coverage, travel time,
reliability, park and ride facilities, comfort and safety are among the determining
factors towards encouraging public transportation as a mode of choice (Land
Transport Authority, 2014). One of the main causes of traffic congestions in KL
is the substantial number of private vehicles with only a single occupant. This
happens because of the weakness of public transport system and the problem is
generally caused by the lack of coordination between agencies and the lack of
integration of public transport services (Abd. Rahman & Abdullah, 2016).
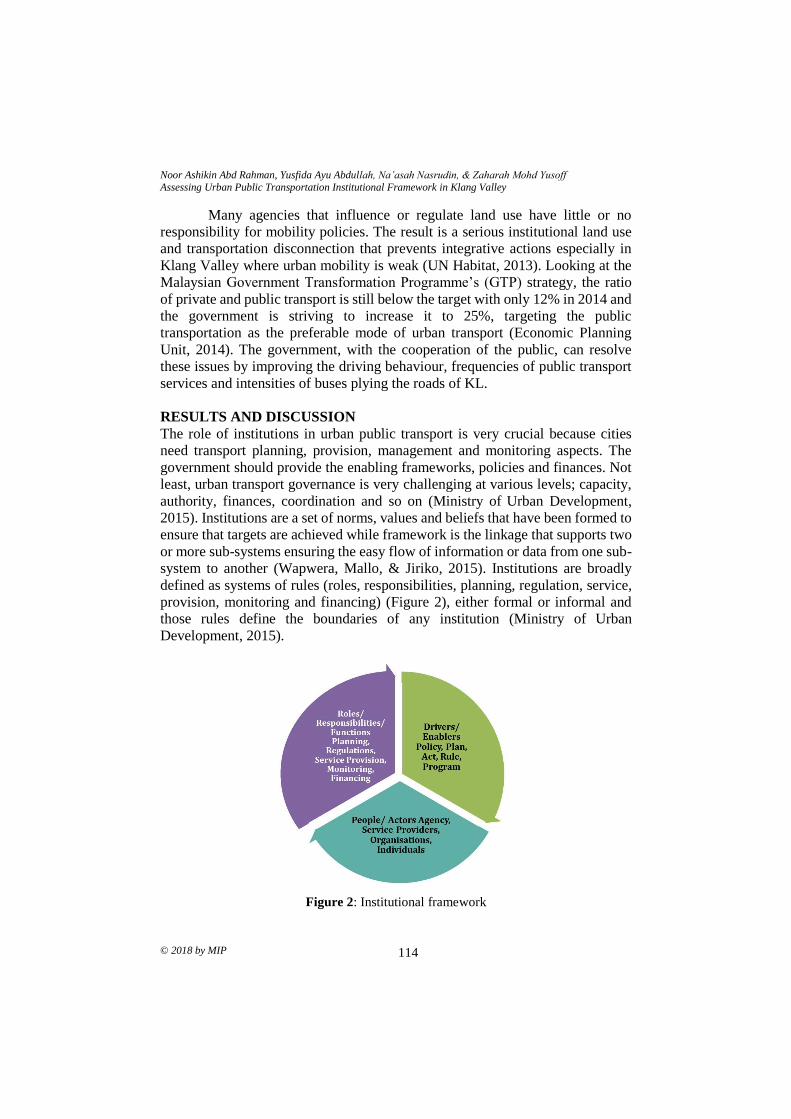
Noor Ashikin Abd Rahman, Yusfida Ayu Abdullah, Na’asah Nasrudin, & Zaharah Mohd Yusoff
Assessing Urban Public Transportation Institutional Framework in Klang Valley
© 2018 by MIP 114
Many agencies that influence or regulate land use have little or no
responsibility for mobility policies. The result is a serious institutional land use
and transportation disconnection that prevents integrative actions especially in
Klang Valley where urban mobility is weak (UN Habitat, 2013). Looking at the
Malaysian Government Transformation Programme’s (GTP) strategy, the ratio
of private and public transport is still below the target with only 12% in 2014 and
the government is striving to increase it to 25%, targeting the public
transportation as the preferable mode of urban transport (Economic Planning
Unit, 2014). The government, with the cooperation of the public, can resolve
these issues by improving the driving behaviour, frequencies of public transport
services and intensities of buses plying the roads of KL.
RESULTS AND DISCUSSION
The role of institutions in urban public transport is very crucial because cities
need transport planning, provision, management and monitoring aspects. The
government should provide the enabling frameworks, policies and finances. Not
least, urban transport governance is very challenging at various levels; capacity,
authority, finances, coordination and so on (Ministry of Urban Development,
2015). Institutions are a set of norms, values and beliefs that have been formed to
ensure that targets are achieved while framework is the linkage that supports two
or more sub-systems ensuring the easy flow of information or data from one sub-
system to another (Wapwera, Mallo, & Jiriko, 2015). Institutions are broadly
defined as systems of rules (roles, responsibilities, planning, regulation, service,
provision, monitoring and financing) (Figure 2), either formal or informal and
those rules define the boundaries of any institution (Ministry of Urban
Development, 2015).
Figure 2: Institutional framework
PLANNING MALAYSIA
Journal of the Malaysia Institute of Planners (2018)
115 © 2018 by MIP
At present, a range of public and private institutions have their own
responsibilities for transportation in the Klang Valley. According to the Land
Public Transport Commission (2012), there are many agencies focusing on public
transport in Malaysia such as the Prime Minister’s Office, Economic Planning
Unit (EPU), Ministry of Finance (MoF), Ministry of Housing, Urban Wellbeing
and Local Government, Ministry of Transport (MoT), Ministry of Works (MoW),
Ministry of Federal Territories, Ministry of Natural Resources and Environment,
Ministry of Home Affairs and also the Land Public Transport Commission. These
agencies are accountable and form part of the institutional framework for urban
public transport in Malaysia whether directly or indirectly.
For now, no single government agency has the authority to plan and
deliver solutions for urban mobility across all relevant dimensions (public and
private transport mode) and level of government, and administrative geographical
boundaries (especially among local authorities and states). The Land Public
Transport Commission or known as the Suruhanjaya Pengangkutan Awam Darat
(SPAD) has been given the jurisdiction over land public transport only and not
including private (car-based) transport planning, which at the national level
(federal level) is under the jurisdiction of Ministry of Works. In practice, the
overall transport planning between private and public transport is formulated and
delivered with limited coordination between agencies (Sander, 2015).
Based on the study, it was apparent that urban public transportation in
Klang Valley faces many disputes in relation to its institutional framework, such
as discussed below.
Institutional Coordination between Agencies for Urban Public
Transportation
The issue of public transportation is related to the complexity of land use and lack
of holistic approach in development and planning strategies. Furthermore, lack of
comprehensive planning is the key factor which creates connectivity gaps, thus
rendering the Land Public Transport (LPT) services as inefficient and not user-
friendly. A cohesive effort between the Federal, States and Local Authorities
needs to be established and clearly defined roles and responsibilities are critical
to ensure a seamless system is put in place (Abdul Aziz & Mohd Amin, 2012).
The development has led to institutional conflicts in several areas
especially enforcement, infrastructure provision and use, policy formulation and
coordination. Problems of complexity, planning, implementation and
enforcement should be viewed seriously because there are different ministries and
agencies at the federal and local levels involved in various aspects of public
transport in the Klang Valley. It is necessary to create a central responsibility for
policy planning and regulatory oversight to achieve successful initiatives (Oni,
Okanlawon, & Asenime, 2006). Furthermore, the four (4) thrusts should be
carried out especially in ensuring that the transportation efficiency such as
Noor Ashikin Abd Rahman, Yusfida Ayu Abdullah, Na’asah Nasrudin, & Zaharah Mohd Yusoff
Assessing Urban Public Transportation Institutional Framework in Klang Valley
© 2018 by MIP 116
collaborative planning and governance, regulatory strengthening, service quality
and excellence and also infrastructure and capacity (Abdul Aziz & Mohd Amin,
2012).
Based on the expert interviews, it was discovered that the lack of
foresight on behalf of the government has resulted in a situation where Klang
Valley endures high level of car ownership but low level of public transportation
usage. A poor public transportation system will only force more people to not
choose public transport, more so if they have access to private vehicles. Public
transportation in semi-urban and rural areas has suffered the most from these
disastrous policies. Worse still is the fact that local authorities have been
witnessing this deterioration with the lack of finances and most importantly the
jurisdiction to arrest the situation. The poor public transport system costs the
Klang Valley people too much.
From the analysis, 80% of the interviewees suggested that the
government should focus on coordination between relevant agencies because
separate efforts will cause a mismatch and redundancy of services and
development. Furthermore, serving the convenient and price point of the public
transport is the most important part to shift the culture of high usage of private
transport into public transport. According to the World Bank’s report, the rates at
which roads were being built were unable to match with the expansion rates of
car possession. Furthermore, the issue of traffic congestion in Malaysia’s cities
especially in Kuala Lumpur and Selangor is a result of insufficient public transit
as an alternative to car use along with public satisfaction towards public transport
are low. These threaten the achievement of public transport usage for Malaysian
(Sander, 2015).
The task in transforming public transport in the Klang Valley was led by
SPAD in coordination with various agencies. However, lack of coordination
among agencies in planning and implementation of various policies and
initiatives had resulted in inefficient use of public transport. Although there is an
established public transport committee yet there is still a lack of efficacy in
carrying out public transport improvements plan. Overseen by different agencies,
urban transport planning is not integrated across modes and administrative
boundaries. Transport planning does not span to Greater Kuala Lumpur or Klang
Valley conurbation, which is often defined differently by different agencies. At
the federal level, the Ministry of Transport, Ministry of Works and SPAD are
responsible for planning and delivering urban transport (private and public
transport) especially at the city level. But in Vancoucer, urban transport planning
is done at the metropolitan level (Sander, 2015).
Issues of Policy Implementation for Urban Transportation
Urbanization boosted the economic opportunity especially for big cities and
changes the style of development. Road congestions are mainly caused by high
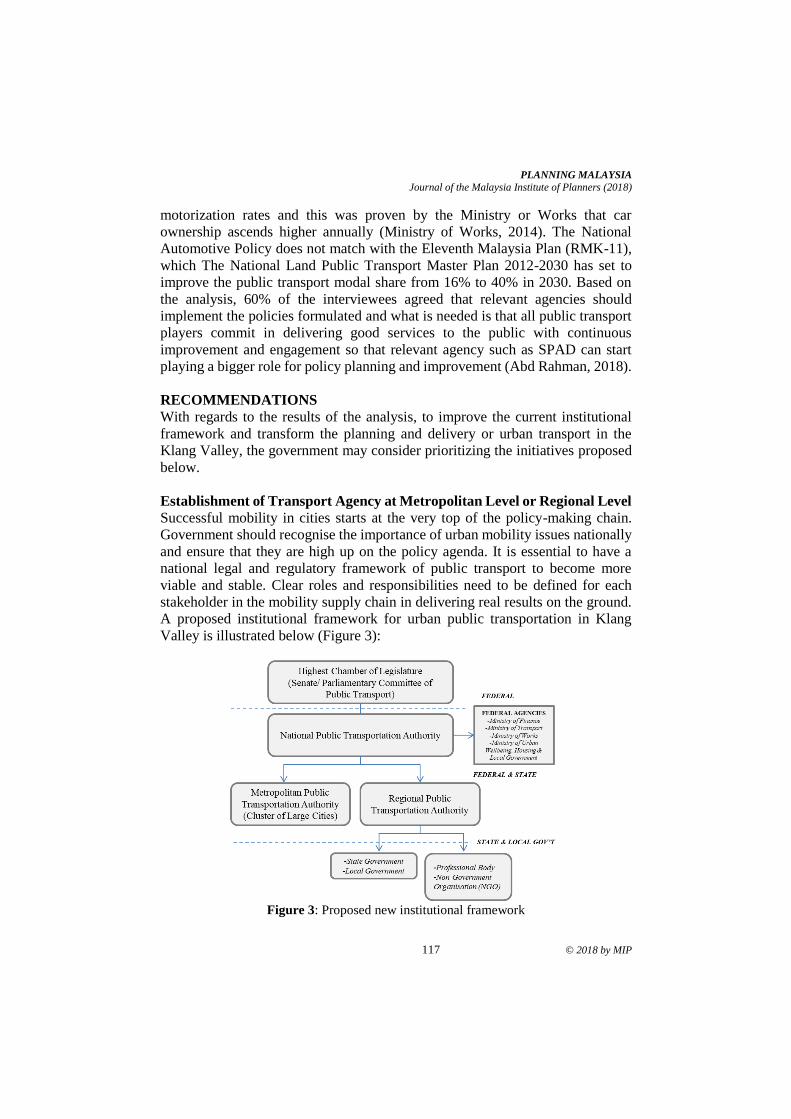
PLANNING MALAYSIA
Journal of the Malaysia Institute of Planners (2018)
117 © 2018 by MIP
motorization rates and this was proven by the Ministry or Works that car
ownership ascends higher annually (Ministry of Works, 2014). The National
Automotive Policy does not match with the Eleventh Malaysia Plan (RMK-11),
which The National Land Public Transport Master Plan 2012-2030 has set to
improve the public transport modal share from 16% to 40% in 2030. Based on
the analysis, 60% of the interviewees agreed that relevant agencies should
implement the policies formulated and what is needed is that all public transport
players commit in delivering good services to the public with continuous
improvement and engagement so that relevant agency such as SPAD can start
playing a bigger role for policy planning and improvement (Abd Rahman, 2018).
RECOMMENDATIONS
With regards to the results of the analysis, to improve the current institutional
framework and transform the planning and delivery or urban transport in the
Klang Valley, the government may consider prioritizing the initiatives proposed
below.
Establishment of Transport Agency at Metropolitan Level or Regional Level Successful mobility in cities starts at the very top of the policy-making chain.
Government should recognise the importance of urban mobility issues nationally
and ensure that they are high up on the policy agenda. It is essential to have a
national legal and regulatory framework of public transport to become more
viable and stable. Clear roles and responsibilities need to be defined for each
stakeholder in the mobility supply chain in delivering real results on the ground.
A proposed institutional framework for urban public transportation in Klang
Valley is illustrated below (Figure 3):
Figure 3: Proposed new institutional framework
Noor Ashikin Abd Rahman, Yusfida Ayu Abdullah, Na’asah Nasrudin, & Zaharah Mohd Yusoff
Assessing Urban Public Transportation Institutional Framework in Klang Valley
© 2018 by MIP 118
Overseen by different agencies, urban public transport is not integrated
across modes and administration boundaries. Agencies such as the Ministry of
Transport, Ministry of Works and SPAD are the federal level agencies
responsible for planning and delivering urban transport at the city level but not in
a metropolitan/regional level. This establishment of a new institutional
framework can integrate approach towards the policy, planning and delivery of
urban transport across different modes and across the administration boundaries.
Policy Alignment and Implementation Government or agency should emphasized to align all relevant development
policies from Vision 2020, National Physical Plan 3 (NPP3), National
Urbanisation Policy, Land Public Transport Master Plan, Eleventh Malaysia Plan
and also development plans at every relevant city to promote an efficient and
effective land public transport. Hence, if we want to achieve a 40% modal share
for public transport in urban areas especially in the Klang Valley, the policy
makers should therefore focus on major policies. This initiative should consider
the transportation infrastructure policy by giving the priority to public transport
development and also the land use policy by adopting compact, connected and
coordinated cities, in addition to adapting the Transit Oriented Development
(TOD) and allowing a maximum plot ratio up to 1:8 for every development that
implemented this policy especially in Selangor (JPBD Selangor, 2016).
Based on the analysis, in delivering good public transport services to the
public, it should refer to supply and demand system. The government have not
encouraged the public enough in using the public transport. It should, at the same
time implements policies to support the initiative such as increasing new car
price, reconsider when building new road or highways and provide tax exemption
for urban public transport (Abd. Rahman, 2018). Furthermore, the government
must align all policies to promote public transport incentives to discourage the
usage of private transport in congested areas like Klang Valley. By implementing
these policies, it will help Malaysia to transform its public transport system and
achieve the vision of “Public Transport as Rakyat Choice of Mobility’ through
physically well connected, affordable and accessible, high level services,
convenience, safe, secure, reliable and sufficient information (Suruhanjaya
Pengangkutan Awam Darat, 2012).
CONCLUSION
A region like Klang Valley would easily be communicated if the traffic flow ran
smoothly and orderly, and when there is integration between the public transport
systems. Likewise, this can be achieved through a good public transport planning
system and policy implementation through an integrated and across mode and
administrative boundaries. Cities should be able to provide an efficient urban
structure and equitable society which all members can easily gain access to all
PLANNING MALAYSIA
Journal of the Malaysia Institute of Planners (2018)
119 © 2018 by MIP
the amenities and enjoy the maximum benefits of city life. Moreover, the
implementation of effective public transport system is the key solution in
improving people mobility and also to counter the major problem of urban public
transportation in Klang Valley. With the right regulatory and institutional
framework in place, Klang Valley will have the power to define how they can
encourage the people to use public transport and also achieve developing country
with efficient and affordable transportation network towards 2020.
Note: During the study, SPAD was still lawful as the responsible commission for land public transport. However, the newly elected government, has announced in June 2018 that SPAD is to be disbanded
and replaced by the Agensi Pengangkutan Awam Darat (APAD) or also known as the Land Public Transport Agency. APAD will therefore be responsible in delivering the public transport policies in
the country. It is also will be responsible for the planning and development of public transport
especially for Mass Rapid Transport (MRT) and Light Rail Transit (LRT). To avoid any conflicts of duties, APAD will have a separate role from the Road Transport Department Malaysia or Jabatan
Pengangkutan Jalan (JPJ). JPJ itself will function accordingly based on the Land Public Transport
Act 2010. At this point (August 2018), the restructuring of SPAD is still ongoing.
ACKNOWLEDGEMENT
The authors would like to thank the Public Service Department of Malaysia for
funding the research, the Universiti Teknologi MARA (UiTM) and the Centre of
Postgraduate Studies FSPU, UiTM for the provision of support facilities. A
special thank goes to all the participants from the government departments,
organisations and individuals who have contributed to this study.
REFERENCES Abd. Rahman, N. A. (2018). Draft of analysis for urban public transportation
institutional framework in Malaysia [Unpublished].
Abd. Rahman, N.A., & Abdullah, Y. A. (2016). Theorizing the concept of urban public
transportation institutional framework in Malaysia. 4th International Building
Conference (IBCC 2016). March 7-8, 2016, Kuala Lumpur, Malaysia.
Abdul Aziz, A., & Mohd Amin, N. F. (2012). Transforming the land public transport
system in Malaysia. Sharing Urban Transport Solutions, 30.
Department for Transport (2011). Travel training: Good practice guidance. London:
Author.
Economic Planning Unit (2014). Government transformation programme: Annual report
2014. Malaysia: Government of Malaysia.
Economic Planning Unit (2015). Eleventh Malaysia plan (RMK-11). Malaysia:
Government of Malaysia.
Jaafar, S., Ponrahono, Z., Bachok, S., Ibrahim, M., & Osman, M. M. (2014). Urban public
transportation cycle and sustainability challenges in Malaysia. International
Islamic University Malaysia Research, Invention and Innovation Exhibition:
IIUM.
Jabatan Perancangan Bandar dan Desa Negeri Selangor [JPBD Selangor] (2016). Dasar
perancangan pembangunan berorientasikan transit negeri Selangor. Selangor,
Malaysia: Author.
Noor Ashikin Abd Rahman, Yusfida Ayu Abdullah, Na’asah Nasrudin, & Zaharah Mohd Yusoff
Assessing Urban Public Transportation Institutional Framework in Klang Valley
© 2018 by MIP 120
Land Public Transport Commission (2012). Greater KL/Klang Valley – Land public
transport master plan. Kuala Lumpur: Government of Malaysia.
Land Transport Authority (2014). Land Transport Authority annual report. Singapore:
Author.
Malaysian Digest (2015, April 3). The problem with Malaysia’s public transport. Is
change on the horizon? Retrieved from
http://www.malaysiandigest.com/news/548349-the-problem-with-malaysia-s-
public-transport-is-change-on-the-horizon.html.
McKinsey & Company (2013). How to make a city great. Retrieved from
https://www.mckinsey.com/featured-insights/urbanization/how-to-make-a-city-
great
Ministry of Transport (2014). Strategy paper – Providing seamless transportation.
Malaysia: Government of Malaysia.
Ministry of Urban Development (2015). Institutional development in urban transport.
India: Government of India.
Ministry of Works (2014). Road traffic volume 2014. Malaysia: Government of Malaysia.
Oni, S. I, Okanlawon, K. R., & Asenime, C. O. (2006). Institutional framework for the
transformation of transport administration in Metropolitan Lagos. In R.
Anifowose, & T. Babawale (Eds.), An agenda for a new Nigeria: The imperative
of transformation (pp. 421-437). Lagos, Nigeria: Concept Publications Limited.
Palinkas, L. A., Horwitz, S. M., Green, C. A., Wisdom, J. P., Duan, N., & Hoagwood, K.
(2015). Purposeful sampling for qualitative data collection and analysis in mixed
method implementation research. Administration and Policy in Mental Health,
42(5), 533-544.
Public Transport User Associations (2010). Public transportation. Available at
https://www.ptua.org.au/2010/.
Sander, F. G. (2015). Malaysia economic monitor June 2015: Transforming urban
transport. Thailand: The World Bank.
Suruhanjaya Pengangkutan Awam Darat (2012). National land public transport master
plan. Kuala Lumpur: Government of Malaysia.
TallyPress.com (2016, January 6). 8 Reasons why Malaysians are extremely frustrated
with our transportation system. Retrieved from https://tallypress.com/fun/8-
reasons-why-malaysians-are-extremely-frustrated-with-our-transportation-
system.
The Star (2017, April 1). Awareness is key to public transport take-off. Retrieved from
https://www.thestar.com.my/business/business-news/2017/04/01/ awareness-is-
key-to-public-transport-takeoff/
UN Habitat (2013). Planning and design for sustainable urban mobility: Global repost
on human settlement 2013. Kenya: Author.
Wapwera, S. D., Mallo, D. M., & Jiriko, G. J. (2015). Institutional framework and
constraints in the urban and regional planning system in Jos Metropolis, Nigeria.
Journal of Geography, 8(10), 244-260.
1Senior Lecturer at Universiti Teknologi MARA, Malaysia. E-mail: [email protected] 121
PLANNING MALAYSIA:
Journal of the Malaysian Institute of Planners
VOLUME 16 ISSUE 3 (2018) Page 121 – 131
USE PATTERN AND ACTIVITIES: THE EVALUATION OF
MALAYSIAN GREEN OPEN SPACE DESIGN
Nurhayati Abdul Malek1 & Amanina Nashar²
1Faculty of Architecture, Planning and Surveying
UNIVERSITI TEKNOLOGI MARA, MALAYSIA
2MDLA DESIGN SDN. BHD., SELANGOR, MALAYSIA
Abstract
Numerous studies acknowledged green open space (GOS) as part of the
sustainable component which promotes livability and active community. GOS
offers the opportunity for people to socialise through appropriate outdoor setting.
Acknowledging countless GOS benefits, hence it appears relevant to plan for a
good quality of GOS (QGOS). A QGOS ensures park users enjoy maximum
utilisation and benefit of outdoor spaces. Having a good QGOS is one of the
government strategies included in the 11th Malaysian Plan 2016-2020, to improve
people quality of life. Numerous urban related studies had shown that proximity,
use pattern, sociability, accessibility and varieties of activities are the significant
factors for successful parks design with the consideration of needs and
preferences of park users. Hence, this paper will focus on park use pattern to
access the quality of the neighbourhood park (QNP) in Malaysia. The objectives
are; i) to identify park use pattern among Malaysian, ii) to determine influential
factors of Malaysian park use pattern. A quantitative method of questionnaire
survey was conducted to obtain the data. Factor analysis results generated from
the 1,500 respondents surveyed at 15 Malaysian neighbourhood parks indicated
that nature appreciation loads the highest (Eigenvalue = 2.067, Variance
Explained = 29.534%), social and active activities (Eigenvalue = 1.270, Variance
Explained = 18.137%), followed by passive activities (Eigenvalue = 0.825,
Variance Explained = 11.785%). Together, this finding provides essential
guidance for park planners to plan for future QGOS and as part of the support to
the 11th Malaysian Plan (2016-2020).
Keywords: quality neighbourhood park, use pattern, activities
Noor Ashikin Abd Rahman, Yusfida Ayu Abdullah, Na’asah Nasrudin, & Zaharah Mohd Yusoff
Assessing Urban Public Transportation Institutional Framework in Klang Valley
© 2018 by MIP 122
INTRODUCTION
Current statistics release by World Health Organization (WHO) indicates
minimal level of people involvement in physical activities around the globe. Lack
of involvement in physical activities has led to increasing death rate and non-
communicable diseases (NCD). Hence, encouraging more people to actively
involve in physical activities is included as one of the four global strategies to
overcome this shortcoming. In 2015, all countries, including Malaysia, had taken
proactive measures by being signatories to the Transforming our World: The
2030 Agenda for Sustainable Development. The Agenda strives to ensure
universal health coverage and decreasing health inequities for people of all ages.
Apart from that, enhancing people's well being particularly on community health
is one of the main strategies listed in the 11th Malaysia Plan (2016-2020).
To date, previous and current studies have been emphasising on the
significant benefits of GOS in terms of active participation in physical activities
(PA) for all ages. However, GOS offers countless other benefits including health
benefits, social sustainability, and environment and psychological improvement
(Warburton, Nicol, & Bredin, 2006; Wendel-Vos, Droomers, Kremers, Brug, &
Van Lenthe, 2007). Along with these benefits, QGOS is seen as a significant
contributor to promote a healthy lifestyle among Malaysian citizen. QGOS
encourage active park utilisation through variety of recreational activities.
Several studies have documented that maintenance, safety, facilities,
accessibility, distance and natural elements are the significant factors that
influence park usability (McCormack, Rock, Toohey, & Hignell, 2010; Chen,
Liu, Xie, & Marušić, 2016). Moreover, access to parks and GOS brings positive
effects to physical, mental health and human well-being (Sugiyama, Healy,
Dunstan, Salmon, Owen, 2008; Park et al., 2011; Houlden, Weich, & Jarvis,
2017). However, this paper narrows its focus on park use pattern and activities
upon two measures of the user’s needs and preferences, particularly in Malaysia
neighbourhood park context.
LITERATURE REVIEW
Needs and Preferences Related to Quality Neighbourhood Park
Recent studies on high-quality park have emphasized the essential of park use
pattern, perception and user’s needs in an outdoor setting (Lee & Maheswaran,
2010; Goličnik & Thompson, 2010). In the past century, the term ‘park quality’
addressed the relationship between man and space (Carmona, Heath, Oc, &
Tiesdell, 2003; Francis, 2003; Ter, 2011). In the 20th century, guided by this
concept, parks are designed to offer various recreational activities, with
consideration of user's needs and satisfaction. Needs and satisfaction are two
essential measures to ensure social sustainability and enhance people well-being
through green open spaces (Kweon, Christopher, Leiva, & Rogers, 2010; Hadavi,
PLANNING MALAYSIA
Journal of the Malaysia Institute of Planners (2018)
123 © 2018 by MIP
Kaplan, & Hunter, 2017). Meanwhile, other studies on parks and green open
spaces have also found that people’s needs and preferences on activities
conducted within the park area influence the level of park utilisation (Iamtrakul,
Kardi, Jian, & Kazunori, 2005; Maulan, 2015; Moulay, Ujang, & Said, 2017;
Abbasi, Alalouch, & Bramley, 2016; Paul & Nagendra, 2017). Francis (2003)
found out that the identification of user’s needs helps in the formation of
successful green open spaces design and would prolong the time spend in the park
itself. Moreover, other studies found that different countries display different
needs and preferences (Priego, Breuste, & Rojas, 2008; Schipperijn et al., 2010).
Hence, this implicates that the identification of both needs and preference helps
designers to ensure good QCOS and generate high park utilisation among users.
When user’s needs are fulfilled, the level of satisfaction increases.
Parks Usage and Physical Activity Pattern
Prior studies pertaining neighbourhood park usage have outlined several criteria
of active park utilisation. Activities conducted, transportation mode, frequency of
usage and travel time are among frequently used measures to determine park
utilisation (Parks and Recreation Department, 1989; Yuen, 1996; Bahrini, Bell &
Mokhtarzadeh, 2017). Indeed, other studies reported that the facilities provided,
park sizes and park distance from home profoundly determine park use pattern
(Giles-Corti et al., 2005; Kaczynski, Potwarka, & Saelens, 2008). For instance,
the closer the neighbourhood area to the park, the more percentage it is likely to
be utilised by the residents. However, there are also studies that measure park use
pattern by green infrastructure (Mansor, Said, & Mohamad, 2010), park space
quantity and quality, facilities condition, social demographic as well as park
management (Nasution & Zahrah, 2012).
Additionally, Matsuoka & Kaplan (2008) reported that the outdoor
physical setting, particularly nature elements, has a strong influence on the park
user’s wellbeing and their responses towards the outdoor setting. In other related
studies, Hadavi et al. (2017) found that physical activities performed, frequency
of walk and visitation are the crucial measures to park use pattern.
Active, Passive and Social Activities
A study conducted by Carr, Francis, Rivlin and Stone (1992) stated that comfort,
relaxation, discovery, and user’s engagement with the environment are four
significant basic needs of people towards open spaces. Passive includes watching
people and the surrounding nature. Meanwhile, active activities involve contact
with people, socialising and recreational activities. Hari and Kujala (2009)
pointed out that social activity occurs when there are at least two or more people
connected to each other with interactivity process and encouragement in an
outdoor space. Gobster (2002), characterised three types of activities within the
outdoor spaces as i) passive activities (PA), ii) active individual (AI), and active
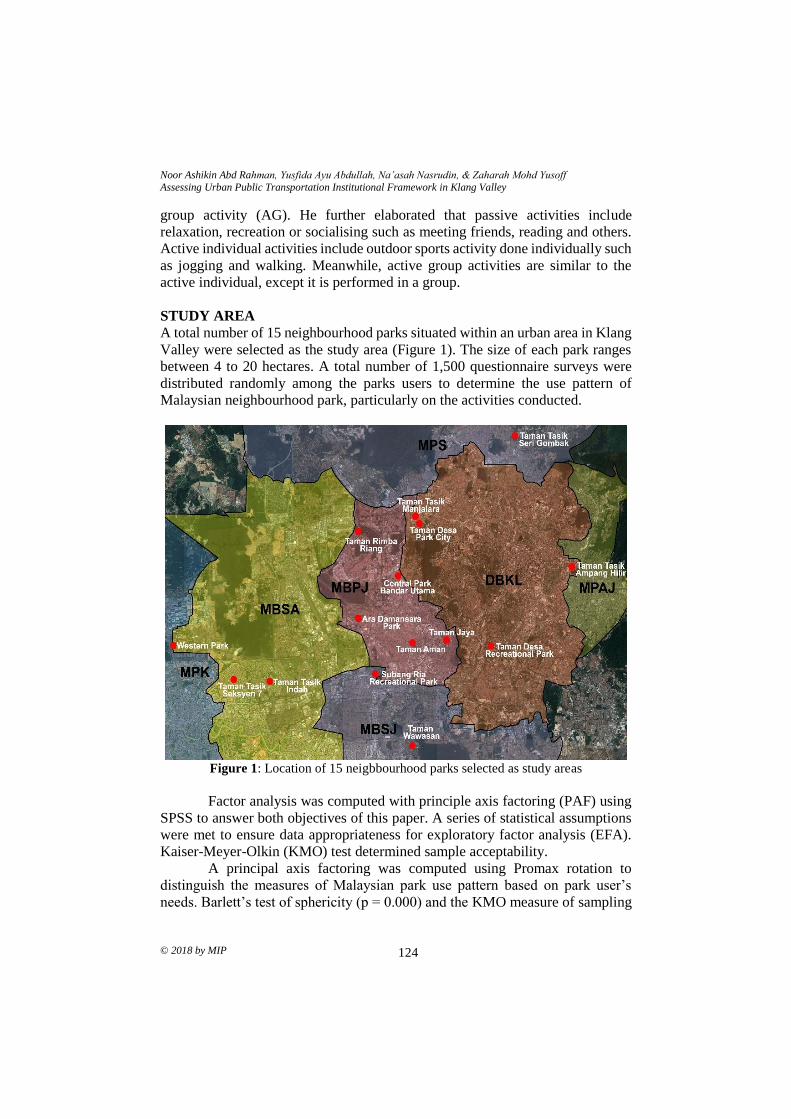
Noor Ashikin Abd Rahman, Yusfida Ayu Abdullah, Na’asah Nasrudin, & Zaharah Mohd Yusoff
Assessing Urban Public Transportation Institutional Framework in Klang Valley
© 2018 by MIP 124
group activity (AG). He further elaborated that passive activities include
relaxation, recreation or socialising such as meeting friends, reading and others.
Active individual activities include outdoor sports activity done individually such
as jogging and walking. Meanwhile, active group activities are similar to the
active individual, except it is performed in a group.
STUDY AREA
A total number of 15 neighbourhood parks situated within an urban area in Klang
Valley were selected as the study area (Figure 1). The size of each park ranges
between 4 to 20 hectares. A total number of 1,500 questionnaire surveys were
distributed randomly among the parks users to determine the use pattern of
Malaysian neighbourhood park, particularly on the activities conducted.
Figure 1: Location of 15 neigbbourhood parks selected as study areas
Factor analysis was computed with principle axis factoring (PAF) using
SPSS to answer both objectives of this paper. A series of statistical assumptions
were met to ensure data appropriateness for exploratory factor analysis (EFA).
Kaiser-Meyer-Olkin (KMO) test determined sample acceptability.
A principal axis factoring was computed using Promax rotation to
distinguish the measures of Malaysian park use pattern based on park user’s
needs. Barlett’s test of sphericity (p = 0.000) and the KMO measure of sampling
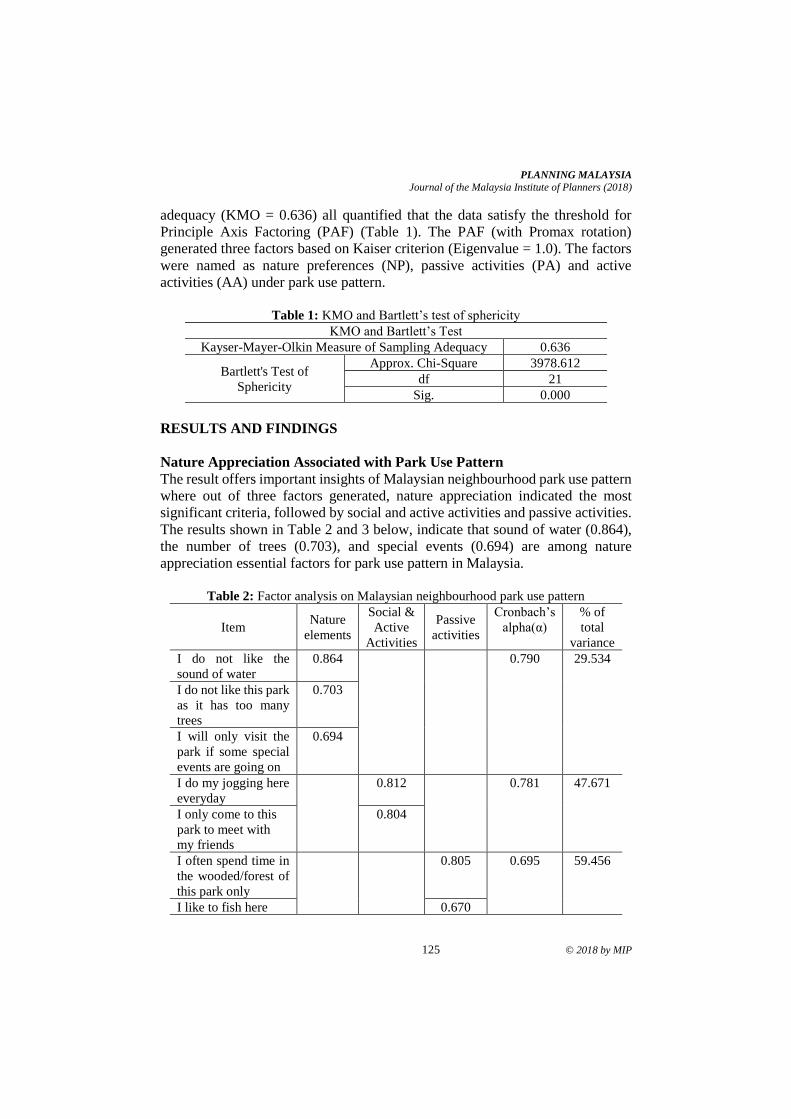
PLANNING MALAYSIA
Journal of the Malaysia Institute of Planners (2018)
125 © 2018 by MIP
adequacy (KMO = 0.636) all quantified that the data satisfy the threshold for
Principle Axis Factoring (PAF) (Table 1). The PAF (with Promax rotation)
generated three factors based on Kaiser criterion (Eigenvalue = 1.0). The factors
were named as nature preferences (NP), passive activities (PA) and active
activities (AA) under park use pattern.
Table 1: KMO and Bartlett’s test of sphericity
KMO and Bartlett’s Test
Kayser-Mayer-Olkin Measure of Sampling Adequacy 0.636
Bartlett's Test of
Sphericity
Approx. Chi-Square 3978.612
df 21
Sig. 0.000
RESULTS AND FINDINGS
Nature Appreciation Associated with Park Use Pattern
The result offers important insights of Malaysian neighbourhood park use pattern
where out of three factors generated, nature appreciation indicated the most
significant criteria, followed by social and active activities and passive activities.
The results shown in Table 2 and 3 below, indicate that sound of water (0.864),
the number of trees (0.703), and special events (0.694) are among nature
appreciation essential factors for park use pattern in Malaysia.
Table 2: Factor analysis on Malaysian neighbourhood park use pattern
Item Nature
elements
Social &
Active
Activities
Passive
activities
Cronbach’s
alpha(α)
% of
total
variance
I do not like the
sound of water
0.864 0.790 29.534
I do not like this park
as it has too many
trees
0.703
I will only visit the
park if some special
events are going on
0.694
I do my jogging here
everyday
0.812 0.781 47.671
I only come to this
park to meet with
my friends
0.804
I often spend time in
the wooded/forest of
this park only
0.805 0.695 59.456
I like to fish here 0.670
Noor Ashikin Abd Rahman, Yusfida Ayu Abdullah, Na’asah Nasrudin, & Zaharah Mohd Yusoff
Assessing Urban Public Transportation Institutional Framework in Klang Valley
© 2018 by MIP 126
Several implications drawn from the findings are; firstly, water is one of
the nature appreciation for parks which required certain characteristics. Most of
the park users prefer water elements with less sound such as pond or lakes.
Secondly, it is essential for parks to have an appropriate number of trees. A
possible explanation is that, too many trees will reduce user’s visual link from
opposite spaces and create sense of enclosure. Indeed, a study conducted by
Moulay et al. (2017) on open spaces found that legibility and visibility within
park spaces are two essential measures to successful park design in Malaysia. The
study further elaborated that too many obstacles such as trees and other objects
will delay the visibility process within spaces, hence reduce spatial connectivity.
Hence, maintenance, continuous vision, safety and security are part of significant
measures related to the theory of defensible spaces for the outdoor environment
(Newman, 1972). Bounds (2008) also identified spatial continuity, simplicity,
clarity and hierarchy of the elements between spaces as part of the measure of
QGOS.
Therefore, the finding indicates that trees location and maintenance are
two significant measures in park space design. Other studies emphasised that tree
characteristic is another aspect which contributes to park user’s safety and
security (Mohd. Hashim, Othman Thani, Jamaluddin, & Mohd Yatim, 2016).
Meanwhile, Krenichyn (2006) found that majority of female users feel unsafe
when utilising dark and enclose spaces.
Natural elements particularly trees are part of the prominent features of
successful GOS design (Abdul Malek & Nashar, 2018). Hence, together the
findings provide an important insight that, choosing the right trees is a key
challenge for park planners and landscape architect in park design. It is because
tree characteristics will influence user’s behaviour and experience towards
outdoor spaces, besides offering recreational opportunities for people to enjoy
being outdoor (Rahman, Tuan Hussain, & Mohamad Ismail, 2017).
Activities Related to Park Use Pattern in Malaysia
Different user’s have different preferences and needs. The second highest theme
extracted was social and active activities (Eigenvalue = 1.270, Variance
Explained = 18.137%), followed by passive activities (Eigenvalue =0.825,
Variance Explained = 11.785%). Majority of park users in Malaysia prefer social
and active activities such as jogging and meeting friends rather than passive
activities. The findings also indicate that age strongly influences activities
selection. Descriptive analysis computed on age factor indicates that majority of
93% of park users are below 45 years old. Meanwhile, about 17% of park users
age from 43 years old and above.
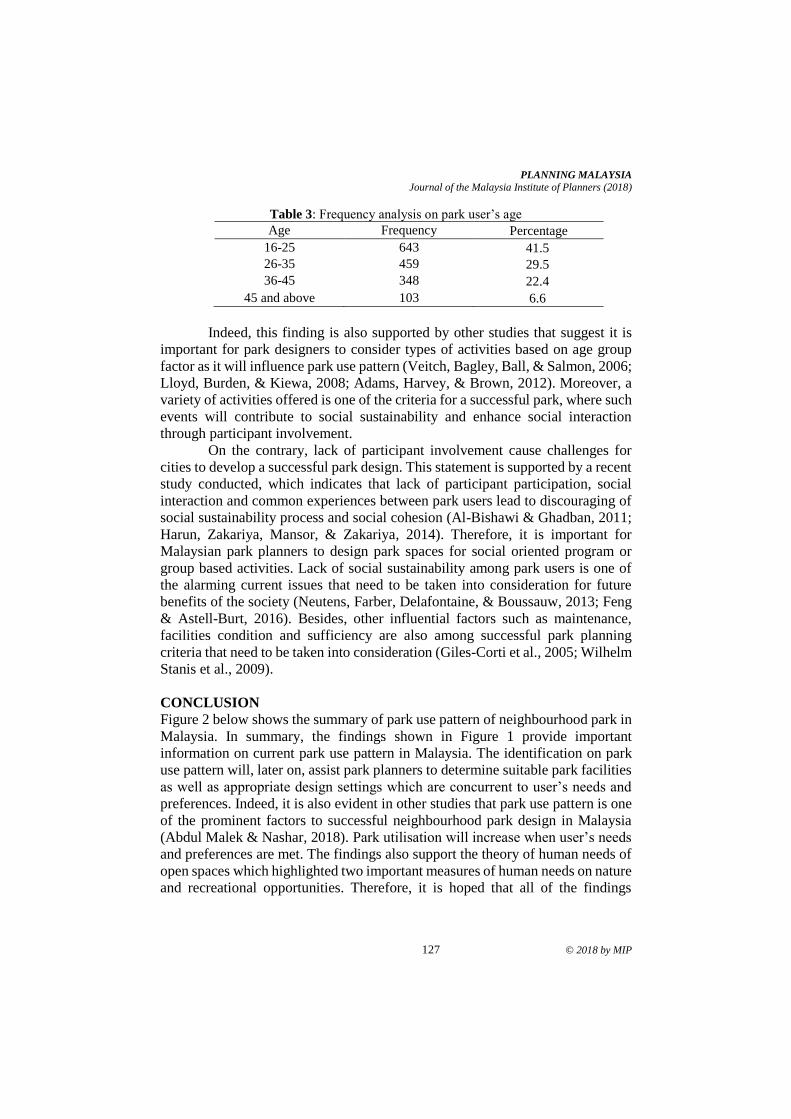
PLANNING MALAYSIA
Journal of the Malaysia Institute of Planners (2018)
127 © 2018 by MIP
Table 3: Frequency analysis on park user’s age
Age Frequency Percentage
16-25 643 41.5
26-35 459 29.5
36-45 348 22.4
45 and above 103 6.6
Indeed, this finding is also supported by other studies that suggest it is
important for park designers to consider types of activities based on age group
factor as it will influence park use pattern (Veitch, Bagley, Ball, & Salmon, 2006;
Lloyd, Burden, & Kiewa, 2008; Adams, Harvey, & Brown, 2012). Moreover, a
variety of activities offered is one of the criteria for a successful park, where such
events will contribute to social sustainability and enhance social interaction
through participant involvement.
On the contrary, lack of participant involvement cause challenges for
cities to develop a successful park design. This statement is supported by a recent
study conducted, which indicates that lack of participant participation, social
interaction and common experiences between park users lead to discouraging of
social sustainability process and social cohesion (Al-Bishawi & Ghadban, 2011;
Harun, Zakariya, Mansor, & Zakariya, 2014). Therefore, it is important for
Malaysian park planners to design park spaces for social oriented program or
group based activities. Lack of social sustainability among park users is one of
the alarming current issues that need to be taken into consideration for future
benefits of the society (Neutens, Farber, Delafontaine, & Boussauw, 2013; Feng
& Astell-Burt, 2016). Besides, other influential factors such as maintenance,
facilities condition and sufficiency are also among successful park planning
criteria that need to be taken into consideration (Giles-Corti et al., 2005; Wilhelm
Stanis et al., 2009).
CONCLUSION
Figure 2 below shows the summary of park use pattern of neighbourhood park in
Malaysia. In summary, the findings shown in Figure 1 provide important
information on current park use pattern in Malaysia. The identification on park
use pattern will, later on, assist park planners to determine suitable park facilities
as well as appropriate design settings which are concurrent to user’s needs and
preferences. Indeed, it is also evident in other studies that park use pattern is one
of the prominent factors to successful neighbourhood park design in Malaysia
(Abdul Malek & Nashar, 2018). Park utilisation will increase when user’s needs
and preferences are met. The findings also support the theory of human needs of
open spaces which highlighted two important measures of human needs on nature
and recreational opportunities. Therefore, it is hoped that all of the findings
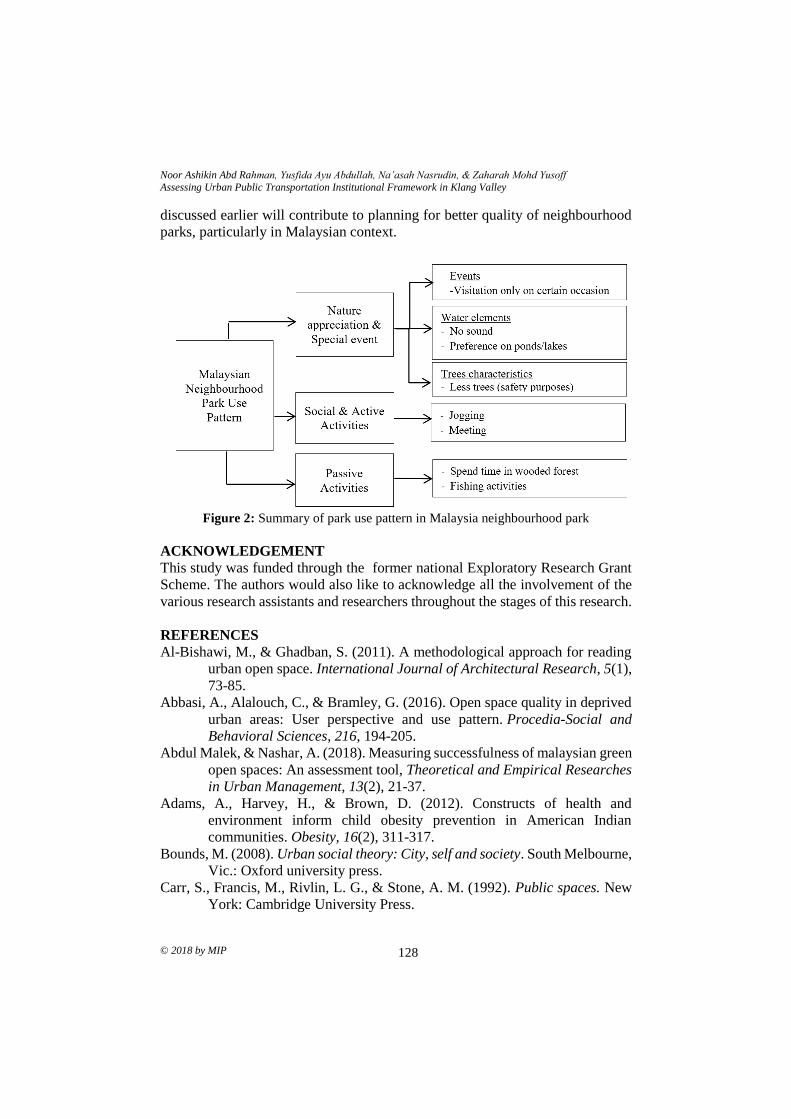
Noor Ashikin Abd Rahman, Yusfida Ayu Abdullah, Na’asah Nasrudin, & Zaharah Mohd Yusoff
Assessing Urban Public Transportation Institutional Framework in Klang Valley
© 2018 by MIP 128
discussed earlier will contribute to planning for better quality of neighbourhood
parks, particularly in Malaysian context.
Figure 2: Summary of park use pattern in Malaysia neighbourhood park
ACKNOWLEDGEMENT
This study was funded through the former national Exploratory Research Grant
Scheme. The authors would also like to acknowledge all the involvement of the
various research assistants and researchers throughout the stages of this research.
REFERENCES
Al-Bishawi, M., & Ghadban, S. (2011). A methodological approach for reading
urban open space. International Journal of Architectural Research, 5(1),
73-85.
Abbasi, A., Alalouch, C., & Bramley, G. (2016). Open space quality in deprived
urban areas: User perspective and use pattern. Procedia-Social and
Behavioral Sciences, 216, 194-205.
Abdul Malek, & Nashar, A. (2018). Measuring successfulness of malaysian green
open spaces: An assessment tool, Theoretical and Empirical Researches
in Urban Management, 13(2), 21-37.
Adams, A., Harvey, H., & Brown, D. (2012). Constructs of health and
environment inform child obesity prevention in American Indian
communities. Obesity, 16(2), 311-317.
Bounds, M. (2008). Urban social theory: City, self and society. South Melbourne,
Vic.: Oxford university press.
Carr, S., Francis, M., Rivlin, L. G., & Stone, A. M. (1992). Public spaces. New
York: Cambridge University Press.
PLANNING MALAYSIA
Journal of the Malaysia Institute of Planners (2018)
129 © 2018 by MIP
Carmona, M., Heath, T., Oc, T., & Tiesdell, S. (2003). Public spaces - urban
spaces: The dimensions of urban design. Oxford, UK: Architectural
Press, Elsevier.
Chen, Y., Liu, T., Xie, X., & Marušić, B. G. (2016). What attracts people to visit
community open spaces? A case study of the overseas Chinese Town
community in Shenzhen, China. International Journal of Environmental
Research and Public Health, 13(7), 644.
Feng, X., & Astell-Burt, T. (2016). What types of social interactions reduce the
risk of psychological distress? Fixed effects longitudinal analysis of a
cohort of 30,271 middle to older aged Australians. Journal of Affective
Disorder, 204, 99-102.
Francis, M. (2003). Urban open space: Designing for user needs. London: Island
Press.
Giles-Corti, B., Broomhall, M. H., Knuiman, M., Collins, C., Douglas, K., Ng,
K.,…& Donovan, R. J. (2005). Increasing walking: How important is
distance to, attractiveness, and size of public open space? American
Journal of Preventive Medicine, 28, 169-176.
Goličnik, B., & Thompson, C. W. (2010). Emerging relationships between design
and use of urban park spaces. Landscape and Urban Planning, 94(1), 38-
53.
Gobster, P. H. (2002). Managing urban parks for a racially and ethnically diverse
clientele. Leisure Sciences, 24, 143-159.
Hadavi, S., Kaplan, R., & Hunter, M. R. (2017). How does perception of nearby
nature affect multiple aspects of neighbourhood satisfaction and use
patterns? Landscape Research, 43(3), 360-379.
Harun, N. Z., Zakariya, K., Mansor, M., & Zakariya, K. (2014). Determining
attributes of the urban plaza for social sustainability. Procedia- social
and behavioural sciences. 153, 606-615.
Houlden, V., Weich, S., & Jarvis, S. (2017). A cross-sectional analysis of green
space prevalence and mental wellbeing in England. BMC Public
Health, 17(1), 460.
Hari, R., & Kujala, M. V. (2009). Brain basis of human social interaction: From
concepts to brain imaging. Physiological reviews, 89(2), 453-479.
Iamtrakul, P., Kardi, T., Jian, G., & Kazunori, H. (2005). Interaction of activity
involvement and recreational location selection behaviour in Lowland
City: A case study of public parks in Saga City, Japan. Journal of
Zhejiang University-SCIENCE A, 6(8), 900-906.
Kaczynski, A. T., Potwarka, L. R., & Saelens, B. E. (2008). Association of park
size, distance, and features with physical activity in neighbourhood
parks. American Journal of Public Health, 98, 1451-1456.
Noor Ashikin Abd Rahman, Yusfida Ayu Abdullah, Na’asah Nasrudin, & Zaharah Mohd Yusoff
Assessing Urban Public Transportation Institutional Framework in Klang Valley
© 2018 by MIP 130
Krenichyn, K. (2006). The only place to go and be in the city: Women talk about
exercise, being outdoors, and the meanings of a large urban park. Health
& Place, 12(4), 631-643.
Kweon, B. S., Christopher, E. D., Leiva, P. I., & Rogers, G. O. (2010). Landscape
components, land use, and neighbourhood satisfaction. Environment and
Planning B: Urban Analytics and City Science, 37(3), 500-517.
Lee, A. C., & Maheswaran, R. (2011). The health benefits of urban green spaces:
A review of the evidence. Journal of Public Health, 33(2), 212-222.
Lloyd, K., Burden, J., & Kiewa, J. (2008). Young girls and urban parks: Planning
for transition through adolescence. Journal of Park and Recreation
Administration, 26(3), 21-38.
Mansor, M., Said, I., & Mohamad, I. (2010). Experiential contacts with green
infrastructure’s diversity and well-being of the urban
community. Procedia - Social and Behavioral Sciences, 49, 257-267.
Matsuoka, R. H., & Kaplan, R. (2008). People needs in the urban landscape:
Analysis of landscape and urban planning contributions. Landscape and
Urban Planning, 84(1), 7-19.
Maulan, S. (2015). Preferences for usability at Taman Tasik Seremban, Malaysia.
International Journal of Sustainable Tropical Design Research and
Practice, 8, 28-33.
McCormack, G. R., Rock, M., Toohey, A. M., & Hignell, D. (2010).
Characteristics of urban parks associated with park use and physical
activity: A review of qualitative research. Health & Place, 16(4), 712-
726.
Mohd. Hashim, N. H., Othman Thani, S. K. S., Jamaluddin, M. A., & Mohd
Yatim, N. (2016). A perceptual study on the influence of vegetation
design towards women's safety in public park. Procedia-Social and
Behavioral Sciences, 234, 280-288.
Moulay, A., Ujang, N., & Said, I. (2017). Legibility of neighbourhood parks as a
predictor for enhanced social interaction towards social sustainability.
Cities, 61, 58-64.
Nasution, A. D., & Zahrah, W. (2012). Public open space's contribution to quality
of life: Does privatisation matters? Asian Journal of Environment-
Behaviour Studies, 3(9), 59-74.
Newman, O. (1972). Defensible space: People and design in the violent city.
London: Architectural Press.
Neutens, T., Farber, S., Delafontaine, M., & Boussauw, K. (2013). Spatial
variation in the potential for social interaction: A case study in Flanders
(Belgium). Computers, Environment and Urban Systems, 41, 318-331.
Park, B. J., Furuya, K., Kasetani, T., Takayama, N., Kagawa, T., & Miyazaki, Y.
(2011). Relationship between psychological responses and physical
PLANNING MALAYSIA
Journal of the Malaysia Institute of Planners (2018)
131 © 2018 by MIP
environments in forest settings. Landscape and Urban Planning, 102(1),
24-32.
Parks and Recreation Department (1989). Research study on effectiveness of
public parks in Singapore. Singapore.
Paul, S., & Nagendra, H. (2017). Factors influencing perceptions and use of urban
nature: Surveys of park visitors in Delhi. Land, 6(2), 27.
Priego, C., Breuste, J., & Rojas, J. (2008). Perception and value of nature in urban
landscapes: A comparative analysis of cities in Germany, Chile and
Spain. Landscape Online, 7(1), 22.
Rahman, A. A., Tuan Hussain, F. N., & Mohamad Ismail, S. (2017). Residents
Willingness to pay for conservation of green spaces and amenities at
Urban Forest Bukit Nanas, Kuala Lumpur, International Journal of the
Malay World and Civilisation, 5(1),81-86.
Schipperijn, J., Ekholm, O., Stigsdotter, U. K., Toftager, M., Bentsen, P.,
Kamper-Jørgensen, F., & Randrup, T. B. (2010). Factors influencing the
use of green space: Results from a Danish national representative survey.
Landscape and Urban Planning, 95(3), 130-137.
Sugiyama, T., Healy, G. N., Dunstan, D. W., Salmon, J., & Owen, N. (2008).
Joint associations of multiple leisure-time sedentary behaviours and
physical activity with obesity in Australian adults. International Journal
of Behavioral Nutrition and Physical Activity, 5, 35.
Ter, U. (2011). Quality criteria of urban parks: The case of Alaaddın Hill (Konya-
Turkey). African Journal of Agricultural Research, 6(23), 5367-5376.
Veitch, J., Bagley, S., Ball, K., & Salmon, J. (2006). Where do children usually
play? A qualitative study of parents’ perceptions of influences on
children’s active free-play. Health and Place, 12, 383-393.
Warburton, D. E. R., Nicol, C. W., & Bredin, S. S. D. (2006). Health benefits of
physical activity: The evidence. Canadian Medical Association Journal,
174, 801-809.
Wendel-Vos, W., Droomers, M., Kremers, S., Brug, J., & Van Lenthe, F. (2007).
Potential environmental determinants of physical activity in adults: A
systematic review. Obesity Reviews, 8, 425-440.
Wilhelm Stanis, W., Sonja, A., Schneider, I. E., Shinew, K. J., Chavez, D. J., &
Vogel, M. C. (2009). Physical activity and the recreation opportunity
spectrum: Differences in important site attributes and perceived
constraints. Journal of Park & Recreation Administration, 27(4), 73-91.
Yuen, B. (1996). Public housing-led recreation development in
Singapore. Habitat International, 19(3), 239-252.
1E-mail: [email protected] 132
PLANNING MALAYSIA:
Journal of the Malaysian Institute of Planners
VOLUME 16 ISSUE 3 (2018) Page 132 – 142
POST OCCUPANCY EVALUATION MODEL: ADAPTIVE MEASURE
TOWARDS SUSTAINABLE NEIGHBORHOOD
DEVELOPMENT
Rostam Yaman1, Suwattana Thadaniti2, Noraini Ahmad3, Jamalunlaili Abdullah4,
& Farrah Zuhaira Ismail5
1,2Environment Research Institute
CHULALONGKORN UNIVERSITY, THAILAND
3Kulliyah of Architecture and Environmental Design
INTERNATIONAL ISLAMIC UNIVERSITY, MALAYSIA
1,4,5Faculty Architecture, Planning and Surveying
UNIVERSITI TEKNOLOGI MARA, MALAYSIA
Abstract
Sustainable development is key to the strategic sustainability within a society.
Sustainable neighbourhood development (SND) is a fundamental element of a
sustainable community. However, SND on it own will certainly not permit all
stakeholders, particularly the end-users, to efficiently address current or
projected future issues that positioned beyond the extent of physical
development scope. Thus, this research aims to explore whether pre-occupancy
assessment criteria addresses the adaptive measures of sustainable dimension
pillars (SDP) upon post-occupancy holistically. The research objective is to
identify the post-occupancy sustainable criteria gap of SND. To achieve this, the
research applied Stakeholders-Inclusion Approach using Post-Occupancy
Evaluation Model (POEM) Handbook as measurement tool. This research seeks
to measure and identify SDP gap on economic, social and environmental balance
and responsive approach towards incremental improvements in SND at
community and individual levels. The findings indicated that there are SDP
adaptation gaps in post-occupied SND.
Keywords: post-occupancy evaluation, sustainable dimension pillar, assessment
criteria, stakeholder-inclusion approach sustainable neighbourhood
development
PLANNING MALAYSIA
Journal of the Malaysia Institute of Planners (2018)
133 © 2018 by MIP
INTRODUCTION
ASEAN Scenarios
Since the 1950’s, ASEAN region has experienced tremendous levels of
urbanization with more than 1,000% increase in urbanisation (Dahiya, 2014). The
expansion of city-based economic activities draws human into urban areas and
consequently expanding demand for more urban expansion and natural resources
consumption. Thus, the urbanization process in the ASEAN region is inextricably
linked to economic growth through (rapidly) rising consumption (Dahiya, 2016).
This striking rise in the “urban power of consumption” gives impacts at
multiple levels. Firstly, it raises the city-based demand for consumable goods and
services. Secondly, it increases demand for developed land for residential,
commercial, institutional, and other public uses (e.g. transport), along with
a plethora of urban infrastructure and basic services. Thirdly, the demand for
city expansion at the urban periphery causes an irreversible change in land-use
– from agriculture and forests to urban built-up areas – with consequential
concerns related to food in-security. Finally, it is quite likely that such a
staggering expansion of a “consuming class” spurs demand for private vehicles,
which creates an enormous increase in greenhouse gas emissions, with the
potential of further exacerbating climate change and its worldwide impacts.
The global greenhouse gas emission statistics by sectors suggests the
main emitted gas is carbon dioxide, which made up 70% of total emission
(Rauland & Newman, 2015). The main sectors of carbon emission which come
from energy and land use manifest in urban development and urban lifestyle
(Davies, 2016). Hence, the need to remodel the way of urbanizations either
development or lifestyle towards reducing greenhouse gas emission (Ho,
Matsuoka, Simson, & Gomi, 2013).
Urban Development & GBC’s/GBI’s.
Developing an economically productive urban set-up and at the same time
sustainable and equally liveable is a world issue. Future projections by 2030
suggest the planet will be a global city and not regarded as global village as
previously presumed (Yaman, 2016). Cities and metropolis will be the hub of
economic activity and productivity, a centre for human livelihood and economic
development. The neighbourhood roles in sustainable cities and as ways to
address the UN Sustainable Development Goal No. 11: Make cities and human
settlements inclusive, safe, resilient and sustainable, could be achieved via
interconnected network of green spaces that helps stop the loss of biodiversity,
enabling ecosystems to deliver their many services to people and nature and
multiple health benefits (Haase et al., 2017). Urban development should be
planned at district or micro level with requiring measurement and benchmark for
Rostam Yaman, Suwattana Thadaniti, Noraini Ahmad, Jamalunlaili Abdullah, Farrah Zuhaira Ismail
Post Occupancy Evaluation Model: Adaptive Measure Towards Sustainable Neighborhood Development
© 2018 by MIP 134
it performances. It should be both viable economically and sustainable
environmentally, and also socially just.
The concept of greening the neighbourhoods, districts and finally the
cities has become momentous challenge. Understanding the criteria frameworks
that was learnt from greening the buildings is rightly essential. The ideal green
district should emphasize on putting the pedestrian at the centre of planning and
designed considerations, while vehicular is regarded as secondary factor
(Aghaabbasi, Moeinaddini, Shah, & Asadi-Shekari, 2017). Emphasizing
communal walking and cycling distance to access daily need and socially interact
is sustainable, the usage of energy is reduced, thus, no greenhouse gas (GHG)
emitted to the atmosphere. Community can be connected to nature by accessing
to green lungs, such as parks, gardens or playfields. The well-being of the
communities is increased through employment and education opportunities
within local vicinity, civics engagement and other local amenities (Peters, 2016). Throughout the region, governments, developers and communities have
realized the values of sustainable development, effort need to be consolidated
into actions as holistic approach in sustainable built environment, community and
economic is rather complex (McGill, Oyedele, McAllister, & Qin, 2016). Green
Building Councils/Institutes (GBC’s/GBI’s) in the ASEAN have recognized the
needs of frameworks for sustainable communities, various rating assessment
criteria’s and tools for sustainable development have been developed and
consistently revised. These frameworks have been developed to give clear and
consistent direction on sustainable communities. They also act as reference to
local authorities with a policy framework, project planning and approval, and for
ultimate sustainable development outcomes (Palmqvist, 2015). However, most of
the GBC’s/GBI’s in this region are still lacking on evaluation tools targeting at
end-users or households, except Malaysia, Singapore and Indonesia (Table 1),
which have pre-occupancy assessment tools (Yaman, Thadaniti,
Suntornvongsagul, Adnan, & Ahmad, 2017).
MATERIAL AND METHODS
The Case Study
The case study of this research is certified SND located in the Greater Kuala
Lumpur, Malaysia (Figure 1). The certified SND theme is ‘the promise of beauty,
luxury, nature’. It is an integrated township development in the prime vicinity of
Shah Alam, within Greater Kuala Lumpur. This premium urban neighbourhood
township development comprises Commercial Centre, 2 phases of landed
neighbourhood residences and 2 phases of condominium developments. The
green township development plot spread across 60 acres of a freehold prime land.
It exudes all the luxury and exclusivity and it is also the first green township in
Malaysia that has revolutionized the land-use change of an industrial area into
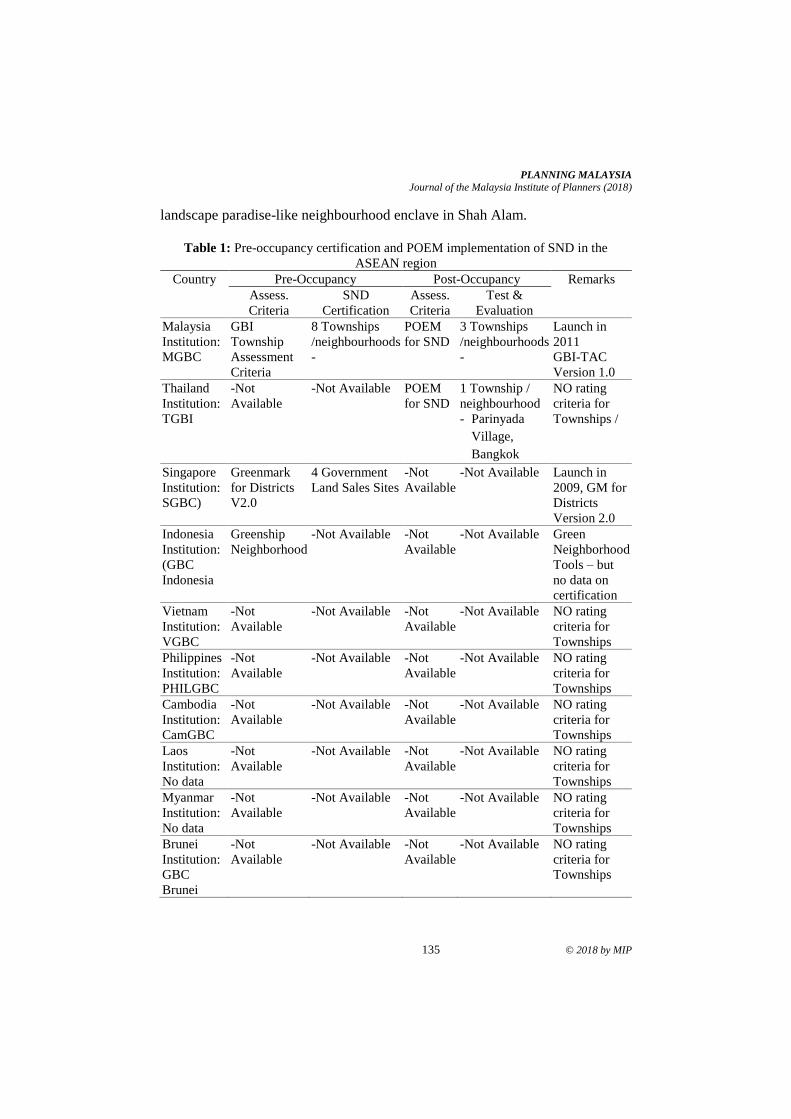
PLANNING MALAYSIA
Journal of the Malaysia Institute of Planners (2018)
135 © 2018 by MIP
landscape paradise-like neighbourhood enclave in Shah Alam.
Table 1: Pre-occupancy certification and POEM implementation of SND in the
ASEAN region
Country Pre-Occupancy Post-Occupancy Remarks
Assess.
Criteria
SND
Certification
Assess.
Criteria
Test &
Evaluation
Malaysia
Institution:
MGBC
GBI
Township
Assessment
Criteria
8 Townships
/neighbourhoods
-
POEM
for SND
3 Townships
/neighbourhoods
-
Launch in
2011
GBI-TAC
Version 1.0
Thailand
Institution:
TGBI
-Not
Available
-Not Available POEM
for SND
1 Township /
neighbourhood
- Parinyada
Village,
Bangkok
NO rating
criteria for
Townships /
Singapore
Institution:
SGBC)
Greenmark
for Districts
V2.0
4 Government
Land Sales Sites
-Not
Available
-Not Available Launch in
2009, GM for
Districts
Version 2.0
Indonesia
Institution:
(GBC
Indonesia
Greenship
Neighborhood
-Not Available -Not
Available
-Not Available Green
Neighborhood
Tools – but
no data on
certification
Vietnam
Institution:
VGBC
-Not
Available
-Not Available -Not
Available
-Not Available NO rating
criteria for
Townships
Philippines
Institution:
PHILGBC
-Not
Available
-Not Available -Not
Available
-Not Available NO rating
criteria for
Townships
Cambodia
Institution:
CamGBC
-Not
Available
-Not Available -Not
Available
-Not Available NO rating
criteria for
Townships
Laos
Institution:
No data
-Not
Available
-Not Available -Not
Available
-Not Available NO rating
criteria for
Townships
Myanmar
Institution:
No data
-Not
Available
-Not Available -Not
Available
-Not Available NO rating
criteria for
Townships
Brunei
Institution:
GBC
Brunei
-Not
Available
-Not Available -Not
Available
-Not Available NO rating
criteria for
Townships
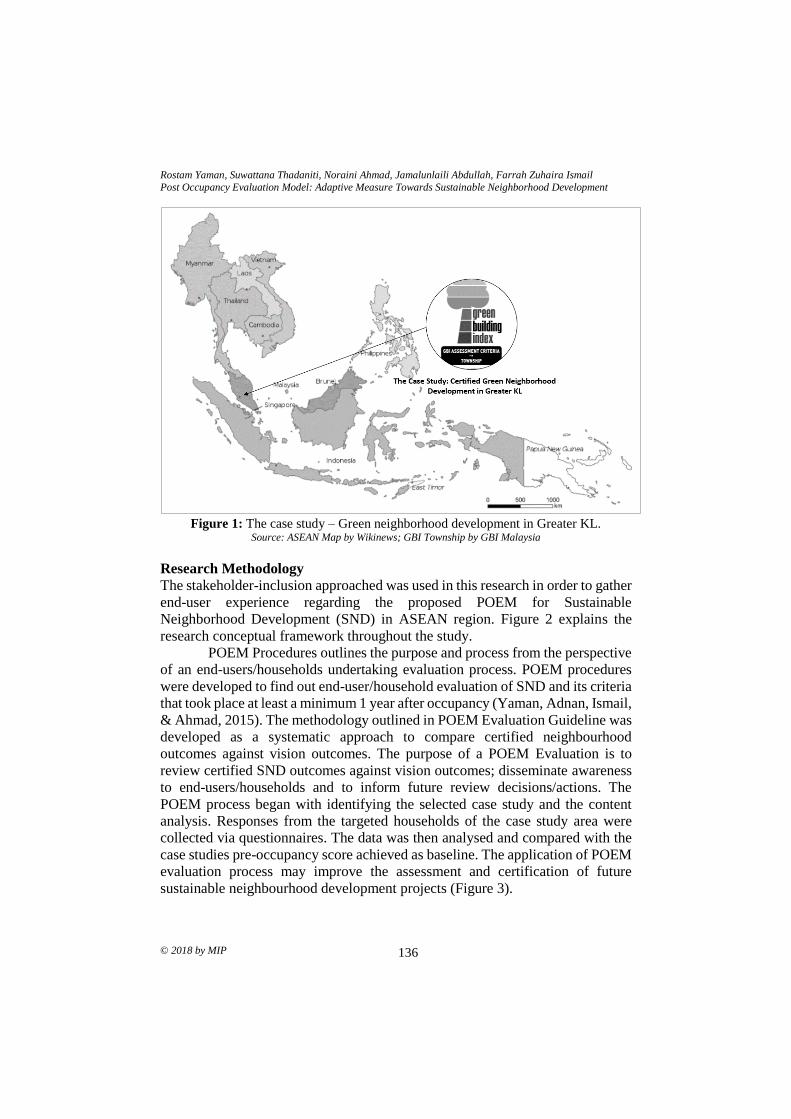
Rostam Yaman, Suwattana Thadaniti, Noraini Ahmad, Jamalunlaili Abdullah, Farrah Zuhaira Ismail
Post Occupancy Evaluation Model: Adaptive Measure Towards Sustainable Neighborhood Development
© 2018 by MIP 136
Figure 1: The case study – Green neighborhood development in Greater KL.
Source: ASEAN Map by Wikinews; GBI Township by GBI Malaysia
Research Methodology
The stakeholder-inclusion approached was used in this research in order to gather
end-user experience regarding the proposed POEM for Sustainable
Neighborhood Development (SND) in ASEAN region. Figure 2 explains the
research conceptual framework throughout the study.
POEM Procedures outlines the purpose and process from the perspective
of an end-users/households undertaking evaluation process. POEM procedures
were developed to find out end-user/household evaluation of SND and its criteria
that took place at least a minimum 1 year after occupancy (Yaman, Adnan, Ismail,
& Ahmad, 2015). The methodology outlined in POEM Evaluation Guideline was
developed as a systematic approach to compare certified neighbourhood
outcomes against vision outcomes. The purpose of a POEM Evaluation is to
review certified SND outcomes against vision outcomes; disseminate awareness
to end-users/households and to inform future review decisions/actions. The
POEM process began with identifying the selected case study and the content
analysis. Responses from the targeted households of the case study area were
collected via questionnaires. The data was then analysed and compared with the
case studies pre-occupancy score achieved as baseline. The application of POEM
evaluation process may improve the assessment and certification of future
sustainable neighbourhood development projects (Figure 3).
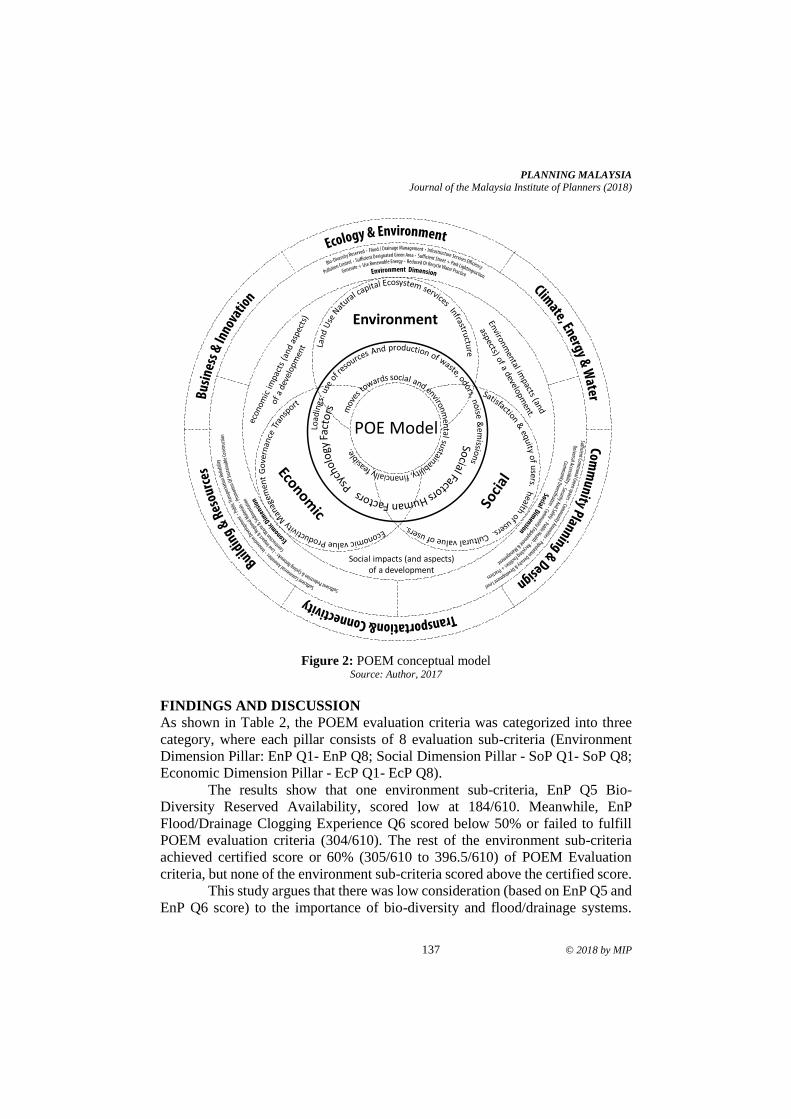
PLANNING MALAYSIA
Journal of the Malaysia Institute of Planners (2018)
137 © 2018 by MIP
Figure 2: POEM conceptual model
Source: Author, 2017
FINDINGS AND DISCUSSION
As shown in Table 2, the POEM evaluation criteria was categorized into three
category, where each pillar consists of 8 evaluation sub-criteria (Environment
Dimension Pillar: EnP Q1- EnP Q8; Social Dimension Pillar - SoP Q1- SoP Q8;
Economic Dimension Pillar - EcP Q1- EcP Q8).
The results show that one environment sub-criteria, EnP Q5 Bio-
Diversity Reserved Availability, scored low at 184/610. Meanwhile, EnP
Flood/Drainage Clogging Experience Q6 scored below 50% or failed to fulfill
POEM evaluation criteria (304/610). The rest of the environment sub-criteria
achieved certified score or 60% (305/610 to 396.5/610) of POEM Evaluation
criteria, but none of the environment sub-criteria scored above the certified score.
This study argues that there was low consideration (based on EnP Q5 and
EnP Q6 score) to the importance of bio-diversity and flood/drainage systems.
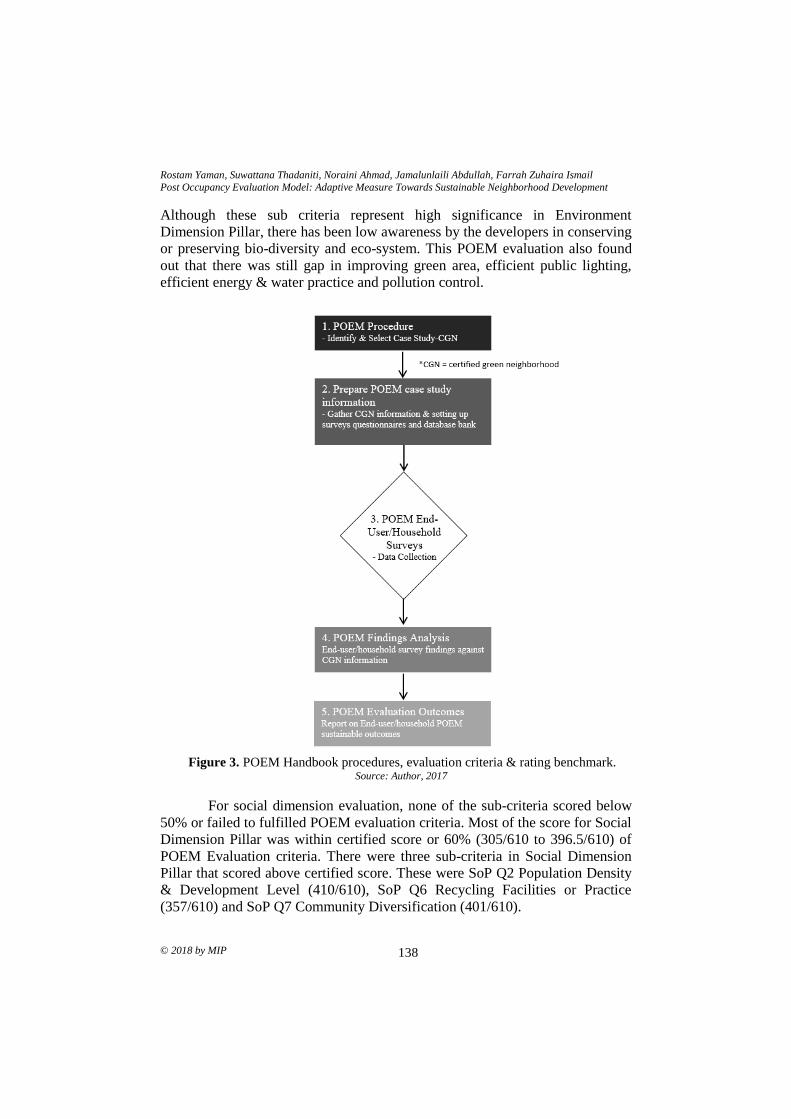
Rostam Yaman, Suwattana Thadaniti, Noraini Ahmad, Jamalunlaili Abdullah, Farrah Zuhaira Ismail
Post Occupancy Evaluation Model: Adaptive Measure Towards Sustainable Neighborhood Development
© 2018 by MIP 138
Although these sub criteria represent high significance in Environment
Dimension Pillar, there has been low awareness by the developers in conserving
or preserving bio-diversity and eco-system. This POEM evaluation also found
out that there was still gap in improving green area, efficient public lighting,
efficient energy & water practice and pollution control.
Figure 3. POEM Handbook procedures, evaluation criteria & rating benchmark.
Source: Author, 2017
For social dimension evaluation, none of the sub-criteria scored below
50% or failed to fulfilled POEM evaluation criteria. Most of the score for Social
Dimension Pillar was within certified score or 60% (305/610 to 396.5/610) of
POEM Evaluation criteria. There were three sub-criteria in Social Dimension
Pillar that scored above certified score. These were SoP Q2 Population Density
& Development Level (410/610), SoP Q6 Recycling Facilities or Practice
(357/610) and SoP Q7 Community Diversification (401/610).
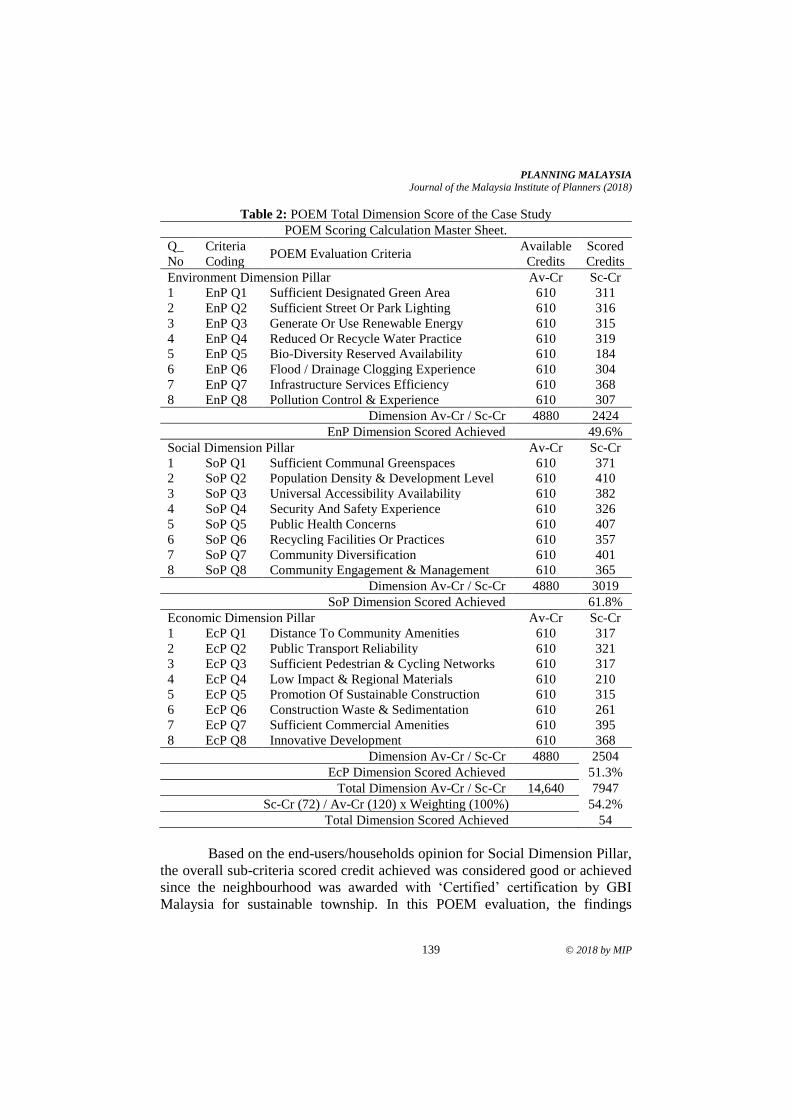
PLANNING MALAYSIA
Journal of the Malaysia Institute of Planners (2018)
139 © 2018 by MIP
Table 2: POEM Total Dimension Score of the Case Study
POEM Scoring Calculation Master Sheet.
Q_
No
Criteria
Coding POEM Evaluation Criteria
Available
Credits
Scored
Credits
Environment Dimension Pillar Av-Cr Sc-Cr
1 EnP Q1 Sufficient Designated Green Area 610 311
2 EnP Q2 Sufficient Street Or Park Lighting 610 316
3 EnP Q3 Generate Or Use Renewable Energy 610 315
4 EnP Q4 Reduced Or Recycle Water Practice 610 319
5 EnP Q5 Bio-Diversity Reserved Availability 610 184
6 EnP Q6 Flood / Drainage Clogging Experience 610 304
7 EnP Q7 Infrastructure Services Efficiency 610 368
8 EnP Q8 Pollution Control & Experience 610 307
Dimension Av-Cr / Sc-Cr 4880 2424
EnP Dimension Scored Achieved 49.6%
Social Dimension Pillar Av-Cr Sc-Cr
1 SoP Q1 Sufficient Communal Greenspaces 610 371
2 SoP Q2 Population Density & Development Level 610 410
3 SoP Q3 Universal Accessibility Availability 610 382
4 SoP Q4 Security And Safety Experience 610 326
5 SoP Q5 Public Health Concerns 610 407
6 SoP Q6 Recycling Facilities Or Practices 610 357
7 SoP Q7 Community Diversification 610 401
8 SoP Q8 Community Engagement & Management 610 365
Dimension Av-Cr / Sc-Cr 4880 3019
SoP Dimension Scored Achieved 61.8%
Economic Dimension Pillar Av-Cr Sc-Cr
1 EcP Q1 Distance To Community Amenities 610 317
2 EcP Q2 Public Transport Reliability 610 321
3 EcP Q3 Sufficient Pedestrian & Cycling Networks 610 317
4 EcP Q4 Low Impact & Regional Materials 610 210
5 EcP Q5 Promotion Of Sustainable Construction 610 315
6 EcP Q6 Construction Waste & Sedimentation 610 261
7 EcP Q7 Sufficient Commercial Amenities 610 395
8 EcP Q8 Innovative Development 610 368
Dimension Av-Cr / Sc-Cr 4880 2504
EcP Dimension Scored Achieved 51.3%
Total Dimension Av-Cr / Sc-Cr 14,640 7947
Sc-Cr (72) / Av-Cr (120) x Weighting (100%) 54.2%
Total Dimension Scored Achieved 54
Based on the end-users/households opinion for Social Dimension Pillar,
the overall sub-criteria scored credit achieved was considered good or achieved
since the neighbourhood was awarded with ‘Certified’ certification by GBI
Malaysia for sustainable township. In this POEM evaluation, the findings
Rostam Yaman, Suwattana Thadaniti, Noraini Ahmad, Jamalunlaili Abdullah, Farrah Zuhaira Ismail
Post Occupancy Evaluation Model: Adaptive Measure Towards Sustainable Neighborhood Development
© 2018 by MIP 140
suggested that improvement can still be made on security and safety of the
neighbourhood (based on SoP Q4 lowest score). Additionally, the score of SoP
Q6 also suggests that this certified neighbourhood may need a bit more extra
effort in improving recycling facilities and practices by the community of the
neighbourhood.
Regarding the economic dimension aspects, majority POEM evaluation
criteria fulfilled the certified score or 60% (305/610 to 396.5/610) except two.
None of evaluation sub-criteria in Economic Dimension Pillar was above the
certified score. The two sub-criteria that scored below 50% (below 305/610) or
failed to fulfilled POEM evaluation criteria were EcP Q4 Low Impact & Regional
Materials (256/610) and EcP Q6 Construction waste & Sedimentation (261/610).
Based on the POEM evaluation, the overall economic dimension sub-
criteria scored credit achieved was considered ‘achieved’. The exception was EcP
Q4 where this criteria was below ‘Certified’ score, suggesting lacking in
optimizing low impact and regional materials in this certified sustainable.
Similarly, EcP Q6 score suggests lacking in effort in Construction Waste &
Sedimentation. The practical features of ‘Australian’ louvered windows which
allow controllable continuous air flow cross the internal space mentioned in this
Neighborhood Pre-Occupancy Sustainable features is the example of out-bound
or non-regional materials which was used in this development. Other measures
that can be stressed in promoting sustainable economic dimension are further
considerations on sustainable transportation & connectivity; and sustainable
materials & resources. More efforts can be further highlighted in transportation
& connectivity by improving pedestrian and cycling networks and more
awareness on materials and resources by promoting construction waste
management & sustainable construction.
The overall POEM findings, for this case study was rated as ‘Certified’
where the total POEM score was 54, the overall dimensions scored credit
achieved was considered ‘low achieved’ since this neighbourhood was also
awarded with ‘Certified’ (50-65 score achieved) certification by GBI Malaysia
for sustainable township. This indicates that this case study’s post-occupancy
score is similar to what it has achieved during planning and completion or during
pre-occupancy assessments.
CONCLUSION POEM evaluation on-site testing of the certified sustainable neighbourhood case
study have presented diverse narratives of how sustainable urban neighbourhood
/ township development has been developed in the Greater KL in the last half
decades. The results derived from the previous on-site study pointed out that the
selected certified SND have resulted in a rather lower dimension score achieved
in post-occupancy evaluation based on end-users/households opinion compared
to pre-occupancy evaluation criteria during planning assessment or completion
PLANNING MALAYSIA
Journal of the Malaysia Institute of Planners (2018)
141 © 2018 by MIP
and verification assessment of SND. The obtained results have established that
the certified SND has been evaluated with an adaptation gap and recognition of
the three dimensions of the proposed POEM that include different SDP aspects.
The difference in score between post- and pre-occupancy evaluation was due to
design and planning envisaged functionality were slightly dissimilar from end-
users/households perception on the occupied space.
The findings indicate that a comprehensive Stakeholder-Inclusion
Approach method in developing POEM for SND (Figure 2), supported by key
issues of SDP understanding in sustainability neighbourhood development and
guided by clear and comprehensive POEM procedures, can oversee and foster the
SND and its communities towards an enhanced, balanced and holistic
sustainability in the Greater KL. The results generated in this study have verified
that the function and significance of post-occupancy evaluation has become as
one of the important issues that should be taken into consideration by the related
institutions or authorities in charge for the urban development and community
well-being in the urban area. Pre-occupancy sustainable assessment may lay the
foundation for the vision of sustainable goals but the sustainable post-occupancy
evaluation is the actual measure in rating the sustainability level as it is based on
the actual physical built environment instead of on drawings on papers, the actors
are real as it engaged all related stakeholders instead of projected statistical
numbers of occupants, and finally it also considers the local context of culture,
customs and religions.
Thus, this study claims that the adoption and implementation of POEM
for SND in the Greater KL will facilitate efforts to enhance the sustainability of
current and future urban neighbourhood development by delivering a clear
interpretation of the present sustainable dimension of post-occupied development
and providing insights towards the forthcoming progression in order to achieve
the sustainable urban growth of Klang Valley/Greater KL. There is no doubt that
pre-occupancy sustainable assessment criteria is necessary and served its
purposes in sustainable urban development. However, the intent of POEM for
SND is to further facilitate the continuation and improvement in sustainable urban
development be it at individual, community, neighbourhood or township level, it
is for betterment in sustainable agenda as whole.
ACKNOWLEDGEMENT
The author would like to acknowledge EDS, Chulalongkorn University, KAED,
International Islamic University Malaysia and FSPU, Universiti Teknologi Mara
for providing research platform and research grant.
Rostam Yaman, Suwattana Thadaniti, Noraini Ahmad, Jamalunlaili Abdullah, Farrah Zuhaira Ismail
Post Occupancy Evaluation Model: Adaptive Measure Towards Sustainable Neighborhood Development
© 2018 by MIP 142
REFERENCES
Aghaabbasi, M., Moeinaddini, M., Shah, M. Z., & Asadi-Shekari, Z. (2017). A new
assessment model to evaluate the microscale sidewalk design factors at the
neighbourhood level. Journal of Transport & Health, 5, 97-112.
Dahiya, B. (2014). Southeast Asia and sustainable urbanization. Global Asia, 9(3), 84-
91.
Dahiya, B. (2016). ASEAN economic integration and sustainable urbanization. Journal
of Urban Culture Research, 13(1), 8-15.
Davis, S. M. (2016). Rising temperatures, rising stakes: The role of international policy
negotiations in the climate crisis (Student thesis). Fordham University, New
York, USA.
Haase, D., Kabisch, S., Haase, A., Andersson, E., Banzhaf, E., Baró, F., ... & Krellenberg,
K. (2017). Greening cities–To be socially inclusive? About the alleged paradox
of society and ecology in cities. Habitat International, 64, 41-48.
Ho, C. S., Matsuoka, Y., Simson, J., & Gomi, K. (2013). Low carbon urban development
strategy in Malaysia–The case of Iskandar Malaysia development
corridor. Habitat International, 37, 43-51.
McGill, G., Oyedele, L. O., McAllister, K., & Qin, M. (2016). Effective indoor air quality
for energy-efficient homes: A comparison of UK rating systems. Architectural
Science Review, 59(2), 159-173.
Palmqvist, T. (2015). An assessment of sustainable development work in Swedish
municipalities (Master thesis). Uppsala University, Sweden.
Peters, T. (2016). Social sustainability in context: Rediscovering Ingrid Gehl's Bo-
miljø. Architectural Research Quarterly, 20(4), 371-380.
Rauland, V., & Newman, P. (2015). Decarbonising cities: Mainstreaming low carbon
urban development. New York: Springer.
Yaman, R., Adnan, H., Ismail, F. Z., & Ahmad, N. (2015). Sustainable management (SM)
guide in GBI interiors design project tools. ARPN Journal of Engineering and
Applied Sciences, 10(10), 4498-4507.
Yaman, R., Thadaniti, S., Suntornvongsagul, K., Adnan, H., & Ahmad, N. (2017). Post
occupancy evaluation for sustainable neighborhood development. Advanced
Science Letters, 23(4), 3128-3131.
Yaman, R. (2016). A post occupancy evaluation model for sustainable urban
neighborhood assessment in Malaysia (Doctorate dissertation). Chulalongkorn
University, Thailand.
1Lecturer at Universiti Teknologi MARA, Malaysia. Email: [email protected] 143
PLANNING MALAYSIA:
Journal of the Malaysian Institute of Planners
VOLUME 16 ISSUE 3 (2018) Page 143 – 155
TEMPORARY PLANNING PERMISSION IN DEVELOPMENT
CONTROL SYSTEM FOR URBAN DEVELOPMENT
Mohammad Yusup1, Ahmad Fuzi Arshad2, Marlyana Azyyati Marzukhi3,
& Yusfida Ayu Abdullah4
1,2,3,4Faculty of Architecture, Planning and Surveying
UNIVERSITI TEKNOLOGI MARA, MALAYSIA
Abstract
Planning permission is prerequisite in development control process as it acts as
one of the most significant and effective factors that determine the quality built
environment and physical planning. This paper focuses on the temporary
planning permission, which is a short-term approval and is only permissible for
temporary use of land and buildings. The potential advantages of temporary
planning permission have yet to be explored by the planning authorities in
Malaysia. This study is aimed at exploring the implementation of the planning
permission delivery process in controlling the development of land and building
on a temporary basis. Thus, the objectives are intended to examine the process
and procedure of temporary planning permission for urban development in
relation to Act 172, to ascertain the role and function of the local planning
authority, and reviewing the provision of law related to the temporary planning
permission as in the Act 172. Comparative analysis between Act 172 (West
Malaysia), Planning Act (Cap. 232) (Singapore) and Town and Country Planning
Act 1990 (UK) in terms of decision making process has been made to explore the
best practices in temporary planning permission. This study is anticipated to
enhance the temporary planning permission delivery process and the
development control system in Peninsular Malaysia.
Keywords: development control system, local planning authority, planning law,
temporary planning permission, urban development, urban governance
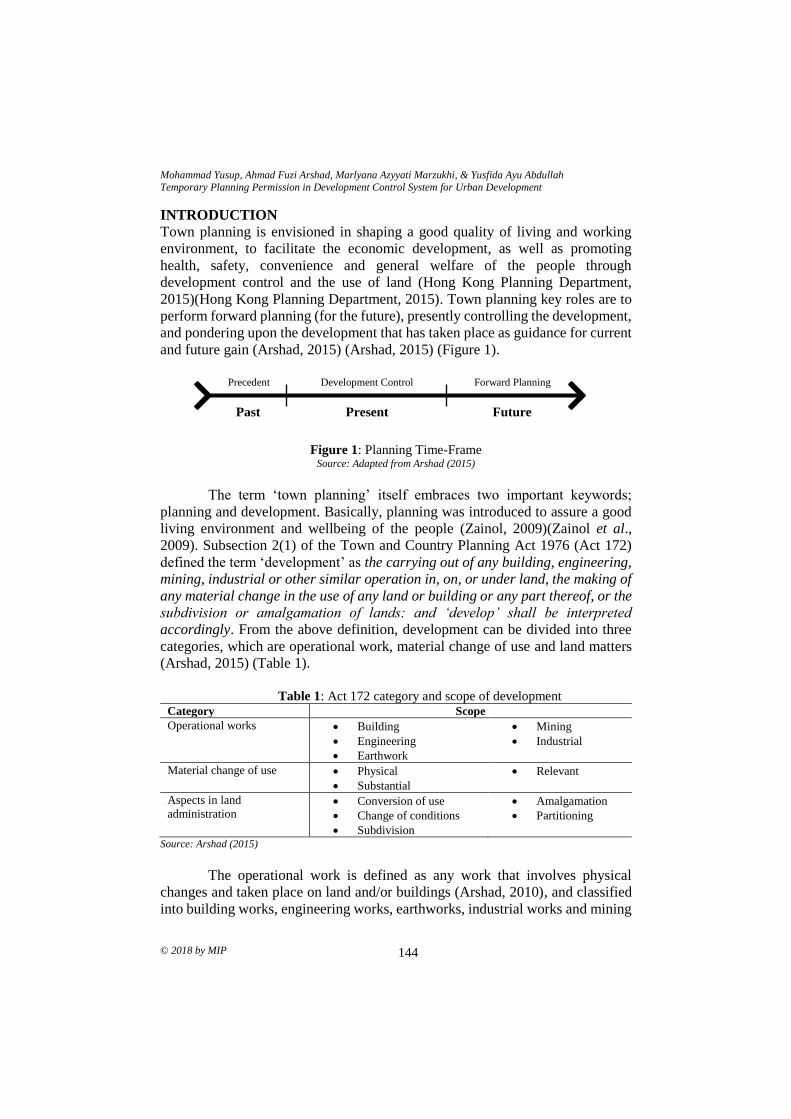
Mohammad Yusup, Ahmad Fuzi Arshad, Marlyana Azyyati Marzukhi, & Yusfida Ayu Abdullah
Temporary Planning Permission in Development Control System for Urban Development
© 2018 by MIP 144
INTRODUCTION
Town planning is envisioned in shaping a good quality of living and working
environment, to facilitate the economic development, as well as promoting
health, safety, convenience and general welfare of the people through
development control and the use of land (Hong Kong Planning Department,
2015)(Hong Kong Planning Department, 2015). Town planning key roles are to
perform forward planning (for the future), presently controlling the development,
and pondering upon the development that has taken place as guidance for current
and future gain (Arshad, 2015) (Arshad, 2015) (Figure 1).
Figure 1: Planning Time-Frame
Source: Adapted from Arshad (2015)
The term ‘town planning’ itself embraces two important keywords;
planning and development. Basically, planning was introduced to assure a good
living environment and wellbeing of the people (Zainol, 2009)(Zainol et al.,
2009). Subsection 2(1) of the Town and Country Planning Act 1976 (Act 172)
defined the term ‘development’ as the carrying out of any building, engineering,
mining, industrial or other similar operation in, on, or under land, the making of
any material change in the use of any land or building or any part thereof, or the
subdivision or amalgamation of lands: and ‘develop’ shall be interpreted
accordingly. From the above definition, development can be divided into three
categories, which are operational work, material change of use and land matters
(Arshad, 2015) (Table 1).
Table 1: Act 172 category and scope of development
Category Scope
Operational works • Building
• Engineering
• Earthwork
• Mining
• Industrial
Material change of use • Physical
• Substantial
• Relevant
Aspects in land
administration • Conversion of use
• Change of conditions
• Subdivision
• Amalgamation
• Partitioning
Source: Arshad (2015)
The operational work is defined as any work that involves physical
changes and taken place on land and/or buildings (Arshad, 2010), and classified
into building works, engineering works, earthworks, industrial works and mining
Past Future
Development Control
Present
Precedent Forward Planning
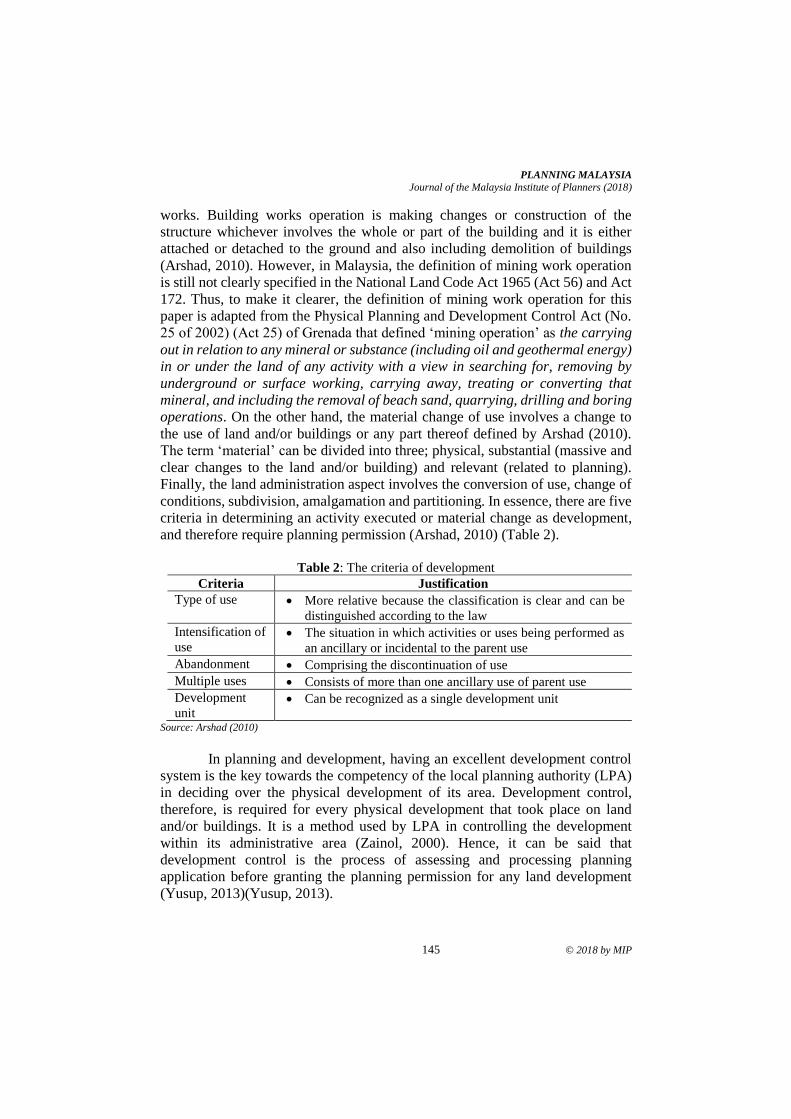
PLANNING MALAYSIA
Journal of the Malaysia Institute of Planners (2018)
145 © 2018 by MIP
works. Building works operation is making changes or construction of the
structure whichever involves the whole or part of the building and it is either
attached or detached to the ground and also including demolition of buildings
(Arshad, 2010). However, in Malaysia, the definition of mining work operation
is still not clearly specified in the National Land Code Act 1965 (Act 56) and Act
172. Thus, to make it clearer, the definition of mining work operation for this
paper is adapted from the Physical Planning and Development Control Act (No.
25 of 2002) (Act 25) of Grenada that defined ‘mining operation’ as the carrying
out in relation to any mineral or substance (including oil and geothermal energy)
in or under the land of any activity with a view in searching for, removing by
underground or surface working, carrying away, treating or converting that
mineral, and including the removal of beach sand, quarrying, drilling and boring
operations. On the other hand, the material change of use involves a change to
the use of land and/or buildings or any part thereof defined by Arshad (2010).
The term ‘material’ can be divided into three; physical, substantial (massive and
clear changes to the land and/or building) and relevant (related to planning).
Finally, the land administration aspect involves the conversion of use, change of
conditions, subdivision, amalgamation and partitioning. In essence, there are five
criteria in determining an activity executed or material change as development,
and therefore require planning permission (Arshad, 2010) (Table 2).
Table 2: The criteria of development
Criteria Justification
Type of use
• More relative because the classification is clear and can be
distinguished according to the law
Intensification of
use • The situation in which activities or uses being performed as
an ancillary or incidental to the parent use
Abandonment • Comprising the discontinuation of use
Multiple uses • Consists of more than one ancillary use of parent use
Development
unit • Can be recognized as a single development unit
Source: Arshad (2010)
In planning and development, having an excellent development control
system is the key towards the competency of the local planning authority (LPA)
in deciding over the physical development of its area. Development control,
therefore, is required for every physical development that took place on land
and/or buildings. It is a method used by LPA in controlling the development
within its administrative area (Zainol, 2000). Hence, it can be said that
development control is the process of assessing and processing planning
application before granting the planning permission for any land development
(Yusup, 2013)(Yusup, 2013).
Mohammad Yusup, Ahmad Fuzi Arshad, Marlyana Azyyati Marzukhi, & Yusfida Ayu Abdullah
Temporary Planning Permission in Development Control System for Urban Development
© 2018 by MIP 146
Planning permission, according to Subsection 2(1) of Act 172, is
expressed as permission granted, either with or without conditions applied, to
carry out development. It is a legal document issued by the LPA of the area, which
allows specific development at a particular site (Leicester City Council,
2015)(Leicester City Council, 2015).
DEVELOPMENT CONTROL: THE INSTRUMENTATION IN
DECISION-MAKING PROCESS
The development control approach consists of two main mechanisms, namely
statutory and non-statutory planning instruments (Arshad, 2010). The statutory
development control mechanisms are formed by the legal provisions and the
approval procedures by the authority of the respective areas. It is the gazetted and
approved documents according to the legal procedure and usually prepared by
systematic procedure and approval period. However, the non-statutory
development control mechanisms are the non-gazetted documents exercised for
the purpose of the planning and development control. This type of development
control mechanism helps in supporting the statutory development control
mechanism and facilitates the implementation of development control functions
by LPA. This shows that development control can be in various forms of
approaches and the main aim is to control the development of land and buildings.
PLANNING PERMISSION: WHY IS IT NECESSARY?
The requirement for planning permission by the Act 172 is spelt out under Section
18 to Section 31A of Part IV - Planning Control. Planning permission can be seen
as the process in allowing any activity to take place on land and buildings or to
permit any change on the use of land and buildings (Arshad, 2015). The planning
permission is indeed necessary so as to control proper development of land and
buildings and to implement the proposals of the development plan accordingly.
LPA Roles in Planning Permission Process
The local authority is the lowest level of the government administration system
and this position allows them to regulate and monitor the development process
within their respective territory (Yusup, 2013)(Yusup, 2013). Subsection 5(1) of
Act 172 affirms that every local authority shall act as the LPA within their
administrative area. While, any other area that is not under the jurisdiction of the
local authority, Section 5(2) of the same Act provides the legislative power to the
State Director as the LPA of the area and perform such functions as the LPA as
stipulated in Section 6(1) of Act 172. These include to regulate, control and plan
for the development and the use of all land and buildings within their respective
administrative area. Moreover, LPA also carried out functions like undertaking,
assisting in, and encourage the collection, maintenance, and publication of
statistics, bulletins, and monographs, and other publications relating to town and
PLANNING MALAYSIA
Journal of the Malaysia Institute of Planners (2018)
147 © 2018 by MIP
country planning and its methodology. The LPA also perform such other
functions as assigned by the State Authority or the State Planning Committee
from time to time as well as functions specified in Section 6(2).
Section 4(4) (aa) of Act 172 also points out that the SPC is also
responsible in regulating, controlling, plans and organises all development
activities within the state administrative area. Thus, the role of local authority as
LPA is shared or duplicated with the SPC with regard to development control
matters. In addition, Section 22(2A) of the same Act states that SPC may request
advice from the National Physical Planning Council (NPPC) regarding certain
types of development whose planning application are submitted to LPA.
The Planning Permission Process and Procedure
Figure 2 shows planning permission process and procedure as stipulated in Act
172. In short, any new proposed development, either permanent or temporary,
must conform to the existing development plan of the area. Irrespective whether
or not the plan has been gazette, planning applications must refer to the said
development plan. However, the period when development plan has yet to be
gazette tend to put the LPA in a dilemma when it comes to deciding on planning
applications. The question is how to decide on the planning application at this
period of time?
There are several ways in enhancing the decision-making process that
can be performed by the LPA which include through the issuance of temporary
planning permission (TPP) especially for a short-term time-based development
of land and building that may not give obvious impact towards its physical, social
and economic aspects of the surrounding area. Alternatively, LPA development
control system could adapt to use a non-statutory approach or informal method
by creating procedures to formalise the non-statutory or informal instruments
such as applying elements of participation, consultations with professional
agencies and adoption by the councils.
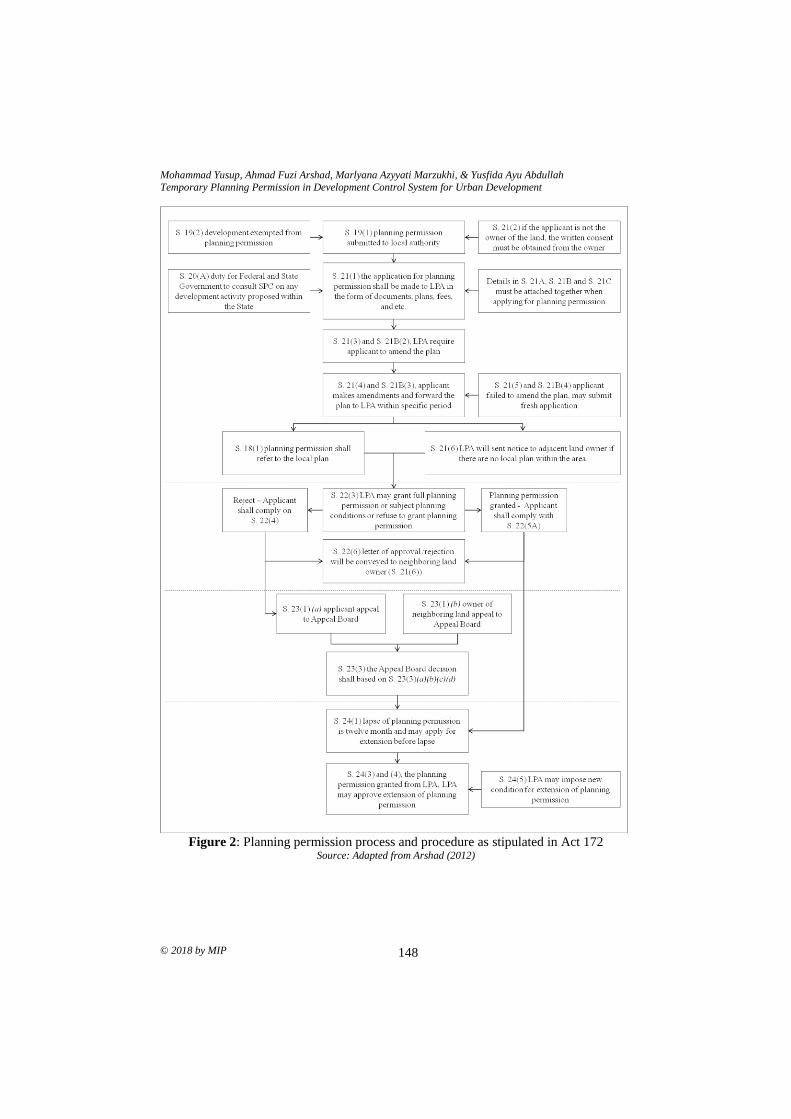
Mohammad Yusup, Ahmad Fuzi Arshad, Marlyana Azyyati Marzukhi, & Yusfida Ayu Abdullah
Temporary Planning Permission in Development Control System for Urban Development
© 2018 by MIP 148
Figure 2: Planning permission process and procedure as stipulated in Act 172
Source: Adapted from Arshad (2012)
PLANNING MALAYSIA
Journal of the Malaysia Institute of Planners (2018)
149 © 2018 by MIP
TEMPORARY PLANNING PERMISSION (TPP) AND ITS PROVISION
IN ACT 172
The temporary planning permission (TPP) is basically a short-term, time-based
planning permission, which can be extended or revoked by the LPA at any time
which the LPA thinks necessary for the protection of public interest in the area
(Arshad, 2015). Usually, the TPP period can be up to a maximum of five years.
The approval for this type of planning permission is granted by the LPA for a
fixed time period on which it will expire based on the stipulated planning
conditions (Arshad, 2015). The LPA may grant the TPP due to the proposed
structure or the use of land and/or building is impermanent and the LPA might
also remove the structure or stop the use of land and/or buildings when it is no
longer necessary(Magrath Insight, 2012). Additionally, the LPA can also grant
the TPP if they are uncertain regarding the impact of the use of land and/or
building and intended to give the development a ‘trial run’(Magrath Insight,
2012). As an example, coastal reclamation can be considered as a ‘new land’.
After the reclamation has taken place, the area should not straight away be
developed with permanent development as the land is still unstable and takes time
to be stabilised. Therefore, during that period, the LPA can propose or grant any
temporary development on the land as a ‘trial run’ to see the impact and effect in
carrying out development on the land. This ’trial run’ also can be an effective
way to see the strength, weakness, opportunity and threat of the area in order to
plan for a long-term future development.
There are various areas of development or categories of land use and
building use that TPP can be applied such as commercial (kiosk, car showroom),
industrial (futsal arena), agriculture, residential, recreational, public facilities,
public infrastructure (telecommunication tower), utilities, amenities and
archaeological site based on its suitability with the requirement where the TPP
can be granted. The practical used for the TPP can only apply for development
that categorises in the operational works and material change of use (Arshad,
2015).
After independence from British in 1957, Malaysia has opted to adopt
the British planning system as primary guidance to develop the nation. There are
similarities pertaining to three main aspects of planning system (planning
authority, development plan system and development control system) between
Malaysia (Town and Country Planning Act 1976) and United Kingdom (Town
and Country Planning Act 1990). In United Kingdom, approval of local
development order is made by the local authority as stipulated under section 61A
of Town and Country Planning Act 1990. Before local authorities granted
approval for a development order, the applicants are responsible to carry out pre-
application consultation according to section 61W of Town and Country Planning
Act 1990. Temporary development order in United Kingdom is to allow
flexibility in granting the development order to cope with the complexity of the
Mohammad Yusup, Ahmad Fuzi Arshad, Marlyana Azyyati Marzukhi, & Yusfida Ayu Abdullah
Temporary Planning Permission in Development Control System for Urban Development
© 2018 by MIP 150
development without neglecting the needs of having a conducive decision-
making process in planning approval.
The Process of Obtaining Temporary Planning Permission
The process of obtaining the TPP is basically similar to the normal planning
permission as in Figure 2 and follows the planning control process under Part IV
of Act 172 and other related provisions. The only difference between TPP and
normal planning permission are the time and scale of the development that should
be allowed by LPA. Even though the TPP is just for a small scale, short-term
development, the planning permission for this type of development must abide
the same process including giving notice to adjacent landowners, planning
appeal, development charge, revocation of planning approval, and planning
enforcement. Yet, there is no extensive provision for the TPP mention in Act 172
except in Section 22(5). Further explanation will be described below.
Provision to Use Temporary Planning Permission Based on Act 172
The TPP has no extensive provision stipulated in Act 172 aside from Section
22(5) on the use of planning conditions, which states that planning permission
granted on the use of land or building for a limited time and the use of such land
and building will be reverted to its original use after the period expires. This is to
ensure that the development of such land will be in accordance with the approved
layout plan. As so, it is prohibited to carry out any development that may destruct
land and environment in terms of physical, natural topography and landscape.
The development should be sympathetic and integrated with surrounding
architecture. Section 22(6) states that the copy of planning approval must be
served to the persons that make objections to the proposed development
according to Section 21(6) of Act 172.
Requirements in Submitting Applications for Temporary Planning Permission
The requirements for TPP submission shall be as mentioned in Section 21 of Act
172:
• Layout plans, building plan, elevations, perspectives and etc.
• Planning proposal reports, environmental and social impact assessment
• Internal and external technical departments feed-back
• Supporting letters, power of attorney and documents
• Public and neighbouring landowner objections (Subsection 21(6))
• Processing fees for planning submission
Appeal on the Planning Decision Based on Act 172
The rights for planning appeal as in Section 23 is provided to the statutory person
to forward an appeal to the Appeal Board, which are either the applicant of the
planning permission or the rightful person that make objections under Section
PLANNING MALAYSIA
Journal of the Malaysia Institute of Planners (2018)
151 © 2018 by MIP
21(6) who are upset by the decision or the condition imposed by the LPA. The
Appeal Board shall hear the appellant and the LPA regarding the appeal and make
a decision. The Appeal Board shall make decisions either by accepting the LPA
decision and reject the appeal; allow the appeal and request of the LPA to grant
approval or comply with conditions decided by the Appeal Board; allow the
appeal and revoke the planning approval; allow the appeal and request the LPA
to delete or amend the planning conditions or replace with conditions set by the
Appeal Board.
Revocation of Planning Approval
The revocation or modification of the planning permission and approval by LPA
usually being executed based on reason of public interest such as infrastructure
development (highway, railway, etc.), which benefitted the public more than the
individual or a small group of interest. The process of revocation is specified in
Section 25(1) to Section 25(8) of Act 172. In overall process of revocation or
modification, Section 25(9) states that any person that is upset by the amount of
any reimbursement or compensation offered or paid, the respective person can
appeal to the Appeal Board and the Board is responsible to assess the amount that
shall be paid.
Requisition Notice
Requisition notice can be issued by the LPA or the owner of the land as in Section
30 of Act 172, based on the relevancy of the purpose of the requisition notice
presented. Still, a person that aggrieved by the requisition notice submitted, with
manners, shall appeal to the Appeal Board and then the process will go through
as in Subsection 30(3) to Subsection 30(8) of Act 172.
Planning Offences
The categories of planning offences are highlighted in Section 26 to Section 29
of Act 172. The offences include development that is not in accordance with the
local plan of the area, development being carried out without obtaining planning
approval from the respective LPA of the area beforehand, development
undertaken is not in accordance to the planning approval, carrying out
development with approval being revoked, and development undertaken does not
comply with the amended approval.
Decision-Making in Granting Temporary Planning Permission in Act 172,
Planning Act (Cap. 232) and Town and Country Planning Act 1990
Section 22 of Act 172 provides on the treatment of applications. The LPA shall
grant the planning permission within the capacity for its local authority area.
However, in certain situation, the LPA needs to seek advice from the SPC and
the NPPC regarding the application submitted, before granting or rejecting the
Mohammad Yusup, Ahmad Fuzi Arshad, Marlyana Azyyati Marzukhi, & Yusfida Ayu Abdullah
Temporary Planning Permission in Development Control System for Urban Development
© 2018 by MIP 152
application. The approval must be in accordance with the local plan of the area
and if the proposed development is located in the area that has no local plan, the
LPA shall notice the owners of the neighbouring land regarding the proposed
development and the owners has the right to object, thus Section 21(7) applied.
In addition, certain planning application may require following procedures
according to Section 22(2), (2A) and (2B) together with the specified planning
conditions as in Section 22(3) to Section 22(6).
In Singapore, the decision in granting the TPP falls under the jurisdiction
‘competent authority’, with the TPP provisions are set out in Part III:
Development and Subdivision of Land of the Planning Act (Cap. 232). For the
UK, it is the LPA who is responsible in granting TPP in accordance to the
provisions under the provisions of Part III: Control Over Development of the
Town and Country Planning Act 1990.
Instruments Use to Grant Temporary Planning Permission
There are several instruments that can be used as medium and guidance in
granting TPP. These include the existing policies and local plan of the area,
compliance to planning standard, use class order (land and building), notice to
adjacent landowners as pointed out in Section 21(6) of Act 172 (if applicable)
and informal discussion by the LPA related to the planning application submitted.
Similarly, numerous instruments can be used under Planning Act (Cap.
232) to facilitate the process of TPP including obligation toward the provision in
Master Plan and temporary levy as stipulated under Section 40(A). This section
explains the needs of applicant to pay to the competent authority a tax known as
temporary levy in respect of every development of land authorised by any
planning permission or conservation granted for a specified period of 10 years or
less.
In the UK, according to the Town and Country Planning (General
Permitted Development) (England) Order 2015, Schedule 2, Part 4 Class D,
“development consisting of a change of use of a building and any land within its
curtilage; (a) from - (i) a use falling within Class A1 (shops), Class A2 (financial
and professional services), Class A3 (restaurants and cafes), Class A4 (drinking
establishment), Class A5 (hot food takeaways), Class B1 (business), Class D1
(non-residential institutions) and Class D2 (assembly and leisure) of the Schedule
to the Use Classes Order, or , (ii) a use as a betting office or payday loan shop; -
(b) to a flexible use falling within Class A1 (shops), Class A2 (financial and
professional services), Class A3 (restaurants and cafes) or Class B1 (business) of
that Schedule. A temporary development order may be granted for a single
continuous period of up to two (2) years beginning from the date the building and
any land within its curtilage began to be used for the flexible use on the date given
in the notice under paragraph D.2(a), whichever is earlier.
PLANNING MALAYSIA
Journal of the Malaysia Institute of Planners (2018)
153 © 2018 by MIP
Measures to Grant Temporary Planning Permission
In granting TPP for any development of land and buildings, there are numerous
aspects that need to be taken into consideration. Even though the TPP is just a
short-term time-based development approval, it could have the possibility to
affect the surrounding areas at an unpredictable time. There are possibilities of
impact on planning standard and guidelines, existing and planned land use, local
economy, the general public and socio-cultural, existing buildings, roads and
traffic system, ecosystem and infrastructure and amenities.
According to Planning Act (Cap. 232), power to make rules relating to
temporary development levy is provided under section 40D. The minister may
make rules and for any matter which is required under this part to be prescribed
and, in particular, for or with respect to all any of the following matters, including;
(i) rates and methods of calculation; (ii) exemption of any particular development
or class of developments from being subject of any temporary development levy;
(iii) deferment of liability to pay any temporary development levy; and (iv) the
refund, wholly or in part, of the temporary development levy paid by any person.
This practice allows balance of power amongst the government authorities in the
process of development control. Strict rules and regulations are needed to avoid
any possible misconduct by both authority and the applicant in order to ensure
effective planning control in Singapore.
Pre-consultation as in section 61W in Town and Country Planning Act
1990 requires the application to be informed to relevant stakeholders to ensure
thorough process in issuance of TPP. Additionally, section 62 further strengthens
the power of LPA as responsible authority in facilitating the whole TPP process.
This section elaborates the need of applicant to obligate towards the rules and
regulations made by the LPA as part of stringent decision making process.
Determination of Time Limit of Temporary Planning Permission
Normally, the granting of TPP is based on the circumstances and considerations
including existing planning policy, nature of the development activity based on
time-frame, stipulated planning condition, a breach of the building use and the
planning enforcement. Whereas, determination of time limit of the TPP is based
on considerations such as the reversion to its original use, revocation of planning
approval and the extension of planning approval (LPA may impose new planning
condition and fees). For instance, Subang Jaya Municipal Council (MPSJ)
imposed a maximum three-year limit for each TPP it approved. The decisions
were made based on case-to-case basis and LPA has full jurisdiction over the
decision on granting the planning approval subject to compliance to the rules and
regulations made by the LPA.
The limit for TPP in Singapore is 10 years. Section 40C explain the
meaning of temporary planning permission as “a planning permission or
conservation permission granted for a specified period of 10 years or less”. Also,
Mohammad Yusup, Ahmad Fuzi Arshad, Marlyana Azyyati Marzukhi, & Yusfida Ayu Abdullah
Temporary Planning Permission in Development Control System for Urban Development
© 2018 by MIP 154
the Minister may, in his discretion and subject to such terms and conditions as he
may determine, remit, wholly or in part, the temporary development levy payable
by any person if he is satisfied that it is just and equitable to do so.
Use of Planning Conditions
The use of comprehensive planning conditions by LPA is important to help in
enhancing the efficiency of the current planning approval conditions. The criteria
of planning conditions comprise:
• Necessity – consideration of the current and future demands and needs;
• Relevancy – pertinent to the current situation and conditions;
• Precision and clarity – transparent and understandable by people affected;
• Justice – seek fairness in every aspect of the decision-making process;
• Reasonableness – practicable, and
• Enforceable - long-term implementation.
CONCLUSION
TPP allows flexibility in the physical development, and undeniably required in
the present planning and development control process as it is an important
element in the urban planning system. It is, therefore, important that provisions
regarding TPP in Act 172 are expanded in detail especially regarding time frame,
type of development, development fees, and so on. The provisions related to TPP
are also important for the purpose of planning legal system. The process and
procedures, the process of decision-making, the use of formal and informal
instruments and other measures need to be considered and should be uniformly
formulated to be implemented by the LPA. Systematic and formal TPP process
and procedures is an important measure that can help improve the competency of
the delivery system of local authority in the development control process,
particularly on submission for planning approval.
ACKNOWLEDGEMENT
The authors would like to credit the Research Management Centre (RMC) of
Universiti Teknologi MARA, Malaysia and the Ministry of Higher Education
Malaysia for the funding and continuous support to complete this study.
REFERENCES Arshad, A. F. (2010). Paper 2: Development concept and development control. Shah
Alam: Faculty of of Architecture, Planning and Surveying, UiTM.
Arshad, A. F. (2012). Flow chart of structure plan and local plan preparation as
stipulated under Town and Country Planning Act 1976 (Act 172) (Unpublished).
Universiti Technologi MARA, Malaysia.
Arshad, A. F. (2015). Kebenaran merancang terhad (Unpublished). Bengkel Pemantapan
Dasar dan Kaedah Perancangan Negeri Kedah. Langkawi, Kedah, Malaysia.
PLANNING MALAYSIA
Journal of the Malaysia Institute of Planners (2018)
155 © 2018 by MIP
Hong Kong Planning Department (2015). Hong Kong: The facts (town planning).
Information Services Department, Hong Kong Special Administrative Region
Government. Available at http://www.gov.hk.
Leicester City Council. (2015). A guide to making a planning application. Leicester:
Author.
Planning Act (Chapter 232) (Singapore). Retrieved September 2018, from Singapore
Institute Online:
https://sso.agc.gov.sg/Act/PA1998?ValidDate=20170630&ProvIds=legis#legis
National Land Code Act 1965 (Act 56) (Malaysia).
The Town and Country Planning Act 1990 (England). Retrieved July 31, from
legislation.gov.uk: http: //www/legislation.gov. uk/ukpga/1990/8/contents.
The Town and Country Planning (General Permitted Development) (England) Order
2015. Retrieved July 31, from legislation.gov.uk:
http:www/legislation.gov.uk/uksi/2015/596/ contents/made.
Town and Country Planning Act 1976 (Act 172) (Malaysia).
Yusup, M. (2013). Statutory Procedure and Planning Machinery for Urban Development
in Sarawak. Shah Alam: Universiti Teknologi MARA (Shah Alam).
Zainol, H. (2009). Perspektif perancangan. Shah Alam: Pusat Penerbitan Universiti
(UPENA), UiTM.
1Lecturer at Universiti Teknologi MARA, Malayisa. Email: [email protected] 156
PLANNING MALAYSIA:
Journal of the Malaysian Institute of Planners
VOLUME 16 ISSUE 3 (2018) Page 156 – 170
LOST SPACE IN URBAN CORE AREAS OF KUALA LUMPUR IN
RELATIONS TO PHYSICAL URBAN ENVIRONMENT
Nurul Shakila Khalid1, Sabirah Hilal2, Na’asah Nasrudin3, & Marlyana
Azzyati Marzukhi4
1,2,3,4Faculty of Architecture, Planning and Surveying
UNIVERSITI TEKNOLOGI MARA, MALAYSIA
Abstract
The process of urban development today treats buildings as isolated objects, not
as part of the larger fabric of streets, squares, parks and viable open space, and
without an understanding of human behaviour. What emerges in most
environmental settings is unshaped antispace. The essence of this research seeks
to establish a better understanding towards the local perception of lost space in
the urban core areas of Kuala Lumpur and identify the appropriate tools to
improve the usability of the space. The research has been designed with the aim
of seeking effective ways of designing a space in the urban core to minimize the
undermanaged space. For this reason, the research focuses on the definitions and
characteristics of lost space before the process of designing the space. A
qualitative analysis is made on selected parameters in the theory of lost space by
Trancik (1986); activities, accessibility, connectivity, maintenance and design
aspect. Through a qualitative approach, the result indicates that there were various
new perceptions of descriptive lost space includes economic and social activity,
connectivity, and accessibility as these are an important strategy for maintaining
the vitality and robustness of urban space. It is proposed in this paper that more
attention should be given to urban areas to continue to give cities’ life and vitality,
and the most significant result is to achieve holistic sustainable planning and
management of urban space.
Keywords: lost space, environmental settings, local perceptions, vitality
PLANNING MALAYSIA
Journal of the Malaysia Institute of Planners (2018)
157 © 2018 by MIP
INTRODUCTION
In most of the cities today, designers are faced with the challenge of creating
holistic environments in an urban core particularly as collective, unifying
frameworks for new development (Krier, Ibelings, Meuser, & Bodenschatz
2006). Too often the design’s contribution becomes an after the fact cosmetic
treatment of spaces that are ill-planned for public use in the first place. The
process of urban development treats buildings as isolated objects, not as part of
the larger fabric of streets, squares, parks and viable open space, without
considering the relationship between buildings and spaces, and understanding of
human behaviour (Loukaitou-Sideris, 1996; Carmona, 2010). Hence, what
emerges in most environmental settings today is unshaped antispace. It is centred
on the concept of urbanism as an essential attitude in urban design, favouring the
spatially connected public environment over the master planning. This approach
knows for making figurative space out of the lost landscape. Architects, urban
planners, urban environment, and landscape architects have a major
responsibility to meet the challenge and to reintegrate the lost spaces in the urban
core into the effective urban fabric. According to Trancik (1986), lost space is a leftover unconstructed
landscape. They are the undermanaged areas between districts, buildings, or
roads emerge without anyone realizing it until its being done physically on the
ground. It is the undesirable urban space that is accidentally formed during the
planning stage (Sommer, 1974). In other words, lost space can be seen as an
inadequate use of space in urban area, isolated from the walking flow
(Montgomery, 1998 and Tibbalds, 2001). It is abandoned and left area that has
lost their functions (Franck & Stevens, 2006). Trancik (1986) notices that space
such as a park can be considered as lost space if space does not serve its intended
purpose. Lost space becomes a place when it is given a contextual meaning
derived from cultural or regional content (Azhar & Gjerde, 2016). Therefore, in
the effort to recapturing the lost space and imbue it with a sense of place,
designers need to focus on the needs and wants of the users.
Mobility and communication have increasingly dominated Kuala
Lumpur, which has consequently lost much of its cultural meaning and human
purpose especially today, the spaces between buildings are rarely designed. The
results of this can be seen all around us. The disjointed lacking visual and physical
coherence in Kuala Lumpur has resulted to the more utilitarian in their
organization, the notion of function was gradually displaces from the external
space to the organization of internal space. A building tended to become more of
an object, separate from its context.
Under the logic of lost space and how the theoretical understanding
contributes to user perception, this research attempts to seek a better
understanding towards the local perception of lost space in the urban core areas
of Kuala Lumpur and seek the appropriate tools to improve the usability of the
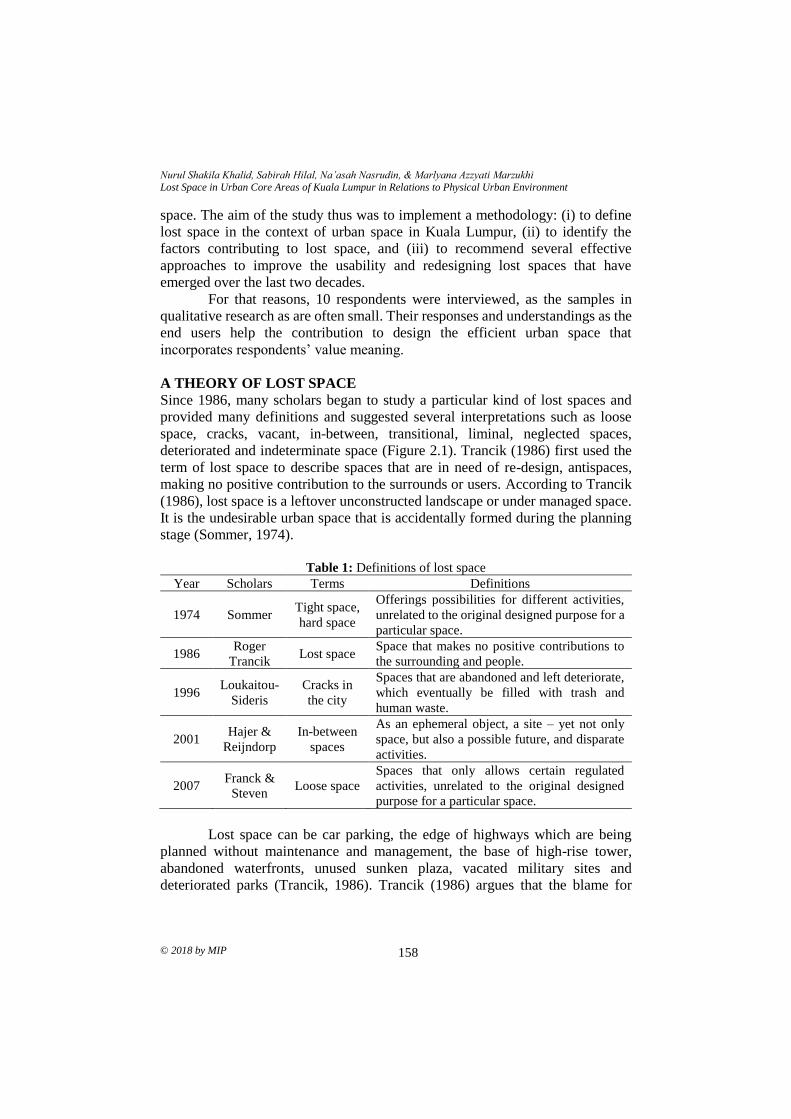
Nurul Shakila Khalid, Sabirah Hilal, Na’asah Nasrudin, & Marlyana Azzyati Marzukhi
Lost Space in Urban Core Areas of Kuala Lumpur in Relations to Physical Urban Environment
© 2018 by MIP 158
space. The aim of the study thus was to implement a methodology: (i) to define
lost space in the context of urban space in Kuala Lumpur, (ii) to identify the
factors contributing to lost space, and (iii) to recommend several effective
approaches to improve the usability and redesigning lost spaces that have
emerged over the last two decades.
For that reasons, 10 respondents were interviewed, as the samples in
qualitative research as are often small. Their responses and understandings as the
end users help the contribution to design the efficient urban space that
incorporates respondents’ value meaning.
A THEORY OF LOST SPACE
Since 1986, many scholars began to study a particular kind of lost spaces and
provided many definitions and suggested several interpretations such as loose
space, cracks, vacant, in-between, transitional, liminal, neglected spaces,
deteriorated and indeterminate space (Figure 2.1). Trancik (1986) first used the
term of lost space to describe spaces that are in need of re-design, antispaces,
making no positive contribution to the surrounds or users. According to Trancik
(1986), lost space is a leftover unconstructed landscape or under managed space.
It is the undesirable urban space that is accidentally formed during the planning
stage (Sommer, 1974).
Table 1: Definitions of lost space
Year Scholars Terms Definitions
1974 Sommer Tight space,
hard space
Offerings possibilities for different activities,
unrelated to the original designed purpose for a
particular space.
1986 Roger
Trancik Lost space
Space that makes no positive contributions to
the surrounding and people.
1996 Loukaitou-
Sideris
Cracks in
the city
Spaces that are abandoned and left deteriorate,
which eventually be filled with trash and
human waste.
2001 Hajer &
Reijndorp
In-between
spaces
As an ephemeral object, a site – yet not only
space, but also a possible future, and disparate
activities.
2007 Franck &
Steven Loose space
Spaces that only allows certain regulated
activities, unrelated to the original designed
purpose for a particular space.
Lost space can be car parking, the edge of highways which are being
planned without maintenance and management, the base of high-rise tower,
abandoned waterfronts, unused sunken plaza, vacated military sites and
deteriorated parks (Trancik, 1986). Trancik (1986) argues that the blame for
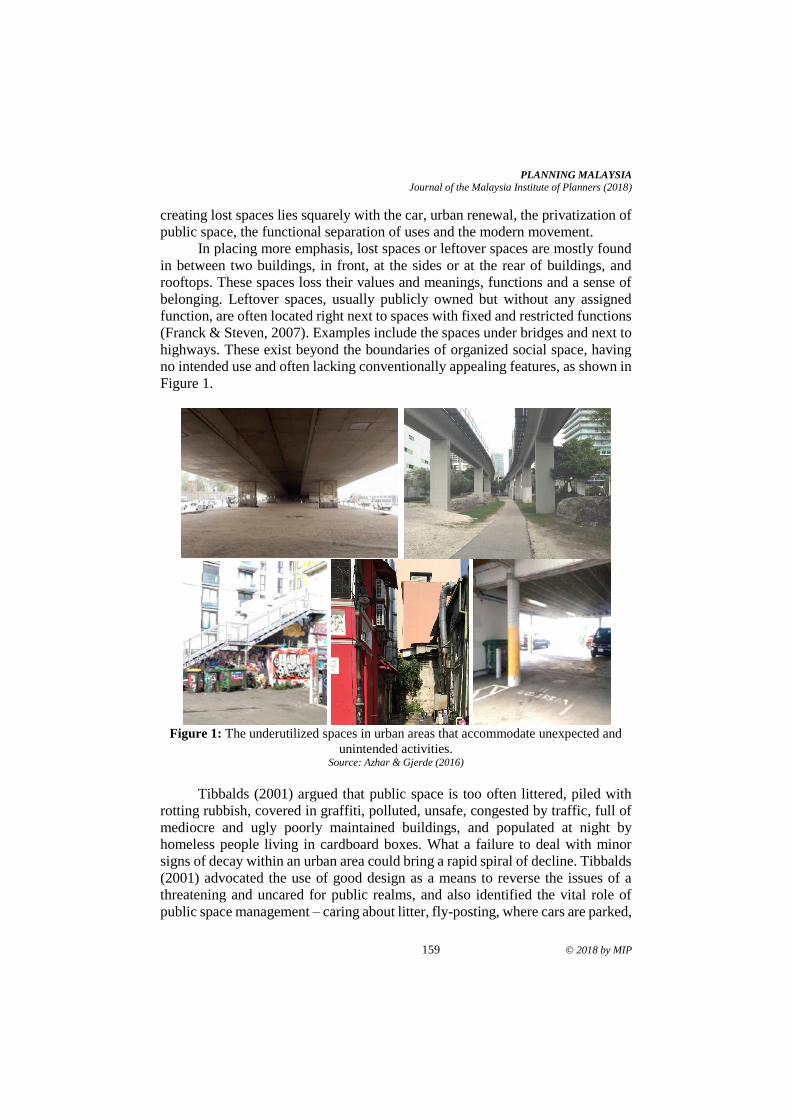
PLANNING MALAYSIA
Journal of the Malaysia Institute of Planners (2018)
159 © 2018 by MIP
creating lost spaces lies squarely with the car, urban renewal, the privatization of
public space, the functional separation of uses and the modern movement.
In placing more emphasis, lost spaces or leftover spaces are mostly found
in between two buildings, in front, at the sides or at the rear of buildings, and
rooftops. These spaces loss their values and meanings, functions and a sense of
belonging. Leftover spaces, usually publicly owned but without any assigned
function, are often located right next to spaces with fixed and restricted functions
(Franck & Steven, 2007). Examples include the spaces under bridges and next to
highways. These exist beyond the boundaries of organized social space, having
no intended use and often lacking conventionally appealing features, as shown in
Figure 1.
Figure 1: The underutilized spaces in urban areas that accommodate unexpected and
unintended activities. Source: Azhar & Gjerde (2016)
Tibbalds (2001) argued that public space is too often littered, piled with
rotting rubbish, covered in graffiti, polluted, unsafe, congested by traffic, full of
mediocre and ugly poorly maintained buildings, and populated at night by
homeless people living in cardboard boxes. What a failure to deal with minor
signs of decay within an urban area could bring a rapid spiral of decline. Tibbalds
(2001) advocated the use of good design as a means to reverse the issues of a
threatening and uncared for public realms, and also identified the vital role of
public space management – caring about litter, fly-posting, where cars are parked,
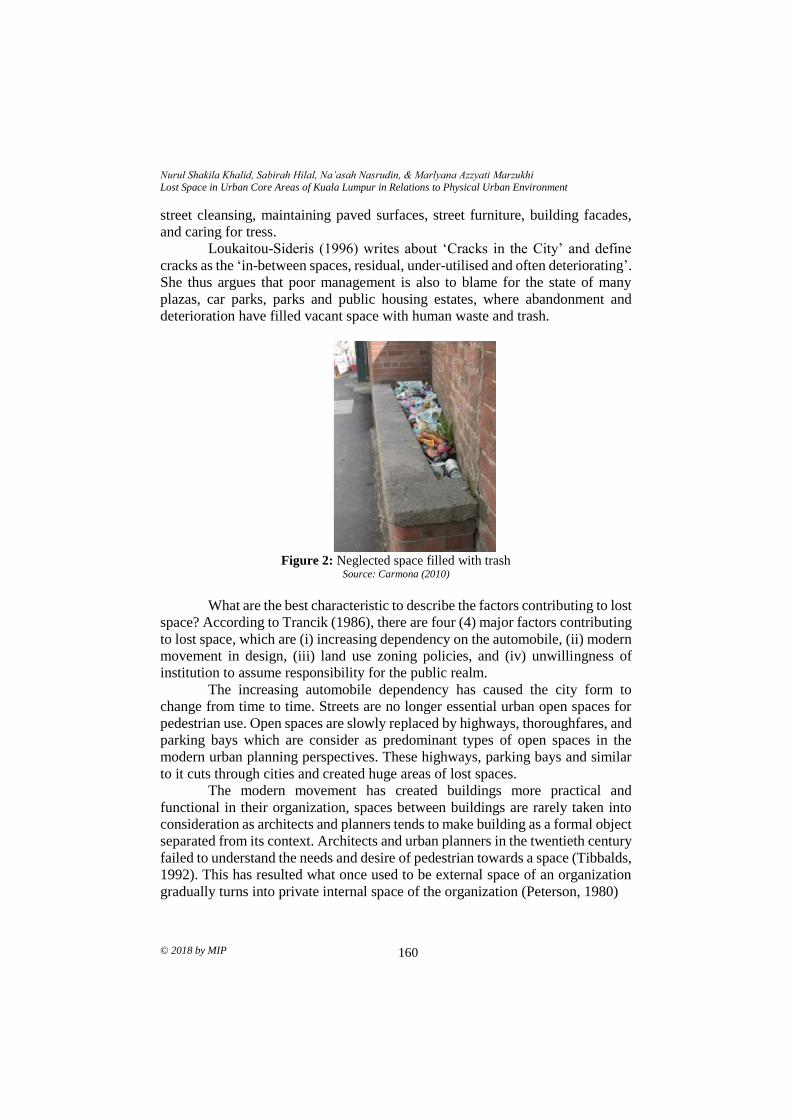
Nurul Shakila Khalid, Sabirah Hilal, Na’asah Nasrudin, & Marlyana Azzyati Marzukhi
Lost Space in Urban Core Areas of Kuala Lumpur in Relations to Physical Urban Environment
© 2018 by MIP 160
street cleansing, maintaining paved surfaces, street furniture, building facades,
and caring for tress.
Loukaitou-Sideris (1996) writes about ‘Cracks in the City’ and define
cracks as the ‘in-between spaces, residual, under-utilised and often deteriorating’.
She thus argues that poor management is also to blame for the state of many
plazas, car parks, parks and public housing estates, where abandonment and
deterioration have filled vacant space with human waste and trash.
Figure 2: Neglected space filled with trash
Source: Carmona (2010)
What are the best characteristic to describe the factors contributing to lost
space? According to Trancik (1986), there are four (4) major factors contributing
to lost space, which are (i) increasing dependency on the automobile, (ii) modern
movement in design, (iii) land use zoning policies, and (iv) unwillingness of
institution to assume responsibility for the public realm.
The increasing automobile dependency has caused the city form to
change from time to time. Streets are no longer essential urban open spaces for
pedestrian use. Open spaces are slowly replaced by highways, thoroughfares, and
parking bays which are consider as predominant types of open spaces in the
modern urban planning perspectives. These highways, parking bays and similar
to it cuts through cities and created huge areas of lost spaces.
The modern movement has created buildings more practical and
functional in their organization, spaces between buildings are rarely taken into
consideration as architects and planners tends to make building as a formal object
separated from its context. Architects and urban planners in the twentieth century
failed to understand the needs and desire of pedestrian towards a space (Tibbalds,
1992). This has resulted what once used to be external space of an organization
gradually turns into private internal space of the organization (Peterson, 1980)
PLANNING MALAYSIA
Journal of the Malaysia Institute of Planners (2018)
161 © 2018 by MIP
As mentioned by Trancik (1986), the zoning policy was initiated by the
planners with the purposed to promote health, safety and social welfare through
the segregation of land uses. However, the zoning policies adopted hardly take
consideration towards the spatial structure and community existence. The value
imposed by zoning has rejected the elements of old town that were built around
a network of street-level public spaces in response to traditional planning. This
has resulted towards an increasingly unliveable environment, vehicular and
pedestrian system became confusing, the relationships of building and public
spaces were ignored, and undeveloped spaces were turned into parking lots.
Zonings has subdivided cities into homogeneous districts, and created a major
lost space in the urban fabric.
The privatizations of public spaces are closely related to the modern
architectural movement which does not pay much attention to the public realm.
The framework of common public realm concern has lost along the way of
modern architectural movement, the minimal investment in maintaining public
spaces and lack of interest in controlling the physical form and appearance of the
city has created monumental problems for not only the public spaces in the city
but also the image of the city.
ANALYSIS AND DISCUSSIONS
Analysis sections were divided into three (3) stage; (i) stage 1 Analysis of
relationship between the characteristics of lost space and the physical setting, (ii)
stage 2 Analysis of Characteristics between prescriptive and descriptive lost
space, and (iii) stage 3 Analysis of prescriptive vs descriptive lost space.
Prescriptive lost space refers to the definitions as explain in the theory of lost
space, and using codes and themes to group the definitions, while descriptive
refers to local perceptions that may contrast with the definitions by theory. Both
descriptive and prescriptive reflects the question how theoretical approach of lost
space may differs how local perceive and understand the lost space.
The Relationship between the Characteristics of Descriptive Lost Space and
the Physical Urban Environment
In this analysis, the physical urban environment, such as streets, public spaces,
parks, government reserve, buildings and parking, has unique characteristics
needed in enhancing its quality. Physical settings in the urban area become a part
of city attractiveness elements because of its ability to attract newly-emerging
businesses and social interactions. In particular, not only the city but the people
have recognised that attractive physical settings of the city can enhance city
uniqueness and improve urban environment.
The results found that there are three (3) most characteristics mentioned by
the respondents; social activity, economic activity and design (Table 2). Cafes,
buskers, picnic, exhibitions, music festivals, and other events are types of social
Nurul Shakila Khalid, Sabirah Hilal, Na’asah Nasrudin, & Marlyana Azzyati Marzukhi
Lost Space in Urban Core Areas of Kuala Lumpur in Relations to Physical Urban Environment
© 2018 by MIP 162
activities identified by the respondents. If space was poorly managed and
declined either physically, or in the activities (social, cultural and economic) it
offers, the vicious cycle of decline may all too easily set in. Carmona, Heath, Oc
and Tiesdell (2010) describe “if people use space less, then there is less incentive
to provide new spaces and maintain existing ones. With decline in their
maintenance and quality, public spaces are less likely to be used, thereby
exacerbating the vicious spiral of decline”.
The second characteristic of descriptive lost space as perceived by the
selected members of the creative class is economic activities. Retail locations,
restaurants, cafés, street food stalls, are some of the economic activities that were
identified by the respondents. The third characteristic of descriptive lost space as
perceived by end users’ is the connectivity. According to the respondents,
connectivity refers to the relative location and types of elements in the physical
setting. Connectivity also refers to the availability of public transportation in the
area. Accessibility, according to the respondents, refers to safety, convenience,
and permeability. Some respondents have been denied access to it, prominent
among which are the rich, elderly and youth. Exclusion of fear and inability to
consume, the most written about being sporting and skateboarding, which is
regarded by some as anti-social because of the conflict it creates with other
groups. In such places, youth experience problems of safety and security and
feelings of exclusion, while what they desire in a public space is social
integration, safety and freedom of movement. All these describe failures to
manage shared public spaces in a manner that allows their equitable use by all
groups without diminishing the welfare of others.
Analysis of characteristics of descriptive lost space is very important as
to compare with the characteristics of prescriptive lost space explained in the
theory. As an example, the variety of public spaces in Kuala Lumpur such as KL
Bird Park, Orchid Garden, Merdeka Square, and Perdana Botanical Garden,
includes those that are planned for certain assigned functions; both legally and
physically, accommodate other activities as well. It also includes other kinds of
spaces currently without assigned functions that accommodate unintended and
spontaneous activities. Many of these spaces possess particular features that
invite people to appropriate them for their own uses.
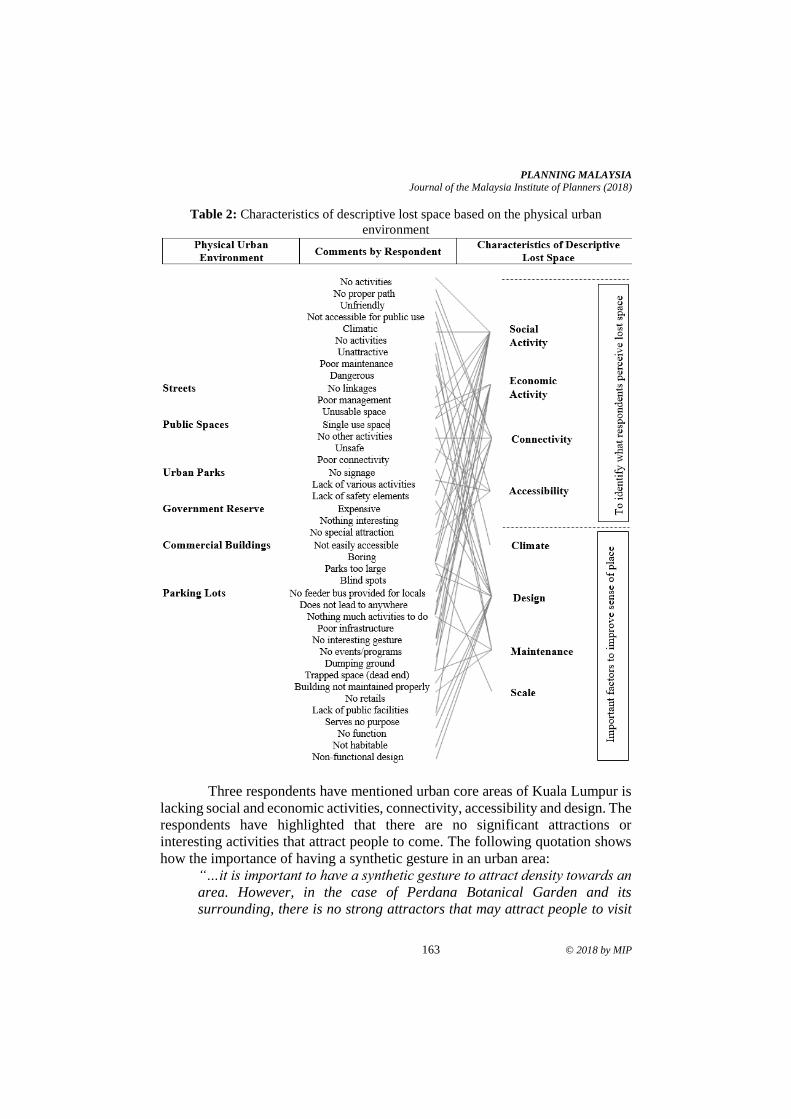
PLANNING MALAYSIA
Journal of the Malaysia Institute of Planners (2018)
163 © 2018 by MIP
Table 2: Characteristics of descriptive lost space based on the physical urban
environment
Three respondents have mentioned urban core areas of Kuala Lumpur is
lacking social and economic activities, connectivity, accessibility and design. The
respondents have highlighted that there are no significant attractions or
interesting activities that attract people to come. The following quotation shows
how the importance of having a synthetic gesture in an urban area:
“…it is important to have a synthetic gesture to attract density towards an
area. However, in the case of Perdana Botanical Garden and its
surrounding, there is no strong attractors that may attract people to visit
Nurul Shakila Khalid, Sabirah Hilal, Na’asah Nasrudin, & Marlyana Azzyati Marzukhi
Lost Space in Urban Core Areas of Kuala Lumpur in Relations to Physical Urban Environment
© 2018 by MIP 164
the area often. Having activities alone does not make the area lively. The
support of public transportation and better connectivity helps to capture
the density in the area…”
The poor physical state of Perdana Botanical Garden seems to rest with the
fact that it is rarely clear who should be managing it after it is built, or after it has
declined. As a result, it is being neglected, with Hajer and Reijndorp (2001)
explaining that more attention needs to be given to such transitional space.
In addition, the study area consists of a large recreational park surrounded
by various cultural and eco-tourism areas. However, local people did not find any
attractions to visit. This brings us to the second characteristic, which is poor in
connectivity and accessibility that contributes to lost space as mentioned by the
respondent.
“I have been living in Kuala Lumpur for 30 years. I can count how many
times I have been to Perdana Botanical Garden. Hardly reachable,
unfriendly pathways and bicycle lane, and no public transportation access
to the area except the Hop on Hop off Bus, which only caters for the tourists
only”.
The design of the area also influences people to utilise the space. Two
respondents perceived that Perdana Botanical Garden is unsafe due to many
reasons such as robbery and vandalism. The massive development around the
park contributed to the feeling of unsafe due to the lack of natural surveillance.
Characteristics of Prescriptive and Descriptive Lost Space
Most of the respondents expressed the negative perceptions towards the term lost
space as defined by Trancik (1986), Loukaitou-Sideris (1996), and Franck and
Steven (2006). People are aware of the negative side of the space and the need of
redesigning towards the area. This shows that most of the respondents’ definitions
of lost space are somehow similar to Trancik’s (1986).
For descriptive definition of lost space, this study synthesizes the key
themes discussed by selected end users’ when asked to define their individual
perceptions of lost space. In general, respondents perceived descriptive lost
space as underutilized, abandoned, wasted, unused or hidden spaces.
Descriptive lost space, however, has the potential to become a positive space if
it benefits the aesthetics of the surroundings. The characteristics of prescriptive
lost space are activity, connectivity, accessibility, design, maintenance,
orientation, and scale. From a prescriptive perspective, activity refers to unused
sunken plazas, abandoned waterfronts, and edges of freeways. Connectivity in
prescriptive perspective refers to parking lots when they cut the city’s urban
fabric. Meanwhile, accessibility mostly refers to wide roads if they limit access
to surrounding districts. From a prescriptive perspective, design refers to
PLANNING MALAYSIA
Journal of the Malaysia Institute of Planners (2018)
165 © 2018 by MIP
unstructured landscape at the base of high rise towers and marginal public
housing, and maintenance includes the edge of freeways and deteriorated parks.
Finally, orientation in a prescriptive perspective refers to large parcel
development, large blank walls, large government structures, and mega
structures. When spaces in the physical setting lack characteristic such as the
activity or design, they are considered as lost space in prescriptive perspective.
The descriptive lost space results can be concluded by combining the
descriptive definition and characteristics of lost space, meaning that for a place
to be defined as descriptive lost space, it must lack of at least one of the four (4)
common characteristics of descriptive lost space; activities, connectivity,
accessibility and maintenance.
Prescriptive vs Descriptive Lost Space
In discussing the lost space in Kuala Lumpur, the respondents mentioned Taman
Tasik Perdana, streets, roundabout, waterfront, Kompleks Daya Bumi, viaduct of
Jalan Kuching - Jalan Tun Perak, and parking space. Examples of each area
mentioned by respondent will be discussed in the following section. For the
purpose of determining whether an exact location conforms to the characteristics
of prescriptive and or descriptive lost space, these specific areas of Kuala Lumpur
mentioned by the respondents were fit into the typologies of prescriptive lost
space.
Table 4 summarizes the understanding of respondents of lost space in
Kuala Lumpur. The results show there is the conflict between the characteristics
of prescriptive and descriptive of lost space. Respondents reported that the
parking lots are not a lost space because it is a park facility since everybody drives
a car to go to the park.
People create loose space through their own actions (Krier et al., 2006).
These urban spaces possess physical and social possibilities for looseness, being
open to appropriation, but it is people, through their own eyes and understanding,
who fulfil these possibilities. From the results, the emergence of a lost space
depends upon; people’s perspective of the potential within the space, and second,
varying degrees of creativity and determination to make use of what is present,
with possibility of modifying existing elements or bringing in additional ones.
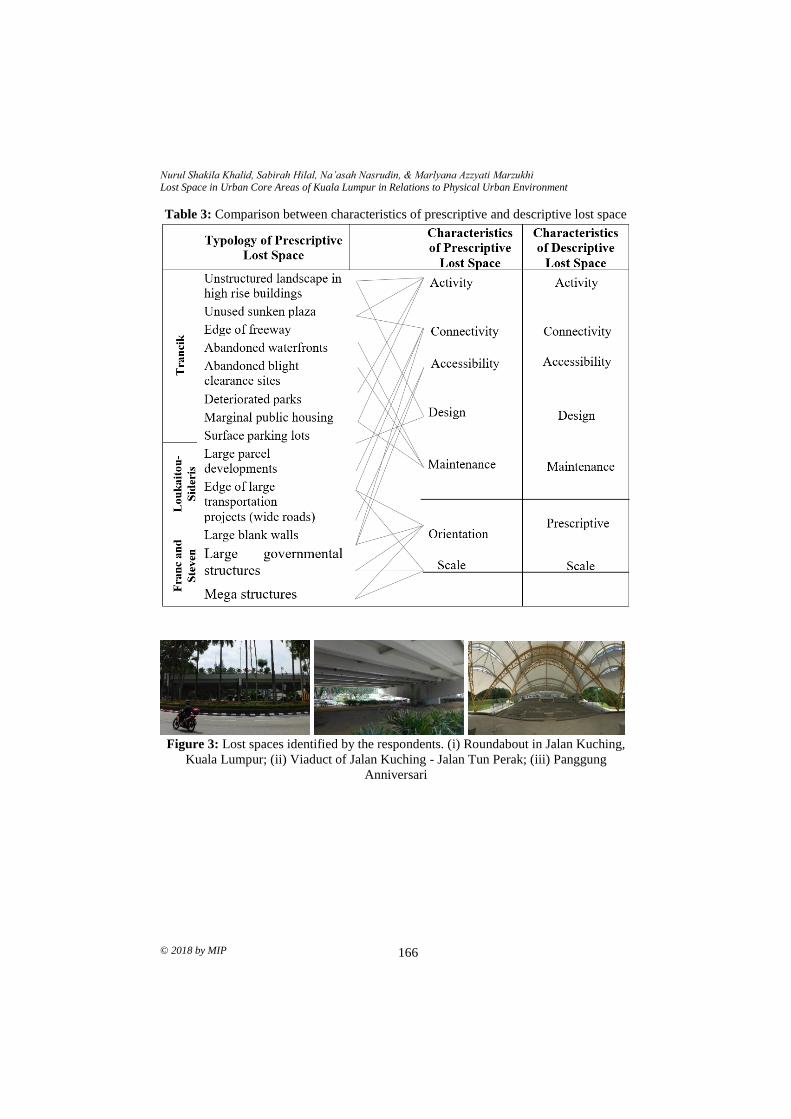
Nurul Shakila Khalid, Sabirah Hilal, Na’asah Nasrudin, & Marlyana Azzyati Marzukhi
Lost Space in Urban Core Areas of Kuala Lumpur in Relations to Physical Urban Environment
© 2018 by MIP 166
Table 3: Comparison between characteristics of prescriptive and descriptive lost space
Figure 3: Lost spaces identified by the respondents. (i) Roundabout in Jalan Kuching,
Kuala Lumpur; (ii) Viaduct of Jalan Kuching - Jalan Tun Perak; (iii) Panggung
Anniversari
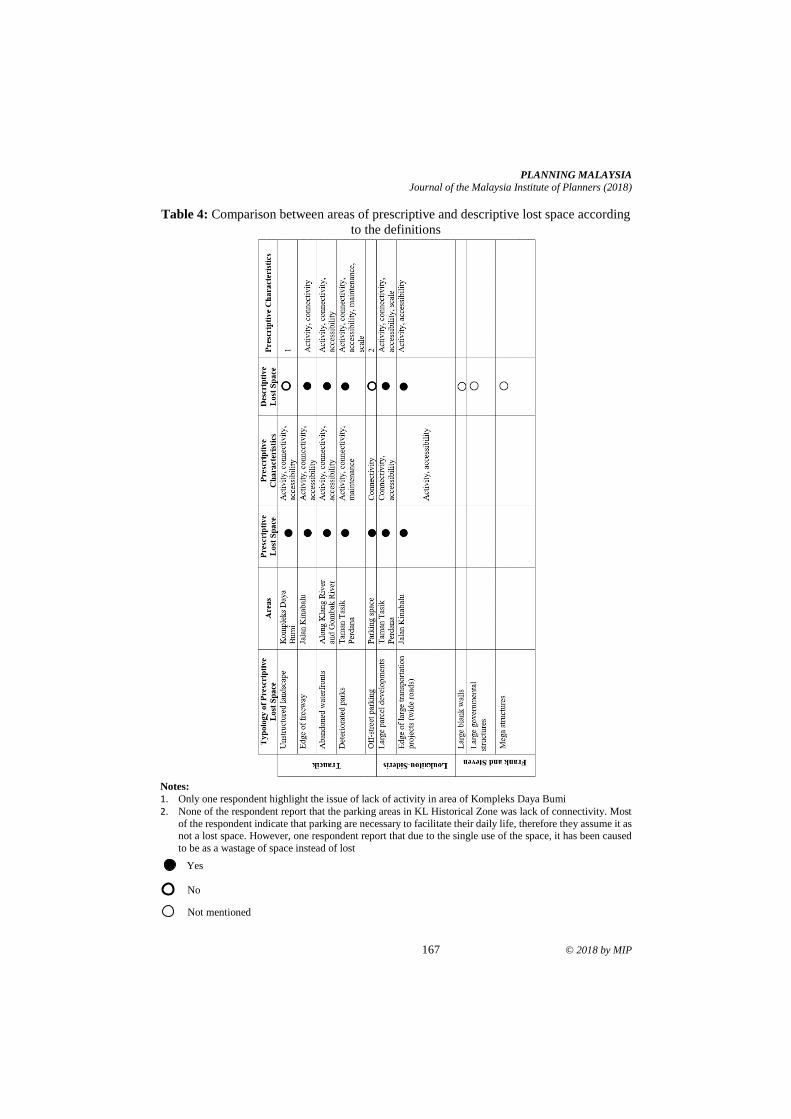
PLANNING MALAYSIA
Journal of the Malaysia Institute of Planners (2018)
167 © 2018 by MIP
Table 4: Comparison between areas of prescriptive and descriptive lost space according
to the definitions
Notes:
1. Only one respondent highlight the issue of lack of activity in area of Kompleks Daya Bumi 2. None of the respondent report that the parking areas in KL Historical Zone was lack of connectivity. Most
of the respondent indicate that parking are necessary to facilitate their daily life, therefore they assume it as not a lost space. However, one respondent report that due to the single use of the space, it has been caused
to be as a wastage of space instead of lost
Yes
No
Not mentioned
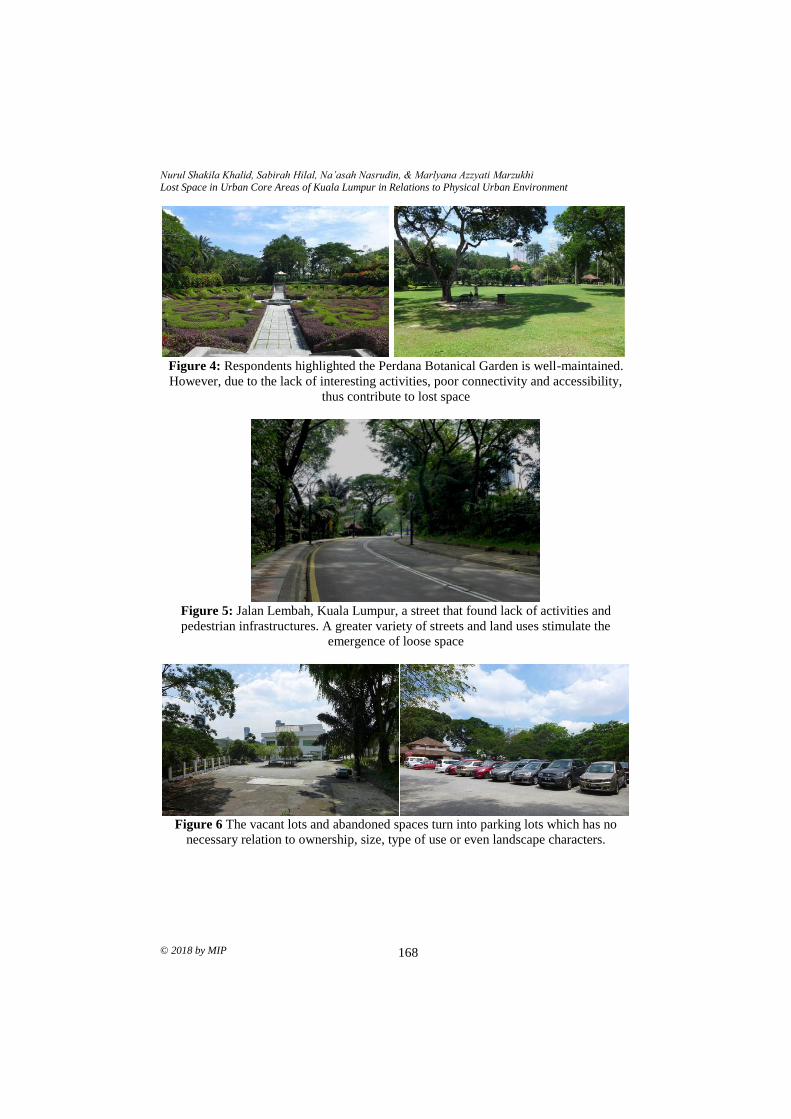
Nurul Shakila Khalid, Sabirah Hilal, Na’asah Nasrudin, & Marlyana Azzyati Marzukhi
Lost Space in Urban Core Areas of Kuala Lumpur in Relations to Physical Urban Environment
© 2018 by MIP 168
Figure 4: Respondents highlighted the Perdana Botanical Garden is well-maintained.
However, due to the lack of interesting activities, poor connectivity and accessibility,
thus contribute to lost space
Figure 5: Jalan Lembah, Kuala Lumpur, a street that found lack of activities and
pedestrian infrastructures. A greater variety of streets and land uses stimulate the
emergence of loose space
Figure 6 The vacant lots and abandoned spaces turn into parking lots which has no
necessary relation to ownership, size, type of use or even landscape characters.
PLANNING MALAYSIA
Journal of the Malaysia Institute of Planners (2018)
169 © 2018 by MIP
CONCLUSION
Having the understanding on the differences between prescriptive lost space and
descriptive lost space, it is apparent that the respondents in this research perceive
Kuala Lumpur to be lacking activity, connectivity and accessibility, and
therefore, has descriptive lost space potential. The respondents also perceive that
more social economic activity would help prevent descriptive lost space,
especially if those activities had better connectivity and accessibility with the
surrounding.
It is crucial to trigger the relevant bodies’ interest by highlighting certain
basic principles in planning for a better space design and planning in urban core
areas. As conclusion, both political commitment and public investment are
required. It is not the planning system per se which is at fault. We need a strong
planning system. It is possibly the way that it is operated that needs review. There
needs to be greater sensitivity in the application of planning laws to better control
over the location of high buildings, infrastructures, public spaces, greater regard
for historic areas, better understanding of the organic growth of urban core and a
striving for higher quality in building and space design.
Additionally, there has always been a strong relation between commerce
and urban public space, and strong exclusionary tendencies among those with
management and ownership responsibilities. It is surprising that corporate
interests are determined to take responsibility for public spaces when the public
sector has often done such a poor job in managing the spaces for which they are
responsible, spaces that still make up the large majority of the public realm.
REFERENCES Azhar, J., & Gjerde, M. (2016). Re-thinking the role of urban in-between spaces. In J.
Zuo, L. Daniel, & V. Soebarto (Eds.), Fifty years later: Revisiting the role of
architectural science in design and practice: 50th International Conference of
the Architectural Science Association 2016 (pp. 279–288). Adelaide: The
Architectural Science Association and the University of Adelaide.
Carmona, M. (2010). Contemporary public space: Critique and classification, Part one:
Critique. Journal of Urban Design, 15(1), 123-148.
Carmona, M., Heath, T., Oc, T., & Tiesdell, S. (2010). Public places - urban spaces: The
dimension of urban design. Oxford: Architectural Press.
Franck, K., & Stevens, Q. (2006). Loose space: Possibility and diversity in urban life.
London: Routledge.
Hajer, M., & Reijnorp, A. (2001). In search of new public domain. Rotterdam: NAi.
Krier, R., Ibelings, H., Meuser, P., & Bodenschatz, H. (2006). Town spaces:
Contemporary interpretations in traditional urbanism: Krier-Kohl-Architects.
Basel: Birkhauser.
Loukaitou-Sideris, A. (1996). Cracks in the city: Addressing the constraints and potentials
of urban design. Journal ofs Urban Design, 1(1), 91-103.
Montgomery, J. (1998). Making a city: Urbanity, vitality and urban design. Journal of
Urban Design, 3(1), 93-116.

Nurul Shakila Khalid, Sabirah Hilal, Na’asah Nasrudin, & Marlyana Azzyati Marzukhi
Lost Space in Urban Core Areas of Kuala Lumpur in Relations to Physical Urban Environment
© 2018 by MIP 170
Sommer, R. (1974). Tight spaces: Hard architecture and how to humanize it. Old Tappan:
Prentice-Hall.
Tibbalds, F. (2001). Making people-friendly towns: improving the public environment in
towns and cities. London: Spoon Press.
Trancik, R. (1986). Finding Lost Space: Theories of Urban Design. New York: Van
Nostrand Reinhold.
1Assistant Professor at Universiti Tunku Abdul Rahman, Malaysia. Email: [email protected] 171
PLANNING MALAYSIA:
Journal of the Malaysian Institute of Planners
VOLUME 16 ISSUE 3 (2018) Page 171 – 181
PREFERENCE OF RESIDENTIAL TYPOLOGIES OF URBAN
MALAYSIANS
Lim Poh Im1 & Chang Yun Fah2
Faculty of Engineering & Science
UNIVERSITI TUNKU ABDUL RAHMAN, MALAYSIA
Abstract
This paper seeks to understand patterns of residential preferences of urban
Malaysians when seeking to purchase residential properties. Data was gathered
through sampling surveys targeting potential house buyers in property fairs in
three urban centres in Malaysia, namely Kuala Lumpur, Georgetown and Johor
Bahru. Results highlighted significant presence of young purchasers and first-
time buyers; majority seeking to purchase properties priced RM600,000 and
below; and taking very long tenure to finance the properties. Double-storey
terrace and condominium, accumulatively garnered higher popular choice, but
both fell short of ‘Most Preferred’ category. Factor analysis discovered that
overall landed properties fared better than multi-storey buildings as preferred
residential typology across the board regardless of socio-economic backgrounds.
Family situation and circumstance, referring to marital status, number of family
member, and whether they previously owned a property, were found to be the
most crucial factors governing their choice on the preferred type of residential
properties.
Keywords: housing typology, housing preference house choice, residential
typologies, family factors in housing, landed housing, multi-storey
housing
Lim Poh Im & Chang Yun Fah
Preference of Residential Typologies of Urban Malaysians
© 2018 by MIP 172
INTRODUCTION
The research on housing or homeownership can be approached from different
angles and subject to diverse influencing factors. Home ownership is a result of
many determinants, including housing characteristics (house types and property
types), employment and income trends, and socio-cultural and demographic
descriptors. This paper seeks to understand preferences in types of residential
properties, and factors determining the decisions in choosing them, based on
feedback from potential house-buyers in three urban centres in Malaysia, namely
Kuala Lumpur, Georgetown and Johor Bahru. These three cities were chosen as
they represent the three largest cities in Malaysia with the highest concentration
of urban population, highest transaction of properties and most affluent housing
markets and high living costs. The typologies of residential properties included
in this paper are based on commonly found housing typologies in Malaysia.
Factors influencing choices of residential properties include profile of buyer, i.e.
investors vs. genuine buyers and first time home buyers; socio-marital
background, e.g. age, gender, family situation, occupation and other factors
related to finance arrangement and payment methods.
LITERATURE REVIEW
Residential Building Typology and Character in Malaysian Cities
The definition of housing typology itself can be referred to the classification of
residential buildings, according to its association with physical composition,
intensity of development and degree of formality. There are many types of
residential properties in Malaysia. In this study, the categorisation is based on the
most commonly found housing typologies in Malaysian cities using the
Malaysian National Property Information (NAPIC)’s house price index
categorisation as a basis. NAPIC categorised the residential properties into only
four, namely terrace, high-rise, semi-detached and detached house. For this study,
these were further divided them into townhouse, apartment, condominium, flat,
shop-house/shop-apartment, terrace house, semi-detached house and detached
house/bungalow, for a more meaningful understanding on the commonly found
residential typologies in Malaysian cities.
The diversity in the residential typologies in Malaysia cities is a
combined result of historical trends, contemporary market forces and the
regulatory demands. The colonial heritage in the past, which merged with local
traditional forms of housing, resulted in housing types of ‘terrace house’, ‘shop-
house’ and ‘bungalows’ (Ju & Omar, 2011). ‘Shop-house’ for instance, is a
hybrid residential-commercial typology, traditionally found in South-east Asian
colonial cities. ‘Terrace house’ can be taken as the most economic type of landed
property, while ‘semi-detached’ type has bigger private compounds, but do not
have the luxurious amount of open spaces like the ‘bungalow’. Another type of
PLANNING MALAYSIA
Journal of the Malaysia Institute of Planners (2018)
173 © 2018 by MIP
landed property is townhouse, which is an individual stratified unit with separate
entrances for the upper and lower units.
Other than this, the high-density and multi-storey types of housing, such
as ‘apartment’, ‘condominium’ and ‘flat’ are more popularly found in urban
centres in Malaysia. The housing landscape of Malaysian cities reflects the
increased demand in urban population and the regulatory regimes governing
urban planning and housing development. Planning controls restrict the amount
of land available for housing, and determine the density as well as the types of
development activity of the location or zonation. Planning standards specifying
the allowable units per acre or in plot ratio, building height, land set-backs,
amount of land for open space and amenities, and in the cases of low-cost and
affordable units, the unit size. As a result, high-density development can be
synonymous to the high-rise typologies, including apartment, condominium and
flat, with densities of 60 to 128 units per acre. Low-rise units refer to cluster,
terrace and townhouse (20 to 35 units per acre), while detached, semi-detached
and bungalow houses can have very low density, as low as 15 units per acre.
Factors Influencing Preferences on Types of Residential Buildings
Research on residential housing choice and preference are wide and multi-
faceted. There has been a tradition of explaining housing preference based on
homebuyer demographics such as age, household composition, income, and
current housing situation (Rossi & Weber, 2010). Empirical studies relating
housing choice and socio-demographic backgrounds have shown that home
ownership is strongly related to stages in the life cycle (Clark & Onaka, 1983),
the presence of children (Coulson, 1999; Goodman, 1990; Haurin & Kamara,
1992) and employment types and location (Levine, 2007)
In a study of factors affecting buying behaviour of apartment in Amman
Jordan, significant constructs such as aesthetic, economic, marketing,
geographic, and social factors were found. The study concluded that there were
significant differences in terms of respondents’ gender and age, but no significant
differences according to the marital status or educational level (Haddad, Judeh,
& Haddad, 2011). In a study on house purchase intention of consumers in Kota
Kinabalu, Malaysia, it was found that house features, financing, distance,
environment and superstition-numbers have significant positive relationships
with house purchase intention (Chia, Harun, Kassim, Martin, & Kepal, 2016).
Indeed, house preferences are not only influenced by social-demographic
descriptors, but equally important are buyers’ intentions and their finance
situations. In understanding reasons of homeownership factors in Malaysia, Tan
(2009) uncovered six factors, namely local amenities and social capital
investment, properties maintenance and improvement, length of tenure,
children’s educational needs and financial benefits in understanding buyers’
motivation as considerations in buying homes in Malaysia.
Lim Poh Im & Chang Yun Fah
Preference of Residential Typologies of Urban Malaysians
© 2018 by MIP 174
In a study of factors affecting the purchase decision of investors in the
residential property market in Malaysia, it was revealed that locational, financial
and structural factors affect property investors in making their purchases (Tan,
2012), while Kohler (2013) revealed that investors generally prefer smaller
properties especially apartments and flats as these properties have always been
more popular among tenants. In identifying drivers behind housing preferences
of first-time home buyers, Reed and Mills (2006) confirmed that “financial”
issues accounted for approximately 30 percent of the actual decision by first‐time
buyers to purchase housing, while decisions relating to the timing and choice
were dependent on “site‐specific” factors.
Most literature found relate housing preferences to the socio-
demographic attributes and reasons behind certain choices were made, but
seldom correlate to the different housing typologies. Only one finding from a
recent study of young Malaysians in Subang Jaya, Selangor, Malaysia which
revealed that young urbanites preferred landed housing with more bedrooms
compared to high-rise housing. They preferred to live in urban area so as to be
close to workplace and services. They targeted high priced houses despite facing
affordability issues (Ling, Mansur, & Musthafa, 2016).
METHODOLOGY
Sampling and Questionnaire
Primary data using a face-to-face convenient sampling survey was conducted in
three major Malaysian cities, namely Kuala Lumpur in the central region of
Peninsular Malaysia, Penang in the northern region, and Johor Bahru in the
southern part of Peninsular Malaysia. The surveys were conducted at five major
property fairs in year 2016. These property fairs are Malaysia Property Expo
(MAPEX), The Star Property Fairs, and Malaysia Secondary Property Exhibition
(MASPEX). A total of 1015 valid samples were analysed. The survey targeted
visitors to the property fairs. The survey questionnaire included 66 questions
concerning respondents’ socio-demographic backgrounds, current family and
living conditions, payment and financial arrangements, and housing type
preference. For this paper, 27 questions grouped under the following categories
were analysed:
• Respondents’ socio-demographic data: marital status, living condition,
number of family member, occupation, education level, age, gender,
ethnicity, religion, household income, currently own any property.
• Preferred type of house: flat, apartment, townhouse, condominium, shop-
house, single storey terrace, double storey terrace, semi-detached, and
bungalow.
• Purpose of purchase: payment method, loan tenure, percentage of income
for property, house price, floor size, etc.
PLANNING MALAYSIA
Journal of the Malaysia Institute of Planners (2018)
175 © 2018 by MIP
All questions related to house type preference were measured using a
five-point Likert Scale and respondents were asked to state the level of their
agreement on preferred house types.
Analytical Method
Statistical analysis was carried out using the IBM Statistical Package for the
Social Science (SPSS) for Windows version 22.0. Exploratory factor analysis was
used to investigate the relationships between the factors and to identify the
unspoken concerns of the respondents behind purchasing a type of residential
property. Principal Component was used as an extraction method and orthogonal
Varimax rotation to optimize the results.
General Characteristics of the Respondents
Referring to Table 2, in terms of age group, majority of respondents (77.5%)
consists of youth aged between 20 to 39 years-old, with 58.3% males and 41.7%
females. For ethnic background, 67.6% were Chinese, followed by Malay
(26.3%) and Indian (4.8%). Majority of the respondents were from higher income
occupations i.e. ‘businessmen, managerial and professionals’ (78.2%) and they
were mostly highly educated.
‘Family and living situation’ data shows that 33.8% of respondents were
singles who live with their parents, singles who live with friends (17.7%), while
married couples with and without children consist of 34.5%. On marital status, a
significant portion was singles (53.9%) as opposed to 46.1% married. Small
households with one or two persons consist of a whopping 43.5% of respondents,
compared to households with three to four persons (36.7%); while larger
households with five and six members only occupied 19.8%.
With regard to main intention to own the property, majority purchased
mainly for own stay (59.2%) as opposed to 40.8% for investment. Slightly more
than half of the potential buyers have owned a property (59.1%) while equally
significant numbers (40.9%) were first-time buyers. On the types of property,
whether they prefer ‘new property’, ‘sub-sale’ or ‘do not mind either’, about half
of the respondents choose ‘new property’ while a significant portion (45%) did
not mind both. In terms of unit size preference, majority (87.2%) choose sizes
between 750 to 2000 square feet.
Majority or 74.5% of the potential purchasers indicated they prefer house
priced below RM600,000, out of which 45.1% were not willing to pay higher
than RM400,000. This was understandable judging from the same data which
pointed out that a significant number or 55.6% of the respondents has household
income of RM6,000 and below. In a property survey data from Q3 2016, the
average house price in Kuala Lumpur was around RM772,126 (NAPIC, 2016)
and the average costs of a 1000 sq. ft. apartment in a typical Malaysian city was
between RM516,700 and RM1.2 million (Numbeo, 2017) Our data revealed that
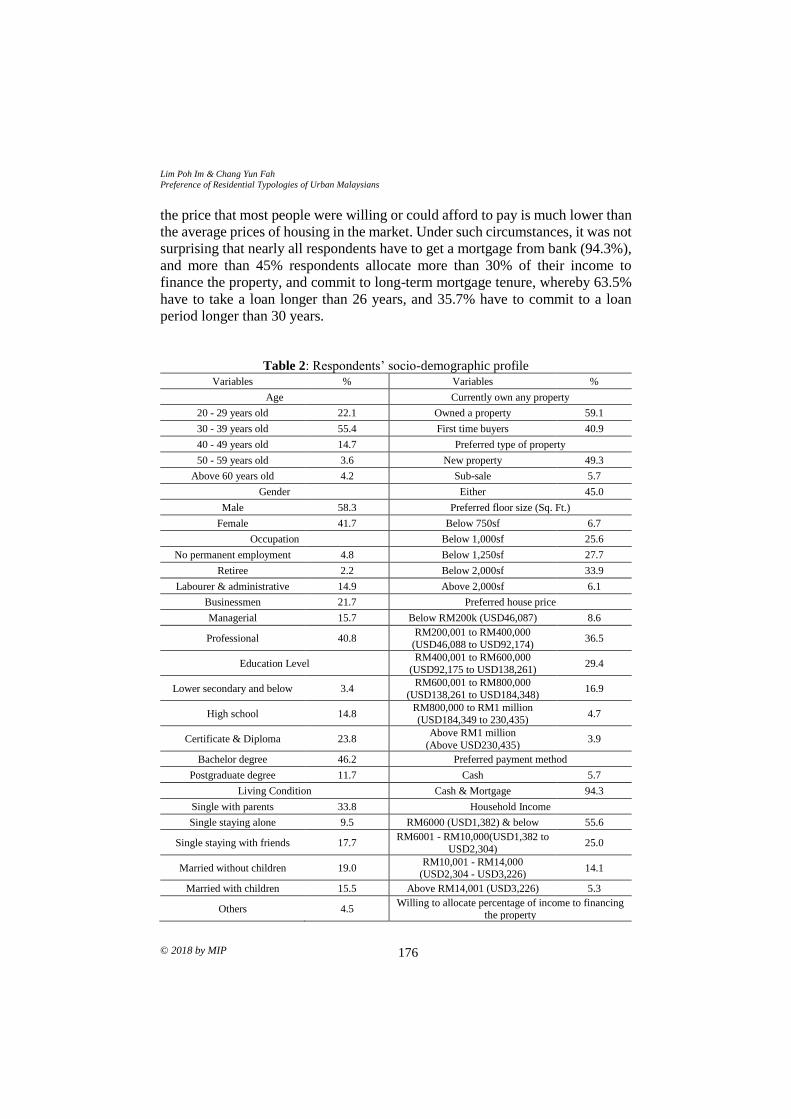
Lim Poh Im & Chang Yun Fah
Preference of Residential Typologies of Urban Malaysians
© 2018 by MIP 176
the price that most people were willing or could afford to pay is much lower than
the average prices of housing in the market. Under such circumstances, it was not
surprising that nearly all respondents have to get a mortgage from bank (94.3%),
and more than 45% respondents allocate more than 30% of their income to
finance the property, and commit to long-term mortgage tenure, whereby 63.5%
have to take a loan longer than 26 years, and 35.7% have to commit to a loan
period longer than 30 years.
Table 2: Respondents’ socio-demographic profile
Variables % Variables %
Age Currently own any property
20 - 29 years old 22.1 Owned a property 59.1
30 - 39 years old 55.4 First time buyers 40.9
40 - 49 years old 14.7 Preferred type of property
50 - 59 years old 3.6 New property 49.3
Above 60 years old 4.2 Sub-sale 5.7
Gender Either 45.0
Male 58.3 Preferred floor size (Sq. Ft.)
Female 41.7 Below 750sf 6.7
Occupation Below 1,000sf 25.6
No permanent employment 4.8 Below 1,250sf 27.7
Retiree 2.2 Below 2,000sf 33.9
Labourer & administrative 14.9 Above 2,000sf 6.1
Businessmen 21.7 Preferred house price
Managerial 15.7 Below RM200k (USD46,087) 8.6
Professional 40.8 RM200,001 to RM400,000
(USD46,088 to USD92,174) 36.5
Education Level RM400,001 to RM600,000
(USD92,175 to USD138,261) 29.4
Lower secondary and below 3.4 RM600,001 to RM800,000
(USD138,261 to USD184,348) 16.9
High school 14.8 RM800,000 to RM1 million
(USD184,349 to 230,435) 4.7
Certificate & Diploma 23.8 Above RM1 million
(Above USD230,435) 3.9
Bachelor degree 46.2 Preferred payment method
Postgraduate degree 11.7 Cash 5.7
Living Condition Cash & Mortgage 94.3
Single with parents 33.8 Household Income
Single staying alone 9.5 RM6000 (USD1,382) & below 55.6
Single staying with friends 17.7 RM6001 - RM10,000(USD1,382 to
USD2,304) 25.0
Married without children 19.0 RM10,001 - RM14,000
(USD2,304 - USD3,226) 14.1
Married with children 15.5 Above RM14,001 (USD3,226) 5.3
Others 4.5 Willing to allocate percentage of income to financing
the property
PLANNING MALAYSIA
Journal of the Malaysia Institute of Planners (2018)
177 © 2018 by MIP
Marital Status Below 20% 18.6
Single 53.9 20.1% - 30% 36.3
Married 46.1 30.1% - 40% 21.4
Number of Family Member 40.1% - 50% 15.5
One person 33.8 Above 50% 8.2
Two persons 9.7 Preferred loan Tenure
Three persons 17.7 Below 10 years 6.6
Four persons 19.0 11 - 15 years 17.8
Five persons 15.5 16 - 25 years 12.1
Six persons 4.3 26 - 30 years 27.8
Purpose of Purchase Above 30 years 35.7
Own stay 59.2 Investment 40.8
Source: Own survey data
RESULTS AND DISCUSSION
Respondents’ Preferences on Various Types of Property
Respondents were asked to state their preferences on the types of residential
properties in 5-level Likert Scale ranged from Least Preferred to Most preferred.
Among various types of property, flat and shop-house have the lowest popularity
where 69.9% and 65.6% of the respondents chose ‘Least Preferred’ and ‘Not
likely’ respectively (Table 3). Townhouse was also not favoured as it manly
occupied the lower tiers of the preference scale.
Accumulatively, double-storey terrace and condominium seemed to be
quite popular among the buyers, with 82.3% and 82.1% potential purchasers
chose “Most Preferred’, ‘I Can Consider’ or ‘Do Not Mind’ respectively. In
particular, double-storey terrace and semi-detached types scored the highest in
‘Most preferred’ category, with 25.9% and 24.8% respectively. Interestingly,
condominium scored the highest in ‘I can consider’ category with 36.3%
compared to 22.8% in the ‘Most preferred’ category. This is similar to double-
storey terrace, where more respondents chose ‘I Can Consider’ (34.7%).
As for apartment and single-storey terrace, data seemed to suggest that
there was a mixed reaction and no strong preference on either extreme ends, with
higher percentage of respondents concentrates in the middle, choosing ‘I don’t
mind’ and ‘I can consider’. For bungalow type, the preference level seemed to
spread quite evenly between those who prefer and not prefer. This suggests that
as much as there were people who prefer bungalow, there were those who do not
fancy them. This may be attributed to affordability concerns.
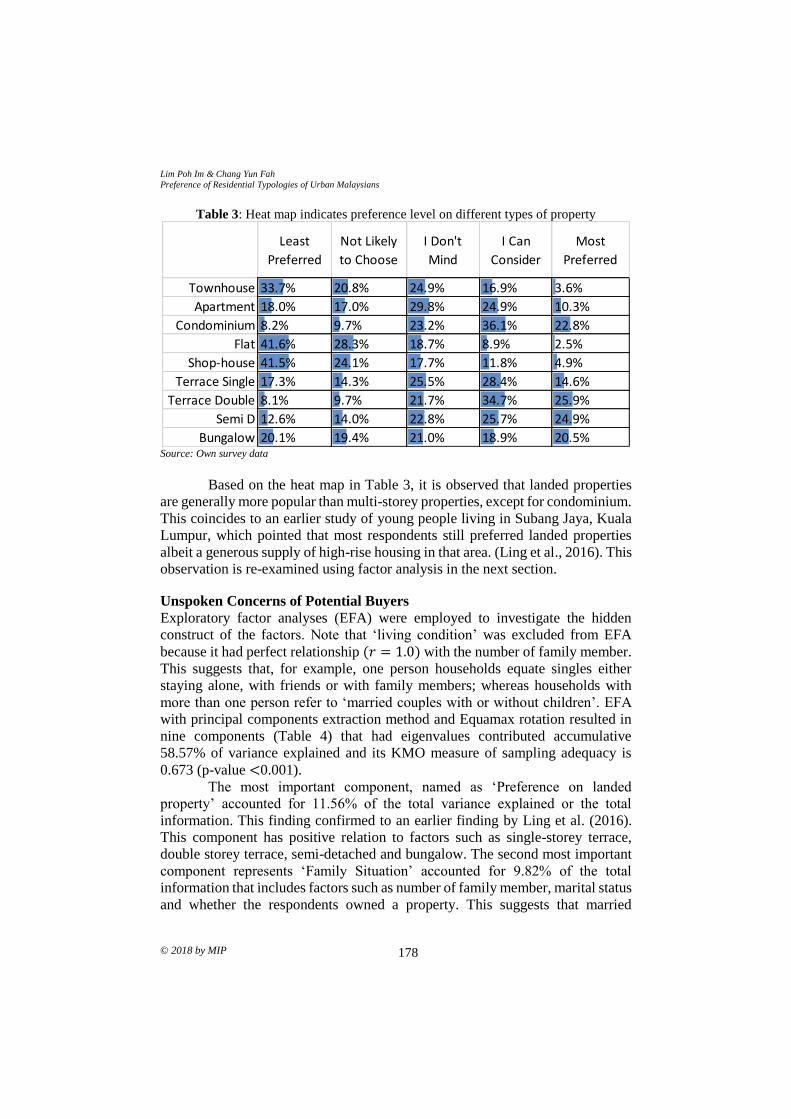
Lim Poh Im & Chang Yun Fah
Preference of Residential Typologies of Urban Malaysians
© 2018 by MIP 178
Table 3: Heat map indicates preference level on different types of property
Source: Own survey data
Based on the heat map in Table 3, it is observed that landed properties
are generally more popular than multi-storey properties, except for condominium.
This coincides to an earlier study of young people living in Subang Jaya, Kuala
Lumpur, which pointed that most respondents still preferred landed properties
albeit a generous supply of high-rise housing in that area. (Ling et al., 2016). This
observation is re-examined using factor analysis in the next section.
Unspoken Concerns of Potential Buyers Exploratory factor analyses (EFA) were employed to investigate the hidden
construct of the factors. Note that ‘living condition’ was excluded from EFA
because it had perfect relationship (𝑟 = 1.0) with the number of family member.
This suggests that, for example, one person households equate singles either
staying alone, with friends or with family members; whereas households with
more than one person refer to ‘married couples with or without children’. EFA
with principal components extraction method and Equamax rotation resulted in
nine components (Table 4) that had eigenvalues contributed accumulative
58.57% of variance explained and its KMO measure of sampling adequacy is
0.673 (p-value <0.001).
The most important component, named as ‘Preference on landed
property’ accounted for 11.56% of the total variance explained or the total
information. This finding confirmed to an earlier finding by Ling et al. (2016).
This component has positive relation to factors such as single-storey terrace,
double storey terrace, semi-detached and bungalow. The second most important
component represents ‘Family Situation’ accounted for 9.82% of the total
information that includes factors such as number of family member, marital status
and whether the respondents owned a property. This suggests that married
Least
Preferred
Not Likely
to Choose
I Don't
Mind
I Can
Consider
Most
Preferred
Townhouse 33.7% 20.8% 24.9% 16.9% 3.6%
Apartment 18.0% 17.0% 29.8% 24.9% 10.3%
Condominium 8.2% 9.7% 23.2% 36.1% 22.8%
Flat 41.6% 28.3% 18.7% 8.9% 2.5%
Shop-house 41.5% 24.1% 17.7% 11.8% 4.9%
Terrace Single 17.3% 14.3% 25.5% 28.4% 14.6%
Terrace Double 8.1% 9.7% 21.7% 34.7% 25.9%
Semi D 12.6% 14.0% 22.8% 25.7% 24.9%
Bungalow 20.1% 19.4% 21.0% 18.9% 20.5%
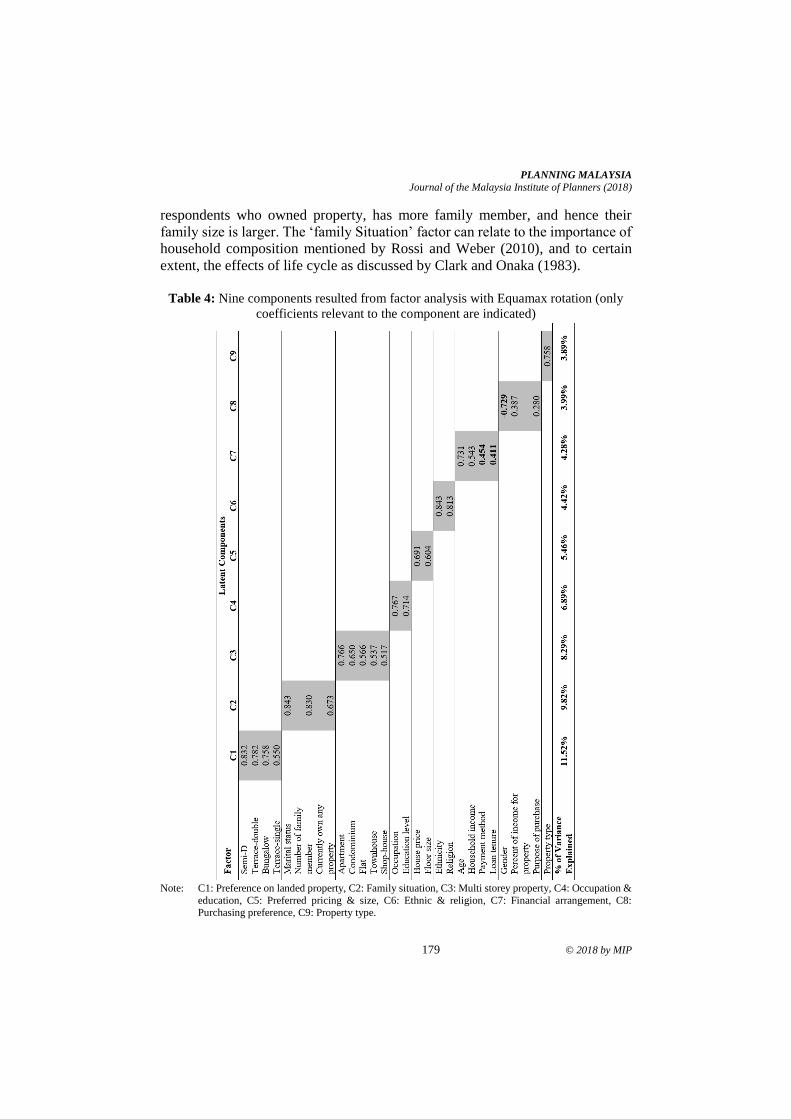
PLANNING MALAYSIA
Journal of the Malaysia Institute of Planners (2018)
179 © 2018 by MIP
respondents who owned property, has more family member, and hence their
family size is larger. The ‘family Situation’ factor can relate to the importance of
household composition mentioned by Rossi and Weber (2010), and to certain
extent, the effects of life cycle as discussed by Clark and Onaka (1983).
Table 4: Nine components resulted from factor analysis with Equamax rotation (only
coefficients relevant to the component are indicated)
Note: C1: Preference on landed property, C2: Family situation, C3: Multi storey property, C4: Occupation &
education, C5: Preferred pricing & size, C6: Ethnic & religion, C7: Financial arrangement, C8: Purchasing preference, C9: Property type.
Lim Poh Im & Chang Yun Fah
Preference of Residential Typologies of Urban Malaysians
© 2018 by MIP 180
The third component represents other types of property contributed
8.29% of the total information. This include apartment, condominium, flat,
townhouse and shop-house. This result revealed that the potential house-buyers
placed higher preference on landed properties than multi-storey properties. Other
components are ‘Occupation and Education’ refer to occupation and education
level of the respondents; ‘Preferred Pricing and Size’ (preferred house price and
floor size); ‘Ethnic and Religion’ (ethnicity and religion of the respondents); and
‘Financial Arrangement’ represents respondent’s age, household income,
preferred loan tenure and payment method. The last two components are
‘Purchasing Preference’ consists of gender, purpose of purchase, and percentage
of income for property, and ‘Property Type’.
While most factors have positive relations with the respective hidden
components, ‘payment method’, ‘loan tenure’ and ‘gender’ showed negative
relations. The explanation could be that for example, an older house buyer with
higher household income tends to get shorter loan tenure by paying with cash,
and hence the ‘financial arrangement’ level was lower. Also, it was observed that
the ‘purchasing preference’ was higher for male who intended to buy house for
own stay will allocate higher portion of income for property.
CONCLUSION
As this study has chosen a sample population from potential buyers at property
fairs, it only represents a segment of Malaysian urban population that has
intentions to purchase properties. Hence the data will not be generalised to the
entire population. This study has tried to discover factors leading to housing
preferences and to make distinctions on the types of residential typologies most
preferred by urban Malaysians. The findings confirmed the issues of mismatch
between preferred house price and affordability, and high reliance on long term
mortgage arrangement. It was also discovered that there were high interests
among younger purchasers despite them facing financial challenges. Factor
Analysis highlighted that landed property remained the most preferred choice as
compared with multi-storey types regardless of respondents’ backgrounds.
Double-storey terrace and condominium seemed to garner higher accumulative
positive preferences. In addition, our data also showed that ‘family situation’ was
the second most important component in the factor analysis, specifically ‘family
size’, ‘marital status’ and ‘whether previously owned a property’ were the major
deciding factors. Owing to this trend, it is suggested that future housing
development could devote resources to assess and match the socio-demographic
profiles of potential purchasers with the types of residential property to offer.
PLANNING MALAYSIA
Journal of the Malaysia Institute of Planners (2018)
181 © 2018 by MIP
ACKNOWLEDGEMENT
This research was conducted under a research fund from Exploratory Research
Grant Scheme (ERGS), Ministry of Higher Education (MOHE) Malaysia. Special
thanks to The Star Property and Mr Michael Geh of Raine & Horne, for their kind
assistance and contribution.
REFERENCES Chia, J., Harun, A., Mohd Kassim, A. W., Martin, D., & Kepal, N. (2016). Understanding
factors that influence house purchase among consumers in Kota Kinabalu: an
application of buyer behaviour model theory. Journal of Technology
Management and Business, 3(2), 94-110.
Clark, W. A. V., & Onaka, J. L. (1983). Life cycle and housing adjustment as explanations
of residential mobility. Urban Studies, 20(1), 47-57.
Coulson, N. E. (1999). Why are Hispanic and Asian-American homeownership rates so
low? Immigration and other factors. Journal of Urban Economics, 45(2), 209-
227.
Goodman, A. C. (1990). Demographic of individual housing demand. Regional Science
and Urban Economics, 20(1), 83-102.
Haurin, D. R., & Kamara, D. (1992). The homeownership decision of female-headed
households. Journal of Housing Economics, 2(4), 293-309.
Haddad, M., Judeh, M., & Haddad, S. (2011). Factors affecting buying behaviour of an
apartment: an empirical investigation in Amman Jordan. Research Journal of
Applied Sciences, Engineering and Technology, 3(3), 234-239.
Ju, S. R., & Omar, S. (2011, October). Housing typology of Modern Malaysia. 1st South
East Asia Housing Forum of ARCH. October 6-7, 2011, Seoul, Korea.
Kohler, M. J. (2013). Why you should be investing your money in real estate. Retrieved
from http://www.entrepreneur.com/article/228506.
Levine, J. (2007). Rethinking accessibility and jobs-housing balance. Journal of the
American Planning Association, 64(2), 133-149.
Ling, O., Mansur, N. A., & Musthafa, S. N. (2016). The housing preference of young
people in Malaysian urban areas: A case study Subang Jaya, Selangor.
Malaysian Journal of Society and Space, 12(7), 60-74.
Numbeo (2017). Property prices in Malaysia. Retrieved from
https://www.numbeo.com/property-investment/country_result.jsp?country=
Malaysia
National Property Information Centre [NAPIC] (2016). Residential property stock tables
Q3 2016. Available at http://napic.jpph.gov.my/portal/key-statistics
Rossi, P. H., & Weber, E. (2010). The social benefits of homeownership: Empirical
evidence from national survey. Housing Policy Debates, 7(1), 1-35.
Reed, R., & Mills, A. (2006). Identifying the drivers behind housing preferences of first-
time owners. Property Management, 25(3), 225-241.
Tan, T. H. (2012). Meeting first-time buyers’ housing needs and preferences in greater
Kuala Lumpur. Cities, 29(6), 389-396.
Tan, T. H. (2009). Home owning motivation, Malaysia. Journal of Accounting, Business
and Management, 1(1), 93-112.
1Assistant Professor at Universiti Teknologi MARA, Malaysia. Email: [email protected] 182
PLANNING MALAYSIA:
Journal of the Malaysian Institute of Planners
VOLUME 16 ISSUE 3 (2018) Page 182 – 196
PROMOTING RURAL TOURISM IN PERAK TENGAH DISTRICT
THROUGH THE EXPANDING OF HERITAGE INTERPRETATION
AND PRESENTATION
Siti Norlizaiha Harun1
Faculty of Architecture, Planning and Surveying
UNIVERSITI TEKNOLOGI MARA, MALAYSIA
Abstract
The State of Perak is known for its richness and uniqueness in history and cultural
heritage. However, the State’s tourism promotion has been focusing more on the
popular destinations, leaving out those with heritage significance especially those
located in the rural area. This is due to limited knowledge on method to interpret
the cultural resources in the rural area, as well as unorganized interpretation
programmes. This research has two aims, which are 1) to identify potential
cultural heritage significance in Perak Tengah; and 2) to outline an interpretation
plan of the potential cultural heritage as new tourist attraction of Perak. This
research involves three stages; observation and inventory of resources, focus
group interview and interpretation proposal. Results from the focus group
discussion indicate the need to customize the interpretation and presentation of
rural heritage especially on physical experience in community cultural activities.
In the end, this study outlines interpretation guidance for heritage site operators
on how visitors can experience the cultural heritage in the rural area.
Keywords: cultural, heritage, interpretation, rural, visitor
PLANNING MALAYSIA
Journal of the Malaysia Institute of Planners (2018)
183 © 2018 by MIP
RESEARCH BACKGROUND
The rural area has a lot of cultural heritage resources in the form of unique culture
and art, traditional knowledge, natural beauty and others. The traditional
activities of rural community do not only benefit the image and appearance of
tourist attractions, but also could be used as resources to increase the income of
the community and as motivation to preserve socio-cultural activities (Susyanti,
2013). The importance of rural cultural resources is recognised in some of the
national policies. For instance, the National Key Result Areas (NKRA) has
identified tourism, as well as agriculture, farming and cottage industry, as areas
to be emphasised in its goal of promoting economic revitalization and thus
prevent migration of population as well as creating a strong encouragement for
rural youth to remain in the village. The National Physical Plan 2 (NPP2) also
highlighted cultural heritage and tourism as important to support the realization
of the New Economic Model and the 1Malaysia Concept (FDCTP, 2016). The
plan’s policy 11 and 12 state that natural tourism resources, the authentic multi-
cultural and historical heritage of the country shall be conserved. Tourism
development zones in each state shall focus on specialized regional niche
products based on their locational advantages and availability of resources.
Similarly, the Ministry of Tourism and Culture also highlights the importance of
cultural heritage and tourism. Its main vision is to develop Malaysia as a world-
class tourist and cultural destination as well as to build the national identity based
on art, culture, and heritage.
The State of Perak is known for its richness and uniqueness of history,
tradition and cultural heritage especially the traditional Malay village. Figure 1
shows the most visited destinations by domestic tourists in Perak for year 2011-
2013 (IDR, 2015). It can be seen that these were all leisure and entertainment
destinations. Meanwhile, none of the cultural heritage destinations such as
cultural community activities and traditions made the list. The Districts of Perak
Tengah, Kuala Kangsar and Hilir Perak have lots of cultural heritage potential to
be promoted especially on village life, arts, culture and agriculture activities.
Therefore, programmes to attract tourists to these cultural heritage destinations
should be encouraged, and the new attractions should be defined and interpret
wisely especially in the rural area so that they can beneficial to the community. It
would take some effort to create effective interpretation – but if it is done right,
it would not only help visitors understand the resources but also contribute to
better management of the tourist attractions and at the same time can generate
more revenues.
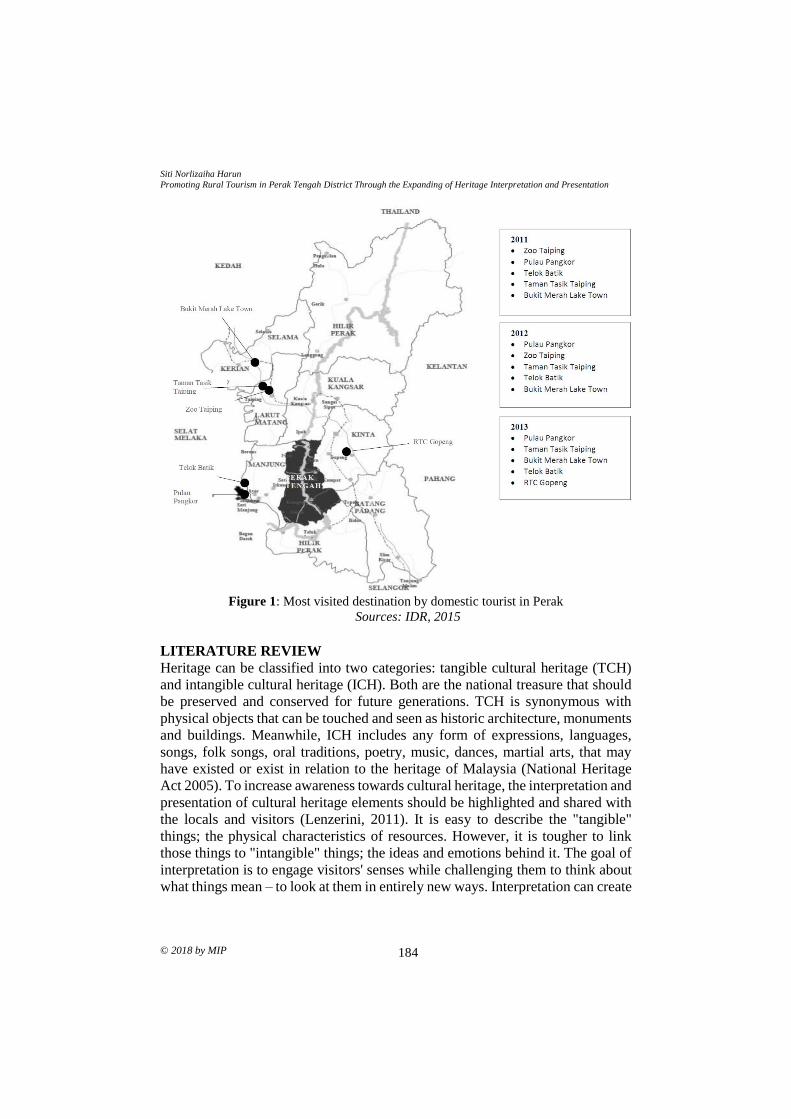
Siti Norlizaiha Harun
Promoting Rural Tourism in Perak Tengah District Through the Expanding of Heritage Interpretation and Presentation
© 2018 by MIP 184
Figure 1: Most visited destination by domestic tourist in Perak
Sources: IDR, 2015
LITERATURE REVIEW
Heritage can be classified into two categories: tangible cultural heritage (TCH)
and intangible cultural heritage (ICH). Both are the national treasure that should
be preserved and conserved for future generations. TCH is synonymous with
physical objects that can be touched and seen as historic architecture, monuments
and buildings. Meanwhile, ICH includes any form of expressions, languages,
songs, folk songs, oral traditions, poetry, music, dances, martial arts, that may
have existed or exist in relation to the heritage of Malaysia (National Heritage
Act 2005). To increase awareness towards cultural heritage, the interpretation and
presentation of cultural heritage elements should be highlighted and shared with
the locals and visitors (Lenzerini, 2011). It is easy to describe the "tangible"
things; the physical characteristics of resources. However, it is tougher to link
those things to "intangible" things; the ideas and emotions behind it. The goal of
interpretation is to engage visitors' senses while challenging them to think about
what things mean – to look at them in entirely new ways. Interpretation can create
PLANNING MALAYSIA
Journal of the Malaysia Institute of Planners (2018)
185 © 2018 by MIP
memorable and meaningful experiences for visitors, and inspire them to learn
more (Lancaster County Planning Commission, 2002).
The cultural heritage resources are widely available in the rural area in
the form of a unique culture and art, expertise and traditional knowledge, natural
beauty, ecological resources and others, and very representative of the
community culture. They enhance the image and appearance of tourist attractions,
and also could be used as resources to increase the income of the community and
as motivation to preserve socio-cultural activities (Susyanti, 2013). Tourists are
very interested to see how life or culture and heritage interpretation that can help
enrich their experience. They are seeking to understand the sense of place in
communities which are unique personalities. All these can be seen in the rural
area. According to Saidatulakmal (2012), the terms rural tourism and heritage
tourism are commonly used in tourism industry to refer to any form of tourism
that showcase the rural life, art, culture and heritage at rural location, thereby
benefiting the local community economically and socially as well as enabling
interactions between tourists and locals for more enriching tourism experiences.
Interpretation Principles
Interpretation is an informational and inspirational process including educational
activities that aim to reveal meanings of our cultural and natural resources. Tilden
(1977) established six principles of interpretation, which have been referred to in
preparing interpretation programme of heritage sites worldwide. These principles
are:
i. Any interpretation that does not somehow relate what is being displayed
or described to something within the personality or experience of the
visitor will be sterile.
ii. Information, as such, is not interpretation. Interpretation is revelation
based upon information.
iii. Interpretation is an art, which combines many arts, whether the materials
presented are scientific, historical or architectural.
iv. The chief aim of interpretation is not instruction, but provocation.
v. Interpretation should aim to present a whole rather than apart and must
address itself to the whole man rather than any phase.
vi. Interpretation addressed to children (say, up to the age of 12) should not
be a dilution of the presentation to adults, but should follow a
fundamentally different approach.
To fit today's world on interpretation, Knudson, Beck and Cable (2003),
and Beck and Cable (2011) have updated Tilden’s principles by adding new
principles that provide a more elaborate interpretative philosophy that focuses
more on the interpreter’s role and method of interpretation. According to Beck
and Cable (2011), every place has a history, and interpretation can bring the past
Siti Norlizaiha Harun
Promoting Rural Tourism in Perak Tengah District Through the Expanding of Heritage Interpretation and Presentation
© 2018 by MIP 186
alive to make the present more enjoyable and the future more meaningful. To
achieve this, interpreters must concern themselves with the quantity and quality
of information presented. Focused and well-researched interpretation will be
more powerful than longer discourse. Quality interpretation depends on the
interpreter's knowledge and skill, which must be continually developed over time
and at the end of the interpretation should instil in the people ability, and the
desire, to sense the beauty of their surroundings and could provide spiritual uplift
and to encourage resource preservation. International Council of Monuments and
Sites (ICOMOS) Charter (1999) gives a guiding direction on what heritage
interpretation programmes should be considered. The main aspects are retention
of the heritage authenticity and culture experiences which include:
i. Enhance the appreciation and understanding of that cultural heritage;
ii. Present the significance of the culture in a relevant and accessible
manner;
iii. Use appropriate, stimulating and contemporary forms of education,
technology, and personal explanations;
iv. Encourage high levels of public awareness and support of heritage;
v. Encourage visitors to experience the wider cultural/natural heritage of
the region; and
vi. Involvement of all parties, including the local and/or indigenous
community representatives is necessary to achieve a sustainable tourism
industry.
Interpretation can be used to promote cultural heritage to build national,
regional, and community identities. Many visitors want to learn about the places
they visit and interpretation can convey factual material, for examples the history
of the buildings, their architectural styles and their building technique (Aplin,
2002; Timothy, 2011). The goal of interpretation is not instruction but to change
attitudes and behaviour, to motivate and inspire, and to take information and
make it meaningful and exciting. Interpretation is not just glossy brochures,
appropriate signage, and well-edited videos; it is the art of telling a story of a
community. The interpretation story can inspire and will provoke people to
broaden their knowledge (National Trust of Australia, 2014). The daily life also
can be subjects of interpretation for the visitors. The experiences of spending a
few days immersed in a village's way of life will stay with tourists for longer than
if they had spent the time looking at the monument or building. The tourist seeks
various physical experiences and satisfaction. The nature of these will largely
determine the destination chosen and the activities enjoyed (Goeldner, 2000).
Interpretation Practices
Studies on heritage interpretation and presentation worldwide, commonly
highlight the issues and challenges of managing tourist in heritage sites. How to
PLANNING MALAYSIA
Journal of the Malaysia Institute of Planners (2018)
187 © 2018 by MIP
do the best interpretation of heritage and give the best experience to the visitors?
A lot of unfavourable factors have been identified by Asfaw and Gebreslassie
(2016), like the limited capacity of heritage interpreters and lack of organized
interpretation and presentation. Most of the heritage interpretation and
presentation manuals and guidelines by European countries have structured and
organized interpretation practice into three steps (Lancaster County Planning
Commission, 2002; FI NTDA, 2012; Tilkin, 2013). The first step is to make an
inventory of heritage resources, next is to define significance and third is the
development of the story through an effective media. To achieve good
interpretation, Binoy (2011) emphasised that the role of interpreters at heritage
sites must provoke curiosity, attention, and interest among the visitors to listen,
participate and actively involved in the heritage interpretation process. However,
Leanza, Porto, Sapienza and Cascone (2016) highlighted that the tourist
itineraries are seen as good opportunities for the development of tourism in the
rural areas that possess natural or cultural resources. According to Leanza et al.
(2016), heritage interpretation-based itinerary is able to influence tourists who
visit famous rural heritage site, to extend their stay in the related rural area and,
as a consequence, consume more tourist products. Tourist itinerary needs to be
supported by suitable interpretation media and connects several heritage
attractions located in a given rural area with a heritage site selected as a tourist
catalyst.
The important criteria in creating interpretation are to know the audience.
Interpreters must know who are the visitors; will they understand and appreciate
what they are told through the interpretaion? The best way to tell a story is to
depend on the physical features that are connected with the story. Good
interpretation is about "show and tell", for example, if we discuss how to make
traditional food, the visitors will want to see a demonstration of the cooking
process. Good interpretation will inspire future exploration.
Harun (2007) has explored the different interpretation between two
historical sites in Perak; Kellie’s Castle and Pasir Salak Historical Complex. The
interpretation of Kellie’s Castle came from the building itself which displays the
architecture and history of the castle. However, interpretation of Pasir Salak
Historical Complex is through the creating of interpretation elements, which
associates the site and the history of Malay heroes against the first British
Resident of Perak, J.W.W. Birch whom was assassinated in 1875.The
interpretation elements including the diorama at the historical time tunnel gallery,
traditional Perak house, and memorial monuments.
Ahmad (2012) applied interpretation concepts towards restoration work
of heritage buildings. He found that historical buildings have intrinsic values that
need to be explored through suitable interpretation medium. He also suggested
that it is necessary to establish authentic assessment and validated interpretations
of heritage resources. Authenticity in heritage is very important because the
Siti Norlizaiha Harun
Promoting Rural Tourism in Perak Tengah District Through the Expanding of Heritage Interpretation and Presentation
© 2018 by MIP 188
genuine historic building preservation will provoke the visitor's intention and
gives distinctive experiences.
STUDY AREA
The District of Perak Tengah has a lot of cultural heritage potentials which can
be developed as tourism attractions and destinations. The Perak Tengah District
Local Plan 2013 has proposed the strategies to strengthen and utilise all tourism
potentials in the rural area, especially the activities that are based on history and
water (Perak River). The plan also specifies that all tourism activities need to be
supported with appropriate infrastructure for visitors convenience. The Plan’s
main proposal of tourism strengthening includes current cultural resources;
promoting Pasir Salak Historical Complex, promoting handcraft industries and
developing royal tombs as tourist attraction. Other tourism resources needed to
be improved are Terrapin Wildlife Conservation Centre, Dato Sagor Motor
Sports Circuit and Parit Town. Additionally, the Plan proposes the development
of a tourist information centre in the District.
Based on authors’ observation and interviews, potential cultural heritage
attractions in the District have their own identities and located on route that can
be linked to allow easy exploration by visitors. Unfortunately, these attractions
are not being promoted sufficiently and lacking on-site support facilities
especially in terms of interpretation and presentation. This included incomplete
tourist itinerary document, limited interpreters, unclear tourist trail and lack of
information on heritage resources.
The study area for this research involves the 69 kampung (villages) along
Perak River in Perak Tengah District. The villages along Perak River are very
attractive with unique and pleasant panorama of village and farming areas. The
communities are also active with their culture activities. All these represent the
rural heritage image that should be given priority to be highlighted as new tourism
products.
RESEARCH METHODOLOGY
Data collection was carried out through inventory and mapping of cultural
heritage significance, and focus group interviews. The focus group consisted of
21 tourist operators and homestay owners in Perak Tengah District (Table 1). The
interviews sought to identify which cultural resources should be highlighted in
Perak Tengah, what are the existing interpretation medium, what should be the
interpretation programmes to promote rural cultural heritage resources, and what
would be the threats and challenges.
Table 1: List of homestay/accommodation in Perak Tengah District
No. Homestay/Accommodation Address/Location
1 Green Village Resort Pasir Salak
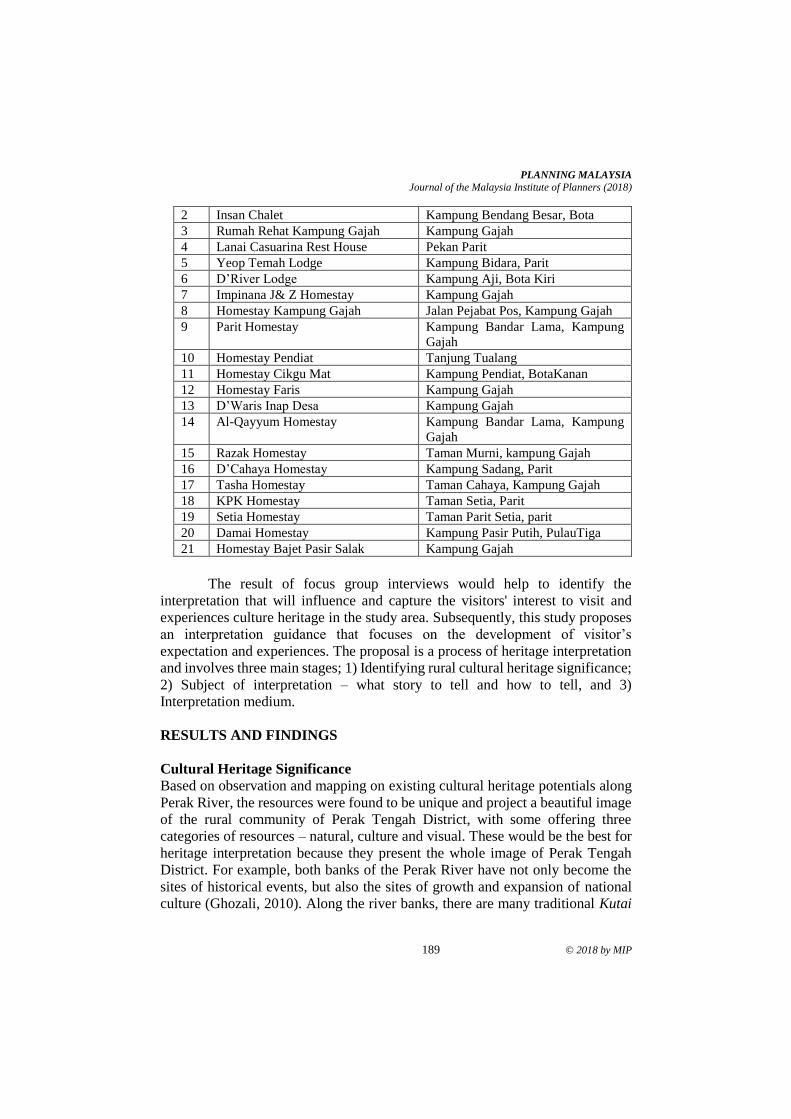
PLANNING MALAYSIA
Journal of the Malaysia Institute of Planners (2018)
189 © 2018 by MIP
2 Insan Chalet Kampung Bendang Besar, Bota
3 Rumah Rehat Kampung Gajah Kampung Gajah
4 Lanai Casuarina Rest House Pekan Parit
5 Yeop Temah Lodge Kampung Bidara, Parit
6 D’River Lodge Kampung Aji, Bota Kiri
7 Impinana J& Z Homestay Kampung Gajah
8 Homestay Kampung Gajah Jalan Pejabat Pos, Kampung Gajah
9 Parit Homestay Kampung Bandar Lama, Kampung
Gajah
10 Homestay Pendiat Tanjung Tualang
11 Homestay Cikgu Mat Kampung Pendiat, BotaKanan
12 Homestay Faris Kampung Gajah
13 D’Waris Inap Desa Kampung Gajah
14 Al-Qayyum Homestay Kampung Bandar Lama, Kampung
Gajah
15 Razak Homestay Taman Murni, kampung Gajah
16 D’Cahaya Homestay Kampung Sadang, Parit
17 Tasha Homestay Taman Cahaya, Kampung Gajah
18 KPK Homestay Taman Setia, Parit
19 Setia Homestay Taman Parit Setia, parit
20 Damai Homestay Kampung Pasir Putih, PulauTiga
21 Homestay Bajet Pasir Salak Kampung Gajah
The result of focus group interviews would help to identify the
interpretation that will influence and capture the visitors' interest to visit and
experiences culture heritage in the study area. Subsequently, this study proposes
an interpretation guidance that focuses on the development of visitor’s
expectation and experiences. The proposal is a process of heritage interpretation
and involves three main stages; 1) Identifying rural cultural heritage significance;
2) Subject of interpretation – what story to tell and how to tell, and 3)
Interpretation medium.
RESULTS AND FINDINGS
Cultural Heritage Significance
Based on observation and mapping on existing cultural heritage potentials along
Perak River, the resources were found to be unique and project a beautiful image
of the rural community of Perak Tengah District, with some offering three
categories of resources – natural, culture and visual. These would be the best for
heritage interpretation because they present the whole image of Perak Tengah
District. For example, both banks of the Perak River have not only become the
sites of historical events, but also the sites of growth and expansion of national
culture (Ghozali, 2010). Along the river banks, there are many traditional Kutai
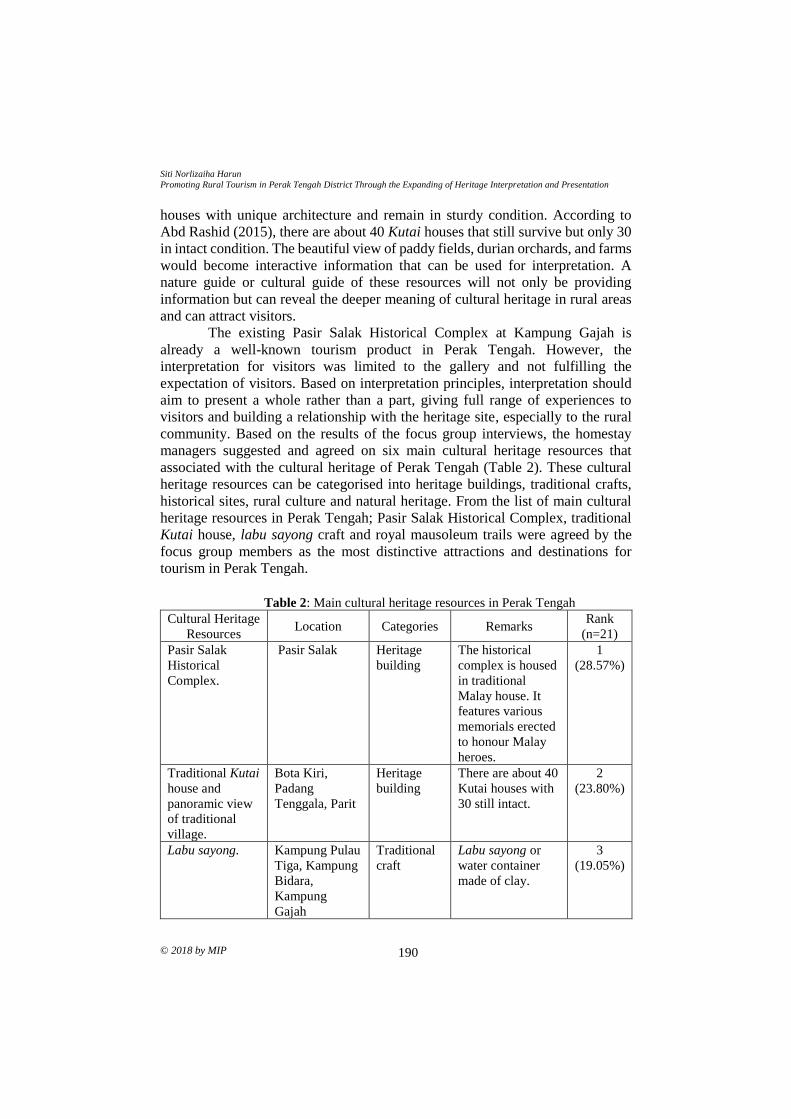
Siti Norlizaiha Harun
Promoting Rural Tourism in Perak Tengah District Through the Expanding of Heritage Interpretation and Presentation
© 2018 by MIP 190
houses with unique architecture and remain in sturdy condition. According to
Abd Rashid (2015), there are about 40 Kutai houses that still survive but only 30
in intact condition. The beautiful view of paddy fields, durian orchards, and farms
would become interactive information that can be used for interpretation. A
nature guide or cultural guide of these resources will not only be providing
information but can reveal the deeper meaning of cultural heritage in rural areas
and can attract visitors.
The existing Pasir Salak Historical Complex at Kampung Gajah is
already a well-known tourism product in Perak Tengah. However, the
interpretation for visitors was limited to the gallery and not fulfilling the
expectation of visitors. Based on interpretation principles, interpretation should
aim to present a whole rather than a part, giving full range of experiences to
visitors and building a relationship with the heritage site, especially to the rural
community. Based on the results of the focus group interviews, the homestay
managers suggested and agreed on six main cultural heritage resources that
associated with the cultural heritage of Perak Tengah (Table 2). These cultural
heritage resources can be categorised into heritage buildings, traditional crafts,
historical sites, rural culture and natural heritage. From the list of main cultural
heritage resources in Perak Tengah; Pasir Salak Historical Complex, traditional
Kutai house, labu sayong craft and royal mausoleum trails were agreed by the
focus group members as the most distinctive attractions and destinations for
tourism in Perak Tengah.
Table 2: Main cultural heritage resources in Perak Tengah
Cultural Heritage
Resources Location Categories Remarks
Rank
(n=21)
Pasir Salak
Historical
Complex.
Pasir Salak Heritage
building
The historical
complex is housed
in traditional
Malay house. It
features various
memorials erected
to honour Malay
heroes.
1
(28.57%)
Traditional Kutai
house and
panoramic view
of traditional
village.
Bota Kiri,
Padang
Tenggala, Parit
Heritage
building
There are about 40
Kutai houses with
30 still intact.
2
(23.80%)
Labu sayong. Kampung Pulau
Tiga, Kampung
Bidara,
Kampung
Gajah
Traditional
craft
Labu sayong or
water container
made of clay.
3
(19.05%)
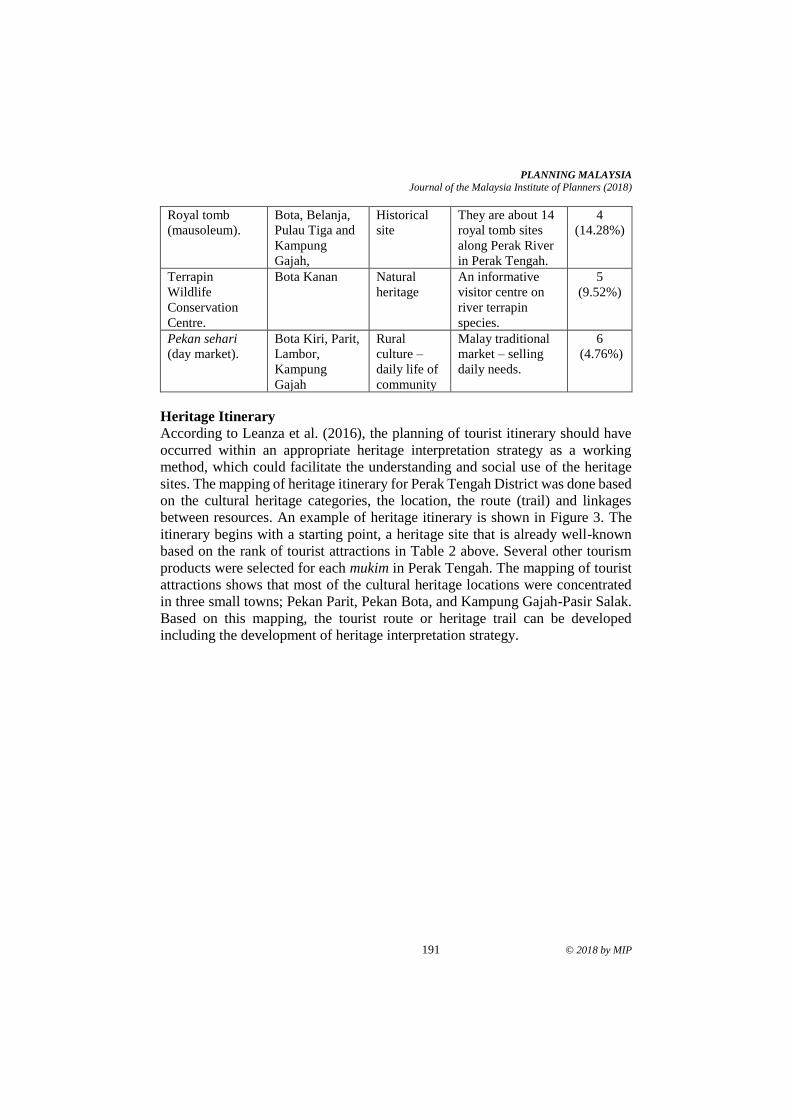
PLANNING MALAYSIA
Journal of the Malaysia Institute of Planners (2018)
191 © 2018 by MIP
Royal tomb
(mausoleum).
Bota, Belanja,
Pulau Tiga and
Kampung
Gajah,
Historical
site
They are about 14
royal tomb sites
along Perak River
in Perak Tengah.
4
(14.28%)
Terrapin
Wildlife
Conservation
Centre.
Bota Kanan Natural
heritage
An informative
visitor centre on
river terrapin
species.
5
(9.52%)
Pekan sehari
(day market).
Bota Kiri, Parit,
Lambor,
Kampung
Gajah
Rural
culture –
daily life of
community
Malay traditional
market – selling
daily needs.
6
(4.76%)
Heritage Itinerary
According to Leanza et al. (2016), the planning of tourist itinerary should have
occurred within an appropriate heritage interpretation strategy as a working
method, which could facilitate the understanding and social use of the heritage
sites. The mapping of heritage itinerary for Perak Tengah District was done based
on the cultural heritage categories, the location, the route (trail) and linkages
between resources. An example of heritage itinerary is shown in Figure 3. The
itinerary begins with a starting point, a heritage site that is already well-known
based on the rank of tourist attractions in Table 2 above. Several other tourism
products were selected for each mukim in Perak Tengah. The mapping of tourist
attractions shows that most of the cultural heritage locations were concentrated
in three small towns; Pekan Parit, Pekan Bota, and Kampung Gajah-Pasir Salak.
Based on this mapping, the tourist route or heritage trail can be developed
including the development of heritage interpretation strategy.
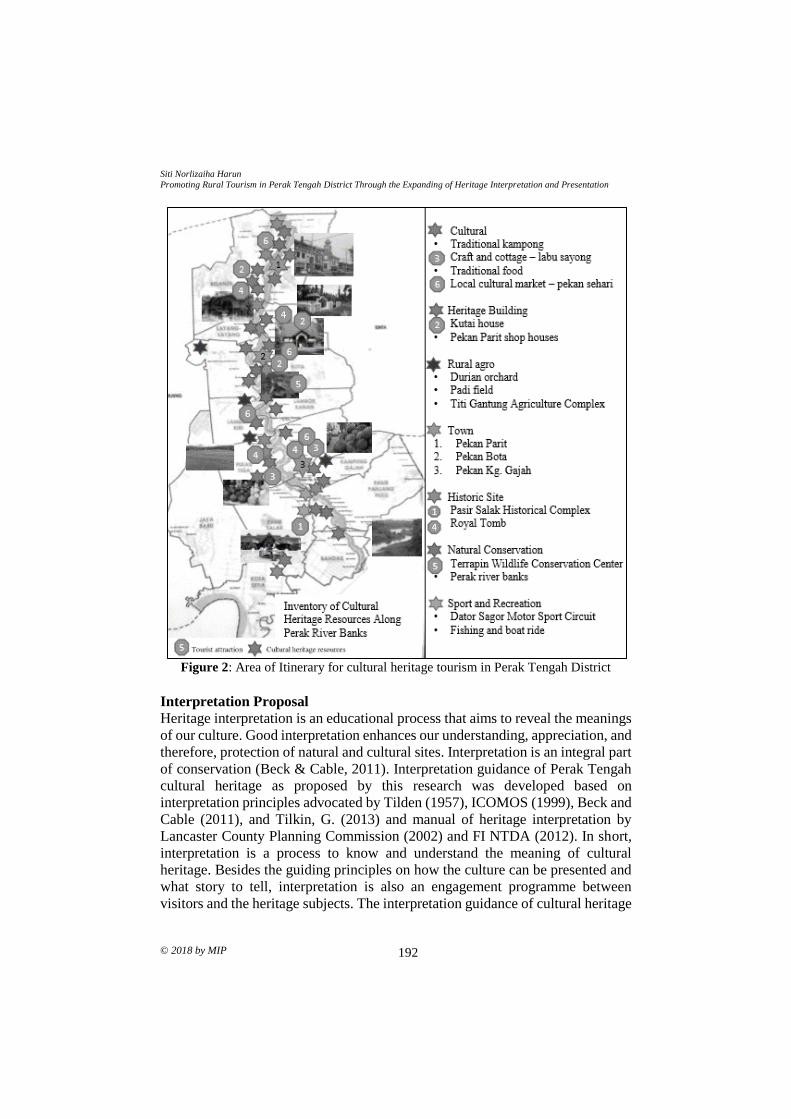
Siti Norlizaiha Harun
Promoting Rural Tourism in Perak Tengah District Through the Expanding of Heritage Interpretation and Presentation
© 2018 by MIP 192
Figure 2: Area of Itinerary for cultural heritage tourism in Perak Tengah District
Interpretation Proposal
Heritage interpretation is an educational process that aims to reveal the meanings
of our culture. Good interpretation enhances our understanding, appreciation, and
therefore, protection of natural and cultural sites. Interpretation is an integral part
of conservation (Beck & Cable, 2011). Interpretation guidance of Perak Tengah
cultural heritage as proposed by this research was developed based on
interpretation principles advocated by Tilden (1957), ICOMOS (1999), Beck and
Cable (2011), and Tilkin, G. (2013) and manual of heritage interpretation by
Lancaster County Planning Commission (2002) and FI NTDA (2012). In short,
interpretation is a process to know and understand the meaning of cultural
heritage. Besides the guiding principles on how the culture can be presented and
what story to tell, interpretation is also an engagement programme between
visitors and the heritage subjects. The interpretation guidance of cultural heritage
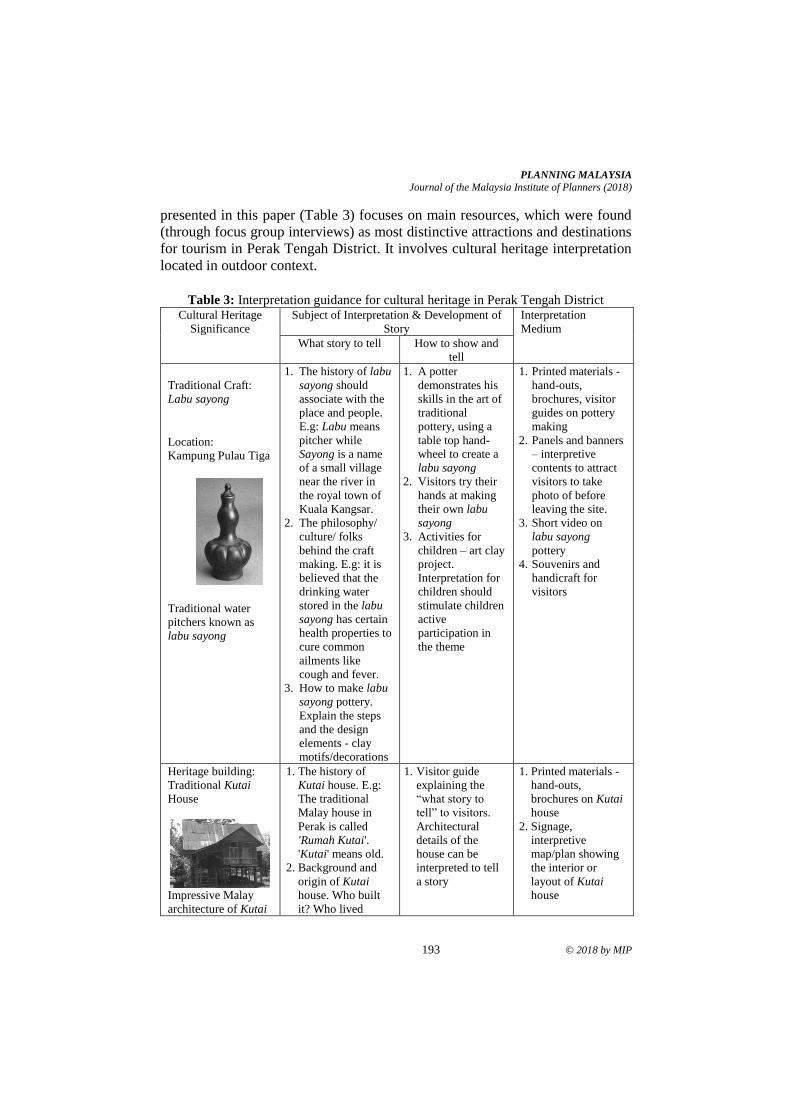
PLANNING MALAYSIA
Journal of the Malaysia Institute of Planners (2018)
193 © 2018 by MIP
presented in this paper (Table 3) focuses on main resources, which were found
(through focus group interviews) as most distinctive attractions and destinations
for tourism in Perak Tengah District. It involves cultural heritage interpretation
located in outdoor context.
Table 3: Interpretation guidance for cultural heritage in Perak Tengah District
Cultural Heritage
Significance
Subject of Interpretation & Development of
Story
Interpretation
Medium
What story to tell How to show and
tell
Traditional Craft:
Labu sayong
Location:
Kampung Pulau Tiga
Traditional water
pitchers known as
labu sayong
1. The history of labu
sayong should
associate with the
place and people.
E.g: Labu means
pitcher while
Sayong is a name
of a small village
near the river in
the royal town of
Kuala Kangsar.
2. The philosophy/
culture/ folks
behind the craft
making. E.g: it is
believed that the
drinking water
stored in the labu
sayong has certain
health properties to
cure common
ailments like
cough and fever.
3. How to make labu
sayong pottery.
Explain the steps
and the design
elements - clay
motifs/decorations
1. A potter
demonstrates his
skills in the art of
traditional
pottery, using a
table top hand-
wheel to create a
labu sayong
2. Visitors try their
hands at making
their own labu
sayong
3. Activities for
children – art clay
project.
Interpretation for
children should
stimulate children
active
participation in
the theme
1. Printed materials -
hand-outs,
brochures, visitor
guides on pottery
making
2. Panels and banners
– interpretive
contents to attract
visitors to take
photo of before
leaving the site.
3. Short video on
labu sayong
pottery
4. Souvenirs and
handicraft for
visitors
Heritage building:
Traditional Kutai
House
Impressive Malay
architecture of Kutai
1. The history of
Kutai house. E.g:
The traditional
Malay house in
Perak is called
'Rumah Kutai'.
'Kutai' means old.
2. Background and
origin of Kutai
house. Who built
it? Who lived
1. Visitor guide
explaining the
“what story to
tell” to visitors.
Architectural
details of the
house can be
interpreted to tell
a story
1. Printed materials -
hand-outs,
brochures on Kutai
house
2. Signage,
interpretive
map/plan showing
the interior or
layout of Kutai
house
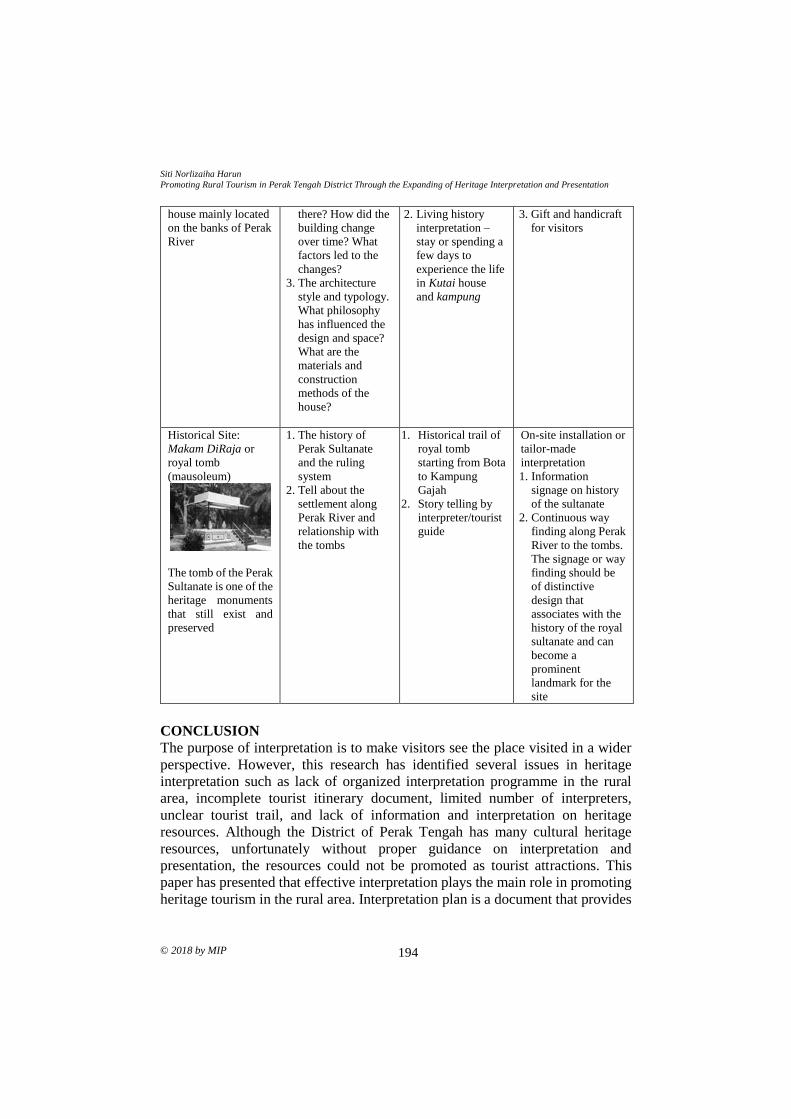
Siti Norlizaiha Harun
Promoting Rural Tourism in Perak Tengah District Through the Expanding of Heritage Interpretation and Presentation
© 2018 by MIP 194
house mainly located
on the banks of Perak
River
there? How did the
building change
over time? What
factors led to the
changes?
3. The architecture
style and typology.
What philosophy
has influenced the
design and space?
What are the
materials and
construction
methods of the
house?
2. Living history
interpretation –
stay or spending a
few days to
experience the life
in Kutai house
and kampung
3. Gift and handicraft
for visitors
Historical Site:
Makam DiRaja or
royal tomb
(mausoleum)
The tomb of the Perak
Sultanate is one of the
heritage monuments
that still exist and
preserved
1. The history of
Perak Sultanate
and the ruling
system
2. Tell about the
settlement along
Perak River and
relationship with
the tombs
1. Historical trail of
royal tomb
starting from Bota
to Kampung
Gajah
2. Story telling by
interpreter/tourist
guide
On-site installation or
tailor-made
interpretation
1. Information
signage on history
of the sultanate
2. Continuous way
finding along Perak
River to the tombs.
The signage or way
finding should be
of distinctive
design that
associates with the
history of the royal
sultanate and can
become a
prominent
landmark for the
site
CONCLUSION
The purpose of interpretation is to make visitors see the place visited in a wider
perspective. However, this research has identified several issues in heritage
interpretation such as lack of organized interpretation programme in the rural
area, incomplete tourist itinerary document, limited number of interpreters,
unclear tourist trail, and lack of information and interpretation on heritage
resources. Although the District of Perak Tengah has many cultural heritage
resources, unfortunately without proper guidance on interpretation and
presentation, the resources could not be promoted as tourist attractions. This
paper has presented that effective interpretation plays the main role in promoting
heritage tourism in the rural area. Interpretation plan is a document that provides
PLANNING MALAYSIA
Journal of the Malaysia Institute of Planners (2018)
195 © 2018 by MIP
the process and strategies for interpretation and presentation of heritage. The plan
identifies the heritage itinerary, key themes, storylines, and audiences and
provides recommendations about interpretation media. It includes practical and
specific advices on how to implement the plan. There is no doubt that formulating
the interpretation plan will be a challenging one for those involved, but the results
will be rewarding.
ACKNOWLEDGMENT
The authors would like to thank the Academic Affair Office, Universiti Teknologi
MARA Perak Branch, for partly funding this study. The authors would also like
to thank Majlis Daerah Perak Tengah, students of Town and Regional Planning
Programme of UITM Perak Branch, and all individuals who have contributed to
this study.
REFERENCES Abd Rashid, M. S. (2015). Understanding the past for a sustainable future: Cultural
mapping of Malay heritage. Procedia - Social and Behavioral Sciences, 170,
10-17.
Ahmad, A. G. (2012). Heritage interpretation in building conservation. Melaka Journal
of Heritage, 1, 30-39.
Aplin, G. (2002). Heritage: Identification, conservation and management. Oxford:
Oxford University Press.
Asfaw, G. W., & Gebreslassie, D. G. (2016). Heritage interpretation and
presentation practices in Tigray, Northern Ethiopia: Cases from the
Wukro Tourism Cluster. Journal of Tourism Culture and Territorial
Development, 7(14), 128-155.
Beck, L., & Cable, T. T. (2011). The gifts of interpretation: Fifteen guiding principles for
interpreting nature and culture (3rd Edition). Champaign, IL: Sagamore
Publishing.
Binoy, T. A. (2011). Archaeological and heritage tourism interpretation. South East Asian
Journal of Tourism and Heritage, 4(1), 100-105.
Fáilte Ireland National Tourism Development Authority [FI NTDA] (2012). Sharing our
stories: Using interpretation to improve the visitors’ experience at heritage
sites. (n.p).
Federal Department of Town and Country Planning Peninsular Malaysia [FDTCP]
(2016). Rancangan Fizikal Negara 2.
Ghozali, M. (2010). Kampung-kampung tersohor: Di sepanjang Sungai Perak = Famous
villages: Along the Perak river. Perak: Institut Darul Ridzuan.
Goeldner, C. R. (2000). Tourism principle, practice and philosophy. New York: John
Willey and Sons Inc.
Harun, S. N. (2007, July). Interpretasi dan persembahan tapak warisan kajian kes
Kompleks Sejarah Pasir Salak dan Istana Kellie. Conference on Scientific and
Social Research. July 3-5, 2007, Petaling Jaya, Selangor, Malaysia.
ICOMOS (1999). ICOMOS international cultural tourism charter: Managing tourism at
places of heritage significance. Mexico: ICOMOS
Siti Norlizaiha Harun
Promoting Rural Tourism in Perak Tengah District Through the Expanding of Heritage Interpretation and Presentation
© 2018 by MIP 196
Institut Darul Ridzuan [IDR] (2015). Is Domestic Tourism Vital? The Perak Scenario.
IDR Perspective, 1, 9-11.
Knudson, D. M., Beck, L., & Cable, T. T. (2003). Interpretation of cultural and natural
resources. University of Minnesota: Venture Publication.
Lancaster County Planning Commission (2002). Telling our stories: An interpretation
manual for heritage partners. Lancaster, Pennsylvania: Author.
Leanza, M., Porto, S. M. C., Sapienza, V., & Cascone, S. M. (2016). A heritage
interpretation-based itinerary to enhance tourist use of traditional rural
buildings. Sustainability, 8(1), 47.
Lenzerini, F. (2011). Intangible cultural heritage: The living culture of peoples. European
Journal of International Law, 22(1), 101-120.
National Heritage Act 2005 (Act 645) (Malaysia).
National Trust of Australia. (2014). Towards a better practice in effective heritage
interpretation. (n.p.): Author.
Saidatulakmal, M. (2012). Cottage tourism for rural development. International
Proceedings of Economic Development and Research, 50(2), 6-9.
Susyanti, D. W. (2013). Potensi Desa Melalui Parawasita Pedesaan. Journal Ekonomi dan
Bisnis, Vol 12, No 1, Jun 2013, 33-36
Tilden, F. (1977). Interpreting our heritage (3rd Edition). Chapel Hill: University of
North Carolina Press.
Tilkin, G. (2013). Professional development in heritage interpretation manual. Bilzen:
Author.
Timothy, D. J. (2011). Cultural heritage and tourism: An introduction. Toronto: Channel
View Publications.
1Email: [email protected] 197
PLANNING MALAYSIA:
Journal of the Malaysian Institute of Planners
VOLUME 16 ISSUE 3 (2018) Page 197 – 207
THE DEMAND OF RECREATIONAL FACILITIES
IN NEIGHBOURHOOD PARKS: VISITORS’ PERSPECTIVES
Ahmad Nazrin Aris Anuar1 & Nur Hafidzah Muhamadan2
Faculty of Architecture, Planning and Surveying
UNIVERSITI TEKNOLOGI MARA, MALAYSIA
Abstract
The role of neighbourhood parks is becoming more significant to visitors as a
recreational place. However, some recreational facilities are far from being
preferred, thus become idle and unutilised. This study determines the demands
for recreational facilities from the standpoint of the visitors. Hence, the objective
of this study is to evaluate the demand for recreational facilities in a
neighbourhood park. This study applied quantitative approach by using
questionnaire survey to obtain data from visitors at five neighbourhood parks in
the Petaling District. The findings showed that most respondents preferred
“slightly agree” to “agree” and “slightly satisfied” to “satisfied” in regard to the
demands of active and passive recreational facilities in neighbourhood parks. It
is hoped that the findings of this study offer viable information for policymakers
and planners in providing recreational facilities that are conducive in
neighbourhood parks.
Keywords: active activity, demand, facility, neighbourhood park, passive
activity, recreation, visitors
Ahmad Nazrin Aris Anuar & Nur Hafidzah Muhamadan
The Demand of Recreational Facilities in Neighbourhood Parks: Visitors’ Perspectives
© 2018 by MIP 198
INTRODUCTION
The development policy of open space and recreation has been applied in the
public parks by the relevant national authority. However, this planning and
development policy has been interpreted in a different way, causing inconsistent
execution at the state and local authority levels. This has created queries
concerning the development of public parks, including the provision of a public
park. The provision of a public park is still at a low standard and insufficient to
cater to the demand of visitors due to its inappropriate placement. To resolve this
predicament, the planning guidelines for open space and recreation need to be
enhanced so as to ensure that the development of open space is more organised
and meets the principles of urban planning and development. According to the
Department of Town and Country Planning (2013), the scope of this guideline is
more detailed on the aspects of the design principles, while the general guidelines
are meant for the provision of open space and recreational areas. The provision
of open space, including areas allowed to be used in all public parks, is under the
supervision of local authorities. However, these guidelines are not specific to the
recreational facilities mainly in the neighbourhood park, hence the question
related to the demand for recreational facilities. This topic has been probed by
several researchers, such as Cohen et al. (2007), Sakip, Akhir, and Omar (2015),
as well as Anuar, Ahmad, Nasir, and Zainuddin (2016).
A number of neighbourhood parks are abandoned due to the lack of
facilities desired by visitors. Lindberg and Shipperijn (2015) found that several
facilities failed to match the needs of the users. This is because the facilities
provided do not meet the visitors’ expectations (Anuar & Muhaidar, 2018). Those
who participate in outdoor recreation activities expect to achieve specific
outcomes, and subsequently evaluate if their recreation experiences are met
(Oliver & DeSarbo, 1988; Graefe & Burns, 2013). Visitors typically favour
specific park location, along with supporting facilities that best provide their
preferred activities (Wolf, Wohlfart, Brown, & Lasa, 2015). These show that
facilities in the park are a motivation to visit the park. Thus, studies on demand
are essential to bridge the gap of knowledge pertaining to recreational facilities,
particularly in neighbourhood park. Hence, the objective of this study is to
evaluate the demand for recreational facilities in neighbourhood park.
LITERATURE REVIEW
As community awareness of healthy lifestyle increases, the usage of public parks
as recreation centres is also increasing. Therefore, the development of a public
park should consider the needs of the community as to maximise its usage. The
local authorities have reserved 10% of the development area to develop a public
park. These include botanical gardens, urban forest, and other public parks for
active and passive recreational purposes. There are hierarchies of public
recreational parks, which fall under the supervision of local authorities, such as
PLANNING MALAYSIA
Journal of the Malaysia Institute of Planners (2018)
199 © 2018 by MIP
national parks, district parks, urban parks, local parks, and neighbourhood parks
(Department of Town and Country Planning, 2013). The public park development
needs to consider various factors of planning and management based on safety,
comfort, and accessibility aspects (Anuar et al., 2016). The park management
needs to ensure the cleanliness of the surrounding area and to control
environmental pollution. Public parks should also be placed in accessible areas
to facilitate the users. Besides, a public park must be functional as a buffer or
separator zone from natural disasters. At the same time, the planning principles
also advocate the need to create green environment in urban areas, as well as to
create harmonious society by encouraging social interaction among the people.
All these criteria should be incorporated in developing a neighbourhood park.
Although the neighbourhood park is smaller than other public parks, the function
remains the same; for the visitors to perform leisure and physical activities, as
desired by the visitors and based on the facilities made available.
A neighbourhood park is an attraction for visitors to undertake physical
activities and relieve stress after a hard day's work. Several researchers agreed
that parks contribute not only to physical activities, but also in terms of the social
well-being of their community, enhance property value, and improve public
health (Kaczynski & Henderson, 2008; Sakip et al., 2015). Apart from that, parks
give valuable significance to the image of the city, wherein urban green spaces
create and strengthen the positive image of the community and the entire city
(Jerke, Porter, & Lassar, 2008; Schwab, 2009; Balch, 2011; Chan, Peters, &
Marafa, 2015). The importance of neighbourhood parks to visitors is always
related to improving the aspect of social interaction amongst the community.
Sakip et al., (2015) claimed that accessible parks can improve social cohesion
and interaction as more people patronise them. Therefore, the recreational
facilities in neighbourhood parks must meet visitors’ expectations, as it is also a
focal point for leisure and social bonding. There is a requirement of a
neighbourhood park to always supply recreational facilities in line with visitors’
requirements. According to Wolf et al., (2015), parks need to supply experiences
and facilities consistent with the demand to satisfy visitors’ expectations and to
protect natural resources from oversupply. Park facilities must meet the visitors’
demand to utilise the space sufficiently. In order to avoid a park from being
abandoned, the public park planning must be sensitive and adhere to the visitors’
demands. Therefore, it is essential to provide preferable facilities to maximise
space utilisation.
RESEARCH METHOD
Study Area
This study focused on several neighbourhood parks located in the Petaling
District of Selangor, Malaysia. Five neighbourhood parks under the supervision
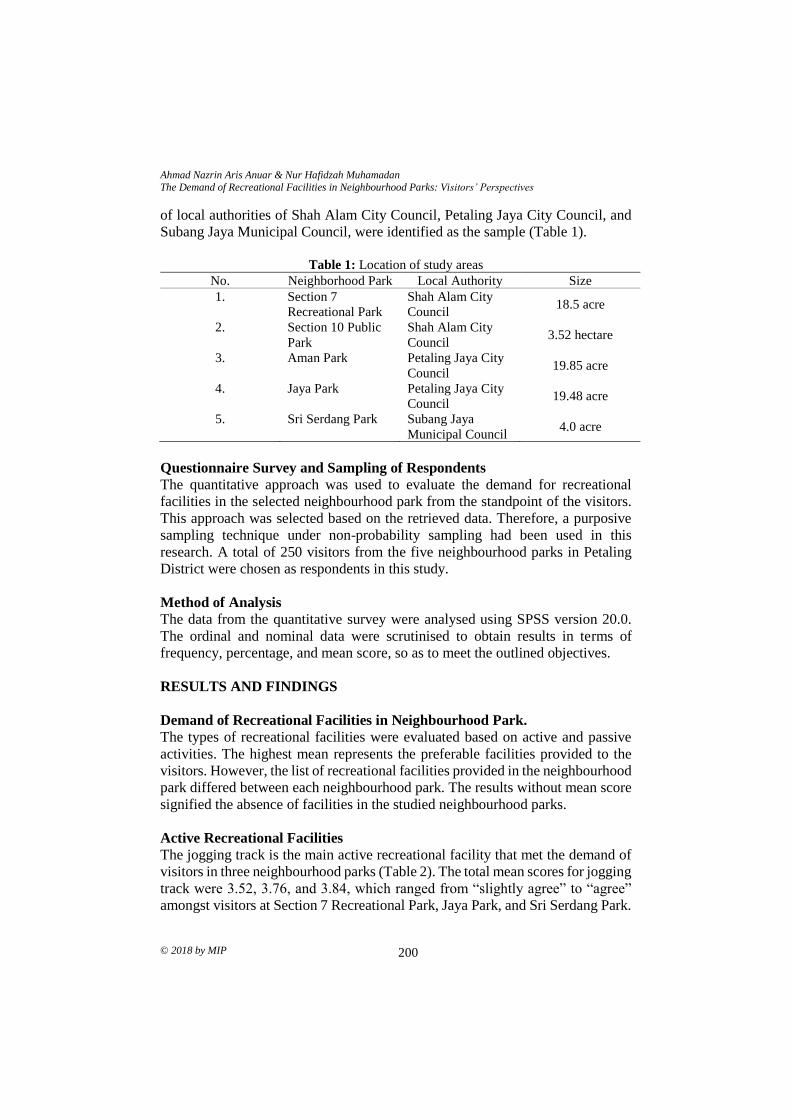
Ahmad Nazrin Aris Anuar & Nur Hafidzah Muhamadan
The Demand of Recreational Facilities in Neighbourhood Parks: Visitors’ Perspectives
© 2018 by MIP 200
of local authorities of Shah Alam City Council, Petaling Jaya City Council, and
Subang Jaya Municipal Council, were identified as the sample (Table 1).
Table 1: Location of study areas
No. Neighborhood Park Local Authority Size
1. Section 7
Recreational Park
Shah Alam City
Council 18.5 acre
2. Section 10 Public
Park
Shah Alam City
Council 3.52 hectare
3. Aman Park Petaling Jaya City
Council 19.85 acre
4. Jaya Park Petaling Jaya City
Council 19.48 acre
5. Sri Serdang Park Subang Jaya
Municipal Council 4.0 acre
Questionnaire Survey and Sampling of Respondents
The quantitative approach was used to evaluate the demand for recreational
facilities in the selected neighbourhood park from the standpoint of the visitors.
This approach was selected based on the retrieved data. Therefore, a purposive
sampling technique under non-probability sampling had been used in this
research. A total of 250 visitors from the five neighbourhood parks in Petaling
District were chosen as respondents in this study.
Method of Analysis
The data from the quantitative survey were analysed using SPSS version 20.0.
The ordinal and nominal data were scrutinised to obtain results in terms of
frequency, percentage, and mean score, so as to meet the outlined objectives.
RESULTS AND FINDINGS
Demand of Recreational Facilities in Neighbourhood Park.
The types of recreational facilities were evaluated based on active and passive
activities. The highest mean represents the preferable facilities provided to the
visitors. However, the list of recreational facilities provided in the neighbourhood
park differed between each neighbourhood park. The results without mean score
signified the absence of facilities in the studied neighbourhood parks.
Active Recreational Facilities
The jogging track is the main active recreational facility that met the demand of
visitors in three neighbourhood parks (Table 2). The total mean scores for jogging
track were 3.52, 3.76, and 3.84, which ranged from “slightly agree” to “agree”
amongst visitors at Section 7 Recreational Park, Jaya Park, and Sri Serdang Park.

PLANNING MALAYSIA
Journal of the Malaysia Institute of Planners (2018)
201 © 2018 by MIP
This result shows the awareness towards healthy living among the community in
Petaling District. However, the integrated playground was the highest active
recreational facility that met the demand of visitors in Section 10 Public Park with
a mean score of 3.25. Aman Park, equipped with a reflexology path, had the
highest active recreational facilities that met the demands of the visitors with a
mean score of 3.98. Most of the visitors agreed with the active recreational
facilities provided by the local authority ranging from “slightly agree” to “agree”.
These mostly motivated the visitors to spend time at the neighbourhood park.
Table 2: Active recreational facilities provided in neighbourhood park
Active Facilities
Section 7
Recreational
Park
(Mean)
Section
10 Public
Park
(Mean)
Aman
Park
(Mean)
Jaya
Park
(Mean)
Sri
Serdang
Park
(Mean)
Outdoor gym 3.48 - 3.62 3.46 -
Integrated
playground
3.34 3.25 3.80 3.42 3.26
Reflexology path 3.06 2.75 3.98 - 3.20
Tai chi plaza 2.86 - - - -
Jogging track 3.52 2.85 3.90 3.76 3.84
Multipurpose
court
- 2.55 - - -
Swing - 3.00 3.12 3.54 3.14
Basketball court - - 3.72 - 3.28
Takraw court - - 3.08 - 2.68
Parcouse - - 3.44 - -
Amphitheatre - - 3.42 - -
Exercise
Equipment
- - - - 3.44
Note: (-) means not available in that particular neighbourhood park
Passive Recreational Facilities Provided in Neighbourhood Park
Table 3 shows the highest mean scores of 3.26 and 3.64 for passive recreational
facilities at Section 7 Recreational Park and Section 10 Public Park. The results
showed “slightly agree” and “agree” concerning the gazebo facility in this type
of neighbourhood parks. This facility obtained the highest score amongst the
passive recreational facilities because the visitors were more interested in health-
related activities, apart from releasing stress. The Aman Park benches received
the highest mean score as the passive recreational facility with a mean score of
3.62. This is similar to two other neighbourhood parks; Jaya Park (mean score
3.90) and Sri Serdang Park (mean score 3.72). Most of the visitors selected
“slightly agree” and “agree” for these facilities as they preferred more relaxing
activities after work.
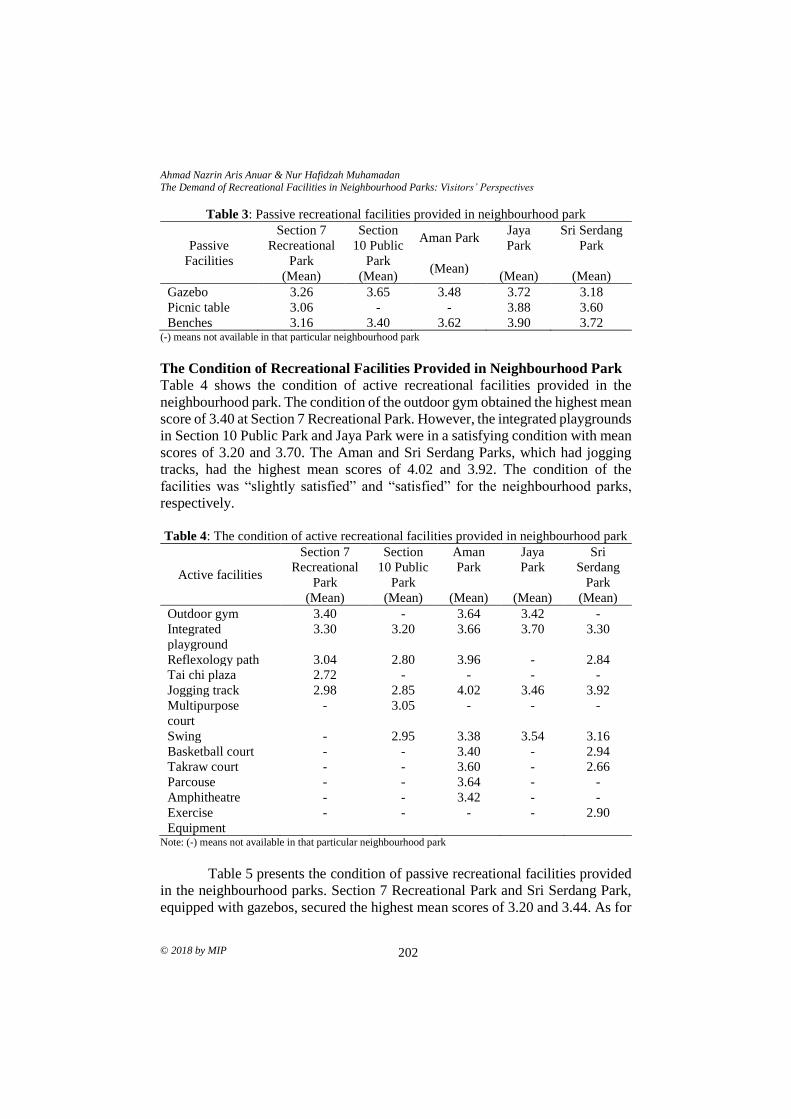
Ahmad Nazrin Aris Anuar & Nur Hafidzah Muhamadan
The Demand of Recreational Facilities in Neighbourhood Parks: Visitors’ Perspectives
© 2018 by MIP 202
Table 3: Passive recreational facilities provided in neighbourhood park
Passive
Facilities
Section 7
Recreational
Park
(Mean)
Section
10 Public
Park
(Mean)
Aman Park
(Mean)
Jaya
Park
(Mean)
Sri Serdang
Park
(Mean)
Gazebo 3.26 3.65 3.48 3.72 3.18
Picnic table 3.06 - - 3.88 3.60
Benches 3.16 3.40 3.62 3.90 3.72 (-) means not available in that particular neighbourhood park
The Condition of Recreational Facilities Provided in Neighbourhood Park
Table 4 shows the condition of active recreational facilities provided in the
neighbourhood park. The condition of the outdoor gym obtained the highest mean
score of 3.40 at Section 7 Recreational Park. However, the integrated playgrounds
in Section 10 Public Park and Jaya Park were in a satisfying condition with mean
scores of 3.20 and 3.70. The Aman and Sri Serdang Parks, which had jogging
tracks, had the highest mean scores of 4.02 and 3.92. The condition of the
facilities was “slightly satisfied” and “satisfied” for the neighbourhood parks,
respectively.
Table 4: The condition of active recreational facilities provided in neighbourhood park
Active facilities
Section 7
Recreational
Park
(Mean)
Section
10 Public
Park
(Mean)
Aman
Park
(Mean)
Jaya
Park
(Mean)
Sri
Serdang
Park
(Mean)
Outdoor gym 3.40 - 3.64 3.42 -
Integrated
playground
3.30 3.20 3.66 3.70 3.30
Reflexology path 3.04 2.80 3.96 - 2.84
Tai chi plaza 2.72 - - - -
Jogging track 2.98 2.85 4.02 3.46 3.92
Multipurpose
court
- 3.05 - - -
Swing - 2.95 3.38 3.54 3.16
Basketball court - - 3.40 - 2.94
Takraw court - - 3.60 - 2.66
Parcouse - - 3.64 - -
Amphitheatre - - 3.42 - -
Exercise
Equipment
- - - - 2.90
Note: (-) means not available in that particular neighbourhood park
Table 5 presents the condition of passive recreational facilities provided
in the neighbourhood parks. Section 7 Recreational Park and Sri Serdang Park,
equipped with gazebos, secured the highest mean scores of 3.20 and 3.44. As for
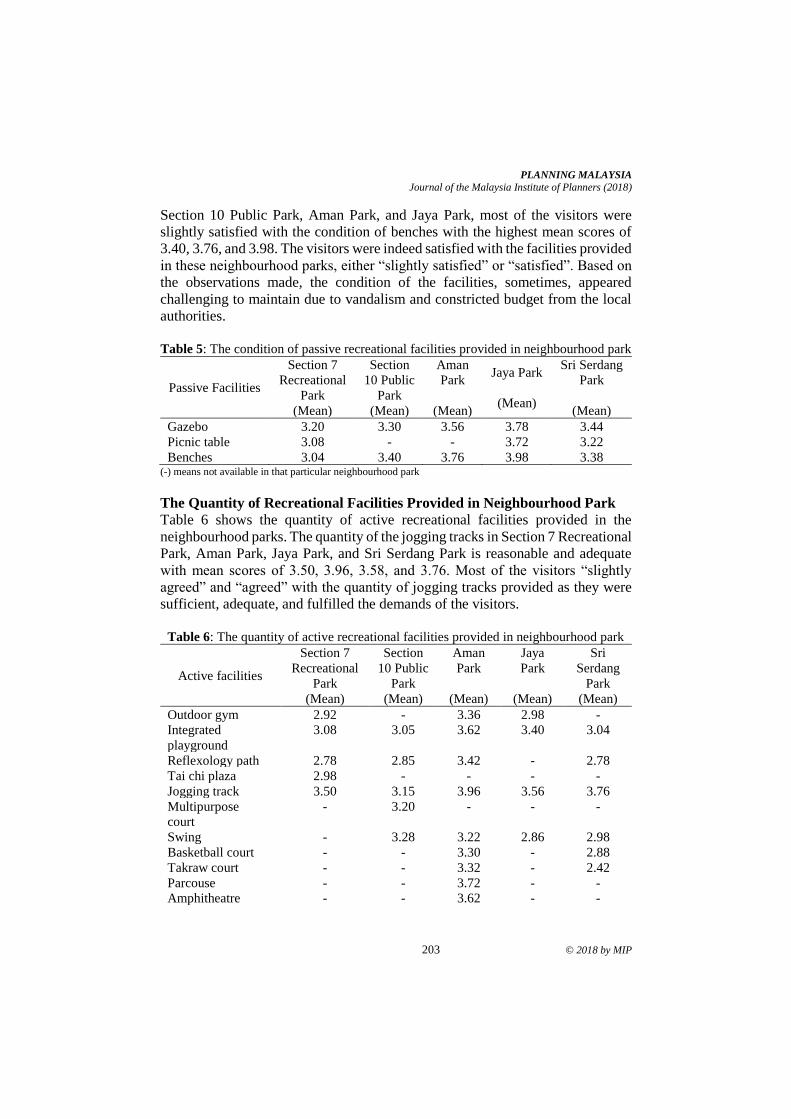
PLANNING MALAYSIA
Journal of the Malaysia Institute of Planners (2018)
203 © 2018 by MIP
Section 10 Public Park, Aman Park, and Jaya Park, most of the visitors were
slightly satisfied with the condition of benches with the highest mean scores of
3.40, 3.76, and 3.98. The visitors were indeed satisfied with the facilities provided
in these neighbourhood parks, either “slightly satisfied” or “satisfied”. Based on
the observations made, the condition of the facilities, sometimes, appeared
challenging to maintain due to vandalism and constricted budget from the local
authorities.
Table 5: The condition of passive recreational facilities provided in neighbourhood park
Passive Facilities
Section 7
Recreational
Park
(Mean)
Section
10 Public
Park
(Mean)
Aman
Park
(Mean)
Jaya Park
(Mean)
Sri Serdang
Park
(Mean)
Gazebo 3.20 3.30 3.56 3.78 3.44
Picnic table 3.08 - - 3.72 3.22
Benches 3.04 3.40 3.76 3.98 3.38 (-) means not available in that particular neighbourhood park
The Quantity of Recreational Facilities Provided in Neighbourhood Park
Table 6 shows the quantity of active recreational facilities provided in the
neighbourhood parks. The quantity of the jogging tracks in Section 7 Recreational
Park, Aman Park, Jaya Park, and Sri Serdang Park is reasonable and adequate
with mean scores of 3.50, 3.96, 3.58, and 3.76. Most of the visitors “slightly
agreed” and “agreed” with the quantity of jogging tracks provided as they were
sufficient, adequate, and fulfilled the demands of the visitors.
Table 6: The quantity of active recreational facilities provided in neighbourhood park
Active facilities
Section 7
Recreational
Park
(Mean)
Section
10 Public
Park
(Mean)
Aman
Park
(Mean)
Jaya
Park
(Mean)
Sri
Serdang
Park
(Mean)
Outdoor gym 2.92 - 3.36 2.98 -
Integrated
playground
3.08 3.05 3.62 3.40 3.04
Reflexology path 2.78 2.85 3.42 - 2.78
Tai chi plaza 2.98 - - - -
Jogging track 3.50 3.15 3.96 3.56 3.76
Multipurpose
court
- 3.20 - - -
Swing - 3.28 3.22 2.86 2.98
Basketball court - - 3.30 - 2.88
Takraw court - - 3.32 - 2.42
Parcouse - - 3.72 - -
Amphitheatre - - 3.62 - -
Ahmad Nazrin Aris Anuar & Nur Hafidzah Muhamadan
The Demand of Recreational Facilities in Neighbourhood Parks: Visitors’ Perspectives
© 2018 by MIP 204
Exercise
Equipment
- - - - 3.10
Note: (-) means not available in that particular neighbourhood park
Table 7 illustrates the quantity of passive recreational facilities provided
in the neighbourhood parks. Section 7 Recreational Park had picnic tables, thus
was awarded with the highest mean score of 2.90 due to its quantity. Next, Section
10 Public Park and Jaya Park had most of the visitors to slightly agree with the
gazebos made available with the highest mean scores of 3.25 and 3.86. In Aman
and Sri Serdang Parks, most of the visitors slightly agreed with the number of
benches provided with mean scores of 3.68 and 3.82. Therefore, most of the
visitors appeared to “slightly agree” and “agree” with the number of passive
facilities, except in Section 7 Recreational Park, as they felt that the number of
passive facilities should be added based on their preferred activities.
Table 7: The quantity of passive recreational facilities provided in neighbourhood park
Passive Facilities
Section 7
Recreational
Park
(Mean)
Section
10 Public
Park
(Mean)
Aman
Park
(Mean)
Jaya Park
(Mean)
Sri
Serdang
Park
(Mean)
Gazebo 2.88 3.25 3.54 3.86 3.38
Picnic table 2.90 - - 3.64 3.24
Benches 2.78 3.15 3.68 3.80 3.82 Note: (-) means not available in that particular neighbourhood park
The Placement Recreational Facilities Provided in Neighbourhood Park
Table 8 presents the placement of active recreational facilities provided in the
neighbourhood parks. Most of the visitors favoured the placement of jogging
tracks with the highest mean score for all types of neighbourhood parks in
Petaling District. This shows that most visitors “slightly agreed” and “agreed”
with the placement of active recreational facilities provided by the local authority.
In Table 8, most of the visitors “did not agree” with the placement of sports
facilities, such as reflexology path, tai chi plaza, multipurpose court, and takraw
court. They felt that these sports facilities are inappropriately placed and unused.
Table 8: The placement of active recreational facilities provided in neighbourhood park
Active facilities
Section 7
Recreational
Park
(Mean)
Section
10 Public
Park
(Mean)
Aman
Park
(Mean)
Jaya
Park
(Mean)
Sri
Serdang
Park
(Mean)
Outdoor gym 3.28 - 3.78 3.68 -
Integrated
playground
3.28 3.05 3.86 3.66 3.04
Reflexology path 2.96 3.15 3.70 - 3.06
PLANNING MALAYSIA
Journal of the Malaysia Institute of Planners (2018)
205 © 2018 by MIP
Tai chi plaza 2.96 - - - -
Jogging track 3.38 3.25 4.24 3.70 3.86
Multipurpose
court
- 2.95 - - -
Swing - 3.56 3.60 3.56
Basketball court - - 3.40 - 3.22
Takraw court - - 3.70 - 2.64
Parcouse - - 3.68 - -
Amphitheatre - - 3.70 - -
Exercise
Equipment
- - - - 3.28
(-) means not available in that particular neighbourhood park
Table 9 illustrates the placement of passive recreational facilities
provided in the neighbourhood parks. These passive facilities are an option for
visitors to relax and appreciate nature. Thus, it is a priority to place these facilities
in an appropriate and accessible area. Therefore, Section 7 Recreational Park
revealed the highest mean score of 3.58 for its placement of picnic tables.
Meanwhile, in Section 10 Public Park, Jaya Park, and Sri Serdang Park, most
visitors selected the benches placement with the highest mean scores of 3.40,
4.02, and 3.80, respectively. The results in Aman Park showed that a majority of
the visitors agreed with the placement of the gazebos with a mean score of 3.94.
This showed that most of the visitors “slightly agreed” and “agreed” with the
placement of passive recreational facilities in the five studied neighbourhood
parks.
Table 9: The placement of passive recreational facilities provided in neighbourhood
park
Passive Facilities
Section 7
Recreational
Park
(Mean)
Section 10
Public
Park
(Mean)
Aman
Park
(Mean)
Jaya
Park
(Mean)
Sri
Serdang
Park
(Mean)
Gazebo 3.06 3.20 3.94 3.84 3.36
Picnic table 3.58 - - 3.50 3.56
Benches 2.86 3.40 3.58 4.02 3.80 Note: (-) means not available in that particular neighbourhood park
SUMMARY AND CONCLUDING REMARKS
This study determined if the recreational facilities provided by the local
authorities in the neighbourhood park met the demands of the visitors. The
challenge of providing sufficient facilities in the neighbourhood park is to ensure
that the recreational facilities are in line with the visitors’ expectations. Some
parks have overlooked the provision of recreational facilities suitable as a
recreation spot to the local community. Recreational facilities in the
Ahmad Nazrin Aris Anuar & Nur Hafidzah Muhamadan
The Demand of Recreational Facilities in Neighbourhood Parks: Visitors’ Perspectives
© 2018 by MIP 206
neighbourhood park should suit the area and support the activities frequented by
its visitors to meet their recreational demands. The respondents defined
recreational facilities based on active and passive activities. The findings for
Section 7 Recreational Park showed that the respondents demanded more active
recreational facilities. As for the Section 10 Public Park, the respondents
preferred passive recreational facilities, such as a rest area, to release stress. The
findings in Aman Park were more towards active recreational facilities with
reflexology path and a jogging track, which appeared to be the highest demands
from the visitors. The results for Jaya Park showed that the respondents preferred
passive recreational facilities as the highest demand, while the Sri Serdang Park
visitors were happy with active recreational facilities as the highest demand. The
results are further supported by the following statement provided by the
respondents:
“At section 7, most of the residents are young people. They like
jogging most of the time when visiting the neighbourhood park”
(25 years old, Malay).
“Supposedly, more facilities in this park can be used by all age
groups. It will offer a variety of games in the public park” (34
years old, Malay).
Therefore, the type of recreational facilities differs depending on the
needs of the visitors. The availability of the recreational facilities, such as
condition, quantity, and placement, is related to the park use and park visitation.
Overall, this study contributes in extending the knowledge and practice in the
field of park and facility management.
REFERENCES Anuar, A. N. A., & Muhaidar, F. S. (2018). The procurement method used for
maintenance in public park: Local authority perspectives. Journal of
Engineering and Applied Sciences, 13(6), 1451-1461.
Anuar, A. N. A., Ahmad, C. B., Nasir, R. A., & Zainuddin, Z. N. M. (2016). The
development of friendly public park benchmarking: A qualitative study. The
Social Sciences, 11(20), 4970-4976.
Balch, C. (2011). Great cities don’t just happen: they are made! In B. M. Evans, F.
McDonald, & D. Rudlin, (Eds.), Urban Identity. Abingdon, Oxon: Routledge.
Chan, C. S., Peters, M., & Marafa, L. M. (2015). Public parks in city branding:
Perceptions of visitors vis-à-vis residents in Hong Kong. Urban Forestry &
Urban Greening, 14(4), 1157-1165.
Cohen, D., McKenzie, T. L., Sehgal, A., Williamsom, S., Golinelli, D., & Lurie, N.
(2007). Contribution of public parks to physical activity. American Journal of
Public Health, 97(3), 509-514.
PLANNING MALAYSIA
Journal of the Malaysia Institute of Planners (2018)
207 © 2018 by MIP
Department of Town and Country Planning (2013). Garis panduan perancangan tanah
lapang dan rekreasi. Kuala Lumpur: Kementerian Perumahan dan Kerajaan
Tempatan.
Graefe, A. R., & Burns, R. C. (2013). Testing a mediation model of customer service and
satisfaction in outdoor recreation. Journal of Outdoor Recreation and Tourism,
3, 36-46.
Jerke, D., Porter, D. R., & Lassar, T. J. (2008). Urban design and the bottom line:
Optimizing the return on perception. Washington DC: Urban Land Institute.
Kaczynski, A. T., & Henderson, K. A. (2008). Parks and recreation settings and active
living: A review of associations with physical activity function and intensity.
Journal of Physical Activity & Health, 5(4), 619-632.
Lindberg, M., & Schipperijn, J. (2015). Active use of urban park facilities - Expectations
versus reality. Urban Forestry & Urban Greening, 14(4), 909-918.
Oliver, R., & De Sarbo, W. S. (1988). Response determinants in satisfaction judgments.
Journal of Consumer Research, 14(4), 495-507.
Sakip, S. R., Akhir, N. M., & Omar, S. S. (2015). Determinant factors of successful public
parks in Malaysia. Procedia-Social and Behavioral Sciences, 170, 422-432.
Schwab, J. (2009). Planning the urban forest: Ecology, Economy and Community
Development. Chicago, IL: American Planning Association.
Wolf, I. D., Wohlfart, T., Brown, G., & Lasa, A. B. (2015). The use of public participation
GIS (PPGIS) for parks visitor management: A case study of mountain biking.
Tourism Management, 51, 112-130
1Lecturer at Universiti Teknologi MARA, Malaysia Email: [email protected] 208
PLANNING MALAYSIA:
Journal of the Malaysian Institute of Planners
VOLUME 16 ISSUE 3 (2018) Page 208 – 220
EXPLORING POSSIBLE USAGE FOR ELEVATED HIGHWAY
INTERSTITIAL SPACES: A CASE STUDY OF DUKE AND AKLEH,
KUALA LUMPUR
Mohamed Ikhwan Nasir Mohamed Anuar1 & Raziah Ahmad2
Faculty of Architecture, Planning and Surveying
UNIVERSITI TEKNOLOGI MARA, MALAYSIA
Abstract
Kuala Lumpur has seen rapid development of mass amount of highway
infrastructure. Although elevated urban highways in Greater Kuala Lumpur may
have relieved the intercity and interstate traffic, the presence of this urban
infrastructural landscape promotes the creation of lost spaces. The construction
of the highways, primarily the elevated ones, often create spaces underneath the
structure that are often neglected in mainstream planning and design. This paper
aims at investigating typologies of interstitial spaces and its characteristics
beneath elevated highway based on available literature as well as to explore the
possibilities of usage for spaces below the elevated highway. This research
employs qualitative method that involves primary and secondary data collection.
The primary data were gathered through site observational study at two major
elevated highways in the Greater Kuala Lumpur area -DUKE 1 Highway and
AKLEH Highway. A review and content analysis of documents related to
urbanization and planning transportation provide secondary data. Findings from
this study suggest that [1] although the highways enhance connectivity and ease
traffic movement, it also leads to abundance of wasted land and spaces [2] an
improved understanding of the typologies and characteristics of these interstitial
spaces shall aid in the improvement of their future usage.
Keywords: infrastructural landscape, interstitial spaces, elevated highway
PLANNING MALAYSIA
Journal of the Malaysia Institute of Planners (2018)
209 © 2018 by MIP
INTRODUCTION
Studies and research in landscape urbanism field have focused on infrastructure
as the most important generative public landscape. Mossop (2006) describes that
these omnipresent urban environments have been considered and evaluated solely
on technical criteria and somehow exempted from having to function socially,
aesthetically, or ecologically. In a study by SWA Group (2011), it was
highlighted in the context of our rapidly changing urban environment,
infrastructure is experiencing a paradigm shift where multiple-use programming
and the integration of latent ecologies is a primary consideration. Redefining
modern infrastructure requires a multi-disciplinary team of landscape architects,
designers, engineers, architects and planners to fully realize the benefits to our
cultural, social and natural systems. Such a re-examination of infrastructural
space involves the recognition that all types of space are valuable, not just the
privileged spaces of more traditional parks and squares, and they must therefore
be inhabitable in a meaningful way. Hence, the mono functional realm of
infrastructure requires new approaches and more sustainable design concepts for
difficult spaces particularly under elevated highways and as well as complex
transit interchanges must therefore be explored and examined. These spaces make
up a large proportion of urban land and are of interest to many stakeholder groups.
While they are often viewed as dangerous or unsightly, they can be an economic,
social, and ecological resource (Kremer & Hamstead, 2015; Anderson & Minor,
2016).
Like most cities in the developing world, Kuala Lumpur has experienced
rapid development which has left the city, in many respects, disjointed and
lacking in spatial coherence in both visual and physical aspect. Described briefly
in the Kuala Lumpur Structure Plan 2020, major roads primarily highways and
rail infrastructure, have in many places effectively divided adjacent spaces and
areas or neighbourhoods that remain physically close but virtually inaccessible to
each other. Elevated highways are described as pieces of infrastructure, which
seldom attract people’s affection and pose a constant provocation, although
practical and financial reasons suggest to simply accepting their presence.
(Harnack & Cohler, 2011). Following this, Crisman, (2012) stated that the
resulting interstice, “a space that intervenes between one thing and another,” often
generates seemingly uninhabitable zones and problematic discontinuities in the
physical and social fabric. Issues relating to the formation and unclear function
of these lost spaces has mostly been discussed in the western world and still
limited within surrounding region (Qamaruz-Zaman et al., 2013; Clements, 2013;
Sanches & Pellegrino, 2016).
Scholars, designers and planners, spanning multiple fields of practice,
have noted that the issue is a result from of a lack of integration during the
planning and design process, and that the problem of left over spaces is indeed a
gap that is to be addressed (Trancik, 1986; Mossop, 2006; Crisman, 2009;
Mohamed Ikhwan Nasir Mohamed Anuar & Raziah Ahmad
Exploring Possible Usage for Elevated Highway Interstitial Spaces: A case study of DUKE and AKLEH, Kuala Lumpur
© 2018 by MIP 210
Prasetyo & Iverson 2014; Akinci, Demir, & Demirel, 2016). Barter's study (2004)
disclosed significant issues about highways in Kuala Lumpur which demonstrates
the high ratio of highways as compared to the number of population (68 meters
per 1000 population). Therefore, to address the issues at hand, there is a need to
understand the current situation of the existing left-over spaces under the elevated
highways in Kuala Lumpur. This paper aims at investigating typologies of
interstitial spaces and its characteristics beneath elevated highway based on
available literature as well as to explore the potential of usage for spaces below
the elevated highway.
LITERATURE REVIEW
Elevated Highways and the Emergence of “Lost Spaces”
Regarded as the most commonly used and economical mode of human
transportation, highway transportation is the most important connection in the
landscape between rural and urban areas. The creation of ‘Elevated highway’ or
‘flyover’ as commonly referred to in the United Kingdom and most
Commonwealth countries (Akinci et al., 2016) has been mentioned as one of the
major drivers of landscape change worldwide. Adding to this, landscape
fragmentation caused by transportation infrastructure has a number of effects on
almost all components of landscapes, including aesthetic, ecological, historical,
and recreational qualities (Forman et al., 2011).
Elevated highways have often been built in the following urban areas:
surround urban periphery, river bank, industrial area and the one that cut through
the low-income housing (Biesecker, 2015). The development of this kind
infrastructure would primarily increase the accessibility and mobility of urban
dwellers but at the same time become barriers that separate district or
neighbourhood. Saouma (2008) conducted a thorough analysis of the impact of
elevated highways in Bourj Hammoud, Beirut. Her findings revealed six types of
impacts as shown in Figure 1. During the early phase of the construction of
elevated highways, this infrastructure has not only promoted growth and
development of cities, it also became a symbol of progression, increased
accessibility, and mobility to urban residents (a). Because of its efficiency that
have shortened the travelling distances, elevated highways have dominated the
urban fabric (b). Such intrusion of urban structure has given bad impact in which
it creates physical and psychological barrier that segregates neighbourhoods (c).
Additionally, the undefined spaces under the elevated highway have often been
misused (d) as it only allows minimum natural lighting and poor ventilation (e).
Due to its poor quality and accessibility, the underpass spaces became lost spaces
without functional activities (f).
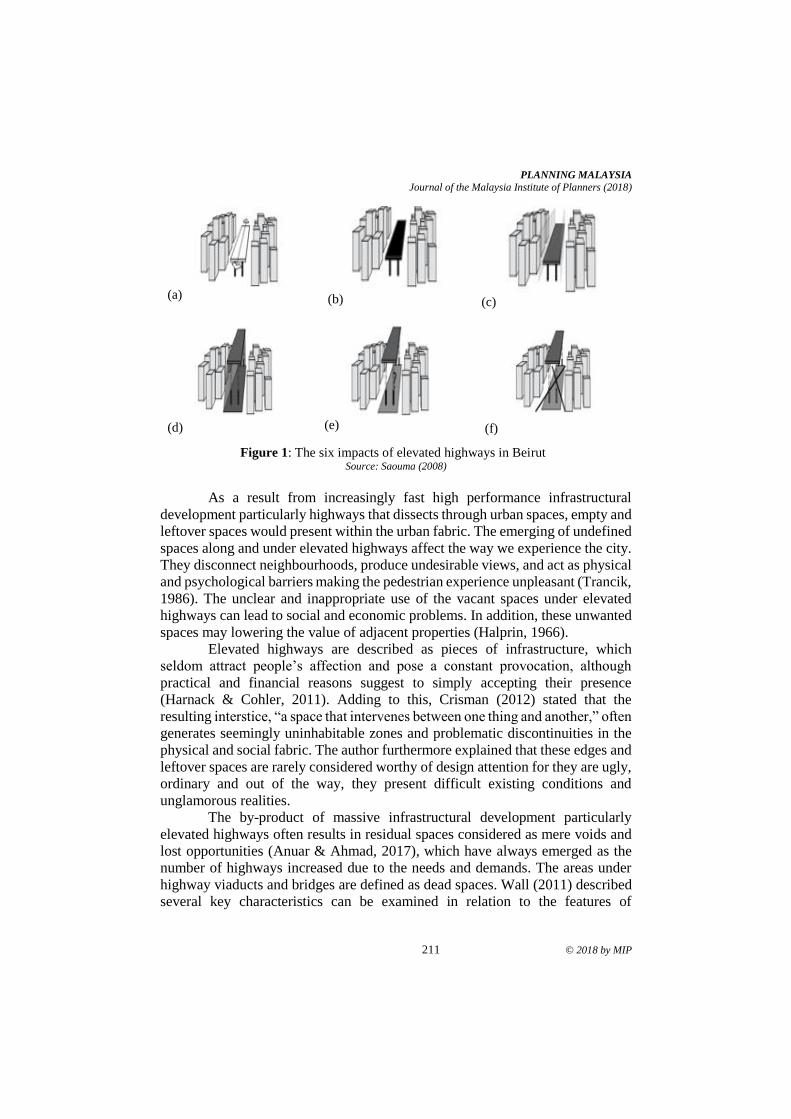
PLANNING MALAYSIA
Journal of the Malaysia Institute of Planners (2018)
211 © 2018 by MIP
(a)
(b)
(c)
(d)
(e)
(f)
Figure 1: The six impacts of elevated highways in Beirut Source: Saouma (2008)
As a result from increasingly fast high performance infrastructural
development particularly highways that dissects through urban spaces, empty and
leftover spaces would present within the urban fabric. The emerging of undefined
spaces along and under elevated highways affect the way we experience the city.
They disconnect neighbourhoods, produce undesirable views, and act as physical
and psychological barriers making the pedestrian experience unpleasant (Trancik,
1986). The unclear and inappropriate use of the vacant spaces under elevated
highways can lead to social and economic problems. In addition, these unwanted
spaces may lowering the value of adjacent properties (Halprin, 1966).
Elevated highways are described as pieces of infrastructure, which
seldom attract people’s affection and pose a constant provocation, although
practical and financial reasons suggest to simply accepting their presence
(Harnack & Cohler, 2011). Adding to this, Crisman (2012) stated that the
resulting interstice, “a space that intervenes between one thing and another,” often
generates seemingly uninhabitable zones and problematic discontinuities in the
physical and social fabric. The author furthermore explained that these edges and
leftover spaces are rarely considered worthy of design attention for they are ugly,
ordinary and out of the way, they present difficult existing conditions and
unglamorous realities.
The by-product of massive infrastructural development particularly
elevated highways often results in residual spaces considered as mere voids and
lost opportunities (Anuar & Ahmad, 2017), which have always emerged as the
number of highways increased due to the needs and demands. The areas under
highway viaducts and bridges are defined as dead spaces. Wall (2011) described
several key characteristics can be examined in relation to the features of
x 3rd AQoL2017Kuching, 14-16 Oct 2017 / E-BPJ, 2(6), Nov 2017 (p. )
5
(a) (b)
Fig. 6: Innovative highways-(a) The Big Dig, Boston and (b) the Cheonggyecheon Stream which was converted from elevated highway in
Seoul (Source: https://cityworksinc.files.wordpress.com/2012/09/img_0232.jpeg
http://www.globalrestorationnetwork.org/uploads/files/CaseStudyAttachments/123_seoul-1.jpg)
2.3 Elevated highways and Urban spatial discontinuity
The term ‘elevated highway or expressway’ and ‘flyover’ has interchangeably been used in academic writings. The former is often used in the context of United State of America (Samuel, 2006). The later, however, has commonly been accepted in the United Kingdom and
most Commonwealth countries (Akinci et al. 2016). Throughout this paper, the term ‘elevated highway' has been adopted by the authors. The function of elevated urban highways that could transfer and mobile people around cities is understandable. Conversely, the
presence of this urban type infrastructure somehow generates specific spaces with idiosyncratic spatial characteristics (Hauck and Kleinekort, 2011). The emergence of undefined and unusable of spaces under highways viaduct has been increased, which disrupted
the urban space's landscape system, land use and public areas (Akinci et al. 2016). The undefined and unusable spaces under the
elevated highways often referred as "interstitial space" (Wall, 2011), "terrain vague" (Rico, 2011), “SLOAPS-Space leftover after planning, (Carmona, 2010), "gap spaces" (Hormingo and Morita, 2004), "wastelands", "derelict areas" (Doron, 2000) and "lost space"
(Trancik, 1986). According to Engwicht, (1990), the diminishing of the social exchange spaces in urban fabric is directly proportional to the increase
in spaces for transport mobility. Elevated highways have often been built in the following urban areas: surround urban periphery, river bank, industrial area and the one that cut through the low-income housing (Bisecker, 2015). On the one hand, development of this kind
infrastructure would primarily increase the accessibility and mobility of urban dwellers. On the other hand, it has physically become
barriers that separate district or neighbourhood. Saouma (2008) conducted a thorough analysis of the impact of elevated highways in the urban area. Her findings revealed six (6)
types of impacts: [1] Symbol of progression, increase accessibility and mobility; [2] Dominant structure in urban fabric; [3] Segregate community or neighbourhood, become physical and psychological barrier and visual intrusion; [4] Produce undefined space which often
misused; [5] Allow minimum natural lighting and poor ventilation at space under the elevated structure and [6] Generate negative spaces or lost spaces which always been neglected. The six impacts are shown in Figure 7.
Fig. 7: The six impacts of elevated highways in urban areas as explored and illustrated by Saouma Source: Saouma (2008)
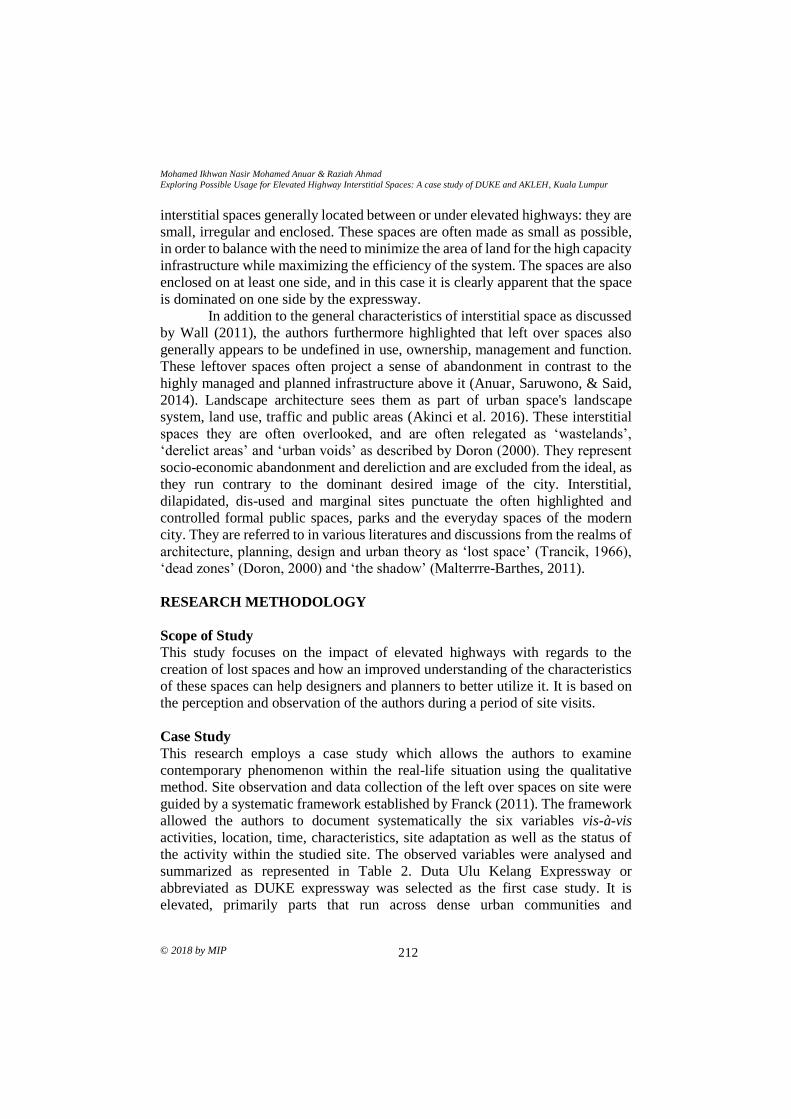
Mohamed Ikhwan Nasir Mohamed Anuar & Raziah Ahmad
Exploring Possible Usage for Elevated Highway Interstitial Spaces: A case study of DUKE and AKLEH, Kuala Lumpur
© 2018 by MIP 212
interstitial spaces generally located between or under elevated highways: they are
small, irregular and enclosed. These spaces are often made as small as possible,
in order to balance with the need to minimize the area of land for the high capacity
infrastructure while maximizing the efficiency of the system. The spaces are also
enclosed on at least one side, and in this case it is clearly apparent that the space
is dominated on one side by the expressway.
In addition to the general characteristics of interstitial space as discussed
by Wall (2011), the authors furthermore highlighted that left over spaces also
generally appears to be undefined in use, ownership, management and function.
These leftover spaces often project a sense of abandonment in contrast to the
highly managed and planned infrastructure above it (Anuar, Saruwono, & Said,
2014). Landscape architecture sees them as part of urban space's landscape
system, land use, traffic and public areas (Akinci et al. 2016). These interstitial
spaces they are often overlooked, and are often relegated as ‘wastelands’,
‘derelict areas’ and ‘urban voids’ as described by Doron (2000). They represent
socio-economic abandonment and dereliction and are excluded from the ideal, as
they run contrary to the dominant desired image of the city. Interstitial,
dilapidated, dis-used and marginal sites punctuate the often highlighted and
controlled formal public spaces, parks and the everyday spaces of the modern
city. They are referred to in various literatures and discussions from the realms of
architecture, planning, design and urban theory as ‘lost space’ (Trancik, 1966),
‘dead zones’ (Doron, 2000) and ‘the shadow’ (Malterrre-Barthes, 2011).
RESEARCH METHODOLOGY
Scope of Study
This study focuses on the impact of elevated highways with regards to the
creation of lost spaces and how an improved understanding of the characteristics
of these spaces can help designers and planners to better utilize it. It is based on
the perception and observation of the authors during a period of site visits.
Case Study
This research employs a case study which allows the authors to examine
contemporary phenomenon within the real-life situation using the qualitative
method. Site observation and data collection of the left over spaces on site were
guided by a systematic framework established by Franck (2011). The framework
allowed the authors to document systematically the six variables vis-à-vis
activities, location, time, characteristics, site adaptation as well as the status of
the activity within the studied site. The observed variables were analysed and
summarized as represented in Table 2. Duta Ulu Kelang Expressway or
abbreviated as DUKE expressway was selected as the first case study. It is
elevated, primarily parts that run across dense urban communities and
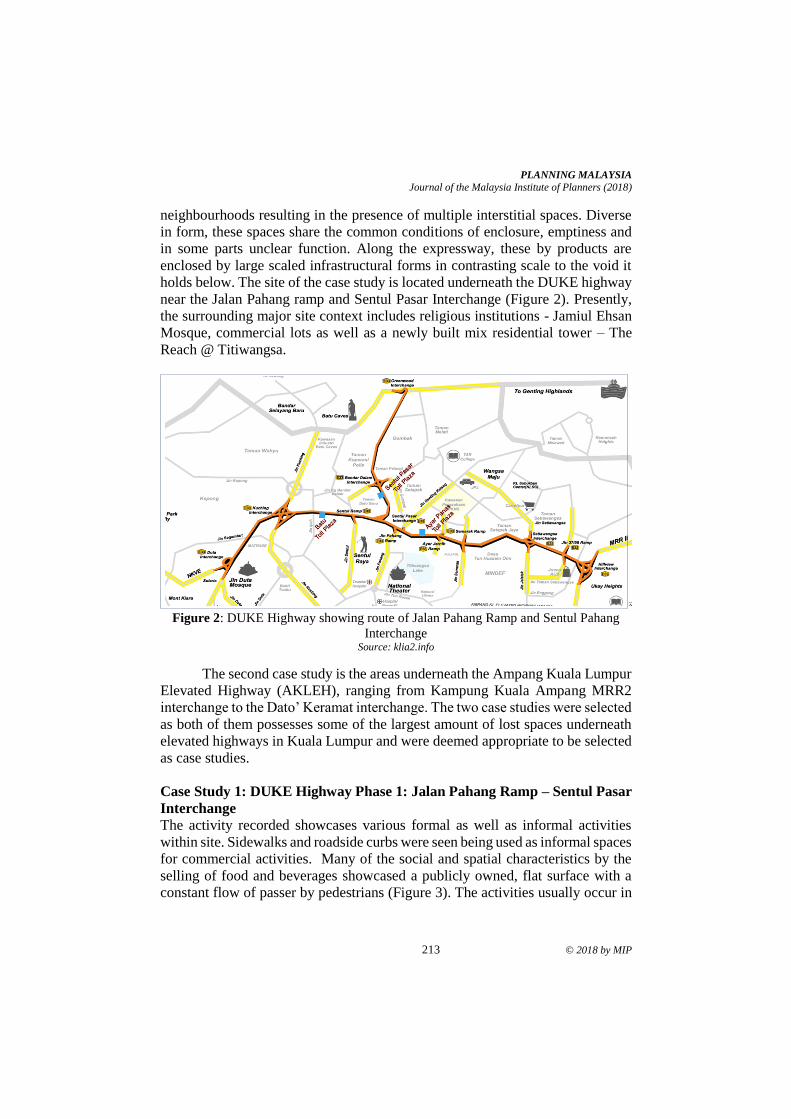
PLANNING MALAYSIA
Journal of the Malaysia Institute of Planners (2018)
213 © 2018 by MIP
neighbourhoods resulting in the presence of multiple interstitial spaces. Diverse
in form, these spaces share the common conditions of enclosure, emptiness and
in some parts unclear function. Along the expressway, these by products are
enclosed by large scaled infrastructural forms in contrasting scale to the void it
holds below. The site of the case study is located underneath the DUKE highway
near the Jalan Pahang ramp and Sentul Pasar Interchange (Figure 2). Presently,
the surrounding major site context includes religious institutions - Jamiul Ehsan
Mosque, commercial lots as well as a newly built mix residential tower – The
Reach @ Titiwangsa.
Figure 2: DUKE Highway showing route of Jalan Pahang Ramp and Sentul Pahang
Interchange Source: klia2.info
The second case study is the areas underneath the Ampang Kuala Lumpur
Elevated Highway (AKLEH), ranging from Kampung Kuala Ampang MRR2
interchange to the Dato’ Keramat interchange. The two case studies were selected
as both of them possesses some of the largest amount of lost spaces underneath
elevated highways in Kuala Lumpur and were deemed appropriate to be selected
as case studies.
Case Study 1: DUKE Highway Phase 1: Jalan Pahang Ramp – Sentul Pasar
Interchange
The activity recorded showcases various formal as well as informal activities
within site. Sidewalks and roadside curbs were seen being used as informal spaces
for commercial activities. Many of the social and spatial characteristics by the
selling of food and beverages showcased a publicly owned, flat surface with a
constant flow of passer by pedestrians (Figure 3). The activities usually occur in
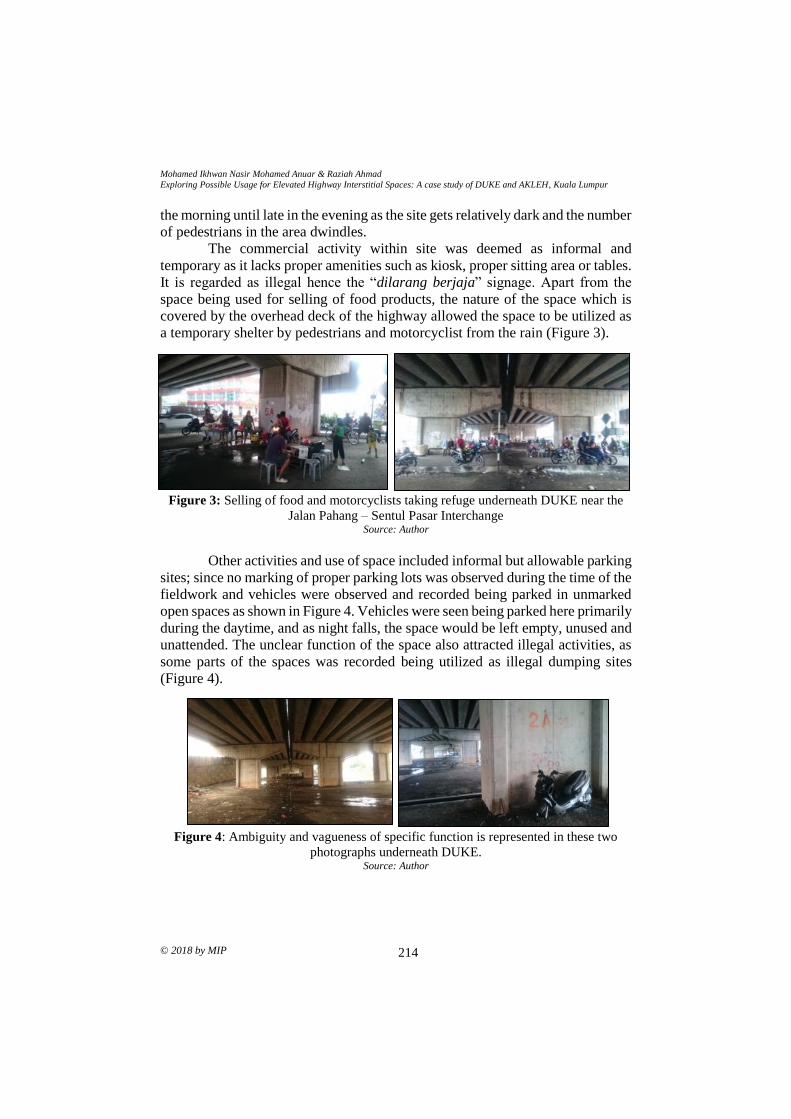
Mohamed Ikhwan Nasir Mohamed Anuar & Raziah Ahmad
Exploring Possible Usage for Elevated Highway Interstitial Spaces: A case study of DUKE and AKLEH, Kuala Lumpur
© 2018 by MIP 214
the morning until late in the evening as the site gets relatively dark and the number
of pedestrians in the area dwindles.
The commercial activity within site was deemed as informal and
temporary as it lacks proper amenities such as kiosk, proper sitting area or tables.
It is regarded as illegal hence the “dilarang berjaja” signage. Apart from the
space being used for selling of food products, the nature of the space which is
covered by the overhead deck of the highway allowed the space to be utilized as
a temporary shelter by pedestrians and motorcyclist from the rain (Figure 3).
Figure 3: Selling of food and motorcyclists taking refuge underneath DUKE near the
Jalan Pahang – Sentul Pasar Interchange Source: Author
Other activities and use of space included informal but allowable parking
sites; since no marking of proper parking lots was observed during the time of the
fieldwork and vehicles were observed and recorded being parked in unmarked
open spaces as shown in Figure 4. Vehicles were seen being parked here primarily
during the daytime, and as night falls, the space would be left empty, unused and
unattended. The unclear function of the space also attracted illegal activities, as
some parts of the spaces was recorded being utilized as illegal dumping sites
(Figure 4).
Figure 4: Ambiguity and vagueness of specific function is represented in these two
photographs underneath DUKE. Source: Author
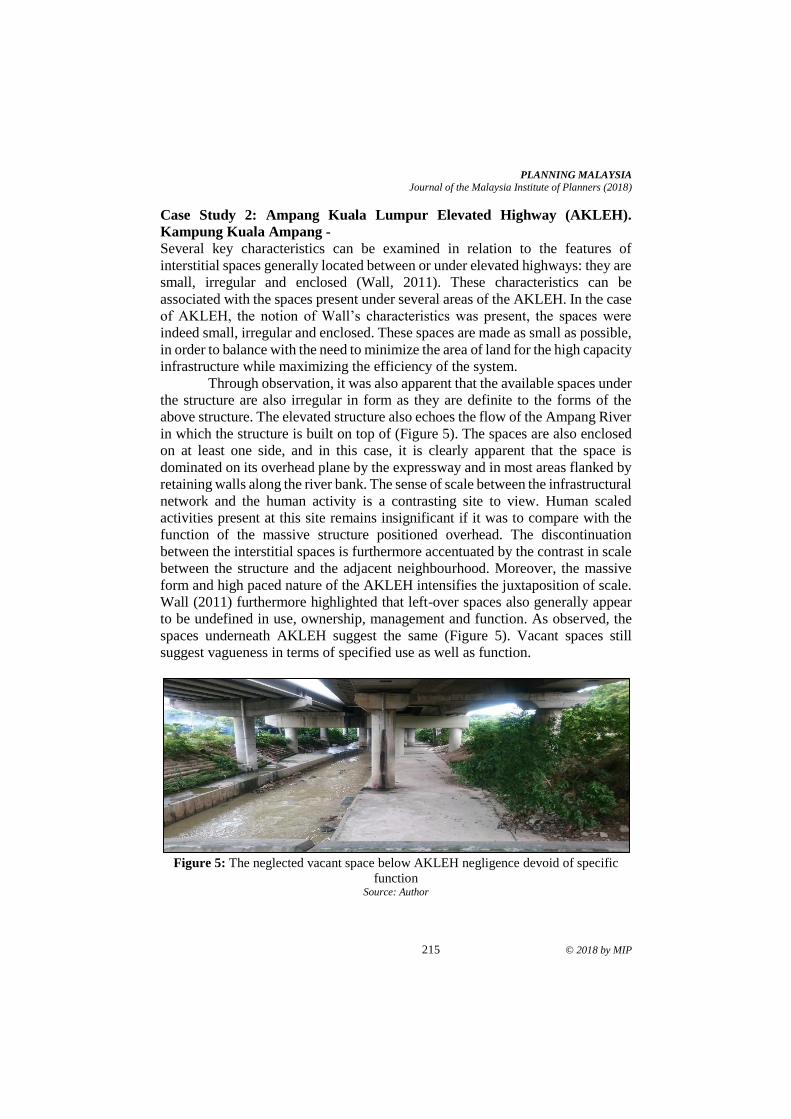
PLANNING MALAYSIA
Journal of the Malaysia Institute of Planners (2018)
215 © 2018 by MIP
Case Study 2: Ampang Kuala Lumpur Elevated Highway (AKLEH).
Kampung Kuala Ampang -
Several key characteristics can be examined in relation to the features of
interstitial spaces generally located between or under elevated highways: they are
small, irregular and enclosed (Wall, 2011). These characteristics can be
associated with the spaces present under several areas of the AKLEH. In the case
of AKLEH, the notion of Wall’s characteristics was present, the spaces were
indeed small, irregular and enclosed. These spaces are made as small as possible,
in order to balance with the need to minimize the area of land for the high capacity
infrastructure while maximizing the efficiency of the system.
Through observation, it was also apparent that the available spaces under
the structure are also irregular in form as they are definite to the forms of the
above structure. The elevated structure also echoes the flow of the Ampang River
in which the structure is built on top of (Figure 5). The spaces are also enclosed
on at least one side, and in this case, it is clearly apparent that the space is
dominated on its overhead plane by the expressway and in most areas flanked by
retaining walls along the river bank. The sense of scale between the infrastructural
network and the human activity is a contrasting site to view. Human scaled
activities present at this site remains insignificant if it was to compare with the
function of the massive structure positioned overhead. The discontinuation
between the interstitial spaces is furthermore accentuated by the contrast in scale
between the structure and the adjacent neighbourhood. Moreover, the massive
form and high paced nature of the AKLEH intensifies the juxtaposition of scale.
Wall (2011) furthermore highlighted that left-over spaces also generally appear
to be undefined in use, ownership, management and function. As observed, the
spaces underneath AKLEH suggest the same (Figure 5). Vacant spaces still
suggest vagueness in terms of specified use as well as function.
Figure 5: The neglected vacant space below AKLEH negligence devoid of specific
function Source: Author
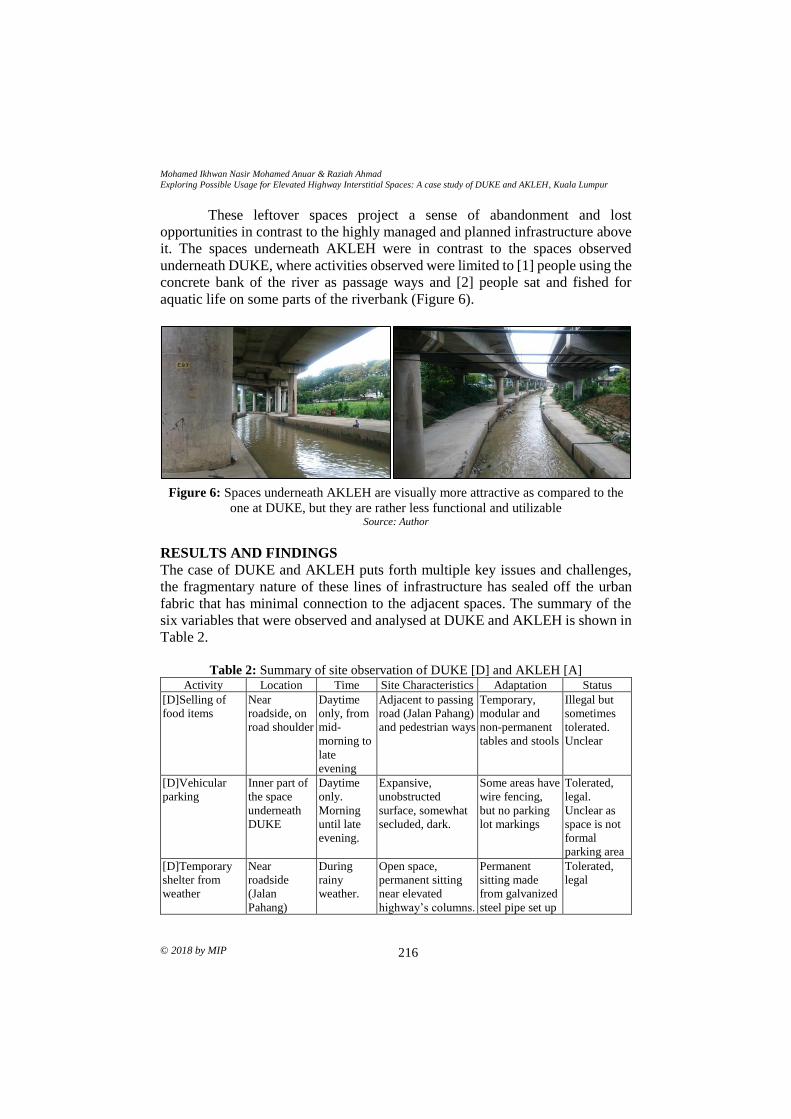
Mohamed Ikhwan Nasir Mohamed Anuar & Raziah Ahmad
Exploring Possible Usage for Elevated Highway Interstitial Spaces: A case study of DUKE and AKLEH, Kuala Lumpur
© 2018 by MIP 216
These leftover spaces project a sense of abandonment and lost
opportunities in contrast to the highly managed and planned infrastructure above
it. The spaces underneath AKLEH were in contrast to the spaces observed
underneath DUKE, where activities observed were limited to [1] people using the
concrete bank of the river as passage ways and [2] people sat and fished for
aquatic life on some parts of the riverbank (Figure 6).
Figure 6: Spaces underneath AKLEH are visually more attractive as compared to the
one at DUKE, but they are rather less functional and utilizable Source: Author
RESULTS AND FINDINGS
The case of DUKE and AKLEH puts forth multiple key issues and challenges,
the fragmentary nature of these lines of infrastructure has sealed off the urban
fabric that has minimal connection to the adjacent spaces. The summary of the
six variables that were observed and analysed at DUKE and AKLEH is shown in
Table 2.
Table 2: Summary of site observation of DUKE [D] and AKLEH [A]
Activity Location Time Site Characteristics Adaptation Status
[D]Selling of
food items
Near
roadside, on
road shoulder
Daytime
only, from
mid-
morning to
late
evening
Adjacent to passing
road (Jalan Pahang)
and pedestrian ways
Temporary,
modular and
non-permanent
tables and stools
Illegal but
sometimes
tolerated.
Unclear
[D]Vehicular
parking
Inner part of
the space
underneath
DUKE
Daytime
only.
Morning
until late
evening.
Expansive,
unobstructed
surface, somewhat
secluded, dark.
Some areas have
wire fencing,
but no parking
lot markings
Tolerated,
legal.
Unclear as
space is not
formal
parking area
[D]Temporary
shelter from
weather
Near
roadside
(Jalan
Pahang)
During
rainy
weather.
Open space,
permanent sitting
near elevated
highway’s columns.
Permanent
sitting made
from galvanized
steel pipe set up
Tolerated,
legal
PLANNING MALAYSIA
Journal of the Malaysia Institute of Planners (2018)
217 © 2018 by MIP
Day and
night
by the local
council to be
used as
sitting/waiting
area for
pedestrians
[D]Waste
dumping
[A]Walking,
Pedestrian route
[A]Fishing
Inner part of
the space
underneath
DUKE
Along
concrete
riverbank
Along
concrete
riverbank
-
Daytime
Daytime
Open space,
secluded area of the
site.
Flat concrete
riverbank
Flat concrete
riverbank, sheltered
overhead by
highway
-
-
-
Illegal
informal
informal
Source: Author
Based on Table 1, the characteristics of the spaces under DUKE and
AKLEH resemble Sola-Morales’ (1995) descriptions in which these are the
spaces with unincorporated margins, interior islands, void of activity, oversights
that often un-inhabited, unsafe and un-productive. In a nutshell, they are foreign
to the urban system, mentally exterior in the physical interior of the city, its
negative image, as much a possible alternative. Apart from that, findings from
both case studies spot three similarities with the Saouma’s (2008) six impacts of
the elevated highways in Beirut. First, the underneath space at DUKE has allow
minimal day light, making this space pretty gloomy, dull and less attractive.
Second, the presence of AKLEH creates both physical and psychological barriers
which segregate and minimize accessibility within the adjacent neighbourhood.
Finally, the characteristics of undefined spaces underneath DUKE and AKLEH
are rather similar to the underpass spaces in Bourj Hammoud, Beirut. It is fuzzy,
misused and unwanted by the communities which could to a certain degree be
associated with potentials of unhealthy and illegal social activities (Halprin 1966;
Branas et al., 2011).
As described in the Kuala Lumpur Structure Plan 2020, infrastructure has
caused adjacent spaces and areas or neighbourhoods to be divided and that they
remain physically close but virtually inaccessible to each other. This key issue is
significantly apparent through the observation of these case studies. The lack of
continuity at the ground level in terms of support activities, scale as well as a
definitive space function has caused severe fragmentation of adjacent spaces
primarily effecting the surrounding areas. This physical and visual fragmentation
is furthermore intensified with the issue of ownership as well as permissible use.
Mohamed Ikhwan Nasir Mohamed Anuar & Raziah Ahmad
Exploring Possible Usage for Elevated Highway Interstitial Spaces: A case study of DUKE and AKLEH, Kuala Lumpur
© 2018 by MIP 218
Further observations and analysis of the site could be suggested as a measure for
a better understanding of how people actually utilize these seldom seen spaces.
Most of the activities observed were temporary and informal in nature. The
challenge is now for both designers and planners to understand how people adapt
to these lost spaces and develop a plan that is systematic and practical for these
spaces but still, in the words of Franck (2011), allow citizens opportunities to
imagine and create their own scenarios.
CONCLUDING REMARKS
Findings from this study suggest that location and characteristics are the most
significant variables which determine types of activities and level of users’
adaptation towards the ambience of undefined spaces created by the elevated
highways. Underneath spaces at DUKE illustrate the more accessible the spaces
within the adjacent neighbourhood, the more likely temporary activities take
place, particularly during day time. In sum, the presence of undefined and less
functional spaces under the elevated DUKE and AKLEH are certainly foreign to
the overall urban system. The occurrence of leftover spaces in urban fabric should
be minimized. Urban intervention which could transform negative spaces into a
more usable and multifunctional public spaces, primarily under the elevated
highway shall be embraced by urban designers and other stakeholders. In the New
Urbanism Paradigm, the tactical approach inspired from urban experiment has
become paramount. It intended to temporarily or permanently transform
underused spaces into outdoor eating areas, park-like spaces or gathering place
through beautification. The phrase use in the Project for Public Spaces “lighter,
quicker, cheaper” shall be adopted to promote various intervention for positive
change in neighbourhood and communities. The suggested approach through
tactical urbanism seems feasible as an effective remedy for redesigning the
unused spaces which could be transform into a meaningful place with a sense of
ownership and attachment.
ACKNOWLEDGEMENT
The authors would like to thank Universiti Teknologi MARA (UiTM) for funding
this research through the LESTARI Grant (Project Code: 600-RMI/DANA
5/3/LESTARI (85/2015), which is provided by The Institute of Research
Management and Innovation (IRMI), Universiti Teknologi MARA, Shah Alam
Selangor.
REFERENCES Akinci, Y. C., Demir, S., & Demirel, O. (2016). Landscape architecture and creating
innovative spaces under highway overpasses. In R. Efe, İ. Cürebal, A. Gad, &
B. Tóth (Eds.), Environmental sustainability and landscape (pp. 1-10). (n.p.):
St. Kliment Ohridski University Press.
PLANNING MALAYSIA
Journal of the Malaysia Institute of Planners (2018)
219 © 2018 by MIP
Anderson, E. C., & Minor, E. S. (2017). Vacant lots: An underexplored resource for
ecological and social benefits in cities. Urban Forestry & Urban Greening, 21,
146-152.
Anuar, M. I. N. M., & Ahmad, R. (2017). Elevated highways and its lost spaces: A review
of Kuala Lumpur‟ s seldom seen. Environment-Behaviour Proceedings
Journal, 2(6), 279-291.
Anuar, M. I. N. M., Saruwono, M., & Said, A.S. (2014, November). Within the shadows:
Infrastructural landscape as urban space reconnector. Regional Conference on
Science, Technology and Social Sciences (RCSTSS 2014). November 23-25,
2014, Cameron Highlands, Pahang, Malaysia.
Barter, P. (2004). Transport, urban structure and lock-in' in the Kuala Lumpur
Metropolitan Area. International Development Planning Review, 26(1), 1-24.
Biesecker, C. (2015). Designing urban under highway spaces (Doctoral dissertation).
University of Georgia, Athens, Georgia, USA.
Branas, C., Cheney, R., Macdonald, J., Tam, V., Jackson, T., & Ten Have, T. (2011). A
difference-in-differences analysis of health, safety, and greening vacant urban
space. American Journal of Epidemiology, 174(11), 1296-1306.
Clements, G. R. (2013). The environmental and social impacts of roads in Southeast Asia
(Doctoral dissertation). James Cook University, Townsville, Australia.
Crisman, P. (2009). Inhabiting the in-between: Architecture and infrastructure
intertwined. University of Virginia School of Architectures.
Doron, G. (2000). The dead zone and the architecture of transgression. City, 4(2), 247-
263.
Forman, R. T., Sperling, D., Bissonette, J. A., Clevenger, A. P., Cutshall, C. D., Dale, V.
H., & Franck, K. A. (2011). Occupying the edge and the underneath- “other”
urban public spaces. In T. Hauck, R. Keller, & V. Kleinekort (Eds.), In T. Hauck,
R. Keller, & V. Kleinekort (Eds.), Infrastructural urbanism - Addressing the in-
between (pp. 117-129). Berlin: DOM Publishers.
Franck, K. A. (2011). Occupying the edge and the underneath - “other” urban public
spaces. In T. Hauck, R. Keller, & V. Kleinekort (Eds.), Infrastructural urbanism
- Addressing the in-between (pp. 117-129). Berlin: DOM Publishers.
Halprin, L. (1966). Freeways. New York: Reinhold Publishing Co.
Harnack, M., & Kohler, M. (2011). As found. Use, meaning and re-appropriation of
contentious urban spaces. In T. Hauck, R. Keller, & V. Kleinekort (Eds.),
Infrastructural urbanism - Addressing the in-between (pp. 131-144). Berlin:
DOM Publishers.
Klia2.info. Malaysia Airport klia2. Retrieved from URL
http://www.klia2.info/trips/highways/duke-duta-ulu-kelang-expressway
Kremer, P., & Hamstead, Z. (2015). Transformation of urban vacant lots for the common
good: an introduction to the special issue. Cities and the Environment
(CATE), 8(2), 1.
Malterre Barthes, C. (2011). The highway's shadow. In T. Hauck, R. Keller, & V.
Kleinekort (Eds.), Infrastructural urbanism - Addressing the in-between (pp. 93-
108). Berlin: DOM Publishers.
Mossop, E. (2006). Landscapes of Infrastructure. In C. Waldheim (Ed.), The landscape
urbanism reader (pp. 163-178). New York: Princeton Architectural Press.
Mohamed Ikhwan Nasir Mohamed Anuar & Raziah Ahmad
Exploring Possible Usage for Elevated Highway Interstitial Spaces: A case study of DUKE and AKLEH, Kuala Lumpur
© 2018 by MIP 220
Qamaruz-Zaman, N., Samadi, Z., & Azhari, N. F. N. (2013). Under the flyovers of Kuala
Lumpur: User centred activities in leftover spaces. Journal of Asian Behaviour
Studies, 3(10), 89-103.
Prasetyo, F. A., & Martin-Iverson, S. (2015). Playing under the fly over: A collaborative
creative community in Bandung. Procedia-Social and Behavioral Sciences, 184,
30-39.
Sanches, P. M. & Pellegrino, P. R. M. (2016). Greening potential of derelict and vacant
lands in urban areas. Urban Forestry & Urban Greening, 19, 128-139.
Saouma, R. (2008). When a city embraces its paradoxes: Exploring the potential of public
spaces under elevated highways: A case study in Bourj Hammoud, Beirut
(Master’s thesis). Wageningen University & Research, Wageningen, the
Netherlands.
Sola-Morales, I. (1995). Terrain vague. Cambridge: MA. MIT Press.
SWA Group (2011). Design briefing: Landscape infrastructure– a tool for making our
cities better. (n.p.): SWA Group.
Trancik, R. (1986). Finding Lost Space: Theories of Urban Design. New York: Van
Nostrand Reinhold.
Wall, E. (2011). Infrastructural form, interstitial spaces and informal acts. In T. Hauck,
R. Keller, & V. Kleinekort (Eds.), Infrastructural urbanism - Addressing the in-
between (pp. 145-157). Berlin: DOM Publishers.
1Associate professor at Universiti Teknologi Malaysia. Email: [email protected] 221
PLANNING MALAYSIA:
Journal of the Malaysian Institute of Planners
VOLUME 16 ISSUE 3 (2018) Page 221 – 232
GIS-BASED REGRESSION ANALYSIS OF THE RELATIONSHIP
BETWEEN ECOLOGICAL FOOTPRINT AND ECONOMIC
DEVELOPMENT OF SELECTED COUNTRIES
M. Rafee Majid1 & Musarrat Zaman2
Faculty of Built Environment
UNIVERSITI TEKNOLOGI MALAYSIA
Abstract
Ecological footprint is an innovative concept to present the consumption of
natural resources and generation of waste in terms of the Earth biological carrying
capacity in a standardized format. The Earth overall sustainability can also be
measured with the idea of ecological footprint and bio-capacity. The aim of this
paper is to analyse the interactive spatial relationship between economic
development and ecological footprints of selected nations. The GIS-based spatial
regression tool Ordinary Least Square (OLS) and Geographically Weighted
Regression (GWR) are used for fulfilling the purpose. Individual components of
ecological footprints - cropland, grazing land, fishing ground, forest land, built-
up land and carbon footprints - are also analysed against the per capita GDP of
the nations in order to understand the interrelationship between them. The
analysis has found a significant relationship between ecological footprint and
economic development and the OLS model can explain approximately 64% of
the variation in the dependent variable with the explanatory variables. The study
has also found that nation’s economic development contributes much in
increasing the carbon footprint. The resulted outcome is significant enough to
warrant a study on the spatial dimension of environment and economy in order to
analyse the individual nation’s economic growth and its relationship with
environmental degradation, which can ultimately influence the global
environmental sustainability.
Keywords: ecological footprint, economic development, sustainability,
regression analysis
M. Rafee Majid & Musarrat Zaman
GIS-Based Regression Analysis of The Relationship Between Ecological Footprint and Economic Development of Selected
Countries
© 2018 by MIP 222
INTRODUCTION
There is always an integrated relationship between economic growth and
environmental impact on the development of human civilization. Natural
ecosystem is one of the major components of the environment that has an
inevitable connection with the economic activities (Wang, Kang, Wu & Xiao,
2013) and the needs of human are supposed be met through balancing the
ecological components without compromising the health of ecosystems (Callicott
& Mumford, 1997). However, overconsumption of natural assets can turn into
the degradation of ecological system services in general and leads towards the
depletion that can hardly be restored (MEA, 2005). In this situation, the
sustainability of the environment cannot be ensured. In order to seek balance
between these two factors, a considerable interest in analysing this
interrelationship has been geared up among researchers over the past decades and
the idea of ecological footprint was developed.
Ecological footprint is an important concept that estimates the Earth
biological carrying capacity required to support the resource use of human and
their produced waste in a standardized format (Venetoulis & Talberth, 2008).
According to Wackernagel et al. (2005), ecological footprint measures how much
of the annual regenerative capacity of the biosphere is required to renew the
resource input of a defined population in a given year. The total productive land
area is calculated on Global Hectare (GHA) unit that supplies the natural
resources and processes the wastes of a particular entity. Ecological footprint is
most commonly used to estimate a nation’s consumption in National Footprint
Accounts (NFAs), consisting the aggregate result of six individual sectors made
up of cropland footprint, grazing footprint, forest land, carbon footprint, fish
footprint and total built up land (Lin et al., 2016).
The NFAs determine whether a particular country exceeds its ecological
limits by consuming more renewable products than could be sustainably
produced on the available land area of that country that is called “bio-capacity”.
Although, the NFAs of countries are measured every year to show total bio-
capacity reserve and deficits, particular study is required to represent the specific
relationship between a country’s economic growth as well as particular socio-
economic development indicators and the ecological footprint. Geographic
Information System (GIS) can efficiently exhibit both of the statistical and spatial
interrelationship between these ecological variables with the economic
components using regression analysis (Anselin, 1998). Thus, the primary aim of
this study is to analyse and visualize the relationship between ecological footprint
and economic factors using the ArcGIS spatial analytics tools to understand the
environmental sustainability of the countries. The first objective of the study is to
analyse the relationship between per capita Gross Domestic Product (GDP),
Human Development Index (HDI), income inequality and total population with
the ecological footprint of some selected countries. The second objective is to
PLANNING MALAYSIA
Journal of the Malaysia Institute of Planners (2018)
223 © 2018 by MIP
measure the interrelationship of cropland, grazing land, forest land, carbon, fish
ground and total built up land footprints with the per capita GDP of the selected
countries.
DATA AND METHODS
This study is based on the fundamentals of linear regression analysis. The specific
data regarding ecological footprints and other economic and socio-economic
factors of the countries are collected from online sources. National Footprint
Accounts (NFAs) Data Package of the global nations calculated by Global
Footprint Network (GFN) organization is downloaded from
www.footprintnetwork.org. In the year 2012, the NFAs calculated the Footprints
of 232 countries, territories, and regions from 1961 to the present. This Data
Package contains ecological footprint and bio-capacity data including cropland
footprint, grazing footprint, carbon footprint, fish footprint, total built up land and
total EF and bio-capacity data for year 2012; HDI and total population of the
countries; per capita GDP; level of income group of the countries within the year
2012. Again for the indicator of income inequalities, the latest Gini Index of the
respective countries is downloaded from World Bank’s website (World Bank,
2017). The world vector map consisting the shape files of each country is
downloaded from Thematic Mapping Website (thematicmapping, n.d.).
The GIS-based multiple regression analysis is the key analysis of this
research. The data analysis of this study is based on Ordinary Least Square
Regression (OLSR) as well as Geographically Weighted Regression (GWR) for
fulfilling the first objective. Statistical and spatial analysis are done on both the
software of ArcGIS and MS Excel. For that Ordinary Least Square Analysis and
Geographically Weighted Regression Analysis tools are used. Only 203 out of
232 countries are analysed for OLSR and GWR, due to missing data in the other
29 countries. For the multiple regression analysis on MS Excel, only 161
countries are considered.
Ordinary Least Squares (OLS) linear regression is a global regression
model that can generate predictions and model the relationship of a dependent
variable in terms of a set of explanatory variables. It determines the
heteroscedasticity or non-stationarity of the global data and confirms the
applicability of GWR for further steps. The basic equation is as follows:
Y= β0+β1X1+ β2X2+……… βnXn+ε (1)
Here, Dependent variable (Y): Ecological Footprint; and Explanatory
variables (X): Per Capita GDP, HDI, Gini Index and total population. The values
are computed by the regression tool that expresses the relationship and strength
of each explanatory variable with the dependent variable. The sign for the
M. Rafee Majid & Musarrat Zaman
GIS-Based Regression Analysis of The Relationship Between Ecological Footprint and Economic Development of Selected
Countries
© 2018 by MIP 224
respective coefficient is positive if the relationship is positive whereas negative
relationships is expressed with negative signs of the coefficients.
Global OLS calculates various statistics and makes the validity of
transferring in GWR analysis through the model performance assessments,
assessment of each explanatory variable in the model (coefficient, probability or
robust probability, and variance inflation factor (VIF), model significance
assessment, stationarity assessment, model biasness assessment and residual
spatial autocorrelation assessment). If the model proven to be non-stationary or
spatial heterogeneity, then GWR can be applied for the next analysis. The spatial
heterogeneity is then analysed using the sophisticated tool of ArcGIS, which is
known as Geographically Weighted Regression (GWR). It is local regression
model for analysing the spatial heterogeneity. If the modelled structure of the
process varies across the study area, the spatial heterogeneity occurs.
RESULTS AND DISCUSSION
Relationship between Per Capita GDP, HDI, Income Inequality and Total
Population with the Ecological Footprint
Ordinary Least Square (OLS) tool was used for performing global regression
analysis in ArcGIS. The shapefile of the global map including the necessary
attribute table was given as input feature class. The Unique ID Field was given
as UN, which is a unique integer number of the attribute table. Countries’ total
ecological footprint was the dependent variable whereas HDI, Per capita GDP,
Population size and Gini Index were explanatory variables.
The OLSR was operated on the variables of total 203 observations and
produced detail analysis report on the observations and operation. According to
the values of coefficient of the explanatory variables, intercept and standard
residuals, an equation of the model was formed as follows;
EF=1.295+2.702HDI+0.000071PER_CAPITA_GDP-.000228POPULATION-
0.024569GINI_INDEX (2)
It provided various information and interpretation techniques for the
generated statistics. Firstly, it shows the Akaike Information Criterion (AIC)
value. The AIC (Akaike Information Criterion) is an estimator of the relative
quality of statistical models regularly used as a means for model selection. It
estimates the quality of each model, relative to each of the other models. Lower
AIC value is preferred over higher one. For this model, the AIC was quite small
(718.5).
The OLSR was also used to analyse several statistical results and assess
the model performance and validity. For example, both the Multiple R-Squared
and Adjusted R-Squared values are measures of model performance. Here, Table
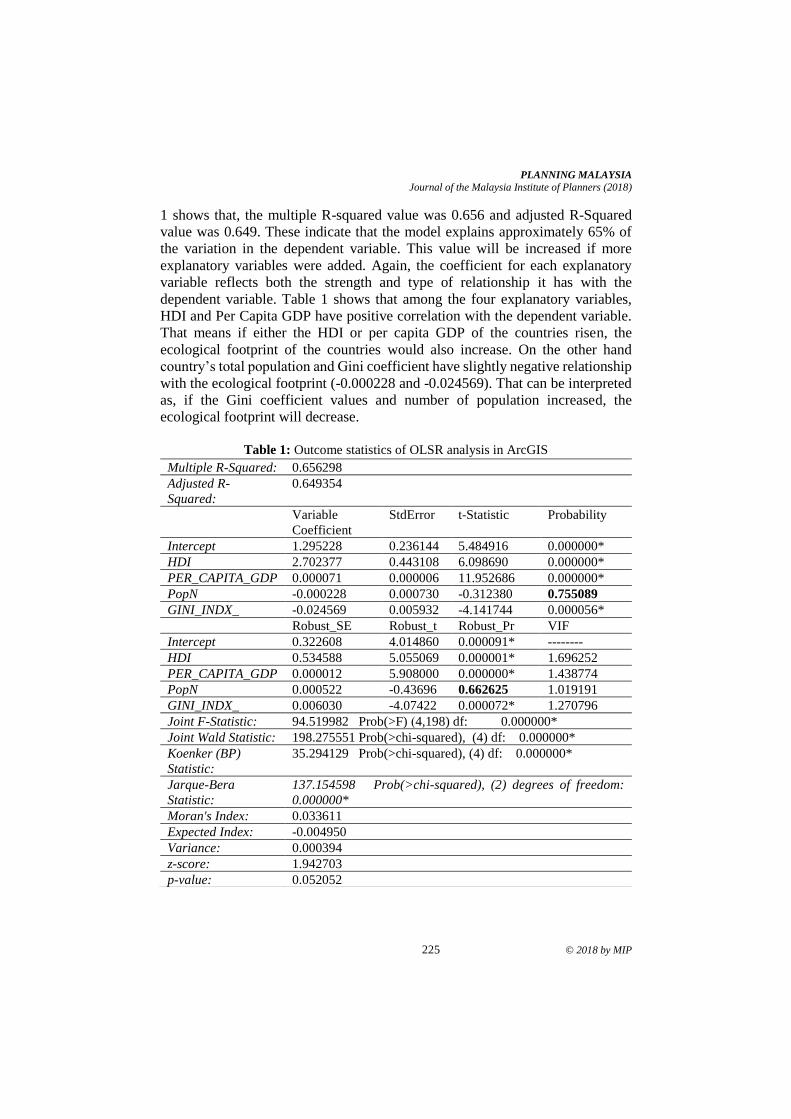
PLANNING MALAYSIA
Journal of the Malaysia Institute of Planners (2018)
225 © 2018 by MIP
1 shows that, the multiple R-squared value was 0.656 and adjusted R-Squared
value was 0.649. These indicate that the model explains approximately 65% of
the variation in the dependent variable. This value will be increased if more
explanatory variables were added. Again, the coefficient for each explanatory
variable reflects both the strength and type of relationship it has with the
dependent variable. Table 1 shows that among the four explanatory variables,
HDI and Per Capita GDP have positive correlation with the dependent variable.
That means if either the HDI or per capita GDP of the countries risen, the
ecological footprint of the countries would also increase. On the other hand
country’s total population and Gini coefficient have slightly negative relationship
with the ecological footprint (-0.000228 and -0.024569). That can be interpreted
as, if the Gini coefficient values and number of population increased, the
ecological footprint will decrease.
Table 1: Outcome statistics of OLSR analysis in ArcGIS
Multiple R-Squared: 0.656298
Adjusted R-
Squared:
0.649354
Variable
Coefficient
StdError t-Statistic
Probability
Intercept 1.295228 0.236144 5.484916 0.000000*
HDI 2.702377 0.443108 6.098690 0.000000*
PER_CAPITA_GDP 0.000071 0.000006 11.952686 0.000000*
PopN -0.000228 0.000730 -0.312380 0.755089
GINI_INDX_ -0.024569 0.005932 -4.141744 0.000056*
Robust_SE Robust_t Robust_Pr VIF
Intercept 0.322608 4.014860 0.000091* --------
HDI 0.534588 5.055069 0.000001* 1.696252
PER_CAPITA_GDP 0.000012 5.908000 0.000000* 1.438774
PopN 0.000522 -0.43696 0.662625 1.019191
GINI_INDX_ 0.006030 -4.07422 0.000072* 1.270796
Joint F-Statistic: 94.519982 Prob(>F) (4,198) df: 0.000000*
Joint Wald Statistic: 198.275551 Prob(>chi-squared), (4) df: 0.000000*
Koenker (BP)
Statistic:
35.294129 Prob(>chi-squared), (4) df: 0.000000*
Jarque-Bera
Statistic:
137.154598 Prob(>chi-squared), (2) degrees of freedom:
0.000000*
Moran's Index: 0.033611
Expected Index: -0.004950
Variance: 0.000394
z-score: 1.942703
p-value: 0.052052
M. Rafee Majid & Musarrat Zaman
GIS-Based Regression Analysis of The Relationship Between Ecological Footprint and Economic Development of Selected
Countries
© 2018 by MIP 226
T-test was used to assess whether or not an explanatory variable was
statistically significant. In this model, for three explanatory variables (HDI, Per
Capita GDP and Gini index), the p value of the t-statistics was less than 0.05,
which indicates that these variables were statistically significant for explaining
ecological footprint. On the other hand, total population of the country did not
have significant statistical relationship with the total ecological footprint; the
possible reason has been discussed in the previous section.
In addition, the variance inflation factor (VIF) measures redundancy
among explanatory variables. In this model, there was no such variable with the
VIF value greater than 7.5. So, none of the variables needs to be excluded from
the model.
Both the Joint F-Statistic and Joint Wald Statistic are measures of overall
model statistical significance. The Joint F-Statistic is trustworthy only when the
Koenker (BP) statistic is not statistically significant. If the Koenker (BP) statistic
was significant, the Joint Wald Statistic should be consulted to determine overall
model significance. Table 1 shows that the probability values for all three of the
F-statistics, Wald statistics and Koenker (BP) statistics were less than 0.05, which
means the model is statistically significant and has a statistically significant
heteroscedasticity or non-stationarity. As, regression models with statistically
significant non-stationarity are especially good candidates for GWR analysis,
from the OLS model, it can be preferred that GWR analysis will have a significant
result using these three variables except country’s total population.
The Jarque-Bera statistic indicates whether or not the residuals are
normally distributed in the model. From Figure 1, it can be seen that the histogram
of the standardized residuals of this model depicts a form of normal distribution
with a classic bell curve, meaning that the model is not biased. Likewise Jarque-
Bera statistic, the Spatial Autocorrelation (Moran's I) tool on the regression
residuals ensures that they are spatially random and the statistically significant
clustering of high or low residuals indicates a key variable is missing from the
model (misspecification) and the model is under and over predictions. OLS
results cannot be trusted when the model is misspecified. Here, results from
running the Spatial Autocorrelation tool on the regression residuals indicates they
were randomly distributed and the z-score was not statistically significant. So it
can be accepted the null hypothesis of complete spatial randomness. Given the z-
score of 1.94, this indicates that there is a less than 10% likelihood that this
clustered pattern could be the result of random chance.
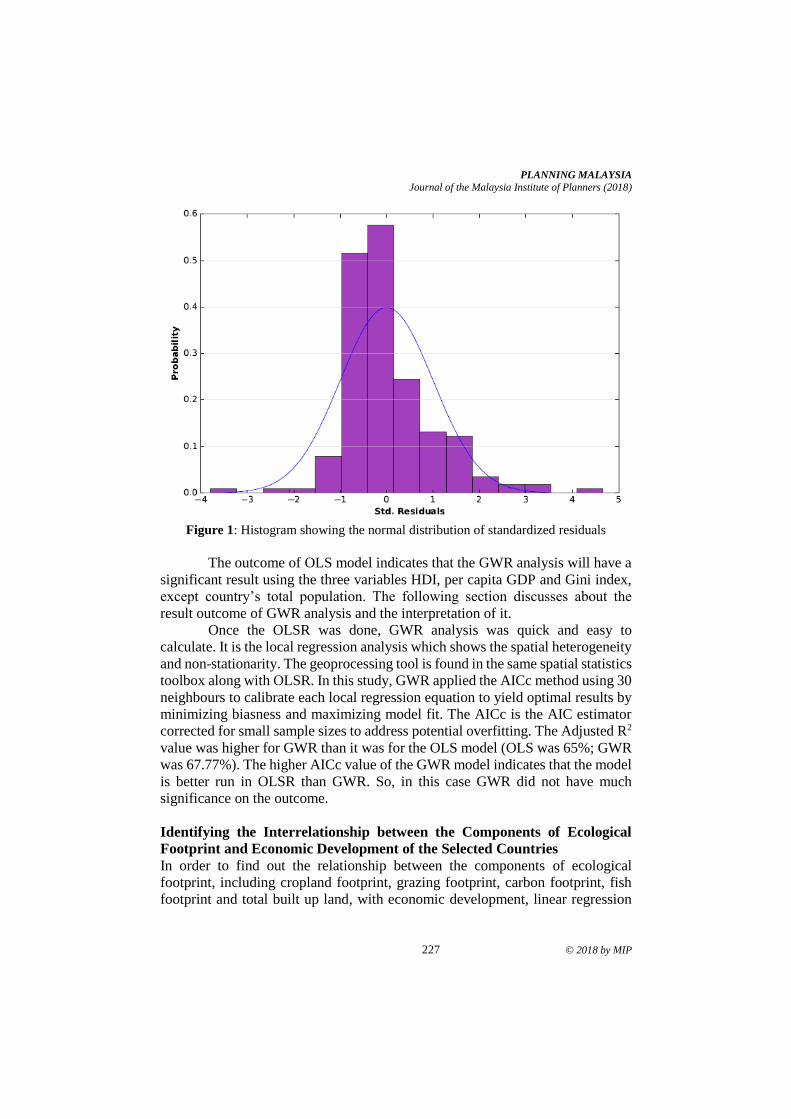
PLANNING MALAYSIA
Journal of the Malaysia Institute of Planners (2018)
227 © 2018 by MIP
Figure 1: Histogram showing the normal distribution of standardized residuals
The outcome of OLS model indicates that the GWR analysis will have a
significant result using the three variables HDI, per capita GDP and Gini index,
except country’s total population. The following section discusses about the
result outcome of GWR analysis and the interpretation of it.
Once the OLSR was done, GWR analysis was quick and easy to
calculate. It is the local regression analysis which shows the spatial heterogeneity
and non-stationarity. The geoprocessing tool is found in the same spatial statistics
toolbox along with OLSR. In this study, GWR applied the AICc method using 30
neighbours to calibrate each local regression equation to yield optimal results by
minimizing biasness and maximizing model fit. The AICc is the AIC estimator
corrected for small sample sizes to address potential overfitting. The Adjusted R2
value was higher for GWR than it was for the OLS model (OLS was 65%; GWR
was 67.77%). The higher AICc value of the GWR model indicates that the model
is better run in OLSR than GWR. So, in this case GWR did not have much
significance on the outcome.
Identifying the Interrelationship between the Components of Ecological
Footprint and Economic Development of the Selected Countries
In order to find out the relationship between the components of ecological
footprint, including cropland footprint, grazing footprint, carbon footprint, fish
footprint and total built up land, with economic development, linear regression
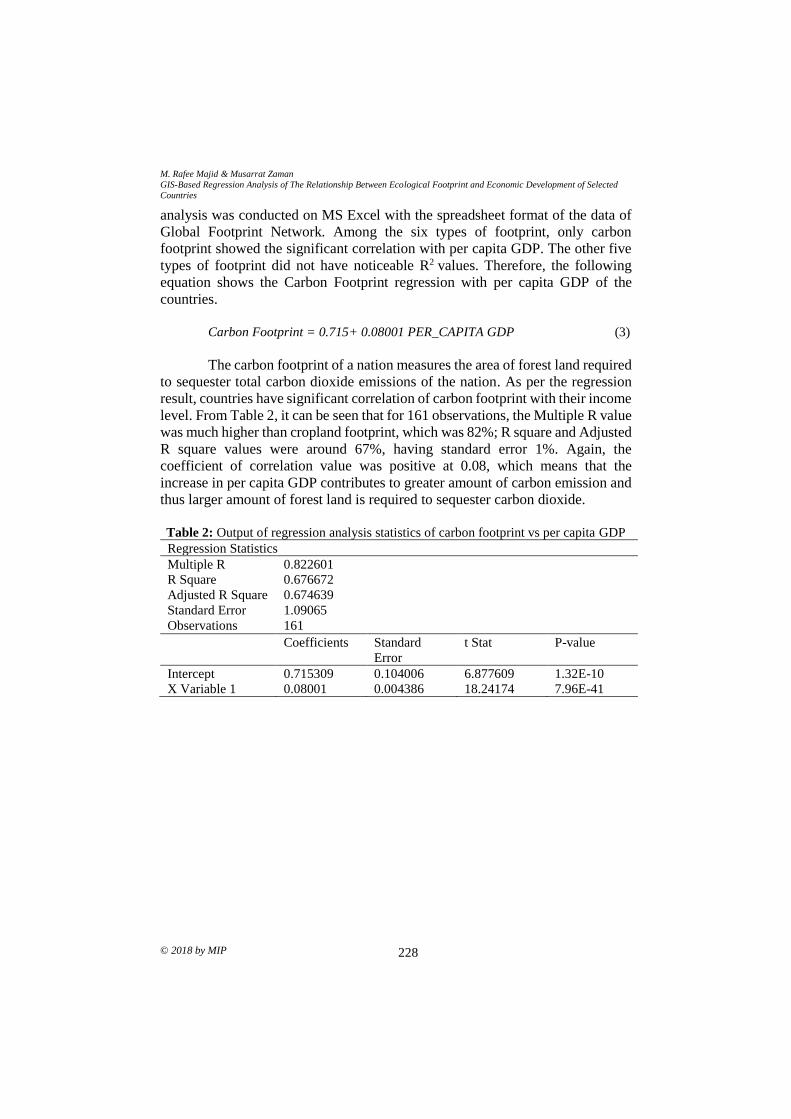
M. Rafee Majid & Musarrat Zaman
GIS-Based Regression Analysis of The Relationship Between Ecological Footprint and Economic Development of Selected
Countries
© 2018 by MIP 228
analysis was conducted on MS Excel with the spreadsheet format of the data of
Global Footprint Network. Among the six types of footprint, only carbon
footprint showed the significant correlation with per capita GDP. The other five
types of footprint did not have noticeable R2 values. Therefore, the following
equation shows the Carbon Footprint regression with per capita GDP of the
countries.
Carbon Footprint = 0.715+ 0.08001 PER_CAPITA GDP (3)
The carbon footprint of a nation measures the area of forest land required
to sequester total carbon dioxide emissions of the nation. As per the regression
result, countries have significant correlation of carbon footprint with their income
level. From Table 2, it can be seen that for 161 observations, the Multiple R value
was much higher than cropland footprint, which was 82%; R square and Adjusted
R square values were around 67%, having standard error 1%. Again, the
coefficient of correlation value was positive at 0.08, which means that the
increase in per capita GDP contributes to greater amount of carbon emission and
thus larger amount of forest land is required to sequester carbon dioxide.
Table 2: Output of regression analysis statistics of carbon footprint vs per capita GDP
Regression Statistics
Multiple R
R Square
Adjusted R Square
Standard Error
Observations
0.822601
0.676672
0.674639
1.09065
161
Coefficients Standard
Error
t Stat P-value
Intercept
X Variable 1
0.715309
0.08001
0.104006
0.004386
6.877609
18.24174
1.32E-10
7.96E-41
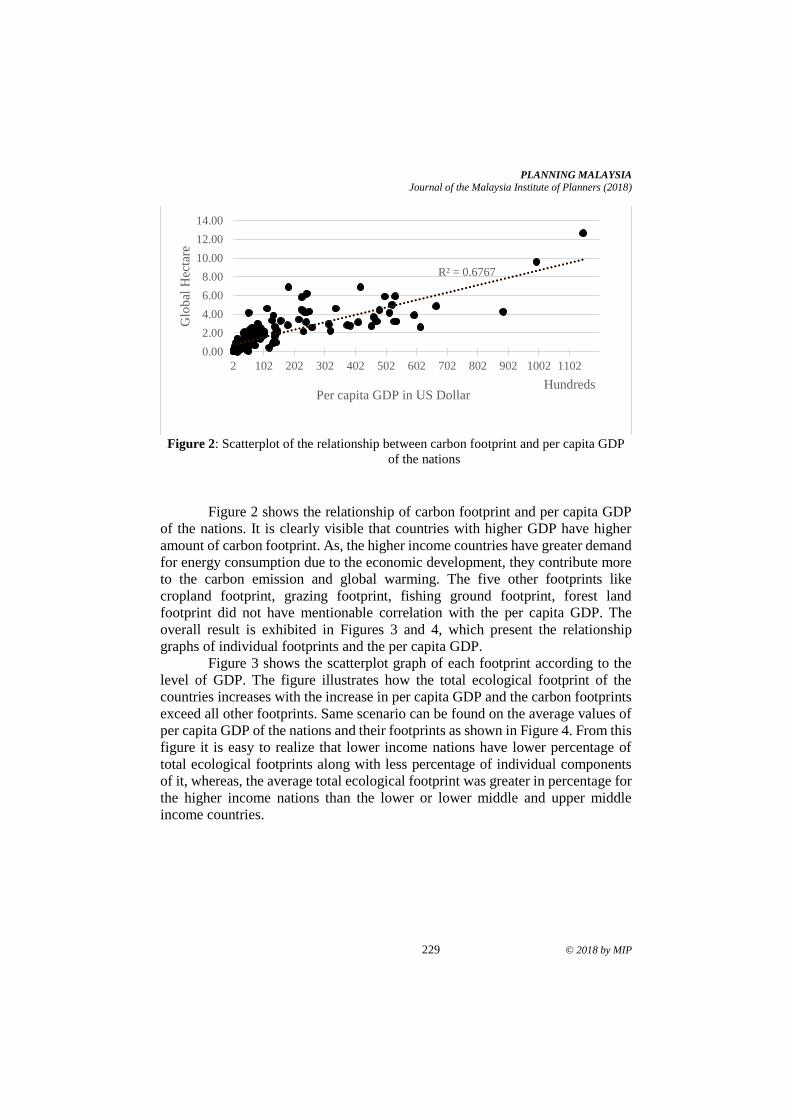
PLANNING MALAYSIA
Journal of the Malaysia Institute of Planners (2018)
229 © 2018 by MIP
Figure 2: Scatterplot of the relationship between carbon footprint and per capita GDP
of the nations
Figure 2 shows the relationship of carbon footprint and per capita GDP
of the nations. It is clearly visible that countries with higher GDP have higher
amount of carbon footprint. As, the higher income countries have greater demand
for energy consumption due to the economic development, they contribute more
to the carbon emission and global warming. The five other footprints like
cropland footprint, grazing footprint, fishing ground footprint, forest land
footprint did not have mentionable correlation with the per capita GDP. The
overall result is exhibited in Figures 3 and 4, which present the relationship
graphs of individual footprints and the per capita GDP.
Figure 3 shows the scatterplot graph of each footprint according to the
level of GDP. The figure illustrates how the total ecological footprint of the
countries increases with the increase in per capita GDP and the carbon footprints
exceed all other footprints. Same scenario can be found on the average values of
per capita GDP of the nations and their footprints as shown in Figure 4. From this
figure it is easy to realize that lower income nations have lower percentage of
total ecological footprints along with less percentage of individual components
of it, whereas, the average total ecological footprint was greater in percentage for
the higher income nations than the lower or lower middle and upper middle
income countries.
R² = 0.6767
0.00
2.00
4.00
6.00
8.00
10.00
12.00
14.00
2 102 202 302 402 502 602 702 802 902 1002 1102
Glo
bal
Hec
tare
Per capita GDP in US DollarHundreds
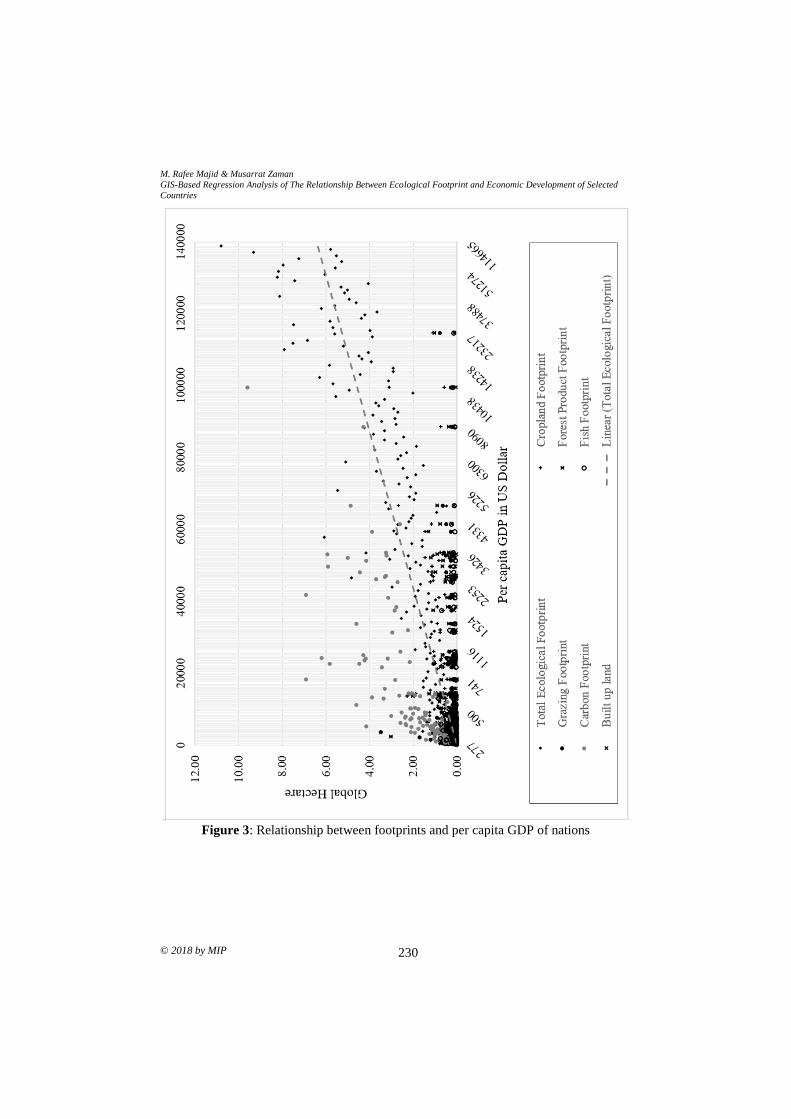
M. Rafee Majid & Musarrat Zaman
GIS-Based Regression Analysis of The Relationship Between Ecological Footprint and Economic Development of Selected
Countries
© 2018 by MIP 230
Figure 3: Relationship between footprints and per capita GDP of nations
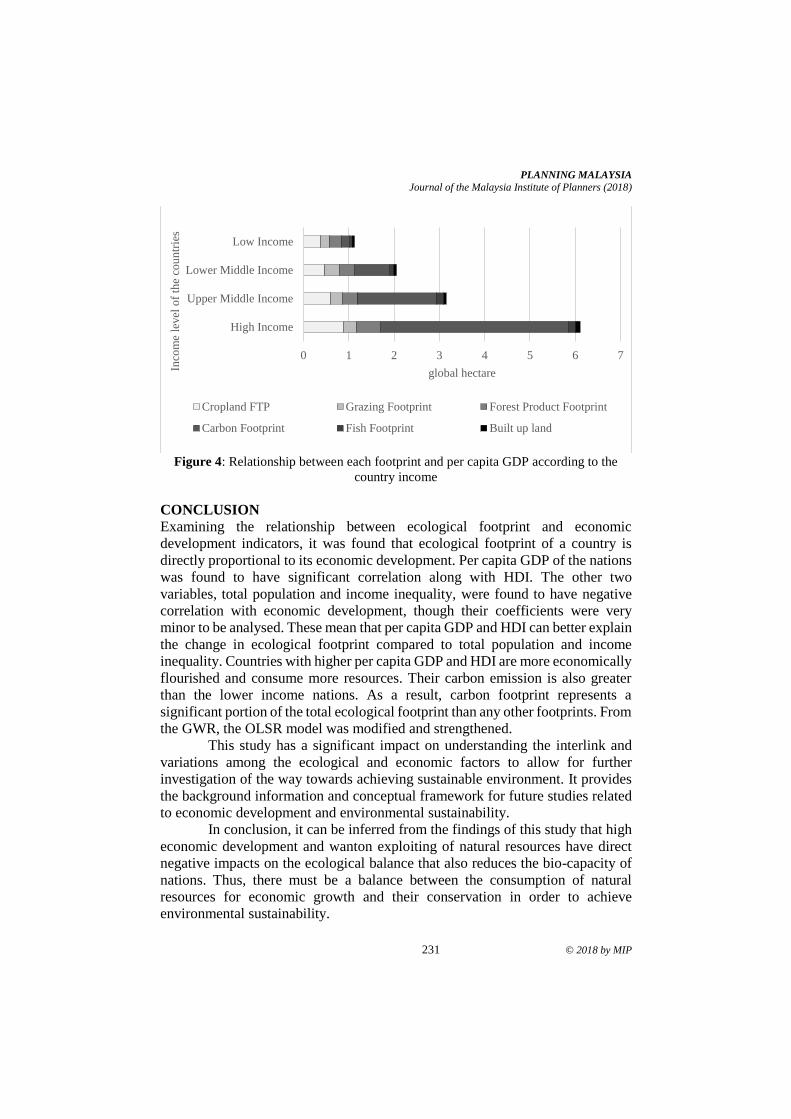
PLANNING MALAYSIA
Journal of the Malaysia Institute of Planners (2018)
231 © 2018 by MIP
Figure 4: Relationship between each footprint and per capita GDP according to the
country income
CONCLUSION
Examining the relationship between ecological footprint and economic
development indicators, it was found that ecological footprint of a country is
directly proportional to its economic development. Per capita GDP of the nations
was found to have significant correlation along with HDI. The other two
variables, total population and income inequality, were found to have negative
correlation with economic development, though their coefficients were very
minor to be analysed. These mean that per capita GDP and HDI can better explain
the change in ecological footprint compared to total population and income
inequality. Countries with higher per capita GDP and HDI are more economically
flourished and consume more resources. Their carbon emission is also greater
than the lower income nations. As a result, carbon footprint represents a
significant portion of the total ecological footprint than any other footprints. From
the GWR, the OLSR model was modified and strengthened.
This study has a significant impact on understanding the interlink and
variations among the ecological and economic factors to allow for further
investigation of the way towards achieving sustainable environment. It provides
the background information and conceptual framework for future studies related
to economic development and environmental sustainability.
In conclusion, it can be inferred from the findings of this study that high
economic development and wanton exploiting of natural resources have direct
negative impacts on the ecological balance that also reduces the bio-capacity of
nations. Thus, there must be a balance between the consumption of natural
resources for economic growth and their conservation in order to achieve
environmental sustainability.
0 1 2 3 4 5 6 7
High Income
Upper Middle Income
Lower Middle Income
Low Income
global hectare
Inco
me
level
of
the
cou
ntr
ies
Cropland FTP Grazing Footprint Forest Product Footprint
Carbon Footprint Fish Footprint Built up land
M. Rafee Majid & Musarrat Zaman
GIS-Based Regression Analysis of The Relationship Between Ecological Footprint and Economic Development of Selected
Countries
© 2018 by MIP 232
REFERENCES Anselin, L. (1998). GIS research infrastructure for spatial analysis of real estate markets.
Journal of Housing Research, 9(1), 113-133.
Callicott, J. B., & Mumford, K. (1997). Ecological sustainability as a conservation
concept. Conservation Biology, 11(1), 32-40.
Lin, D., Hanscom, L., Martindill, J., Borucke, M., Cohen, L., Galli, A.,...& Wackernagel,
M. (2016). Working Guidebook to the National Footprint Accounts: 2016
Edition. Oakland: Global Footprint Network.
Millennium Ecosystem Assessment [MEA]. (2005). Ecosystems and human well-being:
Synthesis. Washington, DC: Island Press.
thematicmapping (n.d.). World borders dataset. Retrieved February 10, 2017 from http://
thematicmapping.org/downloads/world_borders.php
Venetoulis, J., & Talberth, J. (2008). Refining the ecological footprint. Environment
Development and Sustainability, 10, 441-469.
Wackernagel, M., Monfreda, C., Moran, D., Wermer, P., Goldfinger, S., & Deumling, D.
(2005). National footprint and biocapacity accounts 2005: The underlying
calculation method. Land Use Policy, 21, 231-246.
Wang, Y., Kang, L., Wu, X., & Xiao, Y. (2013). Estimating the Environmental Kuznets
curve for ecological footprint at the global level: A spatial econometric
approach. Ecological Indicators, 34, 15-21.
World Bank (2017). GINI index (World Bank estimate). Retrieved February 10, 2017
from http://data. worldbank.org /indicator/SI.POV.GINI
2Associate professor at International Islamic University Malaysia. Email: [email protected] 233
PLANNING MALAYSIA:
Journal of the Malaysian Institute of Planners
VOLUME 16 ISSUE 3 (2018) Page 233 – 247
EVALUATING TRAVEL TIME AND PASSENGER RIDERSHIP OF
UNIVERSITY SHUTTLE BUS SERVICE
Nur Syahira Zulkefly1 & Abdul Azeez Kadar Hamsa2
1,2Kulliyyah of Architecture and Environmental Design
INTERNATIONAL ISLAMIC UNIVERSITY MALAYSIA
Abstract
Poor service adherence to the scheduled timetable and less service frequency
during peak hours have contributed to unreliable shuttle bus services in
International Islamic University Malaysia. As a result, students use either private
vehicles or walk on-campus rather than riding the shuttle buses. This paper
analyse travel time and passenger ridership of shuttle bus services from field
surveys on journey time, running time, dwell time and passenger volume along
Mahallah Ruqayyah and Mahallah Salahuddin shuttle bus routes. One of the key
results on travel time indicates poor service adherence by bus service providers.
In terms of passenger ridership, there was a huge gap between Mahallah
Ruqayyah and Mahallah Salahuddin route where Mahallah Salahuddin has
recorded a low passenger ridership even during peak hours. The findings also
show that the service frequency of shuttle bus during peak hours cannot
accommodate all students and therefore students either walk or use private
vehicles to commute within campus area. Recommendations on the improvement
of shuttle bus services are also discussed in this paper.
Keywords: shuttle bus, passenger ridership, travel time, IIUM, dwell time
Nur Syahira Zulkefly & Abdul Azeez Kadar Hamsa
Evaluating Travel Time and Passenger Ridership of University Shuttle Bus Service
© 2018 by MIP 234
INTRODUCTION
One of the main roles of public transportation is to provide adequate mobility and
wide connectivity to major land uses at an affordable fare to a larger population
at both urban and regional level. The use of public transport depends very much
on how efficient, reliable, quick, comfortable and economical that the transport
services provided for to a larger population. The high use of public transport is
seen as an advantage to the society in terms of reducing traffic congestion,
decreasing parking demand, and reducing noise and air pollutions. The public
transport services for an University campus is very important because it provides
not only better accessibility to a wider University population but also help to serve
in mitigating the increased number of private vehicle use. Shuttle bus service is
one of the public transportation system provided in International Islamic
University Malaysia (IIUM), Gombak campus to serve students from students’
residential areas on-campus to the main academic and administrative centres.
Presently, the services are provided along two routes, one connecting female
residential (Mahallah) areas to the main academic and administrative centres and
other connecting male residential areas to main academic and administrative
centres. Since the introduction of the shuttle bus services on-campus, the use of
these services has been declining due to decrease in service performance related
factors such as increase in travel time and low service frequency. As a result,
many students on-campus either walk or use motorcars and motorcycles for their
daily travel between residential areas and main academic and administrative
centres. The purpose of this paper is to investigate the travel time and passenger
ridership of the two shuttle bus service routes in IIUM. It is to ascertain the
existing service performances of these services along the two selected bus routes.
The findings of this study are expected to shed lights on the application of
measures to improve public shuttle bus services on-campus and as a result help
decrease the use of private transport.
SHUTTLE BUS AND SHUTTLE BUS SERVICES IN IIUM
The advantages of public transport system are obvious in the sense that it
transport large number of people from one place to another in a less number of
vehicles. Public transport is intended to provide passenger transport services
operating on established schedules along designated routes with specific stops
and available to any individual in a community for a fare. Optimal organizational
structure should be established to maximize the use of public transport, non-
motorized transport and minimize the use of private vehicles for the benefits of
less energy consumption, greenhouse gas emission and use of urban spaces
(Shibayama, 2011). Shuttle service is normally provided between two major points of
interest. “Point to point shuttle and line renders demand for travel between
PLANNING MALAYSIA
Journal of the Malaysia Institute of Planners (2018)
235 © 2018 by MIP
different activity centres such as shopping centres, tourism areas and airports
(Vuchic, 2007). Buses, vans and rail transit are generally used to transport people
between these activities. Generally, non-stop services are provided between these
activities. However, the routes may have stops in between if demanded by the
passengers.
One of the important indicators for the success of the shuttle bus services
is travel time. Travel time is broadly defined as the time required to traverse a
route between any two points of interest (Turner, Eisele, Benz, & Holdener,
1998). Travel time can be directly measured by traversing the routes that connects
two or more stations along the route. Travel time is usually related to several
factors such as characteristics of the driver, the vehicle, traffic incidents, traffic
management system, and weather patterns (Turner et al., 1998). Travel time
consists of running time and stopped delay time (Turner et.al., 1998).
• Running Time – the travel time when the vehicle is in motion.
• Stopped Delay Time – time when the vehicle is stopped (or moving
sufficiently slow as to be stopped)
• The other travel time related to public bus vehicle-trip are (Neils, 2011):
• Driving time – actual driving time from stop to stop including unplanned
stopping time between stops.
• Dwell Time – time involved for boarding and alighting at stop.
Passenger ridership is another important service performance indicator to
determine the success of a shuttle bus service. Generally, it is known that higher
the passenger ridership, greater the acceptability of the services by the passengers.
It is important to take note that “identifying significant passenger load points
helps indicate whether services are excessive or deficient and thereby assisting
service planning and schedule adjustment” (Healy, 2001).
Shuttle Bus Service in IIUM
The shuttle bus services are provided to serve student population who live in the
residential areas on-campus to the academic and administrative centres. The total
number of buses serving the IIUM community is four covering two different
travel routes. One of them connects female Mahallah Ruqayyah (residential area)
to academic and administrative centres and the other connects male Mahallah
Salahudding to academic and administrative centres. The following sub-sections
highlight some of the characteristics of the shuttle bus services provided on-
campus.
Bus Exterior and Interior capacity and Seating Design
The IIUM’s shuttle bus has a single-channel door with 44 person seated capacity.
The initial design consideration of the vehicle’s interior is to maximize the
amount of gross area to be used by the passengers. The shuttle bus has two
Nur Syahira Zulkefly & Abdul Azeez Kadar Hamsa
Evaluating Travel Time and Passenger Ridership of University Shuttle Bus Service
© 2018 by MIP 236
double-seat (2 + 2) on each side of the bus with approximately 50 cm aisle width.
A bus provided with two double-seat arrangement on each side should not
normally be used for carrying passengers with standees to avoid discomfort to the
bus users (Vuchic, 2007). On the other hand, a bus provided with 2+1 seating
arrangement is ideally considered as a better layout for carrying passengers with
standees (Vuchic, 2007). Hence, the design layout of the IIUM’s shuttle bus is
not appropriate and suitable to transport people on-campus. To add further, the
buses are not provided with holding bars for the standing passengers while
traveling in the bus.
Distance and Stops of the IIUM Shuttle Bus Routes
IIUM shuttle bus services are provided along two different routes, one serving
female residential areas to the core academic and administrative centres and other
male residential areas to the core academic and administrative centres. These two
routes are named Mahallah Ruqayyah (female residential area) and Mahallah
Salahuddin (male residential area). The total distance (one-way) covered along
each of the two routes is slightly different. The distance covered by Mahallah
Salahuddin (Salahuddin) is slightly longer than Mahallah Ruqayyah (Ruqayyah).
Shuttle Bus Operation
The schedule of bus service is actually based on demand. The schedule of bus
services for both routes (Ruqayyah and Salahuddin) is the same. During peak-
hour, the bus is scheduled at every 15 minutes and during other hours, more than
15 minutes. It is obviously due to higher demand during peak-hour than other
hours. During weekdays, the buses operate 2-3 trips per hour in the morning,
evening and night. But on Saturday, the buses operate only in the morning starting
at 8 am and ending at 1 pm with less frequency of services. The shuttle bus
services for the two routes were operated from Monday to Saturday but no
services on Sunday. As indicated earlier, each route was served by two buses to
cater for the increased number of passengers especially during peak-hour.
RESEARCH APPROACH
For this study, field surveys on travel time and passenger ridership of shuttle bus
services along the two selected routes were administered. Travel time survey was
applied to collect data on travel time starting from origin to the destination of the
shuttle bus services. Passenger ridership was collected by applying passenger
count survey. The details of each of these surveys are explained in the following
sub-sections. The details of on-board data collection on travel time and passenger
ridership are given in Table 1.
PLANNING MALAYSIA
Journal of the Malaysia Institute of Planners (2018)
237 © 2018 by MIP
Table 1: Details of field survey
Day Tuesday and Wednesday
(typical days having classes at respective Kuliyyah during weekdays)
Time of data
collection
Peak Hour (8.00a.m. – 9.00 a.m.)
Off-Peak Hour (9.00 a.m. -10.00 a.m.)
Number of
Enumerators
4 enumerators (2 enumerators each for Mahallah Ruqayyah route &
Mahallah Salahuddin route.)
For on-board survey, one enumerator records the travel time data and
another one records the passenger ridership data.
Travel Time Survey
Travel time survey was administered to measure travel time of the shuttle bus
users along each of the two selected routes. The survey was conducted by
employing on-board enumerators. The enumerators recorded the travel time of
shuttle bus users by using a digital watch. Travel time was measured starting from
the first bus stop of each shuttle bus route. Travel time that were measured
includes running time (without delay) and journey time (with delay). A standard
digital watch showing time in hh:mm:ss was used to measure the travel time of
the users. The time taken by the shuttle bus starting from the first stop of the route
to the last stop including stoppage time at every bus stop along the route was
measured. The stoppage time includes amount of time stopped at the junctions,
allowing boarding and alighting of passengers and traffic congestion.
Passenger Ridership Survey
Passenger ridership survey was conducted to count the number of passengers
boarding and alighting at each bus stop along the two routes. Enumerators were
given the task to count the number of passengers at the starting point of the bus
services and whenever passengers boarded and/or alighted at every bus stop along
the route. Each enumerator was given a pre-prepared passenger ridership form to
record the passenger ridership data. The passenger ridership survey was
administered on Tuesday and Wednesday during both peak and off-peak periods.
This survey was conducted concurrently with that of travel time survey.
Observational Survey
In this study, observations on the movement of shuttle bus services were made to
record immobility of buses that caused increase in travel time along the journeys
of the respective selected bus routes. The observations were made by the
enumerators on-board when measuring travel time and passenger ridership of
shuttle bus services. The observational survey was conducted to account for the
variability in the bus service performances especially travel time which
contributes to the service reliability and punctuality of the bus services. It account
for factors such as location of on-street parking, boarding and alighting of
passengers, congestion especially during peak hours and other concomitant
Nur Syahira Zulkefly & Abdul Azeez Kadar Hamsa
Evaluating Travel Time and Passenger Ridership of University Shuttle Bus Service
© 2018 by MIP 238
factors that contribute towards increase in travel time of the shuttle bus services.
The factors that cause delay in running shuttle bus services were recorded in a
travel time survey form.
Method of Analysis
Univariate analysis technique was applied to describe the variables such as
journey time, running time, dwell time and passenger ridership. Some of the
techniques used to describe variables are frequency distribution and mean. The
findings of these variables were summarized and presented in the form of tables
and figures. This study also applies bivariate analysis technique to discern the
relationship between selected variables of interest. Cross-tabulation technique
was used to identify relationship between schedule and observed travel time and
distance of bus stops, dwell time and passenger boarding and alighting. T-test
was also applied to test the differences in the journey time of the bus services
during peak and off peak hours statistically.
ANALYSIS AND FINDINGS
Travel Time
The travel time on each of the two selected bus routes was analysed to determine
and compare journey time, running time, average travel time, delay time, and
reliability of time between the two routes. Table 2 shows the travel time of the
shuttle bus services along Ruqayyah bus route. Travel time was measured for two
runs on Tuesday and Wednesday during both peak and off peak hours. The travel
time taken along this route showed longer journey and running time during peak
hour than off-peak hour. A total journey time of 21 minutes was taken for a
complete run along this route on Tuesday during peak hour. It is due to increase
in dwell time during peak hour because of longer delay en-route such as
prolonged stopping of the bus at the bus stops to cater for increase in the number
of boarding and alighting passengers. The lowest travel time was observed on
Wednesday during off-peak hour. It has taken a total journey time of only 14.66
minutes to complete one trip from Ruqayyah to the main academic and
administrative centre. The average journey time during peak hour was higher than
off peak hour. Thus, it causes high percentage of delay during peak hour than off
peak hour. Again, the likely reason for this trend is due to increase in dwell time
to allow for increased number of passenger boarding and alighting at specific bus
stops, drivers waiting for students to board the bus at few bus stops along this
route.
PLANNING MALAYSIA
Journal of the Malaysia Institute of Planners (2018)
239 © 2018 by MIP
Table 2: Travel time of Ruqayyah shuttle bus service (Route 1) Time Peak Hour Off-Peak Hour
Day Tuesday Wednesday Tuesday Wednesday
Run 1st 2nd 1st 2nd 1st 2nd 1st 2nd
Journey Time (With
Delay) in minutes
19.3 20.93 19.95 16.98 16.86 17.23 14.66 16.55
Running Time
(Without Delay) in
minutes
13.4 14.48 15.56 12.93 13.68 13.98 11.53 12.8
Total Dwell Time in
minutes
5.9 6.45 4.39 4.05 3.18 3.25 3.13 3.75
Mean Journey Time
in minutes
20.115 18.465 17.045 15.605
Mean Running
Time in minutes
13.940 14.245 13.830 12.165
% of Delay from
total Travel Time
30.6 30.8 22.0 23.9 18.9 18.9 21.4 22.7
Source: Field survey 2014
Table 3 shows travel time of shuttle bus service for the other route namely
Salahuddin route. It is noticed there exists a considerable gap in the overall travel
time in terms of journey and running time between Salahuddin and Ruqayyah.
Salahuddin bus route has recorded lower travel time for each run than Ruqayyah.
The total journey time including delay time along this route was not more than
15 minutes on each of the two runs on both Tuesday and Wednesday during peak
and off peak hour. The highest average journey time was 14.405 minutes on
Tuesday during peak hour and the lowest average journey time was 11.6 minutes
on Wednesday during off-peak hour. One of the reasons is the number of male
users near Salahuddin was lower than the number of female users near Ruqayyah.
Table 3: Travel time of Salahuddin shuttle bus service (Route 2)
Route Peak Hour Off Peak Hour
Day Tuesday Wednesday Tuesday Wednesday
Run 1st 2nd 1st 2nd 1st 2nd 1st 2nd
Journey Time (With
Delay) in minutes
14.31 14.5 13.6 13.43 12.56 13.23 11.6 11.95
Running Time
(Without Delay) in
minutes
11.13 10.9 10.03 10.7 10.25 10.35 9.55 9.71
Total Dwell Time in
minutes
3.18 3.6 3.57 2.73 2.31 2.88 2.05 2.24
Mean Journey Time
in minutes
14.405 13.515 12.895 11.775
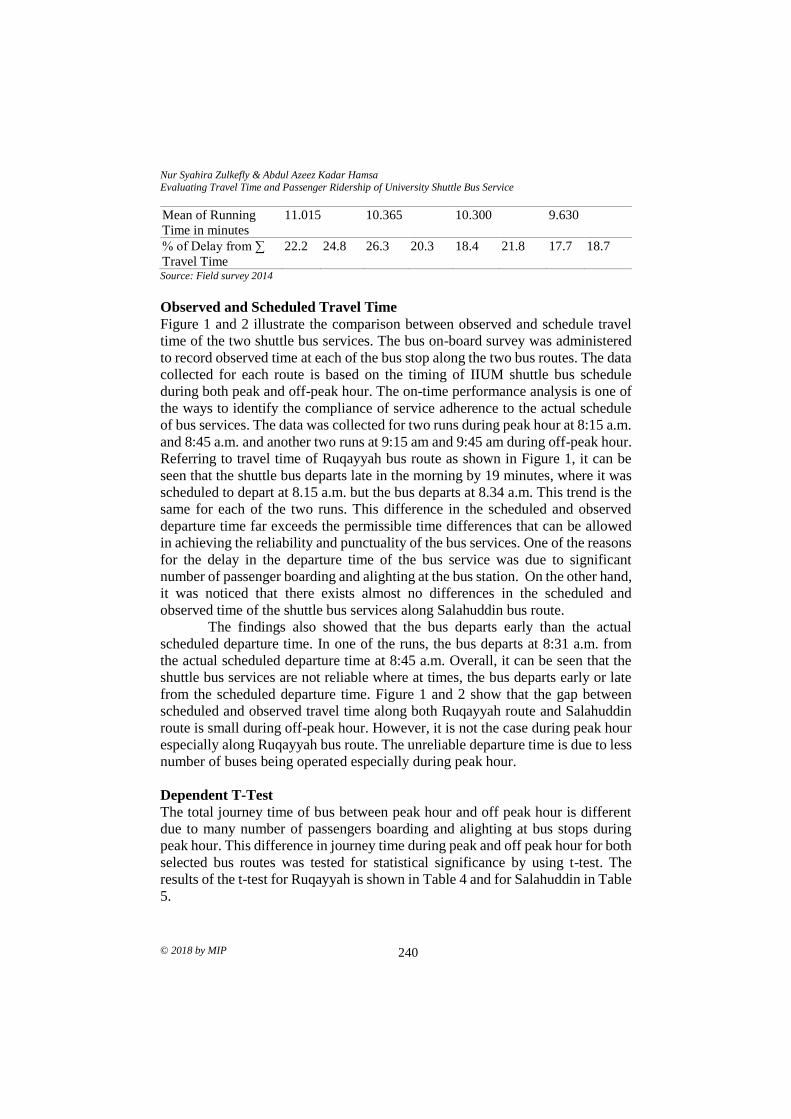
Nur Syahira Zulkefly & Abdul Azeez Kadar Hamsa
Evaluating Travel Time and Passenger Ridership of University Shuttle Bus Service
© 2018 by MIP 240
Mean of Running
Time in minutes
11.015 10.365 10.300 9.630
% of Delay from ∑
Travel Time
22.2 24.8 26.3 20.3 18.4 21.8 17.7 18.7
Source: Field survey 2014
Observed and Scheduled Travel Time
Figure 1 and 2 illustrate the comparison between observed and schedule travel
time of the two shuttle bus services. The bus on-board survey was administered
to record observed time at each of the bus stop along the two bus routes. The data
collected for each route is based on the timing of IIUM shuttle bus schedule
during both peak and off-peak hour. The on-time performance analysis is one of
the ways to identify the compliance of service adherence to the actual schedule
of bus services. The data was collected for two runs during peak hour at 8:15 a.m.
and 8:45 a.m. and another two runs at 9:15 am and 9:45 am during off-peak hour.
Referring to travel time of Ruqayyah bus route as shown in Figure 1, it can be
seen that the shuttle bus departs late in the morning by 19 minutes, where it was
scheduled to depart at 8.15 a.m. but the bus departs at 8.34 a.m. This trend is the
same for each of the two runs. This difference in the scheduled and observed
departure time far exceeds the permissible time differences that can be allowed
in achieving the reliability and punctuality of the bus services. One of the reasons
for the delay in the departure time of the bus service was due to significant
number of passenger boarding and alighting at the bus station. On the other hand,
it was noticed that there exists almost no differences in the scheduled and
observed time of the shuttle bus services along Salahuddin bus route.
The findings also showed that the bus departs early than the actual
scheduled departure time. In one of the runs, the bus departs at 8:31 a.m. from
the actual scheduled departure time at 8:45 a.m. Overall, it can be seen that the
shuttle bus services are not reliable where at times, the bus departs early or late
from the scheduled departure time. Figure 1 and 2 show that the gap between
scheduled and observed travel time along both Ruqayyah route and Salahuddin
route is small during off-peak hour. However, it is not the case during peak hour
especially along Ruqayyah bus route. The unreliable departure time is due to less
number of buses being operated especially during peak hour.
Dependent T-Test
The total journey time of bus between peak hour and off peak hour is different
due to many number of passengers boarding and alighting at bus stops during
peak hour. This difference in journey time during peak and off peak hour for both
selected bus routes was tested for statistical significance by using t-test. The
results of the t-test for Ruqayyah is shown in Table 4 and for Salahuddin in Table
5.
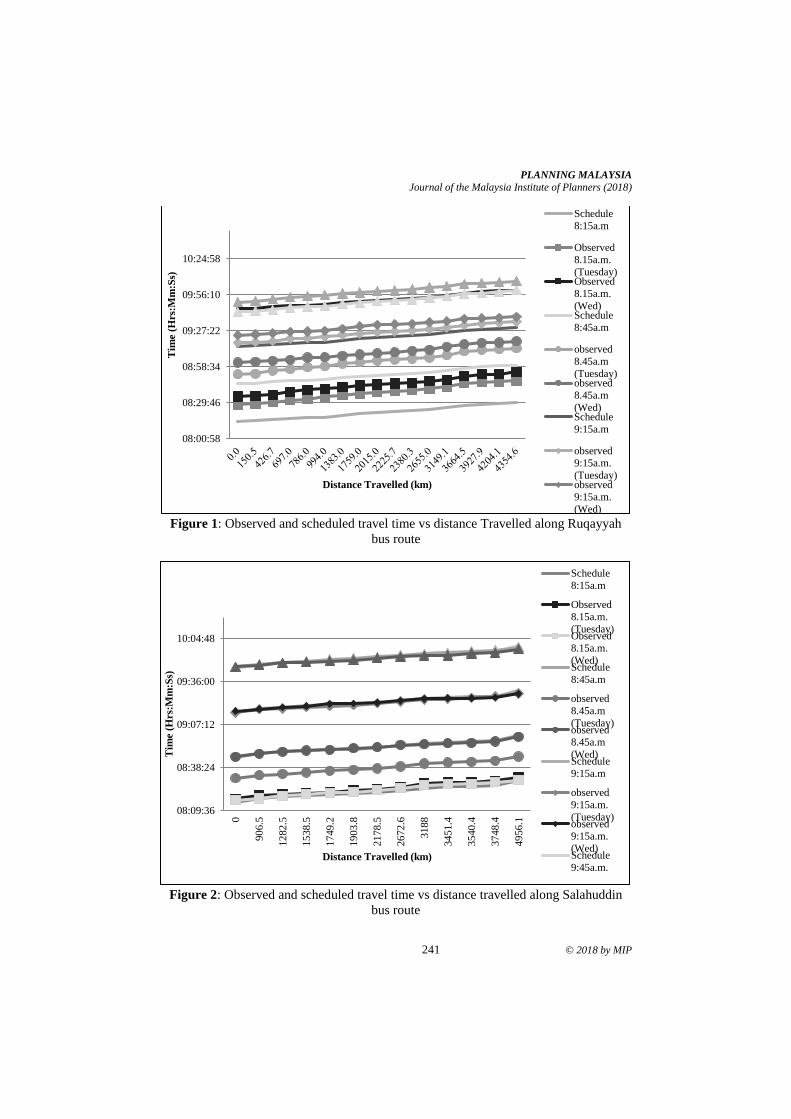
PLANNING MALAYSIA
Journal of the Malaysia Institute of Planners (2018)
241 © 2018 by MIP
Figure 1: Observed and scheduled travel time vs distance Travelled along Ruqayyah
bus route
Figure 2: Observed and scheduled travel time vs distance travelled along Salahuddin
bus route
08:00:58
08:29:46
08:58:34
09:27:22
09:56:10
10:24:58
Tim
e (
Hrs
:Mm
:Ss)
Distance Travelled (km)
Schedule
8:15a.m
Observed
8.15a.m.
(Tuesday)Observed
8.15a.m.
(Wed)Schedule
8:45a.m
observed
8.45a.m
(Tuesday)observed
8.45a.m
(Wed)Schedule
9:15a.m
observed
9:15a.m.
(Tuesday)observed
9:15a.m.
(Wed)
08:09:36
08:38:24
09:07:12
09:36:00
10:04:48
0
90
6.5
12
82.5
15
38.5
17
49.2
19
03.8
21
78.5
26
72.6
31
88
34
51.4
35
40.4
37
48.4
49
56.1
Tim
e (
Hrs
:Mm
:Ss)
Distance Travelled (km)
Schedule
8:15a.m
Observed
8.15a.m.
(Tuesday)Observed
8.15a.m.
(Wed)Schedule
8:45a.m
observed
8.45a.m
(Tuesday)observed
8.45a.m
(Wed)Schedule
9:15a.m
observed
9:15a.m.
(Tuesday)observed
9:15a.m.
(Wed)Schedule
9:45a.m.
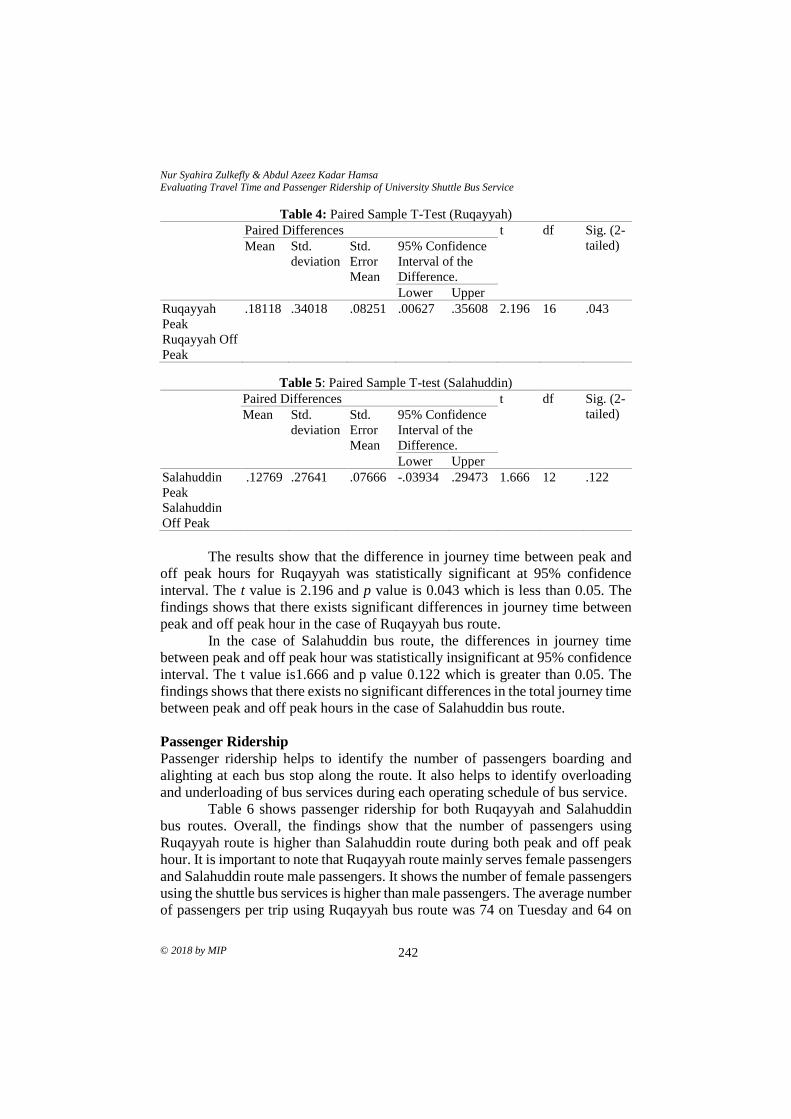
Nur Syahira Zulkefly & Abdul Azeez Kadar Hamsa
Evaluating Travel Time and Passenger Ridership of University Shuttle Bus Service
© 2018 by MIP 242
Table 4: Paired Sample T-Test (Ruqayyah) Paired Differences t df Sig. (2-
tailed) Mean Std.
deviation
Std.
Error
Mean
95% Confidence
Interval of the
Difference.
Lower Upper
Ruqayyah
Peak
Ruqayyah Off
Peak
.18118
.34018 .08251 .00627 .35608 2.196 16 .043
Table 5: Paired Sample T-test (Salahuddin)
Paired Differences t df Sig. (2-
tailed) Mean Std.
deviation
Std.
Error
Mean
95% Confidence
Interval of the
Difference.
Lower Upper
Salahuddin
Peak
Salahuddin
Off Peak
.12769 .27641 .07666 -.03934 .29473 1.666 12 .122
The results show that the difference in journey time between peak and
off peak hours for Ruqayyah was statistically significant at 95% confidence
interval. The t value is 2.196 and p value is 0.043 which is less than 0.05. The
findings shows that there exists significant differences in journey time between
peak and off peak hour in the case of Ruqayyah bus route.
In the case of Salahuddin bus route, the differences in journey time
between peak and off peak hour was statistically insignificant at 95% confidence
interval. The t value is1.666 and p value 0.122 which is greater than 0.05. The
findings shows that there exists no significant differences in the total journey time
between peak and off peak hours in the case of Salahuddin bus route.
Passenger Ridership
Passenger ridership helps to identify the number of passengers boarding and
alighting at each bus stop along the route. It also helps to identify overloading
and underloading of bus services during each operating schedule of bus service.
Table 6 shows passenger ridership for both Ruqayyah and Salahuddin
bus routes. Overall, the findings show that the number of passengers using
Ruqayyah route is higher than Salahuddin route during both peak and off peak
hour. It is important to note that Ruqayyah route mainly serves female passengers
and Salahuddin route male passengers. It shows the number of female passengers
using the shuttle bus services is higher than male passengers. The average number
of passengers per trip using Ruqayyah bus route was 74 on Tuesday and 64 on
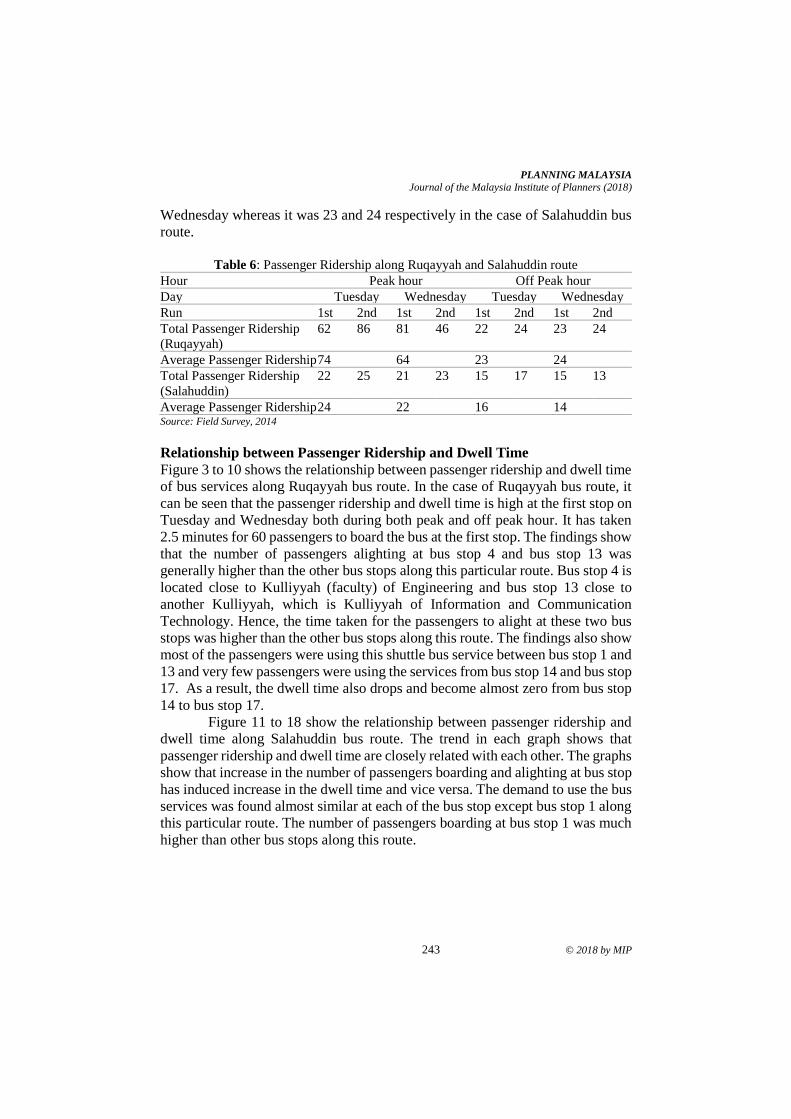
PLANNING MALAYSIA
Journal of the Malaysia Institute of Planners (2018)
243 © 2018 by MIP
Wednesday whereas it was 23 and 24 respectively in the case of Salahuddin bus
route.
Table 6: Passenger Ridership along Ruqayyah and Salahuddin route
Hour Peak hour Off Peak hour
Day Tuesday Wednesday Tuesday Wednesday
Run 1st 2nd 1st 2nd 1st 2nd 1st 2nd
Total Passenger Ridership
(Ruqayyah)
62 86 81 46 22 24 23 24
Average Passenger Ridership 74 64 23 24
Total Passenger Ridership
(Salahuddin)
22 25 21 23 15 17 15 13
Average Passenger Ridership 24 22 16 14 Source: Field Survey, 2014
Relationship between Passenger Ridership and Dwell Time
Figure 3 to 10 shows the relationship between passenger ridership and dwell time
of bus services along Ruqayyah bus route. In the case of Ruqayyah bus route, it
can be seen that the passenger ridership and dwell time is high at the first stop on
Tuesday and Wednesday both during both peak and off peak hour. It has taken
2.5 minutes for 60 passengers to board the bus at the first stop. The findings show
that the number of passengers alighting at bus stop 4 and bus stop 13 was
generally higher than the other bus stops along this particular route. Bus stop 4 is
located close to Kulliyyah (faculty) of Engineering and bus stop 13 close to
another Kulliyyah, which is Kulliyyah of Information and Communication
Technology. Hence, the time taken for the passengers to alight at these two bus
stops was higher than the other bus stops along this route. The findings also show
most of the passengers were using this shuttle bus service between bus stop 1 and
13 and very few passengers were using the services from bus stop 14 and bus stop
17. As a result, the dwell time also drops and become almost zero from bus stop
14 to bus stop 17.
Figure 11 to 18 show the relationship between passenger ridership and
dwell time along Salahuddin bus route. The trend in each graph shows that
passenger ridership and dwell time are closely related with each other. The graphs
show that increase in the number of passengers boarding and alighting at bus stop
has induced increase in the dwell time and vice versa. The demand to use the bus
services was found almost similar at each of the bus stop except bus stop 1 along
this particular route. The number of passengers boarding at bus stop 1 was much
higher than other bus stops along this route.
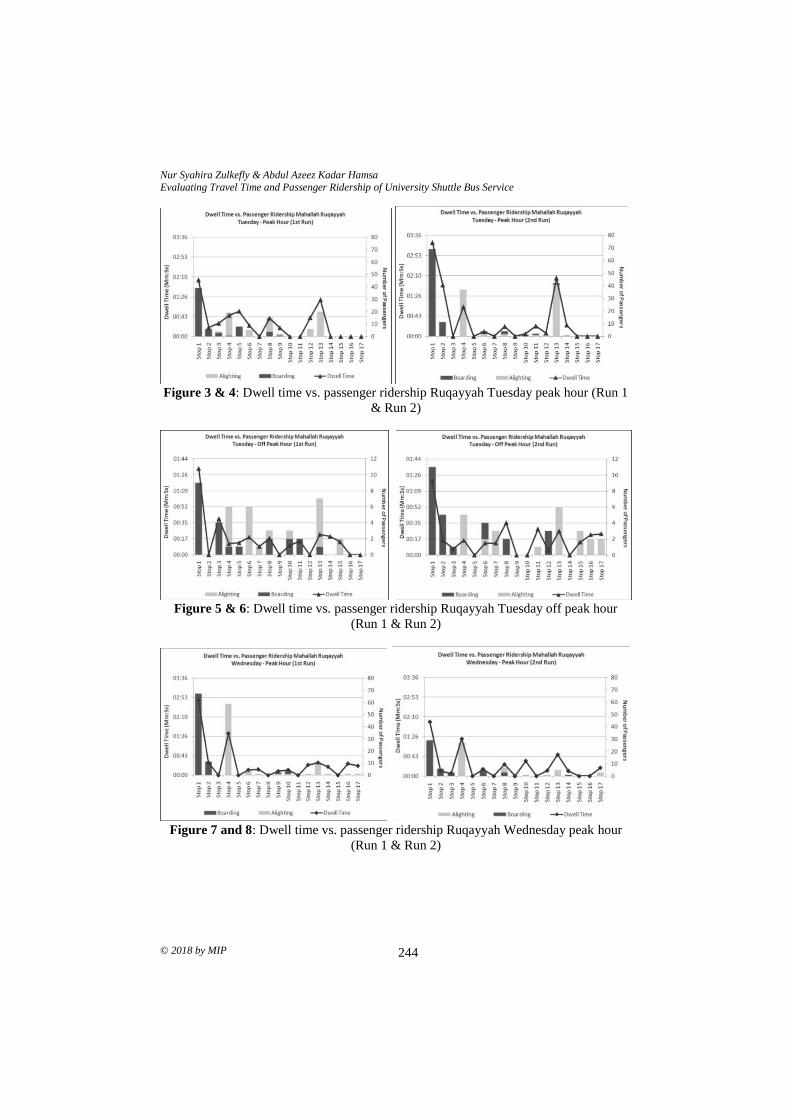
Nur Syahira Zulkefly & Abdul Azeez Kadar Hamsa
Evaluating Travel Time and Passenger Ridership of University Shuttle Bus Service
© 2018 by MIP 244
Figure 3 & 4: Dwell time vs. passenger ridership Ruqayyah Tuesday peak hour (Run 1
& Run 2)
Figure 5 & 6: Dwell time vs. passenger ridership Ruqayyah Tuesday off peak hour
(Run 1 & Run 2)
Figure 7 and 8: Dwell time vs. passenger ridership Ruqayyah Wednesday peak hour
(Run 1 & Run 2)
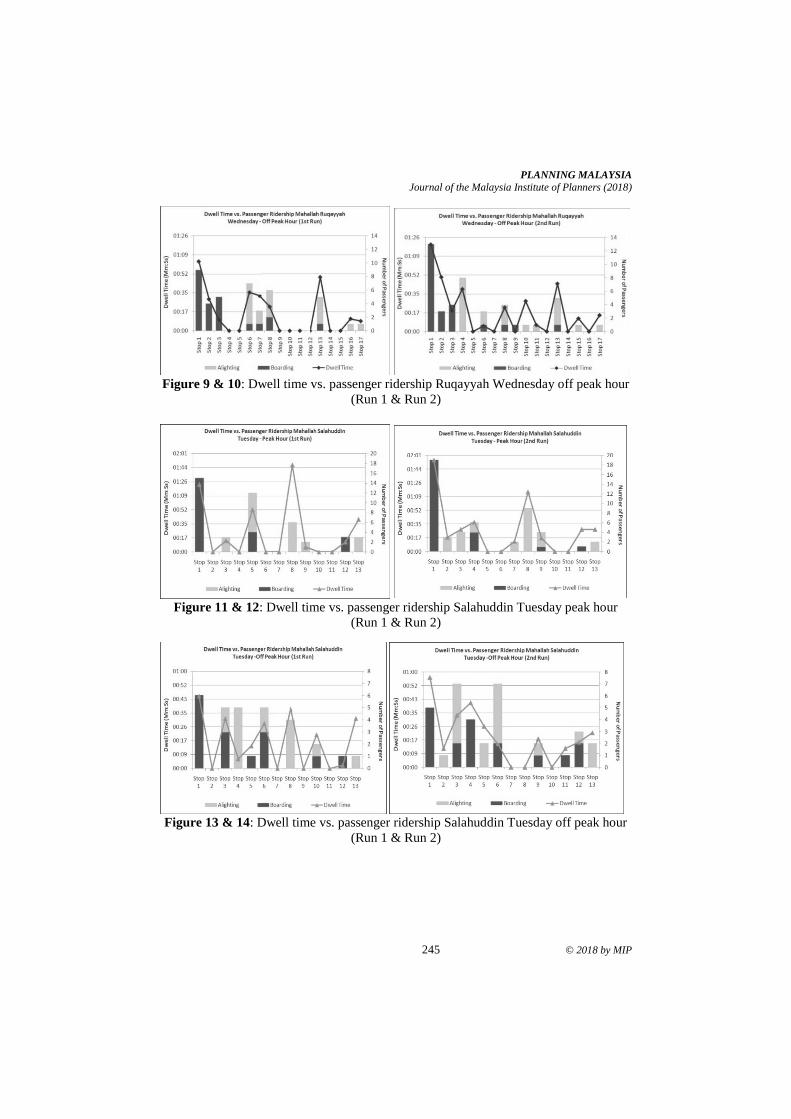
PLANNING MALAYSIA
Journal of the Malaysia Institute of Planners (2018)
245 © 2018 by MIP
Figure 9 & 10: Dwell time vs. passenger ridership Ruqayyah Wednesday off peak hour
(Run 1 & Run 2)
Figure 11 & 12: Dwell time vs. passenger ridership Salahuddin Tuesday peak hour
(Run 1 & Run 2)
Figure 13 & 14: Dwell time vs. passenger ridership Salahuddin Tuesday off peak hour
(Run 1 & Run 2)
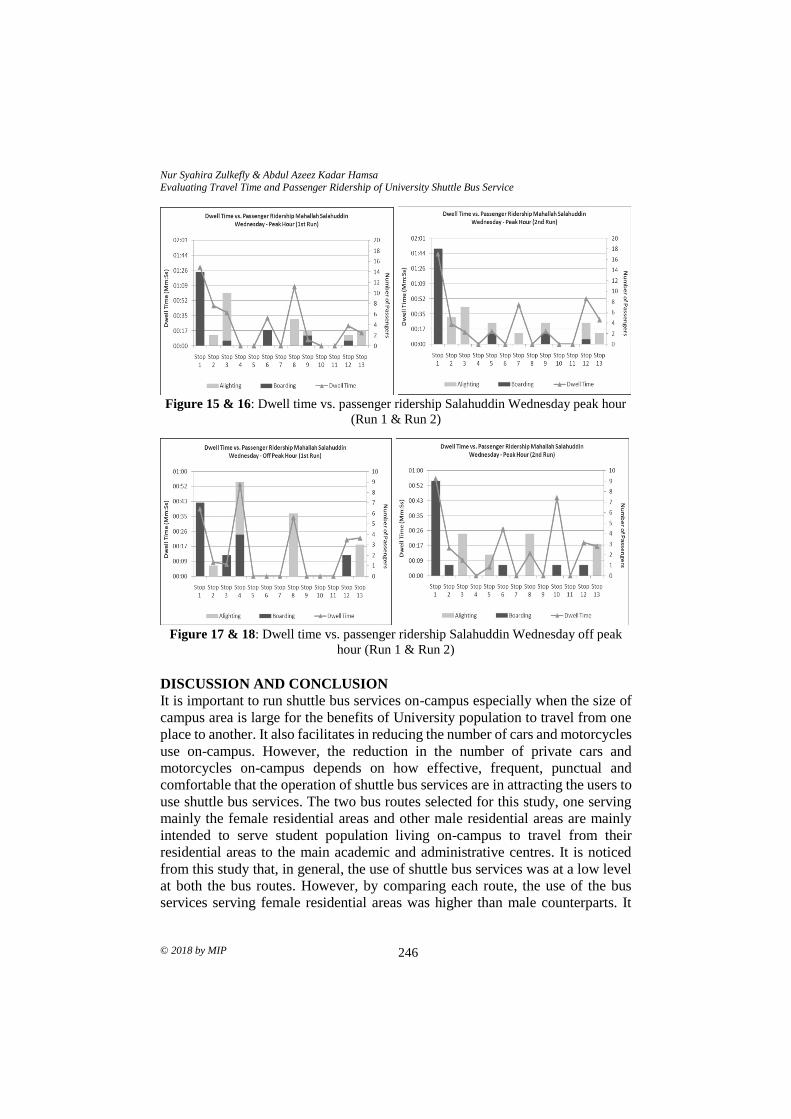
Nur Syahira Zulkefly & Abdul Azeez Kadar Hamsa
Evaluating Travel Time and Passenger Ridership of University Shuttle Bus Service
© 2018 by MIP 246
Figure 15 & 16: Dwell time vs. passenger ridership Salahuddin Wednesday peak hour
(Run 1 & Run 2)
Figure 17 & 18: Dwell time vs. passenger ridership Salahuddin Wednesday off peak
hour (Run 1 & Run 2)
DISCUSSION AND CONCLUSION
It is important to run shuttle bus services on-campus especially when the size of
campus area is large for the benefits of University population to travel from one
place to another. It also facilitates in reducing the number of cars and motorcycles
use on-campus. However, the reduction in the number of private cars and
motorcycles on-campus depends on how effective, frequent, punctual and
comfortable that the operation of shuttle bus services are in attracting the users to
use shuttle bus services. The two bus routes selected for this study, one serving
mainly the female residential areas and other male residential areas are mainly
intended to serve student population living on-campus to travel from their
residential areas to the main academic and administrative centres. It is noticed
from this study that, in general, the use of shuttle bus services was at a low level
at both the bus routes. However, by comparing each route, the use of the bus
services serving female residential areas was higher than male counterparts. It
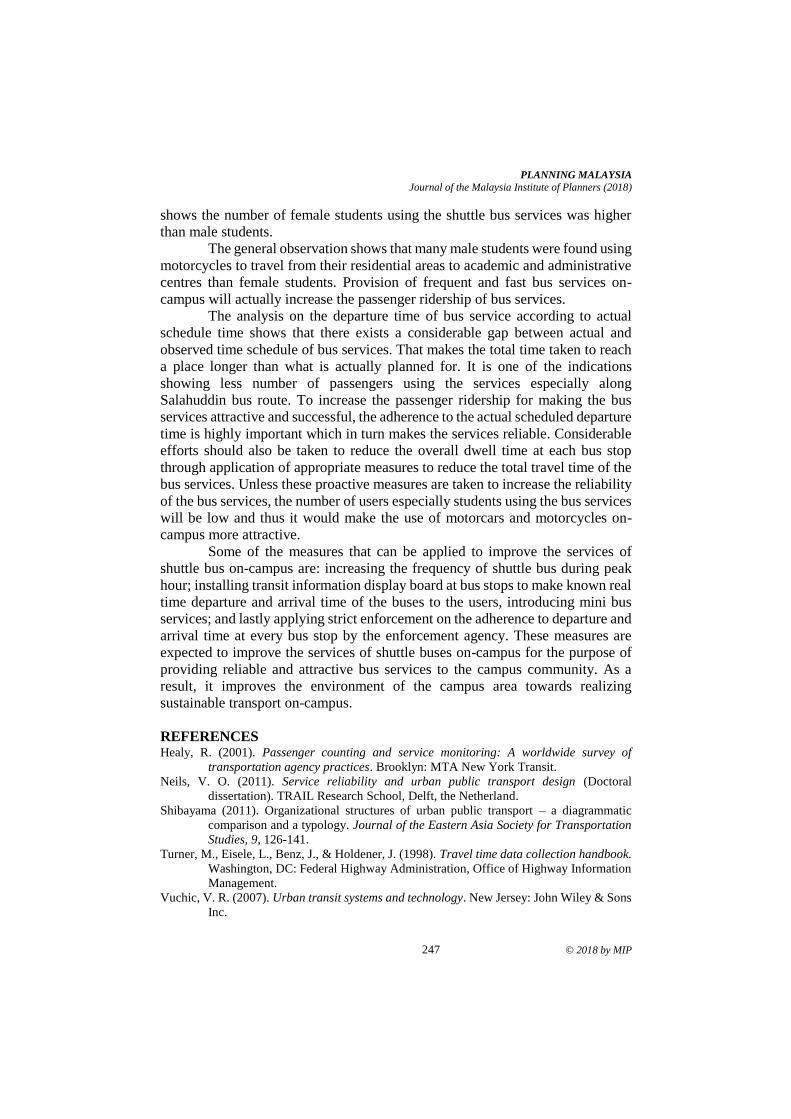
PLANNING MALAYSIA
Journal of the Malaysia Institute of Planners (2018)
247 © 2018 by MIP
shows the number of female students using the shuttle bus services was higher
than male students.
The general observation shows that many male students were found using
motorcycles to travel from their residential areas to academic and administrative
centres than female students. Provision of frequent and fast bus services on-
campus will actually increase the passenger ridership of bus services.
The analysis on the departure time of bus service according to actual
schedule time shows that there exists a considerable gap between actual and
observed time schedule of bus services. That makes the total time taken to reach
a place longer than what is actually planned for. It is one of the indications
showing less number of passengers using the services especially along
Salahuddin bus route. To increase the passenger ridership for making the bus
services attractive and successful, the adherence to the actual scheduled departure
time is highly important which in turn makes the services reliable. Considerable
efforts should also be taken to reduce the overall dwell time at each bus stop
through application of appropriate measures to reduce the total travel time of the
bus services. Unless these proactive measures are taken to increase the reliability
of the bus services, the number of users especially students using the bus services
will be low and thus it would make the use of motorcars and motorcycles on-
campus more attractive.
Some of the measures that can be applied to improve the services of
shuttle bus on-campus are: increasing the frequency of shuttle bus during peak
hour; installing transit information display board at bus stops to make known real
time departure and arrival time of the buses to the users, introducing mini bus
services; and lastly applying strict enforcement on the adherence to departure and
arrival time at every bus stop by the enforcement agency. These measures are
expected to improve the services of shuttle buses on-campus for the purpose of
providing reliable and attractive bus services to the campus community. As a
result, it improves the environment of the campus area towards realizing
sustainable transport on-campus.
REFERENCES Healy, R. (2001). Passenger counting and service monitoring: A worldwide survey of
transportation agency practices. Brooklyn: MTA New York Transit.
Neils, V. O. (2011). Service reliability and urban public transport design (Doctoral
dissertation). TRAIL Research School, Delft, the Netherland.
Shibayama (2011). Organizational structures of urban public transport – a diagrammatic
comparison and a typology. Journal of the Eastern Asia Society for Transportation
Studies, 9, 126-141.
Turner, M., Eisele, L., Benz, J., & Holdener, J. (1998). Travel time data collection handbook.
Washington, DC: Federal Highway Administration, Office of Highway Information
Management.
Vuchic, V. R. (2007). Urban transit systems and technology. New Jersey: John Wiley & Sons
Inc.
1Phd Candidate at University Teknologi MARA, Malaysia. Email: [email protected] 248
PLANNING MALAYSIA:
Journal of the Malaysian Institute of Planners
VOLUME 16 ISSUE 3 (2018) Page 248 – 260
DEVELOPING MALAYSIAN ROADSIDE TREE SPECIES SELECTION
MODEL IN URBAN AREAS
Ramly Hasan1, Noriah Othman2 & Faridah Ismail3
1,2,3Faculty of Architecture, Planning and Surveying
UNIVERSITI TEKNOLOGI MARA, MALAYSIA
Abstract
Urban trees are living organisms and vital elements of a city’s infrastructure; thus,
they should be considered at every stage of planning design and development. In
Malaysia, rapid changes in the environment have indirectly influenced the
roadside tree condition such as fallen trees. This is reflected with the statistic
increment of public complaints by 39% from 2014 until 2016 regarding the
roadside tree problems, which are very worrying for the local authorities. This
study aims to develop a Malaysian Roadside Tree Species Selection for guidance
in selecting the right tree species for a sustainable city. The objectives of this
study are (i) to determine additional attributes in roadside tree species selection,
(ii) to examine the relationship between existing and additional attributes and (iii)
to develop a Malaysian Roadside Tree Species Selection Model based on these
attributes. This research applied the quantitative and qualitative approaches. The
results produced a Malaysian Roadside Tree Species Selection Model.
Keywords: roadside tree, public complaint, tree species selection model
PLANNING MALAYSIA
Journal of the Malaysia Institute of Planners (2018)
249 © 2018 by MIP
INTRODUCTION
Urban roadside trees have been introduced to the city areas since early civilization
for functional and aesthetic purposes. Trees have been fostering many valuable
functions in our lives from giving shade, providing a source of food and
producing economic benefits. The right roadside trees species selection is
important to create an exciting environment, provide shades, protection from
vehicle light glare, sound barrier, and reduce dust pollution. As reported by
Sreetheran, Adnan and Khairil Azuar (2011), the popular tree species planted in
Malaysian urban areas are Peltophorum pterocarpum (yellow flame), Samanea
saman (rain tree), Cinnamomum iners (wild cinnamon), Lagerstroemia speciosa
(pride of India), Ficus benjamina (weeping fig), Mimusops elengi (tanjung),
Millettia atropurpurea (purple millettia), Delonix regia (red flame) and Swietenia
macrophylla (mahogany). The aim of this study is to develop a Malaysian
Roadside Tree Species Selection for guidance in selecting the right trees species.
The objectives of this study are (i) to determine additional attributes in roadside
tree species selection, (ii) to examine the relationship between existing and
additional attributes and (iii) to develop a Malaysian Roadside Tree Species
Selection Model based on these attributes.
UNDERSTANDING VALUES OF ROADSIDE TREE FOR HIGH
QUALITY URBAN LIFESTYLE
Benefits of roadside trees are continuously discussed in previous research in
terms of environmental, social, economic, health, and aesthetic benefits (Hasan,
Othman, & Ismail, 2016; Vogt et al., 2017; Kondo, Han, Donovan, &
MacDonald, 2017; Salmond et al., 2016; Mullaney, Lucke, & Trueman, 2015;
Roy, Byrne, & Pickering, 2012). All the benefits are contributed to creating an
urban fabric and improving the quality of urban lifestyles. However, some of the
current landscape practices lack the basic knowledge that underlies the science
and art of incorporating trees into an urban area (Wiseman, 2017). Some planting
design standards show that little is known about the basic needs of trees and the
selection of the tree planting. In addition, space constraint in cities means that
there are only limited opportunities for increasing tree density within the existing
urban fabric and it is unclear whether the net effect of increased vegetation in
street canyons is beneficial or detrimental to urban air quality at local scales
(Salmond et al., 2013).
PROBLEMS OF MALAYSIAN ROADSIDE TREE SPECIES
SELECTION
Rapid urban growth changes in the environment have indirectly influenced the
roadside tree conditions (Krzyżaniak, Świerk, Walerzak, & Urbański, 2015;
Battipaglia et al., 2010; Sieghardt et al., 2005; Moore, 2009). According to the
statistics of public complaints (Sistem Talian Aduan Rakyat, 2017 and IResponz
Ramly Hasan, Noriah Othman & Faridah Ismail
Developing Malaysian Roadside Tree Species Selection Model in Urban Areas
© 2018 by MIP 250
system, 2017), four selected local authorities namely the Kuala Lumpur City Hall,
Petaling Jaya City Council, Subang Jaya Municipal Council and Selayang
Municipal Council have shown nine issues of tree problems such as fallen trees
(1,662 cases), brittle branches (2,142 cases), obscure visibility (1,493 cases), dead
leaves and debris on the road (1,610 cases), heavy branches obstruct traffic (1,471
cases), old and dead trees (1,300 cases), clogged drainage system due to debris
(1,596 cases), close proximity of trees to houses (181 cases) and leaning tree trunk
(1,191 cases). As supported by Yan and Jung (2018), certain trees planted in
urban areas are species with vigorous growth habit, fragile stems, weak
bifurcation and are susceptible to diseases. These problems occur when several
factors such as site, economic and social factors are not considered during the tree
species selection practice (Miller, Hauer, & Werner, 2015). The increasing
number of public complaints caused the local authority to spend more than a
hundred thousand Ringgit Malaysia to pay for the compensations (Yaman, Jamil,
& Yaakob, 2011).
The findings of the survey conducted by the author in 2016 concluded
that there the level of knowledge in tree species selection practice in Malaysia is
considered as low. This is because the landscape practices are more concerned
about landscape design and aesthetical values compared to the function of tree
species. As reported by Nor Azah (2015), the selection of tree species at local
authority faces problems in terms of lack of expertise and experience to decide
on the right tree species. Because of that, many of roadside trees have caused
problems and the total number of public complaints related to the roadside tree
have increased over the years.
THE ATTRIBUTES INFLUENCING THE TREE SPECIES SELECTION
Miller et al. (2015) established a model to explain the urban roadside tree species
selection. The model classified the factors contributing to the appropriate tree
species selection for urban areas into three distinct categories which are site
factors, social factors and economic factors. The site factors consist of cultural
and environmental constraints. Miller et al. (2015) listed the physical limitation
aspects on the site such as activities created by humans, utilities, structures,
surface cover and pollution, which are referred to as cultural constraints, while
insects, disease, soils, edaphic, physiographic, climate and microclimate are
referred to as environmental constraints. As explained by Pauleit et al. (2002),
edaphic constraint refers to soil conditions such as texture, drainage and chemical
properties. The climatic constraints (Schroeder, Flannigan & Coles, 2006) are
clearly identified as part of the model. The social factors focus on aesthetic
values, functional utility and negative externalities. Finally, there are economic
factors which include establishment costs, maintenance cost and removal costs.
The conflict between bio-physical issues (ecosystem services and site
factors) and socio-economic issues (institutional framework and culture, cost and
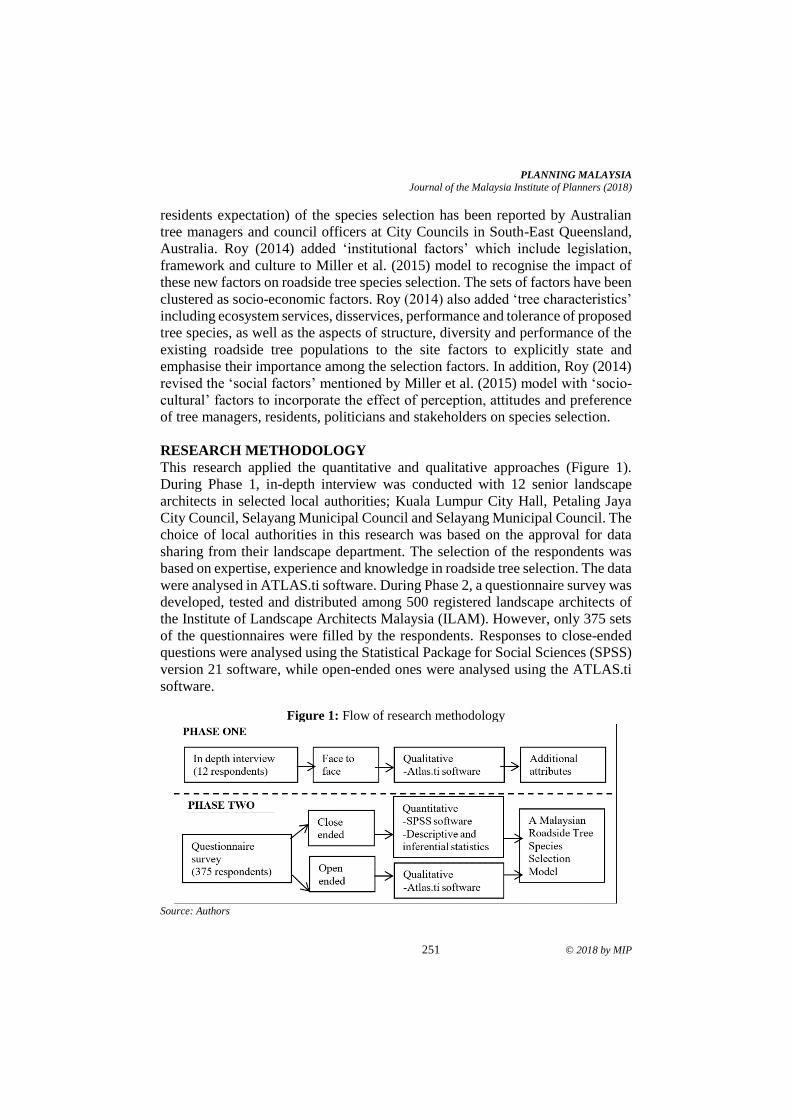
PLANNING MALAYSIA
Journal of the Malaysia Institute of Planners (2018)
251 © 2018 by MIP
residents expectation) of the species selection has been reported by Australian
tree managers and council officers at City Councils in South-East Queensland,
Australia. Roy (2014) added ‘institutional factors’ which include legislation,
framework and culture to Miller et al. (2015) model to recognise the impact of
these new factors on roadside tree species selection. The sets of factors have been
clustered as socio-economic factors. Roy (2014) also added ‘tree characteristics’
including ecosystem services, disservices, performance and tolerance of proposed
tree species, as well as the aspects of structure, diversity and performance of the
existing roadside tree populations to the site factors to explicitly state and
emphasise their importance among the selection factors. In addition, Roy (2014)
revised the ‘social factors’ mentioned by Miller et al. (2015) model with ‘socio-
cultural’ factors to incorporate the effect of perception, attitudes and preference
of tree managers, residents, politicians and stakeholders on species selection.
RESEARCH METHODOLOGY
This research applied the quantitative and qualitative approaches (Figure 1).
During Phase 1, in-depth interview was conducted with 12 senior landscape
architects in selected local authorities; Kuala Lumpur City Hall, Petaling Jaya
City Council, Selayang Municipal Council and Selayang Municipal Council. The
choice of local authorities in this research was based on the approval for data
sharing from their landscape department. The selection of the respondents was
based on expertise, experience and knowledge in roadside tree selection. The data
were analysed in ATLAS.ti software. During Phase 2, a questionnaire survey was
developed, tested and distributed among 500 registered landscape architects of
the Institute of Landscape Architects Malaysia (ILAM). However, only 375 sets
of the questionnaires were filled by the respondents. Responses to close-ended
questions were analysed using the Statistical Package for Social Sciences (SPSS)
version 21 software, while open-ended ones were analysed using the ATLAS.ti
software.
Figure 1: Flow of research methodology
Source: Authors
Ramly Hasan, Noriah Othman & Faridah Ismail
Developing Malaysian Roadside Tree Species Selection Model in Urban Areas
© 2018 by MIP 252
RESULTS AND DISCUSSION
Interview Results with Senior Landscape Architects to Define the Additional
Attributes in Roadside Tree Species Selection Model
The analysis of the interview results with 12 senior landscape architects in the
local authorities is shown in Figure 2. Interviewees mentioned that six additional
attributes that contribute in selecting roadside tree species are; framework and
plan, trending, landscape policies, decision maker, limiting factors and themes.
All the respondents stated trending, landscape policies and decision maker as the
most important attributes that govern the selection of urban roadside tree species.
Responses related to framework and plan (N=2) were also categorised according
to the standard operation procedure (SOP), roadside landscape plan, list of
roadside tree species and planting plan. Trending (N=12) was categorised
according to the characteristics of the urban tree such as flowering trees,
aesthetical values and tree forms. For the landscape policies (N=12), the elements
highlighted by respondents were the National Landscape Policy (NLP), National
Urbanisation Policy (NUP), Environmental Policy (EP) and Landscape Planning
Guidelines (LPG). Respondents explained that decision makers (N=12) refers to
people who have the authority to make decisions for selecting roadside tree
species. Respondents stated that three groups in charge of selecting tree species
are landscape architects, arborists and people in the top management level. Three
of the respondents stated that important elements for limiting factors (N=3) are
spaces and location of the planting trees. These elements will determine the
conditions of tree growth. Attributes for themes (N=6) included types of tree
species and suitable tree species for a variety of road types. Themes of tree species
were determined based on the road hierarchy; main road, secondary road and
highway. The identification of additional attributes showed the difference in
views between Roy’s (2014) and Miller et al. (2015) models. These different
outlooks by the Malaysian local authorities suggest that revision to the Tree
Species Selection Model proposed by Roy (2014) is necessary. The revised Tree
Selection Model is to add the additional attributes in selecting roadside tree
species. Via the improvement of this model, it can be used for local authorities as
a guide for the selection of tree species, especially in Malaysia. This is because
the conditions of Malaysia and others countries are different in terms of tree
species, technology, climate conditions, weather and topography.
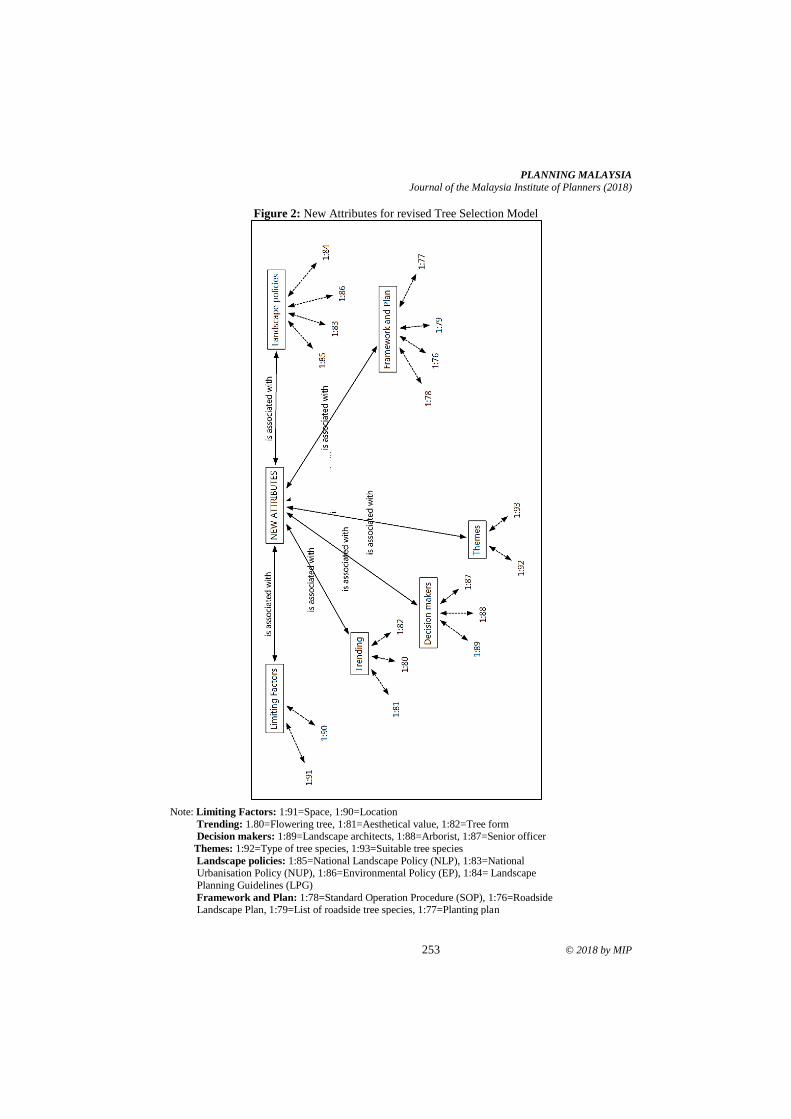
PLANNING MALAYSIA
Journal of the Malaysia Institute of Planners (2018)
253 © 2018 by MIP
Figure 2: New Attributes for revised Tree Selection Model
Note: Limiting Factors: 1:91=Space, 1:90=Location
Trending: 1.80=Flowering tree, 1:81=Aesthetical value, 1:82=Tree form Decision makers: 1:89=Landscape architects, 1:88=Arborist, 1:87=Senior officer
Themes: 1:92=Type of tree species, 1:93=Suitable tree species
Landscape policies: 1:85=National Landscape Policy (NLP), 1:83=National Urbanisation Policy (NUP), 1:86=Environmental Policy (EP), 1:84= Landscape
Planning Guidelines (LPG)
Framework and Plan: 1:78=Standard Operation Procedure (SOP), 1:76=Roadside Landscape Plan, 1:79=List of roadside tree species, 1:77=Planting plan
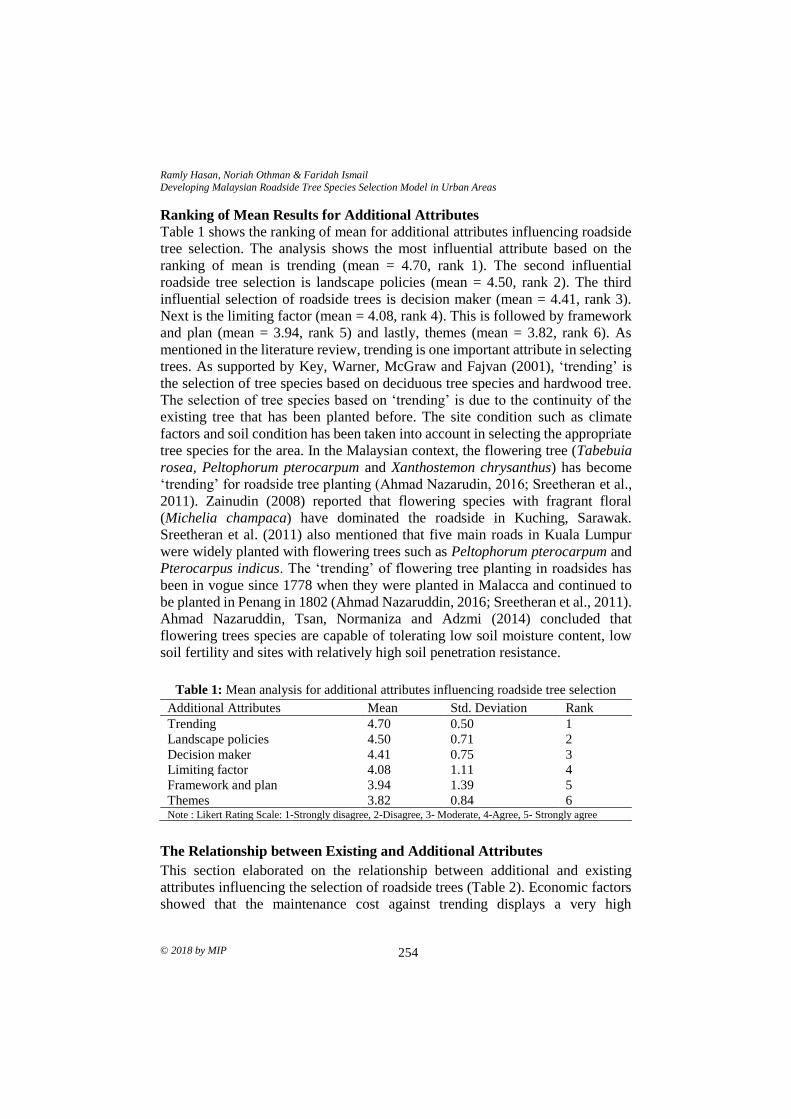
Ramly Hasan, Noriah Othman & Faridah Ismail
Developing Malaysian Roadside Tree Species Selection Model in Urban Areas
© 2018 by MIP 254
Ranking of Mean Results for Additional Attributes
Table 1 shows the ranking of mean for additional attributes influencing roadside
tree selection. The analysis shows the most influential attribute based on the
ranking of mean is trending (mean = 4.70, rank 1). The second influential
roadside tree selection is landscape policies (mean = 4.50, rank 2). The third
influential selection of roadside trees is decision maker (mean = 4.41, rank 3).
Next is the limiting factor (mean = 4.08, rank 4). This is followed by framework
and plan (mean = 3.94, rank 5) and lastly, themes (mean = 3.82, rank 6). As
mentioned in the literature review, trending is one important attribute in selecting
trees. As supported by Key, Warner, McGraw and Fajvan (2001), ‘trending’ is
the selection of tree species based on deciduous tree species and hardwood tree.
The selection of tree species based on ‘trending’ is due to the continuity of the
existing tree that has been planted before. The site condition such as climate
factors and soil condition has been taken into account in selecting the appropriate
tree species for the area. In the Malaysian context, the flowering tree (Tabebuia
rosea, Peltophorum pterocarpum and Xanthostemon chrysanthus) has become
‘trending’ for roadside tree planting (Ahmad Nazarudin, 2016; Sreetheran et al.,
2011). Zainudin (2008) reported that flowering species with fragrant floral
(Michelia champaca) have dominated the roadside in Kuching, Sarawak.
Sreetheran et al. (2011) also mentioned that five main roads in Kuala Lumpur
were widely planted with flowering trees such as Peltophorum pterocarpum and
Pterocarpus indicus. The ‘trending’ of flowering tree planting in roadsides has
been in vogue since 1778 when they were planted in Malacca and continued to
be planted in Penang in 1802 (Ahmad Nazaruddin, 2016; Sreetheran et al., 2011).
Ahmad Nazaruddin, Tsan, Normaniza and Adzmi (2014) concluded that
flowering trees species are capable of tolerating low soil moisture content, low
soil fertility and sites with relatively high soil penetration resistance.
Table 1: Mean analysis for additional attributes influencing roadside tree selection
Additional Attributes Mean Std. Deviation Rank
Trending 4.70 0.50 1
Landscape policies 4.50 0.71 2
Decision maker 4.41 0.75 3
Limiting factor 4.08 1.11 4
Framework and plan 3.94 1.39 5
Themes 3.82 0.84 6 Note : Likert Rating Scale: 1-Strongly disagree, 2-Disagree, 3- Moderate, 4-Agree, 5- Strongly agree
The Relationship between Existing and Additional Attributes
This section elaborated on the relationship between additional and existing
attributes influencing the selection of roadside trees (Table 2). Economic factors
showed that the maintenance cost against trending displays a very high
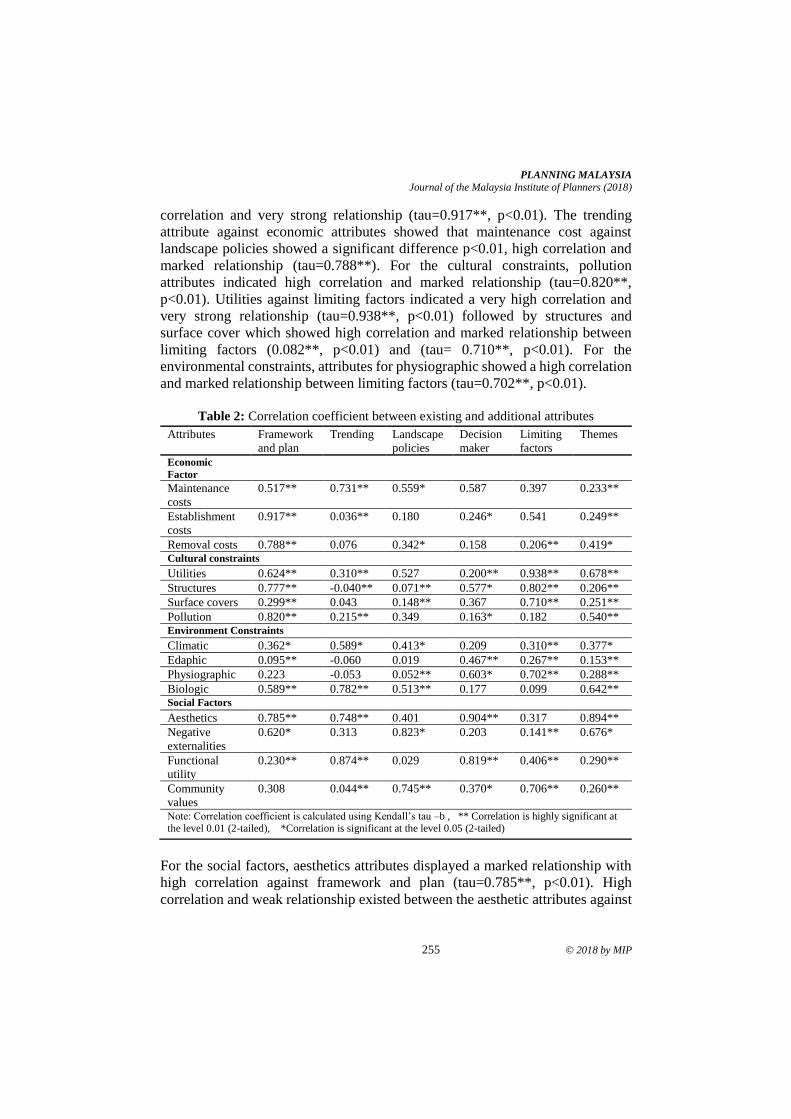
PLANNING MALAYSIA
Journal of the Malaysia Institute of Planners (2018)
255 © 2018 by MIP
correlation and very strong relationship (tau=0.917**, p<0.01). The trending
attribute against economic attributes showed that maintenance cost against
landscape policies showed a significant difference p<0.01, high correlation and
marked relationship (tau=0.788**). For the cultural constraints, pollution
attributes indicated high correlation and marked relationship (tau=0.820**,
p<0.01). Utilities against limiting factors indicated a very high correlation and
very strong relationship (tau=0.938**, p<0.01) followed by structures and
surface cover which showed high correlation and marked relationship between
limiting factors (0.082**, p<0.01) and (tau= 0.710**, p<0.01). For the
environmental constraints, attributes for physiographic showed a high correlation
and marked relationship between limiting factors (tau=0.702**, p<0.01).
Table 2: Correlation coefficient between existing and additional attributes
Attributes Framework
and plan
Trending Landscape
policies
Decision
maker
Limiting
factors
Themes
Economic
Factor
Maintenance
costs
0.517** 0.731** 0.559* 0.587 0.397 0.233**
Establishment
costs
0.917** 0.036** 0.180 0.246* 0.541 0.249**
Removal costs 0.788** 0.076 0.342* 0.158 0.206** 0.419* Cultural constraints
Utilities 0.624** 0.310** 0.527 0.200** 0.938** 0.678**
Structures 0.777** -0.040** 0.071** 0.577* 0.802** 0.206**
Surface covers 0.299** 0.043 0.148** 0.367 0.710** 0.251**
Pollution 0.820** 0.215** 0.349 0.163* 0.182 0.540** Environment Constraints
Climatic 0.362* 0.589* 0.413* 0.209 0.310** 0.377*
Edaphic 0.095** -0.060 0.019 0.467** 0.267** 0.153**
Physiographic 0.223 -0.053 0.052** 0.603* 0.702** 0.288**
Biologic 0.589** 0.782** 0.513** 0.177 0.099 0.642** Social Factors
Aesthetics 0.785** 0.748** 0.401 0.904** 0.317 0.894**
Negative
externalities
0.620* 0.313 0.823* 0.203 0.141** 0.676*
Functional
utility
0.230** 0.874** 0.029 0.819** 0.406** 0.290**
Community
values
0.308 0.044** 0.745** 0.370* 0.706** 0.260**
Note: Correlation coefficient is calculated using Kendall’s tau –b , ** Correlation is highly significant at the level 0.01 (2-tailed), *Correlation is significant at the level 0.05 (2-tailed)
For the social factors, aesthetics attributes displayed a marked relationship with
high correlation against framework and plan (tau=0.785**, p<0.01). High
correlation and weak relationship existed between the aesthetic attributes against
Ramly Hasan, Noriah Othman & Faridah Ismail
Developing Malaysian Roadside Tree Species Selection Model in Urban Areas
© 2018 by MIP 256
trending (tau = 0.748**, p<0.01) and high correlation and marked relationship
between functional utility against trending (tau = 0.874**, p< 0.01).
Analysis on Open-Ended Questions
In the final section of the questionnaire survey, the researchers asked for the
opinion of the respondents regarding additional factors for selecting the right tree
species. 214 responded that education factors are important in selecting tree
species. By having a complete knowledge in trees species, landscape architects
should choose the right tree species in the right place. Other than that, the skill,
expertise and experience are also needed during the selection of trees species.
Someone must have the expertise and skill to ensure the tree species is appropriate
and not threatening to the public and properties. Past experiences in selecting
trees need to be considered in selecting new tree species.
DEVELOPING MALAYSIAN ROADSIDE TREE SPECIES SELECTION
MODEL
This section discussed the Malaysian Roadside Tree Species Model (Figure 3).
The research findings indicate that roadside trees species selection among
Malaysian landscape architects is a more complex process than the ones
demonstrated in the literature (Roy, 2014; Miller et al. 2015). The researchers
found that education factors including knowledge, experience, skill and expertise
influence the selection of roadside tree species. Institutional factors including
landscape policies, decision makers and framework and plan could influence the
way urban roadside trees species are selected, managed and maintained. Limiting
factors including space and location also seem to have influenced the Malaysian
landscape architects regarding roadside tree species selection practices.
Additionally, the researchers found that four new attributes for tree characteristics
which are trending, flowering tree, tree form and themes have strong influence in
selecting roadside trees, as well as budget constraints including establishment
costs, maintenance costs and removal costs.
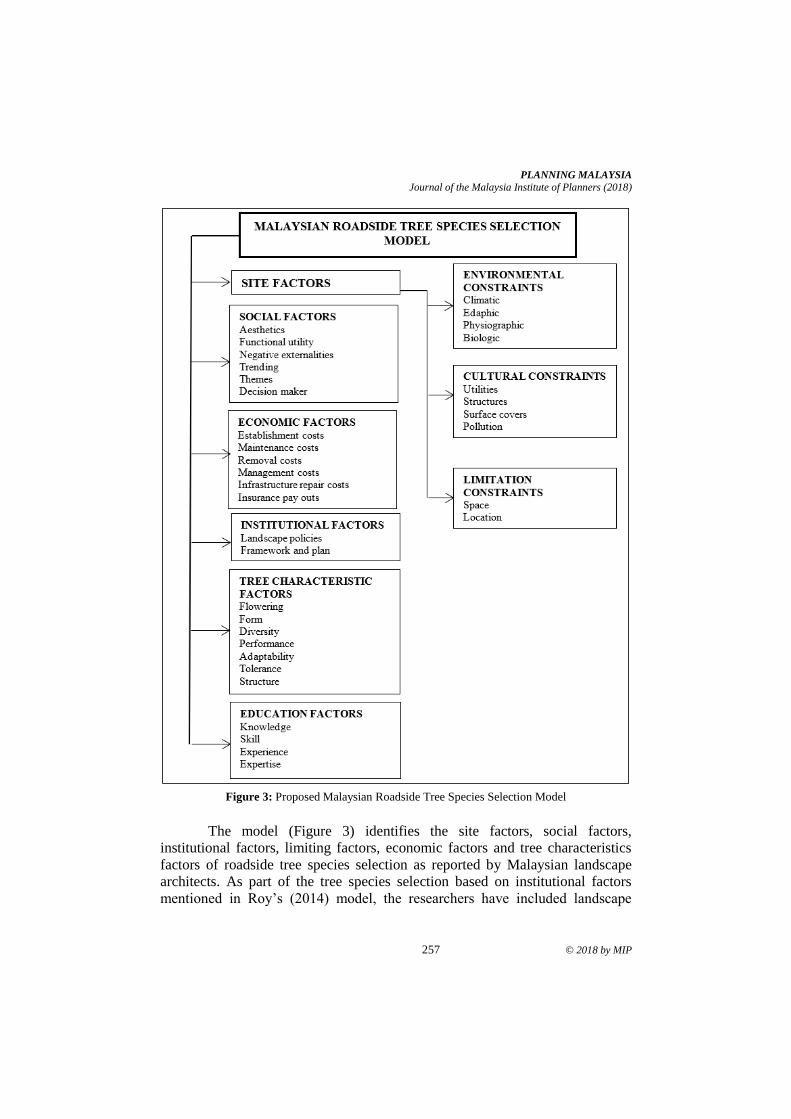
PLANNING MALAYSIA
Journal of the Malaysia Institute of Planners (2018)
257 © 2018 by MIP
Figure 3: Proposed Malaysian Roadside Tree Species Selection Model
The model (Figure 3) identifies the site factors, social factors,
institutional factors, limiting factors, economic factors and tree characteristics
factors of roadside tree species selection as reported by Malaysian landscape
architects. As part of the tree species selection based on institutional factors
mentioned in Roy’s (2014) model, the researchers have included landscape
Ramly Hasan, Noriah Othman & Faridah Ismail
Developing Malaysian Roadside Tree Species Selection Model in Urban Areas
© 2018 by MIP 258
policies, decision makers, framework and plan of the proposed roadside tree
species as reported by Malaysian landscape architects. The researchers added a
new factor to the model, namely limiting factors which comprise space and
location. These elements influence the selection of tree species as reported by
landscape architects, where the limiting space and location features affect tree
growth.
CONCLUSION
In conclusion, six main attributes in selecting roadside trees species were derived
from in-depth interviews with 12 landscape architects who were authorised in
giving approval for the Landscape Planting Plan and proposing the tree species
at the local authority stage. The attributes include framework and plan, trending,
landscape policies, decision makers, limitations constraints and themes. All the
attributes reported by the interviewer were based on the current practices during
the selection of trees species. The findings reported that the majority of additional
attributes indicated a positive correlation and have a relationship with existing
attributes from the Tree Species Selection Model by Roy (2014). Therefore, all
of the additional attributes are appropriate to fit into the Malaysian Roadside Tree
Species Model.
ACKNOWLEDGEMENT
This research was funded by the Geran Insentif Penyeliaan (GIP) (600-IRMI /
MyRA 5/3/GIP (025/2017) from the Research Management Centre, Universiti
Teknologi MARA, Shah Alam, Selangor, Malaysia
REFERENCES Ahmad Nazarudin, M. R. (2016). Xanthostemon Chrysanthus (F. Muell.) Benth.: A new
flowering tree for urban landscapes. International Journal of Agriculture,
Forestry and Plantation, 3, 50-54.
Ahmad Nazarudin, M. R., Tsan, F. Y., Normaniza, O. & Adzmi, Y. (2014). Growth
performance and flowering occurrence of Xanthostemon chrysanthus in two
selected urban sites in Kuala Lumpur, Malaysia. Journal of Tropical Forest
Science, 26(3), 428-434.
Battipaglia, G., Marzaioli, F., Lubritto, C., Altieri, S., Strumia, S., Cherubini, P., &
Cotrufo, M. F. (2010). Traffic pollution affects tree-ring width and isotopic
composition of Pinus pinea. Science of the total Environment, 408(3), 586-593.
Hasan, R., Othman, N., & Ismail, F. (2016). Roadside Tree Management in Selected
Local Authorities for Public Safety. Procedia-Social and Behavioral Sciences,
234, 218-227
IResponz system, (2017). Retrieved from http://www.mpsj.gov.my/iresponz/sso/
index.cfm?option=help
PLANNING MALAYSIA
Journal of the Malaysia Institute of Planners (2018)
259 © 2018 by MIP
Key, T., Warner, T. A., McGraw, J. B., & Fajvan, M. A. (2001). A comparison of
multispectral and multitemporal information in high spatial resolution imagery
for classification of individual tree species in a temperate hardwood forest.
Remote Sensing of Environment, 75(1), 100-112.Kondo, M. C., Han, S.,
Donovan, G. H., & MacDonald, J. M. (2017). The association between urban
trees and crime: Evidence from the spread of the emerald ash borer in
Cincinnati. Landscape and Urban Planning, 157, 193-199.
Krzyżaniak, M., Świerk, D., Walerzak, M., & Urbański, P. (2015). The impact of urban
conditions on different tree species in public green areas in the city of Poznan.
Folia Horticulturae, 27(2), 89-97.
Miller, R. W., Hauer, R. J., & Werner, L. P. (2015). Urban forestry: Planning and
managing urban greenspaces. Long Grove, IL: Waveland Press.
Moore, G. M. (2009). People, trees, landscapes and climate change. In H. Sykes (Ed.),
Climate change on for young and old (pp. 132-149). (n.p.): Future Leaders.
Mullaney, J., Lucke, T., & Trueman, S. J. (2015). A review of benefits and challenges in
growing street trees in paved urban environments. Landscape and Urban
Planning, 134, 157-166.
Nor Azah, A. A. (2015). Ringkasan keperluan latihan pelanggan. institut latihan
kesejahteraan bandar, perumahan dan kerajaan tempatan (IKPKT).
Pauleit, S., Jones, N., Garcia-Martin, G., Garcia-Valdecantos, J. L., Rivière, L. M., Vidal-
Beaudet, L., & Randrup, T. B. (2002). Tree establishment practice in towns and
cities: Results from a European survey. Urban Forestry & Urban Greening,
1(2), 83-96.
Roy, S. (2014). Factor influencing Australian local governments’ street tree species
selection (Doctorate dissertation). Griffith University, Brisbane, Australia.
Salmond, J. A., Tadaki, M., Vardoulakis, S., Arbuthnott, K., Coutts, A., Demuzere, M.,
& McInnes, R. N. (2016). Health and climate related ecosystem services
provided by street trees in the urban environment. Environmental Health, 15(1),
S36.
Schroeder, H., Flannigan, J., & Coles, R. (2006). Residents' attitudes toward street trees
in the UK and US communities. Arboriculture and Urban Forestry, 32(5), 236.
Sieghardt, M., Mursch-Radlgruber, E., Paoletti, E., Couenberg, E., Dimitrakopoulus, A.,
Rego,F., & Randrup, T. B. (2005). The abiotic urban environment: Impact of
urban growing conditions on urban vegetation. In C. Konijnendijk, K. Nilsson,
T. Randrup, & J. Schipperijn (Eds), Urban forests and trees (pp. 281-323). New
York: Springer.
Sistem Talian Aduan Rakyat (2017). Retrieved from http://stars.selangor.gov.my
/login.html
Sreetheran, M., Adnan, M., & Khairil Azuar, A. K. (2011). Street tree inventory and tree
risk assessment of selected major roads in Kuala Lumpur, Malaysia.
Arboriculture and Urban Forestry, 37(5), 226.
Wiseman, P. E. (2017). Roadside tree risk management by state departments of
transportation in the Mid-Atlantic region: A pilot study conducted by the
virginia tech department of forest resources and environmental conservation.
(n.p.): (n.p.).
Ramly Hasan, Noriah Othman & Faridah Ismail
Developing Malaysian Roadside Tree Species Selection Model in Urban Areas
© 2018 by MIP 260
Vogt, J., Gillner, S., Hofmann, M., Tharang, A., Dettmann, S., Gerstenberg, T., & Roloff,
A. (2017). Citree: A database supporting tree selection for urban areas in
temperate climate. Landscape and Urban Planning, 157, 14-25.
Yaman, A. R., Jamil, M. Z., & Yaakob, R. (2011). Manual pengurusan risiko pokok
ameniti. Kuala Lumpur: Jabatan Landskap Negara.
Yan, P., & Yang, J. (2018). Performances of urban tree species under disturbances in 120
cities in China. Forests, 9(2), 50.
Zainudin, S. R. (2008). Diversity of urban trees at protocol and residential roads in
Kuching City North, Sarawak and their management issues (pp. 71-80).
1Senior Lecturer at Universiti Teknologi MARA, Malaysia. Email: [email protected] 261
PLANNING MALAYSIA:
Journal of the Malaysian Institute of Planners
VOLUME 16 ISSUE 3 (2018) Page 261 – 273
ASSESSING A WALKABLE ENVIRONMENT IN JALAN TUANKU
ABDUL RAHMAN, KUALA LUMPUR, MALAYSIA
Na’asah Nasrudin1, Muna Sarimin2 & Norhayati Ibrahim3
Faculty of Architecture, Planning and Surveying
UNIVERSITI TEKNOLOGI MARA, MALAYSIA
Abstract
There is currently a wide discussion on promoting a walkable environment and
improving walkability especially in city centre. Walking in the city is meant to
solve numerous problems ranging from the city vibrancy, traffic congestion,
environmental injustice, social isolation to the human health issues related to
obesity crisis. This paper aims to examine the walkable environment of Jalan
Tuanku Abdul Rahman as one of the busiest pedestrian urban places in the city
centre of Kuala Lumpur, the capital city of Malaysia. It investigates the
pedestrians’ perception on their walking experience based on the walkable
environment elements i.e. comfort, safety and levels of enjoyment. A participant
observation and questionnaire survey technique were employed whereby the
former involved with the researchers general physical evaluation of the site and
the latter engaged a random sample of 120 pedestrians of Jalan Tuanku Abdul
Rahman for a paper-based on street questionnaire survey. The findings suggested
that the majority of the respondents were satisfied with the existing conditions of
comfort and safety and hence, regarded Jalan Tuanku Abdul Rahman as a
walkable area. However, their level of enjoyment was generally minimal
suggesting that there are rooms for further improvement in the pedestrian area to
create a better and more conducive walkable environment.
Keywords: walkable, enjoyable walkway, pedestrian walkway
Na’asah Nasrudin, Muna Sarimin & Norhayati Ibrahim
Assessing a Walkable Environment in Jalan Tuanku Abdul Rahman, Kuala Lumpur, Malaysia
© 2018 by MIP 262
INTRODUCTION Recent studies have confirmed that car culture is on the decline in the city centre
and that increasing attention is being paid to walkable spaces and walkability to
make cities more vibrant and attractive, sustainable, healthier and safer. Walking
is the elementary means of people moving around, integrating and living the
urban space and accomplishing a salutary physical activity. Many benefits have
also been associated with walking, ranging from reducing traffic congestion and
pollution to controlling health crisis related to obesity. Walking can also be
regarded as an essential factor in the creation of liveable communities.
Walkability is usually linked to the quality of the built environment and
connected by the quality of the pedestrian environment. A walkable environment
is often attractive because it is lively and sociable, pleasant, clean and full of
interesting people. Creating walkable environment for pedestrians can improve
urban conditions. It is also seen such environment will be able to promote
environmental preservation, maintaining social equity components of sustainable
urban form as well as providing a more sustainable transportation options. These
save energy and provide opportunities for those who cannot use cars because of
age, income and disability. With such associated benefits, critical questions are
normally posed to researchers, particularly the urban planners: how best to
promote walking and to what extent our built environment is able to encourage
people to walk. This paper, therefore, aims to examine the walkable environment
of Jalan Tuanku Abdul Rahman as one of the busiest pedestrian urban places in
the city centre of Kuala Lumpur, the capital city of Malaysia. This paper is
structured into six sections. The subsequent section is the research background
comprising the literature review of the study. Section three and four explains
about the study area and research methodology respectively. They are then
followed by the results and discussion section and finally, a section on conclusion
and implications of the results. RESEARCH BACKGROUND A walkable environment is often multidimensional in terms of means and these
dimensions are normally measureable. According to Rahaman, Lourenco and
Viegas (2012), a pedestrian space should have some essential elements in order
to meet the needs and comfort of people. Besides, it needs to be managed
efficiently and effectively to promote a conducive environment, sustainable and
eco-friendly to be used by multiple ages of users with a different ability.
Meanwhile, Shamsuddin, Hassan and Bilyamin (2012), and Llewelyn-Davies
(2000) argued that the street design must be a sign of its street activities whereby
for a the specific commercial street, the design of the street must be able to reflect
the on-going the commercial activity.
Much has been written on the elements necessary for a supportive
pedestrian environment. Sarkar and Janardhan (1997) have used similar criteria
PLANNING MALAYSIA
Journal of the Malaysia Institute of Planners (2018)
263 © 2018 by MIP
for evaluating how well streets can serve pedestrians. Both assigned grades to
streets based on how successful they were in the following categories: safety and
security, continuity of the pedestrian network, system coherence, convenience
and comfort, and attractiveness. The enhancement of a liveable street will also
able to promote a safer urban environment. From the environmental point of
view, walking is a “green” mode of transport, as it has a low environmental
impact, without air and noise pollution. The presence of a walkable environment
and transit systems will create a smart alternative to private car usage, thus
reducing traffic congestion, noise, and emissions.
One of the thrusts of development in a rapid city is to utilise resources in
an efficient manner in order to achieve sustainable development. It is translated
in the principles of sustainable urban design by creating a walkable environment
to encourage and facilitate communities in the city to walk. To materialise the
idea of a sustainable city, a network of safe and comfortable pedestrian area
through physical design in cities should be planned, implemented and monitored
(Shamsuddin et al., 2012).
Many factors have been considered to be limitations or constraints to
walking in an urban area (Handy, Xinyu, & Mokhtarian, 2005). The limitation
factors include stressors, like crowding, noise, traffic congestion, community
violence and crime and physical features that reduce the sense of place. The safety
factor (as in fear of crime) has been frequently cited as the highest constraint to
walking by the more vulnerable groups and the people who rely more on walking
(Evans 2009). Meanwhile, travel behaviour theories have been useful in
understanding the factors that influence people to walk and what do people value
most in any of their walking experience. Travel behaviour is influenced by
situational and personal factors (Bouscasse, Joly, & Bonne, 2018). Socio-
psychological factors like attitudes towards the environment and certain modes
of transport or the importance of moral obligation and environmental beliefs are
the main influencing variables for daily travel. People with high environmental
concern have a better perception of “green” mode transport like cycling and
walking.
THE STUDY AREA With a population of over 1.5 million, Kuala Lumpur is the largest city in
Malaysia and growing rapidly. Being an international commercial and financial
centre, the city has put in a tremendous and concerted effort to enhance its
attractiveness and this include improving selected street in Kuala Lumpur for
pedestrians. The Kuala Lumpur Structure Plan 2020 has identified Jalan Tuanku
Abdul Rahman (TAR) as one of the major spines and part of the City Centre
Commercial (CCC) Zone. It is designated as such to promote broad range of
commercial activities to be conducted within walking distance and therefore,
providing the highest potential in supporting Kuala Lumpur’s economic growth.
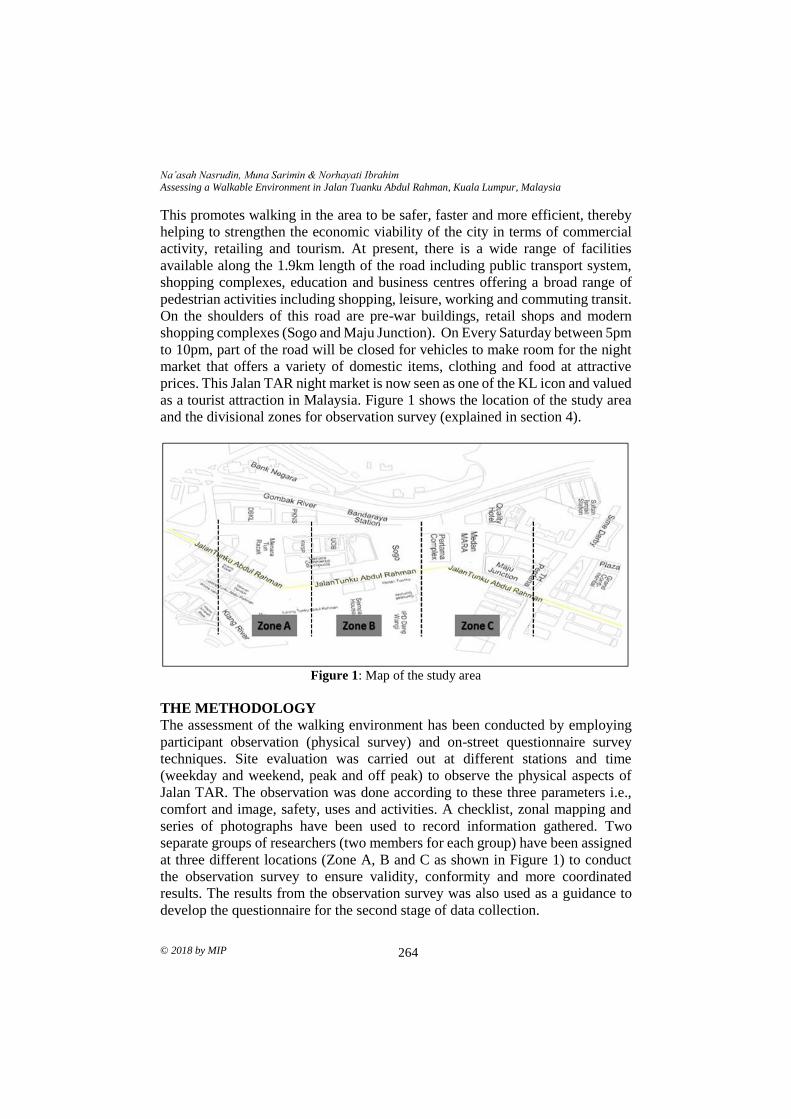
Na’asah Nasrudin, Muna Sarimin & Norhayati Ibrahim
Assessing a Walkable Environment in Jalan Tuanku Abdul Rahman, Kuala Lumpur, Malaysia
© 2018 by MIP 264
This promotes walking in the area to be safer, faster and more efficient, thereby
helping to strengthen the economic viability of the city in terms of commercial
activity, retailing and tourism. At present, there is a wide range of facilities
available along the 1.9km length of the road including public transport system,
shopping complexes, education and business centres offering a broad range of
pedestrian activities including shopping, leisure, working and commuting transit.
On the shoulders of this road are pre-war buildings, retail shops and modern
shopping complexes (Sogo and Maju Junction). On Every Saturday between 5pm
to 10pm, part of the road will be closed for vehicles to make room for the night
market that offers a variety of domestic items, clothing and food at attractive
prices. This Jalan TAR night market is now seen as one of the KL icon and valued
as a tourist attraction in Malaysia. Figure 1 shows the location of the study area
and the divisional zones for observation survey (explained in section 4).
Figure 1: Map of the study area
THE METHODOLOGY The assessment of the walking environment has been conducted by employing
participant observation (physical survey) and on-street questionnaire survey
techniques. Site evaluation was carried out at different stations and time
(weekday and weekend, peak and off peak) to observe the physical aspects of
Jalan TAR. The observation was done according to these three parameters i.e.,
comfort and image, safety, uses and activities. A checklist, zonal mapping and
series of photographs have been used to record information gathered. Two
separate groups of researchers (two members for each group) have been assigned
at three different locations (Zone A, B and C as shown in Figure 1) to conduct
the observation survey to ensure validity, conformity and more coordinated
results. The results from the observation survey was also used as a guidance to
develop the questionnaire for the second stage of data collection.
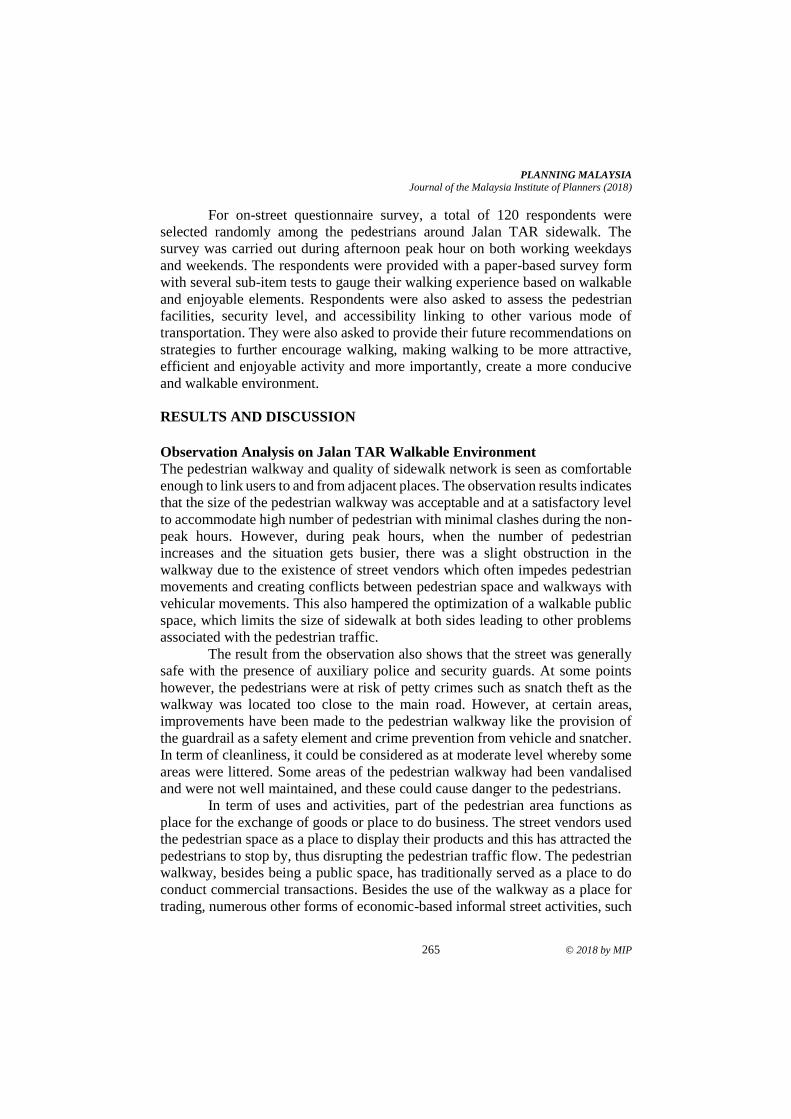
PLANNING MALAYSIA
Journal of the Malaysia Institute of Planners (2018)
265 © 2018 by MIP
For on-street questionnaire survey, a total of 120 respondents were
selected randomly among the pedestrians around Jalan TAR sidewalk. The
survey was carried out during afternoon peak hour on both working weekdays
and weekends. The respondents were provided with a paper-based survey form
with several sub-item tests to gauge their walking experience based on walkable
and enjoyable elements. Respondents were also asked to assess the pedestrian
facilities, security level, and accessibility linking to other various mode of
transportation. They were also asked to provide their future recommendations on
strategies to further encourage walking, making walking to be more attractive,
efficient and enjoyable activity and more importantly, create a more conducive
and walkable environment.
RESULTS AND DISCUSSION
Observation Analysis on Jalan TAR Walkable Environment
The pedestrian walkway and quality of sidewalk network is seen as comfortable
enough to link users to and from adjacent places. The observation results indicates
that the size of the pedestrian walkway was acceptable and at a satisfactory level
to accommodate high number of pedestrian with minimal clashes during the non-
peak hours. However, during peak hours, when the number of pedestrian
increases and the situation gets busier, there was a slight obstruction in the
walkway due to the existence of street vendors which often impedes pedestrian
movements and creating conflicts between pedestrian space and walkways with
vehicular movements. This also hampered the optimization of a walkable public
space, which limits the size of sidewalk at both sides leading to other problems
associated with the pedestrian traffic.
The result from the observation also shows that the street was generally
safe with the presence of auxiliary police and security guards. At some points
however, the pedestrians were at risk of petty crimes such as snatch theft as the
walkway was located too close to the main road. However, at certain areas,
improvements have been made to the pedestrian walkway like the provision of
the guardrail as a safety element and crime prevention from vehicle and snatcher.
In term of cleanliness, it could be considered as at moderate level whereby some
areas were littered. Some areas of the pedestrian walkway had been vandalised
and were not well maintained, and these could cause danger to the pedestrians.
In term of uses and activities, part of the pedestrian area functions as
place for the exchange of goods or place to do business. The street vendors used
the pedestrian space as a place to display their products and this has attracted the
pedestrians to stop by, thus disrupting the pedestrian traffic flow. The pedestrian
walkway, besides being a public space, has traditionally served as a place to do
conduct commercial transactions. Besides the use of the walkway as a place for
trading, numerous other forms of economic-based informal street activities, such
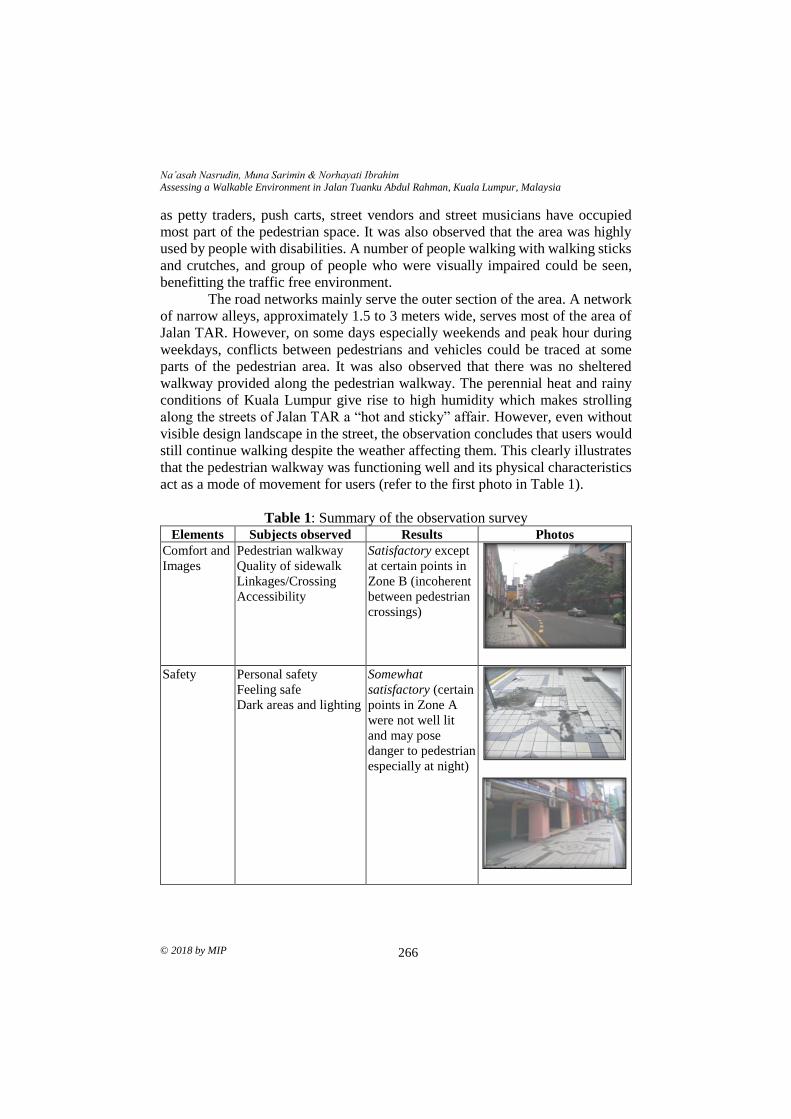
Na’asah Nasrudin, Muna Sarimin & Norhayati Ibrahim
Assessing a Walkable Environment in Jalan Tuanku Abdul Rahman, Kuala Lumpur, Malaysia
© 2018 by MIP 266
as petty traders, push carts, street vendors and street musicians have occupied
most part of the pedestrian space. It was also observed that the area was highly
used by people with disabilities. A number of people walking with walking sticks
and crutches, and group of people who were visually impaired could be seen,
benefitting the traffic free environment.
The road networks mainly serve the outer section of the area. A network
of narrow alleys, approximately 1.5 to 3 meters wide, serves most of the area of
Jalan TAR. However, on some days especially weekends and peak hour during
weekdays, conflicts between pedestrians and vehicles could be traced at some
parts of the pedestrian area. It was also observed that there was no sheltered
walkway provided along the pedestrian walkway. The perennial heat and rainy
conditions of Kuala Lumpur give rise to high humidity which makes strolling
along the streets of Jalan TAR a “hot and sticky” affair. However, even without
visible design landscape in the street, the observation concludes that users would
still continue walking despite the weather affecting them. This clearly illustrates
that the pedestrian walkway was functioning well and its physical characteristics
act as a mode of movement for users (refer to the first photo in Table 1).
Table 1: Summary of the observation survey Elements Subjects observed Results Photos
Comfort and
Images
Pedestrian walkway
Quality of sidewalk
Linkages/Crossing
Accessibility
Satisfactory except
at certain points in
Zone B (incoherent
between pedestrian
crossings)
Safety Personal safety
Feeling safe
Dark areas and lighting
Somewhat
satisfactory (certain
points in Zone A
were not well lit
and may pose
danger to pedestrian
especially at night)
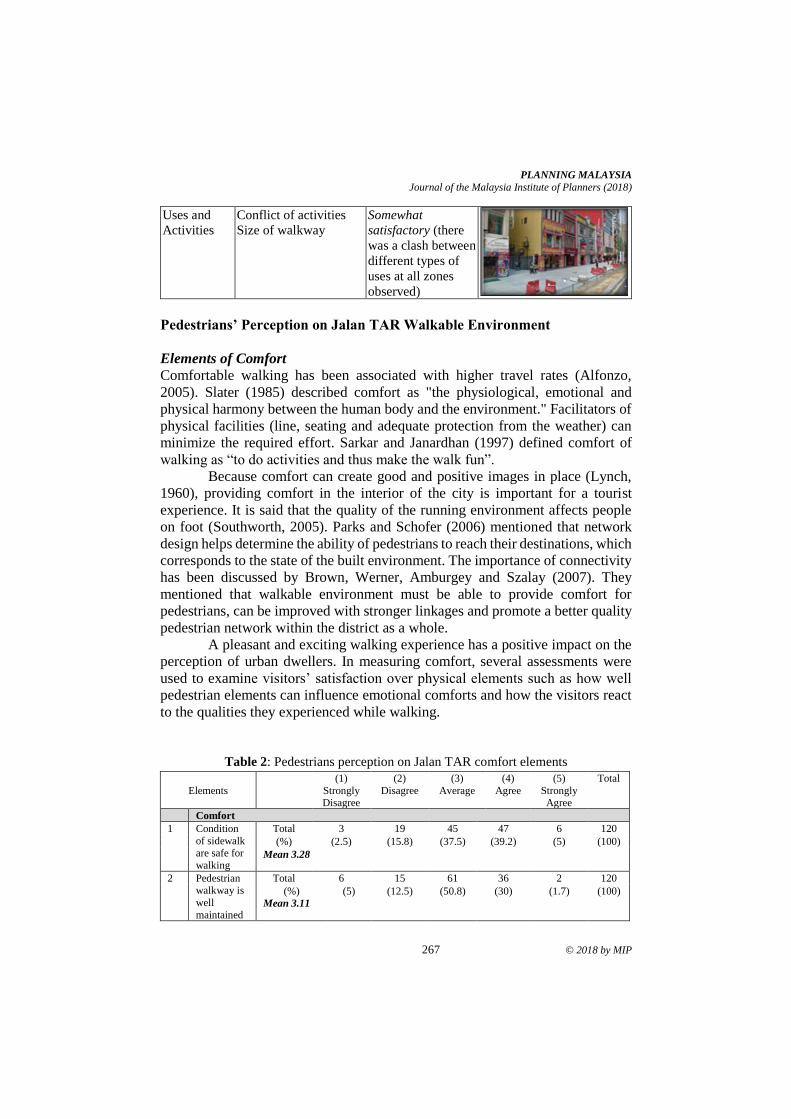
PLANNING MALAYSIA
Journal of the Malaysia Institute of Planners (2018)
267 © 2018 by MIP
Uses and
Activities
Conflict of activities
Size of walkway
Somewhat
satisfactory (there
was a clash between
different types of
uses at all zones
observed)
Pedestrians’ Perception on Jalan TAR Walkable Environment
Elements of Comfort Comfortable walking has been associated with higher travel rates (Alfonzo,
2005). Slater (1985) described comfort as "the physiological, emotional and
physical harmony between the human body and the environment." Facilitators of
physical facilities (line, seating and adequate protection from the weather) can
minimize the required effort. Sarkar and Janardhan (1997) defined comfort of
walking as “to do activities and thus make the walk fun”.
Because comfort can create good and positive images in place (Lynch,
1960), providing comfort in the interior of the city is important for a tourist
experience. It is said that the quality of the running environment affects people
on foot (Southworth, 2005). Parks and Schofer (2006) mentioned that network
design helps determine the ability of pedestrians to reach their destinations, which
corresponds to the state of the built environment. The importance of connectivity
has been discussed by Brown, Werner, Amburgey and Szalay (2007). They
mentioned that walkable environment must be able to provide comfort for
pedestrians, can be improved with stronger linkages and promote a better quality
pedestrian network within the district as a whole.
A pleasant and exciting walking experience has a positive impact on the
perception of urban dwellers. In measuring comfort, several assessments were
used to examine visitors’ satisfaction over physical elements such as how well
pedestrian elements can influence emotional comforts and how the visitors react
to the qualities they experienced while walking.
Table 2: Pedestrians perception on Jalan TAR comfort elements
Elements
(1)
Strongly Disagree
(2)
Disagree
(3)
Average
(4)
Agree
(5)
Strongly Agree
Total
Comfort
1 Condition
of sidewalk are safe for
walking
Total 3 19 45 47 6 120
(%) (2.5) (15.8) (37.5) (39.2) (5) (100)
Mean 3.28
2 Pedestrian walkway is
well
maintained
Total 6 15 61 36 2 120
(%) Mean 3.11
(5) (12.5) (50.8) (30) (1.7) (100)
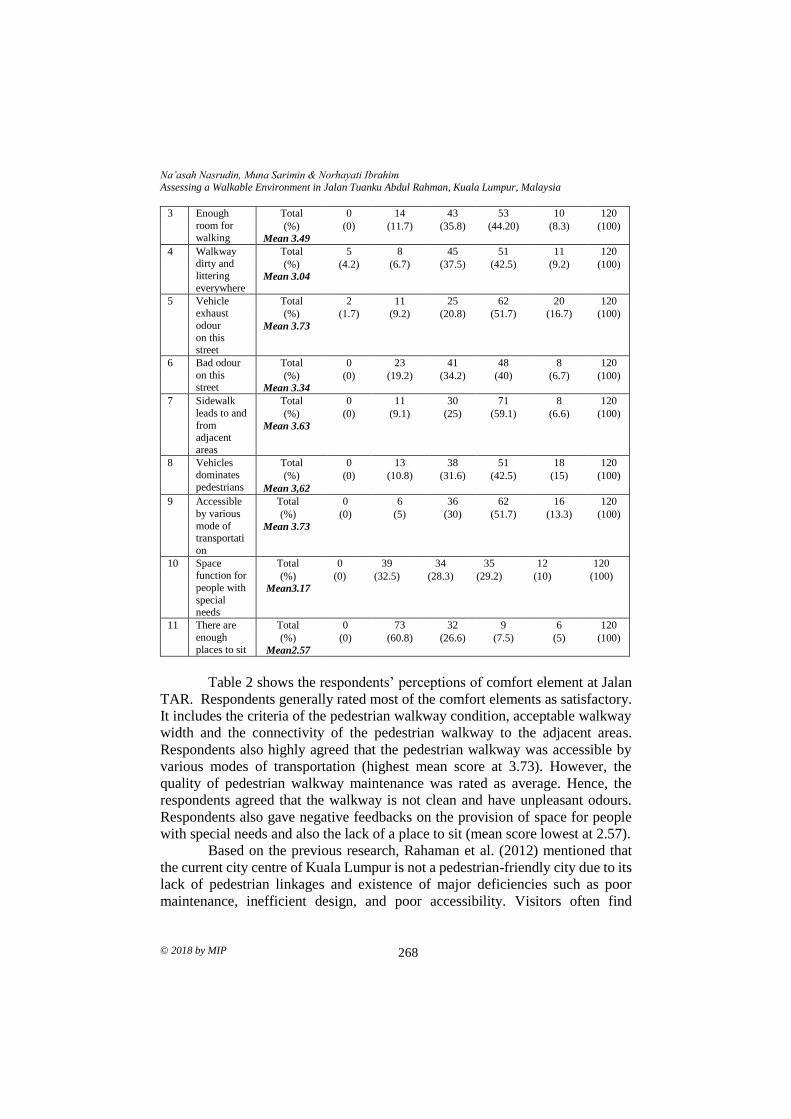
Na’asah Nasrudin, Muna Sarimin & Norhayati Ibrahim
Assessing a Walkable Environment in Jalan Tuanku Abdul Rahman, Kuala Lumpur, Malaysia
© 2018 by MIP 268
3 Enough
room for
walking
Total 0 14 43 53 10 120
(%)
Mean 3.49
(0) (11.7) (35.8) (44.20) (8.3) (100)
4 Walkway dirty and
littering
everywhere
Total 5 8 45 51 11 120
(%) Mean 3.04
(4.2) (6.7) (37.5) (42.5) (9.2) (100)
5 Vehicle exhaust
odour
on this street
Total 2 11 25 62 20 120
(%)
Mean 3.73
(1.7) (9.2) (20.8) (51.7) (16.7) (100)
6 Bad odour
on this street
Total 0 23 41 48 8 120
(%) Mean 3.34
(0) (19.2) (34.2) (40) (6.7) (100)
7 Sidewalk
leads to and
from adjacent
areas
Total 0 11 30 71 8 120
(%)
Mean 3.63
(0) (9.1) (25) (59.1) (6.6) (100)
8 Vehicles dominates
pedestrians
Total 0 13 38 51 18 120
(%) (0) (10.8) (31.6) (42.5) (15) (100)
Mean 3,62
9 Accessible
by various
mode of
transportati
on
Total 0 6 36 62 16 120
(%)
Mean 3.73
(0) (5) (30) (51.7) (13.3) (100)
10 Space function for
people with
special needs
Total 0 39 34 35 12 120
(%) Mean3.17
(0) (32.5) (28.3) (29.2) (10) (100)
11 There are
enough
places to sit
Total 0 73 32 9 6 120
(%)
Mean2.57
(0) (60.8) (26.6) (7.5) (5) (100)
Table 2 shows the respondents’ perceptions of comfort element at Jalan
TAR. Respondents generally rated most of the comfort elements as satisfactory.
It includes the criteria of the pedestrian walkway condition, acceptable walkway
width and the connectivity of the pedestrian walkway to the adjacent areas.
Respondents also highly agreed that the pedestrian walkway was accessible by
various modes of transportation (highest mean score at 3.73). However, the
quality of pedestrian walkway maintenance was rated as average. Hence, the
respondents agreed that the walkway is not clean and have unpleasant odours.
Respondents also gave negative feedbacks on the provision of space for people
with special needs and also the lack of a place to sit (mean score lowest at 2.57).
Based on the previous research, Rahaman et al. (2012) mentioned that
the current city centre of Kuala Lumpur is not a pedestrian-friendly city due to its
lack of pedestrian linkages and existence of major deficiencies such as poor
maintenance, inefficient design, and poor accessibility. Visitors often find
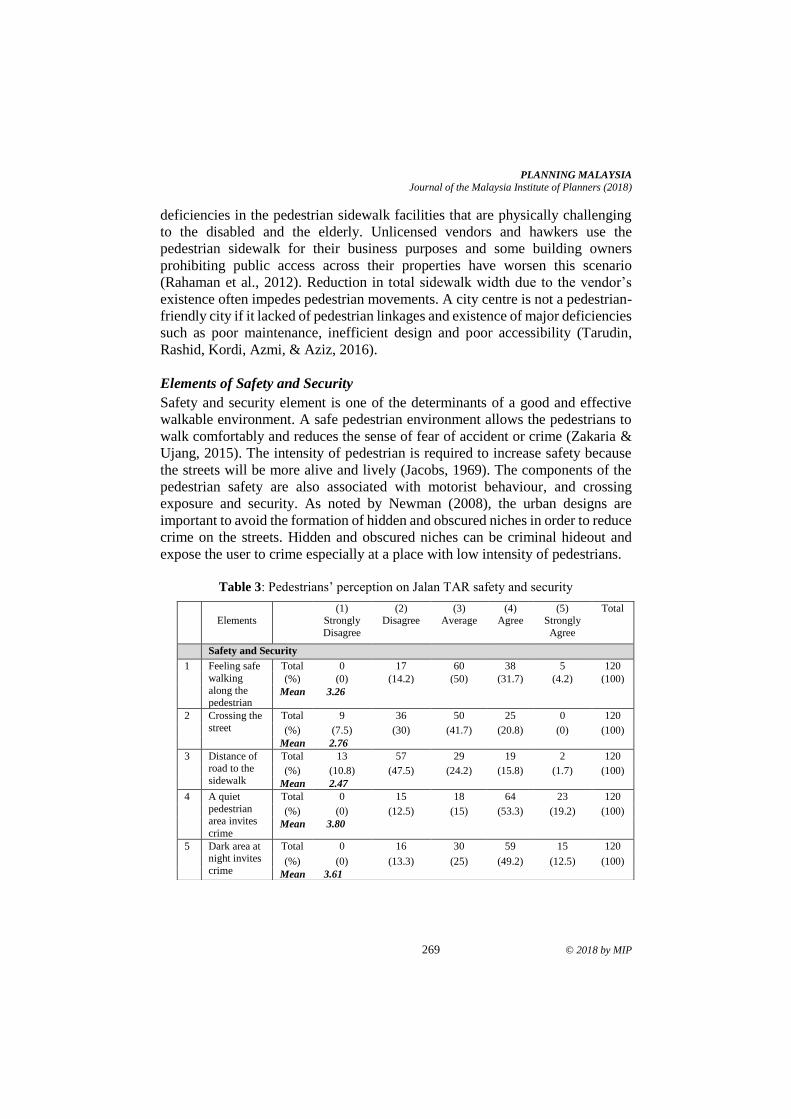
PLANNING MALAYSIA
Journal of the Malaysia Institute of Planners (2018)
269 © 2018 by MIP
deficiencies in the pedestrian sidewalk facilities that are physically challenging
to the disabled and the elderly. Unlicensed vendors and hawkers use the
pedestrian sidewalk for their business purposes and some building owners
prohibiting public access across their properties have worsen this scenario
(Rahaman et al., 2012). Reduction in total sidewalk width due to the vendor’s
existence often impedes pedestrian movements. A city centre is not a pedestrian-
friendly city if it lacked of pedestrian linkages and existence of major deficiencies
such as poor maintenance, inefficient design and poor accessibility (Tarudin,
Rashid, Kordi, Azmi, & Aziz, 2016).
Elements of Safety and Security
Safety and security element is one of the determinants of a good and effective
walkable environment. A safe pedestrian environment allows the pedestrians to
walk comfortably and reduces the sense of fear of accident or crime (Zakaria &
Ujang, 2015). The intensity of pedestrian is required to increase safety because
the streets will be more alive and lively (Jacobs, 1969). The components of the
pedestrian safety are also associated with motorist behaviour, and crossing
exposure and security. As noted by Newman (2008), the urban designs are
important to avoid the formation of hidden and obscured niches in order to reduce
crime on the streets. Hidden and obscured niches can be criminal hideout and
expose the user to crime especially at a place with low intensity of pedestrians.
Table 3: Pedestrians’ perception on Jalan TAR safety and security
Elements
(1) Strongly
Disagree
(2) Disagree
(3) Average
(4) Agree
(5) Strongly
Agree
Total
Safety and Security
1 Feeling safe
walking
along the pedestrian
Total 0 17 60 38 5 120
(%) (0) (14.2) (50) (31.7) (4.2) (100)
Mean 3.26
2 Crossing the
street
Total 9 36 50 25 0 120
(%) (7.5) (30) (41.7) (20.8) (0) (100)
Mean 2.76
3 Distance of road to the
sidewalk
Total 13 57 29 19 2 120
(%) (10.8) (47.5) (24.2) (15.8) (1.7) (100)
Mean 2.47
4 A quiet
pedestrian area invites
crime
Total 0 15 18 64 23 120
(%) (0) (12.5) (15) (53.3) (19.2) (100)
Mean 3.80
5 Dark area at night invites
crime
Total 0 16 30 59 15 120
(%) (0) (13.3) (25) (49.2) (12.5) (100)
Mean 3.61
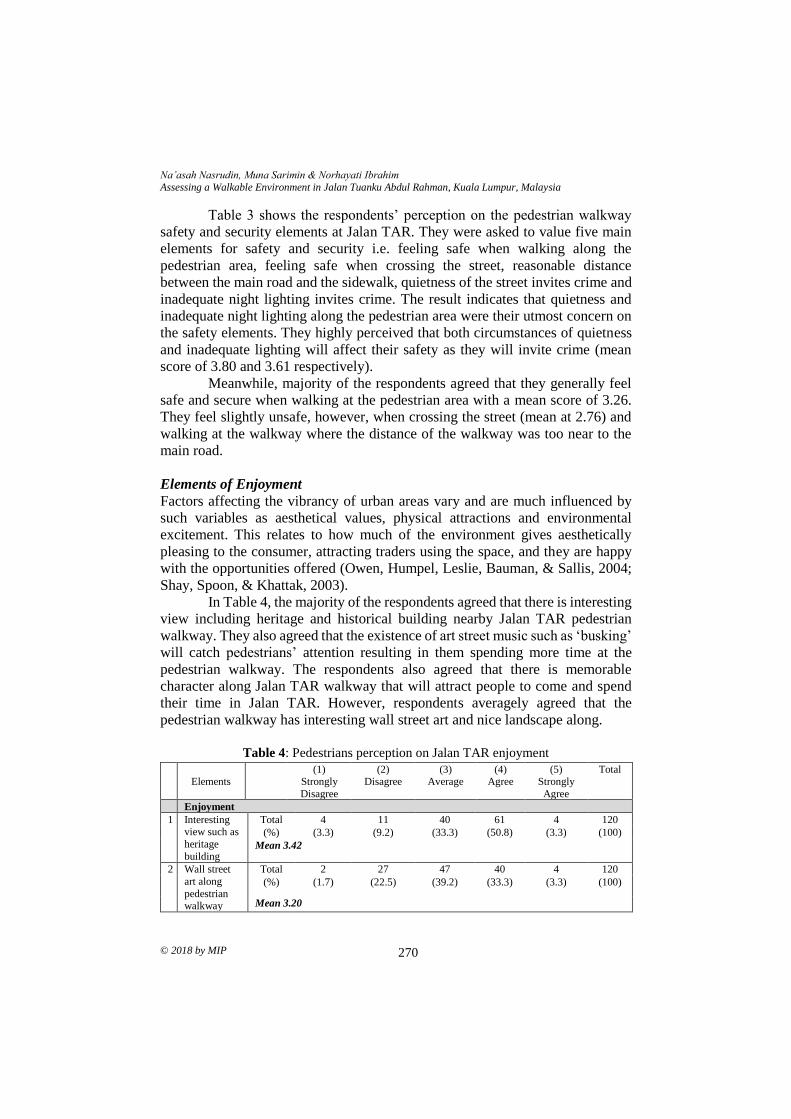
Na’asah Nasrudin, Muna Sarimin & Norhayati Ibrahim
Assessing a Walkable Environment in Jalan Tuanku Abdul Rahman, Kuala Lumpur, Malaysia
© 2018 by MIP 270
Table 3 shows the respondents’ perception on the pedestrian walkway
safety and security elements at Jalan TAR. They were asked to value five main
elements for safety and security i.e. feeling safe when walking along the
pedestrian area, feeling safe when crossing the street, reasonable distance
between the main road and the sidewalk, quietness of the street invites crime and
inadequate night lighting invites crime. The result indicates that quietness and
inadequate night lighting along the pedestrian area were their utmost concern on
the safety elements. They highly perceived that both circumstances of quietness
and inadequate lighting will affect their safety as they will invite crime (mean
score of 3.80 and 3.61 respectively).
Meanwhile, majority of the respondents agreed that they generally feel
safe and secure when walking at the pedestrian area with a mean score of 3.26.
They feel slightly unsafe, however, when crossing the street (mean at 2.76) and
walking at the walkway where the distance of the walkway was too near to the
main road.
Elements of Enjoyment
Factors affecting the vibrancy of urban areas vary and are much influenced by
such variables as aesthetical values, physical attractions and environmental
excitement. This relates to how much of the environment gives aesthetically
pleasing to the consumer, attracting traders using the space, and they are happy
with the opportunities offered (Owen, Humpel, Leslie, Bauman, & Sallis, 2004;
Shay, Spoon, & Khattak, 2003).
In Table 4, the majority of the respondents agreed that there is interesting
view including heritage and historical building nearby Jalan TAR pedestrian
walkway. They also agreed that the existence of art street music such as ‘busking’
will catch pedestrians’ attention resulting in them spending more time at the
pedestrian walkway. The respondents also agreed that there is memorable
character along Jalan TAR walkway that will attract people to come and spend
their time in Jalan TAR. However, respondents averagely agreed that the
pedestrian walkway has interesting wall street art and nice landscape along.
Table 4: Pedestrians perception on Jalan TAR enjoyment
Elements
(1) Strongly
Disagree
(2) Disagree
(3) Average
(4) Agree
(5) Strongly
Agree
Total
Enjoyment
1 Interesting view such as
heritage
building
Total 4 11 40 61 4 120
(%) (3.3) (9.2) (33.3) (50.8) (3.3) (100)
Mean 3.42
2 Wall street
art along
pedestrian walkway
Total 2 27 47 40 4 120
(%) (1.7) (22.5) (39.2) (33.3) (3.3) (100)
Mean 3.20
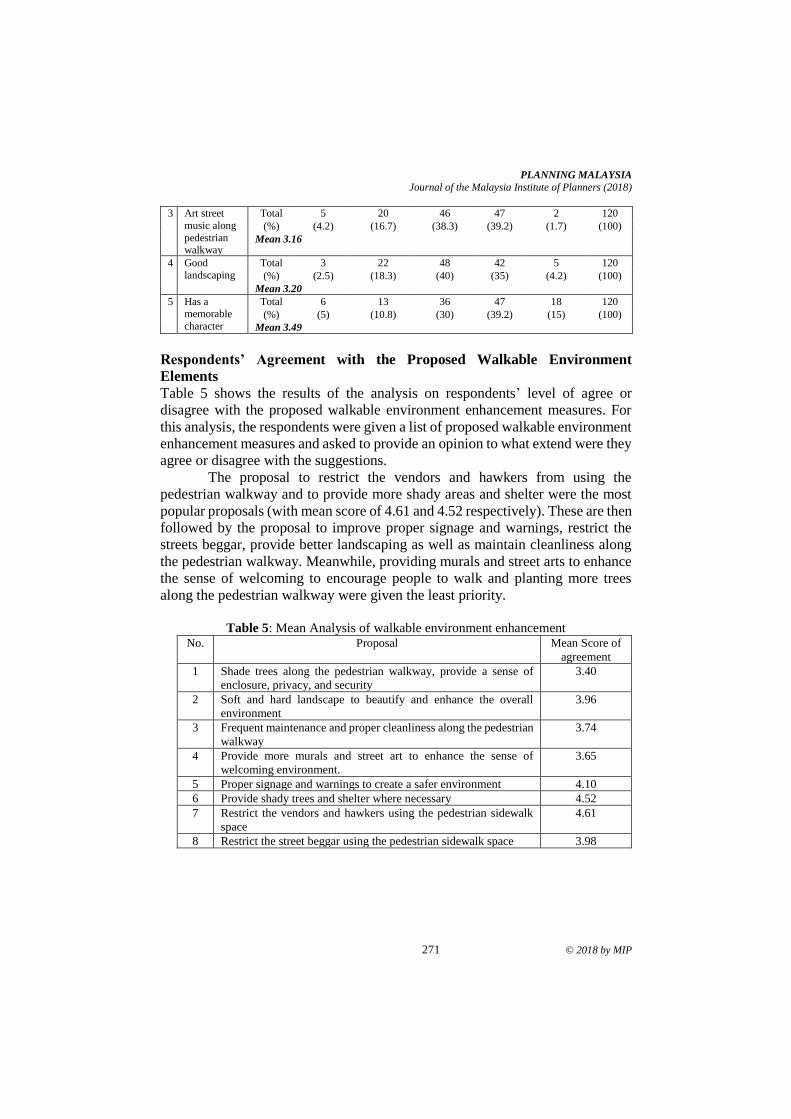
PLANNING MALAYSIA
Journal of the Malaysia Institute of Planners (2018)
271 © 2018 by MIP
3 Art street
music along
pedestrian walkway
Total 5 20 46 47 2 120
(%) (4.2) (16.7) (38.3) (39.2) (1.7) (100)
Mean 3.16
4 Good
landscaping
Total 3 22 48 42 5 120
(%) (2.5) (18.3) (40) (35) (4.2) (100)
Mean 3.20
5 Has a memorable
character
Total 6 13 36 47 18 120
(%) (5) (10.8) (30) (39.2) (15) (100)
Mean 3.49
Respondents’ Agreement with the Proposed Walkable Environment
Elements
Table 5 shows the results of the analysis on respondents’ level of agree or
disagree with the proposed walkable environment enhancement measures. For
this analysis, the respondents were given a list of proposed walkable environment
enhancement measures and asked to provide an opinion to what extend were they
agree or disagree with the suggestions.
The proposal to restrict the vendors and hawkers from using the
pedestrian walkway and to provide more shady areas and shelter were the most
popular proposals (with mean score of 4.61 and 4.52 respectively). These are then
followed by the proposal to improve proper signage and warnings, restrict the
streets beggar, provide better landscaping as well as maintain cleanliness along
the pedestrian walkway. Meanwhile, providing murals and street arts to enhance
the sense of welcoming to encourage people to walk and planting more trees
along the pedestrian walkway were given the least priority.
Table 5: Mean Analysis of walkable environment enhancement
No. Proposal Mean Score of
agreement
1 Shade trees along the pedestrian walkway, provide a sense of
enclosure, privacy, and security
3.40
2 Soft and hard landscape to beautify and enhance the overall
environment
3.96
3 Frequent maintenance and proper cleanliness along the pedestrian
walkway
3.74
4 Provide more murals and street art to enhance the sense of
welcoming environment.
3.65
5 Proper signage and warnings to create a safer environment 4.10
6 Provide shady trees and shelter where necessary 4.52
7 Restrict the vendors and hawkers using the pedestrian sidewalk
space
4.61
8 Restrict the street beggar using the pedestrian sidewalk space 3.98
Na’asah Nasrudin, Muna Sarimin & Norhayati Ibrahim
Assessing a Walkable Environment in Jalan Tuanku Abdul Rahman, Kuala Lumpur, Malaysia
© 2018 by MIP 272
CONCLUSION This study concludes that Jalan TAR pedestrian walkway has comfort and
enjoyable elements as it able to offer both emotional and physical harmony
between the human body and the environment. However, majority respondents
were quite sceptical on safety and security issues and did not give a positive
feedback which limits the overall walkability values of the area. This suggests
that improvement is needed to further enhance the walkable criteria. As
walkability environment should be the asset of a city whereby tourists get
attracted to experience the place, there is a need to create a pedestrian walkway
that is walkable, distinctive with a strong identity and sense of place. A pedestrian
walkway with good and quality design will encourage greater community
participation in walking and can influence emotional comforts and experience
while walking. Sheltered walkway should be provided where necessary to shield
the pedestrians from the hot weather and rainy days, and tree planting is seen a
natural solution to these problems. The design and provision of all important
walkway elements and street furniture (including public art) should be
coordinated, wherever possible, to make a positive contribution, avoid
unnecessary clutter, and ensure a safe, informative and attractive walking
environment.
ACKNOWLEDGEMENT
The authors would like to thank the Ministry of Higher Education, Malaysia for
funding this research through the FRGS grant (FRGS/1/2016/SS07/UITM/02/5)
and Universiti Teknologi MARA (UiTM) for supporting the research.
REFERENCES Alfonzo, M. A. (2005). To walk or not to walk? The hierarchy of walking needs.
Environment and Behaviour, 37, 808-836.
Bouscasse, H., Joly, I., & Bonne, P. (2018). How does environmental concern influence
mode choice habits? A mediation analysis. Transportation Research Part D:
Transport and Environment, 59, 205-222.
Brown, B. B., Werner, C. M., Amburgey, J. M., & Szalay, C. (2007). Walkable Route
perception and Physical Features: Converging Evidence for En Route Walking
Experience. Environment and Behaviour, 39, 34-61.
Evans, G. (2009). Accessibility, urban design and the whole journey environment. Built
Environment, 35(3), 366-385.
Handy, S., Xinyu, C., & Mokhtarian, P. L. (2005). Correlation or causality between the
built environment and travel behavior: Evidence from Northern California.
Transportation Research Part D: Transport and Environment, 10(6), 427-444.
Jacobs, J. (1969). The death and life of great American cities. New York: The Modern
Library.
PLANNING MALAYSIA
Journal of the Malaysia Institute of Planners (2018)
273 © 2018 by MIP
Llewelyn-Davies (Firm). (2000). Urban design compendium. United Kingdom: English
Partnership & The Housing Copporation, UK.
Lynch, K. (1960). A Imagem Da Cidade (The Image of the City) (1996th ed). Lisboa:
Edicoes 70.
Newman, O. (2008). Creating defensible space. Darby, PA: Diane.
Owen, N., Humpel, N., Leslie, E., Bauman, A., & Sallis, J. F. (2004). Understanding
environmental influences on walking. American Journal of Preventive Medicine,
27(1), 67-76.
Parks, J. R., & Schofer, J. L. (2006). Characterizing neighborhood pedestrian
environments with secondary data. Transportation Research Part D: Transport
and Environment, 11(4), 250-263.
Rahaman, K. R., Lourenco, J. M., & Viegas, J. M. (2012). Perceptions of pedestrians and
shopkeepers in European medium-sized cities: Study of Guimara-tildees,
Portugal. Journal of Urban Planning and Development, 138(1) 26-34.
Sarkar, A. K., & Janardhan, K. S. V. S. (1997). A study on pedestrian flow characteristics.
Proceedings Transportation Research Board, 368, 232-238. Washington: (n.p.).
Shamsuddin S., Hassan N. R. A, & Bilyamin S. F. I. (2012). Walkable environment in
increasing the liveability of a city. Procedia-Social and Behavioral Sciences, 50,
167-178.
Shay, E., Spoon, S. C., & Khattak, A. J. (2003). Walkable environment and walking
activity. Chapel Hill: University of North Carolina.
Slater, K. (1985). Human comfort. Springfield, IL: Charles C. Thomas Publisher.
Southworth, M. (2005). Designing the walkable city. Journal of Urban Planning and
Development, 131, 246-257.
Tarudin, N. F., Rashid, M. F. A., Kordi, N. E , Azmi, E. A., & Aziz, T. N. A. T. (2016).
The Improvement on the Sidewalk in Commercial Areas at City Center in
Malaysia. Journal of Applied Environmental and Biological Sciences. 6(9S)35-
38.
Zakaria, J., & Ujang, N. (2015). Comfort of walking in the city center of Kuala Lumpur.
Procedia - Social and Behavioral Sciences, 170, 642-652.
1Senior Lecturer at Universiti Teknologi MARA, Malaysia. E-mail: [email protected] 274
PLANNING MALAYSIA:
Journal of the Malaysian Institute of Planners
VOLUME 16 ISSUE 3 (2018) Page 274 – 284
THE DEFENSIBLE SPACE CONCEPT IN NEIGHBOURHOOD PARK
CASE STUDY: TAMAN TASIK PUCHONG PERDANA, SELANGOR,
MALAYSIA
Marlyana Azyyati Marzukhi1, Mohd Aizzat Afiq2, Oliver Ling Hoon Leh3,
& Yusfida Ayu Abdullah4
1,2,3,4Faculty of Architecture, Planning and Surveying
UNIVERSITI TEKNOLOGI MARA, MALAYSIA
Abstract
Open space can contribute to the overall wellbeing of life by providing social and
recreational focal points. However, open space may also be associated with
undesirable qualities of a place such as crime activities that affect negatively its
quality and the surrounding. Thus, to create a safe and comfort open space area,
the defensible space concept is seen as an important approach to deter crime from
occurring and to sustain the safety environment. Therefore, this research
objective is to investigate whether the elements of the defensible space concept;
territoriality, surveillance, and image, may be used in the planning of
neighbourhood park. A study was carried out at Taman Tasik Puchong Perdana,
Selangor by using a questionnaire survey to collect information from the visitors.
The findings show that the defensible space concept with all the three elements
was not implemented, which further may lead to the crime activities in the
neighborhood park.
Keywords: open space, neighbourhood park, defensible space, territoriality,
surveillance, image
PLANNING MALAYSIA
Journal of the Malaysia Institute of Planners (2018)
275 © 2018 by MIP
INTRODUCTION
Open space is an important element that needs to be provided at residential,
commercial and industrial area development. It can contribute to the ecological
balance of physical development and function as suitable place for social
interaction and communication. As such, the provision of open space needs
proper planning either from physical or social aspects. According to Zainudin and
Abdul Malek (2010), safe environment is a condition which is free from all of the
physical, social and mental threats. In order to prevent crime, it is important to
design a space that is more easily observed through the placement of physical
elements to maximize visibility. The environment is one of the factors influencing
crime and the level of fear of crime in society (Sakip, Johari, & Salleh, 2012).
During the last few decades, crime incidences in open space and public
spaces have been rapidly increasing (Iqbal, 2015). The absence of proper
approach used to ensure the planning of open space and neighbourhood park can
prevent crime resulted in the opportunity for crime to take place in neighbourhood
park (Anastasia & John, 2007; Liebermann & Kruger, 2004). Hence, the purpose
of this research is to examine the implementation of the defensible space concept
in neighbourhood park.
LITERATURE REVIEW
The defensible space concept was introduced by Oscar Newman in 1972. This
concept is one of the approaches to the prevention of crime. According to
Newman (1972), defensible space is defined as “....model for residential
environments which inhabits crime by creating the physical expression of a social
fabric which defends itself....an environment in which latent territoriality and
sense of community in the inhabitants can be translated into responsibility for
ensuring a safe, productive and well-maintained living space”.
The physical design usually provides the potential for community care
and social control to prevent crime. Newman's concept of space defence was
explained on buildings, roads and the environment in residential area. Although
the concept was not specifically targeted at neighbourhood park, its elements
provide the key point of a space defence that potentially makes it less vulnerable
to crime. In fact, this concept can be adapted into the design scheme of open space
and neighbourhood park, and made as one of the key elements in planning
residential areas and its layout.
Generally, the main purpose of the concept is to restructure the physical
layout and create the social strength among the people so that communities can
strengthen their social interaction and prevent crime from occurring in their
housing area. This includes road and surrounding areas, open spaces and
recreational areas. As mentioned by Mair and Mair (2003), defensible space is
“…a structure for the environment of residential which describe the strength of
the social through the environment manipulation”. This structure can also
Marlyana Azyyati Marzukhi, Mohd Aizzat Afiq, Oliver Ling Hoon Leh, & Yusfida Ayu Abdullah
The Defensible Space Concept in Neighbourhood Park. Case Study: Taman Tasik Puchong Perdana, Selangor, Malaysia
© 2018 by MIP 276
improve the condition of the environment to promote safety, comfort, satisfaction
and productivity of community across a variety of contexts.
This approach aims to prevent criminal activities through the creation of
social value which could keep the community from the threat of criminal activity
in the neighbourhood park. It is important to plan and develop a conducive
recreational area, which can create a sense of belonging to the community.
Further, it will lead the local people to appreciate, value and ensure their
neighbourhood park is safe and well managed to give comfort and guarantees the
safety of the users. In this sense, the planning of the residential area (and
neighbourhood park) is more liveable and can be managed by the residents within
their locality (Mohit & Hannan, 2012).
The concept of defensible space does not solely emphasise on physical
planning approach in preventing crime, but also including certain technical
methods and mechanisms particularly when designing the space’s layout. It also
involves the social aspects, where it needs the participation and awareness among
the community in eradicating crime.
Elements of Defensible Space Concept
According to Newman (1972), the three elements that create the defensible space
are the territoriality, surveillance, and image.
Territoriality Territorial include a group of individuals and other territorial units. This group
will form its surveillance to monitor their home environment. Each unit who is in
the territory has territorial characteristics. A set that includes several territorial
known as a territorial complex. To determine the territorial shape of a region,
individuals who reside in these areas must be observed. This is a situation that
formal (professional) and informal (social). This space refers to ownership clearly
and evidently depends on other factors such as appearance and size, shape and
size, the number of units, the breadth, the types of boundaries and a clear
distinction and detail.
This principle emphasizes that all areas either owned by an individual or
the public should be made clear to public space, semi-public or private and semi-
private. A clear definition of space can help to determine who has the right to use
the space as well as give confidence to the community acting on a stranger or
suspicious activities in their neighbourhood. Separation of this space determines
the quality and spaciousness of every individual in the context of the design and
layout that emphasizes the concept of 'Defensible Space' for showing the
character of the layout. Observation of this case still has not received serious
attention while it has a huge influence on the development plan. In a plan for open
space and neighbourhood park, the establishment of private space, spatial space
behaviour, and territory can be formed within the theory of 'Defensible Space'
PLANNING MALAYSIA
Journal of the Malaysia Institute of Planners (2018)
277 © 2018 by MIP
which is a space defence as a transition zone between public space, semi-public,
semi-private and private. The relationship with the territorial concept living space
must be able to differentiate between these spaces to enhance the sense of security
and can help to reduce the occurrence of crime.
Surveillance Surveillance is an element that is closely related to elements of the territory in
which breadth of a territorial community area will affect the environmental
aspects of surveillance in those communities. It emphasizes the area that is design
to allow the people within the area to observe the activities in the area. The
element of surveillance makes the people engage in unnoticed activities. Some of
the elements that can create surveillance in the area are lighting and benches.
Lighting is important to ensure the area can be seen and not dark so that people
can supervise the area and avoid unnoticed activities. If an area is poorly
maintained and unsupervised, it will create ‘sign of crime’ (Melde & Esbensen,
2009).
Image The image refers to the location of the area that does not appear vulnerable to
crime and not isolated from the surrounding view. The image of the area can
attract people to visit the area. Thus, it can elude from the existence of the
defenceless area which may lead to the crime activities. Every planning of
neighbourhood park should emphasize and implement the safety elements to
ensure the safeness of the public. The “Defensible Space” concept is important in
the implementation of safety elements in the recreation area. The evaluation of
safety level in the recreation area will be carried out in this study. This concept is
crucial in ensuring the security elements be applied in every planning of
recreation area to provide comfort and safety to the users. The implementation of
security elements are also vital to reduce the crime activities.
RESEARCH METHODOLOGY
Study Area
This study is focused on the implementation of the Defensible Space Concept in
neighbourhood park, which is the Taman Tasik Puchong Perdana, Puchong,
Selangor. The total area of Taman Tasik Puchong Perdana is 7.70 acres, which
includes 4.51 acres of lake area. Based on the planning standards published by
the Federal Department of Town and Country Planning Peninsular Malaysia
(2013), the park can be classified as a neighbourhood park.
Taman Tasik Puchong Perdana is located in Puchong within the
administrative boundary of Subang Jaya Municipal Council (MPSJ). It is located
near the entrance of Puchong Perdana, which is within 300 meters from the exit
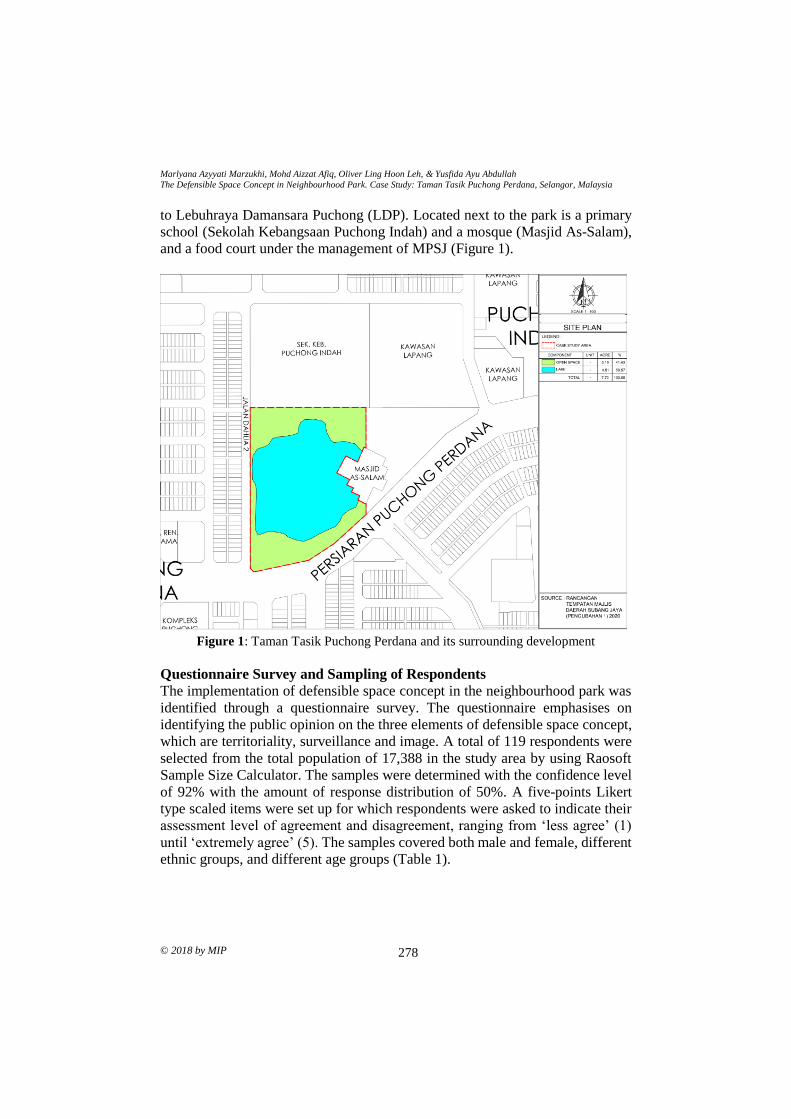
Marlyana Azyyati Marzukhi, Mohd Aizzat Afiq, Oliver Ling Hoon Leh, & Yusfida Ayu Abdullah
The Defensible Space Concept in Neighbourhood Park. Case Study: Taman Tasik Puchong Perdana, Selangor, Malaysia
© 2018 by MIP 278
to Lebuhraya Damansara Puchong (LDP). Located next to the park is a primary
school (Sekolah Kebangsaan Puchong Indah) and a mosque (Masjid As-Salam),
and a food court under the management of MPSJ (Figure 1).
Figure 1: Taman Tasik Puchong Perdana and its surrounding development
Questionnaire Survey and Sampling of Respondents
The implementation of defensible space concept in the neighbourhood park was
identified through a questionnaire survey. The questionnaire emphasises on
identifying the public opinion on the three elements of defensible space concept,
which are territoriality, surveillance and image. A total of 119 respondents were
selected from the total population of 17,388 in the study area by using Raosoft
Sample Size Calculator. The samples were determined with the confidence level
of 92% with the amount of response distribution of 50%. A five-points Likert
type scaled items were set up for which respondents were asked to indicate their
assessment level of agreement and disagreement, ranging from ‘less agree’ (1)
until ‘extremely agree’ (5). The samples covered both male and female, different
ethnic groups, and different age groups (Table 1).
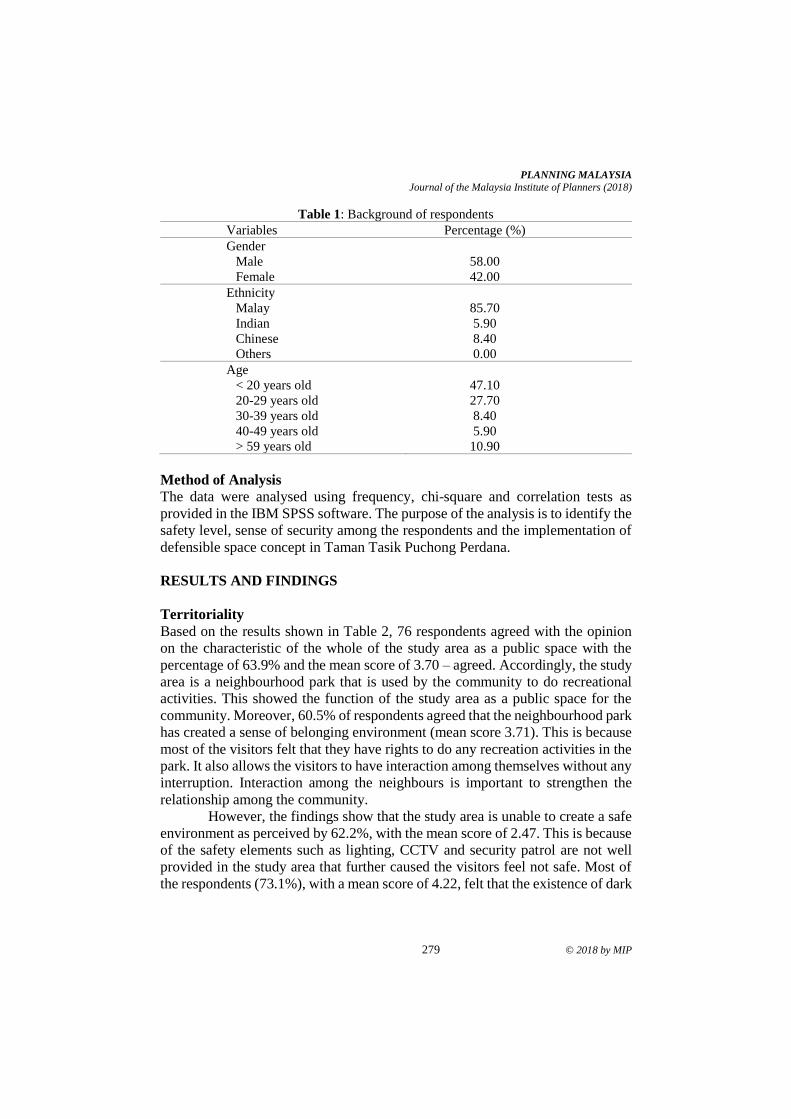
PLANNING MALAYSIA
Journal of the Malaysia Institute of Planners (2018)
279 © 2018 by MIP
Table 1: Background of respondents
Variables Percentage (%)
Gender
Male
Female
58.00
42.00
Ethnicity
Malay
Indian
Chinese
Others
85.70
5.90
8.40
0.00
Age
< 20 years old
20-29 years old
30-39 years old
40-49 years old
> 59 years old
47.10
27.70
8.40
5.90
10.90
Method of Analysis
The data were analysed using frequency, chi-square and correlation tests as
provided in the IBM SPSS software. The purpose of the analysis is to identify the
safety level, sense of security among the respondents and the implementation of
defensible space concept in Taman Tasik Puchong Perdana.
RESULTS AND FINDINGS
Territoriality Based on the results shown in Table 2, 76 respondents agreed with the opinion
on the characteristic of the whole of the study area as a public space with the
percentage of 63.9% and the mean score of 3.70 – agreed. Accordingly, the study
area is a neighbourhood park that is used by the community to do recreational
activities. This showed the function of the study area as a public space for the
community. Moreover, 60.5% of respondents agreed that the neighbourhood park
has created a sense of belonging environment (mean score 3.71). This is because
most of the visitors felt that they have rights to do any recreation activities in the
park. It also allows the visitors to have interaction among themselves without any
interruption. Interaction among the neighbours is important to strengthen the
relationship among the community.
However, the findings show that the study area is unable to create a safe
environment as perceived by 62.2%, with the mean score of 2.47. This is because
of the safety elements such as lighting, CCTV and security patrol are not well
provided in the study area that further caused the visitors feel not safe. Most of
the respondents (73.1%), with a mean score of 4.22, felt that the existence of dark
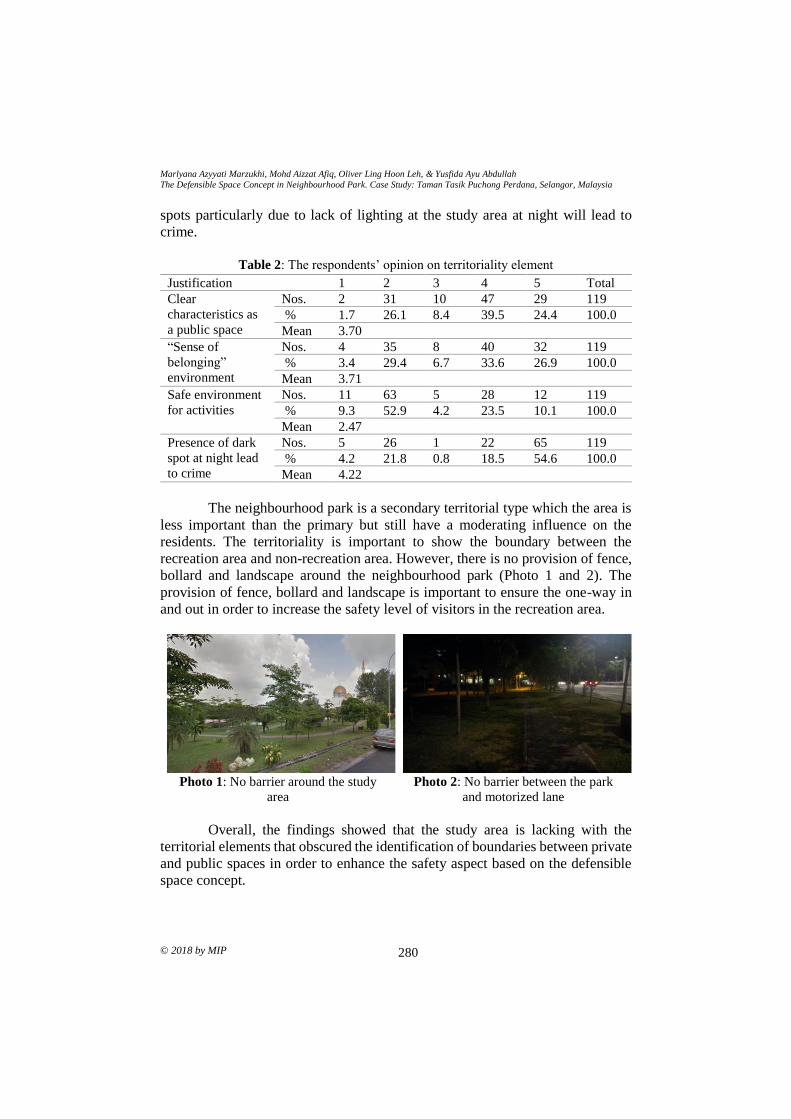
Marlyana Azyyati Marzukhi, Mohd Aizzat Afiq, Oliver Ling Hoon Leh, & Yusfida Ayu Abdullah
The Defensible Space Concept in Neighbourhood Park. Case Study: Taman Tasik Puchong Perdana, Selangor, Malaysia
© 2018 by MIP 280
spots particularly due to lack of lighting at the study area at night will lead to
crime.
Table 2: The respondents’ opinion on territoriality element
Justification 1 2 3 4 5 Total
Clear
characteristics as
a public space
Nos. 2 31 10 47 29 119
% 1.7 26.1 8.4 39.5 24.4 100.0
Mean 3.70
“Sense of
belonging”
environment
Nos. 4 35 8 40 32 119
% 3.4 29.4 6.7 33.6 26.9 100.0
Mean 3.71
Safe environment
for activities
Nos. 11 63 5 28 12 119
% 9.3 52.9 4.2 23.5 10.1 100.0
Mean 2.47
Presence of dark
spot at night lead
to crime
Nos. 5 26 1 22 65 119
% 4.2 21.8 0.8 18.5 54.6 100.0
Mean 4.22
The neighbourhood park is a secondary territorial type which the area is
less important than the primary but still have a moderating influence on the
residents. The territoriality is important to show the boundary between the
recreation area and non-recreation area. However, there is no provision of fence,
bollard and landscape around the neighbourhood park (Photo 1 and 2). The
provision of fence, bollard and landscape is important to ensure the one-way in
and out in order to increase the safety level of visitors in the recreation area.
Photo 1: No barrier around the study
area
Photo 2: No barrier between the park
and motorized lane
Overall, the findings showed that the study area is lacking with the
territorial elements that obscured the identification of boundaries between private
and public spaces in order to enhance the safety aspect based on the defensible
space concept.
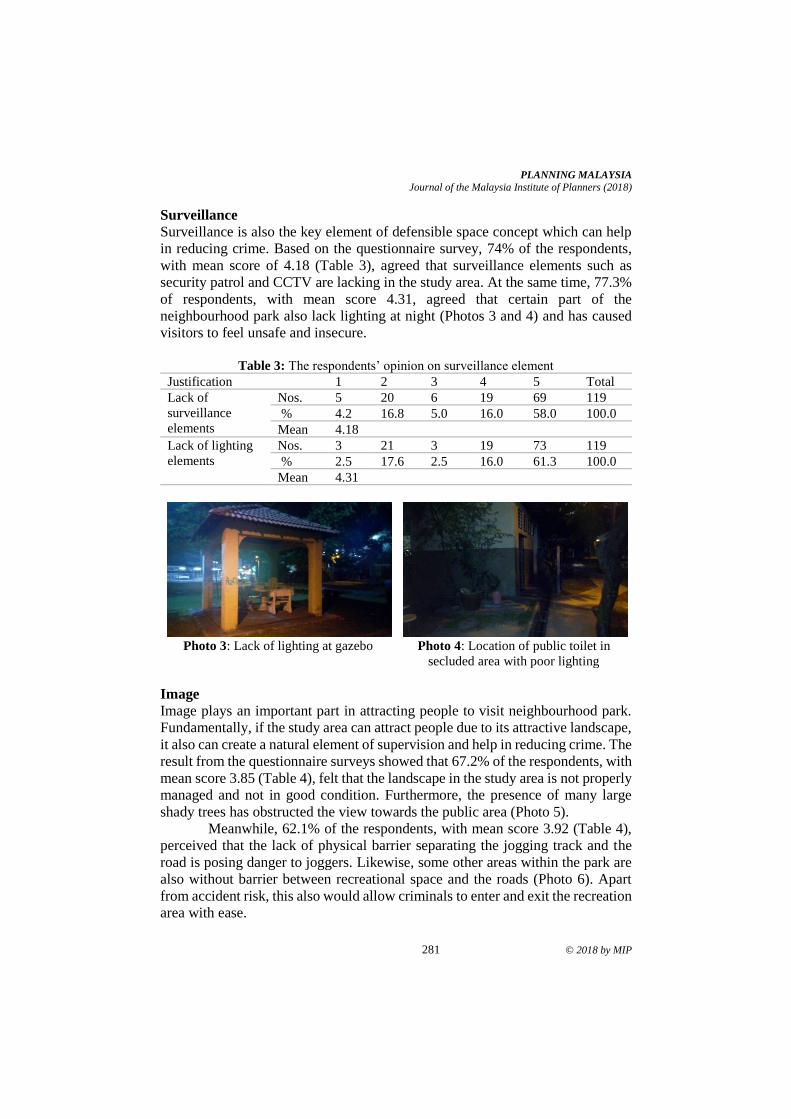
PLANNING MALAYSIA
Journal of the Malaysia Institute of Planners (2018)
281 © 2018 by MIP
Surveillance Surveillance is also the key element of defensible space concept which can help
in reducing crime. Based on the questionnaire survey, 74% of the respondents,
with mean score of 4.18 (Table 3), agreed that surveillance elements such as
security patrol and CCTV are lacking in the study area. At the same time, 77.3%
of respondents, with mean score 4.31, agreed that certain part of the
neighbourhood park also lack lighting at night (Photos 3 and 4) and has caused
visitors to feel unsafe and insecure.
Table 3: The respondents’ opinion on surveillance element
Justification 1 2 3 4 5 Total
Lack of
surveillance
elements
Nos. 5 20 6 19 69 119
% 4.2 16.8 5.0 16.0 58.0 100.0
Mean 4.18
Lack of lighting
elements
Nos. 3 21 3 19 73 119
% 2.5 17.6 2.5 16.0 61.3 100.0
Mean 4.31
Photo 3: Lack of lighting at gazebo Photo 4: Location of public toilet in
secluded area with poor lighting
Image Image plays an important part in attracting people to visit neighbourhood park.
Fundamentally, if the study area can attract people due to its attractive landscape,
it also can create a natural element of supervision and help in reducing crime. The
result from the questionnaire surveys showed that 67.2% of the respondents, with
mean score 3.85 (Table 4), felt that the landscape in the study area is not properly
managed and not in good condition. Furthermore, the presence of many large
shady trees has obstructed the view towards the public area (Photo 5).
Meanwhile, 62.1% of the respondents, with mean score 3.92 (Table 4),
perceived that the lack of physical barrier separating the jogging track and the
road is posing danger to joggers. Likewise, some other areas within the park are
also without barrier between recreational space and the roads (Photo 6). Apart
from accident risk, this also would allow criminals to enter and exit the recreation
area with ease.
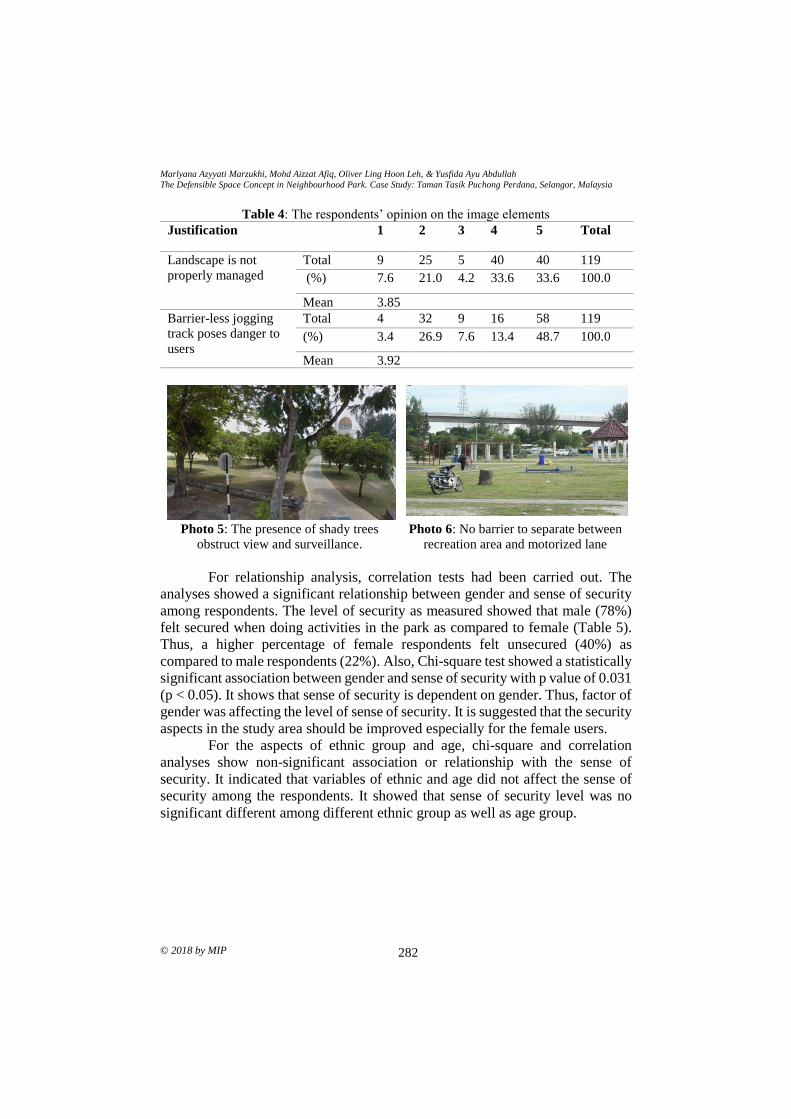
Marlyana Azyyati Marzukhi, Mohd Aizzat Afiq, Oliver Ling Hoon Leh, & Yusfida Ayu Abdullah
The Defensible Space Concept in Neighbourhood Park. Case Study: Taman Tasik Puchong Perdana, Selangor, Malaysia
© 2018 by MIP 282
Table 4: The respondents’ opinion on the image elements
Justification 1 2 3 4 5 Total
Landscape is not
properly managed
Total 9 25 5 40 40 119
(%) 7.6 21.0 4.2 33.6 33.6 100.0
Mean 3.85
Barrier-less jogging
track poses danger to
users
Total 4 32 9 16 58 119
(%) 3.4 26.9 7.6 13.4 48.7 100.0
Mean 3.92
Photo 5: The presence of shady trees
obstruct view and surveillance. Photo 6: No barrier to separate between
recreation area and motorized lane
For relationship analysis, correlation tests had been carried out. The
analyses showed a significant relationship between gender and sense of security
among respondents. The level of security as measured showed that male (78%)
felt secured when doing activities in the park as compared to female (Table 5).
Thus, a higher percentage of female respondents felt unsecured (40%) as
compared to male respondents (22%). Also, Chi-square test showed a statistically
significant association between gender and sense of security with p value of 0.031
(p < 0.05). It shows that sense of security is dependent on gender. Thus, factor of
gender was affecting the level of sense of security. It is suggested that the security
aspects in the study area should be improved especially for the female users.
For the aspects of ethnic group and age, chi-square and correlation
analyses show non-significant association or relationship with the sense of
security. It indicated that variables of ethnic and age did not affect the sense of
security among the respondents. It showed that sense of security level was no
significant different among different ethnic group as well as age group.
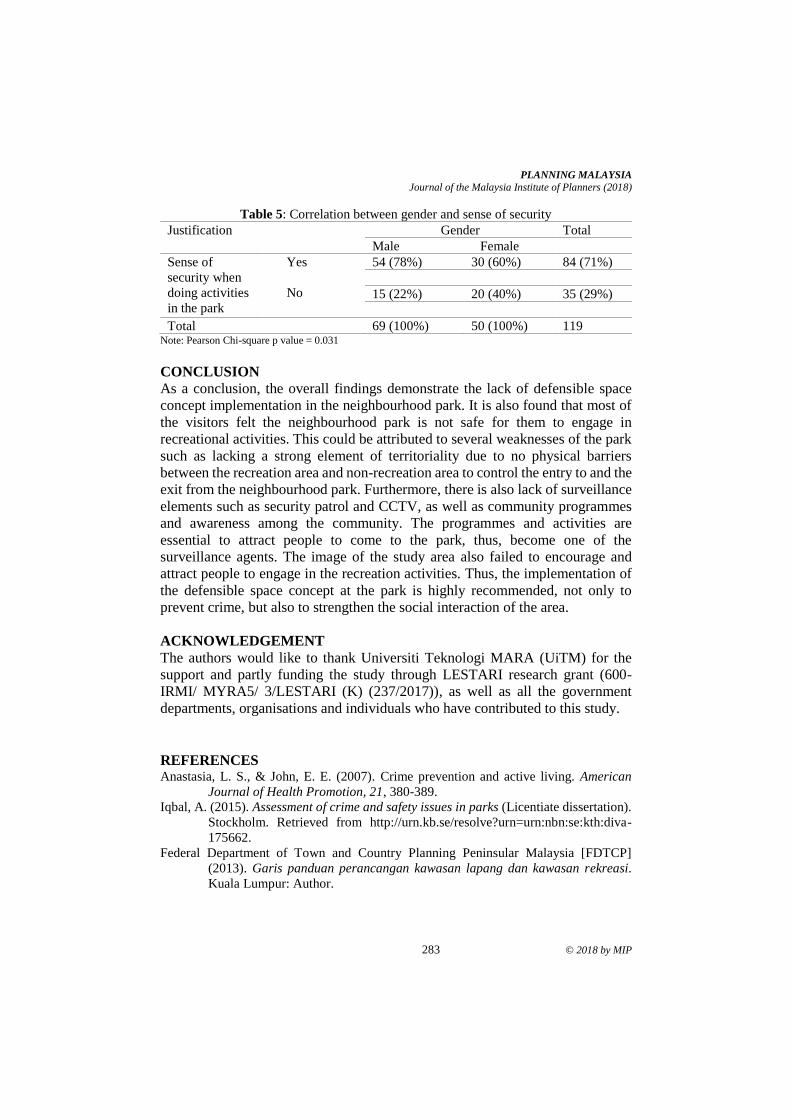
PLANNING MALAYSIA
Journal of the Malaysia Institute of Planners (2018)
283 © 2018 by MIP
Table 5: Correlation between gender and sense of security
Justification Gender Total
Male Female
Sense of
security when
doing activities
in the park
Yes
No
54 (78%) 30 (60%) 84 (71%)
15 (22%) 20 (40%) 35 (29%)
Total 69 (100%) 50 (100%) 119 Note: Pearson Chi-square p value = 0.031
CONCLUSION
As a conclusion, the overall findings demonstrate the lack of defensible space
concept implementation in the neighbourhood park. It is also found that most of
the visitors felt the neighbourhood park is not safe for them to engage in
recreational activities. This could be attributed to several weaknesses of the park
such as lacking a strong element of territoriality due to no physical barriers
between the recreation area and non-recreation area to control the entry to and the
exit from the neighbourhood park. Furthermore, there is also lack of surveillance
elements such as security patrol and CCTV, as well as community programmes
and awareness among the community. The programmes and activities are
essential to attract people to come to the park, thus, become one of the
surveillance agents. The image of the study area also failed to encourage and
attract people to engage in the recreation activities. Thus, the implementation of
the defensible space concept at the park is highly recommended, not only to
prevent crime, but also to strengthen the social interaction of the area.
ACKNOWLEDGEMENT
The authors would like to thank Universiti Teknologi MARA (UiTM) for the
support and partly funding the study through LESTARI research grant (600-
IRMI/ MYRA5/ 3/LESTARI (K) (237/2017)), as well as all the government
departments, organisations and individuals who have contributed to this study.
REFERENCES Anastasia, L. S., & John, E. E. (2007). Crime prevention and active living. American
Journal of Health Promotion, 21, 380-389.
Iqbal, A. (2015). Assessment of crime and safety issues in parks (Licentiate dissertation).
Stockholm. Retrieved from http://urn.kb.se/resolve?urn=urn:nbn:se:kth:diva-
175662.
Federal Department of Town and Country Planning Peninsular Malaysia [FDTCP]
(2013). Garis panduan perancangan kawasan lapang dan kawasan rekreasi.
Kuala Lumpur: Author.
Marlyana Azyyati Marzukhi, Mohd Aizzat Afiq, Oliver Ling Hoon Leh, & Yusfida Ayu Abdullah
The Defensible Space Concept in Neighbourhood Park. Case Study: Taman Tasik Puchong Perdana, Selangor, Malaysia
© 2018 by MIP 284
Liebermann, S., & Kruger, T. (2004). Crime prevention through environmental design
(CPTED). 9th International Conference on Crime Prevention Environmental
Design. Brisbane, Australia.
Mair, J. S., & Mair, M. (2003). Violence prevention and control through environmental
modifications. Annual Review of Public Health, 24, 209-255.
Melde, C., & Esbensen, F.A. (2009). The victim-offender overlap and fear of in-school
victimization: A longitudinal examination of risk assessment models. Crime &
Delinquency, 55, 499-525.
Mohit, M. A. & Hannan, M. H. E. (2012). A study of crime potentials in Taman Melati
terrace housing in Kuala Lumpur: Issues and challenges. Social and Behavioral
Sciences, 42, 271-283.
Newman, O. (1972). Defensible space – Crime prevention through urban design. New
York: Collier Books.
Sakip, S. R. M., Johari, N., & Salleh, M. N. M. (2012). The relationship between crime
prevention through environmental design and fear of crime. Procedia-Social and
Behavioral Sciences, 68, 628-636.
Zainudin, A. Z., & Abdul Malek, J. (2010). Keberkesanan program bandar selamat dari
persepsi penduduk. Kajian kes: Bandaraya Shah Alam. Jurnal Teknologi, 53,
13-34.
1PhD Candidate at Universiti Sains Malaysia. Email: [email protected] 285
PLANNING MALAYSIA:
Journal of the Malaysian Institute of Planners
VOLUME 16 ISSUE 3 (2018) Page 285 – 296
NCIA-AMB MASUK KAMPUNG PROJECT: A PARADIGM OF
OPPORTUNITIES AND CHALLENGES FOR SUSTAINABLE RURAL
DEVELOPMENT
Sana Malik1, Faiqa Khilat2, Fariha Tariq3, & Kamal Arifin4
1 School of Housing, Building & Planning
UNIVERSITI SAINS MALAYSIA
2,3 School of Architecture & Planning,
UNIVERSITY OF MANAGEMENT & TECHNOLOGY, PAKISTAN
4 Pr1ma Homes
PERBADANAN PR1MA MALAYSIA, MALAYSIA
Abstract
Malaysian government is focused to accomplish world-class living standard of
whole nation by year 2025 through sustainable development irrespective of
regional, religious and ethnic boundaries. The Northern Corridor Implementation
Authority (NCIA) is an organization set up for the implementation of Koridor
Utara (Northern Corridor Economic Region, NCER) in Malaysia for achieving
this vision. Such economic corridors are aimed to elevate the income levels
through agriculture, manufacturing, logistics, education and tourism. The
execution of development projects always impact the involved community in
multiple dimensions. Masuk Kampung Project at Pantai Murni, Yan Kedah was
one of the NCIA initiatives in collaboration with AMB (Akademi Binaan
Malaysia). This paper draws out a conceptual framework of community
perceptions associated with this project based on qualitative research. Viewpoints
studied through interviews and participant observation helped in fabricating the
opportunities and challenges connected with rural development. Findings
revealed that community perception is of key importance and their prime
reflections can be beneficial to policy makers, stakeholders, academicians and
civil society in shaping the policy agenda for future projects of same nature in
Malaysia. Hence, the study is a contribution to understanding development
projects aiming at rural areas on national and global channels.
Keywords: sustainability, rural development, economic conditions, sustainable
tourism, community perceptions
Sana Malik, Faiqa Khilat, Fariha Tariq, & Kamal Arifin
NCIA-AMB Masuk Kampung Project: A Paradigm of Opportunities and Challenges for Sustainable Rural Development
© 2018 by MIP 286
INTRODUCTION
Malaysia is a multi-ethnic and multi-religious country with a population of 28.5
million. It is characterized by three main ethnic groups: Malay and indigenous
people, Chinese, and Indians. Ever since the independence from the long British
rule in 1957, Malaysia has successfully transformed itself from a poor country
into a middle-income nation by stressing on the economic development of rural
areas in its five-year plans (Hatta & Ali, 2013). Many schemes were introduced
to encourage development of agriculture sector, rural industrialization,
resettlement schemes, infrastructure, and community development. This has been
observed to be a continuous process, aimed to achieve certain, carefully crafted
goals and solve root-level problems faced by rural community. Due to the
exceptional nature of rural development plans, with prominent state
interventions, rural development in Malaysia is now considered to be identical
with state’s development strategies. Such plans are aimed to solve problems such
as the sharp contrast between the lifestyles in the urban and rural areas, deficiency
of financial growth, inadequate rural that prevailed prior to independence and
little productivity. In this regard, Northern Corridor Implementation Authority
(NCIA) is an authorized organization for the execution of one such project named
as Northern Corridor Economic Region (NCER) in Malaysia. However, recent
study discovered that accomplishments from the project have not visualized the
expectation; hence leading to poor execution of NCIA which was meant to
operate in flexible manner to achieve the overarching goal of shared growth while
ensuring compliance from all stakeholders (Athukorala & Narayanan, 2018).
This sets the direction to study the concerns of one of the stakeholders involved
i.e. the community, for successful implementation and execution of such projects.
Zal (2018) established that it is important to determine the right group of people
from which to gain information about a community's potential, and also the need,
as a first step, to involve both groups of people in the development process. The
current study revolves around one of NCIA rural project in collaboration with
AMB (Akademi Binaan Malaysia) in Pantai Murni, Yan, Kedah within the
framework of such project. Discussions focused on the opportunities and
challenges associated with sustainable rural development from the viewpoint of
kampung (village) community. The study holds significance by observing the
kampung perceptions in relation to the actual facts of rural economic progress in
Malaysia.
THEORETICAL FRAMEWORK
In order to meet vital energy needs economically, efficiently and sustainably of
present world, a balanced energy portfolio is required. The portfolio should be
well-suited for the socio-economic conditions of the country as well as for its own
region on individual basis. Roughly 1.6 billion people worldwide do not have
access to electricity in their homes, representing slightly more than one quarter
PLANNING MALAYSIA
Journal of the Malaysia Institute of Planners (2018)
287 © 2018 by MIP
of the world’s population (Flavin & Aeck, 2005). In many areas, people still live
without refrigeration, television/radios, and even light. The investment of energy
resources in rural areas is a core step in achieving economic sustainable
development.
Sustainable development is generally discussed in terms of
environmental considerations, but from a rural community perspective,
sustainable development must address how people of the community generate the
income to maintain their rural lifestyle (Freshwater, 2000). Sustainability ensures
that generated benefits and supported organizations meant to continue even after
the completion of project. Sustainability is defined as guarantee that the
institutions supported through projects and the benefits realized are maintained
and continue after the end of the project (Tango International, 2009).
There are many scholarly approaches to rural development. According to
(Maxwell, Urey, & Ashley, 2001), “In peri-urban zones, the main opportunities
are likely to include intensive agricultural activities for the city, short-distance
commuting, weekend leisure, and town-oriented industrialization; further away
from towns, arable farming, some tourism, and resource-based industrialization
are options; in remote areas, subsistence farming, long-distance migration and
‘niche’ tourism are likely to be the main options”. This viewpoint describes
distance of rural areas from cities as major factor for measuring the potential of
rural development projects. Another stance relates to the evolving of rural
development over the years as symbiotic feature. Ellis (2000) illustrated this
evolution from basic community development to integrated rural development,
which has got further attention as sustainable livelihoods providing solution to
poverty eradication for more than two decades.
Malaysia has well incorporated such sustainable approaches of rural
development in its national plans. According to Grand Transformation Plan
(GTP), the accessibility of basic infrastructure is stated as a primary right of every
resident of Malaysia irrespective of their location. State and local governments
are promised to provide four major components of national infrastructure namely
roads, electricity, water and housing to cater some percentage out of 35%
Malaysian rural community (Prime Minister's Department, 2010). Several studies
have been conducted on the rural developments and its multidisciplinary scopes
opened venues for different philosophical discussions. In this regard, study on the
ideological context of rural development in Sabah, Malaysia revealed that such
development works provide the entry point for federal government into village
politics; if development does not necessarily raise the local standard of living, it
facilitates the expansion and entrenchment of the ruling elite – the United
Malaysia National Organization (UMNO) (Doolittle, 2014). Recently, another
study in three rural villages of Perak State was conducted to discover the
viewpoints of rural community about the renewable energy technologies aiming
to advance sustainable lifestyles in rural setting. Findings suggested that even due
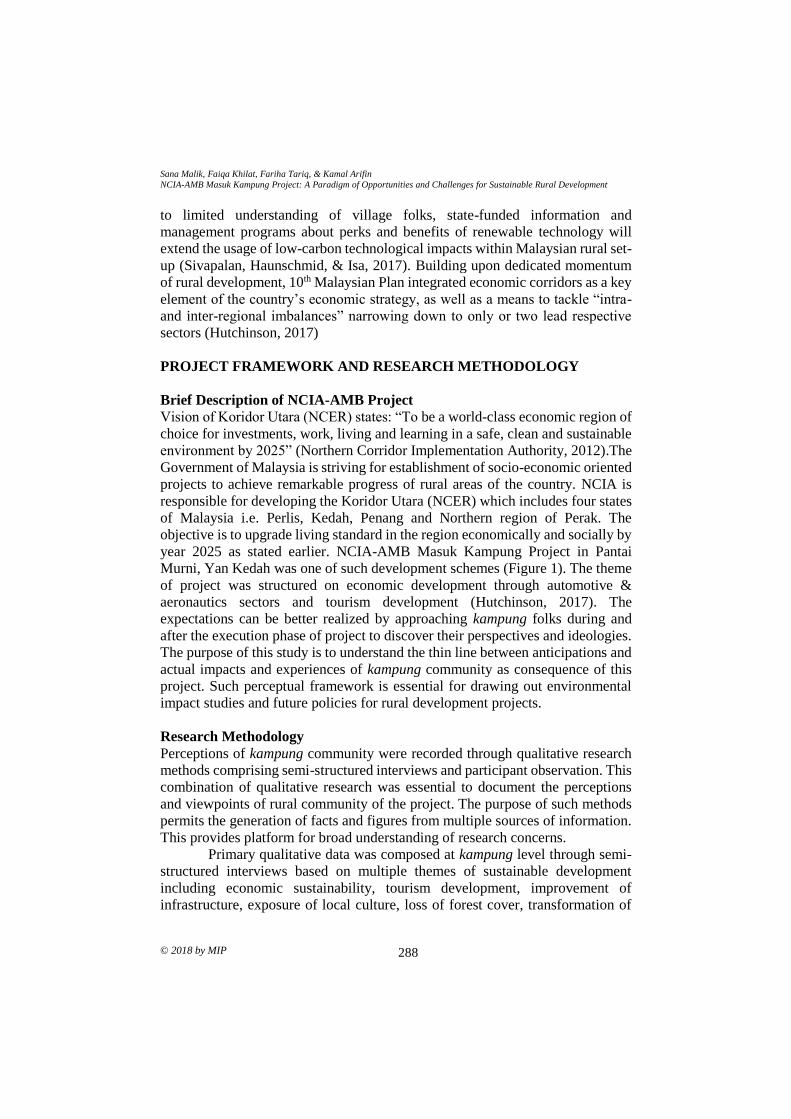
Sana Malik, Faiqa Khilat, Fariha Tariq, & Kamal Arifin
NCIA-AMB Masuk Kampung Project: A Paradigm of Opportunities and Challenges for Sustainable Rural Development
© 2018 by MIP 288
to limited understanding of village folks, state-funded information and
management programs about perks and benefits of renewable technology will
extend the usage of low-carbon technological impacts within Malaysian rural set-
up (Sivapalan, Haunschmid, & Isa, 2017). Building upon dedicated momentum
of rural development, 10th Malaysian Plan integrated economic corridors as a key
element of the country’s economic strategy, as well as a means to tackle “intra-
and inter-regional imbalances” narrowing down to only or two lead respective
sectors (Hutchinson, 2017)
PROJECT FRAMEWORK AND RESEARCH METHODOLOGY
Brief Description of NCIA-AMB Project
Vision of Koridor Utara (NCER) states: “To be a world-class economic region of
choice for investments, work, living and learning in a safe, clean and sustainable
environment by 2025” (Northern Corridor Implementation Authority, 2012).The
Government of Malaysia is striving for establishment of socio-economic oriented
projects to achieve remarkable progress of rural areas of the country. NCIA is
responsible for developing the Koridor Utara (NCER) which includes four states
of Malaysia i.e. Perlis, Kedah, Penang and Northern region of Perak. The
objective is to upgrade living standard in the region economically and socially by
year 2025 as stated earlier. NCIA-AMB Masuk Kampung Project in Pantai
Murni, Yan Kedah was one of such development schemes (Figure 1). The theme
of project was structured on economic development through automotive &
aeronautics sectors and tourism development (Hutchinson, 2017). The
expectations can be better realized by approaching kampung folks during and
after the execution phase of project to discover their perspectives and ideologies.
The purpose of this study is to understand the thin line between anticipations and
actual impacts and experiences of kampung community as consequence of this
project. Such perceptual framework is essential for drawing out environmental
impact studies and future policies for rural development projects.
Research Methodology
Perceptions of kampung community were recorded through qualitative research
methods comprising semi-structured interviews and participant observation. This
combination of qualitative research was essential to document the perceptions
and viewpoints of rural community of the project. The purpose of such methods
permits the generation of facts and figures from multiple sources of information.
This provides platform for broad understanding of research concerns.
Primary qualitative data was composed at kampung level through semi-
structured interviews based on multiple themes of sustainable development
including economic sustainability, tourism development, improvement of
infrastructure, exposure of local culture, loss of forest cover, transformation of
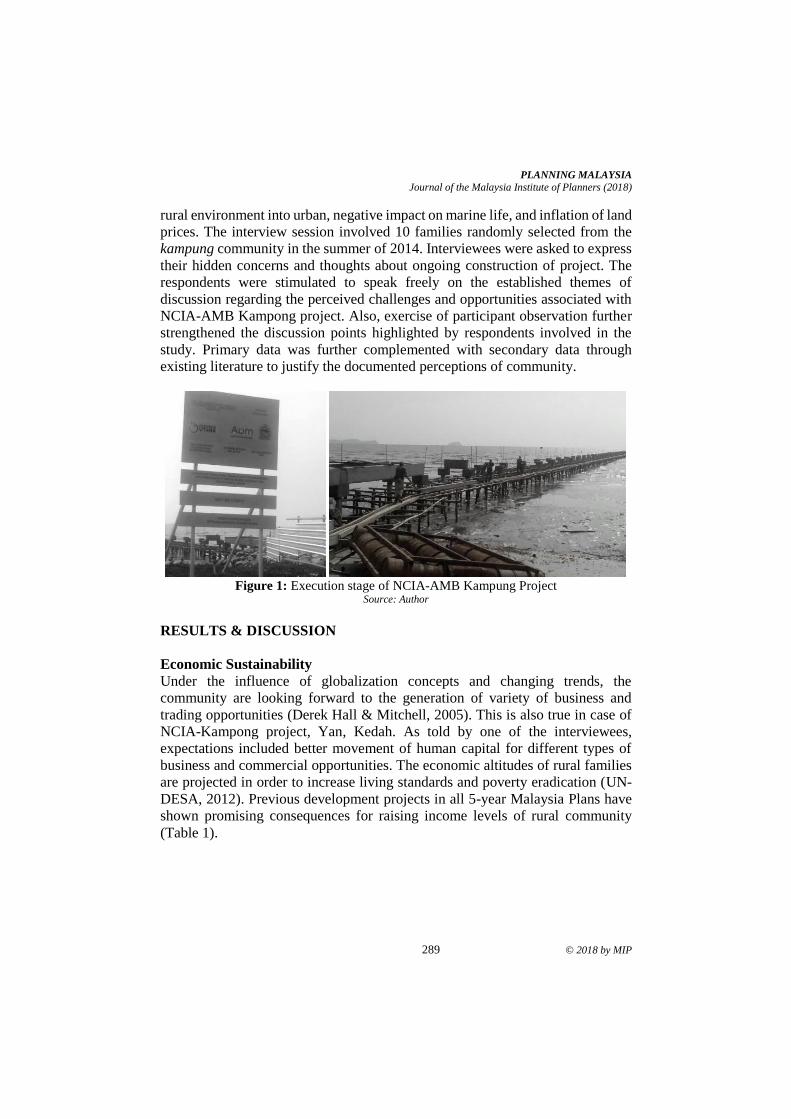
PLANNING MALAYSIA
Journal of the Malaysia Institute of Planners (2018)
289 © 2018 by MIP
rural environment into urban, negative impact on marine life, and inflation of land
prices. The interview session involved 10 families randomly selected from the
kampung community in the summer of 2014. Interviewees were asked to express
their hidden concerns and thoughts about ongoing construction of project. The
respondents were stimulated to speak freely on the established themes of
discussion regarding the perceived challenges and opportunities associated with
NCIA-AMB Kampong project. Also, exercise of participant observation further
strengthened the discussion points highlighted by respondents involved in the
study. Primary data was further complemented with secondary data through
existing literature to justify the documented perceptions of community.
Figure 1: Execution stage of NCIA-AMB Kampung Project
Source: Author
RESULTS & DISCUSSION
Economic Sustainability
Under the influence of globalization concepts and changing trends, the
community are looking forward to the generation of variety of business and
trading opportunities (Derek Hall & Mitchell, 2005). This is also true in case of
NCIA-Kampong project, Yan, Kedah. As told by one of the interviewees,
expectations included better movement of human capital for different types of
business and commercial opportunities. The economic altitudes of rural families
are projected in order to increase living standards and poverty eradication (UN-
DESA, 2012). Previous development projects in all 5-year Malaysia Plans have
shown promising consequences for raising income levels of rural community
(Table 1).
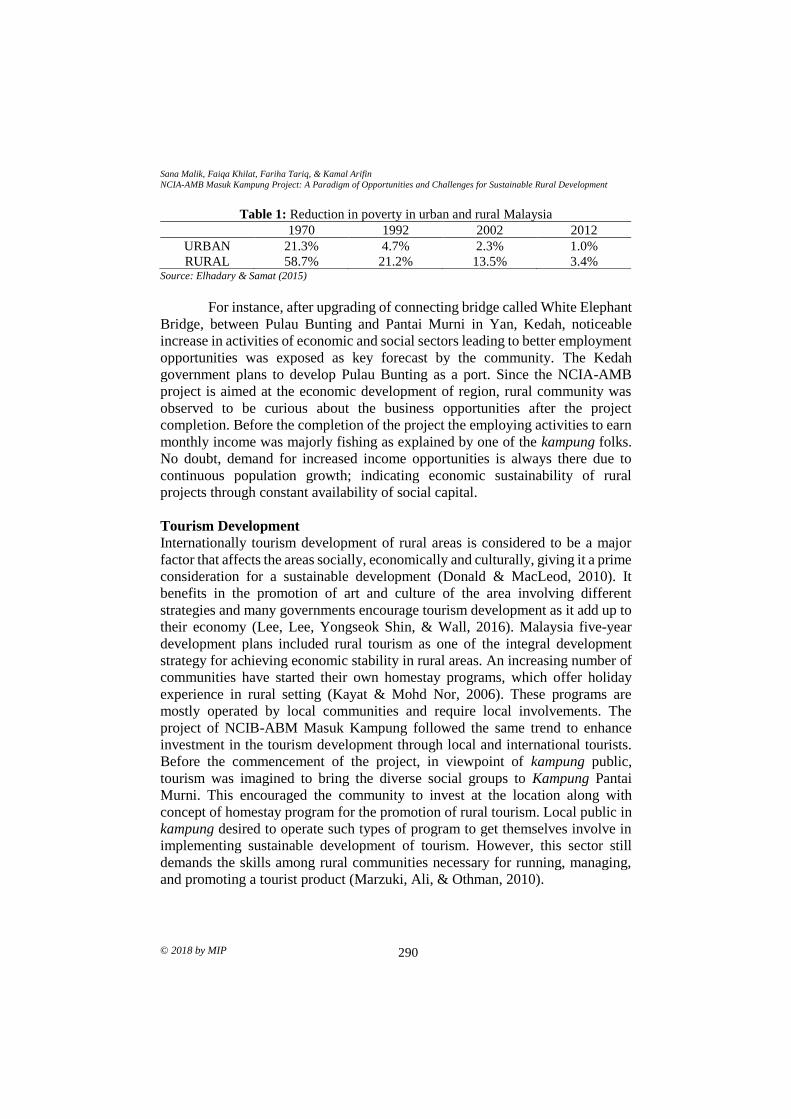
Sana Malik, Faiqa Khilat, Fariha Tariq, & Kamal Arifin
NCIA-AMB Masuk Kampung Project: A Paradigm of Opportunities and Challenges for Sustainable Rural Development
© 2018 by MIP 290
Table 1: Reduction in poverty in urban and rural Malaysia
1970 1992 2002 2012
URBAN 21.3% 4.7% 2.3% 1.0%
RURAL 58.7% 21.2% 13.5% 3.4% Source: Elhadary & Samat (2015)
For instance, after upgrading of connecting bridge called White Elephant
Bridge, between Pulau Bunting and Pantai Murni in Yan, Kedah, noticeable
increase in activities of economic and social sectors leading to better employment
opportunities was exposed as key forecast by the community. The Kedah
government plans to develop Pulau Bunting as a port. Since the NCIA-AMB
project is aimed at the economic development of region, rural community was
observed to be curious about the business opportunities after the project
completion. Before the completion of the project the employing activities to earn
monthly income was majorly fishing as explained by one of the kampung folks.
No doubt, demand for increased income opportunities is always there due to
continuous population growth; indicating economic sustainability of rural
projects through constant availability of social capital.
Tourism Development
Internationally tourism development of rural areas is considered to be a major
factor that affects the areas socially, economically and culturally, giving it a prime
consideration for a sustainable development (Donald & MacLeod, 2010). It
benefits in the promotion of art and culture of the area involving different
strategies and many governments encourage tourism development as it add up to
their economy (Lee, Lee, Yongseok Shin, & Wall, 2016). Malaysia five-year
development plans included rural tourism as one of the integral development
strategy for achieving economic stability in rural areas. An increasing number of
communities have started their own homestay programs, which offer holiday
experience in rural setting (Kayat & Mohd Nor, 2006). These programs are
mostly operated by local communities and require local involvements. The
project of NCIB-ABM Masuk Kampung followed the same trend to enhance
investment in the tourism development through local and international tourists.
Before the commencement of the project, in viewpoint of kampung public,
tourism was imagined to bring the diverse social groups to Kampung Pantai
Murni. This encouraged the community to invest at the location along with
concept of homestay program for the promotion of rural tourism. Local public in
kampung desired to operate such types of program to get themselves involve in
implementing sustainable development of tourism. However, this sector still
demands the skills among rural communities necessary for running, managing,
and promoting a tourist product (Marzuki, Ali, & Othman, 2010).
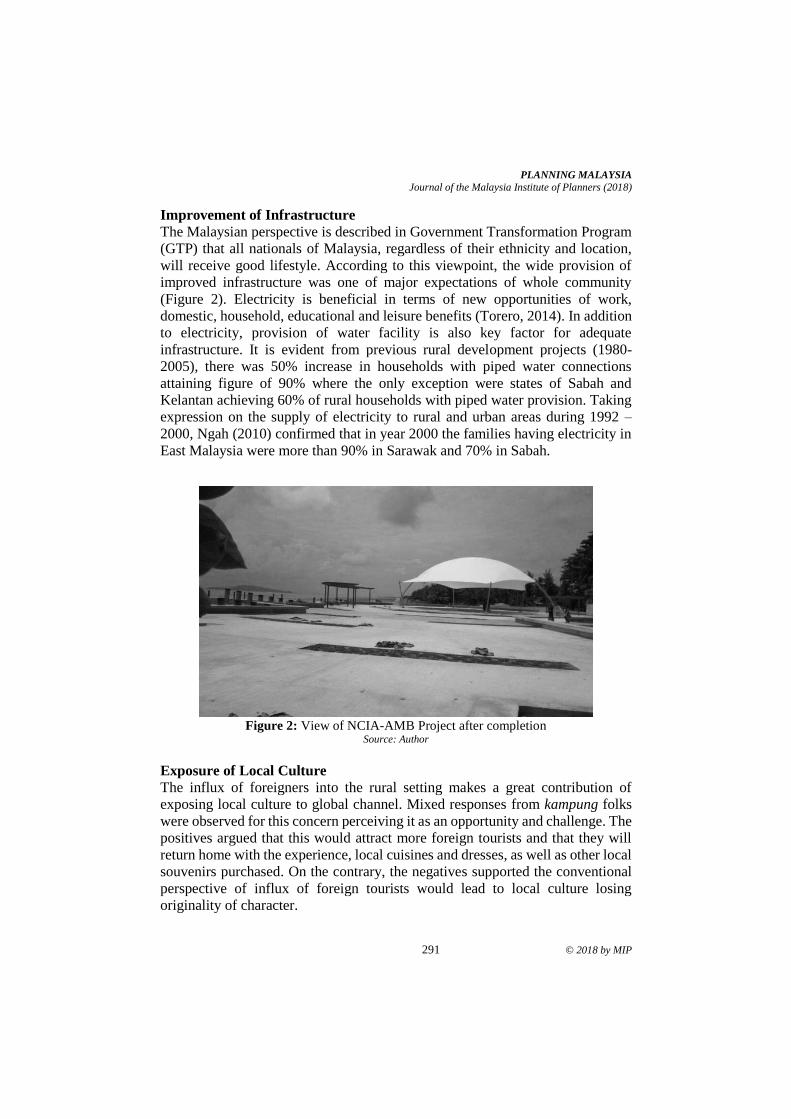
PLANNING MALAYSIA
Journal of the Malaysia Institute of Planners (2018)
291 © 2018 by MIP
Improvement of Infrastructure
The Malaysian perspective is described in Government Transformation Program
(GTP) that all nationals of Malaysia, regardless of their ethnicity and location,
will receive good lifestyle. According to this viewpoint, the wide provision of
improved infrastructure was one of major expectations of whole community
(Figure 2). Electricity is beneficial in terms of new opportunities of work,
domestic, household, educational and leisure benefits (Torero, 2014). In addition
to electricity, provision of water facility is also key factor for adequate
infrastructure. It is evident from previous rural development projects (1980-
2005), there was 50% increase in households with piped water connections
attaining figure of 90% where the only exception were states of Sabah and
Kelantan achieving 60% of rural households with piped water provision. Taking
expression on the supply of electricity to rural and urban areas during 1992 –
2000, Ngah (2010) confirmed that in year 2000 the families having electricity in
East Malaysia were more than 90% in Sarawak and 70% in Sabah.
Figure 2: View of NCIA-AMB Project after completion
Source: Author
Exposure of Local Culture
The influx of foreigners into the rural setting makes a great contribution of
exposing local culture to global channel. Mixed responses from kampung folks
were observed for this concern perceiving it as an opportunity and challenge. The
positives argued that this would attract more foreign tourists and that they will
return home with the experience, local cuisines and dresses, as well as other local
souvenirs purchased. On the contrary, the negatives supported the conventional
perspective of influx of foreign tourists would lead to local culture losing
originality of character.
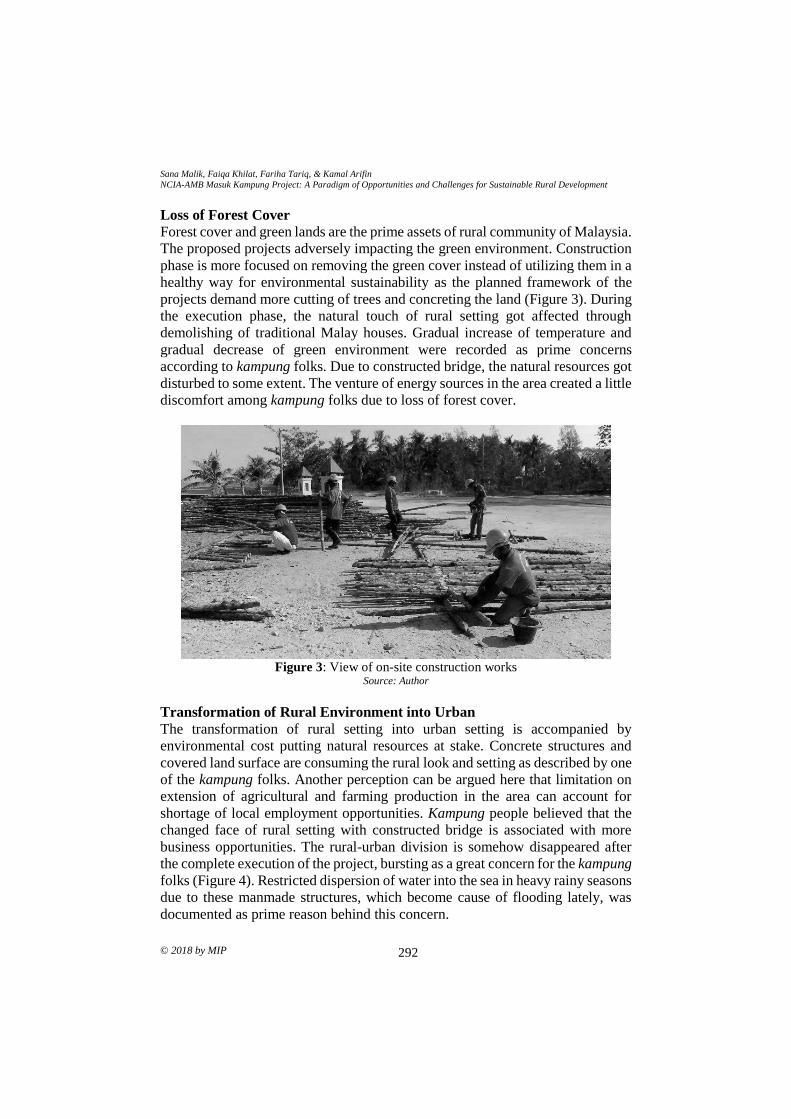
Sana Malik, Faiqa Khilat, Fariha Tariq, & Kamal Arifin
NCIA-AMB Masuk Kampung Project: A Paradigm of Opportunities and Challenges for Sustainable Rural Development
© 2018 by MIP 292
Loss of Forest Cover
Forest cover and green lands are the prime assets of rural community of Malaysia.
The proposed projects adversely impacting the green environment. Construction
phase is more focused on removing the green cover instead of utilizing them in a
healthy way for environmental sustainability as the planned framework of the
projects demand more cutting of trees and concreting the land (Figure 3). During
the execution phase, the natural touch of rural setting got affected through
demolishing of traditional Malay houses. Gradual increase of temperature and
gradual decrease of green environment were recorded as prime concerns
according to kampung folks. Due to constructed bridge, the natural resources got
disturbed to some extent. The venture of energy sources in the area created a little
discomfort among kampung folks due to loss of forest cover.
Figure 3: View of on-site construction works
Source: Author
Transformation of Rural Environment into Urban
The transformation of rural setting into urban setting is accompanied by
environmental cost putting natural resources at stake. Concrete structures and
covered land surface are consuming the rural look and setting as described by one
of the kampung folks. Another perception can be argued here that limitation on
extension of agricultural and farming production in the area can account for
shortage of local employment opportunities. Kampung people believed that the
changed face of rural setting with constructed bridge is associated with more
business opportunities. The rural-urban division is somehow disappeared after
the complete execution of the project, bursting as a great concern for the kampung
folks (Figure 4). Restricted dispersion of water into the sea in heavy rainy seasons
due to these manmade structures, which become cause of flooding lately, was
documented as prime reason behind this concern.
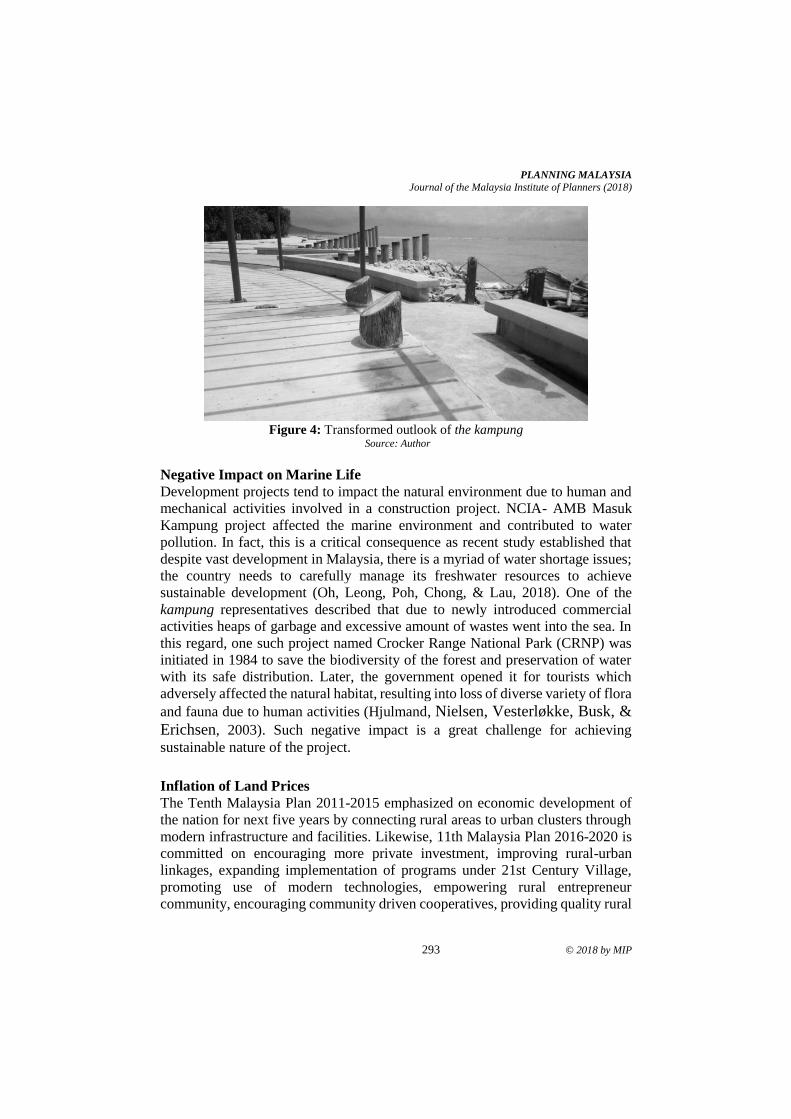
PLANNING MALAYSIA
Journal of the Malaysia Institute of Planners (2018)
293 © 2018 by MIP
Figure 4: Transformed outlook of the kampung
Source: Author
Negative Impact on Marine Life
Development projects tend to impact the natural environment due to human and
mechanical activities involved in a construction project. NCIA- AMB Masuk
Kampung project affected the marine environment and contributed to water
pollution. In fact, this is a critical consequence as recent study established that
despite vast development in Malaysia, there is a myriad of water shortage issues;
the country needs to carefully manage its freshwater resources to achieve
sustainable development (Oh, Leong, Poh, Chong, & Lau, 2018). One of the
kampung representatives described that due to newly introduced commercial
activities heaps of garbage and excessive amount of wastes went into the sea. In
this regard, one such project named Crocker Range National Park (CRNP) was
initiated in 1984 to save the biodiversity of the forest and preservation of water
with its safe distribution. Later, the government opened it for tourists which
adversely affected the natural habitat, resulting into loss of diverse variety of flora
and fauna due to human activities (Hjulmand, Nielsen, Vesterløkke, Busk, &
Erichsen, 2003). Such negative impact is a great challenge for achieving
sustainable nature of the project.
Inflation of Land Prices
The Tenth Malaysia Plan 2011-2015 emphasized on economic development of
the nation for next five years by connecting rural areas to urban clusters through
modern infrastructure and facilities. Likewise, 11th Malaysia Plan 2016-2020 is
committed on encouraging more private investment, improving rural-urban
linkages, expanding implementation of programs under 21st Century Village,
promoting use of modern technologies, empowering rural entrepreneur
community, encouraging community driven cooperatives, providing quality rural
Sana Malik, Faiqa Khilat, Fariha Tariq, & Kamal Arifin
NCIA-AMB Masuk Kampung Project: A Paradigm of Opportunities and Challenges for Sustainable Rural Development
© 2018 by MIP 294
basic infrastructure and basic services (EPU, 2015). The NCIA-AMB Masuk
Kampung Project has similar vision for upgrading the living standard of kampung
community by providing amenities, communication and links to the neighbouring
urban centres. The fresh investment for tourism purposes in the region has
increased the land prices, creating an alarming situation for community in
maintaining their homes in the near future. The conversion of adjacent land areas
into commercial use within the premises of new development pushed back the
existing settlements. This emerged as one of the great concerns for kampung
folks. Commercial development encourages inflated rates of land due to
provision of modern and up-to-date infrastructure leading to commercialism. This
aspect considered as both opportunity for investors and challenge for kampung
community at the same time.
CONCLUSION
The study established that there is need to improve the management and
execution phase of development projects for rural areas in Malaysia. Similarly,
the aims and activities of such projects should be designed to facilitate the life of
rural community and to deal better with their social and environmental issues.
This study was dedicated to explore the viewpoints of rural people affected by
the NCIA-AMB Masuk Kampung Project (Table 2). Discussions show that
improved economic activities, tourism development and upgraded infrastructure
were considered as opportunities in viewpoint of rural community. While loss of
forest cover, transformation of rural environment into urban and negative impact
on marine life were recorded as challenges. Exposure of local culture and
inflation of land prices were perceived as both opportunity and challenge by
kampung people.
Table 2: Opportunities and challenges involved in NCIA-AMB Project
Kampung Concerns for
NCIA-AMB project
Opportunity Challenge
Economic sustainability √
Tourism development √
Improvement of
infrastructure √
Exposure of local culture √ √
Loss of forest cover √
Transformation of rural
environment into urban
√
Negative impact on marine
life
√
Inflation of land prices √ √
PLANNING MALAYSIA
Journal of the Malaysia Institute of Planners (2018)
295 © 2018 by MIP
This study concludes that these opportunities and challenges should be
acknowledged in order to achieve sustainable nature of the rural development
project. No doubt, improvement of rural-urban divide will elevate the living
standard of rural community, but there is also need to satisfy what people think
and feel. State and local governments must admit the vital importance of public
participation and perception. This calls for resolving the institutional barriers
which prohibit the practice of public engagement in project development process.
Since Malaysia is focused in achieving its rural development goals for Vision
2025, incorporating rural community perceptions will help in establishing
sustainable nature of rural development projects despite the mandatory
mechanical processes and excessive commercialism.
ACKNOWLEDGMENT
We acknowledge the cooperation of kampung community for expressing sincere
views in conducting this research.
REFERENCES Athukorala, P., & Narayanan, S. (2018). Economic corridors and regional development:
The Malaysian experience. World Development, 106, 1-14.
Derek Hall, I. K., & Mitchell, M. (2005). Rural tourism and sustainable business. Bristol,
UK: Channel View Publications Ltd.
Donald, V. L., & MacLeod, S. A. (2010). Sustainable tourism in rural Europe:
Approaches to development. London: Taylor & Francis.
Doolittle, A. A. (2014). Are they making fun of us? The politics of development in Sabah,
Malaysia. France, Europe: Presses Universitaires de Provence.
Elhadary, Y., & Samat, N. (2015). Malaysia towards zero poverty by 2020. Proceedings
of the International Conference on Development and Socio Spatial Inequalities
2015. Penang: USM Press.
Ellis, F. (2000). Livelihoods and rural poverty reduction in developing countries. Oxford:
Oxford University Press.
Economic Planning Unit [EPU] (2015). Transforming rural areas to uplift wellbeing of
rural communities. Putrajaya: Author.
Flavin, C., & Aeck, M. H. (2005). Energy for development - The potential role of
renewable energy in meeting the millennium development goals. Washington
DC: Worldwatch Institute.
Freshwater, D. (2000). Three parers on rural development. Potsdam: TVA Rural Studies
Program.
Hatta, Z. A., & Ali, I. (2013). Poverty reduction policies in Malaysia: Trends, strategies
and challenges. Asian Culture and History, 5(2), 48-56.
Hjulmand, L. G., Nielsen, U., Vesterløkke, P., Busk, R. J., & Erichsen, E. (2003). Tourism
as a development strategy in rural areas adjacent to the Croker Range National
Park, Sabah, Malaysia. ASEAN Review of Biodiversity and Environmental
Conservation (ARBEC), 1-19.
Hutchinson, F. E. (2017). Evolving paradigms in Malaysia's regional development policy.
Journal of Southeast Asian Economies, 34(3), 462-487.
Sana Malik, Faiqa Khilat, Fariha Tariq, & Kamal Arifin
NCIA-AMB Masuk Kampung Project: A Paradigm of Opportunities and Challenges for Sustainable Rural Development
© 2018 by MIP 296
Kayat, K., & Mohd Nor, N. A. (2006). Community members involvement in community
development programme: Homestay programme in Kedah. Akademika, 67(1),
77-102.
Lee, A. H. J., Lee, D. B. H., Yongseok Shin, & Wall, G. (2016). Creativity and Traditional
Cultural Accommodations in Sustainable Community Development: The Case
of ‘Hanok-stay’ Program in South Korea. Journal of Rural and Community
Development, 11(1), 16-29.
Marzuki, A., Ali, K., & Othman, A. G. (2010). A review on rural tourism development in
Malaysia. International Journal of Hospitality & Tourism Systems, 3(1), 23-30.
Maxwell, S., Urey, I., & Ashley, C. (2001). Emerging issues in rural development.
London: Overseas Development Institute.
Ngah, I. (2010). Rural development in Malaysia. Kuala Lumpur: Universiti Teknologi
Malaysia.
Northern Corridor Implementation Authority. (2012). Koridor Utara Malaysia. Pulau
Pinang: Author.
Oh, K. S., Leong, J. C., Poh, P. E., Chong, M. N., & Lau, E. V. (2018). A review of
greywater recycling related issues: Challenges and future prospects in Malaysia.
Journal of Cleaner Production, 171, 17-29.
Prime Minister's Department Malaysia (2010). Government transformation programme.
Putrajaya: Performance Management and Delivery Unit (PEMANDU).
Sivapalan, S., Haunschmid, S., & Isa, M. H. (2017). Potential of renewable energy
technologies and its implications for the management of low carbon lifestyles in
Rural Malaysia. Global Business & Management Research,, 9, 622-631.
Tango International (2009). Sustainability of rural development projects-Best practices
and lessons learned by IFAD in Asia. Tucson-Arizona: International Fund for
Agricultural Development (IFAD) IFAD.
Torero, M. (2014, December). The impact of rural electrification. 11th Conference AFD
PROPARCO/EUDN: Energy for Development. December 3, 2014, Paris,
France.
UN-DESA (2012). Finance for the transition to a green economy in the context of
sustainable development and poverty eradication. RIO 2012 Issues Briefs, 16.
Zal, W. A. (2018). The practice of community potential mapping as a guideline for
community development in Malaysia. Community Development Journal, 53(2),
321-339.
2Professor at Universiti Teknologi MARA, Malaysia. Email: [email protected] 297
PLANNING MALAYSIA:
Journal of the Malaysian Institute of Planners
VOLUME 16 ISSUE 3 (2018) Page 297 – 307
MULTI-DIMENSIONAL HUMAN INTERACTION IN OPEN SPACES
Filzani Illia Ibrahim1, Dasimah Omar2 & Nik Hanita Nik Mohamad3
1School of Architecture, Building and Design
TAYLORS UNIVERSITY LAKESIDE CAMPUS, MALAYSIA
2,3Faculty of Architecture, Planning & Surveying UNIVERSITI TEKNOLOGI MARA, MALAYSIA
Abstract Due to rapid urban development, open spaces have changed drastically over the
decades and generations have been struggling with its consequences. There have
been various studies on how open spaces provide positive reaction to human.
Apparently, in relation to open spaces, Malaysia has received very little attention
from researchers. This paper investigates the human interaction experienced in
the open spaces and how it relates to city sustainability. The aim of this paper is
to provide valuable insight of the various dimensions of human interaction
experienced in open spaces. This study employed a quantitative research method
whereby questionnaire survey was administered to 861 respondents who visited
five selected open spaces of Shah Alam, Selangor, Malaysia. The findings in this
paper address human-human interaction and human-nature interaction in the
parks.
Keywords: open spaces, human-human interaction, human-nature interaction
Filzani Illia Ibrahim, Dasimah Omar & Nik Hanita Nik Mohamad
Multi-Dimensional Human Interaction in Open Spaces
© 2018 by MIP 298
INTRODUCTION Currently open spaces are emerging as one of the most important spaces in the
urban fabric. They are multi-purpose public spaces in the city that offer social,
economic, and environmental benefits. They help to enhance the image of the
city, and improve the quality of urban life. Hence, there are various theories that
relate to the multi-dimensional human interaction in the open spaces. Chiesura
(2004) claimed that the major function of open space is to satisfy people’s
recreational need. However it can be seen that open spaces provide more than just
recreational satisfaction. Arifin (2005) stated that open spaces with plant
represent natural contact with human due to their roles in producing oxygen, and
controlling the surrounding system and the soil water. Moreover, natural
landscape in open spaces can sometimes play a key role in promoting social
interaction (Oguz, 2000). Hence, open spaces might have different usage and
purposes towards different people in the urban areas.
As there are various studies on how open spaces provide positive reaction
to human and nature, hence the question is multi-dimensional human interaction
in different hierarchy of open spaces offer different positive impacts to the urban
dwellers? Multi-dimensional human interaction in the open spaces can be
categorised as human-human interaction and human-nature interaction. Under the
human-human interaction, there are three variables that can be measured which
are social interaction, citizen participation and sense of community. As for the
human-nature interaction, the variables to be measured are contact with nature,
aesthetic preference, and recreational or play. Thus, among these variables, which
are the variables that are suitable for each types of open spaces. According to Mutiara & Isami, (2012) people’s involvement and
interaction in open spaces can enhance the sense of belonging among people and at the same time increase the degree of neighbourhood attachment. However, different hierarchy of open spaces might offer different purposes and interactions among the users. The typology of open spaces are basically characterized by population number, size of the open space and also the facilities provided in the open space.
HUMAN INTERACTION IN OPEN SPACES Although open spaces play vital role in improving the environmental system
(Marzukhi, Karim, & Latfi, 2012; Ariffin, 2005), their main function is to satisfy
people’s recreational need. When an open space was designed, the overarching
consideration was based on real or perceived notions of recreational needs.
Increasing empirical evidence have indicated that the presence of natural
assets and it components in urban context provide significant contribution to the
quality of life in many ways. Besides vital environment services such as air and
water purification, and wind and noise filtering, open spaces provide social and
psychological services which are of crucial significance for the liveability of
PLANNING MALAYSIA
Journal of the Malaysia Institute of Planners (2018)
299 © 2018 by MIP
modern cities and the well-being of urban dwellers (Chiesura, 2004). They help
in reducing stress, rejuvenate city dwellers and provide a sense of tranquillity
(Kaplan, 1993). Conway (2000) verified beliefs about stress reduction benefits
and mental health through the experience on the use of open spaces.
Hence, Matsuoka and Kaplan (2008) provided a valuable insight into
how human interact with outdoor urban environments, which included open
spaces. They provided major themes, or purpose of using open spaces, that are
directly linked with open spaces which are; human-nature interaction and human-
human interaction. As for the nature needs, there are three variables that can be
measured which are, contact with nature, aesthetic preference, and recreation or
play. Whereby for human needs, the variable to be measured are social
interaction, citizen participation, and sense of community. There are much to be
learned about the relationship among the six human interactions examined by the
researchers. Hence, with the rapid urbanization in the city, it is important to study
the issues of scale in terms of human benefit. Moreover, Matsuoka and Kaplan
(2008) stated that the human needs that are categorized into six general themes
and that these needs often interact with each other. Hence, giving an urban setting,
especially open spaces might affect the fulfilment of other purposes.
RESEARCH METHODOLOGY This research takes the view of Sekaran and Bougie (2016) in selecting structured
questionnaire surveys to investigate and measure attitudes and perceptions. It is
considered the most appropriate method to obtain a large amount of data as it
permits analysis in statistical form within a relatively short of time. Hence, in this
study, questionnaire survey was carried out to gather the data, namely the user’s
profile of open spaces (D1); the human-human interaction in open spaces (D2);
the human-nature interaction in open spaces (D3); and the perceived benefits and
vitality of open spaces (D4).
The results served very well in formulating the variables and items for
four domains in the research instrument of questionnaire survey. There were six
parts in the questionnaire form, namely: (1) socio demographic profile; (2)
purpose and visit information; (3) human-nature interaction; (4) human-human
interaction; (5) facilities, amenities and accessibilities; and (6) perceived benefits
and opinion.
Sampling was determined based on Sekaran and Bougie’s (2016) rules
in determining sample size namely: (1) sample size larger than 30 and less than
500 are appropriate for most research and (2) where sample are to be broken into
subsamples, a minimum sample size of 30 for each category is necessary. Thus,
this study uses a disproportionate stratified random sampling where the samples
size was ascertained according to the size ratio of each park in relation to the total
size of study area (Table 1).
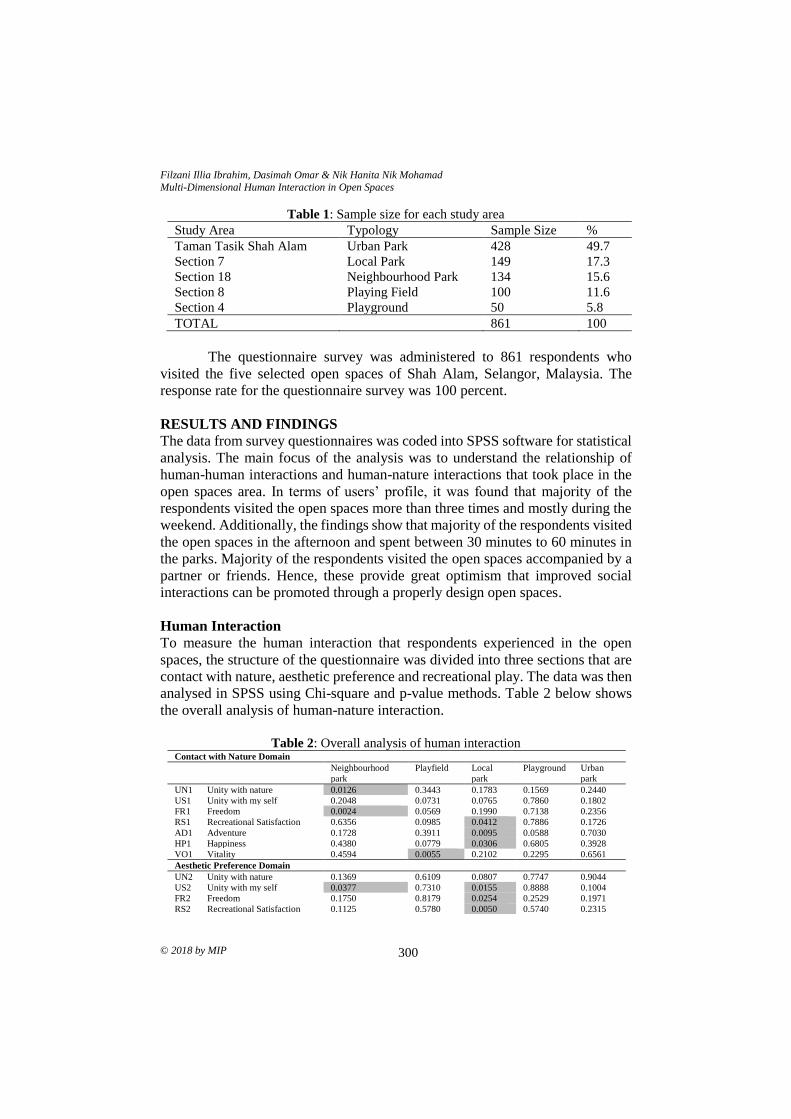
Filzani Illia Ibrahim, Dasimah Omar & Nik Hanita Nik Mohamad
Multi-Dimensional Human Interaction in Open Spaces
© 2018 by MIP 300
Table 1: Sample size for each study area
Study Area Typology Sample Size %
Taman Tasik Shah Alam Urban Park 428 49.7
Section 7 Local Park 149 17.3
Section 18 Neighbourhood Park 134 15.6
Section 8 Playing Field 100 11.6
Section 4 Playground 50 5.8
TOTAL 861 100
The questionnaire survey was administered to 861 respondents who
visited the five selected open spaces of Shah Alam, Selangor, Malaysia. The
response rate for the questionnaire survey was 100 percent.
RESULTS AND FINDINGS The data from survey questionnaires was coded into SPSS software for statistical
analysis. The main focus of the analysis was to understand the relationship of
human-human interactions and human-nature interactions that took place in the
open spaces area. In terms of users’ profile, it was found that majority of the
respondents visited the open spaces more than three times and mostly during the
weekend. Additionally, the findings show that majority of the respondents visited
the open spaces in the afternoon and spent between 30 minutes to 60 minutes in
the parks. Majority of the respondents visited the open spaces accompanied by a
partner or friends. Hence, these provide great optimism that improved social
interactions can be promoted through a properly design open spaces.
Human Interaction To measure the human interaction that respondents experienced in the open
spaces, the structure of the questionnaire was divided into three sections that are
contact with nature, aesthetic preference and recreational play. The data was then
analysed in SPSS using Chi-square and p-value methods. Table 2 below shows
the overall analysis of human-nature interaction.
Table 2: Overall analysis of human interaction
Contact with Nature Domain
Neighbourhood
park
Playfield Local
park
Playground Urban
park
UN1 Unity with nature 0.0126 0.3443 0.1783 0.1569 0.2440
US1 Unity with my self 0.2048 0.0731 0.0765 0.7860 0.1802
FR1 Freedom 0.0024 0.0569 0.1990 0.7138 0.2356
RS1 Recreational Satisfaction 0.6356 0.0985 0.0412 0.7886 0.1726
AD1 Adventure 0.1728 0.3911 0.0095 0.0588 0.7030
HP1 Happiness 0.4380 0.0779 0.0306 0.6805 0.3928
VO1 Vitality 0.4594 0.0055 0.2102 0.2295 0.6561
Aesthetic Preference Domain
UN2 Unity with nature 0.1369 0.6109 0.0807 0.7747 0.9044
US2 Unity with my self 0.0377 0.7310 0.0155 0.8888 0.1004
FR2 Freedom 0.1750 0.8179 0.0254 0.2529 0.1971
RS2 Recreational Satisfaction 0.1125 0.5780 0.0050 0.5740 0.2315
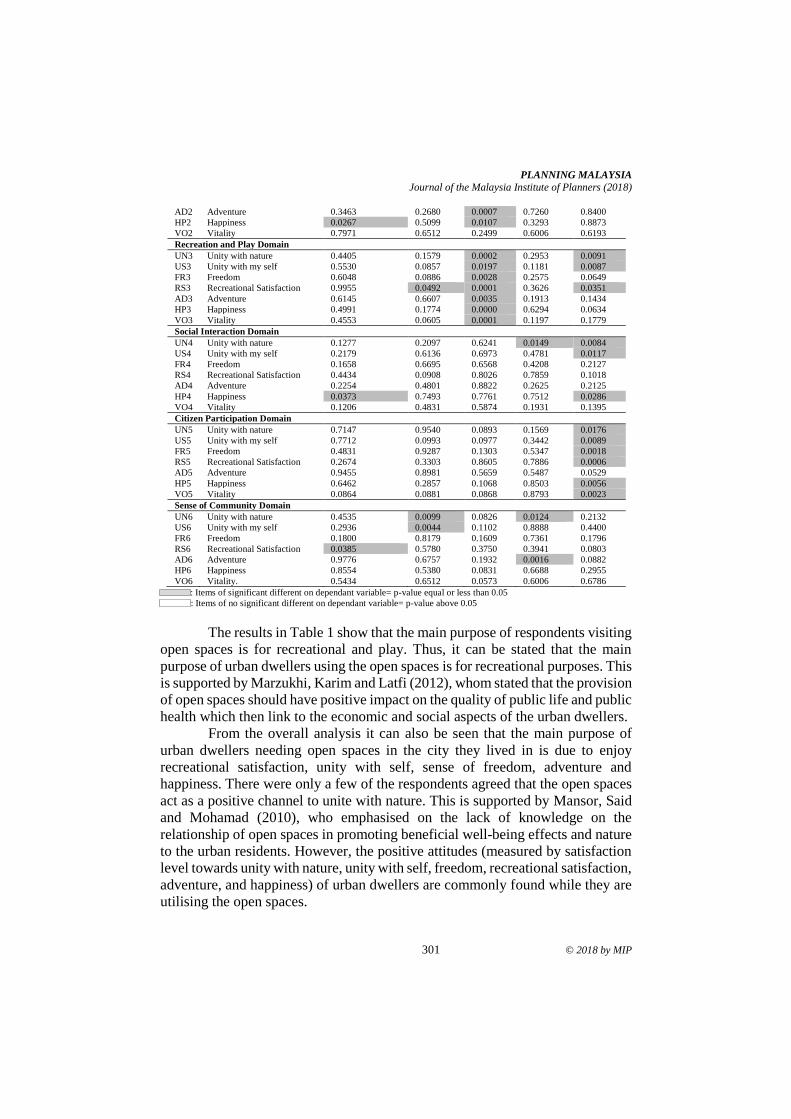
PLANNING MALAYSIA
Journal of the Malaysia Institute of Planners (2018)
301 © 2018 by MIP
AD2 Adventure 0.3463 0.2680 0.0007 0.7260 0.8400
HP2 Happiness 0.0267 0.5099 0.0107 0.3293 0.8873
VO2 Vitality 0.7971 0.6512 0.2499 0.6006 0.6193
Recreation and Play Domain
UN3 Unity with nature 0.4405 0.1579 0.0002 0.2953 0.0091
US3 Unity with my self 0.5530 0.0857 0.0197 0.1181 0.0087
FR3 Freedom 0.6048 0.0886 0.0028 0.2575 0.0649
RS3 Recreational Satisfaction 0.9955 0.0492 0.0001 0.3626 0.0351
AD3 Adventure 0.6145 0.6607 0.0035 0.1913 0.1434
HP3 Happiness 0.4991 0.1774 0.0000 0.6294 0.0634
VO3 Vitality 0.4553 0.0605 0.0001 0.1197 0.1779
Social Interaction Domain
UN4 Unity with nature 0.1277 0.2097 0.6241 0.0149 0.0084
US4 Unity with my self 0.2179 0.6136 0.6973 0.4781 0.0117
FR4 Freedom 0.1658 0.6695 0.6568 0.4208 0.2127
RS4 Recreational Satisfaction 0.4434 0.0908 0.8026 0.7859 0.1018
AD4 Adventure 0.2254 0.4801 0.8822 0.2625 0.2125
HP4 Happiness 0.0373 0.7493 0.7761 0.7512 0.0286
VO4 Vitality 0.1206 0.4831 0.5874 0.1931 0.1395
Citizen Participation Domain
UN5 Unity with nature 0.7147 0.9540 0.0893 0.1569 0.0176
US5 Unity with my self 0.7712 0.0993 0.0977 0.3442 0.0089
FR5 Freedom 0.4831 0.9287 0.1303 0.5347 0.0018
RS5 Recreational Satisfaction 0.2674 0.3303 0.8605 0.7886 0.0006
AD5 Adventure 0.9455 0.8981 0.5659 0.5487 0.0529
HP5 Happiness 0.6462 0.2857 0.1068 0.8503 0.0056
VO5 Vitality 0.0864 0.0881 0.0868 0.8793 0.0023
Sense of Community Domain
UN6 Unity with nature 0.4535 0.0099 0.0826 0.0124 0.2132
US6 Unity with my self 0.2936 0.0044 0.1102 0.8888 0.4400
FR6 Freedom 0.1800 0.8179 0.1609 0.7361 0.1796
RS6 Recreational Satisfaction 0.0385 0.5780 0.3750 0.3941 0.0803
AD6 Adventure 0.9776 0.6757 0.1932 0.0016 0.0882
HP6 Happiness 0.8554 0.5380 0.0831 0.6688 0.2955
VO6 Vitality. 0.5434 0.6512 0.0573 0.6006 0.6786
: Items of significant different on dependant variable= p-value equal or less than 0.05
: Items of no significant different on dependant variable= p-value above 0.05
The results in Table 1 show that the main purpose of respondents visiting
open spaces is for recreational and play. Thus, it can be stated that the main
purpose of urban dwellers using the open spaces is for recreational purposes. This
is supported by Marzukhi, Karim and Latfi (2012), whom stated that the provision
of open spaces should have positive impact on the quality of public life and public
health which then link to the economic and social aspects of the urban dwellers.
From the overall analysis it can also be seen that the main purpose of
urban dwellers needing open spaces in the city they lived in is due to enjoy
recreational satisfaction, unity with self, sense of freedom, adventure and
happiness. There were only a few of the respondents agreed that the open spaces
act as a positive channel to unite with nature. This is supported by Mansor, Said
and Mohamad (2010), who emphasised on the lack of knowledge on the
relationship of open spaces in promoting beneficial well-being effects and nature
to the urban residents. However, the positive attitudes (measured by satisfaction
level towards unity with nature, unity with self, freedom, recreational satisfaction,
adventure, and happiness) of urban dwellers are commonly found while they are
utilising the open spaces.
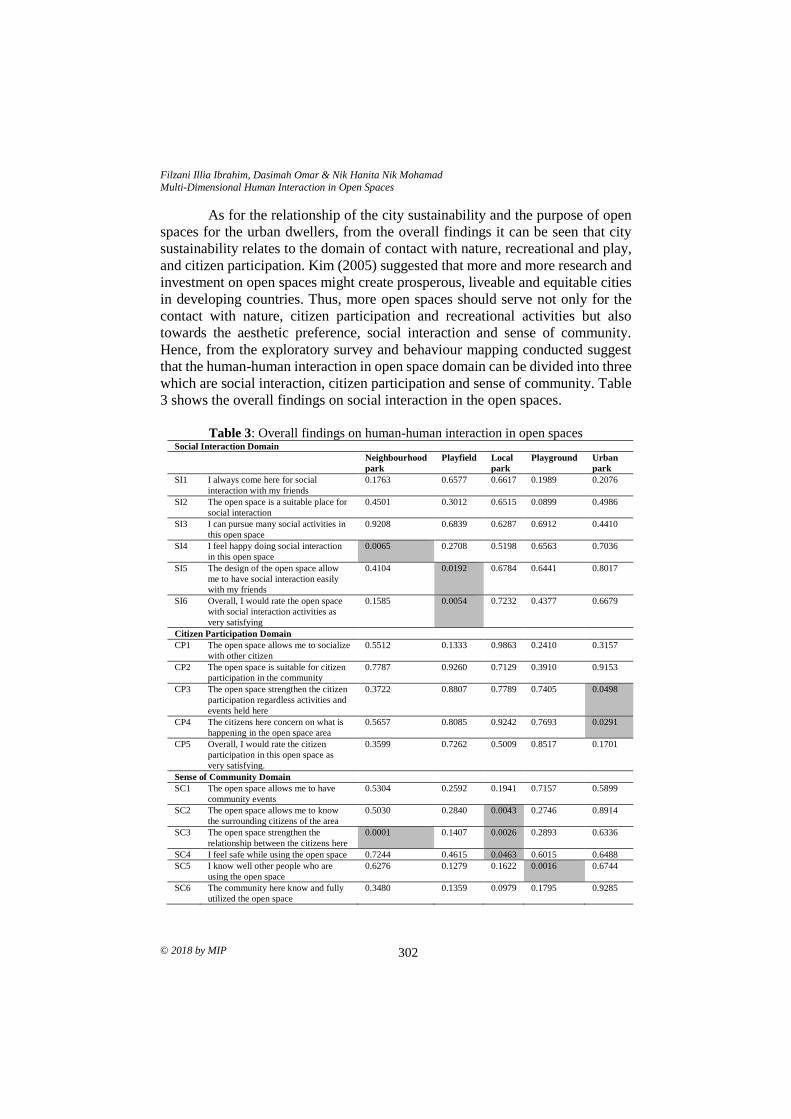
Filzani Illia Ibrahim, Dasimah Omar & Nik Hanita Nik Mohamad
Multi-Dimensional Human Interaction in Open Spaces
© 2018 by MIP 302
As for the relationship of the city sustainability and the purpose of open
spaces for the urban dwellers, from the overall findings it can be seen that city
sustainability relates to the domain of contact with nature, recreational and play,
and citizen participation. Kim (2005) suggested that more and more research and
investment on open spaces might create prosperous, liveable and equitable cities
in developing countries. Thus, more open spaces should serve not only for the
contact with nature, citizen participation and recreational activities but also
towards the aesthetic preference, social interaction and sense of community.
Hence, from the exploratory survey and behaviour mapping conducted suggest
that the human-human interaction in open space domain can be divided into three
which are social interaction, citizen participation and sense of community. Table
3 shows the overall findings on social interaction in the open spaces.
Table 3: Overall findings on human-human interaction in open spaces
Social Interaction Domain
Neighbourhood
park
Playfield Local
park
Playground Urban
park
SI1 I always come here for social
interaction with my friends
0.1763 0.6577 0.6617 0.1989 0.2076
SI2 The open space is a suitable place for
social interaction
0.4501 0.3012 0.6515 0.0899 0.4986
SI3 I can pursue many social activities in
this open space
0.9208 0.6839 0.6287 0.6912 0.4410
SI4 I feel happy doing social interaction
in this open space
0.0065 0.2708 0.5198 0.6563 0.7036
SI5 The design of the open space allow
me to have social interaction easily
with my friends
0.4104 0.0192 0.6784 0.6441 0.8017
SI6 Overall, I would rate the open space
with social interaction activities as
very satisfying
0.1585 0.0054 0.7232 0.4377 0.6679
Citizen Participation Domain
CP1 The open space allows me to socialize
with other citizen
0.5512 0.1333 0.9863 0.2410 0.3157
CP2 The open space is suitable for citizen
participation in the community
0.7787 0.9260 0.7129 0.3910 0.9153
CP3 The open space strengthen the citizen
participation regardless activities and
events held here
0.3722 0.8807 0.7789 0.7405 0.0498
CP4 The citizens here concern on what is
happening in the open space area
0.5657 0.8085 0.9242 0.7693 0.0291
CP5 Overall, I would rate the citizen
participation in this open space as
very satisfying.
0.3599 0.7262 0.5009 0.8517 0.1701
Sense of Community Domain
SC1 The open space allows me to have
community events
0.5304 0.2592 0.1941 0.7157 0.5899
SC2 The open space allows me to know
the surrounding citizens of the area
0.5030 0.2840 0.0043 0.2746 0.8914
SC3 The open space strengthen the
relationship between the citizens here
0.0001 0.1407 0.0026 0.2893 0.6336
SC4 I feel safe while using the open space 0.7244 0.4615 0.0463 0.6015 0.6488
SC5 I know well other people who are
using the open space
0.6276 0.1279 0.1622 0.0016 0.6744
SC6 The community here know and fully
utilized the open space
0.3480 0.1359 0.0979 0.1795 0.9285
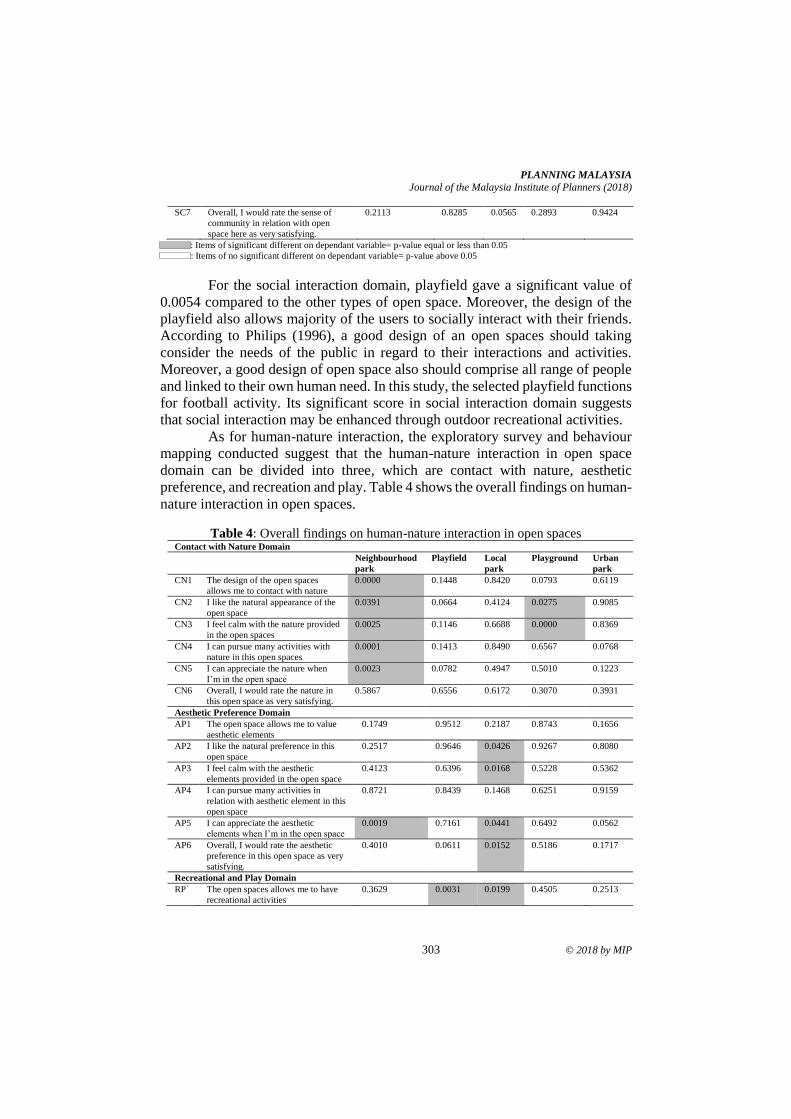
PLANNING MALAYSIA
Journal of the Malaysia Institute of Planners (2018)
303 © 2018 by MIP
SC7 Overall, I would rate the sense of
community in relation with open
space here as very satisfying.
0.2113 0.8285 0.0565 0.2893 0.9424
: Items of significant different on dependant variable= p-value equal or less than 0.05
: Items of no significant different on dependant variable= p-value above 0.05
For the social interaction domain, playfield gave a significant value of
0.0054 compared to the other types of open space. Moreover, the design of the
playfield also allows majority of the users to socially interact with their friends.
According to Philips (1996), a good design of an open spaces should taking
consider the needs of the public in regard to their interactions and activities.
Moreover, a good design of open space also should comprise all range of people
and linked to their own human need. In this study, the selected playfield functions
for football activity. Its significant score in social interaction domain suggests
that social interaction may be enhanced through outdoor recreational activities.
As for human-nature interaction, the exploratory survey and behaviour
mapping conducted suggest that the human-nature interaction in open space
domain can be divided into three, which are contact with nature, aesthetic
preference, and recreation and play. Table 4 shows the overall findings on human-
nature interaction in open spaces.
Table 4: Overall findings on human-nature interaction in open spaces Contact with Nature Domain
Neighbourhood
park
Playfield Local
park
Playground Urban
park
CN1 The design of the open spaces
allows me to contact with nature
0.0000 0.1448 0.8420 0.0793 0.6119
CN2 I like the natural appearance of the
open space
0.0391 0.0664 0.4124 0.0275 0.9085
CN3 I feel calm with the nature provided
in the open spaces
0.0025 0.1146 0.6688 0.0000 0.8369
CN4 I can pursue many activities with
nature in this open spaces
0.0001 0.1413 0.8490 0.6567 0.0768
CN5 I can appreciate the nature when
I’m in the open space
0.0023 0.0782 0.4947 0.5010 0.1223
CN6 Overall, I would rate the nature in
this open space as very satisfying.
0.5867 0.6556 0.6172 0.3070 0.3931
Aesthetic Preference Domain
AP1 The open space allows me to value
aesthetic elements
0.1749 0.9512 0.2187 0.8743 0.1656
AP2 I like the natural preference in this
open space
0.2517 0.9646 0.0426 0.9267 0.8080
AP3 I feel calm with the aesthetic
elements provided in the open space
0.4123 0.6396 0.0168 0.5228 0.5362
AP4 I can pursue many activities in
relation with aesthetic element in this
open space
0.8721 0.8439 0.1468 0.6251 0.9159
AP5 I can appreciate the aesthetic
elements when I’m in the open space
0.0019 0.7161 0.0441 0.6492 0.0562
AP6 Overall, I would rate the aesthetic
preference in this open space as very
satisfying.
0.4010 0.0611 0.0152 0.5186 0.1717
Recreational and Play Domain
RP` The open spaces allows me to have
recreational activities
0.3629 0.0031 0.0199 0.4505 0.2513
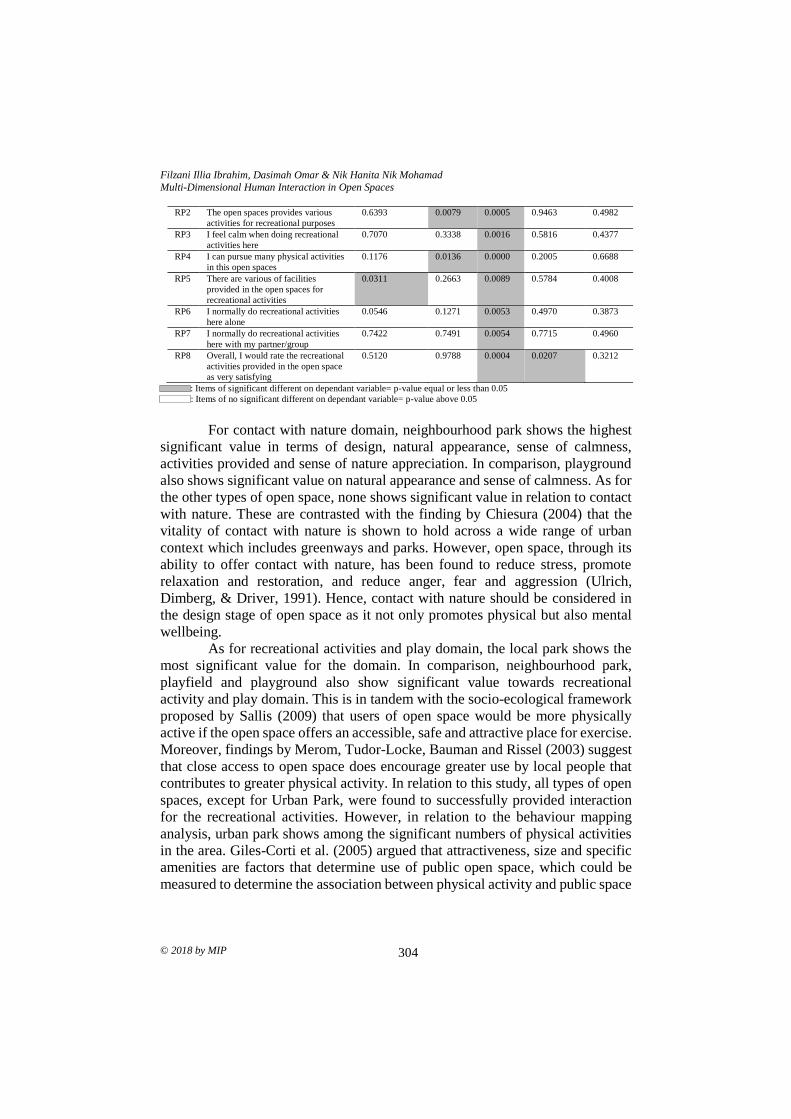
Filzani Illia Ibrahim, Dasimah Omar & Nik Hanita Nik Mohamad
Multi-Dimensional Human Interaction in Open Spaces
© 2018 by MIP 304
RP2 The open spaces provides various
activities for recreational purposes
0.6393 0.0079 0.0005 0.9463 0.4982
RP3 I feel calm when doing recreational
activities here
0.7070 0.3338 0.0016 0.5816 0.4377
RP4 I can pursue many physical activities
in this open spaces
0.1176 0.0136 0.0000 0.2005 0.6688
RP5 There are various of facilities
provided in the open spaces for
recreational activities
0.0311 0.2663 0.0089 0.5784 0.4008
RP6 I normally do recreational activities
here alone
0.0546 0.1271 0.0053 0.4970 0.3873
RP7 I normally do recreational activities
here with my partner/group
0.7422 0.7491 0.0054 0.7715 0.4960
RP8 Overall, I would rate the recreational
activities provided in the open space
as very satisfying
0.5120 0.9788 0.0004 0.0207 0.3212
: Items of significant different on dependant variable= p-value equal or less than 0.05
: Items of no significant different on dependant variable= p-value above 0.05
For contact with nature domain, neighbourhood park shows the highest
significant value in terms of design, natural appearance, sense of calmness,
activities provided and sense of nature appreciation. In comparison, playground
also shows significant value on natural appearance and sense of calmness. As for
the other types of open space, none shows significant value in relation to contact
with nature. These are contrasted with the finding by Chiesura (2004) that the
vitality of contact with nature is shown to hold across a wide range of urban
context which includes greenways and parks. However, open space, through its
ability to offer contact with nature, has been found to reduce stress, promote
relaxation and restoration, and reduce anger, fear and aggression (Ulrich,
Dimberg, & Driver, 1991). Hence, contact with nature should be considered in
the design stage of open space as it not only promotes physical but also mental
wellbeing.
As for recreational activities and play domain, the local park shows the
most significant value for the domain. In comparison, neighbourhood park,
playfield and playground also show significant value towards recreational
activity and play domain. This is in tandem with the socio-ecological framework
proposed by Sallis (2009) that users of open space would be more physically
active if the open space offers an accessible, safe and attractive place for exercise.
Moreover, findings by Merom, Tudor-Locke, Bauman and Rissel (2003) suggest
that close access to open space does encourage greater use by local people that
contributes to greater physical activity. In relation to this study, all types of open
spaces, except for Urban Park, were found to successfully provided interaction
for the recreational activities. However, in relation to the behaviour mapping
analysis, urban park shows among the significant numbers of physical activities
in the area. Giles-Corti et al. (2005) argued that attractiveness, size and specific
amenities are factors that determine use of public open space, which could be
measured to determine the association between physical activity and public space
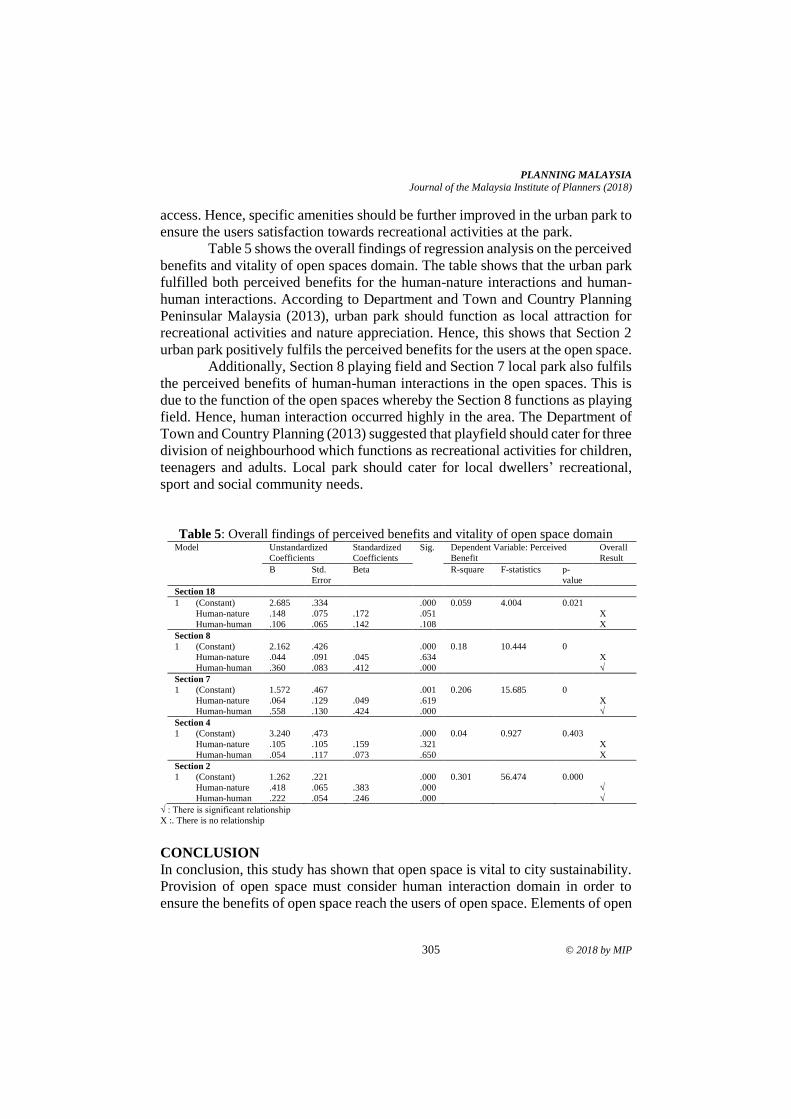
PLANNING MALAYSIA
Journal of the Malaysia Institute of Planners (2018)
305 © 2018 by MIP
access. Hence, specific amenities should be further improved in the urban park to
ensure the users satisfaction towards recreational activities at the park.
Table 5 shows the overall findings of regression analysis on the perceived
benefits and vitality of open spaces domain. The table shows that the urban park
fulfilled both perceived benefits for the human-nature interactions and human-
human interactions. According to Department and Town and Country Planning
Peninsular Malaysia (2013), urban park should function as local attraction for
recreational activities and nature appreciation. Hence, this shows that Section 2
urban park positively fulfils the perceived benefits for the users at the open space.
Additionally, Section 8 playing field and Section 7 local park also fulfils
the perceived benefits of human-human interactions in the open spaces. This is
due to the function of the open spaces whereby the Section 8 functions as playing
field. Hence, human interaction occurred highly in the area. The Department of
Town and Country Planning (2013) suggested that playfield should cater for three
division of neighbourhood which functions as recreational activities for children,
teenagers and adults. Local park should cater for local dwellers’ recreational,
sport and social community needs.
Table 5: Overall findings of perceived benefits and vitality of open space domain
Model Unstandardized
Coefficients
Standardized
Coefficients
Sig. Dependent Variable: Perceived
Benefit
Overall
Result
B Std.
Error
Beta R-square F-statistics p-
value
Section 18
1 (Constant) 2.685 .334 .000 0.059 4.004 0.021
Human-nature .148 .075 .172 .051 X
Human-human .106 .065 .142 .108 X
Section 8
1 (Constant) 2.162 .426 .000 0.18 10.444 0
Human-nature .044 .091 .045 .634 X
Human-human .360 .083 .412 .000 √
Section 7
1 (Constant) 1.572 .467 .001 0.206 15.685 0
Human-nature .064 .129 .049 .619 X
Human-human .558 .130 .424 .000 √
Section 4
1 (Constant) 3.240 .473 .000 0.04 0.927 0.403
Human-nature .105 .105 .159 .321 X
Human-human .054 .117 .073 .650 X
Section 2
1 (Constant) 1.262 .221 .000 0.301 56.474 0.000
Human-nature .418 .065 .383 .000 √
Human-human .222 .054 .246 .000 √
√ : There is significant relationship
X :. There is no relationship
CONCLUSION In conclusion, this study has shown that open space is vital to city sustainability.
Provision of open space must consider human interaction domain in order to
ensure the benefits of open space reach the users of open space. Elements of open
Filzani Illia Ibrahim, Dasimah Omar & Nik Hanita Nik Mohamad
Multi-Dimensional Human Interaction in Open Spaces
© 2018 by MIP 306
space such as green space, water features and physical attributes need to be
included in its design in order to enhance the interactions between human-human
and human-nature in open space.
ACKNOWLEDGEMENT
The authors would like to thank all officers of Taylors University and Research
Management Institute of Universiti Teknologi MARA for their support in
conducting this study.
REFERENCES
Arifin, H. S. (2005). Pemeliharaan taman (edisi revisi). Jakarta: Penebar Swadaya.
Chiesura, A. (2004). The role of urban parks for the sustainable city. Landscape and
Urban Planning, 68(1), 129-138.
Conway, H. (2000). Parks and people: the social functions. In J. Woudstra, K, Fieldhouse
(Eds.), The regeneration of public parks (pp. 9-20). London: E&FN Spon.
Department of Town and Country Planning of Peninsular Malaysia (2013). Planning
guidelines of open spaces and recreation areas. Kuala Lumpur: Ministry of
Housing and Local Government.
Giles-Corti, B., Sallis, J. F., Sugiyama, T., Frank, L. D., Lowe, M., & Owen, N. (2015).
Translating active living research into policy and practice: One important
pathway to chronic disease prevention. Journal of Public Health Policy, 36, 231-
243.
Kaplan, R., (1993). The role of nature in the context of the workplace. Landscape and
Urban Planning, 26(1-4), 193-201.
Kim, S. (2015, March 30). Public spaces - not a “nice to have” but a basic need for cities.
Retrieved from http:// http://blogs.worldbank.org/endpovertyinsouthasia/public-spaces-not-nice-have-
basic-need-cities
Mansor, M., Said, I., & Mohamad, I. (2010). Experiental contacts with green
infrastructure's diversity and well being of urban community. Asian Journal of
Environment-Behaviour Studies, 31-47.
Marzukhi, M. A., Karim, H. A., & Latfi, M. F. (2012). Evaluating the Shah Alam City
Council policy and guidelines on the hierarchy of neighborhood open space.
Procedia - Social and Behavioral Sciences, 36, 456-465.
Matsuoka, R. H., & Kaplan, R. (2008). People needs in the urban landscape : Analysis of
landscape and urban planning contributions. Landscape and Urban Planning,
84(1), 7-19.
Merom, D., Tudor-Locke, C., Bauman, A., & Rissel, C. (2006). Active commuting to
school among NSW primary school children: Implications for public health.
Health and Place 12(4), 678-687.
Mutiara, S., & Isami, K. (2012). Characteristic of public small park usage in Asia Pacific
countries: Case study in Jakarta and Yokohama City, Procedia - Social and
Behavioral Sciences, 35, 412-419.
PLANNING MALAYSIA
Journal of the Malaysia Institute of Planners (2018)
307 © 2018 by MIP
Oguz, D. (2000). User surveys of Ankara’s urban parks. Landscape and Urban Planning,
52(2-3), 165-171.
Philips, L. E. (1996). Parks: Design and management. New York: McGrawHill.
Sallis, J. F. (2009). Measuring physical activity environments: A brief history. American
Journal of Preventive Medicine, 36, S86-S92.
Sekaran, U., & Bougie, R. (2016). Research methods for business: A skill-building
approach. Chichester, West Sussex, United Kingdom: John Wiley & Sons.
Ulrich, R. S., Dimberg, V., & Driver, B. L. (1991). Psychophysiological indicators of
leisure benefits. In B. L. Driver, P. J. Brown, & G. L. Peterson, (Eds.), Benefits
of leisure. (n.p.): Venture Publication.
1Professor at International Islamic University Malaysia. Email: [email protected] 308
PLANNING MALAYSIA:
Journal of the Malaysian Institute of Planners
VOLUME 16 ISSUE 3 (2018) Page 308 – 319
MEETING HOUSING NEEDS OF THE POOR AND NEEDY MUSLIMS
THROUGH ZAKAT AND WAKAF
Khairuddin Abdul Rashid1, Puteri Nur Farah Naadia Mohd Fauzi2, &
Sharina Farihah Hasan3
Kulliyyah of Architecture and Environmental Design
INTERNATIONAL ISLAMIC UNIVERSITY MALAYSIA
Abstract
Meeting housing needs of the poor and needy is a continuous challenge. The
challenge is exacerbated, among others, by the continuous and upward increases
in the cost of living, population growth and the availability of resources. The
Government intervenes through policy implementation and assistance in the
forms of subsidies and the provision of social housing. In Islam, there is an
opportunity to help the poor and needy meeting their housing needs through zakat
and wakaf. Consequently, a study applying a combination of library research and
in-depth face-to-face interviews with experts was carried out. The key objectives
of the study are to assess the potential of zakat and wakaf in the provision of
affordable housing for the poor and needy, and if so, to identify appropriate
strategies to empower the zakat and wakaf authorities in carrying out the task.
The main findings from the study suggest that zakat and wakaf have great
potential to help the poor and needy in meeting their housing needs and that the
best way forward is for the zakat and wakaf authorities to do so through
collaboration, either among themselves or with private property developers. The
significance of the study and its findings are viewed in terms of the innovative
idea in promoting zakat and wakaf authorities to collaborate instead of working
on their own, with conditions that issues related to the Shariah are resolved.
Keywords: economy, housing, procurement, social, wakaf, zakat
PLANNING MALAYSIA
Journal of the Malaysia Institute of Planners (2018)
309 © 2018 by MIP
INTRODUCTION
The problem of the poor and needy accessing to or owning decent and affordable
housing is on the rise. Despite Government intervention, through a variety of
assistance and policy implementations, the housing woes of the poor and needy
continues unabated (Abdul Rashid, Ahmad Sarkawi, & Hasan, 2014; Abdul
Rashid, Hasan, Ahmad Sarkawi, Othman, & Aripin, 2015a; Abdul Rashid,
Hasan, & Ahmad Sarkawi, 2015b; Abdul Rashid et al., 2017; KRI, 2015; Ahmad
Sarkawi, Abdul Rashid, & Hasan, 2015; Cheah & Almeida, 2016; Abdul Rashid,
2017). Having access to decent and affordable housing is a pre-requisite for
nurturing healthy living and good individual and family values (Quran, 30: 21),
these values, in turn, contribute towards the overall goodness of society and the
country.
The terms poor and needy (miskin and miskin tegar) mean different
things to different people. The Government refers to miskin or poor and miskin
tegar or needy/hardcore poor as those with monthly household income below
RM940.00 and RM580.00 (Peninsular Malaysia) respectively i.
The Government has been active and consistent in assisting the poor and
needy in meeting their housing needs. They implemented policies, introduced
subsidies and provided assistance including the implementation of a variety of
affordable housing schemes that attempt to match affordability - assessed through
monthly income – and house type and price (Ahmad Sarkawi et al., 2015; Abdul
Rashid, 2017). However, the problem of housing the poor and needy is far from
over as the shortfall in affordable housing continues to increase (KRI, 2015;
Cheah & Almeida, 2016; Abdul Rashid, 2017).
In Islam, the poor and needy are referred to as fakir and miskin. The
former refers to one that has neither material possession nor means of livelihood
while the latter is one with insufficient means of livelihood to meet basic needs.
Helping the fakir and miskin is an obligation on the rich as well as highly
encouraged on all Muslims; the former through zakat and the latter through
wakaf. The presence of zakat and wakaf reaffirms Islam’s position on the
importance of the fair and equitable distribution of wealth among the ummah
(Quran, 2:43; 9:60; 2:155, 261). Under zakat, fakir and miskin are eligible to be
assisted and their eligibility is determined through haddul kifayah (poverty line
under the zakat system) ii.
The Majlis Agama Islam Negeri-Negeri (MAINs or State Islamic
Religious Councils) are the authorities entrusted with the administration of zakat
and wakaf. MAINs, therefore, have been active in collecting zakat and wakaf
contributions as well as their disbursements. Under zakat, disbursements are
made to the asnafs while under wakaf the help goes to beneficiaries that have
been specifically designated by the Wakeef (donor)iii. The style of assistance
includes helping the asnafs and others in meeting their housing needsiv. However,
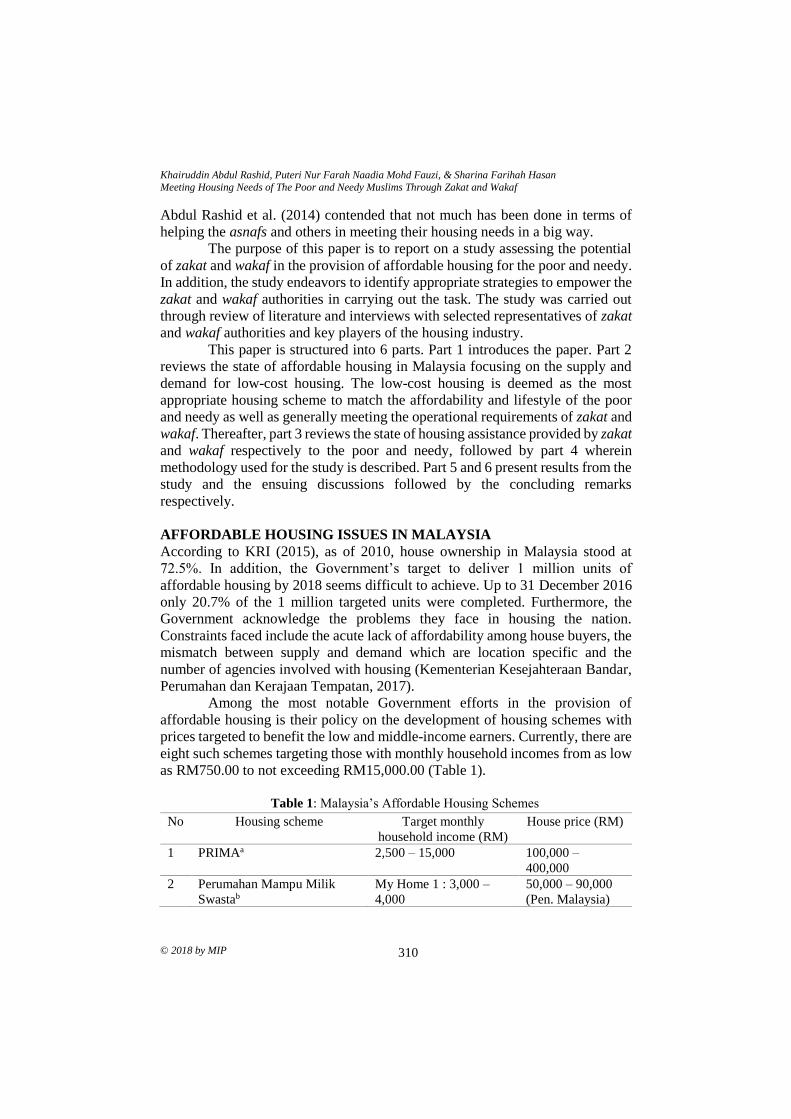
Khairuddin Abdul Rashid, Puteri Nur Farah Naadia Mohd Fauzi, & Sharina Farihah Hasan
Meeting Housing Needs of The Poor and Needy Muslims Through Zakat and Wakaf
© 2018 by MIP 310
Abdul Rashid et al. (2014) contended that not much has been done in terms of
helping the asnafs and others in meeting their housing needs in a big way.
The purpose of this paper is to report on a study assessing the potential
of zakat and wakaf in the provision of affordable housing for the poor and needy.
In addition, the study endeavors to identify appropriate strategies to empower the
zakat and wakaf authorities in carrying out the task. The study was carried out
through review of literature and interviews with selected representatives of zakat
and wakaf authorities and key players of the housing industry.
This paper is structured into 6 parts. Part 1 introduces the paper. Part 2
reviews the state of affordable housing in Malaysia focusing on the supply and
demand for low-cost housing. The low-cost housing is deemed as the most
appropriate housing scheme to match the affordability and lifestyle of the poor
and needy as well as generally meeting the operational requirements of zakat and
wakaf. Thereafter, part 3 reviews the state of housing assistance provided by zakat
and wakaf respectively to the poor and needy, followed by part 4 wherein
methodology used for the study is described. Part 5 and 6 present results from the
study and the ensuing discussions followed by the concluding remarks
respectively.
AFFORDABLE HOUSING ISSUES IN MALAYSIA
According to KRI (2015), as of 2010, house ownership in Malaysia stood at
72.5%. In addition, the Government’s target to deliver 1 million units of
affordable housing by 2018 seems difficult to achieve. Up to 31 December 2016
only 20.7% of the 1 million targeted units were completed. Furthermore, the
Government acknowledge the problems they face in housing the nation.
Constraints faced include the acute lack of affordability among house buyers, the
mismatch between supply and demand which are location specific and the
number of agencies involved with housing (Kementerian Kesejahteraan Bandar,
Perumahan dan Kerajaan Tempatan, 2017).
Among the most notable Government efforts in the provision of
affordable housing is their policy on the development of housing schemes with
prices targeted to benefit the low and middle-income earners. Currently, there are
eight such schemes targeting those with monthly household incomes from as low
as RM750.00 to not exceeding RM15,000.00 (Table 1).
Table 1: Malaysia’s Affordable Housing Schemes
No Housing scheme Target monthly
household income (RM)
House price (RM)
1 PRIMAa
2,500 – 15,000 100,000 –
400,000
2 Perumahan Mampu Milik
Swastab
My Home 1 : 3,000 –
4,000
50,000 – 90,000
(Pen. Malaysia)
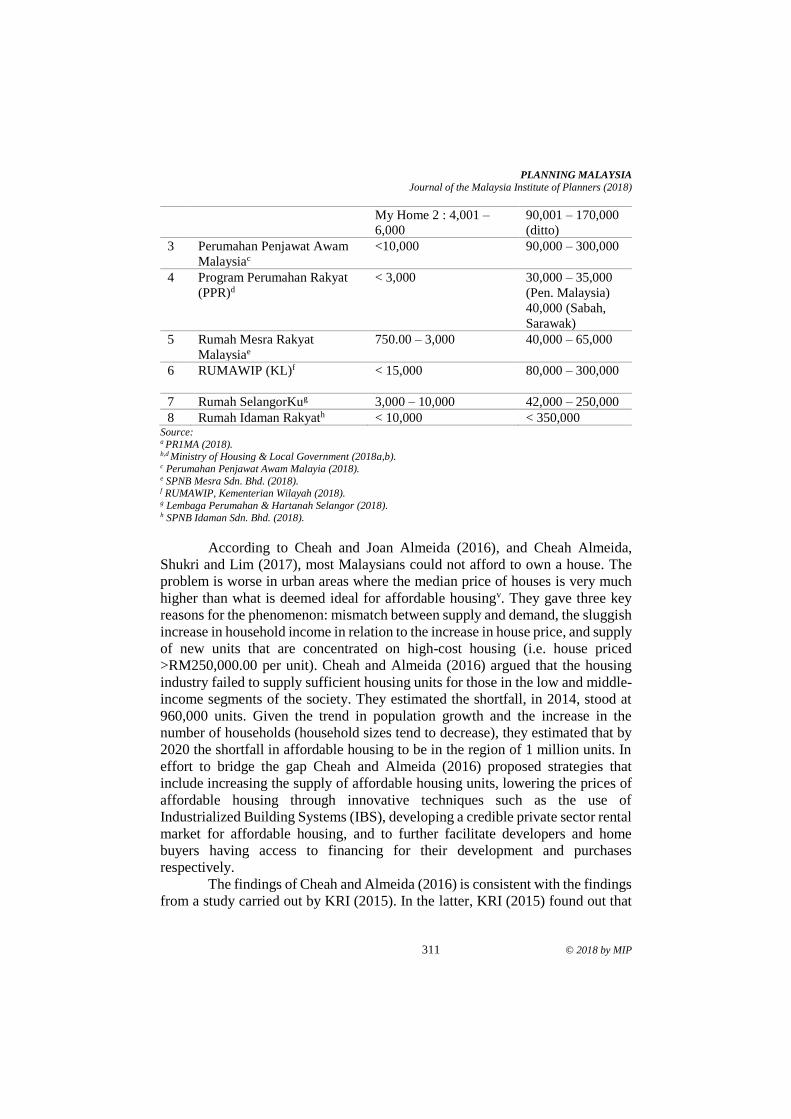
PLANNING MALAYSIA
Journal of the Malaysia Institute of Planners (2018)
311 © 2018 by MIP
My Home 2 : 4,001 –
6,000
90,001 – 170,000
(ditto)
3 Perumahan Penjawat Awam
Malaysiac
<10,000 90,000 – 300,000
4 Program Perumahan Rakyat
(PPR)d
< 3,000 30,000 – 35,000
(Pen. Malaysia)
40,000 (Sabah,
Sarawak)
5 Rumah Mesra Rakyat
Malaysiae
750.00 – 3,000 40,000 – 65,000
6 RUMAWIP (KL)f
< 15,000 80,000 – 300,000
7 Rumah SelangorKug 3,000 – 10,000 42,000 – 250,000
8 Rumah Idaman Rakyath < 10,000 < 350,000 Source: a PR1MA (2018). b,d Ministry of Housing & Local Government (2018a,b). c Perumahan Penjawat Awam Malayia (2018). e SPNB Mesra Sdn. Bhd. (2018). f RUMAWIP, Kementerian Wilayah (2018). g Lembaga Perumahan & Hartanah Selangor (2018). h SPNB Idaman Sdn. Bhd. (2018).
According to Cheah and Joan Almeida (2016), and Cheah Almeida,
Shukri and Lim (2017), most Malaysians could not afford to own a house. The
problem is worse in urban areas where the median price of houses is very much
higher than what is deemed ideal for affordable housingv. They gave three key
reasons for the phenomenon: mismatch between supply and demand, the sluggish
increase in household income in relation to the increase in house price, and supply
of new units that are concentrated on high-cost housing (i.e. house priced
>RM250,000.00 per unit). Cheah and Almeida (2016) argued that the housing
industry failed to supply sufficient housing units for those in the low and middle-
income segments of the society. They estimated the shortfall, in 2014, stood at
960,000 units. Given the trend in population growth and the increase in the
number of households (household sizes tend to decrease), they estimated that by
2020 the shortfall in affordable housing to be in the region of 1 million units. In
effort to bridge the gap Cheah and Almeida (2016) proposed strategies that
include increasing the supply of affordable housing units, lowering the prices of
affordable housing through innovative techniques such as the use of
Industrialized Building Systems (IBS), developing a credible private sector rental
market for affordable housing, and to further facilitate developers and home
buyers having access to financing for their development and purchases
respectively.
The findings of Cheah and Almeida (2016) is consistent with the findings
from a study carried out by KRI (2015). In the latter, KRI (2015) found out that
Khairuddin Abdul Rashid, Puteri Nur Farah Naadia Mohd Fauzi, & Sharina Farihah Hasan
Meeting Housing Needs of The Poor and Needy Muslims Through Zakat and Wakaf
© 2018 by MIP 312
the median price of houses in Malaysia in 2014 was 4.4 times more than the
median household income. This translates into a ‘seriously unaffordable’ housing
market. In urban areas like Kuala Lumpur and Penang, the situation is considered
‘severely unaffordable’ whereby the score stood at 5.4 and 5.2 times median
household income respectively. KRI (2015) also reiterated that the problem of
affordable housing will get worse in years to come given Malaysia’s demographic
factors namely continuous increase in population, rapid rate of urbanization and
decrease in household size.
However, KRI (2015) argued that current affordable housing strategies
that focus on the demand side such as making house financing cheaper or
providing subsidies for home buyers and supply-side intervention via direct
provision of low-cost houses or subsidizing housing costs are unsuitable as they
might drive price increases resulting, among others, in more household debt.
Their key solution lies on the supply side i.e. improve the elasticity of housing
supply so as to make the supply side of housing more responsive to the needs of
all sections of the population. KRI (2015) believe such an approach could be
realized through reforming the Malaysian procurement system.
ZAKAT AND WAKAF AND AFFORDABLE HOUSING
Islam calls for Allah’s abundance to be shared in a fair and equitable manner.
Thus, those bestowed with wealth are required to help the poor and needy. The
wealthier Muslims therefore, are required to pay zakat and are encouraged to
make wakaf contributions. Hence, zakat is an obligation (wajib) whereas wakaf
is philanthropy (Quran, 2:43; 9:60; 2:155, 261). In the former, Allah decrees the
beneficiaries to be the asnafs whereas, in the latter, the beneficiaries are as
directed by the Wakeef.
In terms of permissibility of utilizing zakat money for the purpose of
investing in socio-economic infrastructures such as the building of low cost
housing, the Majma al Fiqh al Islami has decided that it is permissible as long as
the investment meets the following conditions: an investment may be undertaken
as long as no further demand for zakat monies to be distributed for the purpose
of basic sustenance, the zakat money is expended on Shariah compliant activities,
the investment is guaranteed whereby the principal, as well as the potential
profits, belong to zakat, the investment can be promptly liquidated to meet
pressing matters involving the asnafs, detailed feasibility study is required and
the investment must be approved by the reigning authorityvi. Anwar (1995)
provided a detailed explanation of the permissibility and compatibility of
channeling accumulated zakat funds into long-term investment for the betterment
of the ummah. In addition, Saad, Sawandi and Mohammad (2016) pointed out
that during the reign of Caliph Umar Abdul Aziz there was zakat surplus and that
the surplus funds were invested in projects that bring benefits to the asnafs. In
Malaysia, it was reported by Dahaman, Hussin and Mohd Noor (2015) that the
PLANNING MALAYSIA
Journal of the Malaysia Institute of Planners (2018)
313 © 2018 by MIP
fatwa committees of the states of Selangor and Melaka have decreed that
investing zakat money is permissible but subject to conditions to ensure the
security of the zakat monies are not compromised.
Ahmad Sarkawi et al. (2015) reviewed the style and type of housing
assistance provided by zakat to asnafs. From a total of 32 types of zakat
assistance, two focus on housing i.e. assistance in repairing, building or payment
of a deposit for low-cost houses; and assistance to build a house in collaboration
with other agencies.
Abdul Rashid et al. (2017) reviewed records on fatwas concerning the
permissibility of wakaf assets to be invested in socio-economic developments
including housing. In general, it is permissible but subject to specific instructions
issued by the Wakeef. Other conditions include the practice of Istibdal
(replacement of the acquired land), ownership of the wakaf land where the
development takes place is not transferable, only the usufruct, and that the
development must be Shariah compliant.
Studies by Abdul Rashid et al. (2017) and Abdul Rashid (2017) revealed
that housing projects, both to unlock the value of wakaf land and building low-
cost housing, have been commissioned and are currently being commissioned on
wakaf land under a variety of procurement approaches. However, on low cost
housing Abdul Rashid et al. (2017) identified the reasons why the wakaf
authorities are not active: constraints in the availability of wakaf land as suitable
sites, inappropriate size of available wakaf land, lack of money as capital, the
reluctance of private developers and funders to collaborate in developing
affordable housing on wakaf land, and the preference of some wakaf authorities
to focus developing traditional religious facilities rather than low cost housing,
arguing instead that housing is a State matter.
On the constraints faced by wakaf authorities in developing wakaf land
for housing, researchers have proposed that wakaf should consider working in
collaboration with others such as with zakat and/or private property developersvii.
For example, in a study carried out by Mohd Ali et al. (2016), they highlighted
the merits when zakat and wakaf collaborate in the building of residential units
for asnafs. Similarly, Abdul Rashid et al. (2014; 2015a) proposed a tripartite joint
venture procurement model between wakaf-zakat-private property developer as a
way forward.
METHODOLOGY
In the current study, the authors hypothesized that zakat and wakaf have great
potential in contributing towards the provision of affordable housing for the poor
and needy. They believe that these two socio-economic instruments could be
utilized as the third funding source – self-funding and State’s funding via
appropriate policies, subsidies and social housing being the first two funding
sources respectively – in helping the poor and needy towards meeting their
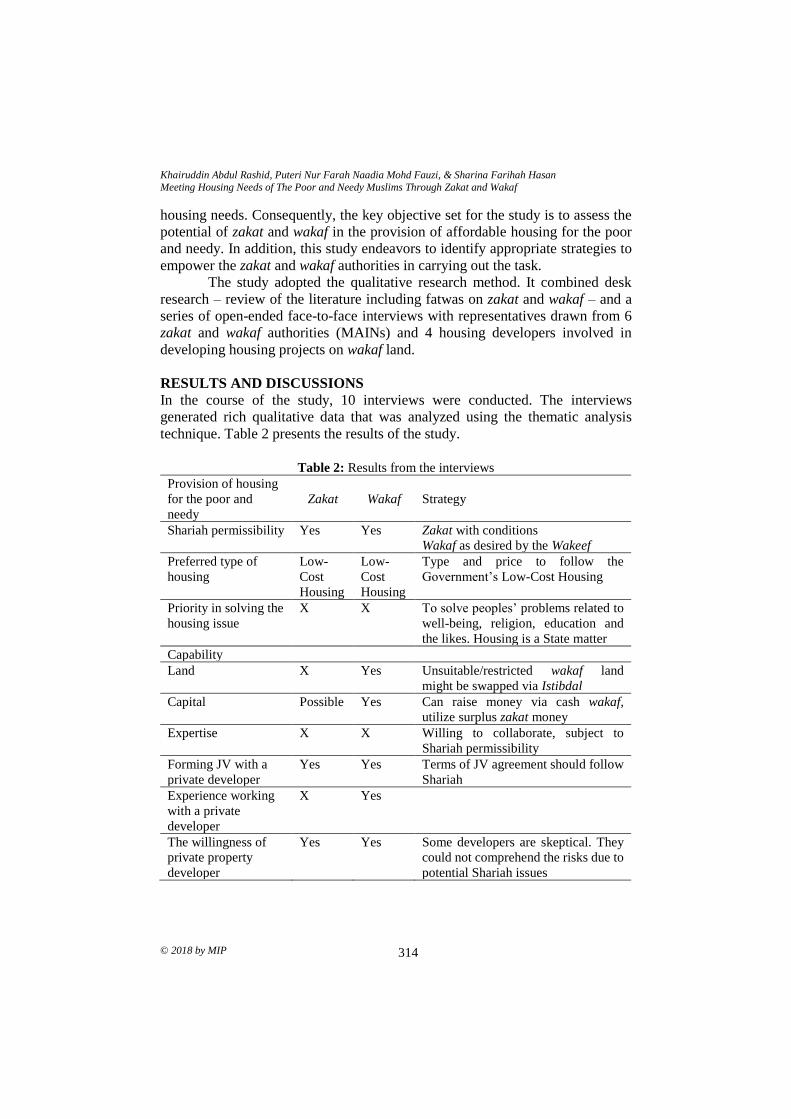
Khairuddin Abdul Rashid, Puteri Nur Farah Naadia Mohd Fauzi, & Sharina Farihah Hasan
Meeting Housing Needs of The Poor and Needy Muslims Through Zakat and Wakaf
© 2018 by MIP 314
housing needs. Consequently, the key objective set for the study is to assess the
potential of zakat and wakaf in the provision of affordable housing for the poor
and needy. In addition, this study endeavors to identify appropriate strategies to
empower the zakat and wakaf authorities in carrying out the task.
The study adopted the qualitative research method. It combined desk
research – review of the literature including fatwas on zakat and wakaf – and a
series of open-ended face-to-face interviews with representatives drawn from 6
zakat and wakaf authorities (MAINs) and 4 housing developers involved in
developing housing projects on wakaf land.
RESULTS AND DISCUSSIONS
In the course of the study, 10 interviews were conducted. The interviews
generated rich qualitative data that was analyzed using the thematic analysis
technique. Table 2 presents the results of the study.
Table 2: Results from the interviews
Provision of housing
for the poor and
needy
Zakat Wakaf Strategy
Shariah permissibility Yes Yes Zakat with conditions
Wakaf as desired by the Wakeef
Preferred type of
housing
Low-
Cost
Housing
Low-
Cost
Housing
Type and price to follow the
Government’s Low-Cost Housing
Priority in solving the
housing issue
X X To solve peoples’ problems related to
well-being, religion, education and
the likes. Housing is a State matter
Capability
Land X Yes Unsuitable/restricted wakaf land
might be swapped via Istibdal
Capital Possible Yes Can raise money via cash wakaf,
utilize surplus zakat money
Expertise X X Willing to collaborate, subject to
Shariah permissibility
Forming JV with a
private developer
Yes Yes Terms of JV agreement should follow
Shariah
Experience working
with a private
developer
X Yes
The willingness of
private property
developer
Yes Yes Some developers are skeptical. They
could not comprehend the risks due to
potential Shariah issues
PLANNING MALAYSIA
Journal of the Malaysia Institute of Planners (2018)
315 © 2018 by MIP
The results from the study suggest that it is permissible, subject to
Shariah conditions, for zakat surplus to be used as an investment in socio-
economic projects including the building of houses for the asnafs. Similarly, it is
permissible, subject to Shariah conditions, for wakaf to be employed in the
provision of affordable housing for the poor and needy. In terms of the type of
housing suitable for development, the interviewees agreed that houses to be
developed for the poor and needy should be modeled after the Government’s
Low-Cost Housing Scheme, with the price capped at about RM40,000.00 per
unit.
However, both the zakat and wakaf authorities do not feel that the
provision of housing for the poor and needy should be accorded the highest
priority. They consider looking after the well-being of the poor and needy
Muslims especially in the provision of daily sustenance, education, religion and
medical and health are more important. In addition, they consider the provision
of housing for the poor and needy are matters to be addressed by the State.
In terms of availability of land for development, zakat has no such
resource but wakaf has a sizeable land bank scattered across the country.
According to Hasan (2008), there was a total of 20,735.61 acres of land registered
as wakaf land, comprising 14,815.787 acres for specific wakaf and 5,919.83 acres
for general wakaf. Wakaf land designated as specific (other than for housing)
cannot be used for housing development unless replaced via Istibdal.
In terms of availability of funding to be used as capital, Ahmad Sarkawi
et al. (2015) believe that zakat authorities could utilize zakat surplus i.e. the
balance after all disbursements made. In contrast to zakat, wakaf is not cash-rich.
However, through initiatives in unlocking the values of wakaf land and effort in
collecting cash wakaf, the potential of wakaf being richer in cash looks promising.
The cash arising therefrom could be expended as capital for housing
development.
However, in terms of expertise, both zakat and wakaf authorities admitted
that their organizations are staffed by non-technically trained personnel.
Therefore, their capability to handle housing development projects is very
limited. In past and on-going projects, they appointed consultants or partnered
with Jabatan Kerja Raya Malaysia (JKR).
The respondents view the idea of zakat and wakaf authorities integrating
their resources as positive. Results from the review of the literature confirmed
that some MAINs have already embarked on such initiatives whereby zakat
authorities build facilities intended to benefit the asnafs on wakaf land (Abdul
Rashid, 2017). In addition, acknowledging their lack of technical expertise as
well as the requirement of a much larger amount of capital injection into mass
low-cost housing projects, these authorities are receptive of working with private
property developers, on condition that the requirements of the Shariah, are not in
any way compromised.
Khairuddin Abdul Rashid, Puteri Nur Farah Naadia Mohd Fauzi, & Sharina Farihah Hasan
Meeting Housing Needs of The Poor and Needy Muslims Through Zakat and Wakaf
© 2018 by MIP 316
On the part of the private property developers, most Muslim developers
are keen to participate in such collaborative working environment. They believe
such an engagement would benefit them in terms of the appropriate profits and
also as means of contribution towards the ummah and Islam. However, the small
and medium-sized private property developers may face difficulties to acquire
the much-needed working capital and bridging finance. Wakaf land could not be
monetized. Banks are reluctant to accept wakaf land as collateral since the
developers or MAINs do not have outright ownership or rights over the land.
In terms of appropriate strategies that could be employed to combat the
identified constraints, topping the list of potential strategies are:
1. Zakat and wakaf authorities should consider collaborating thus,
enhancing their financial and technical capabilities to handle housing
development projects. To this end, further interpretation of the relevant
Shariah rulings on the permissibility of such a collaboration, distribution
of risks and responsibilities, and the resulting incomes are required;
2. Capabilities of the zakat and wakaf authorities could be further enhanced,
in all the key areas, by working in collaboration with credible private
property developers;
3. The zakat and wakaf authorities should consider procuring houses in a
variety of styles to suit their funding and technical capabilities and
demand for houses by the poor and needy Muslims. Demand should be
localized. In this way, small or medium scales procurement could be
undertaken that carry lesser risk such as direct purchases from established
developers or from the secondary market. Procurement of a new
development involving a large amount of funding and other resources are
subjected to a higher level of risk and this style of development should
not become the mainstream approach.
4. Capacity building within the MAINs and strategic change in mindset are
required. The authorities should acknowledge that zakat and wakaf are
powerful tools that could be utilized effectively in uplifting the socio-
economic conditions of the Muslims especially the poor and needy,
including in meeting their housing needs; and
5. Government support via positive policies is needed and this must be
complemented by active R&D to drive the ideas forward.
CONCLUSION
This paper reported on a study assessing the potential of zakat and wakaf in the
provision of affordable housing for the poor and needy. The findings from the
study suggested that zakat and wakaf have such a potential. In addition, the study
identified the availability of key resources and mindset of as among the key
constraints that could impede upon such a potential. To this end, key strategies
that include a call for the zakat and wakat authorities to work in collaboration
PLANNING MALAYSIA
Journal of the Malaysia Institute of Planners (2018)
317 © 2018 by MIP
with credible private property developers thus enhancing their financial and
technical capabilities, and capacity building within the MAINs have been
identified and herein recommended for further consideration.
ACKNOWLEDGEMENT
The study is funded by the Ministry of Higher Education Malaysia:
TRGS/1/2016/UIAM/01/3/1. Project ID: TRGS16-01-001-0001. “A Study into
Procurement and Project delivery System to Empower Wakaf and Zakat in the
Provision of Housing for the Ummah”. In addition to the authors, the following
are also involved with the study: Assoc. Professor Dr. Azila Ahmad Sarkawi and
Assistant Professor Ar. Dr. Srazali Aripin.
_________________________________ i Refer to Program Pembasmian Kemiskinan Bandar (PPKB) Kementerian Kesejahteraa Bandar, Perumahan
Dan Kerajaan Tempatan, online: http://www.kpkt.gov.my/index.php/pages/view/285 accessed 13 November 2017. ii For further discussion on haddul kifayah refer to Manual Pengurusan Agihan Zakat published by Jabatan
Wakaf, Zakat dan Haji, Jabatan Perdana Menteri Malaysia, online: http://intranet.jawhar.gov.my/penerbitan/p_admin/file_upload/manual_pengurusan_agihan_zakat.pdf accessed
10 February 2018. iii Refer to JAWHAR, available online: http://intranet.jawhar.gov.my/spmj/public/index.php accessed 11 November 2017. iv Refer to http://www.zakatselangor.com.my/terkini/fakir-miskin-dapat-bantuan-rumah-lzs-mais/;
http://www.maiamp.gov.my/maiamp2/index.php/zakat/maklumat-bantuan-bina-rumah.html; https://selangorkini.my/2015/12/mais-tiga-tanah-wakaf-bangunkan-projek-perumahan/; all accessed 11
November 2017. v The authors used the Median Multiple (MM) approach, i.e. maximum median house price is 3 times the annual median household income. In their study, they found out that the ratio of housing affordability in 2014
stood at 4.4 which means houses in Malaysia is seriously unaffordable (Cheah Su Ling and Joan Almeida,
2016). vi 3rd Seminar Majma al Fiqh al Islami held on 8-9 Jamadil Akhir 1413H (2-3 December 1992 in Kuwait as
quoted by Azila et al. 2015. vii On wakaf development via government funding in collaboration with financial institution and body corporate, see Anan C. Mohd (2015). Pembangunan Wakaf Menerusi Pendanaan Kerajaan dan Kerjasama
Institusi Kewangan dan Korporat: Hala Tuju, Cabaran dan Harapan. Presentation, Program Muzakarah Wakaf
anjuran JAKIM, Sasana Kijang, Bank Negara Malaysia, 12 November 2015.
REFERENCES Abdul Rashid, K., Ahmad Sarkawi, A., & Hasan, S. F. (2014, August). Development of
a proposed waqaf-zakat-real estate developer joint venture model to address the
issue of affordable housing for the low and middle income Muslim families.
World Conference on Islamic Thought and Civilization (The Rise and Fall of
Civilization: Contemporary States of Muslim affairs), August 18-19, 2014, Ipoh,
Perak,.
Abdul Rashid, K., Hasan, S. F., Ahmad Sarkawi, A., Othman, J., & Aripin, S. (2015a,
June). Preliminary discussion on the potential of zakat-wakaf collaboration in
the provision of housing for the needy Muslims. National Conference on Zakat
and Economic Development 2015. June 1, 2015, Kuantan Pahang.
Abdul Rashid, K., Hasan, S. F., & Ahmad Sarkawi, A. (2015b, November). Assessing the
appropriateness and adequacy of the provision for housing under the haddul-
Khairuddin Abdul Rashid, Puteri Nur Farah Naadia Mohd Fauzi, & Sharina Farihah Hasan
Meeting Housing Needs of The Poor and Needy Muslims Through Zakat and Wakaf
© 2018 by MIP 318
kifayah for asnaf faqr and asnaf miskin. 3rd ASEAN International Conference on
Islamic Finance (AICIF). November 17-19, 2015, Semarang, Indonesia.
Abdul Rashid, K., Hasan, S. F., Mohd Fauzi, P. N. F. N., Ahmad Sarkawi, A., Aripin, S.,
& Mansor, N. S. (2017, April). Permissibility of wakaf in the provision of
affordable housing. International Conference on Business and Social Science
(ICBSS 2017). April 14-15, 2017, Seoul Korea.
Abdul Rashid, K. (2017, September). Sumbangan sektor hartanah wakaf kepada
penyelesaian isu perumahan negara. Seminar Wakaf FSPU UiTM 2017.
September 20, 2017, Shah Alam, Selangor.
Ahmad Sarkawi, A., Abdul Rashid, K., & Hasan, S. F. (2015). Penyediaan tempat tinggal
golongan asnaf menurut skim bantuan agihan zakat: Cadangan pengunaan tanah
wakaf. Jurnal Pengurusan JAWHAR, 9(1).
Anwar, M. (1995). Financing socio-economic development with zakat funds. Journal of
Islamic Economics, 4(1&2), 15-32.
Cheah, S. L., & Almeida, S. J. (2016). Pencerahan terhadap isu rumah mampu milik di
Malaysia. In Bank Negara Malaysia, Laporan Tahunan 2016 (pp. 99-108).
Cheah, S. L., Almeida, S. J., Shukri, M. & Lim, L. S. (2017). Imbalances in the property
market. Bank Negara Malaysia, Quarterly Bulletin, 3rd Quarter 2017, 26-28.
Dahaman, M. A., Hussin, A. M., & Mohd Noor, M. N. (2015, June). Pengembangan dana
Baitulmal Majlis Agama Islam dan Adat Istiadat Melayu Perlis (MAIPs):
Amalan dan cabaran. Persidangan Zakat dalam Pembangunan Ekonomi
Peringkat Kebangsaan 2015. June 1, 2015, Kuantan, Pahang.
Hasan, Z. (2008, June 15). An overview of the effectiveness of the administration of waqf
land in Malaysia. Shariah Law Report, Current Law Journal, 2008. Available at
https://ssrn.com/abstract=2234208.
Kementerian Kesejahteraan Bandar, Perumahan dan Kerajaan Tempatan (2017). Siaran
Media Keputusan Mesyuarat Majlis Perumahan Negara, 2 Mac 2017. Available
at http://www.kpkt.gov.my/index.php/pages/view/508
Khazanah Research Institute [KRI] (2015). Making housing affordable. Kuala Lumpur:
Author.
Lembaga Perumahan & Hartanah Selangor (2018). Rumah Selangorku. Retrieved July 9,
2018 from http://lphs.selangor.gov.my/
Ministry of Housing & Local Government (2018a). Skim perumahan mampu milik
swasta. Retrieved July 9, 2018 from http://ehome.kpkt.gov.my/
Ministry of Housing & Local Government (2018b). Program Perumahan Rakyat (PPR).
Retrieved July 9, 2018 from http://ehome.kpkt.gov.my/
Mohd Ali, S. N., Mohd Noor, A. H., Chuweni, N. N., Ismail, N. R. P., Md Dahlan, F., &
Shari, M. S. A. (2016). Integrating awqaf and zakat: A case study of land
development for the poor in the State Islamic Religious Council Terengganu,
Malaysia. In S. K. Ab. Manan, F. Abd Rahman, & M. Sahri (Eds),
Contemporary issues and development in the global halal industry (pp. 209-
217). (n.p.): Springer.
Perumahan Penjawat Awam Malaysia (2018). PPAM. Retrieved July 9, 2018 from
https://www.ppa1m.gov.my/
PR1MA (2018). PR1MA, rumahku, komunitiku. Retrieved July 9, 2018 from
https://www.pr1ma.my/.

PLANNING MALAYSIA
Journal of the Malaysia Institute of Planners (2018)
319 © 2018 by MIP
RUMAWIP, Kementerian Wilayah (2018). RUMAWIP. Retrieved July 9, 2018 from
https://rumawip.kwp.gov.my/
Saad, R. A. J., Sawandi, N. F., & Mohammad, R. (2016). Zakat surplus funds
management. International Journal of Economics and Financial Issues, 6(7S),
171-176.
SPNB Idaman Sdn. Bhd. (2018). Rumah idaman rakyat. Retrieved July 9, 2018 from
https://www.spnbidaman.com.my/
SPNB Mesra Sdn. Bhd. (2018). Rumah mesra rakyat Malaysia. Retrieved July 9, 2018
from http://www.spnbmesra.com.my/
1Postgraduate at Institute for Environment and Development. Email: [email protected] 320
PLANNING MALAYSIA:
Journal of the Malaysian Institute of Planners
VOLUME 16 ISSUE 3 (2018) Page 320 – 331
IDENTIFICATION OF STRATEGIES FOR URBAN AGRICULTURE
DEVELOPMENT: A SWOT ANALYSIS
Pushpawani Ramaloo1, Chamhuri Siwar2, Choong Yeun Liong3, & Anizan Isahak4
1, 2Institute for Environment and Development
3School of Mathematical Sciences 4School of Environmental Studies and Natural Resource Management
UNIVERSITI KEBANGSAAN MALAYSIA
Abstract
Population growth is the major reason for increased food demands and countries
face difficult challenges in ensuring food security. This study was conducted to
investigate the prospects of urban agriculture (UA) development in Penang state,
Malaysia, from the experts’ perspective, particularly on the strengths,
weaknesses, opportunities and threats (SWOT). Fifty-seven Penang state
stakeholders were interviewed. This study applied qualitative analysis method
using SWOT analysis to identify and prioritize strategies for urban agricultural
development in order to assist planners to manage urban agriculture for achieving
food security in urban areas. Based on the results of the SWOT analysis, strategic
plans for urban agriculture development system were prioritized into legal
framework, financial, infrastructure, land, water, environment and health, social,
marketing, and research and development aspects. Finally, a number of strategies
for sustainable development of urban agriculture were outlined in order to reduce
the weaknesses, avoid the threats, improve the strengths, and grasp the
opportunities for the development of urban agriculture production in the Penang
state.
Keywords: urban agriculture, SWOT analysis, strategic plan, stakeholders,
sustainable development
PLANNING MALAYSIA
Journal of the Malaysia Institute of Planners (2018)
321 © 2018 by MIP
INTRODUCTION
A variation of urban agriculture systems exists globally, depending on local
socio-economic characteristics, populations, geographic, climate and political
conditions. Urban agriculture (UA) and peri-urban agriculture (PUA) focuses on
the production of food and non-food products. Technical UA implicates different
activities for food production such as horticulture, mycoculture, apiculture,
aquaculture, floriculture, and cultivation of plants, tree crop and livestock (de
Bon, Parrot, & Moustier, 2010; Gallaher & Njenga, 2014).
UA has ample potential to yield positive social, economic and
environmental returns for cities and their citizens and has been noted and received
attention from city planners, policymakers, and scholars (Mougeot, 2005;
Colasanti, Hamm, & Litjens, 2012; Drake & Lawson, 2015). A survey of UA
practices across the globe indicates that factors like urban ecosystems remain
connected to urban planning, design, and management for resilience (Scarlett &
Boyd, 2013), urban landscape (Saha & Eckelman, 2017), land use preferences
(Lovell, 2010), water management practices (Cohen & Reynolds, 2015),
innovative forms of green urban architecture practices (Specht et al., 2014),
quality of governance (Walker, 2015), legal-technical, policies, bureaucratic rules
and procedures (Mendes, 2008), and are highly supportive for sustainable
development of UA. A strong policy is needed to feed the entire world population,
to guaranteeing the protection and preservation of natural resources for future
generations to achieve sustainability. Therefore, implementation of any policy
should be supported and shared by the relevant agencies, urban farmers, urban
dwellers, community and society, so that maximum impacts and relevance will
be achieved.
Urban and peri-urban agriculture (UPA) in Malaysia play an important
role as part of the supply chain of cheap food within the country and in managing
urban and peri-urban open space (Ramaloo & Siwar, 2016). This also includes
related activities such as production, processing and marketing of products to
supplier or for direct sale. The scale of UPA in Malaysia is determined by the
land availability and its size, water availability, climate factor, labour, skills,
legislative support, and finance.
UPA in Penang state is an activity that covers crop and livestock
production and is practiced under different circumstances. UPA in Penang state
is practiced by school children, community residents, senior citizens, private and
public employees, individuals, and commercial urban farmers. UPA in Penang
can contribute to the urban populace in a situation of drastic urban development,
high oil prices, and expensive raw commodity prices. The main benefit of urban
farming is for the poor to grow their own food on plots in urban areas, thus,
increasing access to indispensable food, and they can also sell the surplus beyond
their consumption to the urban market.
Pushpawani Ramaloo, Chamhuri Siwar, Choong-Yeun Liong, & Anizan Isahak
Identification of Strategies for Urban Agriculture Development: A SWOT Analysis
© 2018 by MIP 322
The aim of this study is to examine in depth the existence of UA
development in Penang as well as to assist in the formulation of strategies for UA
development for policy makers and planners. This study identifies internal and
external factors of urban agriculture development. The SWOT analysis of internal
factors can be classified as strengths (S) or weaknesses (W), and external factors
can be classified as opportunities (O) or threats (T).
RESEARCH BACKGROUND
Study Area
This study was conducted in the Penang state, located on the northwest coast of
Peninsular Malaysia, by the Strait of Malacca. It has two separate areas, namely
the Penang Island and Seberang Perai (formerly known as Province Wellesley)
on the mainland. Penang has five administrative districts, namely the North-East
district (Daerah Timur Laut) and South-West district (Daerah Barat Daya) on
the Penang Island; and the North Seberang Perai district (Daerah Seberang Perai
Utara), Central Seberang Perai district (Daerah Seberang Perai Tengah) and
South Seberang Perai district (Daerah Seberang Perai Selatan) in Seberang
Perai. Penang has a land area of 1,030 square kilometres (Department of Statistics
Malaysia, 2011). Small and larger scale agriculture in Penang state are included
in the category of urban and suburban agriculture. The land in Penang is
considered among the best farming land suitable for all types of crop production.
Penang farmers practice crops production (staples, vegetables, fruit, and herbs),
staples and cash-crops production, mixed farming production (crops and
livestock), vegetable production, fruit production, plant/flowers production, and
herbs plants production (Ramaloo, Siwar, & Isahak, 2017).
SWOT Analysis
A SWOT (Strengths - Weaknesses - Opportunities - Threats) analysis is a method
used to assist in identifying strategic directions for an organization. In the early
1960s, the Harvard Business School Faculty developed the SWOT organizing
framework of matching an organization’s internal factors (resources, capabilities,
and limitations) with its external environment as a first step in the process of
strategy development (Hill & Westbrook, 1997) and its relation in making
decision (Shrestha, Alavapati, & Kalmbacher, 2004). The SWOT analysis is a
strategic planning tool concerned with the analysis of an organization’s internal
and external environments (Salmi, Ahmed, & Hasnan, 2015; David, David, &
David, 2016). This analysis compares strengths and weaknesses (the resources)
of an organization to opportunities involved in the growth and improvement of
an organization and examines the external threats generated by its environment
(Valentin, 2005; Ommani, 2011). SWOT analysis is typically carried out in the
form of a group meeting with common themes or interactions (Brooks, Heffner,
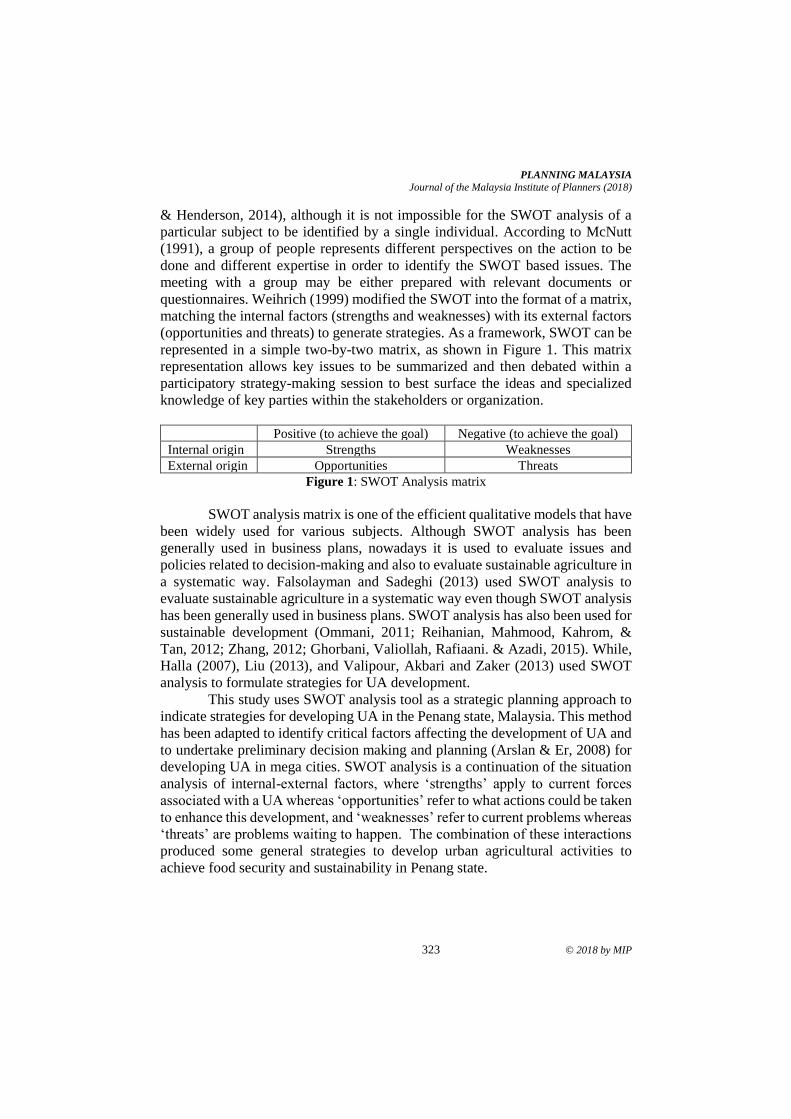
PLANNING MALAYSIA
Journal of the Malaysia Institute of Planners (2018)
323 © 2018 by MIP
& Henderson, 2014), although it is not impossible for the SWOT analysis of a
particular subject to be identified by a single individual. According to McNutt
(1991), a group of people represents different perspectives on the action to be
done and different expertise in order to identify the SWOT based issues. The
meeting with a group may be either prepared with relevant documents or
questionnaires. Weihrich (1999) modified the SWOT into the format of a matrix,
matching the internal factors (strengths and weaknesses) with its external factors
(opportunities and threats) to generate strategies. As a framework, SWOT can be
represented in a simple two-by-two matrix, as shown in Figure 1. This matrix
representation allows key issues to be summarized and then debated within a
participatory strategy-making session to best surface the ideas and specialized
knowledge of key parties within the stakeholders or organization.
Positive (to achieve the goal) Negative (to achieve the goal)
Internal origin Strengths Weaknesses
External origin Opportunities Threats
Figure 1: SWOT Analysis matrix
SWOT analysis matrix is one of the efficient qualitative models that have
been widely used for various subjects. Although SWOT analysis has been
generally used in business plans, nowadays it is used to evaluate issues and
policies related to decision-making and also to evaluate sustainable agriculture in
a systematic way. Falsolayman and Sadeghi (2013) used SWOT analysis to
evaluate sustainable agriculture in a systematic way even though SWOT analysis
has been generally used in business plans. SWOT analysis has also been used for
sustainable development (Ommani, 2011; Reihanian, Mahmood, Kahrom, &
Tan, 2012; Zhang, 2012; Ghorbani, Valiollah, Rafiaani. & Azadi, 2015). While,
Halla (2007), Liu (2013), and Valipour, Akbari and Zaker (2013) used SWOT
analysis to formulate strategies for UA development.
This study uses SWOT analysis tool as a strategic planning approach to
indicate strategies for developing UA in the Penang state, Malaysia. This method
has been adapted to identify critical factors affecting the development of UA and
to undertake preliminary decision making and planning (Arslan & Er, 2008) for
developing UA in mega cities. SWOT analysis is a continuation of the situation
analysis of internal-external factors, where ‘strengths’ apply to current forces
associated with a UA whereas ‘opportunities’ refer to what actions could be taken
to enhance this development, and ‘weaknesses’ refer to current problems whereas
‘threats’ are problems waiting to happen. The combination of these interactions
produced some general strategies to develop urban agricultural activities to
achieve food security and sustainability in Penang state.
Pushpawani Ramaloo, Chamhuri Siwar, Choong-Yeun Liong, & Anizan Isahak
Identification of Strategies for Urban Agriculture Development: A SWOT Analysis
© 2018 by MIP 324
Data Preparation and Analysis
This research is a qualitative study. To conduct the SWOT analysis, face to face
semi-structured interviews with different stakeholder groups were carried out.
Expert interviews were considered as an efficient method of gathering data,
especially in exploratory phase of a project (Bogner, Littig, & Menz, 2009). An
expert group workshop and personal interviews were held amongst 57 member
participants of urban farmers, agriculture stakeholders, municipal city
stakeholders and university academic members (Table 1).
Table 1: Basic data of the participants
Number Type of Participant Number of Participants
1 Urban Farmers 40
2 Agriculture Stakeholders 12
3 Municipal City Stakeholders 2
4 University Academic Members 3
In order to explore different aspects of the experts’ views, experiences
and perspectives on developing UA, the interview questionnaire mainly consists
of open-ended questions. Interview sessions were held in each district of the
Penang state and covered topics and questions related to UA policies, research,
marketing, opportunities, challenges and future prospects. The SWOT analysis
does not require any special tool to make the questionnaire or calculate the data
collected from the stakeholders. The most important part of this analysis were
open interviews and focus groups to find the strengths, weaknesses, opportunities
and threats, and finally develop a strategic plan for UA development.
RESULTS
Based on the observations and data from Penang stakeholders, the SWOT factors
were mapped one by one. Table 2 shows the list of strengths, weaknesses,
opportunities, and threats in the SWOT analysis of Penang stakeholders. The
authors outlined SWOT matrix that was based on the identification and
categorization of major UA issues within each cell of the matrix.
A lot of interesting facts about UA issues were found, which can be
classified in each of the SWOT components. SWOT analysis itself actually
includes two factors: internal factors (strengths and weaknesses) and external
factors (opportunities and threats). Internal factors are factors which influence is
wholly derived from the study object, in this case urban agriculture development
in Penang state itself can bring a positive influence (strength) and can also bring
a negative influence (weakness). Meanwhile, external factors are factors that
originate outside of development of the UA but from nature, the environment,
and the influence of other outsiders. The SWOT analysis has been useful in
deciding the concept strategy accurately.
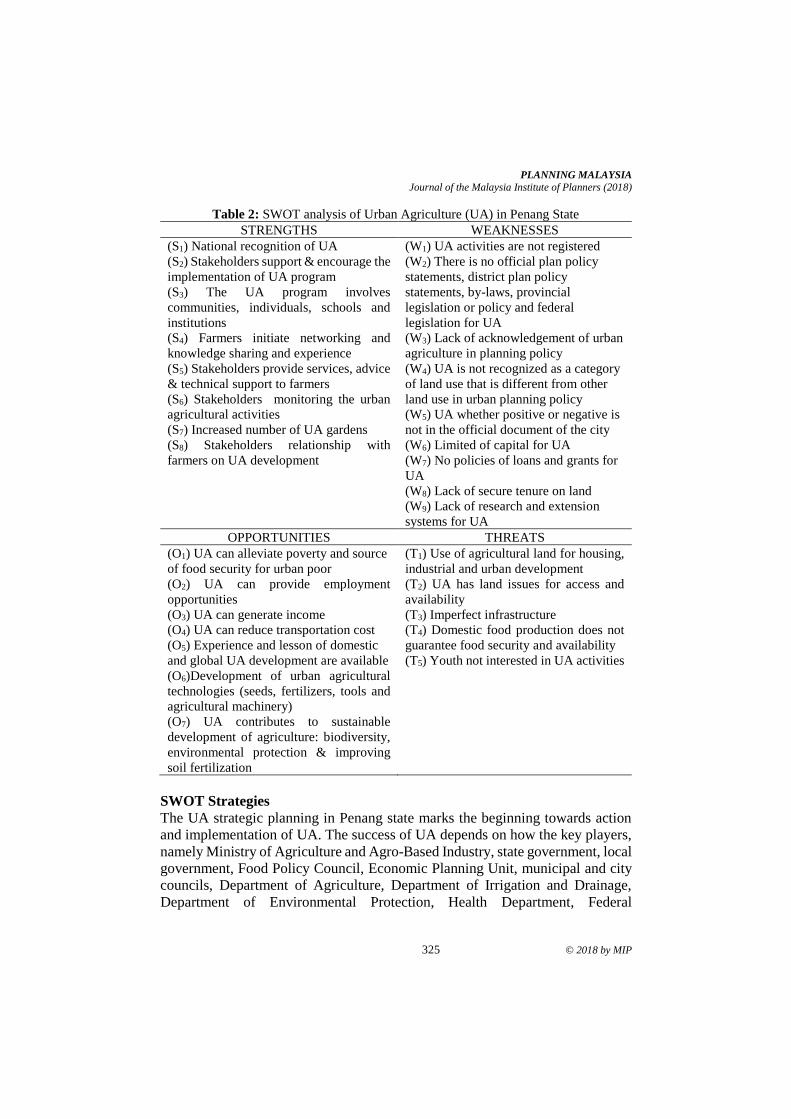
PLANNING MALAYSIA
Journal of the Malaysia Institute of Planners (2018)
325 © 2018 by MIP
Table 2: SWOT analysis of Urban Agriculture (UA) in Penang State
STRENGTHS WEAKNESSES
(S1) National recognition of UA
(S2) Stakeholders support & encourage the
implementation of UA program
(S3) The UA program involves
communities, individuals, schools and
institutions
(S4) Farmers initiate networking and
knowledge sharing and experience
(S5) Stakeholders provide services, advice
& technical support to farmers
(S6) Stakeholders monitoring the urban
agricultural activities
(S7) Increased number of UA gardens
(S8) Stakeholders relationship with
farmers on UA development
(W1) UA activities are not registered
(W2) There is no official plan policy
statements, district plan policy
statements, by-laws, provincial
legislation or policy and federal
legislation for UA
(W3) Lack of acknowledgement of urban
agriculture in planning policy
(W4) UA is not recognized as a category
of land use that is different from other
land use in urban planning policy
(W5) UA whether positive or negative is
not in the official document of the city
(W6) Limited of capital for UA
(W7) No policies of loans and grants for
UA
(W8) Lack of secure tenure on land
(W9) Lack of research and extension
systems for UA
OPPORTUNITIES THREATS
(O1) UA can alleviate poverty and source
of food security for urban poor
(O2) UA can provide employment
opportunities
(O3) UA can generate income
(O4) UA can reduce transportation cost
(O5) Experience and lesson of domestic
and global UA development are available
(O6)Development of urban agricultural
technologies (seeds, fertilizers, tools and
agricultural machinery)
(O7) UA contributes to sustainable
development of agriculture: biodiversity,
environmental protection & improving
soil fertilization
(T1) Use of agricultural land for housing,
industrial and urban development
(T2) UA has land issues for access and
availability
(T3) Imperfect infrastructure
(T4) Domestic food production does not
guarantee food security and availability
(T5) Youth not interested in UA activities
SWOT Strategies
The UA strategic planning in Penang state marks the beginning towards action
and implementation of UA. The success of UA depends on how the key players,
namely Ministry of Agriculture and Agro-Based Industry, state government, local
government, Food Policy Council, Economic Planning Unit, municipal and city
councils, Department of Agriculture, Department of Irrigation and Drainage,
Department of Environmental Protection, Health Department, Federal
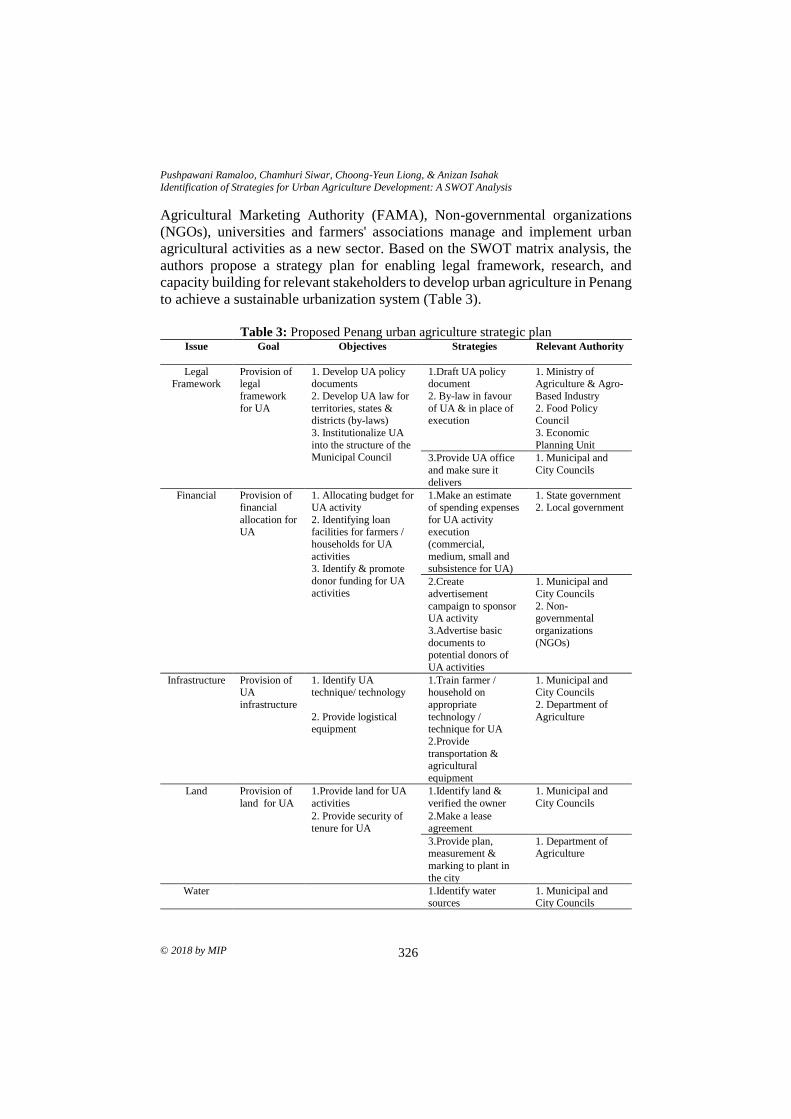
Pushpawani Ramaloo, Chamhuri Siwar, Choong-Yeun Liong, & Anizan Isahak
Identification of Strategies for Urban Agriculture Development: A SWOT Analysis
© 2018 by MIP 326
Agricultural Marketing Authority (FAMA), Non-governmental organizations
(NGOs), universities and farmers' associations manage and implement urban
agricultural activities as a new sector. Based on the SWOT matrix analysis, the
authors propose a strategy plan for enabling legal framework, research, and
capacity building for relevant stakeholders to develop urban agriculture in Penang
to achieve a sustainable urbanization system (Table 3).
Table 3: Proposed Penang urban agriculture strategic plan
Issue Goal Objectives Strategies
Relevant Authority
Legal Framework
Provision of legal
framework
for UA
1. Develop UA policy documents
2. Develop UA law for
territories, states & districts (by-laws)
3. Institutionalize UA
into the structure of the Municipal Council
1.Draft UA policy document
2. By-law in favour
of UA & in place of execution
1. Ministry of Agriculture & Agro-
Based Industry
2. Food Policy Council
3. Economic
Planning Unit
3.Provide UA office
and make sure it
delivers
1. Municipal and
City Councils
Financial
Provision of financial
allocation for
UA
1. Allocating budget for UA activity
2. Identifying loan
facilities for farmers /
households for UA
activities 3. Identify & promote
donor funding for UA
activities
1.Make an estimate of spending expenses
for UA activity
execution
(commercial,
medium, small and subsistence for UA)
1. State government 2. Local government
2.Create
advertisement
campaign to sponsor UA activity
3.Advertise basic
documents to potential donors of
UA activities
1. Municipal and
City Councils
2. Non-governmental
organizations
(NGOs)
Infrastructure Provision of UA
infrastructure
1. Identify UA technique/ technology
2. Provide logistical equipment
1.Train farmer / household on
appropriate
technology / technique for UA
2.Provide
transportation & agricultural
equipment
1. Municipal and City Councils
2. Department of
Agriculture
Land Provision of
land for UA
1.Provide land for UA
activities
1.Identify land &
verified the owner
1. Municipal and
City Councils
2. Provide security of
tenure for UA
2.Make a lease
agreement
3.Provide plan, measurement &
marking to plant in
the city
1. Department of Agriculture
Water 1.Identify water sources
1. Municipal and City Councils
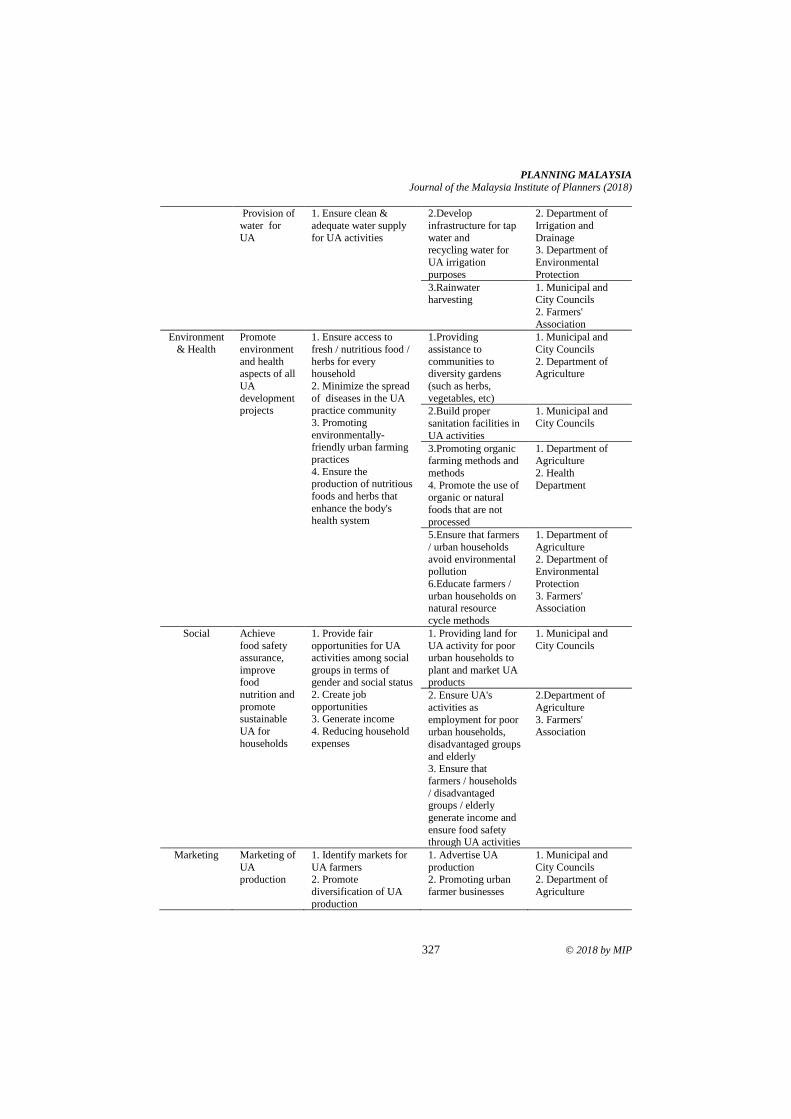
PLANNING MALAYSIA
Journal of the Malaysia Institute of Planners (2018)
327 © 2018 by MIP
Provision of
water for
UA
1. Ensure clean &
adequate water supply
for UA activities
2.Develop
infrastructure for tap
water and recycling water for
UA irrigation
purposes
2. Department of
Irrigation and
Drainage 3. Department of
Environmental
Protection
3.Rainwater harvesting
1. Municipal and City Councils
2. Farmers'
Association
Environment
& Health
Promote
environment
and health aspects of all
UA
development projects
1. Ensure access to
fresh / nutritious food /
herbs for every household
2. Minimize the spread
of diseases in the UA practice community
3. Promoting
environmentally-friendly urban farming
practices
4. Ensure the production of nutritious
foods and herbs that
enhance the body's health system
1.Providing
assistance to
communities to diversity gardens
(such as herbs,
vegetables, etc)
1. Municipal and
City Councils
2. Department of Agriculture
2.Build proper
sanitation facilities in
UA activities
1. Municipal and
City Councils
3.Promoting organic farming methods and
methods
4. Promote the use of organic or natural
foods that are not
processed
1. Department of Agriculture
2. Health
Department
5.Ensure that farmers
/ urban households
avoid environmental pollution
6.Educate farmers /
urban households on natural resource
cycle methods
1. Department of
Agriculture
2. Department of Environmental
Protection
3. Farmers' Association
Social Achieve
food safety assurance,
improve food
nutrition and
promote sustainable
UA for
households
1. Provide fair
opportunities for UA activities among social
groups in terms of gender and social status
2. Create job
opportunities 3. Generate income
4. Reducing household
expenses
1. Providing land for
UA activity for poor urban households to
plant and market UA products
1. Municipal and
City Councils
2. Ensure UA's
activities as
employment for poor urban households,
disadvantaged groups
and elderly 3. Ensure that
farmers / households
/ disadvantaged groups / elderly
generate income and
ensure food safety through UA activities
2.Department of
Agriculture
3. Farmers' Association
Marketing Marketing of
UA production
1. Identify markets for
UA farmers 2. Promote
diversification of UA
production
1. Advertise UA
production 2. Promoting urban
farmer businesses
1. Municipal and
City Councils 2. Department of
Agriculture
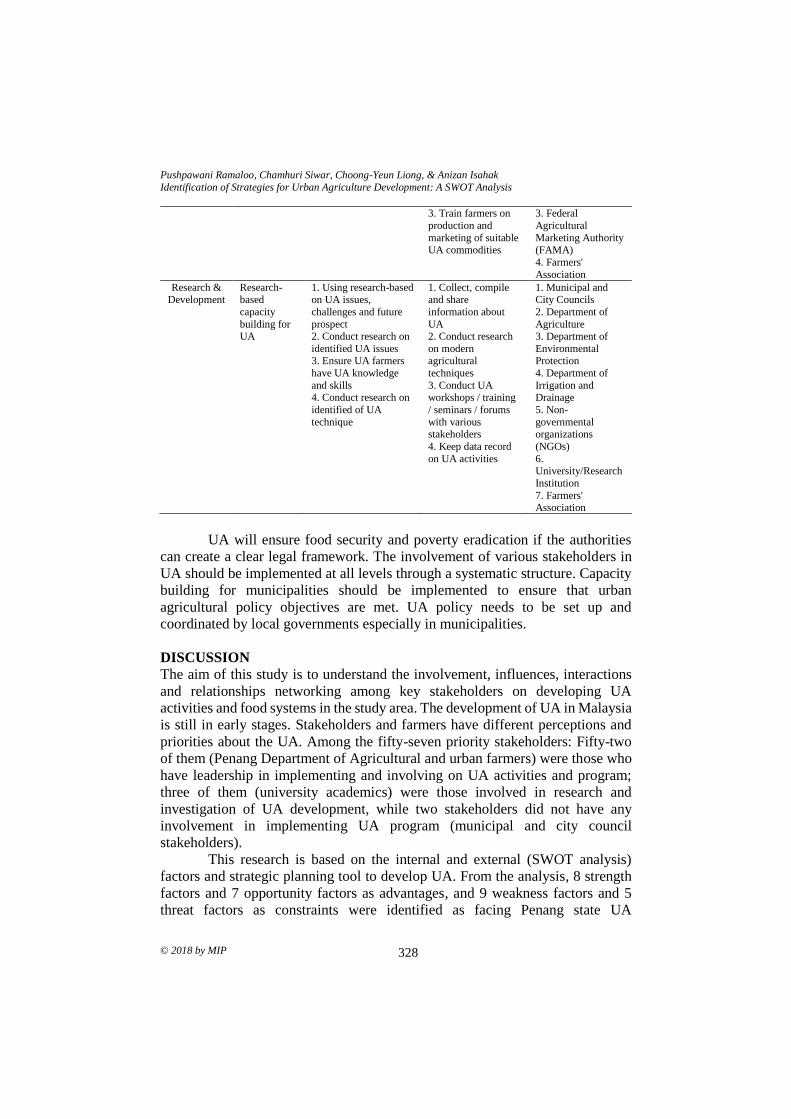
Pushpawani Ramaloo, Chamhuri Siwar, Choong-Yeun Liong, & Anizan Isahak
Identification of Strategies for Urban Agriculture Development: A SWOT Analysis
© 2018 by MIP 328
3. Train farmers on
production and
marketing of suitable UA commodities
3. Federal
Agricultural
Marketing Authority (FAMA)
4. Farmers'
Association
Research & Development
Research-based
capacity
building for UA
1. Using research-based on UA issues,
challenges and future
prospect 2. Conduct research on
identified UA issues 3. Ensure UA farmers
have UA knowledge
and skills 4. Conduct research on
identified of UA
technique
1. Collect, compile and share
information about
UA 2. Conduct research
on modern agricultural
techniques
3. Conduct UA workshops / training
/ seminars / forums
with various stakeholders
4. Keep data record
on UA activities
1. Municipal and City Councils
2. Department of
Agriculture 3. Department of
Environmental Protection
4. Department of
Irrigation and Drainage
5. Non-
governmental organizations
(NGOs)
6. University/Research
Institution
7. Farmers' Association
UA will ensure food security and poverty eradication if the authorities
can create a clear legal framework. The involvement of various stakeholders in
UA should be implemented at all levels through a systematic structure. Capacity
building for municipalities should be implemented to ensure that urban
agricultural policy objectives are met. UA policy needs to be set up and
coordinated by local governments especially in municipalities.
DISCUSSION
The aim of this study is to understand the involvement, influences, interactions
and relationships networking among key stakeholders on developing UA
activities and food systems in the study area. The development of UA in Malaysia
is still in early stages. Stakeholders and farmers have different perceptions and
priorities about the UA. Among the fifty-seven priority stakeholders: Fifty-two
of them (Penang Department of Agricultural and urban farmers) were those who
have leadership in implementing and involving on UA activities and program;
three of them (university academics) were those involved in research and
investigation of UA development, while two stakeholders did not have any
involvement in implementing UA program (municipal and city council
stakeholders).
This research is based on the internal and external (SWOT analysis)
factors and strategic planning tool to develop UA. From the analysis, 8 strength
factors and 7 opportunity factors as advantages, and 9 weakness factors and 5
threat factors as constraints were identified as facing Penang state UA
PLANNING MALAYSIA
Journal of the Malaysia Institute of Planners (2018)
329 © 2018 by MIP
development. From the results of SWOT analysis, strategic plans for UA
development system was proposed to include legal framework, financial,
infrastructure, land, water, environment and health, social, marketing, and
research and development.
CONCLUSION
UA is an important component of sustainable development. Our findings support
local planning practitioners in filling regulatory gaps, and practices of urban
agriculture, and in seeking to promote UA in order to achieve food security in
urban areas in the near future. These require a system that makes use of
stakeholders’ integrated role in order to implement the UA strategic plan for
Malaysia. In the planning and implementation of integrated UA systems the
policymakers and planners plays a key role in the recognition of benefits and
other elements that contribute towards the sustainability of the UA system.
ACKNOWLEDGEMENT
The authors are grateful to Universiti Kebangsaan Malaysia for providing funding
under the Arus Perdana (AP 2014-017) and Geran Universiti Penyelidikan
(GUP-2017-043) in support of this research project.
REFERENCES
Arslan, O., & Er, I. D. (2008). SWOT analysis for safer carriage of bulk liquid chemicals
in tankers. Journal of Hazardous Materials, 154, 901-913.
Bogner, A., Littig, B., & Menz, W. (2009). Introduction: Expert interviews - An
introduction to a new methodological debate. In A. Bogner, B. Littig, and W.
Menz, (Eds.), Interviewing experts (pp. 1-13). Basingstoke: Palgrave
Macmillan.
Brooks, G., Heffner, A. & Henderson, D. (2014). A SWOT analysis of competitive
knowledge from social media for a small start-up business. Review of Business
Information Systems, 18(1), 23-34.
Cohen, N., & Reynolds, K. (2015). Resource needs for a socially just and sustainable
urban agriculture system: Lessons from New York City. Renewable Agriculture
and Food Systems, 30(1), 103-114.
Colasanti, K. J. A., Hamm, M. W., & Litjens, C. M. (2012). The city as an ‘agricultural
powerhouse’? Perspectives on expanding urban agriculture from Detroit,
Michigan. Urban Geography, 33(3), 348-369.
David, M. E., David, F. R., & David, F. R. (2016). The quantitative strategic planning
matrix (QSPM): A new marketing tool. Journal of Strategic Marketing, 1-11.
De Bon, H., Parrot, L., & Moustier, P. (2010). Sustainable urban agriculture in developing
countries: A review. Agronomy for sustainable development, 30(1), 21-32.
Department of Statistics Malaysia (2011). Pulau Pinang @ a Glance. Available at
https://www.statistics.gov.my/.
Pushpawani Ramaloo, Chamhuri Siwar, Choong-Yeun Liong, & Anizan Isahak
Identification of Strategies for Urban Agriculture Development: A SWOT Analysis
© 2018 by MIP 330
Drake, L., & Lawson, L. (2015). Results of a US and Canada community garden survey:
Shared challenges in garden management amid diverse geographical and
organizational contexts. Agriculture Human Values, 32(2), 241-254.
Falsolayman, M., & Sadeghi, H. (2013). An analysis on capabilities of agricultural sector
of Southern Khorasan to have a sustainable development managed by the
application SWOT model. Iranian Journal Geography and Development,
11(30), 139-156.
Gallaher, C., & Njenga, M. (2014). Urban agriculture. In P. Thompson, D. Kaplan (Eds.),
Encyclopedia of food and agricultural ethics (pp. 1775-82). Dordrecht: Springer
Netherlands.
Ghorbani, A., Valiollah, R., Rafiaani. P., & Azadi, H. (2015). Ecotourism sustainable
development strategies using SWOT and QSPM model: A case study of Kaji
Namakzar Wetland, South Khorasan province, Iran. Tourism Management
Perspectives, 16, 290-297.
Halla, F. (2007). A SWOT analysis of strategic urban development planning: The case of
Dar es Salaam city in Tanzania. Habitat International, 31(1), 130-142.
Hill, T. & Westbrook, R. (1997). SWOT analysis: It’s time for a product recall. Long
Range Planning, 30(1), 46-52.
Liu, Q. (2013). Development of urban agriculture in Xixian new area. Asian Agricultural
Research, 5(8), 23-27.
Lovell, S. T. (2010). Multifunctional urban agriculture for sustainable land use planning
in the United States. Sustainability, 2(8), 2499-2522.
McNutt, K. (1991). SWOT before you start. Nutrition Today, 26(1), 48-51.
Mendes, W. (2008). Implementing social and environmental policies in cities: The case
of food policy in Vancouver, Canada. International Journal of Urban and
Regional Research, 32(4), 942-967.
Mougeot, L. (2005). Agropolis: The social, political, and environmental dimensions of
urban agriculture. Earthscan: London.
Ommani, A. R. (2011). Strengths, weaknesses, opportunities and threats (SWOT)
analysis for farming system businesses management. African Journal of
Business Management, 5(22), 9448-9454.
Ramaloo, P., Siwar, C. & Isahak, A. (2017). Typologies and constraints of urban
agriculture development in Penang, Malaysia. In N. Tiraieyari, A. A. Samah, &
G. N. Mclean (Eds.), Urban farming in Malaysia: Improving food security while
greening the environment. Serdang: Universiti Putra Malaysia Publication.
Ramaloo, P. & Siwar, C. (2016). Status of urban and peri urban agriculture in Malaysia:
Implications for developing countries. Proceedings Asia Institute of Technology
(AIT): Urban and Peri-Urban Agriculture in Asia. Bangkok, Thailand.
Reihanian, A., Mahmood, N. Z., Kahrom, E., & Tan, W. H. (2012). Sustainable tourism
development strategy by SWOT analysis: Boujagh National Park, Iran. Tourism
Management Perspectives, 4, 223-228.
Saha, M., & Eckelman, M. J. (2017). Growing fresh fruits and vegetables in an urban
land-scape: a geospatial assessment of ground level and rooftop urban
agriculture potential in Boston, USA. Landscape and Urban Planning, 165, 130-
141.
PLANNING MALAYSIA
Journal of the Malaysia Institute of Planners (2018)
331 © 2018 by MIP
Salmi, A., Ahmed, M. N. & Hasnan, N. (2015). SWOT and TOWS matrix e-government
analysis review on Sultanate of Oman. International Journal of Learning and
Development, 5(4), 13-23.
Scarlett, L., & Boyd, J. (2013). Ecosystem services and resource management:
institutional issues, challenges, and opportunities in the public sector. Ecological
Economics, 115, 3-10.
Shrestha, R. K., Alavapati, J. R. R. & Kalmbacher, R. S. (2004). Exploring the potential
for silvopasture adoption in south-central Florida: An application of SWOT–
AHP method. Agricultural Systems, 81(3), 185-199.
Specht, K., Siebert, R., Hartmann, I., Freisinger, U. B., Sawicka, M., Werner, A.,…&
Dierich, A. (2014). Urban agriculture of the future: An overview of
sustainability aspects of food production in and on buildings. Agriculture and
Human Values, 31, 33-51.
Valentin, E. K. (2005). Away with SWOT analysis: Use defensive/offensive evaluation
instead. The Journal of Applied Business Research, 21(2), 91-105.
Valipour, S., Akbari, M. R., & Zaker, H. K. (2013). Strategic planning for urban
agriculture development by SWOT (Case Study: Dogonbadan city of
Gachsaran). Urban Management, 5(15), 45-57.
Walker, S. (2015). Urban agriculture and the sustainability fix in Vancouver and Detroit.
Urban Geography, 37(2), 163-182.
Weihrich, H. (1999). Analyzing the competitive advantages and disadvantages of
Germany with the TOWS Matrix ‐ An alternative to Porter’s Model. European
Business Review, 99(1), 9-22.
Zhang, X. (2012). Research on the development strategies of rural tourism in Suzhou
based on SWOT analysis. Energy Procedia, 16, 1295-1299.
1Professor at International Islamic University Malaysia. Email: [email protected] 332
PLANNING MALAYSIA:
Journal of the Malaysian Institute of Planners
VOLUME 16 ISSUE 3 (2018) Page 332 – 343
HISTORIC BUILDING INFORMATION MODELLING (HBIM) FOR
MALAYSIAN CONSTRUCTION INDUSTRY
Maisarah Ali1, Kamsiah Mohd Ismail2, Khairusy Syakirin Has-Yun
Hashim3, Saifulnizam Suhaimi4, & Muhammad Hadi Mustafa5
2,3,4,5Kuliyyah of Architecture and Environmental Design
1Kuliyyah of Engineering
INTERNATIONAL ISLAMIC UNIVERSITY MALAYSIA
Abstract
The Historic Building Information Modelling (HBIM) is widely accepted and
practiced all over the world. However, the adoption of HBIM within Malaysian
construction industry is relatively low and slow because it demands new skill sets
such as 3D modelling expertise, understanding of the approach, a lot of
collaboration and it forces industry players to relate to each other differently. It is
psychologically a very healthy environment, but not necessarily an easy
transition. Since our cultural heritage buildings are limited, it is crucial for us to
take care of it. Loss of information, insufficient documentation, poor
maintenance, lack of technology adaptation, and reports reliability are among
common problems the industry are facing. This paper review the attributes of
HBIM based on literature, and its benefits, processes, tools, and challenges are
highlighted. From this study, HBIM shows significant attributes that can
contribute in providing a better understanding in handling historical buildings,
besides allowing enhanced communication and documentation.
Keywords: Historic Building Information Modelling, attributes, benefits,
challenges, Malaysia
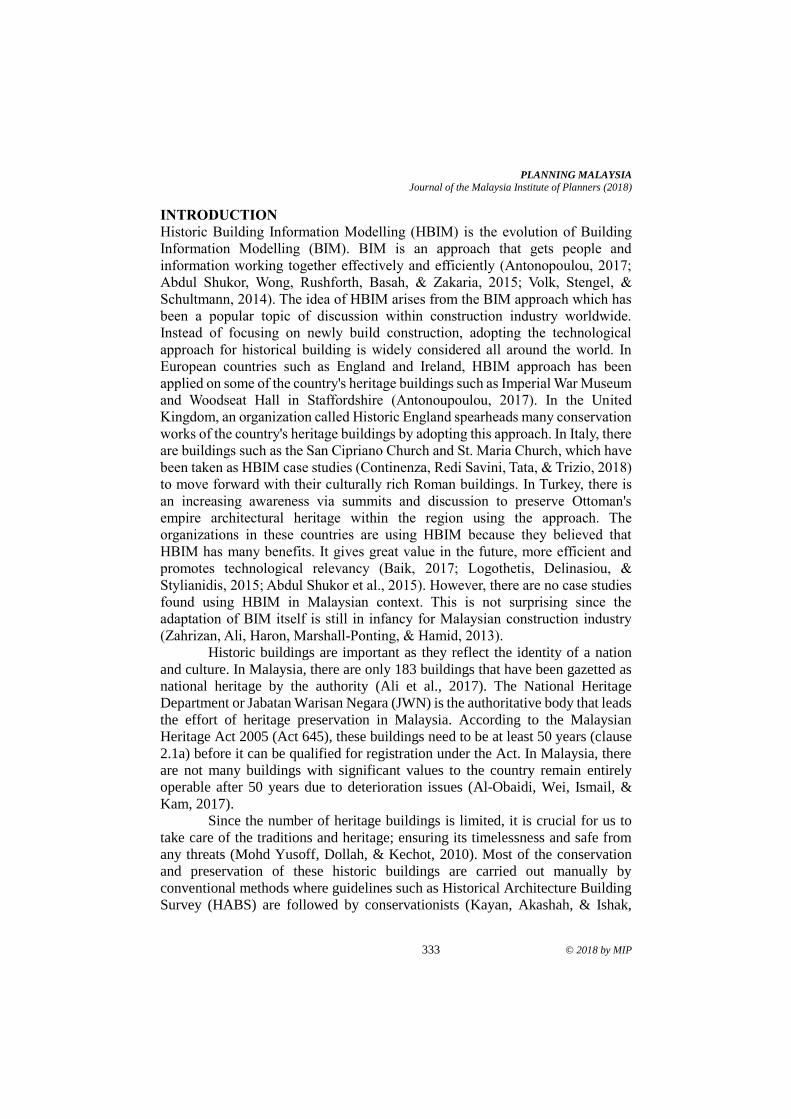
PLANNING MALAYSIA
Journal of the Malaysia Institute of Planners (2018)
333 © 2018 by MIP
INTRODUCTION
Historic Building Information Modelling (HBIM) is the evolution of Building
Information Modelling (BIM). BIM is an approach that gets people and
information working together effectively and efficiently (Antonopoulou, 2017;
Abdul Shukor, Wong, Rushforth, Basah, & Zakaria, 2015; Volk, Stengel, &
Schultmann, 2014). The idea of HBIM arises from the BIM approach which has
been a popular topic of discussion within construction industry worldwide.
Instead of focusing on newly build construction, adopting the technological
approach for historical building is widely considered all around the world. In
European countries such as England and Ireland, HBIM approach has been
applied on some of the country's heritage buildings such as Imperial War Museum
and Woodseat Hall in Staffordshire (Antonoupoulou, 2017). In the United
Kingdom, an organization called Historic England spearheads many conservation
works of the country's heritage buildings by adopting this approach. In Italy, there
are buildings such as the San Cipriano Church and St. Maria Church, which have
been taken as HBIM case studies (Continenza, Redi Savini, Tata, & Trizio, 2018)
to move forward with their culturally rich Roman buildings. In Turkey, there is
an increasing awareness via summits and discussion to preserve Ottoman's
empire architectural heritage within the region using the approach. The
organizations in these countries are using HBIM because they believed that
HBIM has many benefits. It gives great value in the future, more efficient and
promotes technological relevancy (Baik, 2017; Logothetis, Delinasiou, &
Stylianidis, 2015; Abdul Shukor et al., 2015). However, there are no case studies
found using HBIM in Malaysian context. This is not surprising since the
adaptation of BIM itself is still in infancy for Malaysian construction industry
(Zahrizan, Ali, Haron, Marshall-Ponting, & Hamid, 2013).
Historic buildings are important as they reflect the identity of a nation
and culture. In Malaysia, there are only 183 buildings that have been gazetted as
national heritage by the authority (Ali et al., 2017). The National Heritage
Department or Jabatan Warisan Negara (JWN) is the authoritative body that leads
the effort of heritage preservation in Malaysia. According to the Malaysian
Heritage Act 2005 (Act 645), these buildings need to be at least 50 years (clause
2.1a) before it can be qualified for registration under the Act. In Malaysia, there
are not many buildings with significant values to the country remain entirely
operable after 50 years due to deterioration issues (Al-Obaidi, Wei, Ismail, &
Kam, 2017).
Since the number of heritage buildings is limited, it is crucial for us to
take care of the traditions and heritage; ensuring its timelessness and safe from
any threats (Mohd Yusoff, Dollah, & Kechot, 2010). Most of the conservation
and preservation of these historic buildings are carried out manually by
conventional methods where guidelines such as Historical Architecture Building
Survey (HABS) are followed by conservationists (Kayan, Akashah, & Ishak,
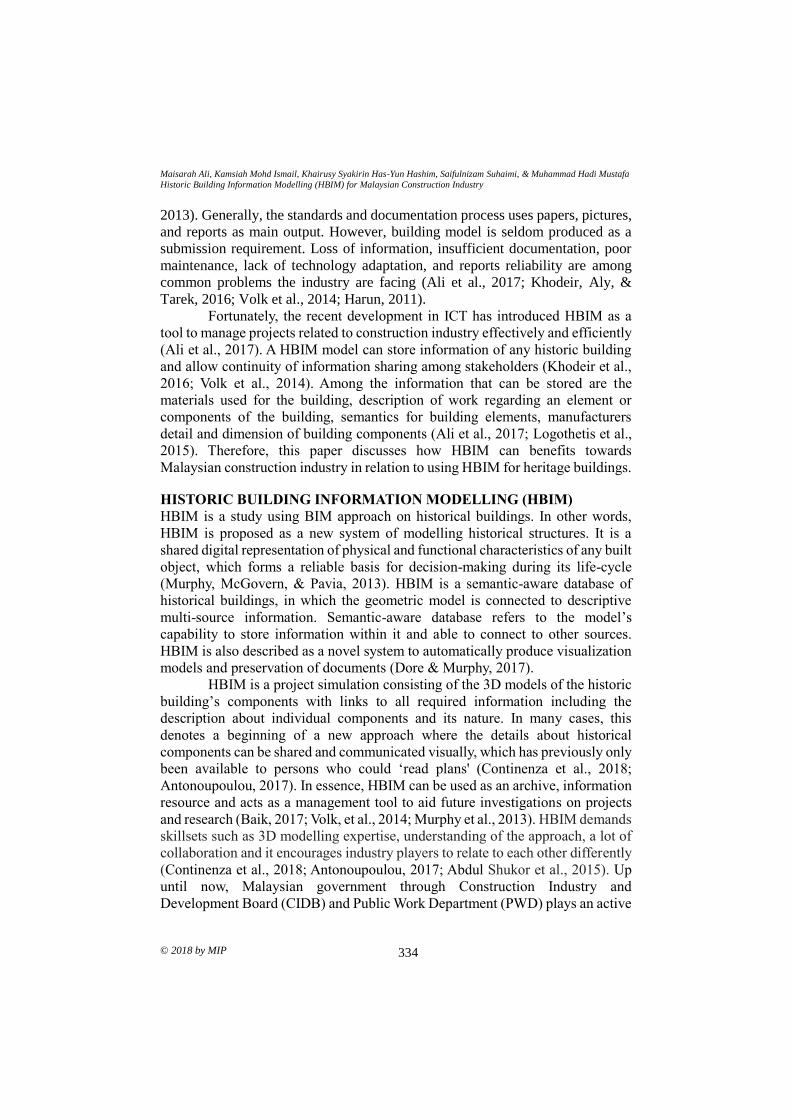
Maisarah Ali, Kamsiah Mohd Ismail, Khairusy Syakirin Has-Yun Hashim, Saifulnizam Suhaimi, & Muhammad Hadi Mustafa
Historic Building Information Modelling (HBIM) for Malaysian Construction Industry
© 2018 by MIP 334
2013). Generally, the standards and documentation process uses papers, pictures,
and reports as main output. However, building model is seldom produced as a
submission requirement. Loss of information, insufficient documentation, poor
maintenance, lack of technology adaptation, and reports reliability are among
common problems the industry are facing (Ali et al., 2017; Khodeir, Aly, &
Tarek, 2016; Volk et al., 2014; Harun, 2011).
Fortunately, the recent development in ICT has introduced HBIM as a
tool to manage projects related to construction industry effectively and efficiently
(Ali et al., 2017). A HBIM model can store information of any historic building
and allow continuity of information sharing among stakeholders (Khodeir et al.,
2016; Volk et al., 2014). Among the information that can be stored are the
materials used for the building, description of work regarding an element or
components of the building, semantics for building elements, manufacturers
detail and dimension of building components (Ali et al., 2017; Logothetis et al.,
2015). Therefore, this paper discusses how HBIM can benefits towards
Malaysian construction industry in relation to using HBIM for heritage buildings.
HISTORIC BUILDING INFORMATION MODELLING (HBIM)
HBIM is a study using BIM approach on historical buildings. In other words,
HBIM is proposed as a new system of modelling historical structures. It is a
shared digital representation of physical and functional characteristics of any built
object, which forms a reliable basis for decision-making during its life-cycle
(Murphy, McGovern, & Pavia, 2013). HBIM is a semantic-aware database of
historical buildings, in which the geometric model is connected to descriptive
multi-source information. Semantic-aware database refers to the model’s
capability to store information within it and able to connect to other sources.
HBIM is also described as a novel system to automatically produce visualization
models and preservation of documents (Dore & Murphy, 2017).
HBIM is a project simulation consisting of the 3D models of the historic
building’s components with links to all required information including the
description about individual components and its nature. In many cases, this
denotes a beginning of a new approach where the details about historical
components can be shared and communicated visually, which has previously only
been available to persons who could ‘read plans' (Continenza et al., 2018;
Antonoupoulou, 2017). In essence, HBIM can be used as an archive, information
resource and acts as a management tool to aid future investigations on projects
and research (Baik, 2017; Volk, et al., 2014; Murphy et al., 2013). HBIM demands
skillsets such as 3D modelling expertise, understanding of the approach, a lot of
collaboration and it encourages industry players to relate to each other differently
(Continenza et al., 2018; Antonoupoulou, 2017; Abdul Shukor et al., 2015). Up
until now, Malaysian government through Construction Industry and
Development Board (CIDB) and Public Work Department (PWD) plays an active
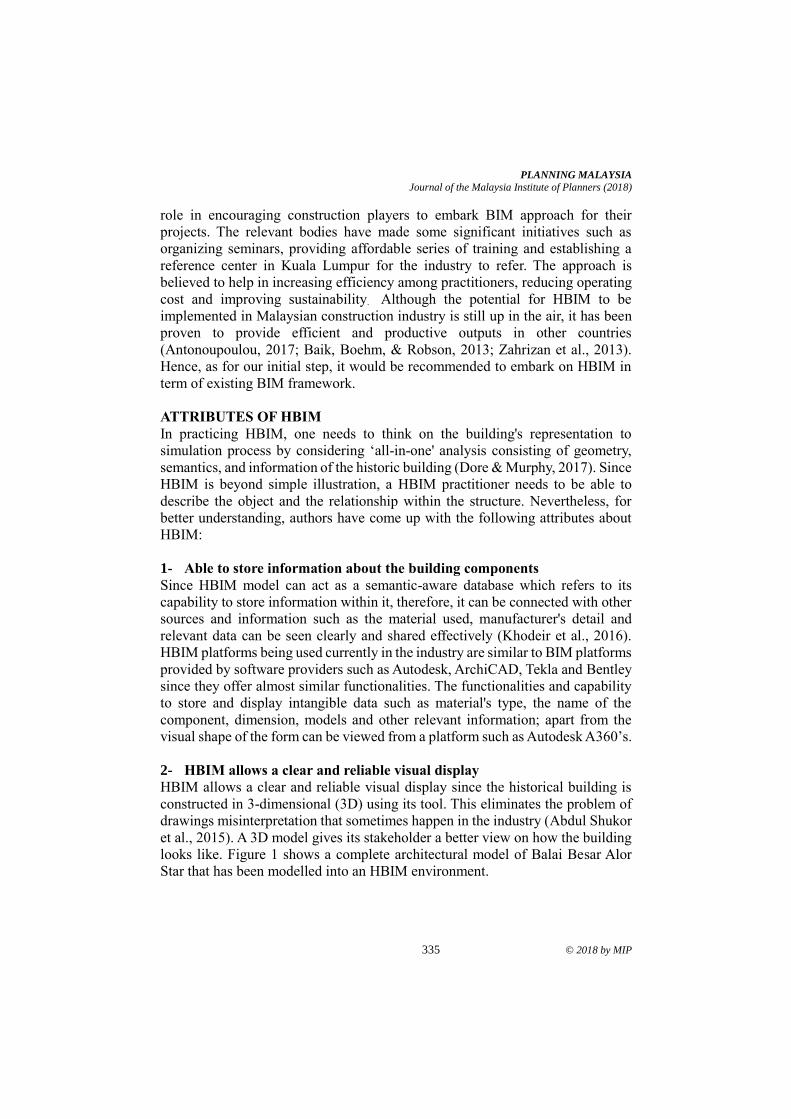
PLANNING MALAYSIA
Journal of the Malaysia Institute of Planners (2018)
335 © 2018 by MIP
role in encouraging construction players to embark BIM approach for their
projects. The relevant bodies have made some significant initiatives such as
organizing seminars, providing affordable series of training and establishing a
reference center in Kuala Lumpur for the industry to refer. The approach is
believed to help in increasing efficiency among practitioners, reducing operating
cost and improving sustainability. Although the potential for HBIM to be
implemented in Malaysian construction industry is still up in the air, it has been
proven to provide efficient and productive outputs in other countries
(Antonoupoulou, 2017; Baik, Boehm, & Robson, 2013; Zahrizan et al., 2013).
Hence, as for our initial step, it would be recommended to embark on HBIM in
term of existing BIM framework.
ATTRIBUTES OF HBIM
In practicing HBIM, one needs to think on the building's representation to
simulation process by considering ‘all-in-one' analysis consisting of geometry,
semantics, and information of the historic building (Dore & Murphy, 2017). Since
HBIM is beyond simple illustration, a HBIM practitioner needs to be able to
describe the object and the relationship within the structure. Nevertheless, for
better understanding, authors have come up with the following attributes about
HBIM:
1- Able to store information about the building components
Since HBIM model can act as a semantic-aware database which refers to its
capability to store information within it, therefore, it can be connected with other
sources and information such as the material used, manufacturer's detail and
relevant data can be seen clearly and shared effectively (Khodeir et al., 2016).
HBIM platforms being used currently in the industry are similar to BIM platforms
provided by software providers such as Autodesk, ArchiCAD, Tekla and Bentley
since they offer almost similar functionalities. The functionalities and capability
to store and display intangible data such as material's type, the name of the
component, dimension, models and other relevant information; apart from the
visual shape of the form can be viewed from a platform such as Autodesk A360’s.
2- HBIM allows a clear and reliable visual display
HBIM allows a clear and reliable visual display since the historical building is
constructed in 3-dimensional (3D) using its tool. This eliminates the problem of
drawings misinterpretation that sometimes happen in the industry (Abdul Shukor
et al., 2015). A 3D model gives its stakeholder a better view on how the building
looks like. Figure 1 shows a complete architectural model of Balai Besar Alor
Star that has been modelled into an HBIM environment.
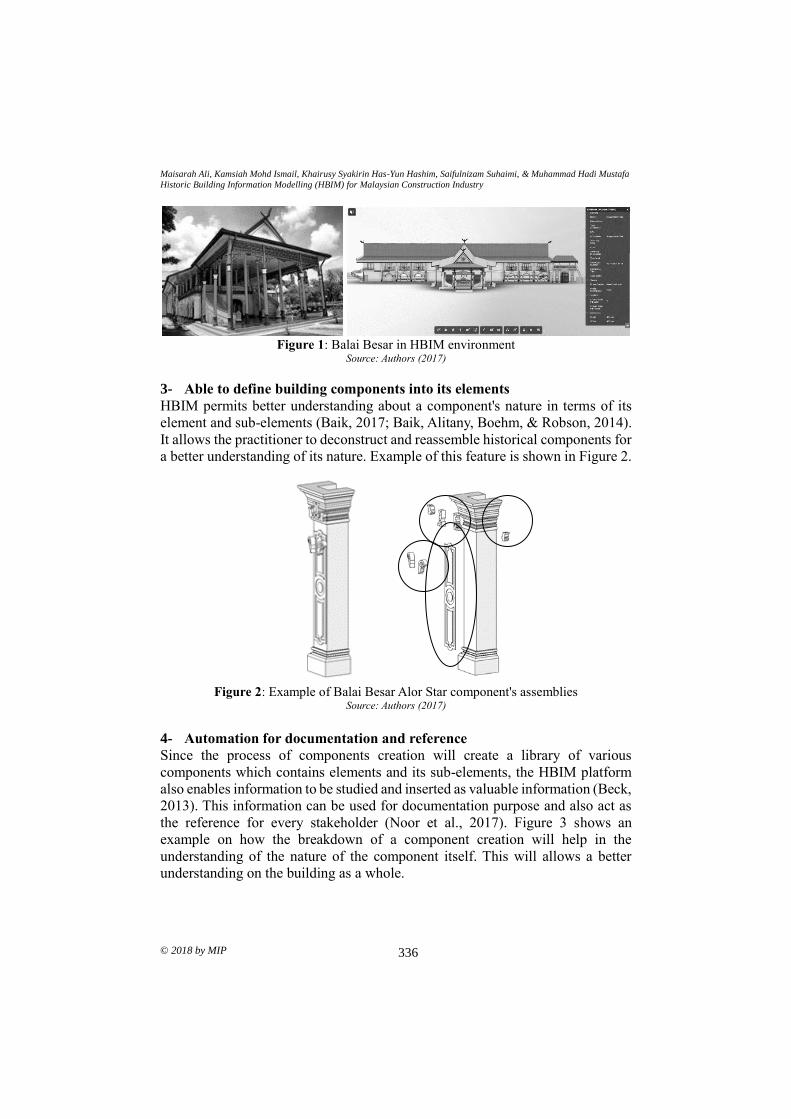
Maisarah Ali, Kamsiah Mohd Ismail, Khairusy Syakirin Has-Yun Hashim, Saifulnizam Suhaimi, & Muhammad Hadi Mustafa
Historic Building Information Modelling (HBIM) for Malaysian Construction Industry
© 2018 by MIP 336
Figure 1: Balai Besar in HBIM environment
Source: Authors (2017)
3- Able to define building components into its elements
HBIM permits better understanding about a component's nature in terms of its
element and sub-elements (Baik, 2017; Baik, Alitany, Boehm, & Robson, 2014).
It allows the practitioner to deconstruct and reassemble historical components for
a better understanding of its nature. Example of this feature is shown in Figure 2.
Figure 2: Example of Balai Besar Alor Star component's assemblies
Source: Authors (2017)
4- Automation for documentation and reference
Since the process of components creation will create a library of various
components which contains elements and its sub-elements, the HBIM platform
also enables information to be studied and inserted as valuable information (Beck,
2013). This information can be used for documentation purpose and also act as
the reference for every stakeholder (Noor et al., 2017). Figure 3 shows an
example on how the breakdown of a component creation will help in the
understanding of the nature of the component itself. This will allows a better
understanding on the building as a whole.
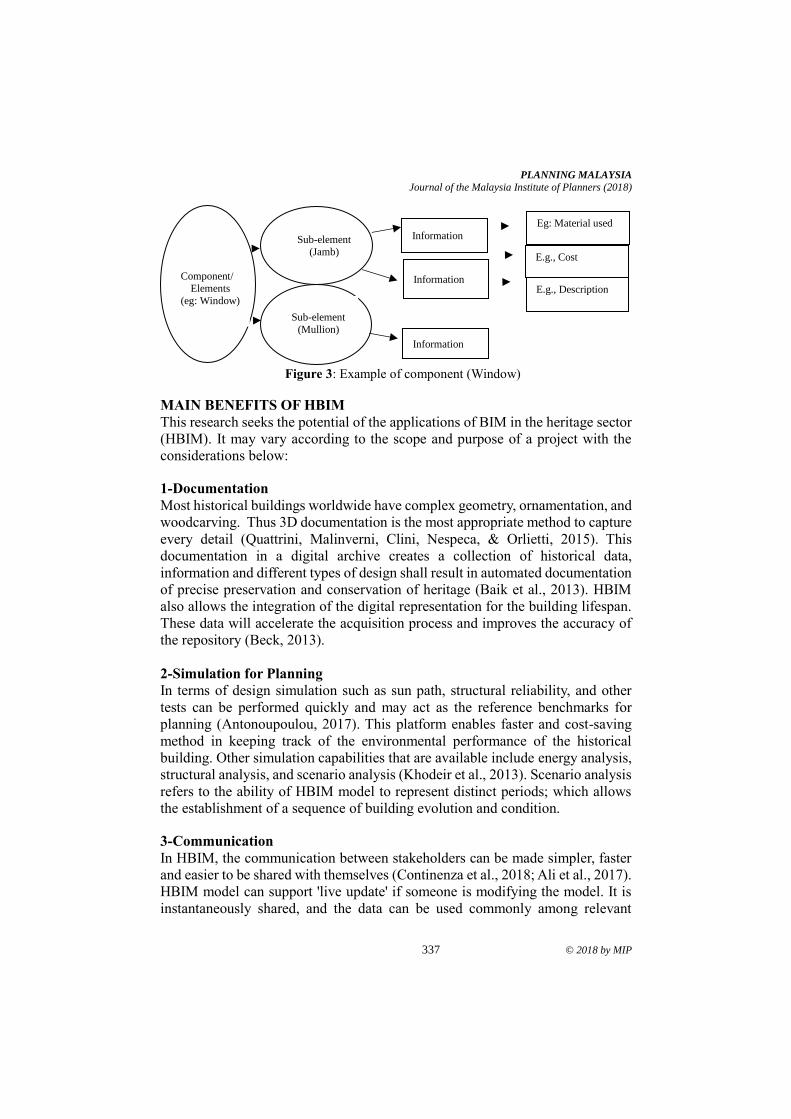
PLANNING MALAYSIA
Journal of the Malaysia Institute of Planners (2018)
337 © 2018 by MIP
Figure 3: Example of component (Window)
MAIN BENEFITS OF HBIM
This research seeks the potential of the applications of BIM in the heritage sector
(HBIM). It may vary according to the scope and purpose of a project with the
considerations below:
1-Documentation
Most historical buildings worldwide have complex geometry, ornamentation, and
woodcarving. Thus 3D documentation is the most appropriate method to capture
every detail (Quattrini, Malinverni, Clini, Nespeca, & Orlietti, 2015). This
documentation in a digital archive creates a collection of historical data,
information and different types of design shall result in automated documentation
of precise preservation and conservation of heritage (Baik et al., 2013). HBIM
also allows the integration of the digital representation for the building lifespan.
These data will accelerate the acquisition process and improves the accuracy of
the repository (Beck, 2013).
2-Simulation for Planning
In terms of design simulation such as sun path, structural reliability, and other
tests can be performed quickly and may act as the reference benchmarks for
planning (Antonoupoulou, 2017). This platform enables faster and cost-saving
method in keeping track of the environmental performance of the historical
building. Other simulation capabilities that are available include energy analysis,
structural analysis, and scenario analysis (Khodeir et al., 2013). Scenario analysis
refers to the ability of HBIM model to represent distinct periods; which allows
the establishment of a sequence of building evolution and condition.
3-Communication
In HBIM, the communication between stakeholders can be made simpler, faster
and easier to be shared with themselves (Continenza et al., 2018; Ali et al., 2017).
HBIM model can support 'live update' if someone is modifying the model. It is
instantaneously shared, and the data can be used commonly among relevant
Component/
Elements
(eg: Window)
Information
Information
Eg: Material used
Information
E.g., Cost
E.g., Description
Sub-element
(Mullion)
Sub-element
(Jamb)
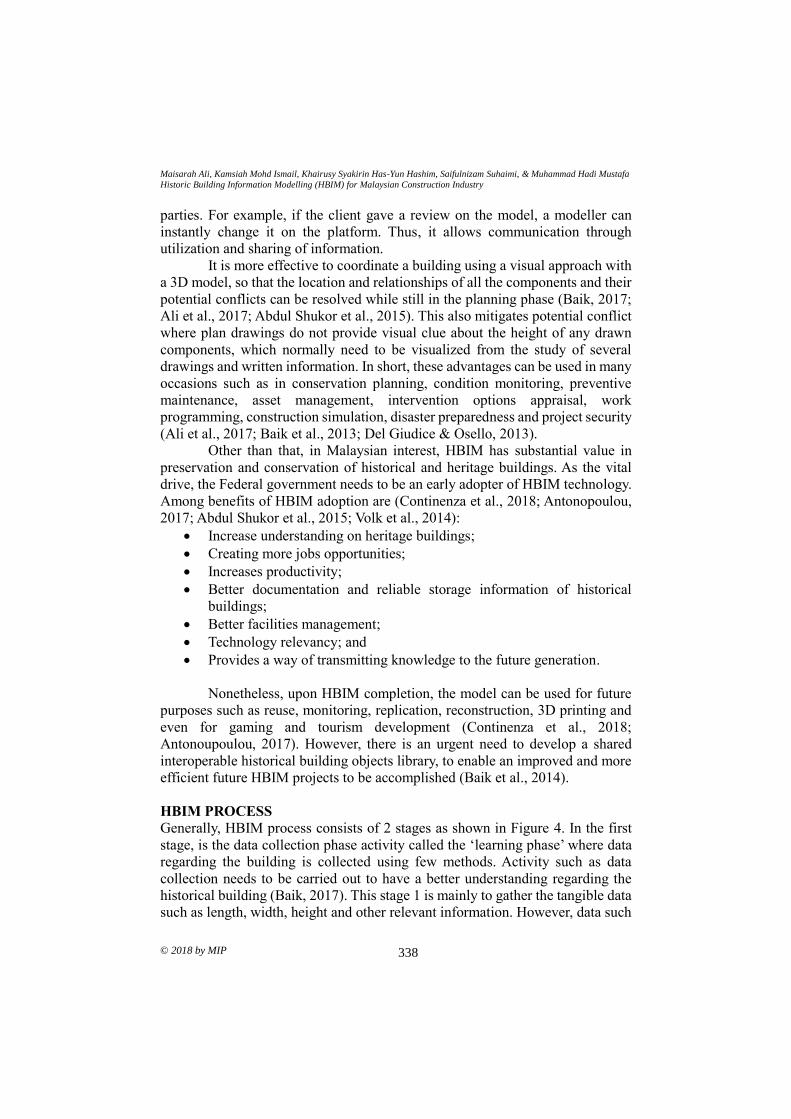
Maisarah Ali, Kamsiah Mohd Ismail, Khairusy Syakirin Has-Yun Hashim, Saifulnizam Suhaimi, & Muhammad Hadi Mustafa
Historic Building Information Modelling (HBIM) for Malaysian Construction Industry
© 2018 by MIP 338
parties. For example, if the client gave a review on the model, a modeller can
instantly change it on the platform. Thus, it allows communication through
utilization and sharing of information.
It is more effective to coordinate a building using a visual approach with
a 3D model, so that the location and relationships of all the components and their
potential conflicts can be resolved while still in the planning phase (Baik, 2017;
Ali et al., 2017; Abdul Shukor et al., 2015). This also mitigates potential conflict
where plan drawings do not provide visual clue about the height of any drawn
components, which normally need to be visualized from the study of several
drawings and written information. In short, these advantages can be used in many
occasions such as in conservation planning, condition monitoring, preventive
maintenance, asset management, intervention options appraisal, work
programming, construction simulation, disaster preparedness and project security
(Ali et al., 2017; Baik et al., 2013; Del Giudice & Osello, 2013).
Other than that, in Malaysian interest, HBIM has substantial value in
preservation and conservation of historical and heritage buildings. As the vital
drive, the Federal government needs to be an early adopter of HBIM technology.
Among benefits of HBIM adoption are (Continenza et al., 2018; Antonopoulou,
2017; Abdul Shukor et al., 2015; Volk et al., 2014):
• Increase understanding on heritage buildings;
• Creating more jobs opportunities;
• Increases productivity;
• Better documentation and reliable storage information of historical
buildings;
• Better facilities management;
• Technology relevancy; and
• Provides a way of transmitting knowledge to the future generation.
Nonetheless, upon HBIM completion, the model can be used for future
purposes such as reuse, monitoring, replication, reconstruction, 3D printing and
even for gaming and tourism development (Continenza et al., 2018;
Antonoupoulou, 2017). However, there is an urgent need to develop a shared
interoperable historical building objects library, to enable an improved and more
efficient future HBIM projects to be accomplished (Baik et al., 2014).
HBIM PROCESS
Generally, HBIM process consists of 2 stages as shown in Figure 4. In the first
stage, is the data collection phase activity called the ‘learning phase’ where data
regarding the building is collected using few methods. Activity such as data
collection needs to be carried out to have a better understanding regarding the
historical building (Baik, 2017). This stage 1 is mainly to gather the tangible data
such as length, width, height and other relevant information. However, data such
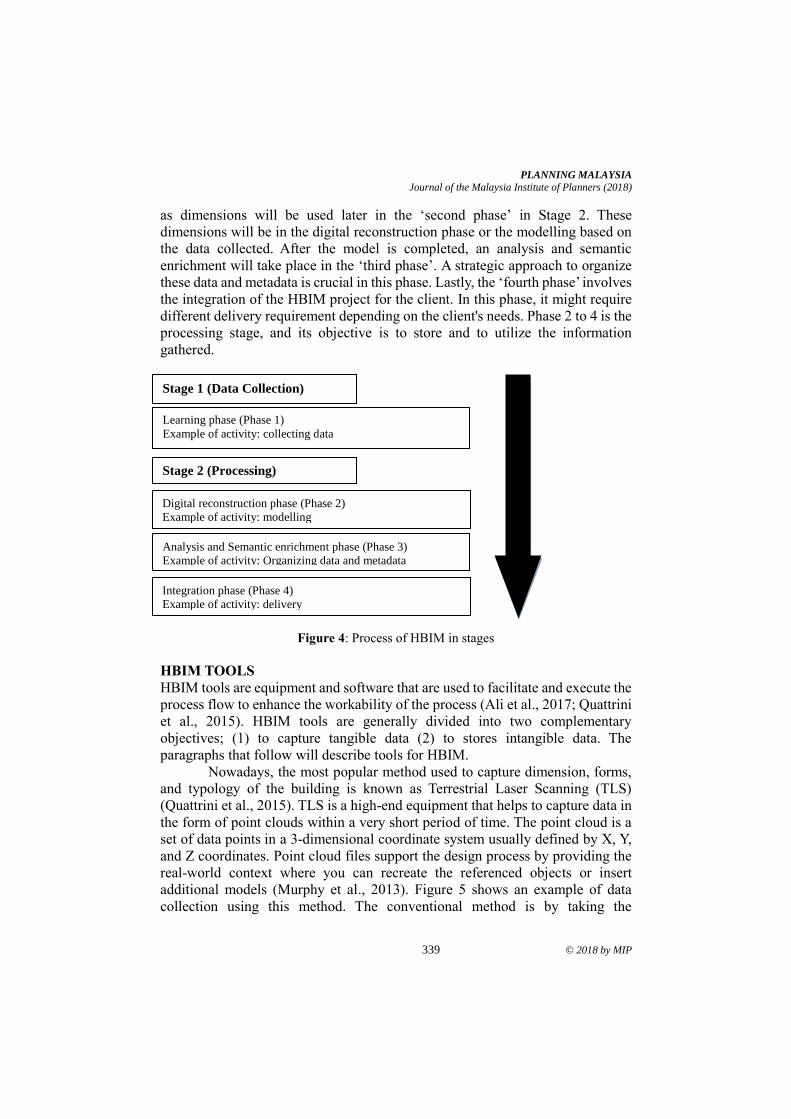
PLANNING MALAYSIA
Journal of the Malaysia Institute of Planners (2018)
339 © 2018 by MIP
as dimensions will be used later in the ‘second phase’ in Stage 2. These
dimensions will be in the digital reconstruction phase or the modelling based on
the data collected. After the model is completed, an analysis and semantic
enrichment will take place in the ‘third phase’. A strategic approach to organize
these data and metadata is crucial in this phase. Lastly, the ‘fourth phase’ involves
the integration of the HBIM project for the client. In this phase, it might require
different delivery requirement depending on the client's needs. Phase 2 to 4 is the
processing stage, and its objective is to store and to utilize the information
gathered.
Figure 4: Process of HBIM in stages
HBIM TOOLS
HBIM tools are equipment and software that are used to facilitate and execute the
process flow to enhance the workability of the process (Ali et al., 2017; Quattrini
et al., 2015). HBIM tools are generally divided into two complementary
objectives; (1) to capture tangible data (2) to stores intangible data. The
paragraphs that follow will describe tools for HBIM.
Nowadays, the most popular method used to capture dimension, forms,
and typology of the building is known as Terrestrial Laser Scanning (TLS)
(Quattrini et al., 2015). TLS is a high-end equipment that helps to capture data in
the form of point clouds within a very short period of time. The point cloud is a
set of data points in a 3-dimensional coordinate system usually defined by X, Y,
and Z coordinates. Point cloud files support the design process by providing the
real-world context where you can recreate the referenced objects or insert
additional models (Murphy et al., 2013). Figure 5 shows an example of data
collection using this method. The conventional method is by taking the
Learning phase (Phase 1)
Example of activity: collecting data
Analysis and Semantic enrichment phase (Phase 3)
Example of activity: Organizing data and metadata
Digital reconstruction phase (Phase 2)
Example of activity: modelling
Integration phase (Phase 4)
Example of activity: delivery
Stage 1 (Data Collection)
Stage 2 (Processing)
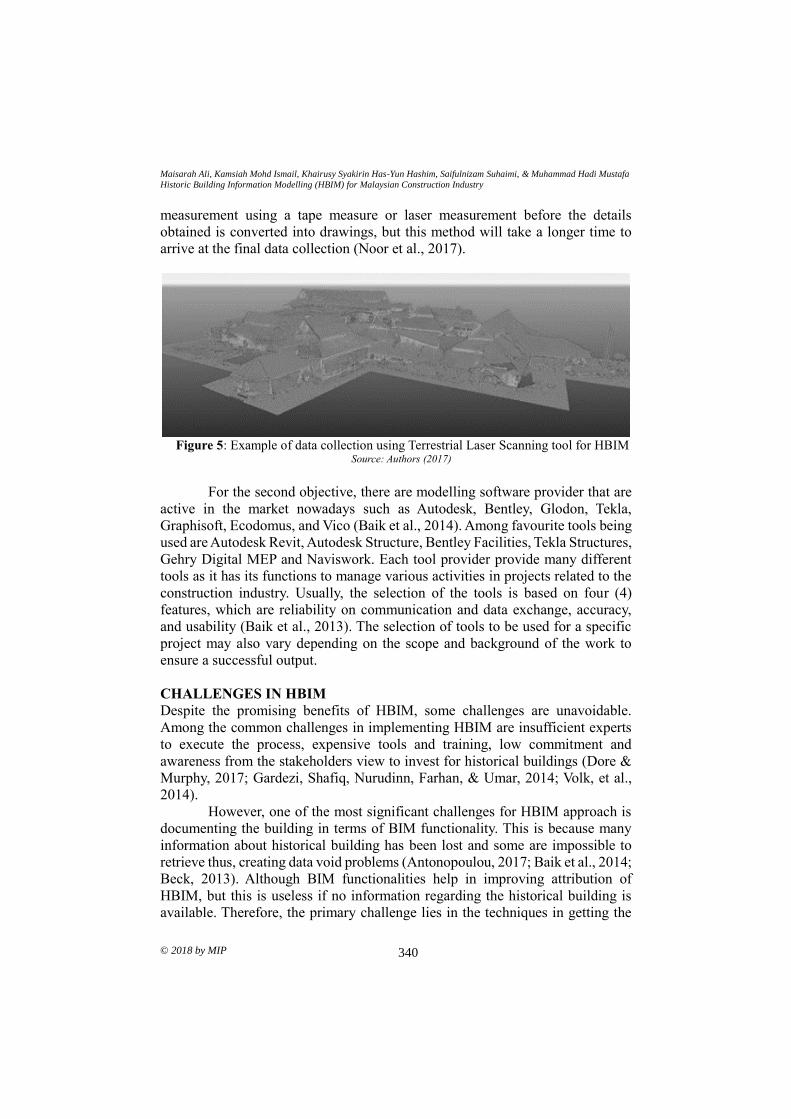
Maisarah Ali, Kamsiah Mohd Ismail, Khairusy Syakirin Has-Yun Hashim, Saifulnizam Suhaimi, & Muhammad Hadi Mustafa
Historic Building Information Modelling (HBIM) for Malaysian Construction Industry
© 2018 by MIP 340
measurement using a tape measure or laser measurement before the details
obtained is converted into drawings, but this method will take a longer time to
arrive at the final data collection (Noor et al., 2017).
Figure 5: Example of data collection using Terrestrial Laser Scanning tool for HBIM
Source: Authors (2017)
For the second objective, there are modelling software provider that are
active in the market nowadays such as Autodesk, Bentley, Glodon, Tekla,
Graphisoft, Ecodomus, and Vico (Baik et al., 2014). Among favourite tools being
used are Autodesk Revit, Autodesk Structure, Bentley Facilities, Tekla Structures,
Gehry Digital MEP and Naviswork. Each tool provider provide many different
tools as it has its functions to manage various activities in projects related to the
construction industry. Usually, the selection of the tools is based on four (4)
features, which are reliability on communication and data exchange, accuracy,
and usability (Baik et al., 2013). The selection of tools to be used for a specific
project may also vary depending on the scope and background of the work to
ensure a successful output.
CHALLENGES IN HBIM
Despite the promising benefits of HBIM, some challenges are unavoidable.
Among the common challenges in implementing HBIM are insufficient experts
to execute the process, expensive tools and training, low commitment and
awareness from the stakeholders view to invest for historical buildings (Dore &
Murphy, 2017; Gardezi, Shafiq, Nurudinn, Farhan, & Umar, 2014; Volk, et al.,
2014).
However, one of the most significant challenges for HBIM approach is
documenting the building in terms of BIM functionality. This is because many
information about historical building has been lost and some are impossible to
retrieve thus, creating data void problems (Antonopoulou, 2017; Baik et al., 2014;
Beck, 2013). Although BIM functionalities help in improving attribution of
HBIM, but this is useless if no information regarding the historical building is
available. Therefore, the primary challenge lies in the techniques in getting the
PLANNING MALAYSIA
Journal of the Malaysia Institute of Planners (2018)
341 © 2018 by MIP
information to minimize data voids in the process.
Data voids have implications in the modelling process, where the level
of development (LOD) for HBIM might not reach the highest LOD, thus making
the model ‘incomplete.' In HBIM modelling process, there are two types of
information involved, known as tangible and intangible information (Volk et al.,
2014). Tangible is information about shape, forms, and whatever perceptible by
touch and can be physically measured, whereas intangible is information that is
physically untouchable such as the description of the material used for the
element that gives value to it. Therefore, in the modelling process, accuracy,
complexity, and reliability of data are important. Commonly, HBIM process gives
challenges in three major areas known as accuracy, complexity, and reliability
(Dore & Murphy, 2017). In handling this concern, tools such as TLS and
modelling software plays a vital part in minimizing this problem. For data voids,
some practitioners suggest that educated guesses may have to be made about
certain aspects of the asset's information (Baik, 2017; Ali et al., 2017). However,
all information (delivered/exchanged) must be verified and validated, allowing
zero ambiguity.
It is recommended that in HBIM process, any part of the model is based
on assumption due to data voids or incomplete information should be explicitly
marked to avoid ambiguity and future confusion, misinterpretation and ill-
informed decision-making (Antonouloupou, 2017; Baik, 2017). An approach to
validating these data can be made later through ‘expert opinion’ method.
CONCLUSION
The Historic Building Information Modelling (HBIM) has been acknowledged
by many kinds of research to be useful to develop a system for maintaining a
historical building efficiently. Its attributes which enable big data storage and
reuse of information along with capability of acting as domain knowledge
throughout the lifecycle of a building has made it very popular. Extensive
encouragement to use HBIM in the industry can help to expand the overall
initiatives and strengthen the image of the Malaysian industry. Besides, looking
at current government efforts for BIM, it is anticipated that HBIM technology
will likely be used for many other types of projects in the future. Lastly, it is also
recommended that further research on this area be performed for a better addition
to the body of knowledge for Malaysia's chapter.
ACKNOWLEDGMENT
This research is supported by a grant (TRGS16-03-003-0003) from the Ministry
of Higher Education Malaysia (MOHE). This research is also supported by
Kuliyyah of Architecture and Environmental Design (KAED) and Kuliyyah of
Engineering of International Islamic University Malaysia.
Maisarah Ali, Kamsiah Mohd Ismail, Khairusy Syakirin Has-Yun Hashim, Saifulnizam Suhaimi, & Muhammad Hadi Mustafa
Historic Building Information Modelling (HBIM) for Malaysian Construction Industry
© 2018 by MIP 342
REFERENCES Abdul Shukor, S. A., Wong, R., Rushforth, E., Basah, S. N., & Zakaria, A. (2015). 3D
terrestrial laser scanner for managing existing building. Jurnal Teknologi,
76(12), 133-139.
Ali, M., Ibrahim, M. N., Mohd Yunus, R., Yahya, M. R., Ismail, F., Mohd Din, A, &
Ibrahim, M. S. (2017). Exploring methods of quantity measurement for
heritage conservation works. Journal of Computational and Theoretical
Nanoscience, 23(7), 6277-6280.
Al-Obaidi, K., Wei, S., Ismail, M., & Kam, K. (2017). Sustainable building assessment
of colonial shophouses after adaptive reuse in Kuala Lumpur. Buildings, 7(4),
87.
Antonopoulou, S. (2017). BIM for heritage: Developing a Historic Building
Information Model. (n.p.): Historic England.
Baik, A., Boehm, J., & Robson, S. (2013). Jeddah historical building information
modeling "JHBIM" Old Jeddah – Saudi Arabia. ISPRS - International
Archives of the Photogrammetry, Remote Sensing and Spatial Information
Sciences, XL-5/W2, 73-78.
Baik, A., Alitany, A., Boehm, J., & Robson, S. (2014). Jeddah Historical Building
Information Modelling "JHBIM"; Object Library. ISPRS Annals of
Photogrammetry, Remote Sensing, and Spatial Information Sciences, II-5, 41-
47.
Baik, A. (2017). From point cloud to Jeddah Heritage BIM Nasif Historical House –
Case study. Digital Applications in Archaeology and Cultural Heritage, 4, 1-
18.
Beck, L. S. (2013). Digital documentation in the conservation of cultural heritage:
Finding the practical in best practice. ISPRS - International Archives of the
Photogrammetry, Remote Sensing, and Spatial Information Sciences, XL-
5/W2, 85–90.
Continenza, R., Redi F., Savini, F., Tata, A., & Trizio, I. (2018). HBIM for the
archaeology of standing buildings: Case study of the Church of San Cipriano
in Castelvecchio Calvisio (L’Aquila, Italy). In P. Fogliaroni, A. Ballatore, &
E. Clementini (Eds.), Proceedings of Workshops and Posters at the 13th
International Conference on Spatial Information Theory (COSIT 2017) (pp.
315-324). Cham: Springer.
Del Giudice, M., & Osello, A. (2013). BIM for cultural heritage. ISPRS - International
Archives of the Photogrammetry, Remote Sensing, and Spatial Information
Sciences, XL-5/W2, 225-229.s
Dore, C., & Murphy, M. (2017). Current state of the art historic building information
modelling. ISPRS - International Archives of the Photogrammetry, Remote
Sensing and Spatial Information Sciences, XLII-2/W5, 185-192.
Gardezi, S. S. S., Shafiq, N., Nurudinn, M. F., Farhan, S. A., & Umar, U. A. (2014).
Challenges for implementation of building information modeling (BIM) in
Malaysian construction industry. Applied Mechanics and Materials, 567, 559-
564.
Harun, S. N. (2011). Heritage building conservation in Malaysia: Experience and
challenges. Procedia Engineering, 20, 41-53.
PLANNING MALAYSIA
Journal of the Malaysia Institute of Planners (2018)
343 © 2018 by MIP
Kayan, B., Akashah, F. W., & Ishak, N. H. (2013, November). Conservation Plan for
Historic Buildings from Building Control Administration Perspective. The 3rd
International Building Control Conference 2013. Nvember 21, 2013, Kuala
Lumpur, Malaysia.
Khodeir, L. M., Aly, D., & Tarek, S. (2016). Integrating HBIM (Heritage Building
Information Modeling) tools in the application of sustainable retrofitting of
heritage buildings in Egypt. Procedia Environmental Sciences, 34, 258-270.
Logothetis, S., Delinasiou, A., & Stylianidis, E. (2015). Building information
modelling for cultural heritage: A review. ISPRS Annals of Photogrammetry,
Remote Sensing, and Spatial Information Sciences, II-5/W3, 177-183.
Mohd Yusoff, M. Y., Dollah, H., & Kechot, A. S. (2010). Pembangunan warisan di
Malaysia: Tinjauan umum tentang dasar. Jurnal Melayu, 5, 277-283
Murphy, M., McGovern, E., & Pavia, S. (2013). Historic building information
modelling – Adding intelligence to laser and image-based surveys of
European classical architecture. ISPRS Journal of Photogrammetry and
Remote Sensing, 76, 89-102.
Noor, N. M., Kamarudin, Z., Abdullah, A., Aiman, A., Mustafa, M. H., Art, A., … &
Design, E. (n.d.). Using terrestrial laser scanner for Malay heritage
documentation : preliminary approach to Istana Balai.
Quattrini, R., Malinverni, E. S., Clini, P., Nespeca, R., & Orlietti, E. (2015). From TLS
to HBIM: High quality semantically-aware 3d modeling of complex
architecture. International Archives of the Photogrammetry, Remote Sensing
and Spatial Information Sciences - ISPRS Archives, 40(5W4), 367-374.
Volk, R., Stengel, J., & Schultmann, F. (2014). Building information models (BIM) for
existing buildings – Literature review and future needs. Automation in
Construction, 38, 109-127.
Zahrizan, Z., Ali, N. M., Haron, A. T., Marshall-Ponting, A., & Hamid, Z. A. (2013).
Exploring the barriers and driving factors in implementing building
information modelling (BIM) in the Malaysian construction industry: A
preliminary study. Journal - The Institution of Engineers, Malaysia, 75(1), 1-
10.
1Senior Lecturer at Universiti Teknologi Malaysia. Email: [email protected] 344
PLANNING MALAYSIA:
Journal of the Malaysian Institute of Planners
VOLUME 16 ISSUE 3 (2018) Page 344 – 356
ECOLOGICAL FRIENDLY APPLIED TECHNOLOGY TO
NEGOTIATE THE DILEMMA BETWEEN ENVIRONMENTAL
PROTECTION AND URBAN DEVELOPMENT
Ariva Sugandi Permana1 & Ahmad Nazri Muhamad Ludin2
Faculty of Built Environment and Surveying
UNIVERSITI TEKNOLOGI MALAYSIA
ABSTRACT
Urban development consumes resources and therefore abolishes the ecological
function of the natural environment. It generates the dilemma between urban
development and environmental protection. Urban development cannot be halted
for many reasons due to its importance to accommodate population growth,
urbanization and economic development. Determinations to negotiate the
dilemma between environmental protection and urban development have been
undergoing for many years. One of the efforts is mesoscale ecological friendly
technology concept where the function of natural environment could be
maintained while letting progressive urban development to flourish. The study
was conducted in secondary city in Peninsular Malaysia of Johor Bahru. The
study was conducted by analysing secondary information obtained from relevant
resources, by undertaking internet research on the applications of ecological
friendly technology towards sustainability in developed and developing
countries, and by observing the connection between urban development and
environmental state. The findings show that by employing applied ecological
friendly technology, the urban physical development can still be undergoing
without substantial environmental impacts.
Keywords: ecological friendly technology, environmental protection, urban
development, sustainability.
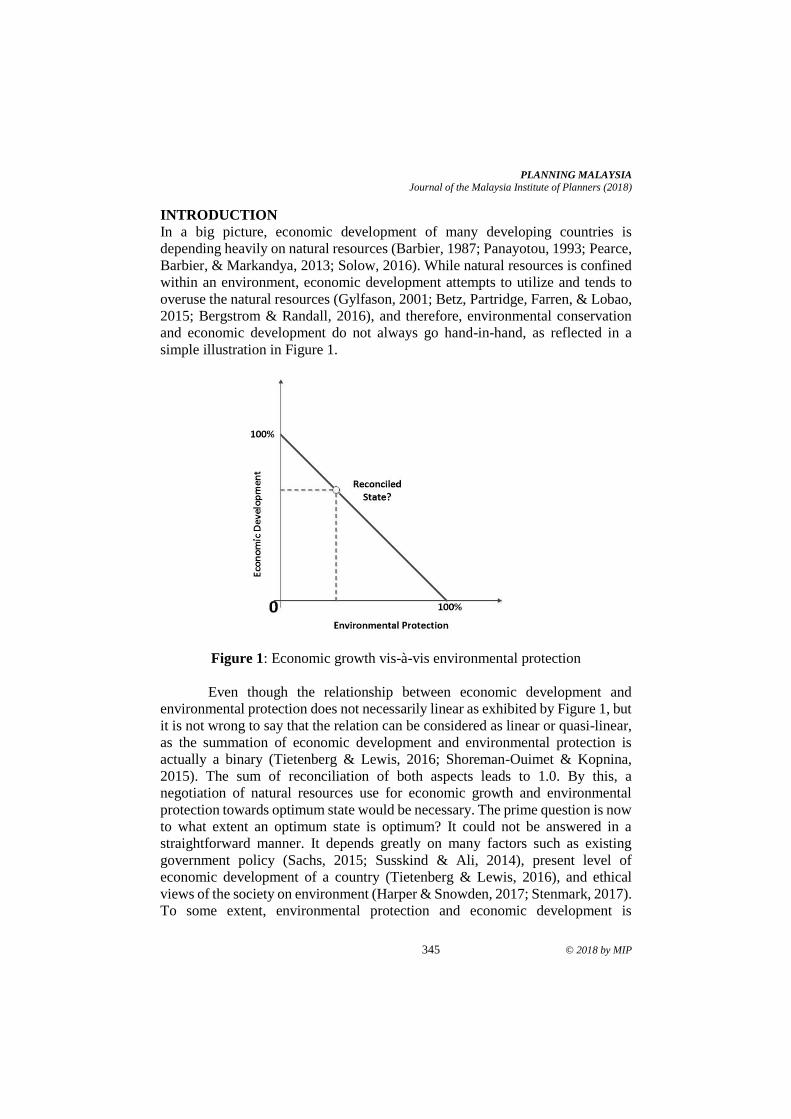
PLANNING MALAYSIA
Journal of the Malaysia Institute of Planners (2018)
345 © 2018 by MIP
INTRODUCTION
In a big picture, economic development of many developing countries is
depending heavily on natural resources (Barbier, 1987; Panayotou, 1993; Pearce,
Barbier, & Markandya, 2013; Solow, 2016). While natural resources is confined
within an environment, economic development attempts to utilize and tends to
overuse the natural resources (Gylfason, 2001; Betz, Partridge, Farren, & Lobao,
2015; Bergstrom & Randall, 2016), and therefore, environmental conservation
and economic development do not always go hand-in-hand, as reflected in a
simple illustration in Figure 1.
Figure 1: Economic growth vis-à-vis environmental protection
Even though the relationship between economic development and
environmental protection does not necessarily linear as exhibited by Figure 1, but
it is not wrong to say that the relation can be considered as linear or quasi-linear,
as the summation of economic development and environmental protection is
actually a binary (Tietenberg & Lewis, 2016; Shoreman-Ouimet & Kopnina,
2015). The sum of reconciliation of both aspects leads to 1.0. By this, a
negotiation of natural resources use for economic growth and environmental
protection towards optimum state would be necessary. The prime question is now
to what extent an optimum state is optimum? It could not be answered in a
straightforward manner. It depends greatly on many factors such as existing
government policy (Sachs, 2015; Susskind & Ali, 2014), present level of
economic development of a country (Tietenberg & Lewis, 2016), and ethical
views of the society on environment (Harper & Snowden, 2017; Stenmark, 2017).
To some extent, environmental protection and economic development is
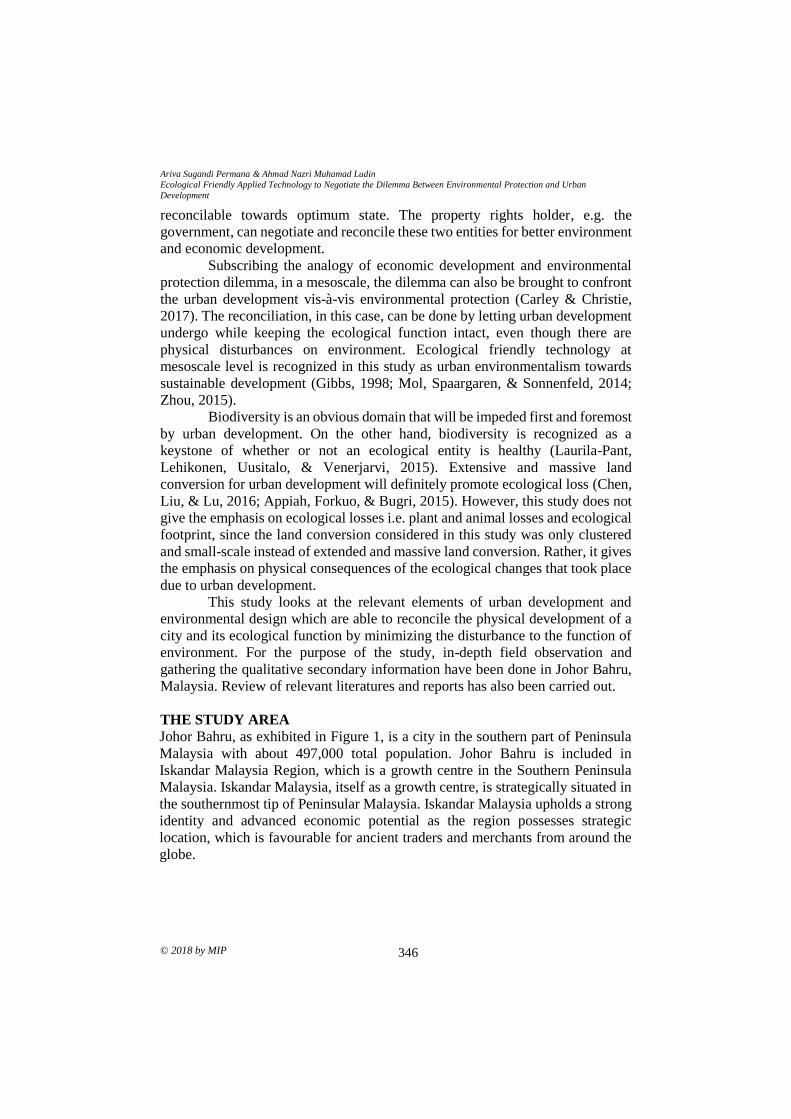
Ariva Sugandi Permana & Ahmad Nazri Muhamad Ludin
Ecological Friendly Applied Technology to Negotiate the Dilemma Between Environmental Protection and Urban
Development
© 2018 by MIP 346
reconcilable towards optimum state. The property rights holder, e.g. the
government, can negotiate and reconcile these two entities for better environment
and economic development.
Subscribing the analogy of economic development and environmental
protection dilemma, in a mesoscale, the dilemma can also be brought to confront
the urban development vis-à-vis environmental protection (Carley & Christie,
2017). The reconciliation, in this case, can be done by letting urban development
undergo while keeping the ecological function intact, even though there are
physical disturbances on environment. Ecological friendly technology at
mesoscale level is recognized in this study as urban environmentalism towards
sustainable development (Gibbs, 1998; Mol, Spaargaren, & Sonnenfeld, 2014;
Zhou, 2015).
Biodiversity is an obvious domain that will be impeded first and foremost
by urban development. On the other hand, biodiversity is recognized as a
keystone of whether or not an ecological entity is healthy (Laurila-Pant,
Lehikonen, Uusitalo, & Venerjarvi, 2015). Extensive and massive land
conversion for urban development will definitely promote ecological loss (Chen,
Liu, & Lu, 2016; Appiah, Forkuo, & Bugri, 2015). However, this study does not
give the emphasis on ecological losses i.e. plant and animal losses and ecological
footprint, since the land conversion considered in this study was only clustered
and small-scale instead of extended and massive land conversion. Rather, it gives
the emphasis on physical consequences of the ecological changes that took place
due to urban development.
This study looks at the relevant elements of urban development and
environmental design which are able to reconcile the physical development of a
city and its ecological function by minimizing the disturbance to the function of
environment. For the purpose of the study, in-depth field observation and
gathering the qualitative secondary information have been done in Johor Bahru,
Malaysia. Review of relevant literatures and reports has also been carried out.
THE STUDY AREA
Johor Bahru, as exhibited in Figure 1, is a city in the southern part of Peninsula
Malaysia with about 497,000 total population. Johor Bahru is included in
Iskandar Malaysia Region, which is a growth centre in the Southern Peninsula
Malaysia. Iskandar Malaysia, itself as a growth centre, is strategically situated in
the southernmost tip of Peninsular Malaysia. Iskandar Malaysia upholds a strong
identity and advanced economic potential as the region possesses strategic
location, which is favourable for ancient traders and merchants from around the
globe.
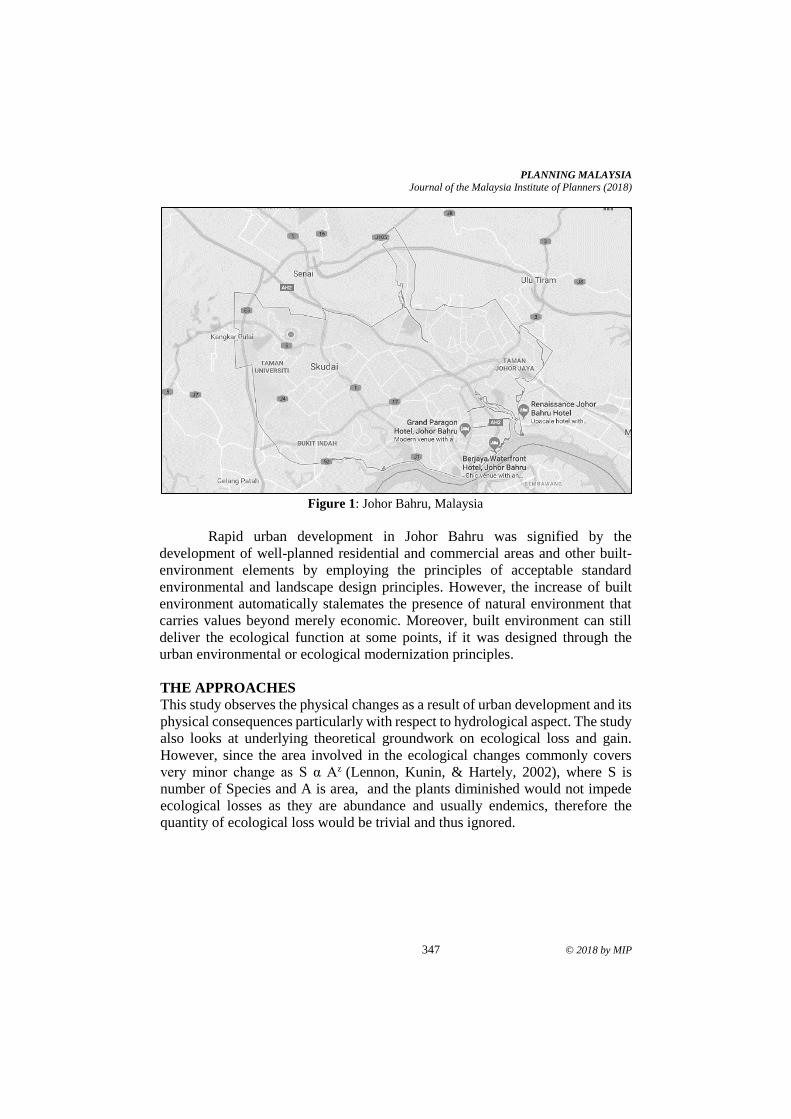
PLANNING MALAYSIA
Journal of the Malaysia Institute of Planners (2018)
347 © 2018 by MIP
Figure 1: Johor Bahru, Malaysia
Rapid urban development in Johor Bahru was signified by the
development of well-planned residential and commercial areas and other built-
environment elements by employing the principles of acceptable standard
environmental and landscape design principles. However, the increase of built
environment automatically stalemates the presence of natural environment that
carries values beyond merely economic. Moreover, built environment can still
deliver the ecological function at some points, if it was designed through the
urban environmental or ecological modernization principles.
THE APPROACHES
This study observes the physical changes as a result of urban development and its
physical consequences particularly with respect to hydrological aspect. The study
also looks at underlying theoretical groundwork on ecological loss and gain.
However, since the area involved in the ecological changes commonly covers
very minor change as S α Az (Lennon, Kunin, & Hartely, 2002), where S is
number of Species and A is area, and the plants diminished would not impede
ecological losses as they are abundance and usually endemics, therefore the
quantity of ecological loss would be trivial and thus ignored.
Ariva Sugandi Permana & Ahmad Nazri Muhamad Ludin
Ecological Friendly Applied Technology to Negotiate the Dilemma Between Environmental Protection and Urban
Development
© 2018 by MIP 348
Changing in Rainfall-Runoff Relationship: The Most Visible Impacts of
Urban Development
Surface Runoff Modification
Changes in the imperviousness of the land exert essential influence on rainfall-
runoff relationship due to changes in the hydrological-ecological process in urban
area (Yao, Wei, & Chen, 2016). They asserted that the growth of impervious
surfaces in urban areas is directly associated with urban development. The factor
that influences the variations in urban hydrology includes increased runoff,
decreased recession time, decreased groundwater recharge and decreased base
flow (Burns et al., 2005; Liu, Ahiablame, Bralts, & Engel, 2015).
A study in Johor Bahru Malaysia by Majid, Jamaludin and Ibrahim
(2013) shows a linear model on the correlation between housing density and
impervious surface that can be expressed by an equation of ln {y/(1-
y)}=0.6716+0.08x, where y: proportion of impervious surface and x: housing
density (unit/acre). By using this equation, the correlation between housing
density in unit/acre and percentage of impervious ground surface is shown in
Figure 2.
Figure 2: Housing density and impervious surface
Source: Adapted from Majid et al. (2013)
Figure 2 reflects residential plots in Johor Bahru with bungalows and
Semi-Ds type of house, where the ground surface composed of pavement and
roof in a flat land, and unimproved area. It is obvious that the higher housing
density would result in higher impervious area, and therefore higher surface
runoff as exhibited in Figure 3.
50
63
72
8085
88 90
40
50
60
70
80
90
100
0.00 5.00 10.00 15.00 20.00 25.00 30.00
Imp
ervio
us
Su
rfac
e (%
)
Housing Density (Unit/Acre)
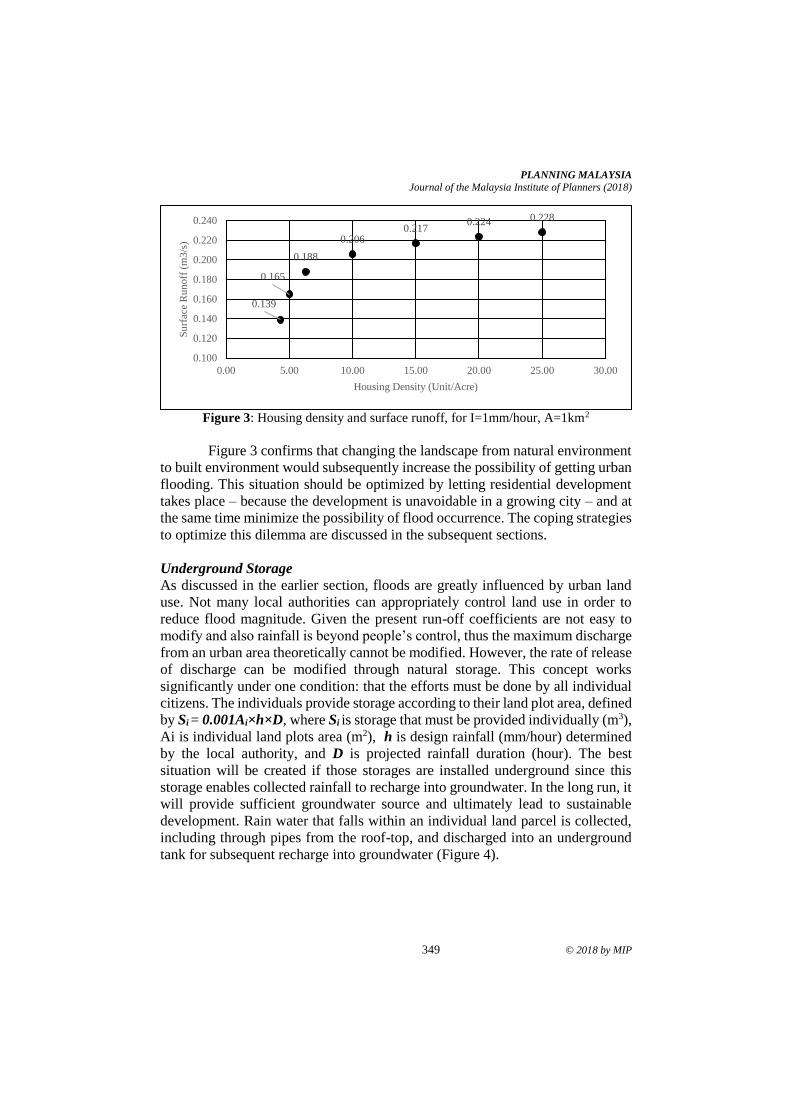
PLANNING MALAYSIA
Journal of the Malaysia Institute of Planners (2018)
349 © 2018 by MIP
Figure 3: Housing density and surface runoff, for I=1mm/hour, A=1km2
Figure 3 confirms that changing the landscape from natural environment
to built environment would subsequently increase the possibility of getting urban
flooding. This situation should be optimized by letting residential development
takes place – because the development is unavoidable in a growing city – and at
the same time minimize the possibility of flood occurrence. The coping strategies
to optimize this dilemma are discussed in the subsequent sections.
Underground Storage
As discussed in the earlier section, floods are greatly influenced by urban land
use. Not many local authorities can appropriately control land use in order to
reduce flood magnitude. Given the present run-off coefficients are not easy to
modify and also rainfall is beyond people’s control, thus the maximum discharge
from an urban area theoretically cannot be modified. However, the rate of release
of discharge can be modified through natural storage. This concept works
significantly under one condition: that the efforts must be done by all individual
citizens. The individuals provide storage according to their land plot area, defined
by Si = 0.001Ai×h×D, where Si is storage that must be provided individually (m3),
Ai is individual land plots area (m2), h is design rainfall (mm/hour) determined
by the local authority, and D is projected rainfall duration (hour). The best
situation will be created if those storages are installed underground since this
storage enables collected rainfall to recharge into groundwater. In the long run, it
will provide sufficient groundwater source and ultimately lead to sustainable
development. Rain water that falls within an individual land parcel is collected,
including through pipes from the roof-top, and discharged into an underground
tank for subsequent recharge into groundwater (Figure 4).
0.139
0.165
0.188
0.2060.217
0.224 0.228
0.100
0.120
0.140
0.160
0.180
0.200
0.220
0.240
0.00 5.00 10.00 15.00 20.00 25.00 30.00
Su
rfac
e R
un
off
(m
3/s
)
Housing Density (Unit/Acre)
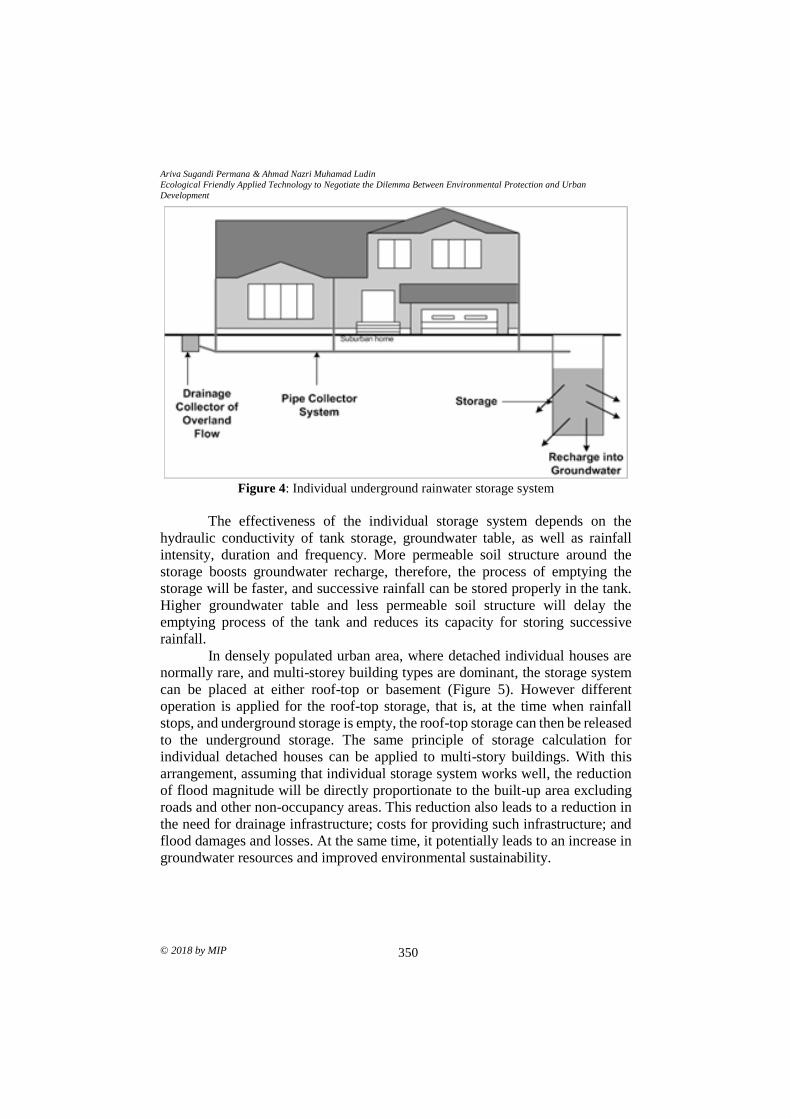
Ariva Sugandi Permana & Ahmad Nazri Muhamad Ludin
Ecological Friendly Applied Technology to Negotiate the Dilemma Between Environmental Protection and Urban
Development
© 2018 by MIP 350
Figure 4: Individual underground rainwater storage system
The effectiveness of the individual storage system depends on the
hydraulic conductivity of tank storage, groundwater table, as well as rainfall
intensity, duration and frequency. More permeable soil structure around the
storage boosts groundwater recharge, therefore, the process of emptying the
storage will be faster, and successive rainfall can be stored properly in the tank.
Higher groundwater table and less permeable soil structure will delay the
emptying process of the tank and reduces its capacity for storing successive
rainfall.
In densely populated urban area, where detached individual houses are
normally rare, and multi-storey building types are dominant, the storage system
can be placed at either roof-top or basement (Figure 5). However different
operation is applied for the roof-top storage, that is, at the time when rainfall
stops, and underground storage is empty, the roof-top storage can then be released
to the underground storage. The same principle of storage calculation for
individual detached houses can be applied to multi-story buildings. With this
arrangement, assuming that individual storage system works well, the reduction
of flood magnitude will be directly proportionate to the built-up area excluding
roads and other non-occupancy areas. This reduction also leads to a reduction in
the need for drainage infrastructure; costs for providing such infrastructure; and
flood damages and losses. At the same time, it potentially leads to an increase in
groundwater resources and improved environmental sustainability.
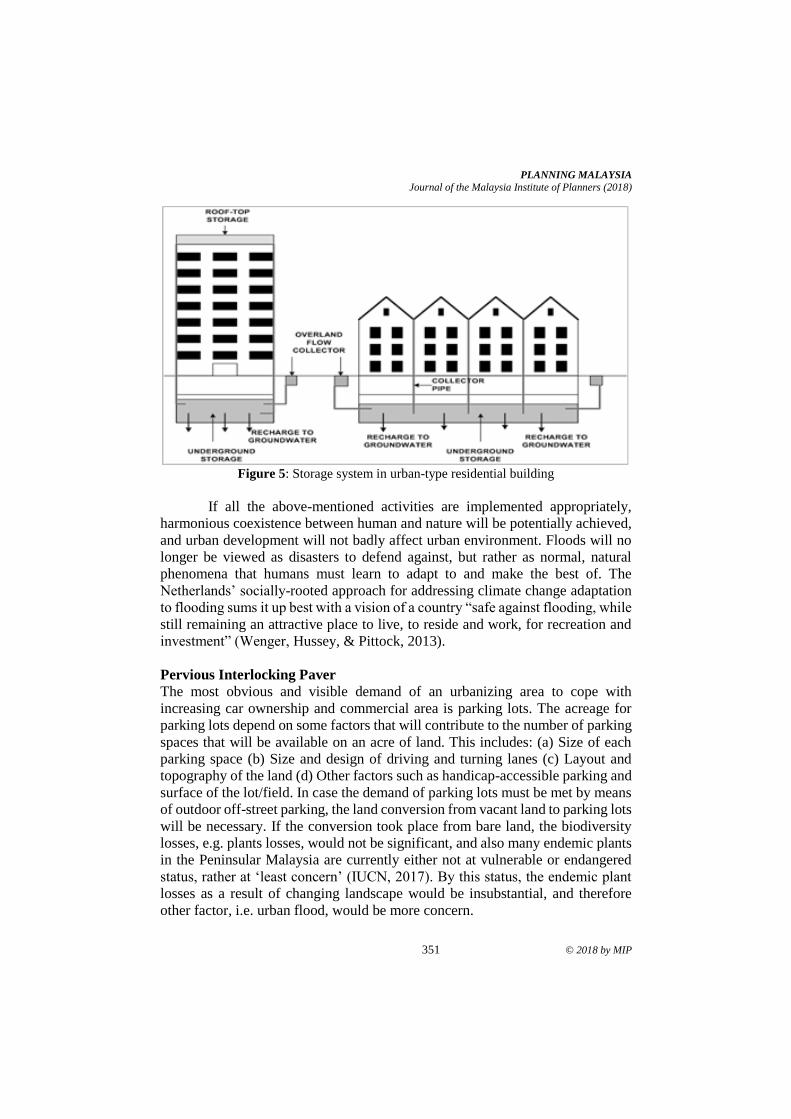
PLANNING MALAYSIA
Journal of the Malaysia Institute of Planners (2018)
351 © 2018 by MIP
Figure 5: Storage system in urban-type residential building
If all the above-mentioned activities are implemented appropriately,
harmonious coexistence between human and nature will be potentially achieved,
and urban development will not badly affect urban environment. Floods will no
longer be viewed as disasters to defend against, but rather as normal, natural
phenomena that humans must learn to adapt to and make the best of. The
Netherlands’ socially-rooted approach for addressing climate change adaptation
to flooding sums it up best with a vision of a country “safe against flooding, while
still remaining an attractive place to live, to reside and work, for recreation and
investment” (Wenger, Hussey, & Pittock, 2013).
Pervious Interlocking Paver
The most obvious and visible demand of an urbanizing area to cope with
increasing car ownership and commercial area is parking lots. The acreage for
parking lots depend on some factors that will contribute to the number of parking
spaces that will be available on an acre of land. This includes: (a) Size of each
parking space (b) Size and design of driving and turning lanes (c) Layout and
topography of the land (d) Other factors such as handicap-accessible parking and
surface of the lot/field. In case the demand of parking lots must be met by means
of outdoor off-street parking, the land conversion from vacant land to parking lots
will be necessary. If the conversion took place from bare land, the biodiversity
losses, e.g. plants losses, would not be significant, and also many endemic plants
in the Peninsular Malaysia are currently either not at vulnerable or endangered
status, rather at ‘least concern’ (IUCN, 2017). By this status, the endemic plant
losses as a result of changing landscape would be insubstantial, and therefore
other factor, i.e. urban flood, would be more concern.
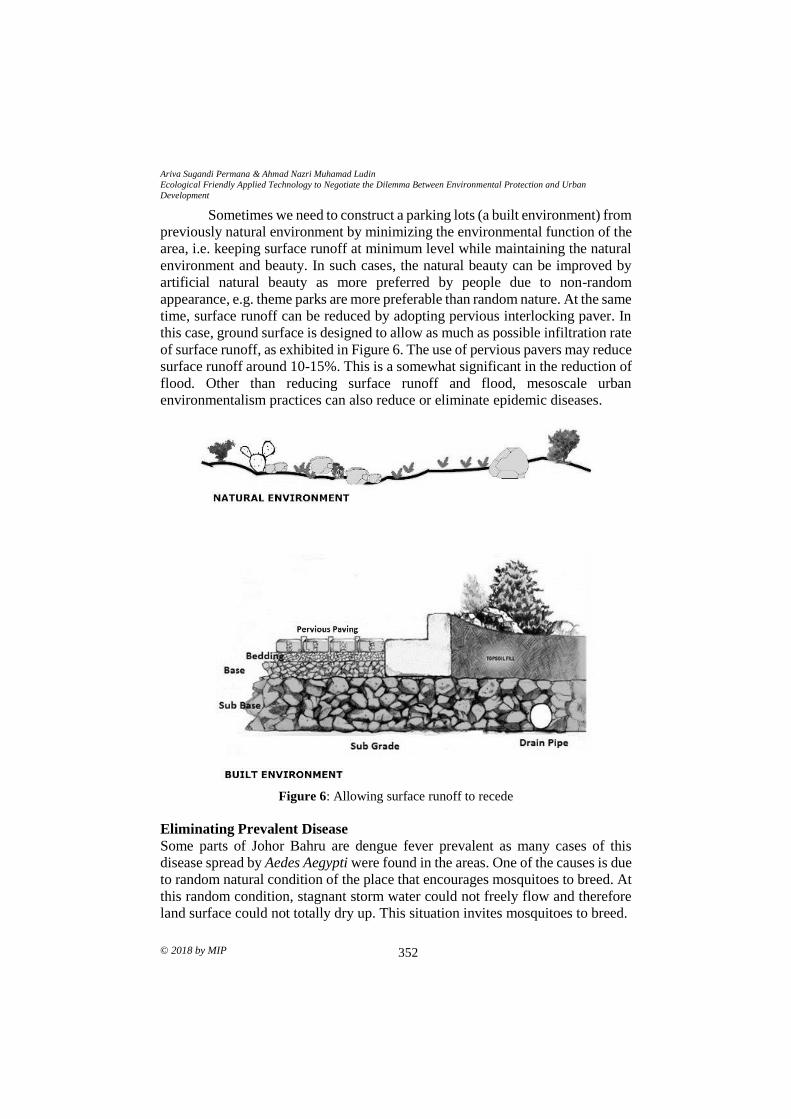
Ariva Sugandi Permana & Ahmad Nazri Muhamad Ludin
Ecological Friendly Applied Technology to Negotiate the Dilemma Between Environmental Protection and Urban
Development
© 2018 by MIP 352
Sometimes we need to construct a parking lots (a built environment) from
previously natural environment by minimizing the environmental function of the
area, i.e. keeping surface runoff at minimum level while maintaining the natural
environment and beauty. In such cases, the natural beauty can be improved by
artificial natural beauty as more preferred by people due to non-random
appearance, e.g. theme parks are more preferable than random nature. At the same
time, surface runoff can be reduced by adopting pervious interlocking paver. In
this case, ground surface is designed to allow as much as possible infiltration rate
of surface runoff, as exhibited in Figure 6. The use of pervious pavers may reduce
surface runoff around 10-15%. This is a somewhat significant in the reduction of
flood. Other than reducing surface runoff and flood, mesoscale urban
environmentalism practices can also reduce or eliminate epidemic diseases.
Figure 6: Allowing surface runoff to recede
Eliminating Prevalent Disease
Some parts of Johor Bahru are dengue fever prevalent as many cases of this
disease spread by Aedes Aegypti were found in the areas. One of the causes is due
to random natural condition of the place that encourages mosquitoes to breed. At
this random condition, stagnant storm water could not freely flow and therefore
land surface could not totally dry up. This situation invites mosquitoes to breed.
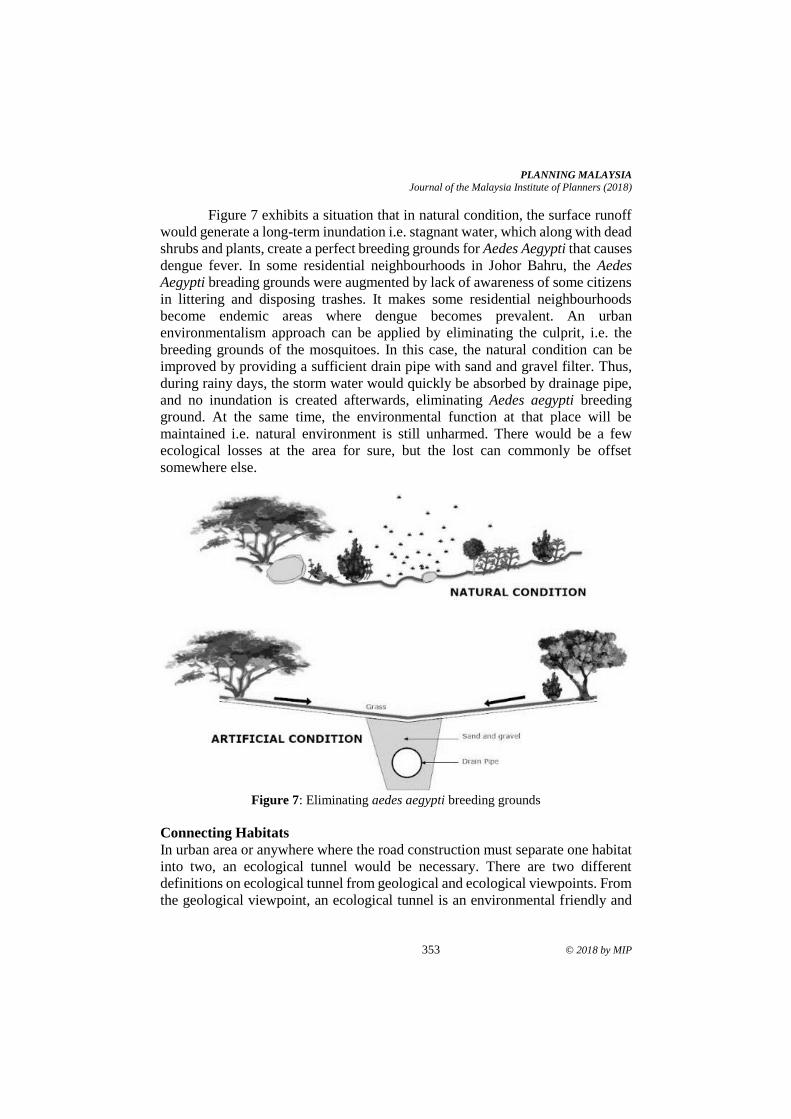
PLANNING MALAYSIA
Journal of the Malaysia Institute of Planners (2018)
353 © 2018 by MIP
Figure 7 exhibits a situation that in natural condition, the surface runoff
would generate a long-term inundation i.e. stagnant water, which along with dead
shrubs and plants, create a perfect breeding grounds for Aedes Aegypti that causes
dengue fever. In some residential neighbourhoods in Johor Bahru, the Aedes
Aegypti breading grounds were augmented by lack of awareness of some citizens
in littering and disposing trashes. It makes some residential neighbourhoods
become endemic areas where dengue becomes prevalent. An urban
environmentalism approach can be applied by eliminating the culprit, i.e. the
breeding grounds of the mosquitoes. In this case, the natural condition can be
improved by providing a sufficient drain pipe with sand and gravel filter. Thus,
during rainy days, the storm water would quickly be absorbed by drainage pipe,
and no inundation is created afterwards, eliminating Aedes aegypti breeding
ground. At the same time, the environmental function at that place will be
maintained i.e. natural environment is still unharmed. There would be a few
ecological losses at the area for sure, but the lost can commonly be offset
somewhere else.
Figure 7: Eliminating aedes aegypti breeding grounds
Connecting Habitats
In urban area or anywhere where the road construction must separate one habitat
into two, an ecological tunnel would be necessary. There are two different
definitions on ecological tunnel from geological and ecological viewpoints. From
the geological viewpoint, an ecological tunnel is an environmental friendly and
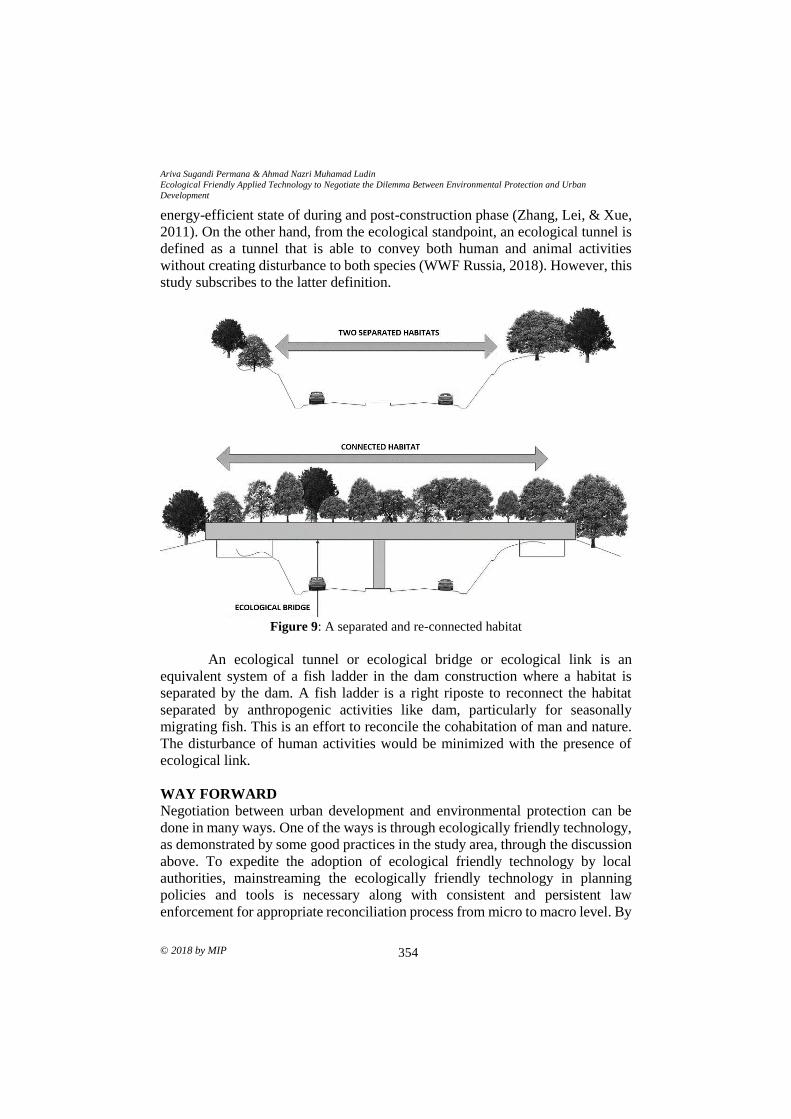
Ariva Sugandi Permana & Ahmad Nazri Muhamad Ludin
Ecological Friendly Applied Technology to Negotiate the Dilemma Between Environmental Protection and Urban
Development
© 2018 by MIP 354
energy-efficient state of during and post-construction phase (Zhang, Lei, & Xue,
2011). On the other hand, from the ecological standpoint, an ecological tunnel is
defined as a tunnel that is able to convey both human and animal activities
without creating disturbance to both species (WWF Russia, 2018). However, this
study subscribes to the latter definition.
Figure 9: A separated and re-connected habitat
An ecological tunnel or ecological bridge or ecological link is an
equivalent system of a fish ladder in the dam construction where a habitat is
separated by the dam. A fish ladder is a right riposte to reconnect the habitat
separated by anthropogenic activities like dam, particularly for seasonally
migrating fish. This is an effort to reconcile the cohabitation of man and nature.
The disturbance of human activities would be minimized with the presence of
ecological link.
WAY FORWARD
Negotiation between urban development and environmental protection can be
done in many ways. One of the ways is through ecologically friendly technology,
as demonstrated by some good practices in the study area, through the discussion
above. To expedite the adoption of ecological friendly technology by local
authorities, mainstreaming the ecologically friendly technology in planning
policies and tools is necessary along with consistent and persistent law
enforcement for appropriate reconciliation process from micro to macro level. By
PLANNING MALAYSIA
Journal of the Malaysia Institute of Planners (2018)
355 © 2018 by MIP
this action, the disturbance to biodiversity, ecological integrity and environmental
disasters, such as urban flood, could be avoided or minimized. At the same time,
urban development could be undertaken without very much worry about
ecological disruption, because the development envisions beyond the planning
horizons.
REFERENCES
Appiah, D. O., Forkuo, E. K., & Bugri, J. T. (2015). Land use conversion probabilities in
a peri-urban district of Ghana. Chinese Journal of Urban and Environmental
Studies, 3(03), 1550026.
Barbier, E. B. (1987). The concept of sustainable economic development. Environmental
conservation, 14(2), 101-110.
Bergstrom, J. C., & Randall, A. (2016). Resource economics: An economic approach to
natural resource and environmental policy. Cheltenham, UK: Edward Elgar
Publishing.
Betz, M. R., Partridge, M. D., Farren, M., & Lobao, L. (2015). Coal mining, economic
development, and the natural resources curse. Energy Economics, 50, 105-116.
Burns, D., Vitvar, T., McDonnell, J., Hassett, J., Duncan, J., & Kendall, C. (2005). Effects
of suburban development on runoff generation in the Croton River basin, New
York, USA. Journal of Hydrology, 31, 266-281.
Carley, M., & Christie, I. (2017). Managing sustainable development. London:
Routledge.
Chen, M., Liu, W., & Lu, D. (2016). Challenges and the way forward in China’s new-
type urbanization. Land Use Policy, 55, 334-339.
Gibbs, D. (1998, November). Ecological Modernization: A Basis for Regional
Development? Seventh International Conference of Greening Industry Network.
Partnership and Leadership: Building Alliance for Sustainable Future.
November 15-18, 1998, Rome, Italy.
Gylfason, T. (2001). Natural resources, education, and economic development. European
Economic Review, 45(4-6), 847-859.
Harper, C., & Snowden, M. (2017). Environment and society: Human perspectives on
environmental issues. London: Routledge.
IUCN (2017). The red list of threatened species (Version 2017-3). Available at
http://www.iucnredlist.org/.
Laurila-Pant, M., Lehikonen, A., Uusitalo, L., & Venerjarvi, R. (2015) How to value
biodiversity in environmental management? Ecological Indicators, 55, 1-11.
Liu, Y., Ahiablame, L. M., Bralts, V. F., & Engel, B. A. (2015). Enhancing a rainfall-
runoff model to assess the impacts of BMPs and LID practices on storm runoff.
Journal of Environmental Management, 147, 12-23.
Lennon, J. J., Kunin, W. E., & Hartely, S. (2002). Fractal species distributions do not
produce power-law species–area relationships. Oikos, 97, 378-386.
Majid, M. R., Jamaludin, J. A. & Ibrahim, W. Y. W. (2013). Estimation of residential
impervious surface using GIS technique. Planning Malaysia Journal, 2, 23-38.
Mol, A. P., Spaargaren, G., & Sonnenfeld, D. A. (2014). Ecological modernization
theory: Taking stock, moving forward. In S. Lockie, D. A. Sonnenfeld, & D. R.
Ariva Sugandi Permana & Ahmad Nazri Muhamad Ludin
Ecological Friendly Applied Technology to Negotiate the Dilemma Between Environmental Protection and Urban
Development
© 2018 by MIP 356
Fisher, Routledge international handbook of social and environmental change
(pp. 15-30). London: Routledge.
Panayotou, T. (1993). Empirical tests and policy analysis of environmental degradation
at different stages of economic development. Geneva: International Labour
Office.
Pearce, D., Barbier, E., & Markandya, A. (2013). Sustainable development: economics
and environment in the Third World. Routledge.
Sachs, W. (2015). Planet dialectics: Explorations in environment and development.
London: Zed Books Ltd..
Shoreman-Ouimet, E., & Kopnina, H. (2015). Reconciling ecological and social justice
to promote biodiversity conservation. Biological Conservation, 184, 320-326.
Solow, R. M. (2016). Resources and economic growth. The American Economist, 61(1),
52-60.
Stenmark, M. (2017). Environmental ethics and policy-making. Londn: Routledge.
Susskind, L. E., & Ali, S. H. (2014). Environmental diplomacy: Negotiating more
effective global agreements. Oxford: Oxford University Press.
Tietenberg, T. H., & Lewis, L. (2016). Environmental and natural resource economics.
(n.p.): Routledge.
Wenger, C., Hussey, K., & Pittock, J. (2013). Living with floods: Key lessons from
Australia and abroad, National Climate Change Adaptation Research Facility,
Gold Coast.
WWF Russia (2018). Ecological tunnel for people and leopards is opened in Russia.
Retrieved from https://wwf.ru/en/resources/news/bioraznoobrazie/narvinskiy-
tonnel-otkryt-v-primore-na-blago-lyudey-i-leopardov/.
Yao, L., Wei, W., & Chen, L. (2016). How does imperviousness impact the urban rainfall-
runoff process under various storm cases? Ecological Indicators, 60, 893-905.
Zhang, Z., Lei, Q., & Xue, Q. (2011). Ecological tunnel for the 21st century: A new
conception and methodology. Journal of Transportation Technologies, 1, 54-57.
Zhou, Y. (2015). State power and environmental initiatives in China: Analyzing China’s
green building program through an ecological modernization perspective. Geoforum,
61, 1-12.
2Associate Professor at Universiti Malaya. Email: [email protected] 357
PLANNING MALAYSIA:
Journal of the Malaysian Institute of Planners
VOLUME 16 ISSUE 3 (2018) Page 357 – 368
IMPEDIMENTS TO HOME OWNERSHIP: PERCEPTION OF LOW-
AND MIDDLE-INCOME TENANTS IN SELANGOR
Yong Kun Hing1 & Kuppusamy Singaravelloo2
Faculty of Economics and Administration
UNIVERSITI MALAYA MALAYSIA
Abstract
Home ownership affordability has been a serious issue among the low and middle
income households in Malaysia. Main contributors to this issue are low income,
high cost of living and growth in income that does not commensurate the rise in
property price. This research intends to identify the level of home ownership
affordability among those who are unable to have a house and are tenants. In
addition, it intends to examine the factors that affect their home ownership
affordability. The study focuses on people residing at rented units in Kajang, an
urban city in Selangor, where primary data was collected using questionnaire
method. The target group was low and middle income households, whose head
of household aged between 21 to 50 years and total household income capped
below RM7,500. The success rate was 74 percent based on 250 households met.
The research findings indicate that the level of home ownership affordability
varies by ethnicity, household income and educational level. Meanwhile, four
main factors that influence home ownership affordability are price of house,
affordable mortgage loan, proximity to workplace and government policy on
affordable housing. Majority of the respondents are still pessimistic of their
ability to own a residential unit.
Keywords: housing, low and middle income household, affordability, access to
housing
Yong Kun Hing & Kuppusamy Singaravelloo
Impediments to Home Ownership: Perception of Low- and Middle-Income Tenants in Selangor
© 2018 by MIP 358
INTRODUCTION
Housing has direct and immediate influence on education, health, political,
environment, security, safety, economy and social life of any society (Ariffin,
Zahari, & Nadarajah, 2010). Carlson et al. (2011, cited by Salhotra, 2018) state
that consequences of inadequate housing include ‘worse health, educational, and
economic outcomes’. Poor families that do not receive housing assistance are
likely affected in their drive to higher education, lower socioeconomic status, and
pose higher chances of teenage pregnancy and being malnourished (Salhotra,
2018). In developing countries, the price of house increases faster than its annual
household income. Although housing reserve may be adequate by quantity, but
as the price is high, those in the lower and middle income groups are unable to
achieve their dream of owning a home (K’Akumu, 2007). For the majority in
these groups, monthly expenditure on housing instalments forms the single
largest category. Quite often, more than 30 percent of their monthly income is
spent on mortgage payments (Beer, Kearins, & Pieters, 2007).
It is commonly known that rapid urbanisation and industrialisation attract
rural to urban immigration in developing countries. This creates a continuous
demand for housing, especially for the immigrants from low and middle income
households at urban areas. Shaffer (2015) points that supply in the United States
is lower than demand due to restrictions by local government in the provision of
housing, mainly from ‘zoning regulations, … approval processes, … and
outdated building codes’ (p. 41). Inadvertently, the value of residential properties
in urban areas has skyrocketed while population growth in urban areas reduces
availability of land for development, leading to an exponential increase in the
premium for urban land (Arıŏglu, 2002) eventually causes the rise in price of new
house. In Malaysia, the price of residential properties in the country grew at 6.45
percent between 2016 and 2017 alone (Valuation and Property Services
Department, 2017). The Malaysian government has carried out policies that focus
on low income households to purchase affordable house. Yet, the volume offered
is still insufficient for this target group (Wan Abd Aziz, Kuppusamy, Doling, &
Hanif, 2014).
While attention is given to the low income group, the middle income
households have been marginalised due to lack of policies to support them. As a
result, the Malaysian government introduced PR1MA houses for the middle
income households earning between RM2,500 and RM7,500 per month, with
conditions that they must be first time buyers, owner-occupied and units cannot
be sold in the first 10 years. For the low income households, the government
looked at providing opportunities for them to rent units. The City Hall of Kuala
Lumpur has been tasked with this initiative by the Ministry of Finance Malaysia,
whereby more than half of its public housing stocks are rented out at a mere
RM124 per month for a three-bedroom unit, and RM55 per month for a studio
unit. Tenants bear no other costs. These are too attractive to many that they do
PLANNING MALAYSIA:
Journal of the Malaysia Institute of Planners (2018)
© 2018 by MIP 359
not want to own it, which would otherwise cost RM250 per month, excluding
the maintenance costs, repairs and taxes (Pros and cons in rent-to-own schemes,
2018). Renting however lead to a shortfall in the sense of belongingness to their
unit, facilities and the neighbourhood.
There is still a dearth of work in tenants and home ownership
affordability in Malaysia. This paper fills the gap in home ownership
affordability, especially discussion on obstacles to home ownership and
affordability among the tenants in urban area among low and middle income
tenants in Selangor and secondly, factors that cause them to continue being
tenants.
THEORETICAL UNDERPINNING
Within the mainstream economic theory, neoclassical economic theory appears
more established to press for liberalising the market from the state in the provision
of goods like housing. The theory states price is determined by an interplay
between supply and demand in the market, which moves into an equilibrium price
when quantity in demand equals its supply (Khalid, 2010). Neoliberalism theory
is widely used to describe liberalisation of government control or protection of
the economy which augments corporate control of the market (Kahn, 2007). In
China, neoliberal reform has brought significant changes in the provision of urban
housing in the 1980s (Wang, Shao, Murie, & Cheng, 2012). In many countries,
neoliberal policy has impacted on the housing provision, opportunities and
affordability (Forrest & Hirayama, 2009).
Duan (2011) applied price to income ratio (PIR) and housing
affordability index to measure housing affordability in Lanzhou, Northwest
China and confirmed that household income is a significant factor of housing
affordability. Besides, Lau and Li (2006) used PIR to analyse the changing
financial ability of Beijing households in the purchase of commercial housing.
Torluccio and Dorakh (2011) identified that housing affordability is not only to
be seen as the ratio of apartment cost to citizen’s income but also the ability to
obtain a loan to buy a house. They pointed that housing affordability in Russia
and Belarus continues to be a big challenge. Home ownership affordability issues
in Australia have been influenced by demographic change, household income,
location, mortgage loan, housing prices, social amenities, economic growth and
government policy (Berry & Dalton, 2004; Berry, 2006; Burke et al., 2008; Yates
& Milligan, 2007; Sliogeris, Crabtree, Phibbs, Johnston, & O'Neill, 2008).
Wan Abd Aziz, Hanif and Kuppusamy (2010), in their study on housing
affordability issues for 1,137 middle income household in major cities in
Malaysia, found that housing affordability is greater amongst private employees
and majority of the middle income households own houses priced between
RM120,000 and RM150,000 in Malaysia except for Kuala Lumpur with a mean
of between RM180,000 and RM200,000.
Yong Kun Hing & Kuppusamy Singaravelloo
Impediments to Home Ownership: Perception of Low- and Middle-Income Tenants in Selangor
© 2018 by MIP 360
Thus, findings above show that home ownership affordability can be
influenced by various factors such as availability of housing loans by financial
institutions, construction cost, household income, housing loan interest rates,
house price, social amenities, demography characteristics, location, population
size, government policies and programmes.
METHODOLOGY
This study was focused on Kajang, a large town situated about 20 kilometres
away from Kuala Lumpur with a population of local citizens being at 311,785
(Department of Statistics, 2011). The research targeted on low and middle
income tenants only. As such, this quantitative study employs a purposive
sampling technique as it required respondents who are aged 21 years old and
above, married and still renting a house. Parents visiting eight kindergartens, one
vernacular primary school and a convent school in the area form the basis of
identifying the respondents, who must be tenants. Once identified, the
respondents were interviewed directly or issued a questionnaire if they insisted
of being given one to answer themselves.
Being the key instrument, the questionnaire used was developed based
on previous studies by scholars in this field such as Trimbath and Montoya
(2002), Berry and Dalton (2004), Berry (2006), Burke and Pinnegar (2007), Md.
Sani (2007), Yates and Milligan (2007), Sliogeris et al. (2008), Duan (2011), and
Torluccio and Dorakh (2011). All questions were closed-ended and based on
perspectives of neo-classical economic and neoliberal theories. The five-point
Likert scale is used to assess the level of agreement to statements. Home
ownership affordability was measured using 17 statements but was reduced to
only 14 after a pilot test. The alpha reliability coefficient scores for the items in
the pilot test were 0.7799. As many as 250 sets of questionnaires were distributed
but only 204 sets of questionnaires were returned successfully. After a review,
19 sets of questionnaires were removed as they did not comply fully to the
criteria set. Therefore, only 185 sets of questionnaires were used in this study,
with an alpha value of 0.7916 in the final test. We have left the housing
affordability level to be decided by the respondents themselves.
DATA ANALYSIS
Data analysis techniques used in this study is quantitative. The factor analysis as
an inferential statistical analysis is used in this study based on the data obtained
from the survey questionnaire to determine the factors that influence the
respondents’ home ownership affordability. The factor analysis techniques
reduced and clustered the original 14 observed variables into a small number of
factors. The second objective of this paper is assisted through the use of
Exploratory Factor Analysis (EFA). Meanwhile, chi-square test was also used to
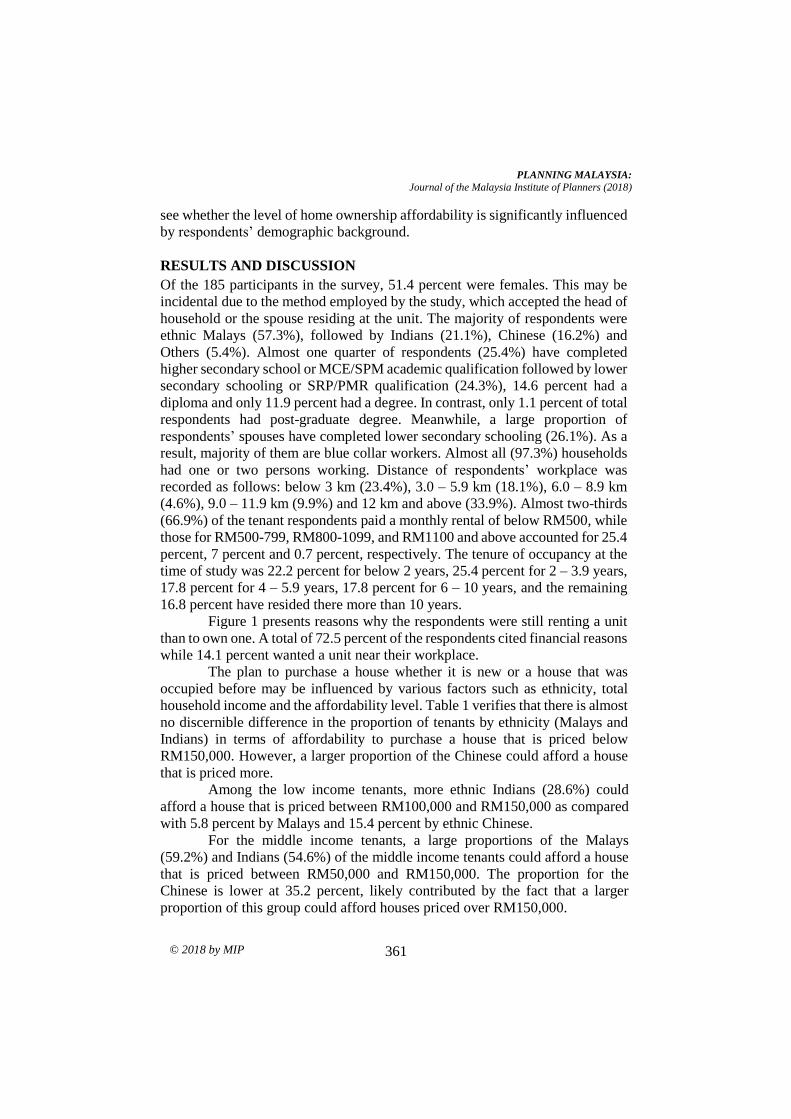
PLANNING MALAYSIA:
Journal of the Malaysia Institute of Planners (2018)
© 2018 by MIP 361
see whether the level of home ownership affordability is significantly influenced
by respondents’ demographic background.
RESULTS AND DISCUSSION
Of the 185 participants in the survey, 51.4 percent were females. This may be
incidental due to the method employed by the study, which accepted the head of
household or the spouse residing at the unit. The majority of respondents were
ethnic Malays (57.3%), followed by Indians (21.1%), Chinese (16.2%) and
Others (5.4%). Almost one quarter of respondents (25.4%) have completed
higher secondary school or MCE/SPM academic qualification followed by lower
secondary schooling or SRP/PMR qualification (24.3%), 14.6 percent had a
diploma and only 11.9 percent had a degree. In contrast, only 1.1 percent of total
respondents had post-graduate degree. Meanwhile, a large proportion of
respondents’ spouses have completed lower secondary schooling (26.1%). As a
result, majority of them are blue collar workers. Almost all (97.3%) households
had one or two persons working. Distance of respondents’ workplace was
recorded as follows: below 3 km (23.4%), 3.0 – 5.9 km (18.1%), 6.0 – 8.9 km
(4.6%), 9.0 – 11.9 km (9.9%) and 12 km and above (33.9%). Almost two-thirds
(66.9%) of the tenant respondents paid a monthly rental of below RM500, while
those for RM500-799, RM800-1099, and RM1100 and above accounted for 25.4
percent, 7 percent and 0.7 percent, respectively. The tenure of occupancy at the
time of study was 22.2 percent for below 2 years, 25.4 percent for 2 – 3.9 years,
17.8 percent for 4 – 5.9 years, 17.8 percent for 6 – 10 years, and the remaining
16.8 percent have resided there more than 10 years.
Figure 1 presents reasons why the respondents were still renting a unit
than to own one. A total of 72.5 percent of the respondents cited financial reasons
while 14.1 percent wanted a unit near their workplace.
The plan to purchase a house whether it is new or a house that was
occupied before may be influenced by various factors such as ethnicity, total
household income and the affordability level. Table 1 verifies that there is almost
no discernible difference in the proportion of tenants by ethnicity (Malays and
Indians) in terms of affordability to purchase a house that is priced below
RM150,000. However, a larger proportion of the Chinese could afford a house
that is priced more.
Among the low income tenants, more ethnic Indians (28.6%) could
afford a house that is priced between RM100,000 and RM150,000 as compared
with 5.8 percent by Malays and 15.4 percent by ethnic Chinese.
For the middle income tenants, a large proportions of the Malays
(59.2%) and Indians (54.6%) of the middle income tenants could afford a house
that is priced between RM50,000 and RM150,000. The proportion for the
Chinese is lower at 35.2 percent, likely contributed by the fact that a larger
proportion of this group could afford houses priced over RM150,000.
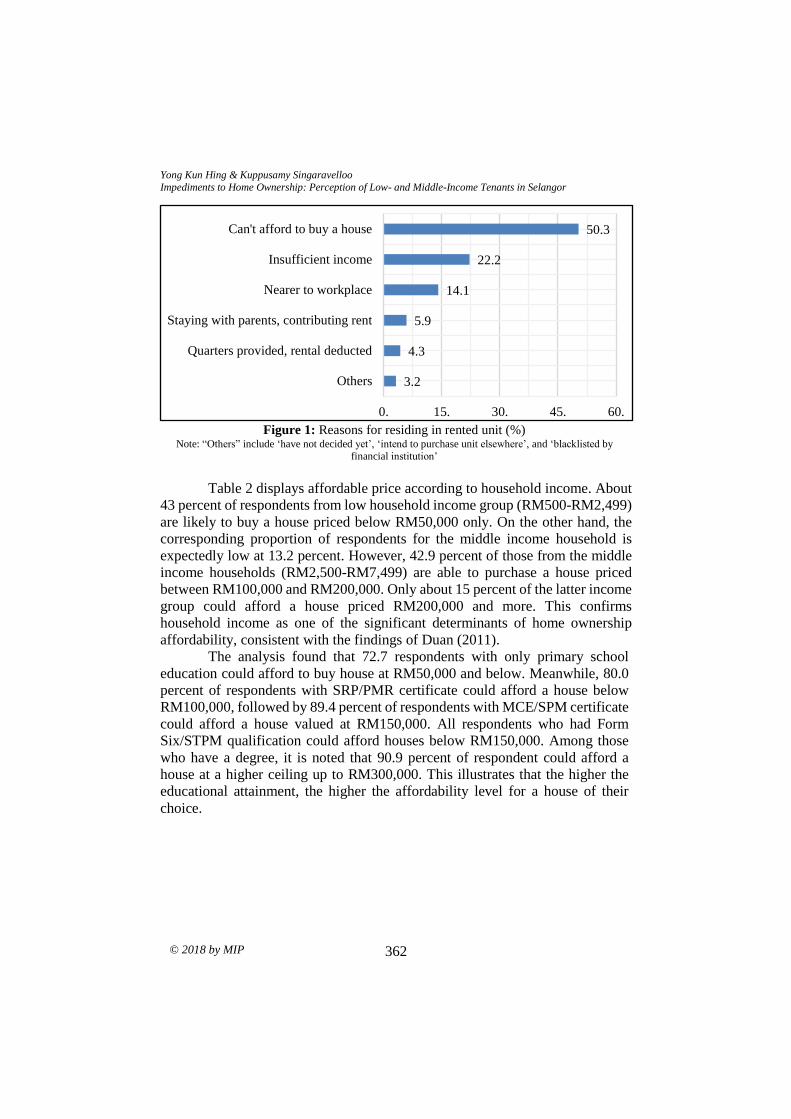
Yong Kun Hing & Kuppusamy Singaravelloo
Impediments to Home Ownership: Perception of Low- and Middle-Income Tenants in Selangor
© 2018 by MIP 362
Figure 1: Reasons for residing in rented unit (%)
Note: “Others” include ‘have not decided yet’, ‘intend to purchase unit elsewhere’, and ‘blacklisted by
financial institution’
Table 2 displays affordable price according to household income. About
43 percent of respondents from low household income group (RM500-RM2,499)
are likely to buy a house priced below RM50,000 only. On the other hand, the
corresponding proportion of respondents for the middle income household is
expectedly low at 13.2 percent. However, 42.9 percent of those from the middle
income households (RM2,500-RM7,499) are able to purchase a house priced
between RM100,000 and RM200,000. Only about 15 percent of the latter income
group could afford a house priced RM200,000 and more. This confirms
household income as one of the significant determinants of home ownership
affordability, consistent with the findings of Duan (2011).
The analysis found that 72.7 respondents with only primary school
education could afford to buy house at RM50,000 and below. Meanwhile, 80.0
percent of respondents with SRP/PMR certificate could afford a house below
RM100,000, followed by 89.4 percent of respondents with MCE/SPM certificate
could afford a house valued at RM150,000. All respondents who had Form
Six/STPM qualification could afford houses below RM150,000. Among those
who have a degree, it is noted that 90.9 percent of respondent could afford a
house at a higher ceiling up to RM300,000. This illustrates that the higher the
educational attainment, the higher the affordability level for a house of their
choice.
50.3
22.2
14.1
5.9
4.3
3.2
0. 15. 30. 45. 60.
Can't afford to buy a house
Insufficient income
Nearer to workplace
Staying with parents, contributing rent
Quarters provided, rental deducted
Others
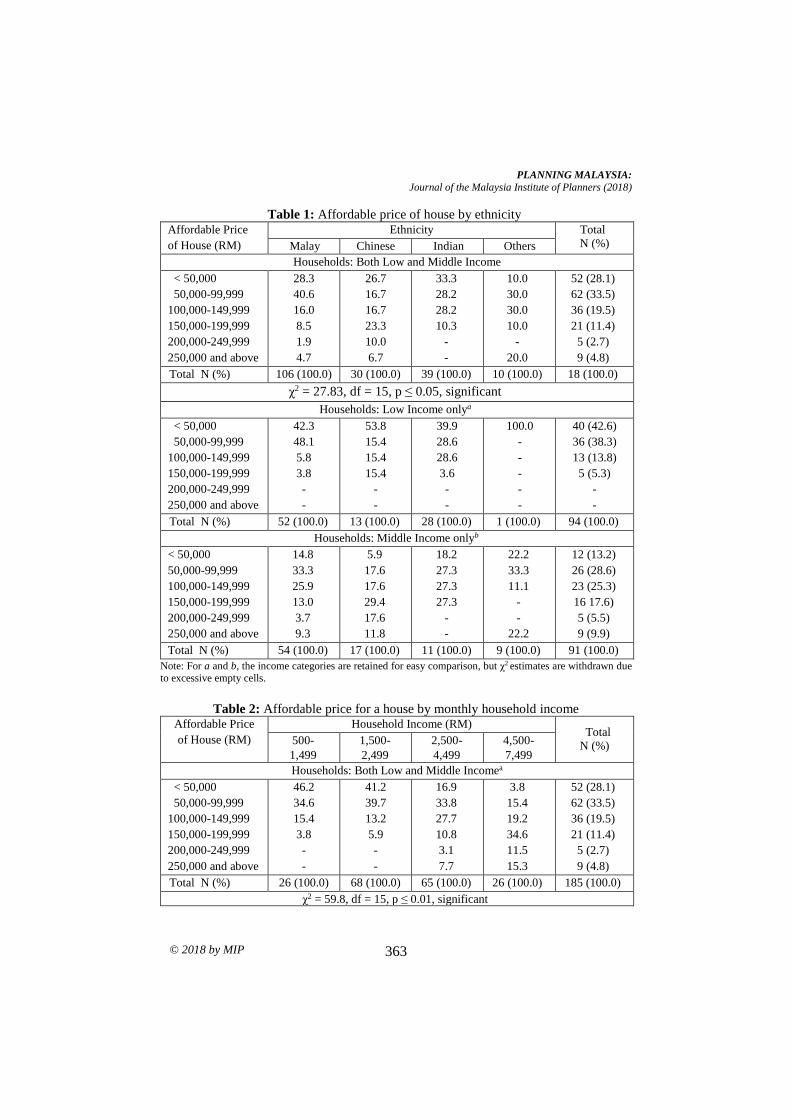
PLANNING MALAYSIA:
Journal of the Malaysia Institute of Planners (2018)
© 2018 by MIP 363
Table 1: Affordable price of house by ethnicity Affordable Price
of House (RM) Ethnicity Total
N (%) Malay Chinese Indian Others
Households: Both Low and Middle Income < 50,000
50,000-99,999
100,000-149,999
150,000-199,999
200,000-249,999
250,000 and above
28.3
40.6
16.0
8.5
1.9
4.7
26.7
16.7
16.7
23.3
10.0
6.7
33.3
28.2
28.2
10.3
-
-
10.0
30.0
30.0
10.0
-
20.0
52 (28.1)
62 (33.5)
36 (19.5)
21 (11.4)
5 (2.7)
9 (4.8)
Total N (%) 106 (100.0) 30 (100.0) 39 (100.0) 10 (100.0) 18 (100.0)
χ2 = 27.83, df = 15, p ≤ 0.05, significant
Households: Low Income onlya
< 50,000
50,000-99,999
100,000-149,999
150,000-199,999
200,000-249,999
250,000 and above
42.3
48.1
5.8
3.8
-
-
53.8
15.4
15.4
15.4
-
-
39.9
28.6
28.6
3.6
-
-
100.0
-
-
-
-
-
40 (42.6)
36 (38.3)
13 (13.8)
5 (5.3)
-
-
Total N (%) 52 (100.0) 13 (100.0) 28 (100.0) 1 (100.0) 94 (100.0)
Households: Middle Income onlyb
< 50,000
50,000-99,999
100,000-149,999
150,000-199,999
200,000-249,999
250,000 and above
14.8
33.3
25.9
13.0
3.7
9.3
5.9
17.6
17.6
29.4
17.6
11.8
18.2
27.3
27.3
27.3
-
-
22.2
33.3
11.1
-
-
22.2
12 (13.2)
26 (28.6)
23 (25.3)
16 17.6)
5 (5.5)
9 (9.9)
Total N (%) 54 (100.0) 17 (100.0) 11 (100.0) 9 (100.0) 91 (100.0)
Note: For a and b, the income categories are retained for easy comparison, but χ2 estimates are withdrawn due to excessive empty cells.
Table 2: Affordable price for a house by monthly household income
Affordable Price
of House (RM) Household Income (RM)
Total
N (%) 500-
1,499
1,500-
2,499
2,500-
4,499
4,500-
7,499
Households: Both Low and Middle Incomea < 50,000
50,000-99,999
100,000-149,999
150,000-199,999
200,000-249,999
250,000 and above
46.2
34.6
15.4
3.8
-
-
41.2
39.7
13.2
5.9
-
-
16.9
33.8
27.7
10.8
3.1
7.7
3.8
15.4
19.2
34.6
11.5
15.3
52 (28.1)
62 (33.5)
36 (19.5)
21 (11.4)
5 (2.7)
9 (4.8)
Total N (%) 26 (100.0) 68 (100.0) 65 (100.0) 26 (100.0) 185 (100.0)
χ2 = 59.8, df = 15, p ≤ 0.01, significant
Yong Kun Hing & Kuppusamy Singaravelloo
Impediments to Home Ownership: Perception of Low- and Middle-Income Tenants in Selangor
© 2018 by MIP 364
Low Income
Households
Middle Income
Households
< 50,000
50,000-99,999
100,000-149,999
150,000-199,999
200,000-249,999
250,000 and above
42.6
38.3
13.8
5.3
-
-
13.2
28.6
25.3
17.6
5.5
9.9
Total N (%) 94 (100.0) 91 (100.0)
χ2 = 39.2, df = 15, p ≤ 0.01, significant
Level of Home Ownership Affordability among Tenants
Table 3 shows that the level of home ownership affordability between low and
middle income tenants is, as expected, different.
Table 3: Affordability level between low and middle income households
Description Low Income
Households
Middle Income
Households
Affordable Price (RM) 100,000 and below
(80.9%)
100,000 - 200,000
(42.9%)
Affordable Deposit (RM) 5,000 or below (78.7%) 10,000 or below (81.3%)
Affordable Monthly Housing Loan
Payment (RM) 500 or below (81.9%) Below 800 (81.4%)
Source: Survey results
Perception of Government Policy in the Provision of Affordable Housing
Data available from the study show that almost three quarters of respondents
(73.5%) were still dissatisfied with the performance of the government on public
home ownership. The respondents were unsure (46.5%) whether the National
Housing Policy could bring house prices down in the future. This study shows
that the government policy is still unsuccessful on the provision of affordable
housing as viewed by the respondents. It also reflects that 16.5 percent of the
middle income households and 14.9 percent of the low income households feel
pessimistic that “National Housing Policy will force house prices to decrease in
the future”. Furthermore, 27.5 percent of the middle income households agree
that the government’s housing policy was ineffective on home ownership in urban
areas. These distributions show some extent of discomfort with the ability of the
government in handling the provision of affordable housing.
PLANNING MALAYSIA:
Journal of the Malaysia Institute of Planners (2018)
© 2018 by MIP 365
Factors Affecting Home Ownership Affordability
We used 14 statements to explore factors influencing home ownership
affordability premised on perspectives of neoclassical economic and neoliberal
theories. They are housing price, household income, daily expenditure, interest
rates, monthly instalment, housing loan, economic crisis, public amenities,
transportation, network, nearby workplace, supply affordable housing, perception
of National Housing Policy, government policy and enforcement.
The employment of a factor analysis using the principal component
model in this analysis reduced these variables into several key factors using
orthogonal rotation (Hair, Black, Babin, & Anderson, 2010). Although Field
(2005) suggested critical factor loadings to be 0.4, we set a higher critical factor
loading at 0.5. Four factors were produced – labelled as Affordable Mortgage
Loan (monthly instalment, housing loan, household income, daily expenditure
and fear of economic crisis); Housing Price (enforcement, interest rates, housing
price and supply affordable house); Proximity to Workplace (nearby workplace,
transportation network and public amenities) and Government Policy on
Affordable Housing (national housing policy and government policy).
In real terms, Affordable Mortgage Loan allows an individual to submit
an application for a loan, and once approved, he/she worries whether he/she can
afford to pay the monthly housing loan instalment. This behaviour which focuses
on affordable mortgage loan is as predicted by neo-classical economic theory.
Meanwhile, on Housing Price, people complain that they could not afford to buy
a house due to constant increases in house price as the latter is determined by the
market forces causing the poor to remain being tenants. The neoliberal theory
widely applies in the Malaysian housing market.
Proximity to Workplace, contributes to home ownership affordability
because people prefer to stay in places nearby their workplace, public
infrastructure and facilities to save time and cost. The final factor Government
Policy on Affordable Housing, relates to the Ministry of Housing and Local
Government and Ministry of Finance which are directly involved in addressing
the problem of housing affordability. Nevertheless, according to neoliberal
theory, the government should stay away from intervening in the market. On the
contrary, the Malaysian government attempts to assist the low income group to
own a house through national housing policy and applies minimal intervention in
the upper band of housing industry (Wan Abd Aziz et al., 2014). Private
developers are not keen to produce housing units for the low income people as
they gain too little from it.
CONCLUSION
In conclusion, the finding shows that a large proportion of the middle income
tenants in Kajang could afford to buy house priced at RM100,000 to RM200,000,
while the majority of low income tenants could only afford a house price less than
Yong Kun Hing & Kuppusamy Singaravelloo
Impediments to Home Ownership: Perception of Low- and Middle-Income Tenants in Selangor
© 2018 by MIP 366
RM100,000. These are still difficult to find due to the high housing prices in
Kajang contributed by its proximity to Kuala Lumpur and Federal Government
Administrative Centre of Putrajaya. Meanwhile, they still prefer to be tenants at
Kajang due to proximity to their workplace. This somewhat mirrors the finding
of Cox and Followill (2018) whose exploration of historical data in few US cities
found that home ownership is not always the best decision. Furthermore, they
also worry whether they can afford to pay the monthly housing loan instalment
once they secure a loan. With these compounding reasons, they are most likely to
continue to stay in rental homes than to buy a house at current scenario. But, being
a tenant does not free them from rises in the rental rates.
Although the government has implemented various programmes and
activities to ensure the people, especially urban low income group, have access
to housing market, there exists a serious impurity in the imbalance between
demand and supply of housing units. Home ownership affordability cannot be
solved just by giving subsidy or zero deposit to purchase a house. It is because
owning a house does not just involve the payment of deposit but also involves the
commitment to monthly instalments for the next 25 years or so, involving the
burden to commit about one-third of their income. Thus, buying a house and the
ability to hold on to home ownership are two different things. Then comes the
need to commit a deposit for the unit. Providing a low public assisted interest rate
for their housing loan may help.
ACKNOWLEDGEMENT
An earlier version of this paper was presented at the APNHR Conference.
REFERENCES Ariffin, R. N. R., Zahari, R. K., & Nadarajah, S. (2010, July). Residential satisfaction in
private low-cost housing in the urban area: a case study of the Klang Valley,
Malaysia. 22nd International Housing Research Conference. July 4-7, 2010,
Istanbul, Turkey.
Arıŏglu, N. (2002). The usage trends of materials in high-rise buildings. In O. Ural, V.
Abrantes, & A. Tadeu (Eds.), Housing construction: An interdisciplinary task (pp.
1655-1660). Portugal: University of Coimbra.
Beer, A., Kearins, B., & Pieters, H. (2007). Housing affordability and planning in
Australia: The challenge of policy under neoliberalism, Housing Studies, 22(1),
11-24.
Berry, M. (2006). Housing affordability and the economy: A review of macroeconomic
impacts and policy issues. Research Paper 4. Australian Housing and Urban
Research Institute: RMIT-NATSEM Research Institute.
Berry, M., & Dalton, T. (2004). Housing prices and policy dilemmas: A peculiarly
Australian problem? Urban Policy and Research, 22(1), 69-91.
PLANNING MALAYSIA:
Journal of the Malaysia Institute of Planners (2018)
© 2018 by MIP 367
Burke, T., Pinnegar, S., Phibbs, P., Neske, C., Gabriel, M., Ralston, L., Ruming, K. (2008)
Experiencing the housing affordability problem: blocked aspirations, trade-offs
and financial hardships, AHURI Research Paper No. NRV3-9. Australian Housing
and Urban Research Institute Limited, Melbourne.
Cox, A., & Followill (2018). To rent of buy? A 30-year perspective. Journal of Financial
Planning, 31(5), 48-55.
Duan, M. (2011). Investigation on housing affordability in Lanzhou, Northwest China.
International Journal of Housing Markets and Analysis, 4(2), 180-190.
Field, A. (2005). Discovering SPSS for windows: Advanced techniques for the beginner.
London: Sage Publications.
Forrest, R., & Hirayama, Y. (2009). The uneven impact of neoliberalism on housing
opportunities. International Journal of Urban and Regional Research, 33(4), 998-
1013.
Hair, J. R., Black, W. C., Babin, B. J., & Anderson, R. E. (2010). Multivariate data
analysis: A global perspective. Singapore: Pearson.
K’Akumu, O. A. (2007). Strategizing the decennial census of housing for poverty
reduction in Kenya. International Journal of Urban and Regional Research, 31(3),
657-674.
Kahn, J. (2007). World trade, world bank, privatization: Neoliberalism the economics
favored by big business, banks, and our government. Retrieved from
http://www.skeptically.org/wto/id10.html.
Khalid, M. S. (2010). Abandoned housing development: The Malaysian experience
(Doctoral dissertation). Heriot-Watt University, Edinburgh, Sctland.
Lau, K. M., & Li, S. M. (2006). Commercial housing affordability in Beijing, 1992-2002.
Habitat International, 30(2006), 614-627.
Malaysia, Department of Statistics (2011). Population distribution by local authority
areas and mukims 2010. Putrajaya: Author.
Md. Sani, N. (2007). Kemampuan pemilikan rumah kos rendah di Kuala Lumpur
(Doctoral dissertation). Universiti Sains Malaysia, Penang, Malaysia.
Pros and cons in rent-to-own schemes (2018, July 28). The Star Bizproperty. Retrieved
from https://www.thestar.com.my/business/business-news/2018/07/28/pros-and-
cons-in-renttoown-schemes/
Salhotra, R. (2018). Inadequate affordable housing in Houston: Causes, effects, and
solutions. Kansas Journal of Law & Public Policy, 27(2), 186-210.
Shaffer, B. (2015). Affordable housing in the Big City: A look at causes and current
policies in San Francisco, Boston, and New York. Harvard Kennedy School
Review, 15, 40-46.
Sliogeris, E., Crabtree, L., Phibbs, P., Johnston, K., & O'Neill, P. (2008). Housing
affordability literature review and affordable housing program audit. Penrith,
N.S.W: University of Western Sydney.
Yong Kun Hing & Kuppusamy Singaravelloo
Impediments to Home Ownership: Perception of Low- and Middle-Income Tenants in Selangor
© 2018 by MIP 368
Torluccio, G., & Dorakh, A. (2011). Housing affordability and methodological principles:
An application. International Research Journal of Finance and Economics, 79,
64-78.
Trimbath, S., & Montoya, J. (2002). Housing affordability in three dimensions: Price,
income and interest rates. California: Milken Institute.
Valuation and Property Services Department. (2017). Malaysian house price index.
Retrieved August 2, 2018 from http://napic.jpph.gov.my/portal.
Wan Abd Aziz, W. N. A., Kuppusamy, S., Doling, J., & Hanif, N. R. (2014). Towards a
housing policy in Malaysia. In J. Doling, & R. Ronald (Eds.), Housing East Asia:
Socioeconomic and demographic challenges. London: Palgrave Macmillan.
Wan Abd Aziz, W. N. A., Hanif, N. R., & Kuppusamy, S. (2010). Housing affordability
issues for middle income households: The Malaysian perspective. Paper presented
at the 22nd International Housing Research Conference, ENHR 2010, 4-7 July,
Istanbul.
Wang, Y. P., Shao, L., Murie, A., & Cheng, J. (2012). The maturation of the neo-liberal
housing market in urban China. Housing Studies, 27(3), 343-359.
Yates, J., & Milligan, V. (2007). Housing affordability: A 21st century problem, Final
report. Australian Housing and Urban Research Institute (AHURI), Sydney
Research Centre.
.
PLANNING MALAYSIA
Journal of the Malaysia Institute of Planners (2020)
193 © 2020 by MIP
NOTES TO CONTRIBUTORS AND GUIDELINES FOR MANUSCRIPT
SUBMISSION
INTRODUCTION
The Journal of the Malaysian Institute of Planners or PLANNING MALAYSIA is a
multidisciplinary journal related to theory, experiments, research, development,
applications of ICT, and practice of planning and development in Malaysia and
elsewhere.
The objective of the journal is to promote the activity of town planning through dialogue
and exchange of views concerning professional town planning practice. PLANNING
MALAYSIA will welcome any news, feature articles, or peer reviewed (including book
reviews, software review, etc.) articles for publication. All articles should be original
work by the authors. Articles, views and features will not be taken to be the official
view of the Malaysian Institute of Planners (MIP) unless it carries the name of MIP
as the author. This is to encourage open discussion on diverse issues and opinion for the
advancement of town planning practice. Articles and contributions will be accepted from
MIP members and non-members worldwide.
In year 2010, PLANNING MALAYSIA Journal has been indexed in SCOPUS. Previous
issues of PLANNING MALAYSIA Journal can be viewed on the MIP website.
SUBMISSION OF MANUSCRIPTS
Manuscript should be emailed to [email protected]. Manuscript should ideally be
in the range of 8-10 pages long. Each manuscript should have a title page and an abstract
of about 150 words. The title page should contain the title, full name(s), designation(s),
organizational affiliation(s), a contact address, and an email address. All manuscripts are
received on the understanding that they are not under concurrent consideration at another
journal. Exclusive copyright of accepted manuscripts shall be assigned to the Publisher
(i.e. the MIP), and in consideration for this, one copy of the current Journal will be
provided for each article. Additional reprints of article can be ordered, at cost, by the
author(s). PDF format of the article (if available) can be obtained from the Publisher.
LAYOUT
Manuscript should be typed in single spacing (including footnotes, endnotes and
references) on one side of the paper only (preferably A4) with the following margins:
right and left - 4.25 cm, top - 5.5 cm and bottom - 5.2 cm (including header – 4.5 cm and
footer – 4.3 cm) in 11 point Times New Roman font. Footnotes should be numbered
consecutively and placed at the end of the manuscript. Footnotes should be kept to a
minimum. Tables and diagrams should be provided in the text. References should follow
the APA (6th Edition) referencing format. All foreign words must be typed and
transliterated. The Editorial Board reserves the right to change the transliteration of all
historical names, titles and non-English terminology to bring them into conformity with
its own style.
Guidelines
© 2020 by MIP 194
USE OF FORMULA, FIGURES AND TABLES
Formula (mathematical formula) should be used only when necessary and the
CONCLUSION derived must be explained and made intelligible to a non-mathematical
reader. Wherever possible, authors are encouraged to place the mathematical parts of the
article in an appendix. In cases of empirical articles, authors are expected to make readily
available a complete set of data and any specialized computer programs to interested
readers.
All illustrations, figures and/or tables in the manuscript must be captioned, in clear black
and white (grayscale) and ready for reproduction.
REFEREEING PROCEDURE
Manuscripts will be acknowledged upon receipt. Only selected (preferred) manuscripts
will be reviewed by two (or three) referees in addition to the editors. Editorial decision
will normally be made within two to six months, but circumstances beyond control
occasionally dictate a longer cycle. If authors are invited to prepare a revision for further
consideration, the major issues to be resolved will be outlined and will be forwarded to
them as quickly as possible.
ACCEPTED ARTICLES
Authors of accepted articles will be requested to provide a digital copy of the manuscript,
preferably in Microsoft Word to the MIP (the Publisher) via email at
[email protected]. MIP will not be responsible for the loss or damage of the digital
copy.
COPYRIGHT
Copyright & Creative Commons Licence
eISSN: 0128-0945 © Year. The Authors. Published for Malaysia insititute of planner.
This is an open-access article under the CC BY-NC-ND license.
The authors hold the copyright without restrictions and also retain publishing rights
without restrictions.
Contact:
Editor-in-Chief
PLANNING MALAYSIA
Journal of the Malaysian Institute of Planners
B-01-02, Jalan SS7/13B, Aman Seri, Kelana Jaya,
47301, Petaling Jaya, Selangor Darul Ehsan, MALAYSIA
Tel: +603 78770637 Fax: +603 78779636
Email: [email protected]
Homepage: www.planningmalaysia.org
***
PLANNING MALAYSIA
Journal of the Malaysia Institute of Planners (2020)
195 © 2020 by MIP
ETHIC STATEMENT
The Journal of the Malaysia Institute of Planners or PLANNING MALAYSIA is a peer-
reviewed journal. This statement spells out ethical behaviour of all parties involved in the
act of publishing an article for this journal, i.e. the author, the peer-reviewer, the chief
editor and editors, and the publisher. This statement is based on COPE’s Best Practice
Guidelines for Journal Editors. URL: http://publicationethics.org/files/u2
/Best_Practice.pdf
DUTIES OF AUTHORS
Reporting Standards
Authors of original research should present an accurate account of the work done as well
as an objective discussion of its significance. Data of the research should be represented
accurately in the article. An article should contain sufficient detail and references to
permit others to replicate the work. Fraudulent or knowingly inaccurate statements
constitute unethical behaviour and are unacceptable.
Data Access and Retention
Authors may be asked to provide the raw data in connection with an article submitted for
editorial review, and should be prepared to provide public access to such, if practicable,
and should in any event be prepared to retain such data for a reasonable time after
publication.
Originality and Plagiarism
Authors should ensure that they have written entirely original works, and if the authors
have used the work and/or words of others this must be appropriately cited or quoted.
Such quotations and citations must be listed in the Reference at the end of the article.
Multiple Publication
An author should not in general publish manuscripts describing essentially the same
research in more than one journal or primary publication. Submitting the same manuscript
to more than one journal concurrently constitutes unethical publishing behaviour and is
unacceptable.
Acknowledgment of Sources
Proper acknowledgment of the work of others must always be given. Authors should cite
publications that have been influential in determining the nature of the reported work.
Authorship of the Paper
Authorship should be limited to those who have made a significant contribution to the
conception, design, execution, or interpretation of the study, and should be listed as co-
authors. Others who have participated in certain substantive aspects of the research
project, they should be acknowledged or listed as contributors.
Ethic Statement
© 2020 by MIP 196
Corresponding Author
Corresponding author is the author responsible for communicating with the journal for
publication. The corresponding author should ensure that all appropriate co-authors and
no inappropriate co-authors are included on the paper. All co-authors have seen and
approved the final version of the paper and have agreed to its submission for publication.
Acknowledgment of Funding Sources
Sources of funding for the research reported in the article should be duly acknowledged
at the end of the article.
Disclosure and Conflicts of Interest
All authors should disclose in their manuscript any financial or other substantive conflict
of interest that might be construed to influence the results or interpretation of their
manuscript.
Fundamental Errors in Published Works
When an author discovers a significant error or inaccuracy in his/her own published work,
it is the author’s obligation to promptly notify the journal editor or publisher and
cooperate with the editor to retract or correct the paper.
DUTIES OF REVIEWERS
Contribution of Peer Review
Peer review assists the chief editor and the editorial board in making editorial decisions
while editorial communications with the author may also assist the author in improving
the paper.
Unqualified to Review or Promptness
Any reviewer who feels unqualified to review the assigned manuscript or unable to
provide a prompt review should notify the editor and excuse himself/herself from the
review process.
Confidentiality
Manuscripts received for review must be treated as confidential documents. They must
not be shown to, or discussed with, others except as authorized by the chief editor.
Privileged information or ideas obtained through peer review must be kept confidential
and not used for personal advantage.
Standards of Objectivity
Reviews should be conducted objectively. There shall be no personal criticism of the
author. Reviewers should express their views clearly with supporting arguments.
Acknowledgment of Sources
Reviewers should identify relevant published work that has not been cited by the authors.
Any statement that had been previously reported elsewhere should be accompanied by
the relevant citation. A reviewer should also call to the chief editor's attention any
PLANNING MALAYSIA
Journal of the Malaysia Institute of Planners (2020)
197 © 2020 by MIP
substantial similarity or overlap between the manuscript under consideration and any
other published paper of which they have personal knowledge.
Conflict of Interest
Reviewers should decline to review manuscripts in which they have conflicts of interest
resulting from competitive, collaborative, or other relationships or connections with any
of the authors.
DUTIES OF EDITORS
Decision on the Publication of Articles
The chief editor of the PLANNING MALAYSIA is responsible for deciding which of the
articles submitted to the journal should be published. The chief editor may be guided by
the policies of the journal's editorial board subjected to such legal requirements regarding
libel, copyright infringement and plagiarism. The chief editor may confer with other
editors or reviewers in making this decision.
Fair play
Manuscripts shall be evaluated solely on their intellectual merit.
Confidentiality
The chief editor/editors and any editorial staff must not disclose any information about a
submitted manuscript to anyone other than the corresponding author, reviewers, potential
reviewers, other editorial advisers, and the publisher.
Disclosure and Conflicts of Interest
Unpublished materials disclosed in a submitted manuscript must not be used by anyone
who has a view of the manuscript while handling it in his or her own research without the
express written consent of the author