21 PLANNING MALAYSIA: Journal of the Malaysian Institute of Planners Volume XI (2013), Page 21 - 40 PERCEPTIONS ON QUALITY OF LIFE IN MALAYSIA: THE URBAN- RURAL DIVIDE Norhaslina Hassan 1 , Noor Ismawati Mohd Jaafar 2 , Raja Noriza Raja Ariffin 3 , Asnarulkhadi Abu Samah 4 & Mohd Nazari Jaafar 5 1 Faculty of Arts and Social Sciences 2&3 Faculty of Economics and Administration UNIVERSITY OF MALAYA 4 Fakulty of Human Ecology UNIVERSITI PUTRA MALAYSIA 5 SPATIALWORKS SDN BHD. Abstract Spatial strategy then known as regional planning, was conceptualized and formally institutionalized in the Second Malaysia Plan, to be among the major instruments of the New Economic Policy (NEP). Urbanization in this context was envisaged to help achieve the spatially balanced development target of the NEP, serving as a means to improve the socioeconomic status of the population in general, and increase the participation of Bumiputras in particular, in the modern urban sector (2nd Malaysia Plan, 1971). Conscious planning which characterizes the country’s development since independence has placed Malaysia currently to be among Asia’s best. The challenge of the concomitant rapid rate of urbanization however, continues to remain one of bridging the multidimensional urban-rural gaps. The National Urbanization Policy (NUP) and National Physical Plan (NPP) while fully cognizant of the potentially divisive globalization effect on national development, stress the enhancement of overall living qualities for sustainability. This paper seeks to explore the differences between the importance and satisfaction in living qualities between the urban and rural dwellers in 14 quality of life domains. These domains are Population and Family, Participation in Education, Human Resource, Health, Income, Expenditures and Savings, Housing, Environment, Transportation, Culture and Entertainment, National Unity, Communication and Technological 1 Associate Professor at Faculty of Arts and Social Sciences, University of Malaya. Email: [email protected]

Welcome message from author
This document is posted to help you gain knowledge. Please leave a comment to let me know what you think about it! Share it to your friends and learn new things together.
Transcript
21
PLANNING MALAYSIA:
Journal of the Malaysian Institute of Planners
Volume XI (2013), Page 21 - 40
PERCEPTIONS ON QUALITY OF LIFE IN MALAYSIA: THE URBAN-
RURAL DIVIDE
Norhaslina Hassan1, Noor Ismawati Mohd Jaafar
2, Raja Noriza Raja
Ariffin3, Asnarulkhadi Abu Samah
4 & Mohd Nazari Jaafar
5
1Faculty of Arts and Social Sciences
2&3Faculty of Economics and Administration
UNIVERSITY OF MALAYA 4Fakulty of Human Ecology
UNIVERSITI PUTRA MALAYSIA 5SPATIALWORKS SDN BHD.
Abstract
Spatial strategy then known as regional planning, was conceptualized and
formally institutionalized in the Second Malaysia Plan, to be among the major
instruments of the New Economic Policy (NEP). Urbanization in this context
was envisaged to help achieve the spatially balanced development target of the
NEP, serving as a means to improve the socioeconomic status of the population
in general, and increase the participation of Bumiputras in particular, in the
modern urban sector (2nd Malaysia Plan, 1971). Conscious planning which
characterizes the country’s development since independence has placed
Malaysia currently to be among Asia’s best. The challenge of the concomitant
rapid rate of urbanization however, continues to remain one of bridging the
multidimensional urban-rural gaps. The National Urbanization Policy (NUP)
and National Physical Plan (NPP) while fully cognizant of the potentially
divisive globalization effect on national development, stress the enhancement of
overall living qualities for sustainability. This paper seeks to explore the
differences between the importance and satisfaction in living qualities between
the urban and rural dwellers in 14 quality of life domains. These domains are
Population and Family, Participation in Education, Human Resource, Health,
Income, Expenditures and Savings, Housing, Environment, Transportation,
Culture and Entertainment, National Unity, Communication and Technological
1 Associate Professor at Faculty of Arts and Social Sciences, University of Malaya. Email: [email protected]
Norhaslina Hassan, Noor Ismawati Mohd Jaafar, Raja Noriza Raja Ariffin, Asnarulkhadi Abu Samah &
Mohd Nazari Jaafar
Perceptions on Quality of Life in Malaysia: The Urban-Rural Divide
© 2013 by MIP 22
Change, Social Participation, Public Safety and Social Security. Quality of Life
Index in this study which is based on a questionnaire survey on 3,500
respondents was derived using the Customer Satisfaction Index. It revealed a
gap between the perceived importance and satisfaction rating for most of the
quality of life domains studied. This gap prevailed for both rural and urban
respondents.
Keywords: regional planning, urbanization & quality of life.
INTRODUCTION
Research and discussion on the quality of life (QOL) is pursued in a detailed
and elaborate manner since the early 80s (Marcouiller, & English, 2001; Dissart
& Deller, 2000). Marans and Stimson (2011) recently summarized major efforts
covering the theory, methods and empirical research on quality of life studies.
One of the more important aspects of QOL research throughout literature is its
definition which generally refers to the degree of well-being felt by the
community or individual. Many researchers have expanded their research using
multivariable criteria for assessing a good quality place (Norainah A.R.,
Dasimah O. and Abdul Ghani S., 2012). Szalai (1980) defines quality of life
based on the degree of excellence or satisfactory character of life. While
covering many, the two basic components of quality of life which underpin
many efforts to quantify quality of life are physical and psychological. The
physical component covers areas such as health, nutrition, and protection from
disease while the psychological component deals with issues such as stress,
entertainment and leisure.
As a concept the meaning of quality of life (QOL) can infer to the
notions of “well-being,” focusing on the individual, to “good society”, to “good
place/city” focusing on the location (Dissart & Deller, 2000). According to Zapf
(2000), QOL does not only encompass living conditions but also the subjective
aspect of living conditions. This necessarily requires that indicators for quality
of life besides including the process and provision of, and access to a better
environment and better facilities further incorporate the manner of delivery of
goods, services, or facilities; and the experience associated with consumption of
goods and services (Massam, 2002). Considered from this perspective, QOL has
a number of implications for planning, more so in the context of a rapidly
urbanizing society such as that of Malaysia’s. Indeed, the main concern of the
planners is the promotion of the general welfare or the public interest. The
comprehensive nature of quality of life research furthermore corresponds well
PLANNING MALAYSIA:
Journal of the Malaysia Institute of Planners (2013)
© 2013 by MIP 23
with the planner’s long-standing concern for comprehensive planning (Myers,
2007).
Conscious planning which characterizes the country’s development
since independence has placed Malaysia currently to be among Asia’s best. This
adds to the considerable degree of consensus regarding the notion that
development, defined in terms of economic growth, is positively linked with
quality of life as its concomitant effect. In fact, despite the difficulties
associated with proving causality in the social sciences, historical evidence
suggests that increases in levels of urbanization and development throughout the
world have almost always been associated with economic gains (measured in
terms of such economic indicators as GNP and GDP). However, it remains to be
shown that these economic gains translate into improved human conditions i.e.
quality of life. The challenge of the rapid rate of urbanization however
continues to remain one of bridging the multidimensional urban-rural gaps.
More importantly, have economic gains caused a rift in the quality of lives
among the more prosperous compared to the other regions?
In Malaysia, urbanization viz development planning was envisaged to
help achieve the spatially balanced development target of the NEP, serving as a
means to improve the socioeconomic status of the population in general and
increase the participation of Bumiputras in particular, in the modern urban
sector (2nd
Malaysia Plan, 1971). Diffusion of urbanization in Malaysia has
contributed to the general improvements of the living environment through the
provision of infrastructure and services such as conventional housing, water and
electricity supplies, sanitation, sewerage, transport and telecommunications and
so forth. Urbanization creates more employment opportunities which are varied,
highly specialized and yield higher incomes, promotes modern lifestyles and
contributes to a higher socioeconomic standard of living with increased access
to higher order facilities and services such as better education, medical services,
recreational and the like. The National Urbanization Policy (NUP) and National
Physical Plan (NPP) while fully cognizant of the potentially divisive
globalization effect on national development, stress the enhancement of overall
living qualities for sustainability. This paper seeks to explore the differences
between the importance and satisfaction in living qualities between the urban
and rural dwellers in 14 quality of life domains with the aim to highlight the
role of planning in reducing the perceived gap.
Norhaslina Hassan, Noor Ismawati Mohd Jaafar, Raja Noriza Raja Ariffin, Asnarulkhadi Abu Samah &
Mohd Nazari Jaafar
Perceptions on Quality of Life in Malaysia: The Urban-Rural Divide
© 2013 by MIP 24
URBANIZATION IN MALAYSIA
Based on the definition of urban areas by the Department of Statisticsi, Figure 1
shows the urbanization rate in Malaysia since 1911. Urban growth in the
country has shown a steady increase with an accelerated rate of increase in the
past three decades or so. In 2010, the urbanization rate was 71.0 percent,
increasing from 62.0 percent in 2000. Apart from W. P. Kuala Lumpur and W.
P. Putrajaya with 100 percent level of urbanization, the other states with a high
level of urbanization were Selangor and Pulau Pinang with 91.4 percent and
90.8 percent respectively. Conversely, the states with lower urbanization levels
were Kelantan (42.4 percent), Pahang (50.5 percent) and Perlis (51.4 per cent)
(Department of Statistics Malaysia, 2012).
The marked increase in the urbanization rate started from 1970
onwards, and continues to increase remarkably (Figure 1). The single most
important explanation for the phenomenal increase in the urbanization rate since
1970 was the implementation of the New Economic Policy (NEP) which
immediately followed the ethnic clash of 1969ii. The two-pronged aim of the
policy was to eradicate poverty irrespective of race and to restructure the society
so that no identification of ethnic origin with economic functions and
geographical locations could be made. Urban strategies which were intertwined
with the broader regional policy and programs in Malaysia have led to large
scale urbanization especially among the Bumiputras and the Malays. Much of
these took place in the newly created towns in the Regional Development Areas
(RDAs) called the new towns, further development of existing small towns in
the agricultural regions, as well as the establishment of industrial centres within
small and medium sized towns in densely populated rural areas (Katiman,
1988).
From the mid-1990s onwards, popularly known as the “new period of
globalization” (Jomo, 1995), a new trend characterizes urban development in
Malaysia. The policy shift emphasizing economic liberalization and
modernization in ensuring national success in the new k-economy saw new
mega urban projects such as the Multimedia Super Corridor (MSC), the Kuala
Lumpur International Airport (KLIA), Kuala Lumpur City Centre (KLCC) and
Putrajaya (the new administrative centre) with “hi-tech” physical infrastructures
were built as a means of “plugging into”, and “making [of] an information
economy and society” (Bunnell, 2002). Based on the pattern of current trends in
the globalization of economic activities, urban growth and development are
expected to accelerate and concentrate further in the few existing urban
conurbations. These are more attractive to international investors since they

PLANNING MALAYSIA:
Journal of the Malaysia Institute of Planners (2013)
© 2013 by MIP 25
offer bigger agglomeration economies and returns to investment as well as a
higher quality of life.
Figure 1: Urbanisation Rate in Peninsular Malaysia, 1911-2010
Source: Based on data from Ooi, 1975 and Department of Statistics, 2012
QUALITY OF LIFE REPORTS IN MALAYSIA
In response to the growing importance and practicality of quality of life as a
measure of progress and harmony in a country, Malaysia has embarked on
producing the first Quality of Life Report in 1999. In the Malaysian context, the
quality of life is defined as encompassing personal development, healthy
lifestyles, access and freedom to acquire knowledge and to enjoy living
standards that exceed the basic needs and individual psychology (Malaysian
Quality of Life, 2002). These endeavors are in line with the level of social
welfare that is set as the national’s goal. A total of 10 indicators was selected
that best portray the well-being of the community in the country. These
indicators are income and distribution, environment, transport and
communications, health, education, housing, environment, family life, social
participation and public safety.
The sequel to the 1999 report was published in 2002 in order to assess
the ongoing changes that are taking place in Malaysia. Several additions have
been made in this second report, which includes indicators on culture and
leisure. Exclusive indicators focusing on quality of life in urban Malaysia
(MUQLI) were also added. The addendum signifies the importance of urban
1911 1921 1931 1947 1957 1970 1980 1991 2000 2010
% Urban Population 10.7 14.0 15.1 15.9 26.5 28.7 37.5 54.9 62.0 71.0
0.0
10.0
20.0
30.0
40.0
50.0
60.0
70.0
80.0
Malaysian Urbanisation 1911 - 2010

Norhaslina Hassan, Noor Ismawati Mohd Jaafar, Raja Noriza Raja Ariffin, Asnarulkhadi Abu Samah &
Mohd Nazari Jaafar
Perceptions on Quality of Life in Malaysia: The Urban-Rural Divide
© 2013 by MIP 26
population in Malaysia that represents 71.0 percent of Malaysia's population in
2010 (Department of Statistics Malaysia, 2006). Unlike the first report that
utilized the quantitative approach and lacked elaboration of the indicators used,
the second report to some extent, attempted to reconcile this by giving further
explanation of those indicators.
The Malaysian Urban Quality of Life Index (MUQLI) for the period of
1990-2000 is based on data collected from four cities; Ipoh, Johor Bahru, Kuala
Lumpur and Kuching that, collectively, accounted for 30 per cent of the
country’s total urban population in 2000. The MUQLI is a composite index
consisting of indices of income and distribution, working life, transport and
communication, health, education, housing, environment, family life, social
participation, public safety and culture and leisure. The report also included the
findings of a survey carried out in 2000 on 2,304 respondents living in two
more cities (Kuantan and Kota Kinabalu), in addition to the four cities above.
The survey was carried out to solicit perception as to the urban quality of life in
Malaysia and to provide a qualitative assessment of the urban quality of life
which complements the quantitative analysis described earlier.
All cities studied recorded improvements in the quality of life of their
population for the observation period, with Kuala Lumpur registering the
highest increase of 9.0 points, followed by Ipoh, Johor Bahru and Kuching.
About three-quarters of the people surveyed reported further that they were
satisfied with the overall quality of life in Malaysian cities. The majority of the
respondents were satisfied with aspects of urban living pertaining to indices for
family life, education, infrastructure and amenities, public safety, housing,
health, transport and the work place (Economic Planning Unit, 2002).
STUDY METHOD
Sampling and survey procedures
The primary source of data for this study was a perception survey designed to
solicit a broad base perceptions of values that are acceptable and thus used to
indicate the quality of living conditions by Malaysian society. The survey
method was also used to collect information on satisfaction levels on
previously agreed-upon quality of life aspects. Stratified sampling technique
was used to determine the acceptable sample size whereby the total population
was stratified according to states and districts. Based on this strategy, 100
districts (from the total of 136 districts listed in the Malaysian Population and

PLANNING MALAYSIA:
Journal of the Malaysia Institute of Planners (2013)
© 2013 by MIP 27
Housing Census 2000) were sampled. This more than met the 97 districts, the
minimum number of districts, required (Krejcie & Morgan, 1970). To ensure
sample representativeness, subjects were selected from sex, ethnic, age cohorts
and location (urban and rural) categories that reflect the real stratification in
Malaysia. Face-to-face interviews were conducted by a trained group of
interviewers. The questionnaire survey was administered on 3,500 respondents
who were selected from all over Malaysia including Sabah and Sarawak. A total
of 3,494 questionnaires were completed and analyzed using SPSS 17.0
(Statistical Package for Social Sciences). All statistical procedures were also
performed using the same software.
Measurement
Quality of Life Index (QOL) in this study was measured by a self-report scale
consisting of 30 indicators constructed from a total of 106 items. All items used
the five-point Likert scale (1 = not satisfied/good/frequent/important at all to 5 =
very satisfied/good/frequent/important). In the interview session, respondents
were asked to rate the importance of and satisfaction over a set of indicators of
life qualities from the 14 quality of life domains that were identified as a
benchmark for determining the quality of life for the Malaysian society. These
domains were Population and Family, Participation in Education, Human
Resource, Health, Income, Expenditures and Savings, Housing, Environment,
Transportation, Culture and Entertainment, National Unity, Communication and
Technological Change, Social Participation, Public Safety and Social Security.
The 30 indicators were constructed to complement 55 indicators derived from
secondary sources according to same 14 domains. These indicators are 108.0 %
more than the indicators reported in the Malaysian Quality of Life Index
(MQLI) (EPU, 1999) and 194.0% more than the Malaysian Urban Quality of
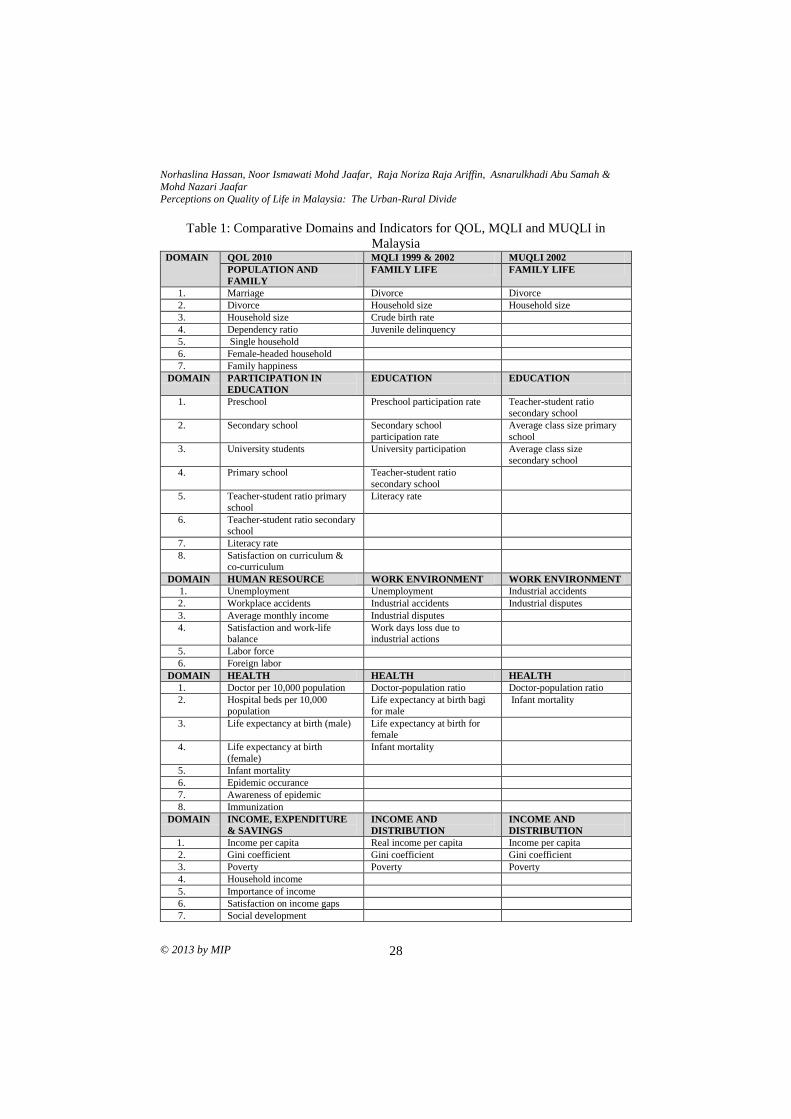
Life Index (MUQLI) (EPU, 2002). Table 1 shows comparative indicators for
MQLI, MUQLI in Malaysia and the study indicators. The significant
contribution to the existing local knowledge about the quality of life made in
this research is the role of National Unity consisting items measuring the
society’s readiness and willingness to accept diversity as well as their
confidence in local and national institutions’ abilities to safeguard the interests
of all fairly.
Norhaslina Hassan, Noor Ismawati Mohd Jaafar, Raja Noriza Raja Ariffin, Asnarulkhadi Abu Samah &
Mohd Nazari Jaafar
Perceptions on Quality of Life in Malaysia: The Urban-Rural Divide
© 2013 by MIP 28
Table 1: Comparative Domains and Indicators for QOL, MQLI and MUQLI in
Malaysia DOMAIN QOL 2010 MQLI 1999 & 2002 MUQLI 2002
POPULATION AND
FAMILY
FAMILY LIFE FAMILY LIFE
1. Marriage Divorce Divorce
2. Divorce Household size Household size
3. Household size Crude birth rate
4. Dependency ratio Juvenile delinquency
5. Single household
6. Female-headed household
7. Family happiness
DOMAIN PARTICIPATION IN
EDUCATION
EDUCATION EDUCATION
1. Preschool Preschool participation rate Teacher-student ratio
secondary school
2. Secondary school Secondary school
participation rate
Average class size primary
school
3. University students University participation Average class size
secondary school
4. Primary school Teacher-student ratio
secondary school
5. Teacher-student ratio primary
school
Literacy rate
6. Teacher-student ratio secondary school
7. Literacy rate
8. Satisfaction on curriculum & co-curriculum
DOMAIN HUMAN RESOURCE WORK ENVIRONMENT WORK ENVIRONMENT
1. Unemployment Unemployment Industrial accidents
2. Workplace accidents Industrial accidents Industrial disputes
3. Average monthly income Industrial disputes
4. Satisfaction and work-life balance
Work days loss due to industrial actions
5. Labor force
6. Foreign labor
DOMAIN HEALTH HEALTH HEALTH
1. Doctor per 10,000 population Doctor-population ratio Doctor-population ratio
2. Hospital beds per 10,000 population
Life expectancy at birth bagi for male
Infant mortality
3. Life expectancy at birth (male) Life expectancy at birth for female
4. Life expectancy at birth
(female)
Infant mortality
5. Infant mortality
6. Epidemic occurance
7. Awareness of epidemic
8. Immunization
DOMAIN INCOME, EXPENDITURE
& SAVINGS
INCOME AND
DISTRIBUTION
INCOME AND
DISTRIBUTION
1. Income per capita Real income per capita Income per capita
2. Gini coefficient Gini coefficient Gini coefficient
3. Poverty Poverty Poverty
4. Household income
5. Importance of income
6. Satisfaction on income gaps
7. Social development

PLANNING MALAYSIA:
Journal of the Malaysia Institute of Planners (2013)
© 2013 by MIP 29
expenditures
8. Adequacy of income for life
sustainance
9. Satisfaction on savings
DOMAIN HOUSING HOUSING HOUSING
1. Low cost housing units built Average medium-cost house
price
Average rent- income ratio
2. Housing affordability Low cost housing units Average house price-income ratio
3. Home ownership Houses with piped water
4. Houses with electricity supply Houses with electricity supply
DOMAIN ENVIRONMENT ENVIRONMENT ENVIRONMENT
1. Clean water supply Water quality River quality index
2. Clean air Air quality Solid waste per capita
3. Importance of environmental
protection
Forested area
DOMAIN TRANSPORT TRANSPORT &
COMMUNICATION
TRANSPORT &
COMMUNICATION
1. Private transport Private motorcycles & cars Private motorcycles & cars
2. Roads Road development index Public transport
3. Satisfaction on public transport Commercial vehicles Telephone
4. Telephone
5. Daily newspaper circulation
DOMAIN CULTURE &
ENTERTAINMENT
CULTURE &
ENTERTAINMENT
CULTURE &
ENTERTAINMENT
1. Cultural, historical & landmark buildings
Library membership Recreational and sports clubs
2. TV programs with local content Television viewers Library membership
3. Cultural importance Domestic hotels visitors
4. Television viewers
5. Involvement in activities & past time habits
6. Involvement in cultural
activities
DOMAIN NATIONAL UNITY
1. Readiness to accept other
people’s opinions &
willingness to discuss towards
arriving at a consensus
2. Readiness to acknowledge &
accept other people’s culture,
political ideology & religion
3. Tendency & frequency of
communication with
ethnically-based social institutions
4. Perception of having good
relationships with other people
at workplace, school,
neighborhood and other
institutions.
5. Use of national language for
communicaation, fluency & the
importance of national language
for national unity
6. Tendency to associate oneself with similar ethnic group,
decendency or original cluster
7. Confidence of (selected) local
and national institutions’

Norhaslina Hassan, Noor Ismawati Mohd Jaafar, Raja Noriza Raja Ariffin, Asnarulkhadi Abu Samah &
Mohd Nazari Jaafar
Perceptions on Quality of Life in Malaysia: The Urban-Rural Divide
© 2013 by MIP 30
abilities to safeguard the
interests of all fairly
DOMAIN COMMUNICATION &
TECHNOLOGICAL
CHANGE
1. Fixed phone ownership
2. Daily newspaper circulation
3. Mobile phone ownership
4. Computer ownership
5. Internet access
6. Social communication
DOMAIN SOCIAL PARTICIPATION SOCIAL PARTICIPATION COMMUNITY
PARTICIPATION
1. Involvement in volunteer
organisations
Registered voters Registered volunteer
organisations. 2. Involvement in community
activities
Registered community
associations
Registered voters
3. Registered voters Registered NGOs membership Rukun Tetangga
membership
4. Direct involvement of members
in decision making
5. Voluntary participation in
selected organisations
6. Frequency of attendance to community-level meetings.
7. Number of NGOs
DOMAIN PUBLIC SAFETY PUBLIC SAFETY PUBLIC SAFETY
1. Crime Crime Crime
2. Road accidents Road accidents Road accidents
3. Death from road accidents
4. Firefighter & Rescue members
5. RELA membership
6. Fear of crime
7. Juvenile Delinquency
DOMAIN SOCIAL SECURITY URBAN SERVICES
1. KWSP contribution Social services expenditures
2. Population with insurance Expenditures for landscape
3. Perception on social security
protection scheme
4. PERKESO contributors
ANALYSIS
Quality of Life Index )(P
iQOL in this studywhich is based on primary data
collected from field survey was derived using the Customer Satisfaction Index
technique. The same technique was used by the Australian University and
Deakin University, Australia to construct the Australian Unity Wellbeing Index
since 2001. Higher quality of life index values indicate higher living quality as
perceived by the society. Similarly, higher values of the sub-index would
indicate higher perceived quality of living associated with the relevant domain.
The formula for index calculation using this technique is given below.
PLANNING MALAYSIA:
Journal of the Malaysia Institute of Planners (2013)
© 2013 by MIP 31
Quality of Life Index, 1
)(
,
)(
n
i
P
ji
P
i DQOL
Quality of Life Sub-Index for Domain i , 5
1)(
,
n
i
iiP
ji
wy
D
Where;
iw = %100
1
n
i
i
i
x
x
ix = average importance score for indicator i , 51 ix
1=not very important, 5=very important
iy = average satisfaction score for indicator , 51 iy
1=not very satisfied, 5=very satisfied
iw = weight factor, %100%0 iw
j = year
n = number of indicators
Paired sample t-tests were conducted to investigate any significant differences
between satisfaction level and importance level of the QOL domains among
respondents living in rural and urban areas. The gap between satisfaction and
importance levels for the domains between rural- and urban-based respondents
was tested using the established ANOVA. A total of 42 (3 x 14) hypotheses
were tested, three for each domainiii.
FINDINGS
Table 2 shows that more than half of the respondents (58%) interviewed lived in
the urban areas compared to rural areas (42%). The majority (68.2%) of the
respondents aged between 25-54 years old and can be defined as within the
productive working age. The larger proportion of the respondents furthermore
was of the Malay ethnic origin (55.4) and Muslims (62.5%). Most respondents
reported monthly individual income between RM1, 000 – RM4, 000 (56.4%);
household size of between 3 - 6 persons (66.3%) and self-owned housing
(66.1%). Almost complete coverage of public utilities was also observed in
i
i
Security Social14andSafety Public13
ionParticipat Social12Change calTechnologi andion Communicat11
UnityNational10entEntertainm and Culture9
tionTransporta8tEnvironmen7
Housing6Savings and esExpenditur Income,5
Health4ResourceHuman 3
Education2Family and Population1

Norhaslina Hassan, Noor Ismawati Mohd Jaafar, Raja Noriza Raja Ariffin, Asnarulkhadi Abu Samah &
Mohd Nazari Jaafar
Perceptions on Quality of Life in Malaysia: The Urban-Rural Divide
© 2013 by MIP 32
respondents’ housing units. Table 2 summarizes the major characteristics of the
sample.
Table 2: Sample Characteristics
Characteristics n (%)
Characteristics n (%)
Location
Types of household
Urban 1962 58.0
Single household 58 1.7
Rural 1420 42.0
less than 3 members 219 6.4
Age
3 or no more than 6 members 2282 66.3
16-24 742 21.3
more than 6 members 885 25.7
25-54 2371 68.2
Employment Sector
55 and above 365 10.5
Private 1003 29.2
Gender
Public 1146 33.4
Male 1750 50.4
Self-employed 710 20.7
Female 1722 49.6
Unemployed 575 16.7
Ethnicity
Individual income
Malay 1931 55.4
Less than RM500.00 259 7.7
Chinese 859 24.6
RM500 - RM1000 634 18.9
Indian 269 7.7
RM1000 - RM4000 1895 56.4
Others 427 12.2
RM4000 and above 232 6.9
Education level
No income 337 10.0
No formal
education 105 3.0
House ownership
Primary 321 9.3
Own house 2286 66.1
Secondary 1650 47.8
Rent 760 22.0
Tertiary 1373 39.8
Squatters 29 0.8
Marital Status
Others 384 11.1
Single 1265 36.4 Main source of utility provider
Married 2083 59.9
Official electricity provider 3469 99.3* Widower/Divorced
/Separated 128 3.7
Official water provider 3289 94.1*
Note: All percentages are based on valid percentage except for * which is calculated based on total sample of 3494.
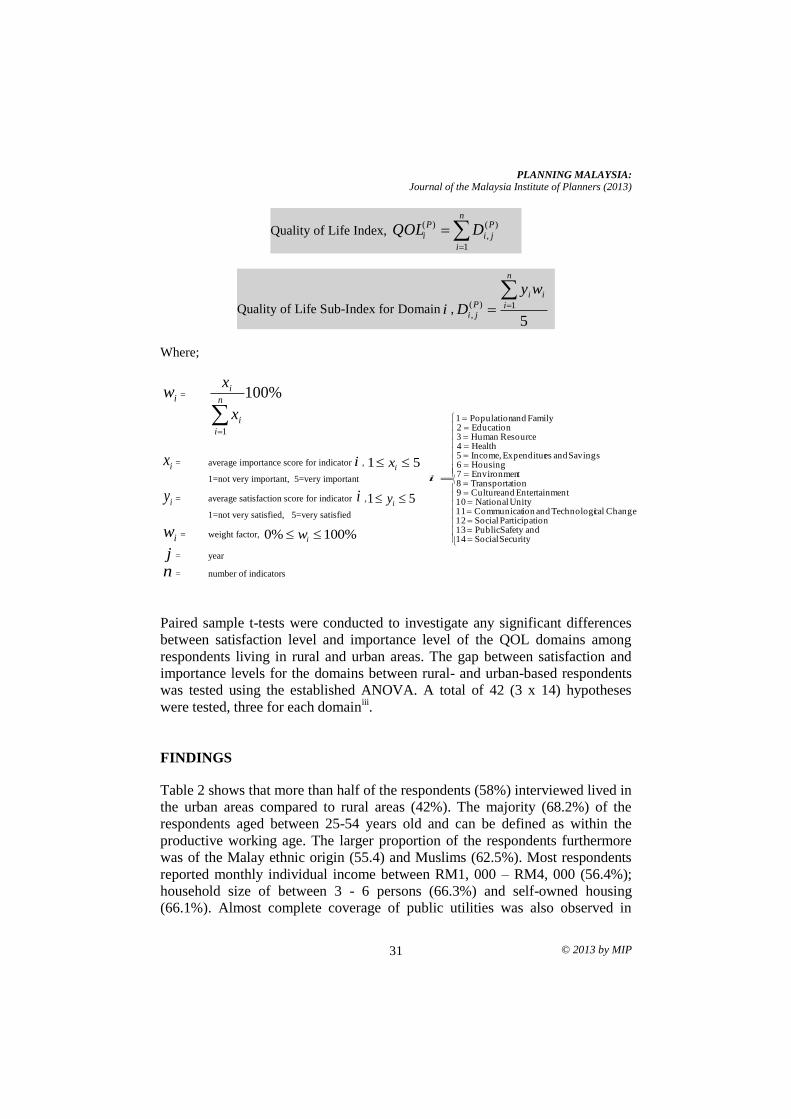
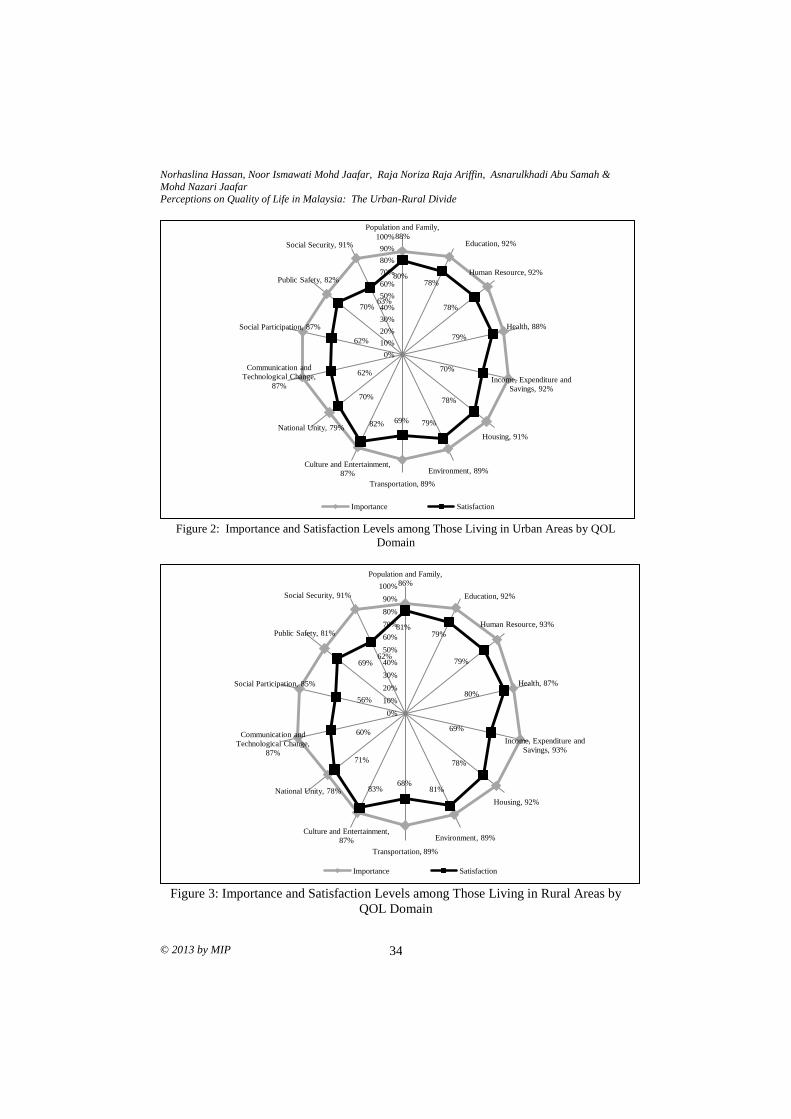
Figures 2 and 3 show the importance and satisfaction levels by QOL
domains among the rural and urban respondents. It can generally be observed
that the Malaysian society was rather realistic in that they did not expect
perfection in the performance of the QOL measurable domains. However, a few
domains were accorded with higher importance score (percentage score
exceeding 90%). These domains were Education, Human Resource, Income,

PLANNING MALAYSIA:
Journal of the Malaysia Institute of Planners (2013)
© 2013 by MIP 33
Expenditures and Savings, Housing and Social Security. National Unity, Public
Safety, Social Participation, Culture and Entertainment, and Communication
and Technological Change were by contrast, considered less important in
determining living qualities according to the respondents.
Figures 2 and 3 also generally depict the underperformance of all
domains (excepting Culture and Entertainment) measured against their
corresponding importance level as felt by the respondents. The trend prevails
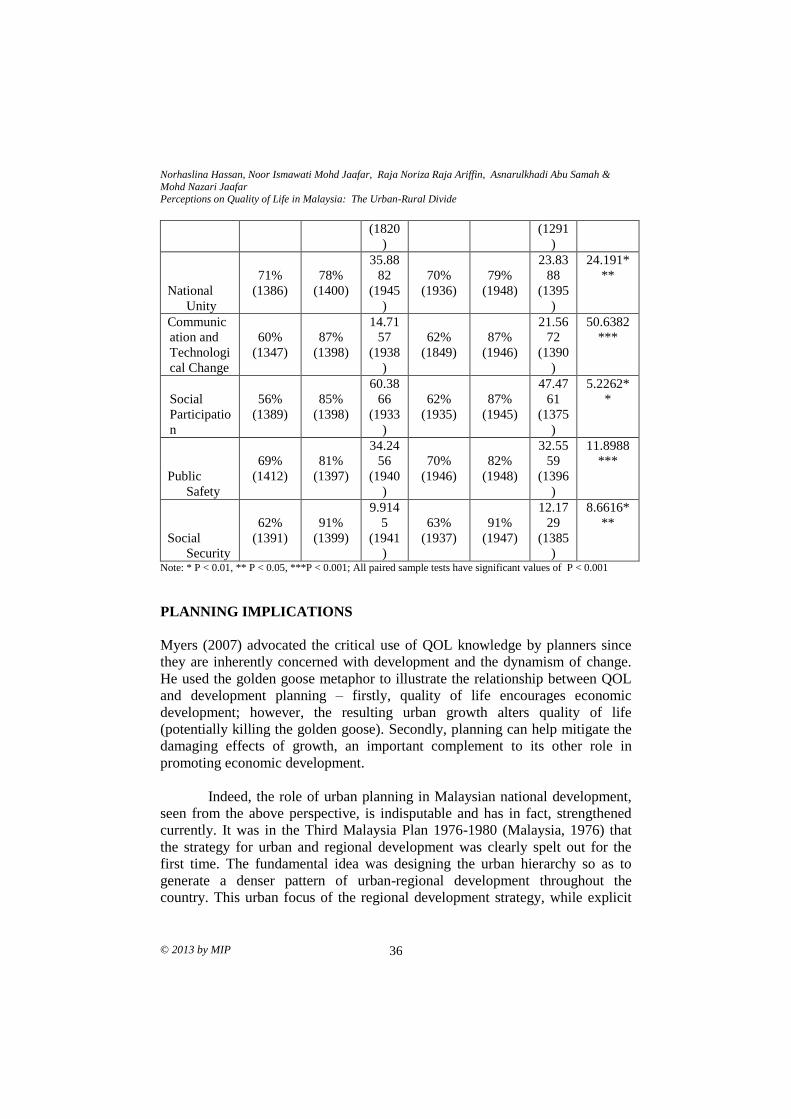
for both urban and rural respondents. The significant disparity between
satisfaction and importance levels in urban and rural locations is evident from
Table 3. All paired sample tests performed were significant at 1% level with the
largest observable disparity associated with Income, Expenditures and Savings
in all locations. The rural respondents further perceived that there is also much
to be done to reduce the wide disparity between satisfaction and importance
levels in the Social Participation domain. Smaller disparity in the importance
and satisfaction levels was found in the Social Security (for both locations)
followed by Human Resource and Environment domains among the urban
respondents.
Table 3 also reported the importance-satisfaction gap, employing the
established ANOVA to test for any significant differences in the gap score
between the urban and rural respondents. The importance-satisfaction gap is
determined by subtracting the satisfaction score assigned to a domain from its
importance score. Table 3 shows rather clearly that there were significant
differences in the above-mentioned gap for most domains between rural and
urban locations as perceived by the respondents. Variations in the importance-
satisfaction gap score between rural and urban respondents were not significant
for only Health and Transportation domains. In other words, the perceived
importance and satisfaction rating of the two domains were similar for both
rural and urban respondents.
Norhaslina Hassan, Noor Ismawati Mohd Jaafar, Raja Noriza Raja Ariffin, Asnarulkhadi Abu Samah &
Mohd Nazari Jaafar
Perceptions on Quality of Life in Malaysia: The Urban-Rural Divide
© 2013 by MIP 34
Figure 2: Importance and Satisfaction Levels among Those Living in Urban Areas by QOL
Domain
Figure 3: Importance and Satisfaction Levels among Those Living in Rural Areas by
QOL Domain
Population and Family,
88% Education, 92%
Human Resource, 92%
Health, 88%
Income, Expenditure and
Savings, 92%
Housing, 91%
Environment, 89%
Transportation, 89%
Culture and Entertainment,
87%
National Unity, 79%
Communication and
Technological Change,
87%
Social Participation, 87%
Public Safety, 82%
Social Security, 91%
80% 78%
78%
79%
70%
78%
79% 69% 82%
70%
62%
62%
70% 63%
0%
10%
20%
30%
40%
50%
60%
70%
80%
90%
100%
Importance Satisfaction
Population and Family,
86%
Education, 92%
Human Resource, 93%
Health, 87%
Income, Expenditure and
Savings, 93%
Housing, 92%
Environment, 89%
Transportation, 89%
Culture and Entertainment,
87%
National Unity, 78%
Communication and
Technological Change,
87%
Social Participation, 85%
Public Safety, 81%
Social Security, 91%
81% 79%
79%
80%
69%
78%
81% 68%
83%
71%
60%
56%
69% 62%
0%
10%
20%
30%
40%
50%
60%
70%
80%
90%
100%
Importance Satisfaction

PLANNING MALAYSIA:
Journal of the Malaysia Institute of Planners (2013)
© 2013 by MIP 35
Table 3: Satisfaction and Importance Levels of Each QOL Domain by Urban and Rural
Locations
Domain Rural Urban ANOVA
F-statistics
Satisfact
ion
(Mean,
n)
Importa
nce
(Mean,
n)
Paire
d
sampl
e test
(t-
test,
df)
Satisfact
ion
(Mean,
n)
Importa
nce
(Mean,
n)
Paire
d
sampl
e test
(t-
test,
df)
Population
and Family
81%
(1402)
86%
(1394)
30.79
41
(1399
)
80%
(1941)
88%
(1944)
38.06
62
(1945
)
4.1374*
*
Education
79%
(1317)
92%
(1401)
34.84
31
(1398
)
78%
(1828)
92%
(1948)
44.21
1
(1947
)
3.7515*
Human
Resource
79%
(1309)
93%
(1403)
27.86
92
(1821
)
78%
(1823)
92%
(1950)
18.35
2
(1304
)
9.8314*
**
Health
80%
(1405)
87%
(1397)
33.37
95
(1393
)
79%
(1952)
88%
(1948)
40.66
81
(1948
)
1.6455
Income,
Expenditur
e and
Savings
69%
(1362)
93%
(1398)
58.01
32
(1935
)
70%
(1886)
92%
(1949)
50.39
95
(1381
)
5.0742*
*
Housing
78%
(1407)
92%
(1401)
35.56
87
(1942
)
78%
(1940)
91%
(1951)
26.05
65
(1393
)
4.2985*
*
Environme
nt
81%
(1410)
89%
(1401)
29.72
71
(1946
)
79%
(1946)
89%
(1951)
17.34
08
(1394
)
24.826*
**
Transportat
ion
68%
(1404)
89%
(1397)
40.46
87
(1929
)
69%
(1926)
89%
(1949)
35.56
79
(1388
)
1.1060
Culture and
Entertainm
ent
83%
(1293)
87%
(1397)
-
7.717
2
82%
(1821)
87%
(1948)
-
13.22
28
23.4238
***
Norhaslina Hassan, Noor Ismawati Mohd Jaafar, Raja Noriza Raja Ariffin, Asnarulkhadi Abu Samah &
Mohd Nazari Jaafar
Perceptions on Quality of Life in Malaysia: The Urban-Rural Divide
© 2013 by MIP 36
(1820
)
(1291
)
National
Unity
71%
(1386)
78%
(1400)
35.88
82
(1945
)
70%
(1936)
79%
(1948)
23.83
88
(1395
)
24.191*
**
Communic
ation and
Technologi
cal Change
60%
(1347)
87%
(1398)
14.71
57
(1938
)
62%
(1849)
87%
(1946)
21.56
72
(1390
)
50.6382
***
Social
Participatio
n
56%
(1389)
85%
(1398)
60.38
66
(1933
)
62%
(1935)
87%
(1945)
47.47
61
(1375
)
5.2262*
*
Public
Safety
69%
(1412)
81%
(1397)
34.24
56
(1940
)
70%
(1946)
82%
(1948)
32.55
59
(1396
)
11.8988
***
Social
Security
62%
(1391)
91%
(1399)
9.914
5
(1941
)
63%
(1937)
91%
(1947)
12.17
29
(1385
)
8.6616*
**
Note: * P < 0.01, ** P < 0.05, ***P < 0.001; All paired sample tests have significant values of P < 0.001
PLANNING IMPLICATIONS
Myers (2007) advocated the critical use of QOL knowledge by planners since
they are inherently concerned with development and the dynamism of change.
He used the golden goose metaphor to illustrate the relationship between QOL
and development planning – firstly, quality of life encourages economic
development; however, the resulting urban growth alters quality of life
(potentially killing the golden goose). Secondly, planning can help mitigate the
damaging effects of growth, an important complement to its other role in
promoting economic development.
Indeed, the role of urban planning in Malaysian national development,
seen from the above perspective, is indisputable and has in fact, strengthened
currently. It was in the Third Malaysia Plan 1976-1980 (Malaysia, 1976) that
the strategy for urban and regional development was clearly spelt out for the
first time. The fundamental idea was designing the urban hierarchy so as to
generate a denser pattern of urban-regional development throughout the
country. This urban focus of the regional development strategy, while explicit

PLANNING MALAYSIA:
Journal of the Malaysia Institute of Planners (2013)
© 2013 by MIP 37
and consistent with the objectives of the National Economic Policy (1970-
1990), was carried through to the current National Vision Policy (2001-2010).
The 9th and 10
th Malaysia Plans (five-year development plans) which embody
the length of the policies’ time span, set the strategy for urban development to
improved and thereby higher quality of urban services and more livable urban
areas.
Within the Integrated Resource Planning and Management Framework,
development planning in Malaysia integrates spatial planning with other
sectoral planning in its implementation incorporating plans and policies already
available at the national level. These include the master plans for agriculture,
industry, tourism, water management and transport. The National Physical Plans
(NPP) in particular, which complements the Five-Year Economic Development
Plans starting from the 9th
Malaysia Plan embodies the strategy for national
spatial development up till 2020 and provides the spatial dimension to the
sectoral distribution of national resources (Department of Town and Country
Planning Malaysia, 2005).
In line with Vision 2020, National Vision Policy and Malaysia’s Five-
Year Plans, the role of planning in national development is as follows
(Department of Town and Country Planning, 2001):
Translating the socioeconomic objectives in spatial and physical forms
Translating development policies into physical planning
Considering the importance of environmental quality in planning
Planning for urban facilities
Contributing and managing scientific and technological advancement.
Taking into recognition further, the processes impacting national
growth and development namely globalization and the emergence of the k-
economy, land use/spatial planning in Malaysia currently aims to (1) rationalize
national spatial planning for economic efficiency and global competitiveness,
(2) promote balanced regional development for national unity (3) optimize
utilization of land and natural resources for sustainable development and (4)
secure spatial and environmental quality and diversity for a high quality of life.
The revised NPP (NPP-2) approved on August 2010, outlined the
objective as "to create an efficient, equitable and sustainable national spatial
framework to guide the overall development of the country towards achieving a
high-income and developed nation status by 2020". Additional policies and
measures formulated in NPP-2 include matters regarding climate change,
protection of biodiversity, green and new technology, as well as sustainable
tourism (Federal Department of Town and Country Planning, Malaysia, 2010).

Norhaslina Hassan, Noor Ismawati Mohd Jaafar, Raja Noriza Raja Ariffin, Asnarulkhadi Abu Samah &
Mohd Nazari Jaafar
Perceptions on Quality of Life in Malaysia: The Urban-Rural Divide
© 2013 by MIP 38
The above clearly spells out the increasing importance of urban planning in
Malaysia, to support the national agenda.
In another planning application, quality of life research such as reported
herein provides as a tool for regular monitoring and reporting of place-based
and community-based living qualities. The relationships between the
characteristics of these places and the perceived QOL of the residents are most
certainly important as they underpin many approaches to planning and design to
enhance the quality of people’s lives. This is also in line with the livability and
sustainability objectives for development within the planning framework in
urban Malaysia as indicated over and over, in most planning policies and
documents. The subjective indicators employed in this study which attempted to
obtain a value for goods, services and amenities from which quality of life is
supposed to derive, could be valuable input for planning. Again, this should
encompass the whole process of, provision of, delivery of and access to
improved living environments.
Although QOL indicators may reflect a rich coverage of living aspects,
it should be apparent that not all goods, services and amenities which are
location specific are under the control of local governments. Some are more
effectively provided by higher level governments i.e. state and federal levels.
Cleanliness, beautification, localized public nuisances, local level pollution and
quality of public services can certainly be acted on by local decision makers.
Furthermore, the aggregated individual living qualities in this study, which
indicate community consensus, seem to suggest that promoting the social
cohesion of communities would improve the quality of life in places. This
includes aspects of Social Participation and National Unity, for example,
involvement in community activities, perception of having a good relationship
with other people at workplace, school, and neighborhood. Clearly, quality of
life concept presents an important opportunity for planners to capture the
attention of wider stakeholders in development. More important, protecting the
quality of life is a goal that citizens’ groups, business leaders share, and hence it
affords a potential basis for negotiating consensus over specific planning goals
(Myers, 2007). It almost invariably includes political aspiration too.

PLANNING MALAYSIA:
Journal of the Malaysia Institute of Planners (2013)
© 2013 by MIP 39
ACKNOWLEDGEMENT
Data reported in this paper is heavily borrowed from the study on Malaysia
Social Report (2010)/Laporan Sosial Malaysia (2010) funded by the Malaysian
Social Institute/Institut Sosial Malaysia (ISM). The views within however,
remain those of the authors’.
REFERENCE
Bunnell, T. (2002). Counter-global Cases for Place: Contesting Displacement in
Globalizing Kuala Lumpur Metropolitan Area. Urban Studies, 41 (12), 2447-
2467.
Cooper, E. (1951). Urbanization in Malaya. Population Studies, 5 (2), 117-131.
Economic Planning Unit, Malaysia (2002). Malaysian Quality of Life.
Norainah A.R., Dasimah O. and Abdul Ghani S. (2012). Determinant Factors of
Neighborhood Quality. Planning Malaysia. Vol. X, 1-16.
Noll, Heinz-Herbert; Wolfgang Zapf (1994). Social Indicators Research: Societal
Monitoring and Social Reporting in I. Borg, P. Ph. Mohler, Eds. Trends and
Perspectives in Empirical Social Research. Berlin/New York: de Gruyter, 1-
16.
Jomo, K.S. (1995). Introduction. In K.S. Jomo (ed.) Privatizing Malaysia: Rents,
Rhetoric, Realities. Oxford. Westview Press.
Lee, B.T. (1977). Malay Urbanization and the Profile of Urban Areas in Peninsular
Malaysia. Journal of Southeast Asian Studies. No. 8 (2), 224-234.
Lim, David (1973). Economic Growth and Development in West Malaysia: 1947-1970.
Kuala Lumpur. Oxford University Press.
Malaysia (1970). The New Economic Policy. Kuala Lumpur: Government Printers.
Malaysia (1971). 2nd
Malaysia Plan, 1971-1975. Kuala Lumpur: Government Printers.
Malaysia (1976). 3rd
Malaysia Plan, 1976-1980. Kuala Lumpur: Government Printers.
Malaysia. 2006, National Vision Policy. Kuala Lumpur: Government Printers.
Marans, R. W. & Stimson, R. J. (Eds.) (2011). Investigating Quality of Urban Life:
Theory, Method, and Empirical Research. Dordrecht. The Netherlands:
Springer Publishing
Massam, B.H. (2002). Quality of Life: Public Planning and Private Living. In Progress
in Planning, 58, 141 -227.
Myers, D. (2007). Building Knowledge about Quality of Life for Urban Planning. In
Journal of the American Planning Association, 54 (3), 347-358
Ooi, J. Kamal Salih (1975). Rationalized Growth Centre Strategies in Malaysian
Regional Development. In: Chees, S. & Khoo Siew-Mun (eds.) Malaysia
Economic Development and Policies. Malaysian Economic Association, Kuala
Lumpur. Peninsular Malaysia. Longman Inc., New York.
Ooi, J.B. (1975). Urbanization and the Urban Population in Peninsular Malaysia.
Journal of Tropical Geography, 40, 40-47.
Norhaslina Hassan, Noor Ismawati Mohd Jaafar, Raja Noriza Raja Ariffin, Asnarulkhadi Abu Samah &
Mohd Nazari Jaafar
Perceptions on Quality of Life in Malaysia: The Urban-Rural Divide
© 2013 by MIP 40
The Federal Department of Town and Country Planning, Malaysia (2005). National
Physical Plan.
The Federal Department of Town and Country Planning, Malaysia (2006). National
Urbanization Policy.
iAccording to the Department of Statistics, urban areas in the latest 2000 census were defined to
include gazetted areas with their adjoining built-up areas which had a combined population of
10,000 or more. In addition, urban areas should have at least 60% of their population (aged 10
years and over) engaged in non-agricultural activities as well as having modern toilet facilities in
their housing units. Urbanization, on the other hand, refers to the proportion of the total
population living in its urban areas.
iiFor more satisfactory explanations on factors influencing early urbanization in Malaysia, please
refer to Lim, 1973; Cooper, 1951; Ooi, 1975).
iii The hypotheses are:
Hypothesis 1: paired-sample test
There is no significance difference in satisfaction and importance score
for domaini among respondents who live in the rural area.
There is significance difference in satisfaction and importance score for
domaini among respondents who live in the rural area.
Hypothesis 2: paired-sample test
There is no significance difference in satisfaction and importance score
for domaini among respondents who live in the urban area.
There is significance difference in satisfaction and importance score for
domaini among respondents who live in the urban area.
Hypothesis 3: ANOVA
There is no significance difference in gap score for domaini among
respondents who live in the urban and rural areas.
There is significance difference in gap score for domaini among
respondents who live in the urban and rural areas.
Related Documents