ORIGINAL ARTICLE
doi:10.1111/j.1558-5646.2011.01430.x
DIVERSIFICATION AND BIOGEOGRAPHICPATTERNS IN FOUR ISLAND RADIATIONSOF PASSERINE BIRDSSusanne A. Fritz,1,2,3,5 Knud A. Jønsson,4,5,6 Jon Fjeldsa,4,7 and Carsten Rahbek1,8
1Center for Macroecology, Evolution and Climate, Department of Biology, University of Copenhagen, Universitetsparken
15, DK-2100 København Ø, Denmark2E-mail: [email protected]
4Center for Macroecology, Evolution and Climate, Vertebrate Department, Natural History Museum, University of
Copenhagen, Universitetsparken 15, DK-2100 København Ø, Denmark6E-mail: [email protected]: [email protected]: [email protected]
Received April 28, 2011
Accepted July 18, 2011
Declining diversification rates over time are a well-established evolutionary pattern, often interpreted as indicating initial rapid
radiation with filling of ecological niche space. Here, we test the hypothesis that island radiations may show constant net diversi-
fication rates over time, due to continued expansion into new niche space in highly dispersive taxa. We investigate diversification
patterns of four passerine bird families originating from the Indo-Pacific archipelagos, and link these to biogeographic patterns
to provide independent indications of niche filling. We find a declining diversification rate for only one family, the Paradisaeidae
(41 species). These are almost completely restricted to New Guinea, and have on average smaller species ranges and higher levels
of species richness within grid cells than the other three families. In contrast, we cannot reject constant diversification rates for
Campephagidae (93 species), Oriolidae (35 species), and Pachycephalidae (53 species), groups that have independently colonized
neighboring archipelagos and continents. We propose that Paradisaeidae have reached the diversity limit imposed by their re-
stricted distribution, whereas high dispersal and colonization success across the geologically dynamic Indo-Pacific archipelagos
may have sustained high speciation rates for the other three families. Alternatively, increasing extinction rates may have obscured
declining speciation rates in those three phylogenies.
KEY WORDS: Dispersal, diversity dependence, macroevolution, speciation, species richness.
The influence of ecological processes on the evolutionary trajec-
tories of different clades has interested biologists for long (Willis
1922), starting with the observation that species richness differs
markedly among taxa. Variation in clade size may be explained
by differences in net diversification rates (i.e., speciation minus
3Current address: Biodiversity and Climate Research Centre (BiK-
F), Senckenberganlage 25, D-60325 Frankfurt (Main), Germany5These authors contributed equally to this work.
extinction) between clades or between areas of distribution, but
also by differences in clade age if diversification rates through
time are identical in different clades. Numerous recent studies
have used molecular phylogenies of various vertebrate groups
to demonstrate a pattern of declining diversification rates over
time (e.g., Harmon et al. 2003; Kozak et al. 2006; Phillimore and
Price 2008; Rabosky and Lovette 2008a). This pattern has been
termed diversity dependence because it is argued to reflect the
existence of upper limits to species richness of clades or regions
1 7 9C© 2011 The Author. Evolution C© 2011 The Society for the Study of Evolution.Evolution 66-1: 179–190
S. A. FRITZ ET AL.
(Nee et al. 1992; Rabosky 2009a). Recently, these limits have
been called ecological limits because they are assumed to result
from ecological processes, for example, competition for limited
resources (Rabosky 2009a). Ecological limits imply that clade
sizes should be independent of diversification rate and clade age
after the initial radiation phase, a pattern that has now been re-
ported for many taxa (Rabosky 2009b).
Diversity dependence of diversification is often explained
in light of ecological opportunities following a geographic dis-
persal event or an adaptive shift into new niche space (Simpson
1953; Schluter 2000). For taxa in the early stages of diversi-
fication in a new niche space, resources are readily available,
and potentially competing species are scarce, facilitating rapid
speciation. As radiations progress, resources diminish and com-
petition increases, thereby decreasing opportunities for specia-
tion and/or increasing extinction rates (Gavrilets and Vose 2005).
Species-rich groups whose diversification trajectories have been
well studied include both adaptive and nonadaptive radiations,
such as North American woodland salamanders (Kozak et al.
2006), different lizard groups, including Anolis in the Caribbean
(Harmon et al. 2003; Rabosky and Glor 2010), and many bird
groups (Nee et al. 1992; Weir 2006; Phillimore and Price 2008;
Rabosky and Lovette 2008a; Moyle et al. 2009). The vast ma-
jority of these and other studies show patterns concordant with
diversity dependence especially for species-rich taxa (see also
McPeek 2008; Rabosky 2009a; Morlon et al. 2010), although
constant diversification rates have recently been suggested for the
large and ecologically diverse group of Neotropical furnariid birds
(Derryberry et al. 2011).
However, many of these studies have focused on radiations
either of continental origin or confined to a small geographic
area. Radiations with an insular origin that have dispersed widely
have rarely been studied (but see examples below). It is possi-
ble that net diversification rates are not diversity dependent for
clades of highly dispersive organisms, which successfully expand
their ranges within extensive archipelagos (possibly with initial
“supertramp” strategies) or colonize other continents (Diamond
1974; Mayr and Diamond 2001; Bellemain and Ricklefs 2008).
A pattern of roughly constant net diversification through time
is expected under either constant speciation and extinction rates
through time, or under low or declining speciation rates in con-
nection with high or increasing extinction rates (Nee et al. 1994;
Rabosky and Lovette 2008b; Quental and Marshall 2009). Both
scenarios may be realistic in geologically dynamic archipelagos.
So far, results for time-constant diversification rates in island taxa
are inconclusive: the diversification patterns of Southeast Asian
Crocidura shrews are consistent with constant diversification rates
(Esselstyn et al. 2009), but Anolis lizards in the Caribbean and
the passerine bird radiation of Zosterops and allies in Australasia
and Africa appear to exhibit diversity dependence (Harmon et al.
2003; Moyle et al. 2009; Rabosky and Glor 2010). In Phelsuma
day geckos, diversification appears to have declined for the clade
endemic to Madagascar but not for the clades occurring in the
Comoros, the Seychelles, and the Mascarene islands (Harmon
et al. 2008). Although some more dated phylogenies of island-
origin radiations exist, they have not been investigated in terms of
diversification rates over time (e.g., Sato et al. 1999).
In the present study, we analyze and compare diversifi-
cation patterns across four families of passerine birds. These
families are part of the core Corvoidea radiation comprising ap-
proximately 750 species, which originated in the Indo-Pacific
archipelagos (Jønsson et al. 2011). All four families are consid-
ered to be large clades in the diversification literature (Phillimore
and Price 2008), and we analyze well-sampled molecular phy-
logenies: Oriolidae (orioles and figbirds, 31 of 35 species),
Paradisaeidae (birds-of-paradise, 40 of 41 species), Pachycephal-
idae (whistlers, shrike-thrushes and allies, 36 of 53 species), and
Campephagidae (cuckoo-shrikes, trillers, and minivets, 75 of 93
species). These families all originated in the same region, the
Indo-Pacific archipelagos, with all the most basal species on New
Guinea (Jønsson et al. 2011). As their area of origin has a complex
history of geological terrane movements and sea-level fluctuations
throughout the Cenozoic (Hall 1998; 2002), it may have provided
exceptional opportunities for allopatric speciation (Mayr and
Diamond 2001; Losos and Ricklefs 2009), but may also have
caused increased extinction rates (Ricklefs 2010).
Here, we investigate whether patterns of diversification for
these four island-origin radiations are consistent with patterns of
diversity dependence or those of rate constancy over time. We use
two different statistical approaches, taking uncertainty of phyloge-
netic reconstruction and effects of missing species into account.
Additionally, the link between decreasing diversification rates
through time, diversity limits, and ecological niche differentia-
tion has rarely been explicitly tested (but see Phillimore and Price
2009; Mahler et al. 2010) because measures of ecological niche
filling across species within a clade are lacking. We use biogeo-
graphic information, that is, the properties of range-size frequency
distributions and species richness within grid cells, as rough mea-
sures for the partitioning of ecological niche space across species
at large spatial scales. Paradisaeidae are mostly restricted to the
island of New Guinea, whereas the other three families have com-
plex dispersal and diversification histories across Australia, Asia,
Africa, and/or the Pacific islands (Frith and Beehler 1998; Jønsson
et al. 2010a; Jønsson et al. 2010b; Jønsson et al. 2010d). There-
fore, our a priori hypothesis was that Paradisaeidae may show
signatures of both decreasing diversification rates through time
and finer ecological niche partitioning, as suggested by smaller
species ranges and higher overlap of these at large spatial grain
sizes. Oriolidae, Campephagidae, and Pachycephalidae all seem
to exhibit higher dispersal and colonization abilities, so they could
1 8 0 EVOLUTION JANUARY 2012
ISLAND BIRD DIVERSIFICATION AND BIOGEOGRAPHY
be expected to show overall constant diversification rates through
time, and have both larger species ranges and less range overlap
between species.
Materials and MethodsDated phylogenies were obtained from published literature for the
Paradisaeidae (Irestedt et al. 2009), the Pachycephalidae (Jønsson
et al. 2010a), the Oriolidae (Jønsson et al. 2010b), and for the
Campephagidae excluding the subclade Pericrocotus (hereafter
called the Coracina tree, Jønsson et al. 2010c; all sequences on
GenBank, see cited literature for accession numbers). To obtain
absolute divergence times, different dating strategies have been
chosen specifically for each family to reflect the most realistic
time estimates (see also the reference for each phylogeny). The
Paradisaeidae and Coracina trees have been calibrated using sec-
ondary calibration points from Barker et al. (2004), setting the
origin of oscines at 76 million years ago (Mya; 95% confidence
interval: 63.84–89.16 Mya). The phylogenies for Pachycephali-
dae and Oriolidae have been calibrated using a rate of mitochon-
drial DNA (mtDNA) evolution. Whereas the 2% rule (Weir and
Schluter 2008) has been used for the Oriolidae, a faster rate re-
ported for island groups (Drovetski et al. 2004) has been used
in conjunction with island ages to calibrate the Pachycephalidae
phylogeny.
A phylogeny for Pericrocotus (Campephagidae) was pub-
lished without dates, and was based on one gene less than the
Coracina tree (Jønsson et al. 2010d). We therefore decided to
use the same dating procedure as for the Coracina tree on
the Pericrocotus phylogeny, and then analyze the two parts of
Campephagidae separately and in combination (see below). To
obtain divergence time estimates for Pericrocotus, we used BEAST
(Drummond et al. 2006; Drummond and Rambaut 2007), and as-
signed the best fitting model, as estimated by MRMODELTEST 2.0
(Nylander 2004) to each of the partitions. To calibrate the tree,
we used an age estimate of approximately 15 Mya for the ori-
gin of Pericrocotus, based on Jønsson et al. (2010c,d). Thus, for
the origin of Pericrocotus we used a normally distributed prior
with a median at 15 Mya and a standard deviation of 1 (quintiles
2.5% = 13.04, 5% = 13.36, 95% = 16.64, 97.5% = 16.96). We
assumed a Yule speciation process for the tree prior and an un-
correlated log-normal distribution for the molecular clock model
(Ho 2007). For all other parameters, we used default prior distri-
butions. Markov Chain Monte Carlo (MCMC) chains were run
for 25 million generations.
To generate a dated phylogeny for all members of
Campephagidae, we then inserted the Pericrocotus tree into the
Coracina tree. The position was determined by two Pericrocotus
species included in the original Coracina tree, which were sub-
sequently deleted. The root age for the Pericrocotus clade was
determined by the Pericrocotus tree, and the root age for the
Campephagidae by the more comprehensive Coracina tree. This
procedure was followed for the combination of the maximum
clade credibility trees, as well as for the combination of 1000
trees that were randomly sampled from the posterior distributions
of the two dating analyses. To assess robustness of our results
to this combination of two independently estimated phylogenies,
we ran all analyses separately for the original Pericrocotus and
Coracina trees as well.
We followed the taxonomy and family definitions in the IOC
World Bird Names (Gill et al. 2009), with a few exceptions follow-
ing previous phylogenetic studies as follows. The Pachycephali-
dae did not include Aleadryas rufinucha, Oreoica gutturalis, Pito-
hui cristatus, and Rhagologus leucostigma (Norman et al. 2009;
Jønsson et al. 2010a). Also, Pitohui kirhocephalus and Pitohui
dichrous were included within the Oriolidae, not the Pachycephal-
idae (Jønsson et al. 2008; Norman et al. 2009). To avoid poly-
phyletic species, Coracina remota (including the taxa matthiae
and heinrothi) and Coracina admiralitatis were recognized as sep-
arate species (all previously part of Coracina tenuirostris, Jønsson
et al. 2010c). Pachycephala pectoralis was separated into a west-
ern Australian species and a species occurring in eastern Australia,
Australian islands, and New Guinea (Jønsson et al. 2010a). Fi-
nally, we split Oriolus chinensis into three species: one species
in continental Asia represented by Oriolus chinensis diffusus, one
species in the Sunda islands represented by Oriolus chinensis
maculatus, and one species occurring in the Philippines and on
Sulawesi represented by Oriolus chinensis chinensis and Oriolus
chinensis melanisticus (Jønsson et al. 2010b). (The same study
suggested splitting Oriolus steerei, which we decided against due
to incomplete sampling of subspecies and the resulting difficulty
of associating species range parts.) Following this revised taxon-
omy, we deleted tips from the phylogenies after dating, until each
species was represented only once; outgroups were also deleted.
Our trees represent the following proportions of sampled species:
Pachycephalidae, 68%; Campephagidae, 81%; Oriolidae, 86%;
and Paradisaeidae, 98%.
To compare diversification patterns through time with bio-
geographic patterns, we matched information on the breeding
range for species of these groups to the same taxonomy. Distribu-
tion data were extracted from a comprehensive global geographic
range database for all land and freshwater birds (version 30 June
2009). The geographic range of each species was mapped at a
resolution of 1◦ latitude × 1◦ longitude following the approach
outlined by Rahbek and Graves (2000; 2001; see also Brooks
et al. 2001; Jetz and Rahbek 2002). Maps represent a conserva-
tive extent-of-occurrence of the breeding ranges based on museum
specimens, published sight records, and spatial distribution of
habitats between documented records, which have subsequently
been validated by ornithological experts. Over 1000 references
have been used to map avian distributions in the region of the
EVOLUTION JANUARY 2012 1 8 1

S. A. FRITZ ET AL.
world covered by the current article (reference list and additional
information is available upon request from C. Rahbek). We mod-
ified distributions from this dataset to match the taxonomy (de-
scribed above) based on information from Taylor (2005), Boles
(2007), Walther and Jones (2008), and Frith and Frith (2009).
Frequency distributions of species richness within grid cells
were generated from this dataset for each family. We generated
species range-size frequency distributions by calculating the land
area contained within each cell using a Behrmann global equal-
area projection, and then summing these land values for each
species. This approach attempts to take the effects of coastlines
into account, as our study area contains many islands, while as-
suming that a species occupies all land area in each grid cell it is
recorded for. Simply counting the number of grid cells for each
species provided similar results (not shown). To describe statis-
tical properties of these frequency distributions, we calculated
skew and kurtosis and compared these to the normal distribution
(Graves and Rahbek 2005).
We used R version 2.10.1 (R Development Core Team 2009)
and the LASER package for R (Rabosky 2006). All analyses were
run on each maximum clade credibility tree as well as on 1000
phylogenies randomly sampled from the posterior distributions
of trees (excluding the burn-in) for each of the four families, to
take uncertainty in phylogenetic reconstruction into account. We
tested for constant diversification rates over time using both the
γ statistic (Pybus and Harvey 2000) and �AICRC, which uses a
maximum-likelihood framework (Rabosky 2006). Null distribu-
tions for both measures were obtained from 5000 phylogenies
simulated for each group, which were of the same size as the
group of interest and grown under a Yule model (constant speci-
ation rate, no extinction).
We accounted for missing species when simulating the phy-
logenies from which we obtained the null distributions for our
test statistics (Pybus and Harvey 2000; Rabosky and Lovette
2008a). Trees were simulated to grow from the root until the
total number of species for a given family was reached. Sub-
sequently, tips and the internal branches leading to them were
deleted at random until the tip number equaled that of our phy-
logenetic sampling for the family. This approach assumed that
all species in the family are known, thus only accounting for
species not sampled in our phylogenies. Additionally, we used
three further levels of total species richness, assuming that the
known species numbers represent 75%, 50%, and 25% of the
true species number, and therefore testing the effects of unde-
tected or extinct species. In these cases, trees were simulated
to the assumed total species number, and tips were reduced to
the number sampled in our phylogenies as before. All our sim-
ulations assumed that species were missing at random from the
phylogeny. Our actual species sampling was above the recom-
mended 80% of known species (Cusimano and Renner 2010) in
all families except one: for Pachycephalidae, our relatively low
proportion of sampled species may introduce increased type I er-
ror rates, as it is possible that many missing species are recent (but
see “Discussion”).
The interpretation of the γ measure is that strongly nega-
tive values indicate a decrease in diversification rate over time,
whereas positive values can arise under constant or increasing di-
versification. Therefore, we used a one-tailed test to detect signifi-
cantly negative γ values, which is seen as conservative if extinction
is nonzero (Pybus and Harvey 2000). We fitted five maximum-
likelihood models of diversification to each phylogeny: the Yule
model and a birth–death model (constant speciation rate and con-
stant, nonzero extinction rate) represented constant-rate models,
and models with rates that vary through time were represented by
a diversity-dependent diversification model with linearly decreas-
ing speciation and zero extinction rates, a diversity-dependent di-
versification model with exponentially decreasing speciation and
zero extinction rates, and a modified Yule model allowing for
two different speciation rates with a breakpoint (Rabosky 2006).
The �AICRC measure is defined as the difference in AIC values
between the best rate-variable model and the best rate-constant
model, that is, it is positive if the best model is rate variable. There-
fore, significantly positive �AICRC values were tested for with a
one-tailed test against the simulated null distributions (Rabosky
2006).
ResultsThe lineage-through-time plot for Paradisaeidae leveled off after
an initially fast diversification, generating an apparently diversity-
dependent pattern, whereas the lineage-through-time plots for the
three other families appeared straight (Fig. 1A–D). Both the γ
statistic and �AICRC confirmed this visual impression: the ob-
served γ of the maximum clade credibility tree for the Paradisaei-
dae was significantly lower than expected if diversification was
constant through time, whereas γ values did not reject constant
rates for the Campephagidae, Oriolidae, and Pachycephalidae
(Table 1). Similarly, �AICRC for the Paradisaeidae was signif-
icantly higher than expected when assuming constant diversifica-
tion rates, but �AICRC for the other families was not (Table 1;
Fig. 2). Although the best diversification model for the Paradis-
aeidae was rate variable (Table 1), the differences in AIC values of
the best model (diversity-dependent diversification with linearly
decreasing speciation rate) to the other two rate-variable models
(diversity-dependent diversification with exponentially decreas-
ing speciation rate and modified Yule model with a shift in speci-
ation rate) were small (4.4 and 2.4, respectively). Pachycephalidae
fitted the Yule model best, and Oriolidae and Campephagidae the
Yule model with one rate shift, but discriminatory power for these
families was low: differences in AIC values between the best and
1 8 2 EVOLUTION JANUARY 2012

ISLAND BIRD DIVERSIFICATION AND BIOGEOGRAPHY
Figure 1. Lineage-through-time plots (A–D) and species richness maps (E–H) for the four families. (A and E) Paradisaeidae; (B and F)
Campephagidae; (C and G) Oriolidae; (D and H) Pachycephalidae. In (A–D), solid lines represent the maximum clade credibility trees, and
gray areas are the 95% confidence interval for phylogenetic uncertainty generated by randomly sampling 1000 trees from the posterior
distribution. Axes were scaled equally in (A–D) to facilitate comparison.
EVOLUTION JANUARY 2012 1 8 3
S. A. FRITZ ET AL.
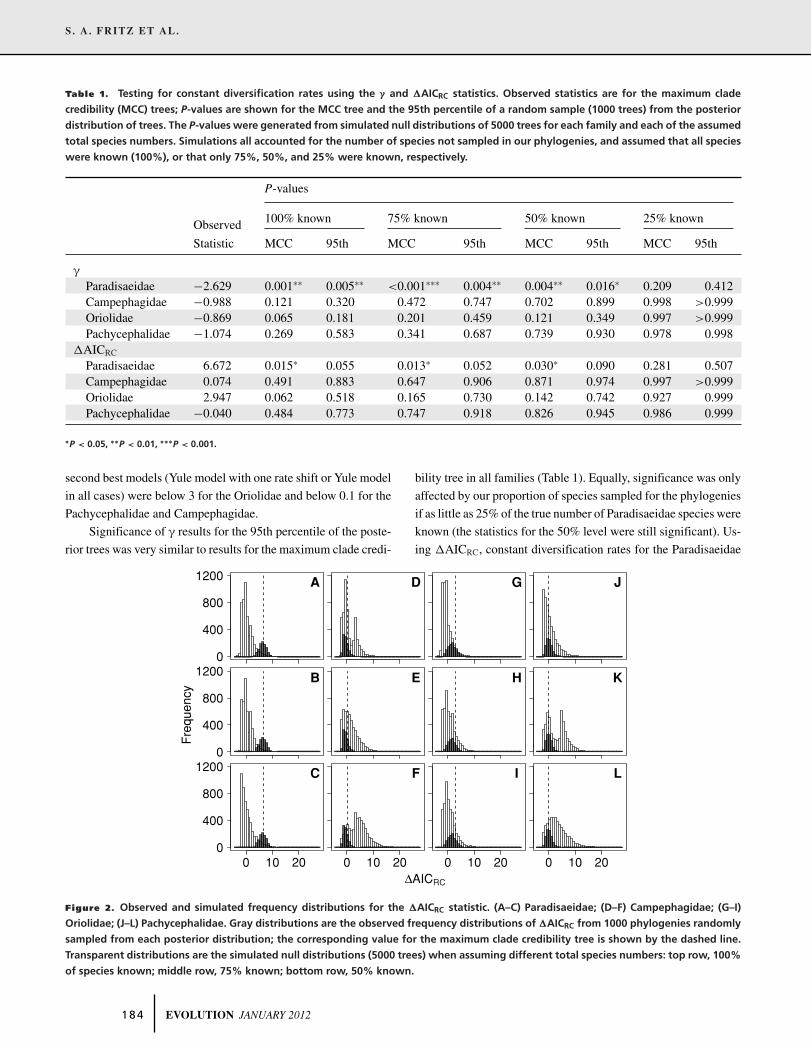
Table 1. Testing for constant diversification rates using the γ and �AICRC statistics. Observed statistics are for the maximum clade
credibility (MCC) trees; P-values are shown for the MCC tree and the 95th percentile of a random sample (1000 trees) from the posterior
distribution of trees. The P-values were generated from simulated null distributions of 5000 trees for each family and each of the assumed
total species numbers. Simulations all accounted for the number of species not sampled in our phylogenies, and assumed that all species
were known (100%), or that only 75%, 50%, and 25% were known, respectively.
P-values
Observed 100% known 75% known 50% known 25% known
Statistic MCC 95th MCC 95th MCC 95th MCC 95th
γ
Paradisaeidae −2.629 0.001∗∗ 0.005∗∗ <0.001∗∗∗ 0.004∗∗ 0.004∗∗ 0.016∗ 0.209 0.412Campephagidae −0.988 0.121 0.320 0.472 0.747 0.702 0.899 0.998 >0.999Oriolidae −0.869 0.065 0.181 0.201 0.459 0.121 0.349 0.997 >0.999Pachycephalidae −1.074 0.269 0.583 0.341 0.687 0.739 0.930 0.978 0.998
�AICRC
Paradisaeidae 6.672 0.015∗ 0.055 0.013∗ 0.052 0.030∗ 0.090 0.281 0.507Campephagidae 0.074 0.491 0.883 0.647 0.906 0.871 0.974 0.997 >0.999Oriolidae 2.947 0.062 0.518 0.165 0.730 0.142 0.742 0.927 0.999Pachycephalidae −0.040 0.484 0.773 0.747 0.918 0.826 0.945 0.986 0.999
∗P < 0.05, ∗∗P < 0.01, ∗∗∗P < 0.001.
second best models (Yule model with one rate shift or Yule model
in all cases) were below 3 for the Oriolidae and below 0.1 for the
Pachycephalidae and Campephagidae.
Significance of γ results for the 95th percentile of the poste-
rior trees was very similar to results for the maximum clade credi-
bility tree in all families (Table 1). Equally, significance was only
affected by our proportion of species sampled for the phylogenies
if as little as 25% of the true number of Paradisaeidae species were
known (the statistics for the 50% level were still significant). Us-
ing �AICRC, constant diversification rates for the Paradisaeidae
A
0
400
800
1200 D G J
B
0
400
800
1200 E H K
C
0
400
800
1200
0 10 20
F
0 10 20
I
0 10 20
L
0 10 20ΔAICRC
Fre
quen
cy
Figure 2. Observed and simulated frequency distributions for the �AICRC statistic. (A–C) Paradisaeidae; (D–F) Campephagidae; (G–I)
Oriolidae; (J–L) Pachycephalidae. Gray distributions are the observed frequency distributions of �AICRC from 1000 phylogenies randomly
sampled from each posterior distribution; the corresponding value for the maximum clade credibility tree is shown by the dashed line.
Transparent distributions are the simulated null distributions (5000 trees) when assuming different total species numbers: top row, 100%
of species known; middle row, 75% known; bottom row, 50% known.
1 8 4 EVOLUTION JANUARY 2012

ISLAND BIRD DIVERSIFICATION AND BIOGEOGRAPHY
could not be rejected for the 95th percentile of the posterior trees
(Table 1). However, P-values were only just above significance
if 100% or 75% of species were assumed to be known, and there
was very little overlap between the observed distribution of the
�AICRC statistic for the posterior trees and the different null dis-
tributions simulated for the Paradisaeidae (Fig. 2). All results for
the other three families were qualitatively the same for the maxi-
mum clade credibility tree and the 95th percentile of the posterior
trees, as well as for all simulations taking different proportions
of sampled species into account. Results for the Campephagidae
did not change when the Pericrocotus and Coracina trees were
analyzed separately (Supporting information).
The distribution of Paradisaeidae is relatively restricted, with
most species in New Guinea and very few in northeastern Aus-
tralia and Wallacea (Fig. 1E). The Campephagidae and the Orioli-
dae have spread throughout Australasia, continental Asia, Africa,
and Europe, and the Pachycephalidae occur throughout the Indo-
Pacific archipelagos, with one species on the Asian mainland
(Fig. 1F–H). Paradisaeidae had the smallest species range sizes
and highest species richness within grid cells at our study scale
(Fig. 3). Species range-size frequency distributions had a much
longer tail for Campephagidae, Oriolidae, and Pachycephalidae
than for Paradisaeidae (Fig. 3A–D). The frequency distribution
of species richness within grid cells was less steep for Paradis-
aeidae than for the other groups, that is, comparatively few grid
cells contained low levels of species richness for Paradisaeidae
(Fig. 3E–H). Skew and kurtosis of both frequency distributions
were relatively lower for Paradisaeidae than for the other three
families (Table 2). All skew and kurtosis statistics significantly
deviated from a normal distribution, except for kurtosis values for
both frequency distributions in Paradisaeidae.
DiscussionThe differences in diversification trajectory and biogeographic
patterns between the Paradisaeidae and each of the other fam-
ilies are striking. Whereas our results were concordant with a
diversity-dependent pattern of diversification for the Paradisaei-
dae, we detected no apparent slowdown in diversification rates
for the other families. Correspondingly, biogeographic patterns
for the Paradisaeidae clearly differed from those of the other
three families: species ranges were smaller on average and over-
lapped more at the spatial scale of our study. Both diversification
and biogeographic patterns therefore offer some support for our
hypothesis that island radiations with high dispersal and colo-
nization abilities may show constant diversification rates through
time, and less fine partitioning of niches. Our results are unusual
when compared to most previous studies of avian taxa with sim-
ilar numbers of species (e.g., Weir 2006; Phillimore and Price
2008; Rabosky and Lovette 2008a), presumably because the four
05
1015202530
0 5 10 15 20
0
10
20
30
A
0
1000
2000
3000E
0
10
20
30
B
0
1000
2000
3000F
0
10
20
30
C
0
1000
2000
3000G
0
10
20
30
0 500 1000 1500
species range size
D
0
1000
2000
3000
0 5 10 15 20
species richness
H
Fre
quen
cy
Figure 3. Species range-size frequency distributions (A–D) and
frequency distributions of species richness within grid cells (E–
H) for the four families. (A and E) Paradisaeidae; (B and F)
Campephagidae; (C and G) Oriolidae; (D and H) Pachycephalidae.
Species range size (in million km2) was measured as the total land
area of occupied grid cells.
Table 2. Testing species range-size frequency distributions and
frequency distributions of species richness within grid cells against
the normal distribution. Species range size was measured as the
total land area of occupied grid cells.
Species range size Species richness
Skew Kurtosis Skew Kurtosis
Paradisaeidae 0.92∗ 0.38 0.73∗∗∗ −0.66Campephagidae 1.93∗∗∗ 2.81∗∗∗ 1.42∗∗∗ 1.67∗∗∗
Oriolidae 2.06∗∗∗ 3.76∗∗∗ 1.77∗∗∗ 2.29∗∗∗
Pachycephalidae 4.19∗∗∗ 17.27∗∗∗ 2.26∗∗∗ 6.82∗∗∗
∗P < 0.05, ∗∗P < 0.01, ∗∗∗P < 0.001.
families analyzed in this study originated in a geologically dy-
namic insular setting. Notably, the large continental radiation of
Furnariidae (Neotropical ovenbirds and woodcreepers) seems to
have maintained constant diversification rates through time, pos-
sibly because furnariid birds span a geologically and climatically
highly dynamic continent (Derryberry et al. 2011). Below, we
first interpret our results in light of general diversity dependence of
EVOLUTION JANUARY 2012 1 8 5

S. A. FRITZ ET AL.
diversification rates, assuming the existence of upper limits on the
species richness of clades or regions ultimately arising from eco-
logical processes (Rabosky 2009a). Then, we discuss alternative
interpretations that do not assume existence of these ecological
limits to diversity, and we conclude with discussing the statistical
robustness of our results.
ECOLOGICAL LIMITS TO DIVERSITY
The diversification pattern and biogeographic patterns for Paradis-
aeidae are concordant with the idea of increased filling of ecolog-
ical niches over time (Nee et al. 1992; Ricklefs 2006; Phillimore
and Price 2009). In Paradisaeidae, diversification rates have ap-
parently slowed down over time, and our biogeographic analyses
indicated relatively high species richness within grid cells and
a relatively high amount of small-ranged species. Progressively
finer niche partitioning, for example during adaptive radiation,
should lead to higher proportions of species with small geographic
ranges, and to higher overlap of these species ranges on coarse
spatial scales (Nee et al. 1992; Schluter 2000; Gavrilets and Vose
2005; McPeek 2008). This process is thought to eventually cause
a slowdown in diversification rates as clade size reaches its so-
called ecological limit (Rabosky 2009a). Our combination of di-
versification analyses and biogeographic patterns links these two
hypotheses: the kurtosis and skew of range-size frequency distri-
butions and of frequency distributions of species richness within
grid cells clearly differentiated Paradisaeidae from the other three
groups, in parallel to the difference in diversification statistics for
phylogenetic branching patterns. These measures may therefore
be a promising avenue for future research on describing niche
partitioning across species within clades at the macroecological
scale, compared to previously used measures such as the total
geographic area occupied by the clade or the median number of
co-occurring species (Phillimore and Price 2009). However, none
of these measures are able to distinguish between the processes
underlying limits to diversity, such as competition, low dispersal
probability, or lack of geographic opportunities for speciation.
The diversification pattern of Paradisaeidae seems similar to
the diversity-dependent patterns reported for a large number of
other taxa (see Rabosky 2009a for a recent review). Why, then, do
the patterns for Oriolidae, Pachycephalidae, and Campephagidae
not conform to this apparently general pattern? Assuming that
diversity dependence is universal, the three radiations may be too
young to have reached their ecological limits yet. Especially, the
Pachycephalidae are a clade much younger than the Paradisaeidae,
which seem to have reached their diversity limit. Compared to
the Paradisaeidae, our frequency distributions of species richness
within grid cells for the other three families show that geographic
ranges overlap much less at our coarse spatial scale, perhaps
reflecting a potential for further ecological niche differentiation.
Assuming that diversity limits exist and have not been
reached by our three families exhibiting patterns of constant di-
versification rates, our results suggest that these ecological limits
differ between clades and regions. First, even clades originat-
ing in the same region at roughly the same time can have very
different upper limits to their size, as suggested by our diversi-
fication patterns for Campephagidae and Paradisaeidae. Second,
the species numbers in each of our three families are unusually
large compared to the other bird clades for which patterns con-
sistent with constant net diversification rates have been shown
previously (Phillimore and Price 2008, 2009), and compared to
the species number at which the species richness–age relation-
ship across clades typically levels off (Ricklefs 2006). One ex-
ception from this general pattern of diversity dependence in large
(avian) taxa is the Neotropical Furnariidae radiation, but these
birds show unusual ecological divergence between subclades and
species groups, and they span an entire, geologically highly dy-
namic continent (Derryberry et al. 2011). As our three families
originated in island areas, unlike most previously studied avian
clades, we suggest that geologically dynamic regions such as the
Indo-Pacific archipelagos may allow higher ecological limits to
clade size than continental regions usually do, by providing nu-
merous opportunities for speciation (Mayr and Diamond 2001;
Losos and Ricklefs 2009). In geologically dynamic archipela-
gos, new ecological opportunities open up frequently, or areas are
repeatedly geographically isolated, which should lead to high spe-
ciation rates in successfully colonizing lineages (Bellemain and
Ricklefs 2008). In concordance with our results for Campephagi-
dae, Oriolidae, and Pachycephalidae, previous studies have sug-
gested elevated or constant net diversification rates for shrews
in the Philippines and day geckos in Indian Ocean archipelagos
(Harmon et al. 2008; Esselstyn et al. 2009).
If ecological limits to diversity differ between clades, then
presumably these limits are influenced not only by the region in
which a clade diversified, but also by a clade’s ability to dis-
perse and colonize, and so ultimately by its ecological traits
(Rabosky 2009a; Vamosi and Vamosi 2010). The geographical
distribution of Paradisaeidae as a family, which seems to have
reached their diversity limit, is much more restricted than that of
each of the other three families. Similarly, decreasing diversifica-
tion rates have been shown for the day gecko clade endemic to
Madagascar, but not for the related clades in Indian Ocean
archipelagos (Harmon et al. 2008). These findings suggest a
link between geographic area occupied and ecological limits on
clade size, and might relate to large-scale species–area relation-
ships (Ricklefs 2006; Kisel et al. 2011). Restricted geographic
ranges, both for the Paradisaeidae as a whole and for most of its
species, may reflect low dispersal and colonization abilities. In
contrast, our other three families have large geographical dis-
tributions and complex colonization histories from centers of
1 8 6 EVOLUTION JANUARY 2012

ISLAND BIRD DIVERSIFICATION AND BIOGEOGRAPHY
diversification in New Guinea across the Indo-Pacific archipela-
gos (Jønsson et al. 2010a,b,c). Likewise, a measure of annual
dispersal correlated strongly with net diversification rates across
bird families (Phillimore et al. 2006), and unusually species-rich
radiations of mammals have been linked to colonization of new
geographic areas (Kisel et al. 2011; Purvis et al. 2011) We fur-
ther speculate that dispersal and colonization abilities within the
families are determined by ecological traits. For example, most
species of Paradisaeidae are promiscuous and use male display
areas (Frith and Beehler 1998), which may restrict individuals’
capacity for long-distance dispersal and thus limit the chances
of establishing breeding populations in new areas (Irestedt et al.
2009).
ALTERNATIVE INTERPRETATIONS
OF DIVERSIFICATION PATTERNS
The interpretation that our analyses show patterns of constant net
diversification rates should be taken cautiously because our fail-
ure to reject the null hypothesis does not prove its validity. Also,
the conclusion that sustained high speciation rates through time
have generated the observed patterns is hypothetical, because only
net diversification rates are inferred from molecular phylogenies,
and the estimation of speciation and extinction rates from these is
problematic. Hence, an alternative explanation for the diversifica-
tion patterns in our three families could be that these families have
already reached a diversity limit, but the signature of diversity de-
pendence in their lineage-through-time plots has been erased by
increasing or high extinction rates (Rabosky and Lovette 2008b;
Quental and Marshall 2009; McInnes et al. 2011). Two observa-
tions support this hypothesis: first, it is generally assumed that
extinction rates are high in island settings (e.g., Ricklefs 2010).
Second, our lineage-through-time plots for Campephagidae, Ori-
olidae, and Pachycephalidae do not show the “pull of the present,”
that is, an upturn in net diversification rate toward the present that
is expected under a birth–death model with constant, high death
rates (Nee et al. 1994). Indeed, all our best models assumed no ex-
tinction at all, which seems unlikely but is a surprisingly common
occurrence in analyses of lineage-through-time plots (Rabosky
and Lovette 2008b; Quental and Marshall 2009). Recently intro-
duced coalescent approaches, or the combination of molecular
data with the fossil record if available, may prove superior in
detecting extinction signatures (Liow et al. 2010; Morlon et al.
2010).
So far, we have assumed that diversity dependence of diver-
sification rates is a general pattern, and that ecological processes
limit the species richness of clades. However, other explanations
exist for observed slowdowns in diversification rates. For exam-
ple, a recent simulation study criticized the use of the birth–death
model as a null hypothesis in phylogenetics for its lack of geo-
graphic context (Pigot et al. 2010). Pigot and colleagues simulated
ecologically neutral cladogenesis under geographic speciation, ei-
ther through vicariance or peripatry, and found that several proper-
ties of the simulated phylogenies and species ranges approximated
those of real avian clades. In their models, clades with rapid initial
diversification experienced slowdowns because the geographic
ranges of their species became smaller over time, making specia-
tion less likely. The resulting patterns of diversification and geo-
graphic ranges are comparable to our patterns for Paradisaeidae,
and to previous studies showing apparent diversity dependence.
A pattern of constant net diversification arose when simulating
peripatric speciation with moderate rates of range growth and
high volatility of ranges over time (Pigot et al. 2010). This model
seems quite reasonable for our three other families, given their ori-
gin in the Indo-Pacific and successful colonization of neighboring
archipelagos and continents. Further development endeavoring to
fit such geographically explicit, ecologically neutral diversifica-
tion models to real clades seems a promising approach.
Finally, it has been argued recently that the common find-
ing of diversification patterns with a slowdown does not mean
that these slowdowns are in fact common, because the patterns
may actually arise from researcher selection of study groups or
low proportions of sampled species (Phillimore and Price 2008;
Cusimano and Renner 2010). The focus on taxa with continental
origin in previous studies may have led to the common finding of
diversity-dependent patterns, with an overlooked predominance
of patterns concordant with constant diversification rates through
time in archipelagos (Harmon et al. 2008; Esselstyn et al. 2009).
Even though Moyle et al. (2009) found a slowdown in diversifi-
cation rates for Zosterops in Southeast Asia and Africa, that result
may have been caused by the rather low proportion of sampled
taxa. The literature so far may be biased against island-origin taxa
because researchers generally choose to study well-defined clades
with a large but manageable number of species, which are less
likely to be from archipelagos given the sampling difficulties and
taxonomic issues involved. Due to the preference for species-rich
groups, researchers are also more likely to work on clades that
have reached saturation, or clades that show apparent diversity
dependence by chance (Phillimore and Price 2008).
STATISTICAL ROBUSTNESS OF OUR RESULTS
Our results appear robust to uncertainty of phylogenetic recon-
struction, because results for a random sample of 1000 poste-
rior trees from the Bayesian phylogenetic reconstruction were
consistent with those for the maximum clade credibility tree.
However, we acknowledge that the two different procedures
used to obtain absolute divergence times for the four phyloge-
nies may affect direct comparisons between taxa. Although the
different dating strategies were chosen to reflect most realistic
time estimates for each family, particularly the Pachycephali-
dae would be estimated as older if dated within the standard
EVOLUTION JANUARY 2012 1 8 7
S. A. FRITZ ET AL.
2% mtDNA rate framework (Weir and Schluter 2008). Because
the dating procedure should affect all time estimates within a phy-
logeny, we think that the comparison of diversification trajectories
is still valid.
Our simulations of expected distributions for the statistic
measures of diversification rates through time accounted for the
effects of unsampled or unknown species, if these were missing
from the phylogenies at random. Although this assumption of
random phylogenetic sampling may have been violated, the high
proportions of species sampled in our phylogenies should limit the
inflation of type I error rates, that is, the probability of incorrectly
rejecting the null hypothesis of constant diversification rates when
it is in fact true (Cusimano and Renner 2010). The phylogeny
for the Paradisaeidae included all but one known species, which
makes it unlikely that the observed slowdown in diversification
rates was caused by low sampling. Likewise, it is improbable that
only 25% of the species of Paradisaeidae are known to science or
have survived to the present (Frith and Beehler 1998), the only
case for which we could not reject constant diversification rates.
The only family for which we sampled less than 80% of known
species (the minimum recommended by Cusimano and Renner
2010) was the Pachycephalidae, but because we could not reject
the null hypothesis for this family, our sampling did not cause
inflation of type I error.
Another bias, which we (and comparative studies in gen-
eral) have been unable to address adequately, may arise because
of differences in species concepts. For objectivity, we used a
recognized global taxonomy, but we recognize that different tax-
onomists have followed different practices in their treatment of
island forms, some authorities defining all isolated and diag-
nosable populations as separate species, others trying to com-
bine them as polytypic superspecies (see Mayr and Diamond
2001). Our study, as well as any other study investigating mul-
tiple species groups across large regions, will be subject to such
taxonomic biases.
Finally, we investigate diversification patterns through time
for whole families, whereas previous studies have focused mainly
on genera (Weir 2006; McPeek 2008; Phillimore and Price 2008).
A meaningful rationale for studying diversification should be
the analysis of monophyletic clades consisting of closely related
species, that is, of single but separate radiations, whether they are
at genus or family level. This condition is true for our families: the
phylogenies for Pachycephalidae and Oriolidae are dominated by
their nominate genera (Pachycephala, 27 of 36 species; Oriolus,
28 of 31 species), for which we expect family-level diversification
patterns to hold. The two separate phylogenies of Campephagi-
dae conform to our condition of single radiations, and they show
qualitatively similar patterns to the family level when analyzed
separately (Supporting information; one tree for Pericrocotus and
the other dominated by Coracina). Finally, the Paradisaeidae con-
sist of 41 species in 16 genera, with generic splitting mainly based
on sexually selected traits. Therefore, we may argue that the fam-
ily comprises two radiations only, corresponding to the two main
clades on the phylogeny (Irestedt et al. 2009). These two clades
have approximate crown ages of 18 and 16 Mya (cf. the upturn
around that time in Fig. 1A), and most nodes are clustered in
the early history for both. In conclusion, all family patterns we
show should hold at meaningful lower levels of clade definition,
although we also believe that the question of taxonomic scale
and its consequences for diversification rate analyses would be
an interesting opportunity for more comprehensive comparative
studies.
ConclusionThere are several possible mechanisms producing the patterns of
diversification rates and species ranges we found for our four
island-origin radiations. We suggest that the dynamics of exten-
sive island systems may allow for sustained high net diversifi-
cation rates, at least for a surprisingly long time, through several
possible mechanisms. These processes depend on dispersal ability
and colonization success of the clades involved, and our sugges-
tions assume that diversity dependence of diversification rates is a
general pattern, with most likely ecological processes setting up-
per limits to species richness in clades or regions. As illustrated
by our study, a general understanding of diversification dynamics
and the resulting biogeographic patterns depends on obtaining
results from a broader array of cases, for example, from species-
poor and species-rich taxa, and those originating within continents
and archipelagos. Interpretations of the underlying processes will
benefit from linking these patterns to additional biogeographic
and ecological data on species-richness patterns, species range-
size frequency distributions, dispersal and colonization ability,
ecological traits, and not least to ecological processes at smaller
scales influencing species assembly processes.
ACKNOWLEDGMENTSWe thank Louis Hansen for his invaluable help with compiling thedatabase of species distributions; A. Pigot for interesting discussion;A. Phillimore, M. McPeek, and several anonymous reviewers for insight-ful comments on previous versions of the manuscript; and the DanishNational Research Foundation for support to the Center for Macroecol-ogy, Evolution and Climate.
LITERATURE CITEDBarker, F. K., A. Cibois, P. Schikler, J. Feinstein, and J. Cracraft. 2004.
Phylogeny and diversification of the largest avian radiation. Proc. Natl.Acad. Sci. USA 101:11040–11045.
Bellemain, E., and R. E. Ricklefs. 2008. Are islands the end of the colonizationroad? Trends Ecol. Evol. 23:461–468.
Brooks, T., A. Balmford, N. Burgess, J. Fjeldsa, L. A. Hansen, J. Moore, C.Rahbek, and P. Williams. 2001. Toward a blueprint for conservation inAfrica. BioScience 51:613–624.
1 8 8 EVOLUTION JANUARY 2012

ISLAND BIRD DIVERSIFICATION AND BIOGEOGRAPHY
Boles, W. E. 2007. Family Pachycephalidae (Whistlers). Pp. 374–437 in J.del Hoyo, A. Elliott, and D. A. Christie, eds. Handbook of the birds ofthe world. Vol. 12: Picarthartes to tits and chickadees. Lynx Edicions,Barcelona.
Cusimano, N., and S. S. Renner. 2010. Slowdowns in diversificationrates from real phylogenies may not be real. Syst. Biol. 59:458–464.
Derryberry, E. P., S. Claramunt, G. Derryberry, R. T. Chesser, J. Cracraft,A. Aleixo, J. Perez-Eman, J. V. Remsen, Jr., and R. T. Brumfield. 2011.Lineage diversification and morphological evolution in a large-scale con-tinental radiation: the Neotropical ovenbirds and woodcreepers (Aves:Furnariidae). Evolution, doi:10.1111/j.1558–5646-2011.01374.x.
Diamond, J. M. 1974. Colonization of exploded volcanic islands by birds: thesupertramp strategy. Science 184:803–806.
Drovetski, S. V., R. M. Zink, S. Rohwer, I. V. Fadeev, E. V. Nesterov,I. Karagodin, E. A. Koblik, and Y. A. Red’kin. 2004. Complex bio-geographic history of a Holarctic passerine. Proc. R. Soc. B 271:545–551.
Drummond, A. J., S. Y. W. Ho, M. J. Phillips, and A. Rambaut. 2006. Relaxedphylogenetics and dating with confidence. PLoS Biol. 4:e88.
Drummond, A. J., and A. Rambaut. 2007. BEAST, version 1.4.7. Available athttp://beast.bio.ed.ac.uk/.
Esselstyn, J. A., R. M. Timm, and R. M. Brown. 2009. Do geologicalor climatic processes drive speciation in dynamic archipelagos? Thetempo and mode of diversification in Southeast Asian shrews. Evolution63:2595–2610.
Frith, C. B., and B. M. Beehler. 1998. The birds of paradise. Oxford Univ.Press, Oxford, U.K.
Frith, C. B., and D. W. Frith. 2009. Family Paradisaeidae (Birds-of-paradise).Pp. 404–493 in J. del Hoyo, A. Elliott, and D. A. Christie, eds. Handbookof the birds of the world. Vol. 14: Bush-shrikes to Old World sparrows.Lynx Edicions, Barcelona
Gavrilets, S., and A. Vose. 2005. Dynamic patterns of adaptive radiation. Proc.Natl. Acad. Sci. USA 102:18040–18045.
Gill, F., M. Wright, and D. Donsker. 2009. IOC World Bird Names, version2.2. Available at http://www.worldbirdnames.org. Accessed December2009.
Graves, G. R., and C. Rahbek. 2005. Source pool geometry and the assem-bly of continental avifaunas. Proc. Natl. Acad. Sci. USA 102:7871–7876.
Hall, R. 1998. Biogeographic implications of the tertiary palaeogeographicevolution of Sulawesi and Borneo. Pp. 133–163 in R. Hall andJ. D. Holloway, eds. Biogeography and geological evolution of SE Asia.Backhuys Publishers, Leiden, the Netherlands.
———. 2002. Cenozoic geological and plate tectonic evolution of SE Asiaand the SW Pacific: computer-based reconstructions, model and anima-tions. J. Asian Earth Sci. 20:353–431.
Harmon, L. J., J. Melville, A. Larson, and J. B. Losos. 2008. The role of ge-ography and ecological opportunity in the diversification of day geckos(Phelsuma). Syst. Biol. 57:562–573.
Harmon, L. J., J. A. Schulte, II, A. Larson, and J. B. Losos. 2003. Tempoand mode of evolutionary radiation in iguanian lizards. Science 301:961–964.
Ho, S. Y. W. 2007. Calibrating molecular estimates of substitution rates anddivergence times in birds. J. Avian Biol. 38:409–414.
Irestedt, M., K. A. Jønsson, J. Fjeldsa, L. Christidis, and P. G. P. Ericson. 2009.An unexpectedly long history of sexual selection in birds-of-paradise.BMC Evol. Biol. 9:235.
Jetz, W., and C. Rahbek. 2002. Geographic range size and determinants ofavian species richness. Science 297:1548–1551.
Jønsson, K. A., R. C. K. Bowie, J. A. Norman, L. Christidis, and J. Fjeldsa.
2008. Polyphyletic origin of toxic Pitohui birds suggests widespreadoccurrence of toxicity in corvoid birds. Biol. Lett. 4:71–74.
Jønsson, K. A., R. C. K. Bowie, R. G. Moyle, L. Christidis, J. A. Norman,B. W. Benz, and J. Fjeldsa. 2010a. Historical biogeography of an Indo-Pacific passerine bird family (Pachycephalidae): different colonizationpatterns in the Indonesian and Melanesian archipelagos. J. Biogeogr.37:245–257.
Jønsson, K. A., R. C. K. Bowie, R. G. Moyle, M. Irestedt, L. Christidis,J. A. Norman, and J. Fjeldsa. 2010b. Phylogeny and biogeography ofOriolidae (Aves: Passeriformes). Ecography 33:232–241.
Jønsson, K. A., R. C. K. Bowie, J. A. A. Nylander, L. Christidis, J. A.Norman, and J. Fjeldsa. 2010c. Biogeographical history of cuckoo-shrikes (Aves: Passeriformes): transoceanic colonization of Africa fromAustralo-Papua. J. Biogeogr. 37:1767–1781.
Jønsson, K. A., M. Irestedt, P. G. P. Ericson, and J. Fjeldsa. 2010d. A molecularphylogeny of minivets (Passeriformes: Campephagidae: Pericrocotus):implications for biogeography and convergent plumage evolution. Zool.Scr. 39:1–8.
Jønsson, K. A., P.-H. Fabre, R. E. Ricklefs, and J. Fjeldsa. 2011. Major globalradiation of corvoid birds originated in the proto-Papuan archipelago.Proc. Natl. Acad. Sci. USA 108:2328–2333.
Kisel, Y., L. McInnes, N. H. Toomey, and C. D. L. Orme. 2011. How di-versification rates and diversity limits combine to create large-scalespecies-area relationships. Philos. Trans. R. Soc. B. 366:2514–2525.
Kozak, K. H., D. W. Weisrock, and A. Larson. 2006. Rapid lineage accumula-tion in a non-adaptive radiation: phylogenetic analysis of diversificationrates in eastern North American woodland salamanders (Plethodontidae:Plethodon). Proc. R. Soc. B 273:539–546.
Liow, L. H., T. B. Quental, and C. R. Marshall. 2010. When can decreasingdiversification rates be detected with molecular phylogenies and thefossil record? Syst. Biol. 59:646–659.
Losos, J. B., and R. E. Ricklefs. 2009. Adaptation and diversification onislands. Nature 457:830–836.
Mahler, D. L., L. J. Revell, R. E. Glor, and J. B. Losos. 2010. Ecologicalopportunity and the rate of morphological evolution in the diversificationof Greater Antillean anoles. Evolution 64:2731–2745.
Mayr, E., and J. M. Diamond. 2001. The birds of northern Melanesia: speci-ation, ecology and biogeography. Oxford Univ. Press, New York.
McInnes, L., C. D. L. Orme, and A. Purvis. 2011. Detecting shifts in diversitylimits from molecular phylogenies: what can we know? Proc. R. Soc. B,doi:10.1098/rspb.2011.0241.
McPeek, M. A. 2008. The ecological dynamics of clade diversification andcommunity assembly. Am. Nat. 172:E270–E284.
Morlon, H., M. D. Potts, and J. B. Plotkin. 2010. Inferring the dynamics ofdiversification: a coalescent approach. PLoS Biol. 8:e1000493.
Moyle, R. G., C. E. Filardi, C. E. Smith, and J. Diamond. 2009. ExplosivePleistocene diversification and hemispheric expansion of a “great speci-ator.” Proc. Natl. Acad. Sci. USA 106:1863–1868.
Nee, S., E. C. Holmes, R. M. May, and P. H. Harvey. 1994. Extinction ratescan be estimated from molecular phylogenies. Philos. Trans. R. Soc. B344:77–82.
Nee, S., A. Ø. Mooers, and P. H. Harvey. 1992. Tempo and mode of evolu-tion revealed from molecular phylogenies. Proc. Natl. Acad. Sci. USA89:8322–8326.
Norman, J. A., P. G. P. Ericson, K. A. Jønsson, J. Fjeldsa, and L. Christidis.2009. A multi-gene phylogeny reveals novel relationships for aberrantgenera of Australo-Papuan core Corvoidea and polyphyly of the Pachy-cephalidae and Psophodidae (Aves: Passeriformes). Mol. Phylogenet.Evol. 52:488–497.
Nylander, J. A. A. 2004. MrModeltest, version 2. Program distributed by theauthor. Available at http://www.abc.se/nylander.
EVOLUTION JANUARY 2012 1 8 9
S. A. FRITZ ET AL.
Phillimore, A. B., R. P. Freckleton, C. D. L. Orme, and I. P. F. Owens. 2006.Ecology predicts large-scale patterns of phylogenetic diversification inbirds. Am. Nat. 168:220–229.
Phillimore, A. B., and T. D. Price. 2008. Density-dependent cladogenesis inbirds. PLoS Biol. 6:e71.
———. 2009. Ecological influences on the temporal pattern of speciation. Pp.240–256 in R. K. Butlin, J. R. Bridle, and D. Schluter, eds. Speciationand patterns of diversity. Cambridge Univ. Press, Cambridge, U.K.
Pigot, A. L., A. B. Phillimore, I. P. F. Owens, and C. D. L. Orme. 2010.The shape and temporal dynamics of phylogenetic trees arising fromgeographic speciation. Syst. Biol. 59:660–673.
Purvis, A., S. A. Fritz, J. Rodrıguez, P. H. Harvey, and R. Grenyer. 2011. Theshape of mammalian phylogeny: patterns, processes and scales. Philos.Trans. R. Soc. B. 366:2462–2477.
Pybus, O. G., and P. H. Harvey. 2000. Testing macro-evolutionary modelsusing incomplete molecular phylogenies. Proc. R. Soc. B 267:2267–2272.
Quental, T. B., and C. R. Marshall. 2009. Extinction during evolutionaryradiations: reconciling the fossil record with molecular phylogenies.Evolution 63:3158–3167.
R Development Core Team. 2009. R: a language and environment for statisticalcomputing. R Foundation for Statistical Computing, Vienna. Availableat http://www.R-project.org.
Rabosky, D. L. 2006. Likelihood methods for detecting temporal shifts indiversification rates. Evolution 60:1152–1164.
———. 2009a. Ecological limits and diversification rate: alternativeparadigms to explain the variation in species richness among cladesand regions. Ecol. Lett. 12:735–743.
———. 2009b. Ecological limits on clade diversification in higher taxa. Am.Nat. 173:662–674.
Rabosky, D. L., and R. E. Glor. 2010. Equilibrium speciation dynamics in amodel adaptive radiation of island lizards. Proc. Natl. Acad. Sci. USA107:22178–22183.
Rabosky, D. L., and I. J. Lovette. 2008a. Density-dependent diversification inNorth American wood warblers. Proc. R. Soc. B 275:2363–2371.
———. 2008b. Explosive evolutionary radiations: decreasing speciation orincreasing extinction through time? Evolution 62:1866–1875.
Rahbek, C., and G. R. Graves. 2000. Detection of macro-ecological patternsin South American hummingbirds is affected by spatial scale. Proc. R.Soc. B 267:2259–2265.
———. 2001. Multiscale assessment of patterns of avian species richness.Proc. Natl. Acad. Sci. USA 98:4534–4539.
Ricklefs, R. E. 2006. Global variation in the diversification rate of passerinebirds. Ecology 87:2468–2478.
———. 2010. Dynamics of colonization and extinction on islands. Insightsfrom Lesser Antillean birds. Pp. 388–414 in J. B. Losos, and R. E.Ricklefs, eds. The theory of island biogeography revisited. PrincetonUniv. Press, Princeton, NJ.
Sato, A., C. O’Huigin, F. Figueroa, P. R. Grant, B. R. Grant, H. Tichy, andJ. Klein. 1999. Phylogeny of Darwin’s finches as revealed by mtDNAsequences. Proc. Natl. Acad. Sci. USA 96:5101–5106.
Schluter, D. 2000. The ecology of adaptive radiation. Oxford Univ. Press,Oxford, U.K.
Simpson, G. G. 1953. The major features of evolution. Columbia Univ. Press,New York.
Taylor, P. B. 2005. Family Campephagidae (Cuckoo-shrikes). Pp. 40–123 in J.del Hoyo, A. Elliott, and D. A. Christie, eds. Handbook of the birds of theworld. Vol. 10: Cuckoo-shrikes to thrushes. Lynx Edicions, Barcelona.
Vamosi, J. C., and S. M. Vamosi. 2010. Key innovations within a geographicalcontext in flowering plants: towards resolving Darwin’s abominablemystery. Ecol. Lett. 13:1270–1279.
Walther, B. A., and P. J. Jones. 2008. Family Oriolidae (Orioles). Pp. 692–731in J. Del Hoyo, A. Elliott, and D. A. Christie, eds. Handbook of thebirds of the world. Vol. 13: Penduline-tits to shrikes. Lynx Edicions,Barcelona.
Weir, J. 2006. Divergent timing and patterns of species accumula-tion in lowland and highland Neotropical birds. Evolution 60:842–855.
Weir, J. T., and D. Schluter. 2008. Calibrating the avian molecular clock. Mol.Ecol. 17:2321–2328.
Willis, J. C. 1922. Age and area. Cambridge Univ. Press, Cambridge, U.K.
Associate Editor: J. Vamosi
Supporting InformationThe following supporting information is available for this article:
Table S1. Testing for constant diversification rates using the γ and �AICRC statistics.
Figure S1. Lineage-through-time plots (A–B) and species richness maps (C–D) for the two campephagid phylogenies.
Figure S2. Observed and simulated frequency distributions for the �AICRC statistic for the two campephagid phylogenies.
Supporting Information may be found in the online version of this article.
Please note: Wiley-Blackwell is not responsible for the content or functionality of any supporting information supplied by the
authors. Any queries (other than missing material) should be directed to the corresponding author for the article.
1 9 0 EVOLUTION JANUARY 2012


![HR - Runes & Radiations [Edited]](https://static.cupdf.com/doc/110x72/577ce7301a28abf103948b15/hr-runes-radiations-edited.jpg)