Delivering What Matters – A Case for PMOPMI –SV Trends & Viewpoints
Aug 26, 2013
Anita Merchant, PMP, CSM, CSPO, ITIL

2
My Guiding Principles – Making Change for the Better
“We’re here to put a dent in the universe. Otherwise why else even be here?”
“Here’s to the crazy ones — the misfits, the rebels, the troublemakers, the round pegs in the
square holes. The ones who see things differently — they’re not fond of rules.…….They push
the human race forward, and while some may see them as the crazy ones, we see genius,
because the ones who are crazy enough to think that they can change the world, are the ones
who do.”
-Steve Jobs
3
A Bit About Me
Career Since 1998� Software Engineer
� Business Analyst
� Project Manager
� Sr Program Manager
� PMO Manager
� Lean Change Agent
Focus Areas
� PMO, Portfolio & Program
Management
� Organizational Change
Management
� Business Process
Improvements
� Training & Coaching

4
Objectives of this Workshop
By the end of this presentation you will understand…
� Why does Business need a PMO?
� How to set up a PMO
� Evolution of a modern PMO
� Path Ahead for PMO success

5
Acknowledgements
Provides IT solutions to the Global 2000 through change and release
management solutions. Credit due to Jane Walton.
Portfolio management market leader, enabling decision makers
across the enterprise to balance strategy with people and money.
French multinational corporation providing IT services, professional
services and global management consulting.
Global management consulting, technology services and outsourcing
company enabling clients to become high performance businesses and
governments.
6
Exercise: Your View – PMO Newsflash
In your groups, take a sheet of paper and create a
“PMO Newsflash” on the subject:
What is a PMO?
Your “Newsflash” must contain no more than ten
words.
Task
You have 5 minutes to produce your “Newsflash”.

7
The Bad News
Over the last five years the PMO failure rate was
as high as 50% in the first year.
- Source: 2012 Gartner study
75% of PMOs fail in the first three years.
- Source: Forrester study (2011)
Less than 10% PMO are considered “high
performers”. Less than 1% PMOs are
considered “Best in Class”
- Source: The State of the PMO – 2007-2008. A Benchmark of
Current Business Practices Center for Business Practices (CBP)
Study)
60% of all organizations could benefit from
improving the maturity of their PMO
- Source: The State of the PMO – 2007-2008. A Benchmark of Current
Business Practices Center for Business Practices (CBP) Study
In low performing organizations, PMOs face much greater difficulty in being accepted as a real value-adding proposition, when compared to
high-performers
- Source: The State of the PMO – 2007-2008. A Benchmark of Current
Business Practices Center for Business Practices (CBP) Study
72% of organizations do not track benefits
beyond projects close. Benefits realization and supply and demand planning are expected to be the most challenging areas for PMOs over the
next two years.
-Source: 2011/12 PMO Trends Survey by PM-Partners Group
It has been shown that deploying a PMO does not lead to performance improvement itself. It is only when the PMO increases maturity that tangible improvement occurs.
(Source: Value of Project Management, Center for Business Practices (CBP) Study)
8
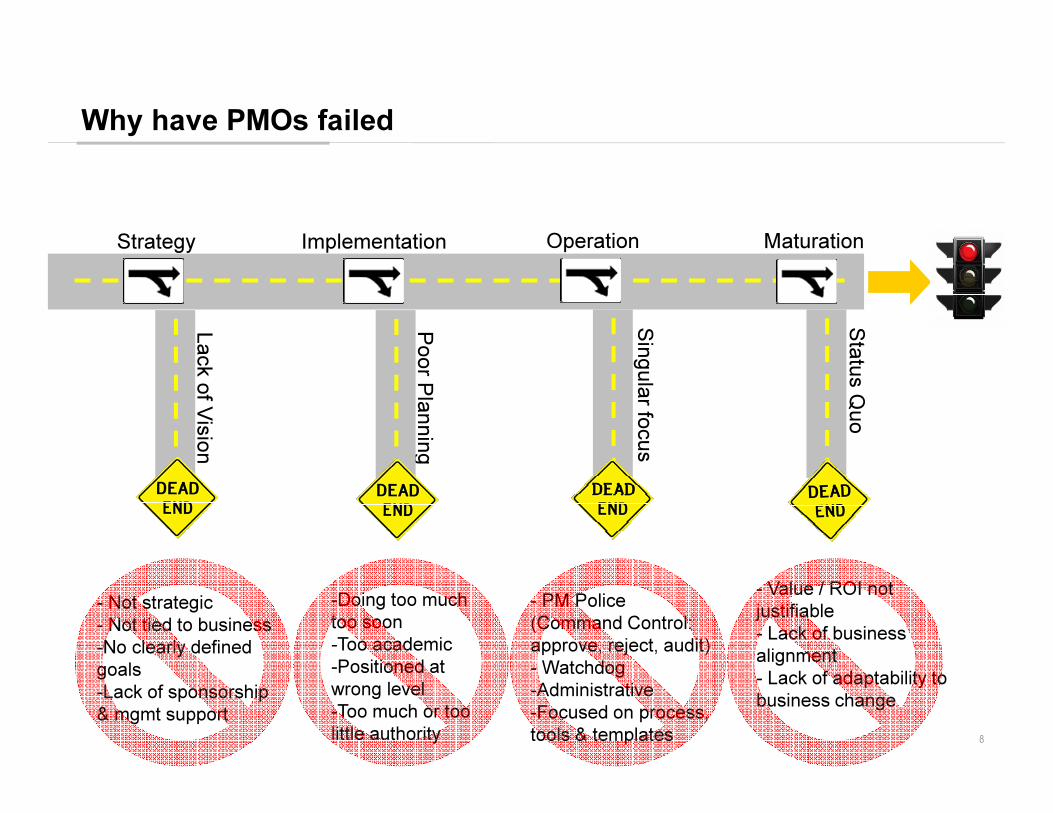
- Value / ROI not
justifiable
- Lack of business
alignment
- Lack of adaptability to
business change
- Not strategic
- Not tied to business
-No clearly defined
goals
-Lack of sponsorship
& mgmt support
-Doing too much
too soon
-Too academic
-Positioned at
wrong level
-Too much or too
little authority
Operation
Sin
gu
lar fo
cu
s
Maturation
Sta
tus Q
uo
- PM Police
(Command Control:
approve, reject, audit)
- Watchdog
-Administrative
-Focused on process,
tools & templates
Why have PMOs failed
Implementation
Po
or P
lan
nin
g
Strategy
La
ck o
f Vis
ion
9
Singular Focus
“Process and tools do not add value in themselves.
Outcomes and results add value”
“Throwing a process or tool at a business problem can
sometimes only make you do wrong things faster.
Speed up your failure!”

Why Does Business Need a PMO
11
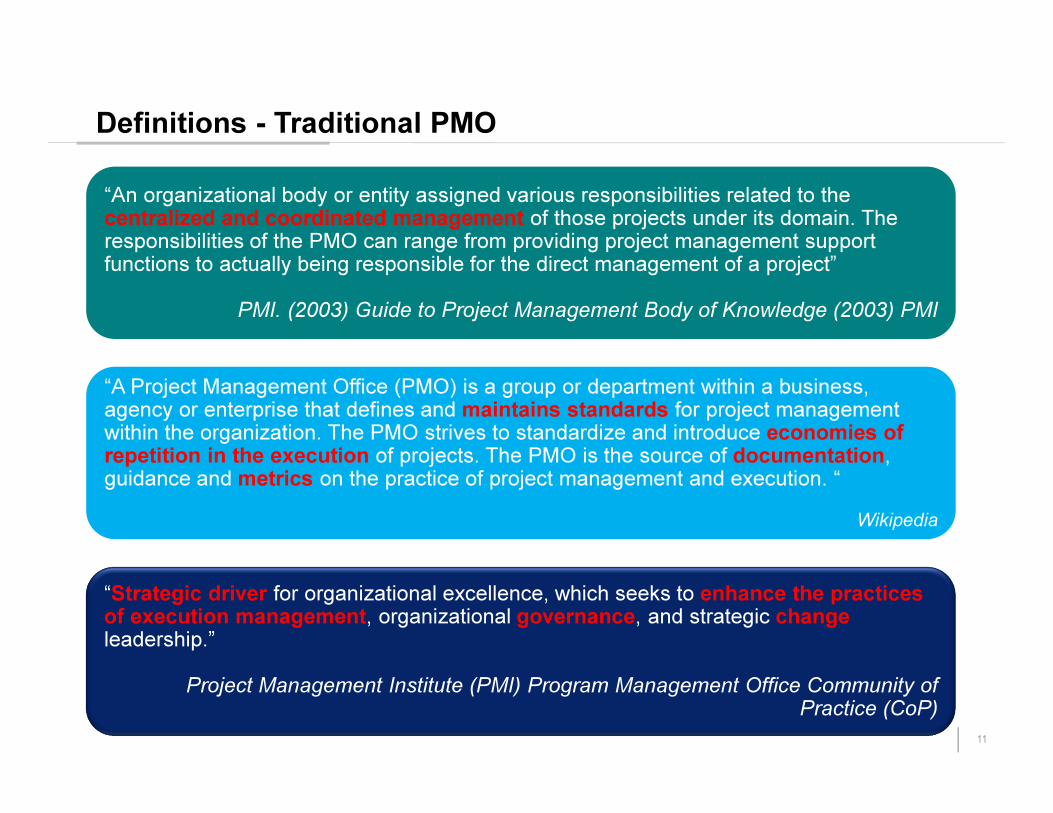
“An organizational body or entity assigned various responsibilities related to the centralized and coordinated management of those projects under its domain. The responsibilities of the PMO can range from providing project management support functions to actually being responsible for the direct management of a project”
PMI. (2003) Guide to Project Management Body of Knowledge (2003) PMI
Definitions - Traditional PMO
“A Project Management Office (PMO) is a group or department within a business, agency or enterprise that defines and maintains standards for project management within the organization. The PMO strives to standardize and introduce economies of repetition in the execution of projects. The PMO is the source of documentation, guidance and metrics on the practice of project management and execution. “
Wikipedia
“Strategic driver for organizational excellence, which seeks to enhance the practices of execution management, organizational governance, and strategic changeleadership.”
Project Management Institute (PMI) Program Management Office Community of Practice (CoP)
12
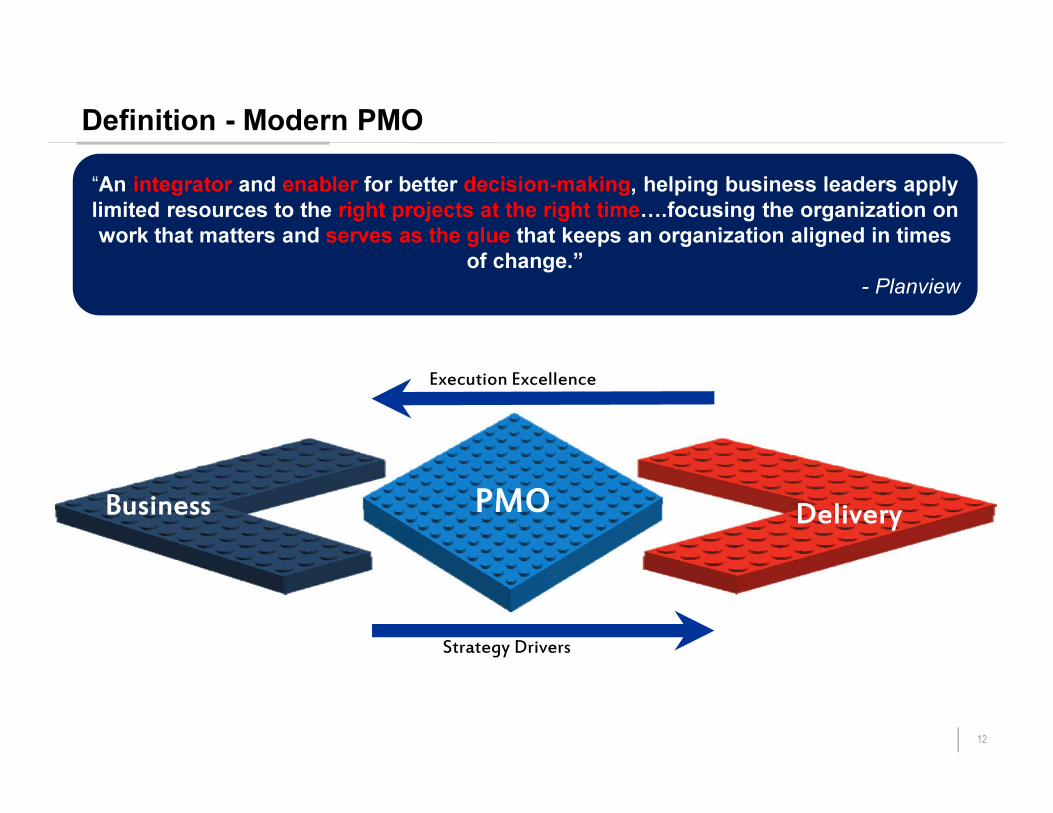
Business Delivery
Definition - Modern PMO
Execution Excellence
Strategy Drivers
PMO
“An integrator and enabler for better decision-making, helping business leaders apply
limited resources to the right projects at the right time�.focusing the organization on
work that matters and serves as the glue that keeps an organization aligned in times
of change.”
- Planview
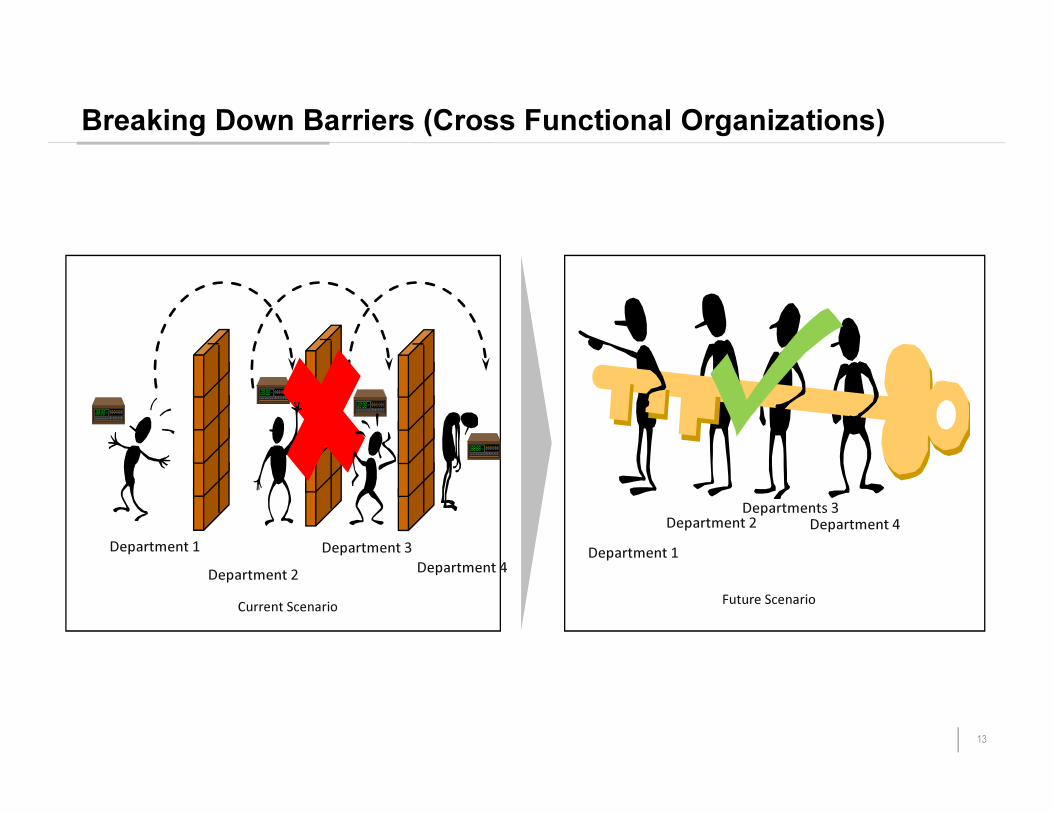
13
Department 4
Department 1
Department 2
Department 3
Current Scenario
Department 4
Department 1
Department 2Departments 3
Future Scenario
Breaking Down Barriers (Cross Functional Organizations)
14
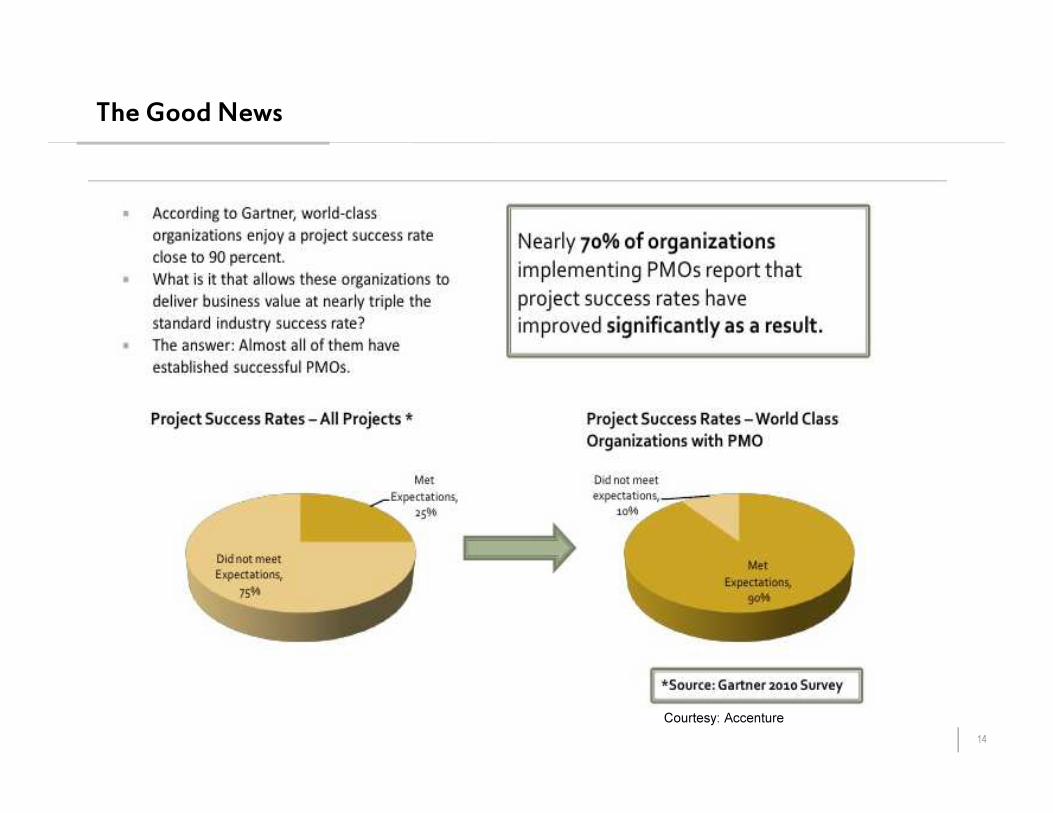
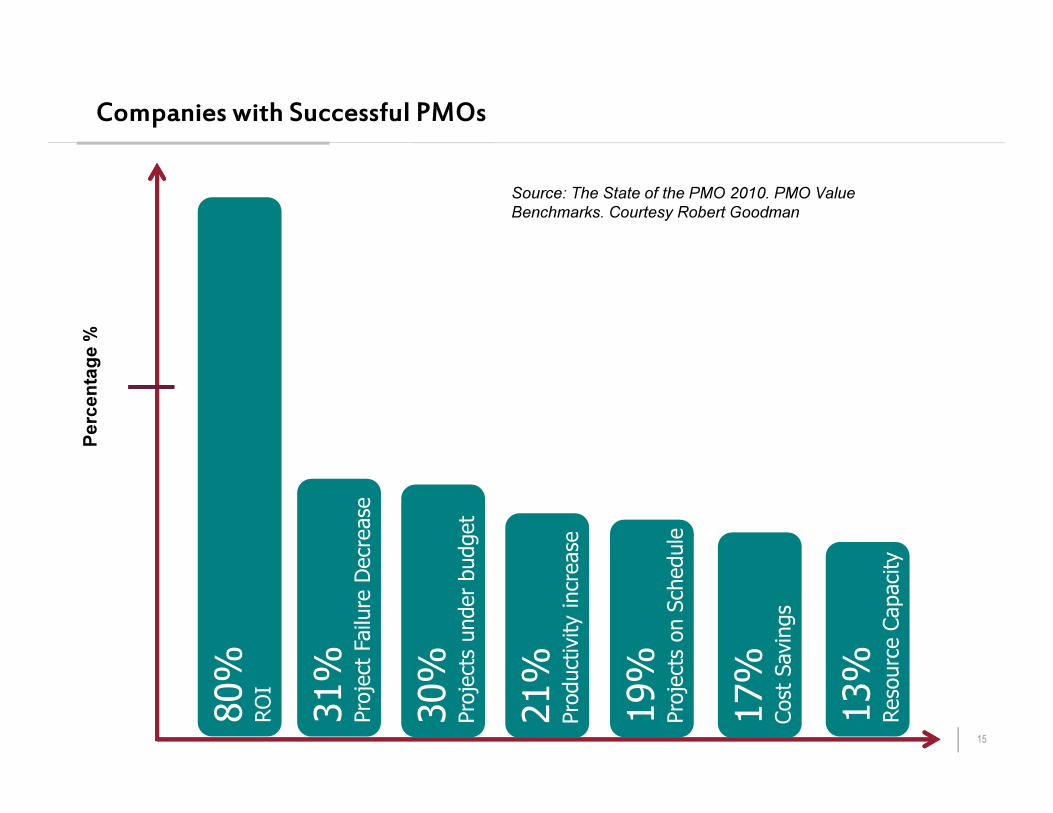
The Good News
Courtesy: Accenture
15
Companies with Successful PMOs
80%
RO
I
31%
Pro
ject
Failu
re D
ecr
ease
19%
Pro
ject
s on S
chedule
Perc
en
tag
e %
30%
Pro
ject
s under
budget
21%
Pro
duct
ivity incr
ease
17%
Cost
Savin
gs
13%
Reso
urc
e C
apaci
ty
Source: The State of the PMO 2010. PMO Value
Benchmarks. Courtesy Robert Goodman

16
A Horror Movie Set
Lack of morale
Projects popping up everywhere like weeds – voice wins
No visibility on what is coming
Resources assigned to 10-15 projects at a time
Resources shared between operations and projects
Project startup took an average of 2 – 3 months
Less than 50% on-time / on-budget
Lack of resource planning and visibility of who was working on what
No visibility on portfolio health, dependencies, & resource conflicts
Inadequate accounting for project budgets, billing disputes
High PM turnover
Penalizing contractual terms

Setting Up a PMO
18
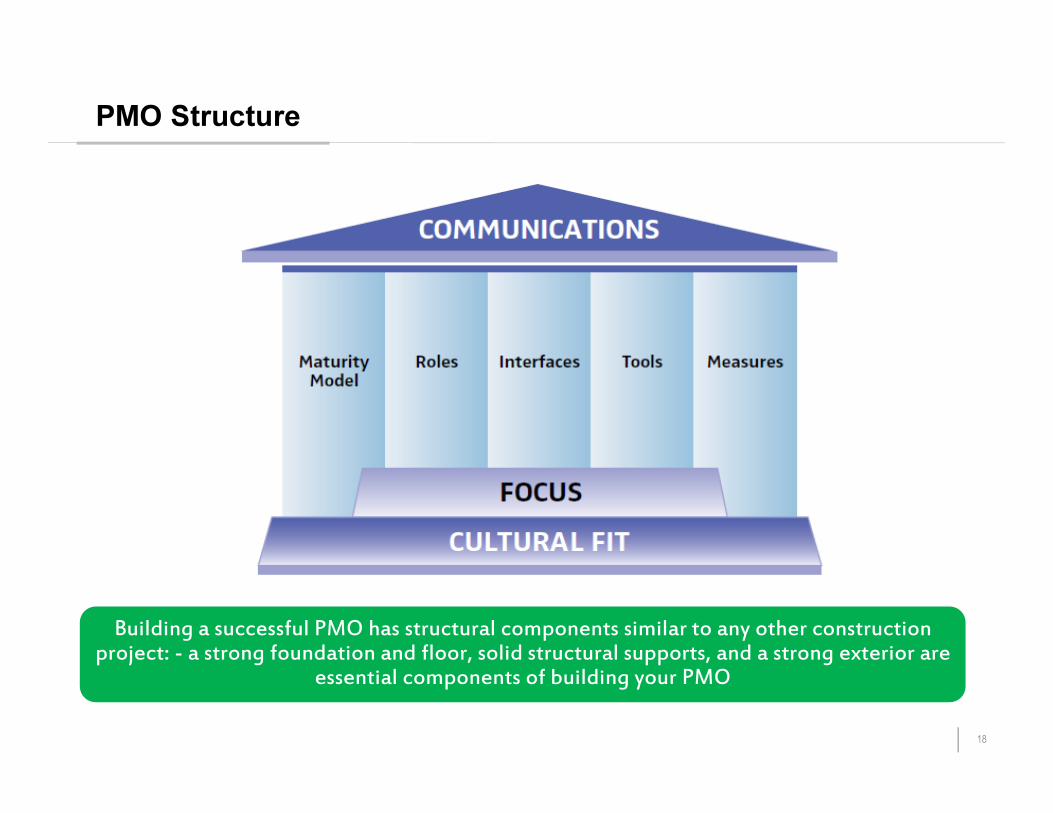
PMO Structure
Building a successful PMO has structural components similar to any other construction project: - a strong foundation and floor, solid structural supports, and a strong exterior are
essential components of building your PMO
19
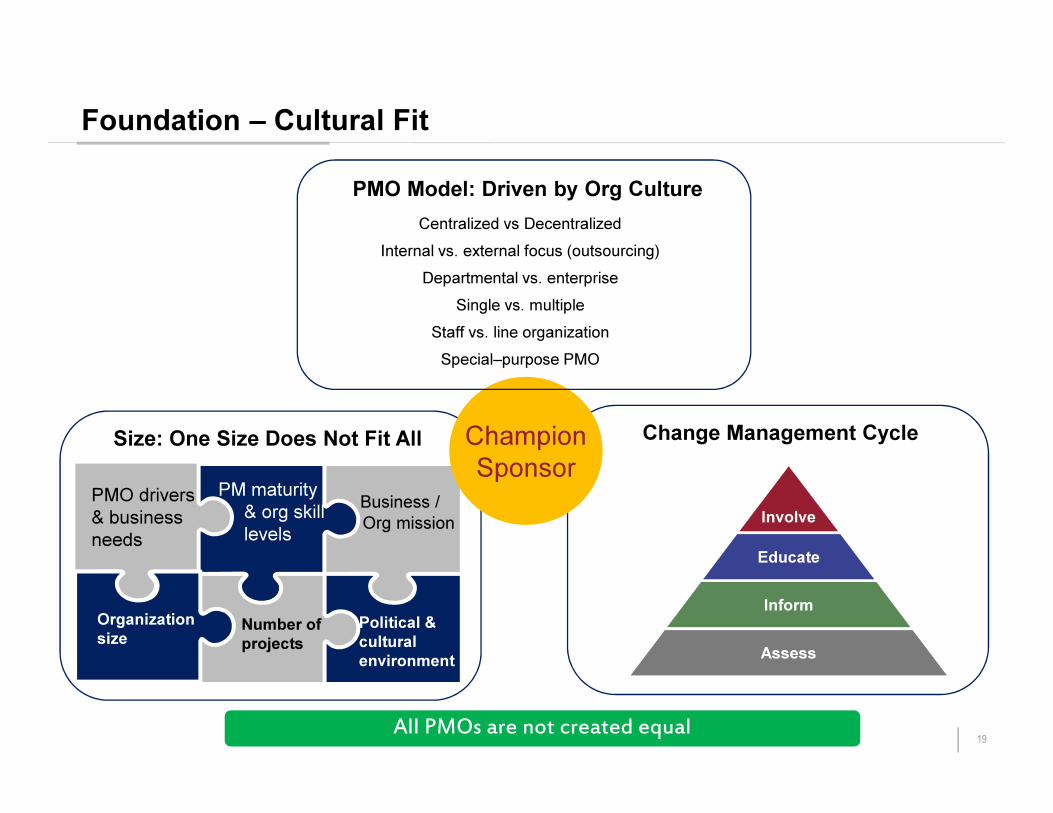
Foundation – Cultural Fit
Business /
Org mission
PM maturity
& org skill
levels
PMO drivers
& business
needs
Size: One Size Does Not Fit All
Organization
sizeNumber of
projects
Political &
cultural
environment
Involve
Educate
Inform
Assess
Change Management Cycle
All PMOs are not created equal
Champion
Sponsor
PMO Model: Driven by Org Culture
Centralized vs Decentralized
Internal vs. external focus (outsourcing)
Departmental vs. enterprise
Single vs. multiple
Staff vs. line organization
Special–purpose PMO

20
Change Management
“Change is a marriage, not a one-night stand. Change
requires thoughtful planning and sensitive
implementation”
21
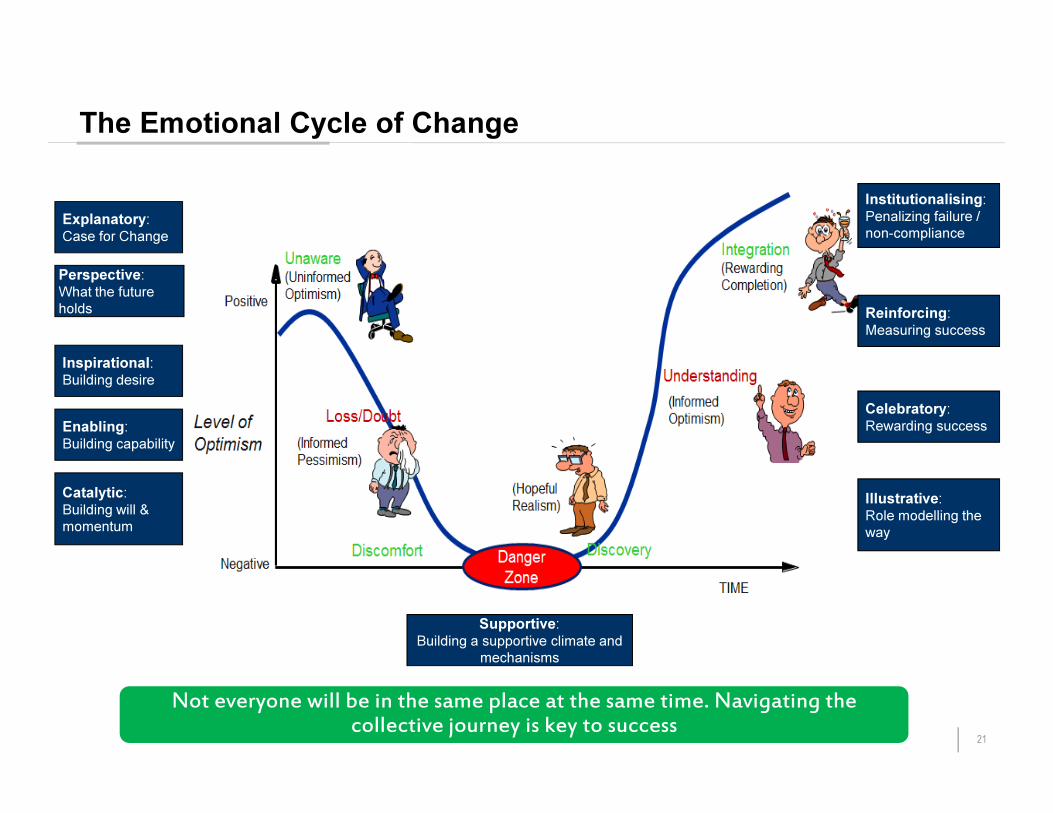
The Emotional Cycle of Change
Not everyone will be in the same place at the same time. Navigating the collective journey is key to success
Explanatory: Case for Change
Perspective:What the future
holds
Inspirational:Building desire
Enabling:Building capability
Catalytic:Building will &
momentum
Illustrative:Role modelling the
way
Celebratory:Rewarding success
Reinforcing:Measuring success
Institutionalising:Penalizing failure /
non-compliance
Supportive:Building a supportive climate and
mechanisms

22
PMO Implementation Strategies
PMO Charter PM MaturitySponsor /
Mgmt SupportPerception of
Value
Political
EnvironmentCulture /
Value System
Strategy Drivers
Implementation Approaches
Evolutionary/Incremental
� Lower implementation risks
� Lower start up costs
�More suitable if high resistance to change
and low management support
�Will take longer to demonstrate ROI
Revolutionary/Wholesale
�May be able to demonstrate ROI
quicker
�More suitable if crisis or recognition at
high level that change is imperative
�Higher implementation risks
�Higher startup costs
23
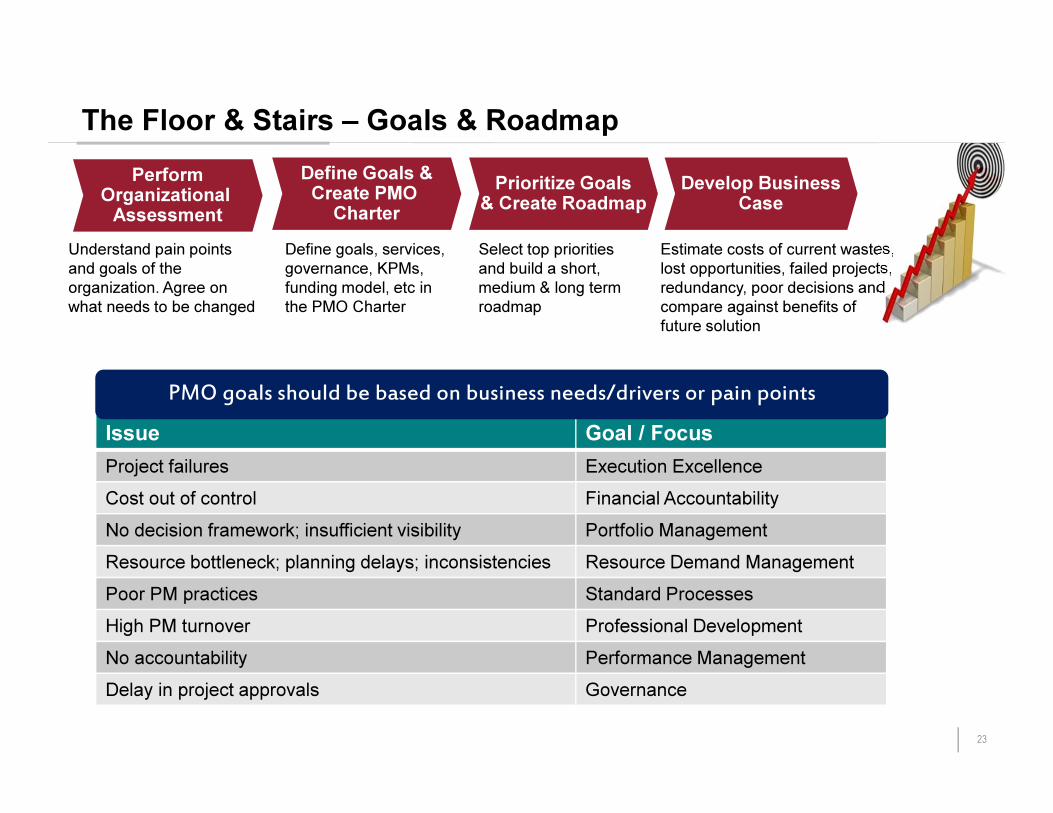
The Floor & Stairs – Goals & Roadmap
Understand pain points
and goals of the
organization. Agree on
what needs to be changed
PerformOrganizational Assessment
Define Goals &Create PMO Charter
Prioritize Goals& Create Roadmap
Develop BusinessCase
Define goals, services,
governance, KPMs,
funding model, etc in
the PMO Charter
Select top priorities
and build a short,
medium & long term
roadmap
Estimate costs of current wastes,
lost opportunities, failed projects,
redundancy, poor decisions and
compare against benefits of
future solution
Issue Goal / Focus
Project failures Execution Excellence
Cost out of control Financial Accountability
No decision framework; insufficient visibility Portfolio Management
Resource bottleneck; planning delays; inconsistencies Resource Demand Management
Poor PM practices Standard Processes
High PM turnover Professional Development
No accountability Performance Management
Delay in project approvals Governance
PMO goals should be based on business needs/drivers or pain points
24
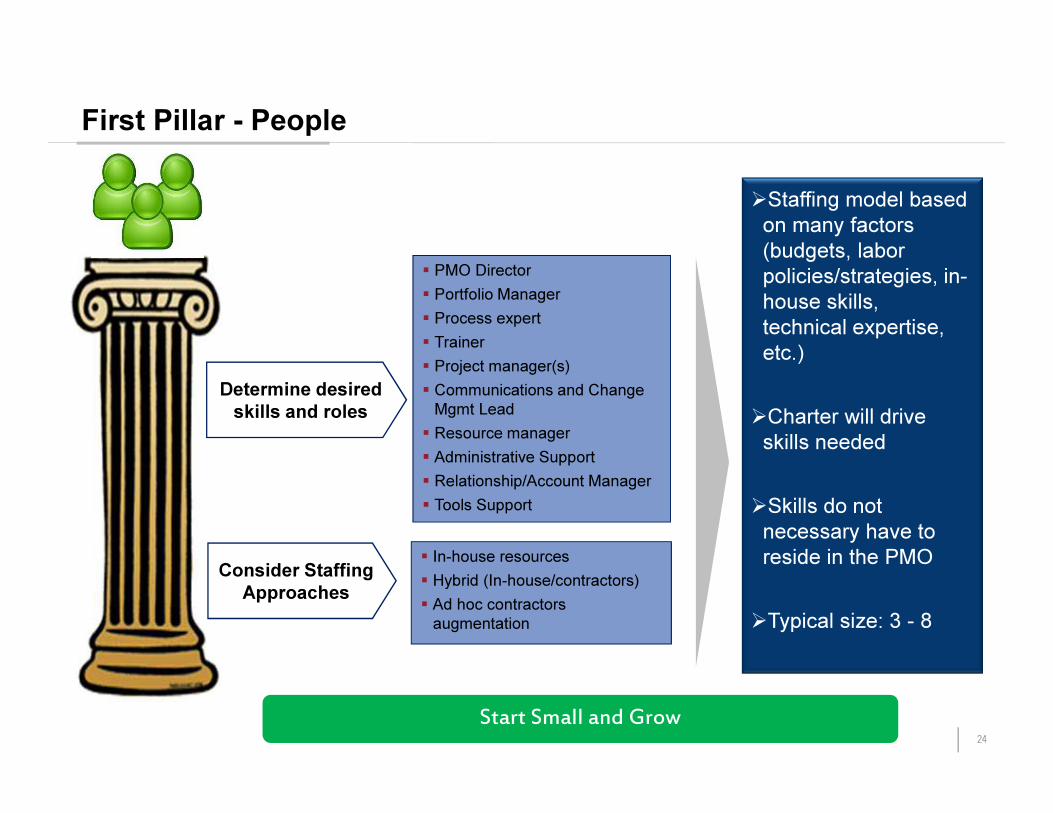
First Pillar - People
� PMO Director
� Portfolio Manager
� Process expert
� Trainer
� Project manager(s)
� Communications and Change
Mgmt Lead
� Resource manager
� Administrative Support
� Relationship/Account Manager
� Tools Support
Determine desired
skills and roles
� In-house resources
� Hybrid (In-house/contractors)
� Ad hoc contractors
augmentation
Consider Staffing
Approaches
�Staffing model based
on many factors
(budgets, labor
policies/strategies, in-
house skills,
technical expertise,
etc.)
�Charter will drive
skills needed
�Skills do not
necessary have to
reside in the PMO
�Typical size: 3 - 8
Start Small and Grow
25
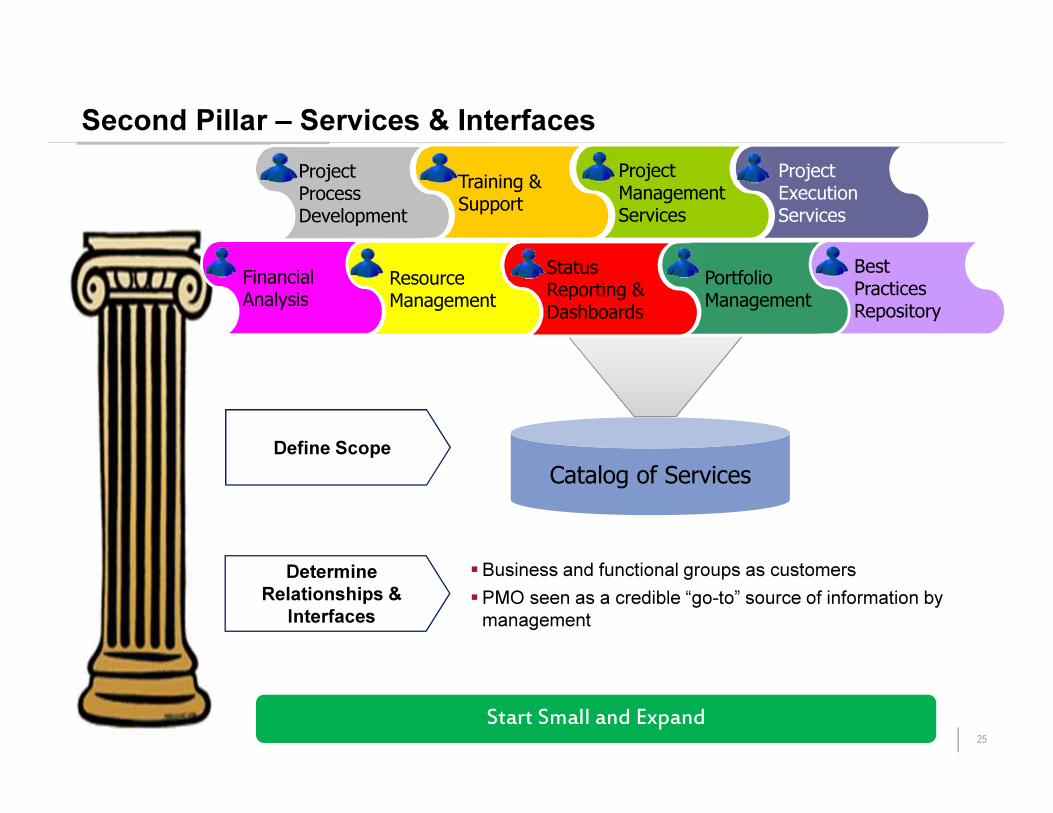
Second Pillar – Services & Interfaces
Catalog of Services
PortfolioManagement
StatusReporting &Dashboards
ResourceManagement
FinancialAnalysis
Project Process Development
Training &Support
Project ManagementServices
ProjectExecutionServices
Best PracticesRepository
Define Scope
Determine
Relationships &
Interfaces
�Business and functional groups as customers
�PMO seen as a credible “go-to” source of information by
management
Start Small and Expand

26
Third Pillar – Tools & Templates
�
�
�
�
� Implement standardized tools, templates, and processes
� operate a central data repository and/or a central planning system
� Find out what is already there and working well, and institutionalize it.
� Create a timeline for adding to the tool suite.
Start Small and Build
Lessons
LearnedProject
Dashboard
Project
Report
Project
ScheduleRAID LogProject
Budget
Project
LifecycleProject
Charter
Project
Requirements
Example Toolset

27
INITIAL
Ad-hoc and
disorganized
MASTERED
Best practices, automation,
continuous improvements
DEFINED
Documented, repeatable
CONTROLLED
Measured and monitored
MANAGED
Consistent, enables decision
making
Walls – PMO Maturity Model
Identify Capabilities
DetermineScale
“As is” Analysis
“To Be” Goal
Create Roadmap
Financial analysis,
risk analysis, project
planning, resource
allocation, etc.
Define rating criteria
from initial to
mature
Current state
assessment
Target rating for
capabilities
Current -> Next
� Define vision of fully
functioning PMO in 2 – 5 yrs
� Compare against best
practices
� Different models (CobiT,
OPM3, ISO 15504, CMM/CMMI)

28
Doors & Windows – Metrics & Success Measures
Less that 15% of PMOs employ formal
metrics program (Source: Forrester
Research)
Project vs PMO metrics - PMOs should
be willing to subject itself to the same
types of measures it require of a project
or program
Metrics are essential for growth &
support – demonstrate progress, value,
& productivity
Types of Metrics (Examples)
No such thing as typical metrics (driven
by PMO Charter)
How do you want to look to the outside world?
•ROI achieved from early delivery
•Cost savings
•Revenue increase
•Percent of projects subjected to decision analysis
•Spending eliminated due to prioritization
Value Metrics
Executive focus -measure and demonstrate
value to business
•Number/percent projects completed on/ahead of schedule
•Number/percent projects completed on/below budget
•Number projects managed – increase over year (target vs. actual)
•Percent of resource utilization
•Percent of billable versus non-billable time
Functional Metrics
Internal focus –performance & quality of PMO
functions
•Turn around time on business cases
•Turn around time on responding to stakeholder request
•Customer satisfaction
•Issues turnaround time
•Quality of information
•Reduction in issues
Service Level Metrics
Customer focus –service level, QoS
29
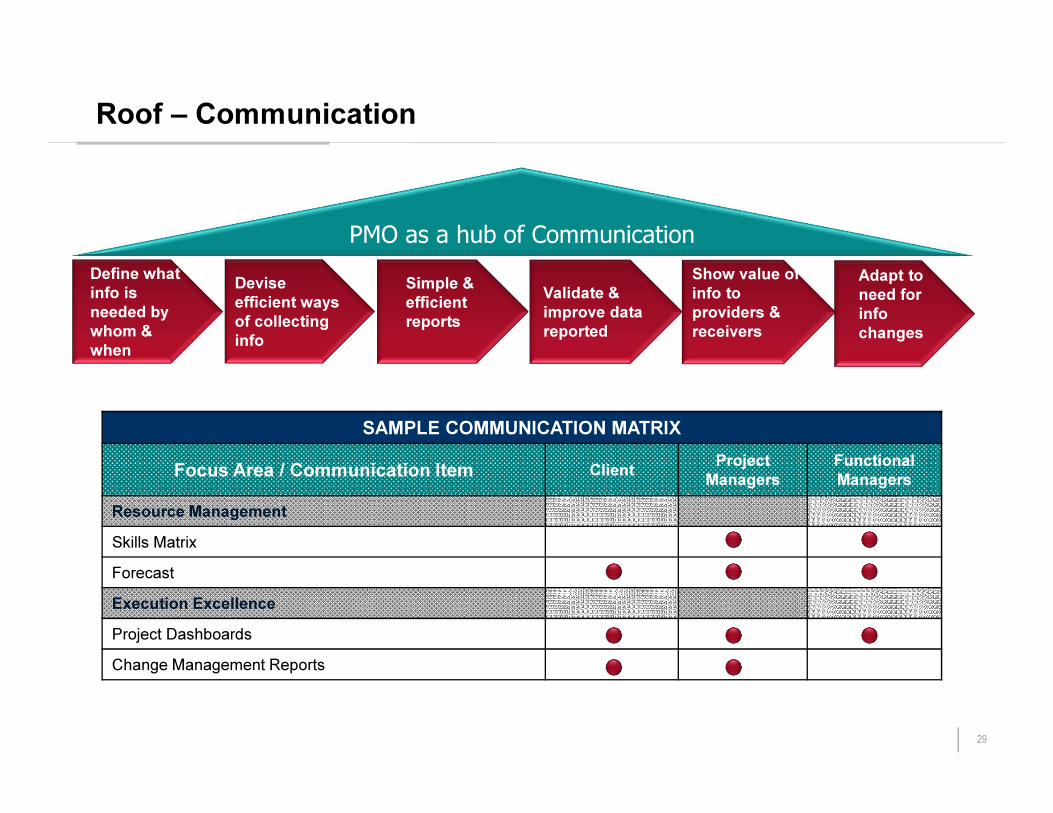
Roof – Communication
PMO as a hub of Communication
SAMPLE COMMUNICATION MATRIX
Focus Area / Communication Item ClientProject
Managers
Functional
Managers
Resource Management
Skills Matrix
Forecast
Execution Excellence
Project Dashboards
Change Management Reports
Define what
info is
needed by
whom &
when
Devise
efficient ways
of collecting
info
Simple &
efficient
reports
Validate &
improve data
reported
Show value of
info to
providers &
receivers
Adapt to
need for
info
changes

30
Success Drivers for a new PMO
Top Down Support
Bottoms-upBuy-in
Strong LOB / Client representation
KPIs Measured & Reported
Executive Sponsorship
Clear Charter
Communications & PR
Governance & Priorities
Time to Derive Benefits
Evolution of a Modern PMO
32
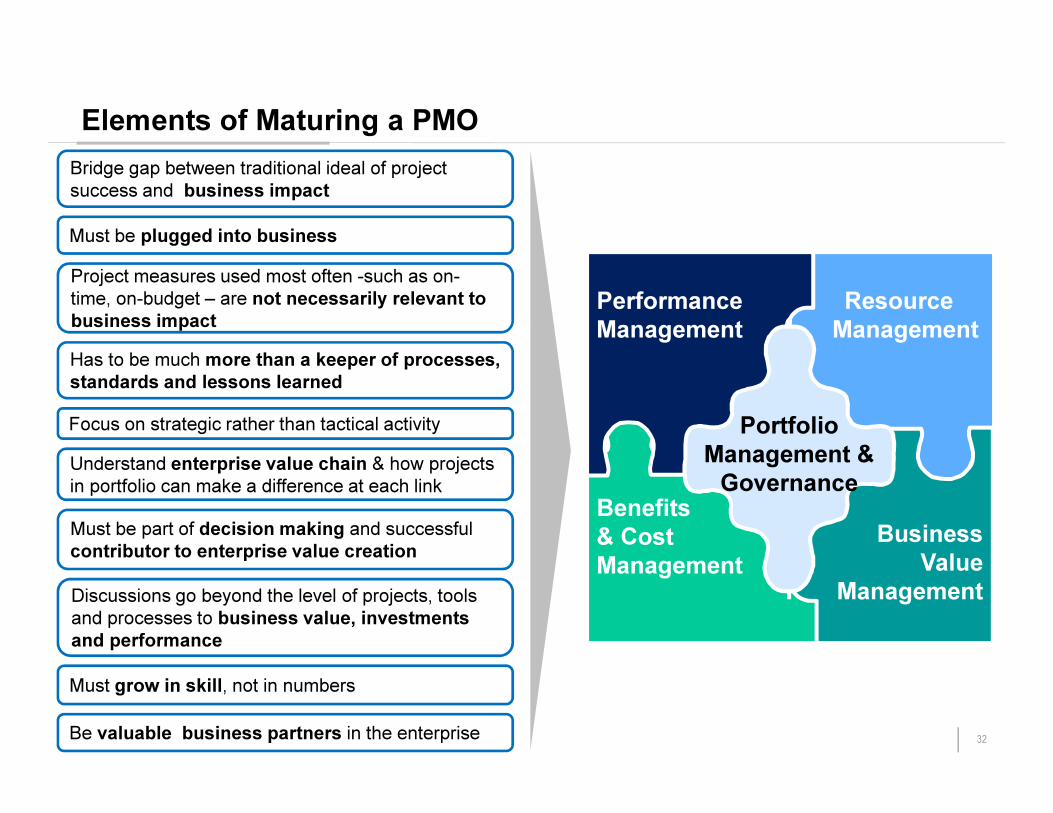
Elements of Maturing a PMO
Resource
Management
Business
Value
Management
Benefits
& Cost
Management
Performance
Management
Portfolio
Management &
Governance
Bridge gap between traditional ideal of project
success and business impact
Must be plugged into business
Project measures used most often -such as on-
time, on-budget – are not necessarily relevant to
business impact
Has to be much more than a keeper of processes,
standards and lessons learned
Focus on strategic rather than tactical activity
Understand enterprise value chain & how projects
in portfolio can make a difference at each link
Must be part of decision making and successful
contributor to enterprise value creation
Discussions go beyond the level of projects, tools
and processes to business value, investments
and performance
Must grow in skill, not in numbers
Be valuable business partners in the enterprise

33
Portfolio Management & Governance
PROJECT MANAGEMENTDo Projects Right
PORTFOLIO MANAGEMENTDo The Right Projects
PROGRAM MANAGEMENTDo Projects Together
Portfolio management is about doing the right projects, at the right
time, using the right resources by selecting and managing projects
as a portfolio of investments
PMO Maturity
Portfolio governance is about sharing power and decision making at management level. Stakeholders include Executive Governance Board, IT Steering Committee and PMO

34
Portfolio Management Process
Clarify business objectives
DetermineValuationCriteria
CreateInventory
Rate Projects
Select Projects
Validate &
Initiate
Manage&
Monitor
� Strategy Map
� Org Objectives
� Based on objectives
� Financial or Scoring
� Limit to 4 - 10
� Poor criteria =>
wrong projects
� Projects
� Requests
� Ideas
� Use valuation criteria
� Early estimates:
� Dependencies
� Constraints
� Resources
� High Impact
� High Value
� Meet teams / mgrs
� Portfolio feasibility
� Refine:
� Dependencies
� Constraints
� Resources
� Performance Mgmt
Maximize
Balance
Align
Execution -> Strategy
No pet projects!
Greatest ROI
Biggest bang for the buck
Not lopsided
Not too risky
Short vs long term results
User Balance Displays
Popular Balance Displays: (1) risk vs reward bubble charts (2)
strategy vs tactical range (3) market vs product line segmentation
(4) time-to-completion (5) time to profit)
Review and update regularly

35
Strategy
implemented
Portfolio Management & Governance
Best Practices
Benefits
Portfolio Process Maturation
Real-time portfolio analysis, reporting and planning, structured investment decision
making
Continuous portfolio reviews and planning
Inventory of projects
Scoring� Customer request, � Break-fix� Resource capacity� Innovation� Risk mitigation� Compliance� Cost savings� Market share� Alignment to company goals� Competitive advantage� Technical feasibility
Valuation Criteria (examples)
Financial� Time to profit� Time to market� ROI� NPV� Payback period� IRR� Margin / revenue
growth
Portfolio
Value
Analysis
Less chaos
Strong
governanceFaster time to
market
Say “no” to
projectsHigher
productivity
No loudest
voice wins
� Organize PMO along customer lines
� Train org on portfolio mentality
� Constantly inprove decision valuation criteria
Portfolio
Maturity
� Involve Voice of Customer (VOC) in decision making

36
Performance & Risk Management Positive Neutral Negative
•Transition from project on-time to deliverables and milestones on time (deliver smaller chunks of value)
•Project-level: tradeoff between delivering on time and delivering value. Late is acceptable sometimes if delay is required to deliver full value
•Portfolio-level: time is only one component to optimization of net value. Some investments are delayed so others can create value more quickly
Schedule Performance
•Transition from on-budget to strategic cost / ROI analysis
•Tradeoff between costs and value, utility, functionality and benefits
•Lifecycle costs (end-to-end solution)
•Provide tools for cost-analysis
•Cost analysis (cost vs value tradeoff) at portfolio level - Sometimes a project may cost less compared to another project but may not be able to create value for the customer
•Sometimes going over-budget may be necessary for innovation or long-term benefits
Cost Performance
•Design process with the objective of delivering value to the enterprise
•As processes grow, they must be lightweight, adaptive and easy to follow
•Measure performance of the process to ensure it is working efficiently
•Continuous Improvements
•Demonstrate results of processes and share improvement stats to ensure adherence
•Provide streamlined and supportive tools for processes
•Emphasis on business performance rather than just project performance
Process Performance
•Identify risks -> score/assess risks -> actively manage
•Use risks to estimate variance in a project
•Risk profiles of investments in a portfolio
•Balancing risks between projects in a portfolio to maximize value
Risk Management
•Decision focused reporting
•Culture of managing from data
•Inferring / interpreting data and not just deliver reports (decode what the data means)
•Engage customers (end users and business) to identify data to measure
•Identify the right KPIs (measure what matters to business), set credible targets, automate data collection
Performance & Risk
Reporting

37
TEXT
CAPACITY
PLANNINGDEMAND MANAGEMENT
Resource Management
SUPPLY MANAGEMENT
• Demand forecast by
categories (skills, projects,
function)
• Institutionalize forecast
• Continuous planning
• Associate demand with
resource utility
• One demand may be
delayed for another valuable
one
• Utility and cost tradeoff
• Opportunity cost
• Skills matrix
• Skill levels
• Develop skills inventory –
real capabilities of the
organization
• Balance skills availability
with customer demand
• Assess demand to
evaluate constraints
• Constrained resources
inside and outside the
org
• Predict future capacity
• Tools for matching supply
and demand
• Develop capacity before
producing products, even
before demand exists
• Prof development,
training, recruitment,
flexible supply sources,
cross-functional staffing
• Match available resource
with needs of org within
set timeframe & budget
and with minimum use of
resources
• balance of cost, value and
risks
• system view for global
effectiveness of resource
allocation
• Bill for services based on
value rather than cost
RESOURCE OPTIMIZATION
Demand Management Supply Management Capacity Planning Resource Optimization
Investing the right human capital and other assets in portfolio projects and activities

38
Life-cycle
thinking
Build foundation for
understanding
&measuring value
and reporting
continuously on
value of activities
(not just value of
projects
Benefits & Cost Management
True Value
Of
Portfolio
� Spending on a new
infrastructure may
relieve future
maintenance costs and
increase performance
and capacity
� Investing in a new
technology may give
competitive advantage
� Investing in SaaS may
reduce infrastructure
and
support/maintenance
costs
Examples

39
Putting it Together
Path Ahead for PMO Success

41
PMO Agility
Continuous
Improvements
Adaptive to Change:
Learn-Unlearn-Relearn
Periodic reviews of the
PMO objectives against
the needs of the businessMeasurements of the
processes and tools such as
effectiveness, adoption and
consistent use
Data-driven
performance analysis
Light-weight
processes
Change Agent for
business
Demonstrable
results
Center of
Excellence
Value driven
Capacity
development
“Change is inevitable, except from a vending machine”
42
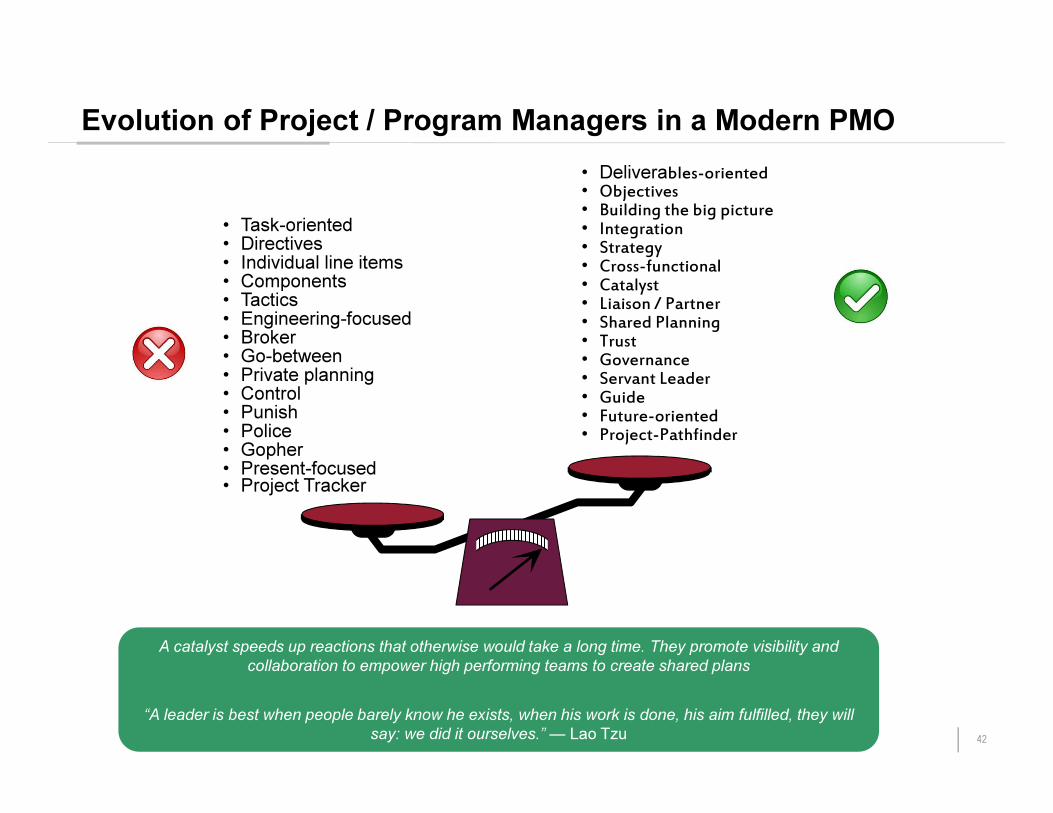
Evolution of Project / Program Managers in a Modern PMO
A catalyst speeds up reactions that otherwise would take a long time. They promote visibility and
collaboration to empower high performing teams to create shared plans
“A leader is best when people barely know he exists, when his work is done, his aim fulfilled, they will
say: we did it ourselves.”— Lao Tzu
• Deliverables-oriented• Objectives• Building the big picture• Integration• Strategy• Cross-functional• Catalyst• Liaison / Partner• Shared Planning• Trust• Governance• Servant Leader• Guide• Future-oriented• Project-Pathfinder
• Task-oriented• Directives• Individual line items• Components• Tactics• Engineering-focused• Broker• Go-between• Private planning• Control• Punish• Police• Gopher• Present-focused• Project Tracker

43
Refocus the organization on outcomes, benefits and
value, thus ensuring the best use of limited
resources
Improve the organization's portfolio management capabilities
as a way to manage innovation and change events and to drive
alignment
Serve as a change agent across a wide array of operations, elements,
products, programs, services, and assets
Steps of Increased Value Creation
Valu
e P
ro
vid
ed
Steps to Success
� Minimize Risk
� Maximize Value at Inception
� Accelerate Speed to Value
� Adaptable to changes; agility

44
PMO Skills Inventory – Spider Diagram
There is no time like the present
to set new goals and direction for
your PMO. An easy but effective
way to do this is to take the
“spider diagrams” in Figure 1 and
enter your self-assessment for
each maturity dimension by
making a colored dot on the
cross-hatch that best matches
your current state. Connect those
dots with lines, and you’ve made a
picture of your current “coverage”
of the maturity dimensions. Then
place another colored dot for
where you want to be a year from
now, and yet another dot for
where you want to be two years
from now. Use that diagram as a
simple representation of your
PMO business plan, and flesh it
out with how you will get from
point A to point B.
45
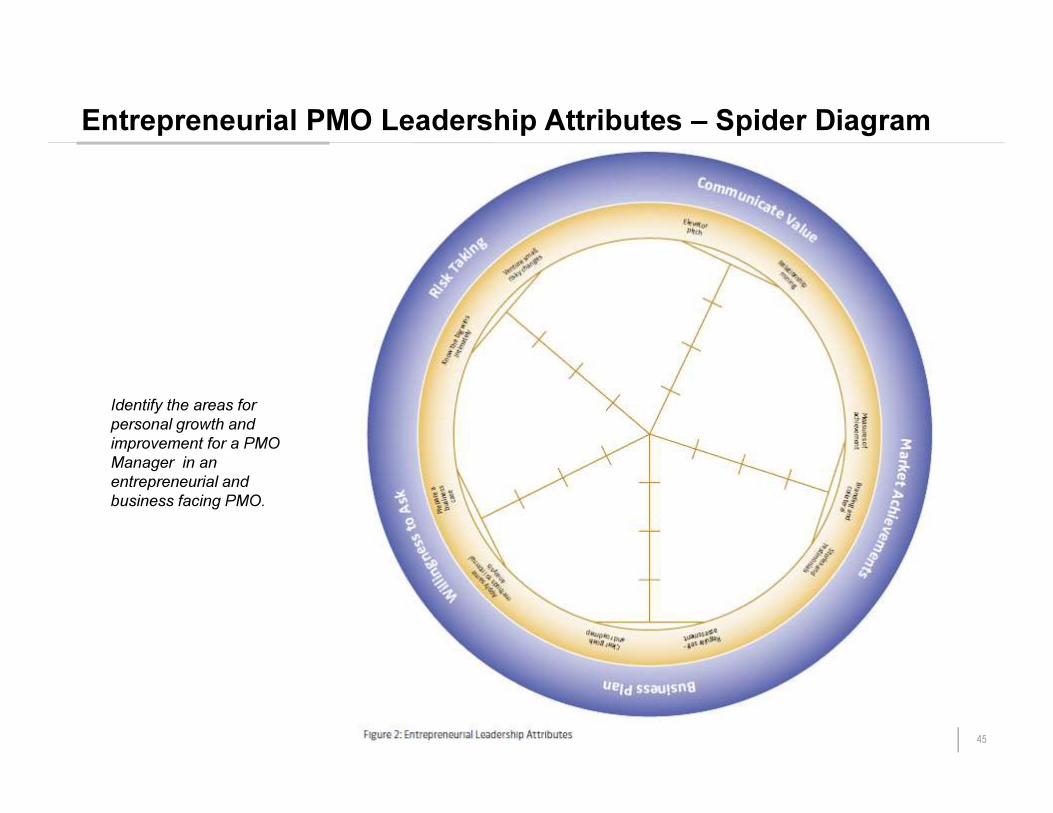
Entrepreneurial PMO Leadership Attributes – Spider Diagram
Identify the areas for
personal growth and
improvement for a PMO
Manager in an
entrepreneurial and
business facing PMO.

46
Leadership for Success
“PMOs don’t succeed or fail…PMO is just a structure.
What succeeds or fails is the organization or the leaders
who try.”
- Adapted from Mark Graban, Lean Enterprise Institute

47
Final Thoughts
“Things don’t have to change the world to be important.”
“That’s been one of my mantras — focus and simplicity. Simple can be harder
than complex. You have to work hard to get your thinking clean to make it
simple. But it’s worth it in the end because once you get there, you can move
mountains.”
“Details matter, it’s worth waiting to get it right.”
-Steve Jobs

48
Exercise: Takeaways
Take 5 minutes to think about your takeaways and feel
free to share and discuss with the group
Task
Based on what you have heard today, list on separate post-it
notes:
What are your Takeaways from the presentation today?

Thank You !