Declining Responsiveness of Plasmodium falciparumInfections to Artemisinin-Based Combination Treatmentson the Kenyan CoastSteffen Borrmann1,2*, Philip Sasi1,3, Leah Mwai1, Mahfudh Bashraheil1, Ahmed Abdallah1, Steven
Muriithi1, Henrike Fruhauf1,2, Barbara Schaub1,2, Johannes Pfeil1,2, Judy Peshu1, Warunee
Hanpithakpong4, Anja Rippert2, Elizabeth Juma5, Benjamin Tsofa6, Moses Mosobo1, Brett Lowe1, Faith
Osier1, Greg Fegan1, Niklas Lindegardh4, Alexis Nzila1, Norbert Peshu1, Margaret Mackinnon1,7, Kevin
Marsh1,7
1 Kenya Medical Research Institute/Wellcome Trust Research Programme, Kilifi, Kenya, 2 Heidelberg University School of Medicine, Dept. of Infectious Diseases,
Heidelberg, Germany, 3 Department of Clinical Pharmacology, Muhimbili University of Health and Allied Sciences, Dar es Salaam, Tanzania, 4 Mahidol-Oxford Tropical
Medicine Research Unit, Faculty of Tropical Medicine, Mahidol University, Bangkok, Thailand, 5 Division of Malaria Control, Ministry of Health, Nairobi, Kenya, 6 District
Office, Ministry of Health, Kilifi, Kenya, 7 Centre for Tropical Medicine, Nuffield Department of Clinical Medicine, University of Oxford, CCVTM, Oxford, United Kingdom
Abstract
Background: The emergence of artemisinin-resistant P. falciparum malaria in South-East Asia highlights the need forcontinued global surveillance of the efficacy of artemisinin-based combination therapies.
Methods: On the Kenyan coast we studied the treatment responses in 474 children 6–59 months old with uncomplicated P.falciparum malaria in a randomized controlled trial of dihydroartemisinin-piperaquine vs. artemether-lumefantrine from2005 to 2008. (ISRCTN88705995)
Results: The proportion of patients with residual parasitemia on day 1 rose from 55% in 2005–2006 to 87% in 2007–2008(odds ratio, 5.4, 95%CI, 2.7–11.1; P,0.001) and from 81% to 95% (OR, 4.1, 95%CI, 1.7–9.9; P = 0.002) in the DHA-PPQ and AM-LM groups, respectively. In parallel, Kaplan-Meier estimated risks of apparent recrudescent infection by day 84 increasedfrom 7% to 14% (P = 0.1) and from 6% to 15% (P = 0.05) with DHA-PPQ and AM-LM, respectively. Coinciding with decreasingtransmission in the study area, clinical tolerance to parasitemia (defined as absence of fever) declined between 2005–2006and 2007–2008 (OR body temperature .37.5uC, 2.8, 1.9–4.1; P,0.001). Neither in vitro sensitivity of parasites to DHA norlevels of antibodies against parasite extract accounted for parasite clearance rates or changes thereof.
Conclusions: The significant, albeit small, decline through time of parasitological response rates to treatment with ACTsmay be due to the emergence of parasites with reduced drug sensitivity, to the coincident reduction in population-levelclinical immunity, or both. Maintaining the efficacy of artemisinin-based therapy in Africa would benefit from a betterunderstanding of the mechanisms underlying reduced parasite clearance rates.
Trial Registration: Controlled-Trials.com ISRCTN88705995
Citation: Borrmann S, Sasi P, Mwai L, Bashraheil M, Abdallah A, et al. (2011) Declining Responsiveness of Plasmodium falciparum Infections to Artemisinin-BasedCombination Treatments on the Kenyan Coast. PLoS ONE 6(11): e26005. doi:10.1371/journal.pone.0026005
Editor: Ivo Mueller, Walter & Eliza Hall Institute, Australia
Received July 8, 2011; Accepted September 15, 2011; Published November 10, 2011
Copyright: � 2011 Borrmann et al. This is an open-access article distributed under the terms of the Creative Commons Attribution License, which permitsunrestricted use, distribution, and reproduction in any medium, provided the original author and source are credited.
Funding: This study was supported by DFG (SFB 544, Junior Group A7) and MMV grants to SB, and by European Developing Countries Clinical Trials Partnership(EDCTP to LM and AN), and by The Wellcome Trust (WT077092). The funders had no role in study design, data collection and analysis, decision to publish, orpreparation of the manuscript.
Competing Interests: The authors have declared that no competing interests exist.
* E-mail: [email protected]
Introduction
Over the last few decades the global spread of parasite resistance to
key antimalarial drugs such as chloroquine and pyrimethamine has been
a challenge for malaria control programs based primarily on prompt and
effective treatment [1–3]. The introduction of highly efficacious
artemisinin-based combination treatments (ACT) as first-line treatment
in most malaria endemic countries has contributed to recent notable
reversals of trends in childhood morbidity and mortality [4,5]. Because of
the prominent value of ACTs in current malaria control programs, the
emergence of parasite resistance to artemisinins and the associated
compromised efficacy of ACTs would pose a major public health
problem. The recently reported emergence of artemisinin-resistant
malaria characterized by slow initial parasite clearance and high rates of
recrudescent infections in Western Cambodia and, possibly, other
countries South East Asia is therefore of great concern [6–9].
Using data from a randomized controlled clinical trial, we
performed a post-hoc analysis of the in vivo response to two ACT
PLoS ONE | www.plosone.org 1 November 2011 | Volume 6 | Issue 11 | e26005
regimens, namely dihydroartemisinin-piperaquine (DHA-PPQ)
and artemether-lumefantrine (AM-LM) over time. The study
was conducted from 2005 to 2008, coinciding with the
introduction of artemether-lumefantrine (CoartemTM) as the
exclusive first-line treatment for all presumptive cases of
uncomplicated P. falciparum malaria in Kilifi District, Coast
Province, Kenya in 2006.
Methods
Study siteThe study was conducted at the Pingilikani study site [10,11].
Malaria transmission in the area is perennial but with peaks trailing
typically two annual rainy seasons [12]. The parasite positivity rate in
outpatients has declined precipitously from 2003 to 2005 (own
unpublished data and [12]). The study was approved by the National
KEMRI Ethical Review Committee, Kenya; the Oxford Tropical
Research Ethics Committee, UK; and the Ethics Committee,
Heidelberg University School of Medicine, Germany. The protocol
for this trial and supporting CONSORT checklist are available as
supporting information; see Checklist S1 and Protocol S1.
Study design and sample sizeThis is a detailed analysis of treatment response rates according
to year of enrollment in a non-inferiority randomized controlled
trial that evaluated the efficacy of DHA-PPQ vs. AM-LM in the
treatment of children with uncomplicated P. falciparum malaria in
Kilifi, Kenya (Controlled Trials Registry number,
ISRCTN88705995). The primary efficacy endpoint was the 28-
day cure rate adjusted for reinfection (defined as clearance of
asexual parasites by day 7 and absence of PCR-confirmed
recrudescence of primary infection). Assuming a cure rate of
95% with AM-LM and a 5% drop-out rate, we calculated that 250
patients per arm would provide 80% power to test a 5% non-
inferiority margin with a 97.5% one-sided confidence interval.
Enrollment of patientsWe enrolled pediatric outpatients aged 6–59 months with
uncomplicated P. falciparum malaria who met the following
selection criteria: reported or documented fever $37.5uC, P.
falciparum mono-infection, microscopically determined peripheral
asexual parasite density of 2,000–200,000/mL, body weight .5 kg
and signed informed consent by parent or legal guardian. We
excluded patients with known allergies, severe malaria or danger
signs [13], participation in an investigational drug study within
previous 30 days, ECG abnormalities requiring urgent manage-
ment, other relevant clinical conditions or severe acute malnutri-
tion. A randomization list was generated by an independent off site
contract research organization (CRO). Sealed envelopes contain-
ing treatment allocation were used to randomize eligible patients
to treatment with DHA-PPQ or AM-LM. The randomization
ratio was 2:1 (DHA-PPQ:AM-LM) for patients enrolled in 2005–
2006 and reversed to 1:2 in 2007–2008 to accommodate a
multicenter trial analysis [14] that required 2:1 randomization for
patients enrolled in 2005–2006 while achieving an overall
balanced 1:1 randomization.
Study drug and administrationStudy drugs were administered orally with food or drinks under
direct supervision. For children ,2 years old tablets were crushed,
mixed with 50 ml water, and administered as slurry. DHA-PPQ
was given 24-hourly for 3 days at single target doses of 2.25 mg of
DHA/kg body weight and 18 mg of PPQ/kg (formulated as
pediatric or adult strength fixed dose combinations of 20/160 mg
and 40/320 mg, respectively; EurartesimTM, SigmaTau, Italy).
Doses were rounded up to the nearest half tablet. AM-LM was
administered as whole tablets according to the manufacturer’s
instructions in 6 doses over 3 days (0, 8, 24, 36, 48, and 60 hours) at
mean target doses of 2 mg of AM/kg and 12 mg of LM/kg
(CoartemTM, Novartis, Switzerland). Participants who vomited or
rejected the study drug within 30 min received a second full dose,
and those who vomited or rejected the study drug after 30 min but
within 1 h received a second half dose. Vomiting or rejecting the
second dose led to withdrawal from the study and administration of
rescue medication. Stability tests that were performed by the drug
manufacturers upon request confirmed that titer and degradation
products of study drugs were still within stringent regulatory
specifications in 2009, .10 months after completion of the study.
Study flow and clinical proceduresDuring the 3-day treatment phase, patients were admitted to the
KEMRI research ward in Pingilikani to ensure strict adhesion to
dosing intervals. Patients were seen by study clinicians on days 0,
1, 2 and 3 and then for weekly follow-up visits until day 63 and
finally on day 84 for collecting medical history, vital signs, malaria
blood smears, and adverse events. Giemsa-stained malaria slides
were read blinded by the same microscopist throughout the study
according to KEMRI standard operating procedures.
GenotypingTo distinguish recrudescent from new infections and to determine
the multiplicity of infection (MOI) index, matched pairs of parasite
isolates obtained at baseline and recurrence were compared using
RFLP-based genotyping analysis of repeat length polymorphisms in
the MSP2 gene (PFB0300c) [15]. Results were verified by genotyping
additional loci (MSP1 and GLURP) or semi-automated capillary
electrophoresis-based analysis of fluorescence-labeled MSP2 PCR
products [16]. Recrudescence was defined as persistence of at least
one baseline clone. Genomic copy number variants at the MDR1 locus
(PFE1150w) were determined by quantitative real-time PCR using the
b-tubulin gene (PF10_0084) as internal control and 3D7 (1 copy) and
Dd2 (2 copies) reference strains for calibration [17].
Pharmacokinetic measurementsSerum samples collected on day 7 were analyzed for LM by
solid-phase extraction and liquid chromatography (LC) with UV
detection as described previously [18], PPQ and its stable isotope
labeled internal standard were analyzed using high throughput
LC-MS/MS on an ABI 5000 triple quadrupole mass spectrometer
(Applied Biosystems/MDS SCIEX, Foster City, USA), with a
TurboV ionization source interface operated in the positive ion
mode [19]. The lower limit of quantification (LLOQ) for PPQ and
LM were set to 1.5 ng/ml and 50 ng/ml, respectively.
Parasite adaptation and chemosensitivity testingParasite isolates were adapted to in vitro culture according to
standard protocols [10]. We determined the concentrations of
DHA, PPQ and LM required to inhibit the in vitro growth of
parasite isolates by 50% (IC50) compared to unexposed controls
using regression analysis of the dose-response curves from
duplicate 3H-hypoxanthine uptake 72-hour exposure experiments
[10]. Two reference strains (V1S, a multidrug-resistant strain, and
3D7, a drug-sensitive strain) were used as controls.
Anti-parasitic antibody responsesWe used an established ELISA protocol to measure concentra-
tions of antibodies against parasite schizont extract (A4 strain)
Declining Responsiveness to Artemisinin in Kenya
PLoS ONE | www.plosone.org 2 November 2011 | Volume 6 | Issue 11 | e26005
[20]. Hyper-immune sera from Kenyan donors and sera from
unexposed European individuals were run in duplicate on each
plate as positive and negative controls, respectively.
Statistical analysisAs a measure of drug efficacy, we computed the day 1 parasite
reduction ratio (PRRD1) as the log10 quotient of baseline and day 1
parasitemias (after setting parasitemias below the microscopic
detection threshold on day 1 to 10/mL). We also analyzed the
probability that parasites were detected by microscopy or not on
day 1 by binomial logistic regression for the influences of period of
enrolment (2005–2006 vs. 2007–2008), log10 baseline parasitemia,
treatment (AM-LM vs. DHA-PPQ), dose per body weight, patient
age, number of previous malaria episodes and anti-schizont
antibody levels fitting each of these separately in univariable
analyses and then combined in one multivariable analysis if they
remained significant at the P#0.2 level. Similarly, we analyzed
percentage reductions of parasite densities from baseline calculat-
ed by dividing baseline densities with densities at day 1 or 2
multiplied by 100. Parasite and fever clearance times were
estimated by parametric survival analysis of the time from baseline
to the first of two consecutive negative blood smears or
temperature measurements ,37.5uC, respectively. Risk of recru-
descent primary or secondary (re-) infections was assessed by the
Kaplan-Meier (KM) method for survival data. For these analyses,
patients who did not meet a study endpoint (either absence or
recurrence of parasitemia from day 7 to day 84) were censored at
the last visit before dropout (Fig. 1). Cox proportional hazards
model was used to estimate hazards ratios (HR). Data on previous
malaria episodes were obtained by matching subjects to a passive
outpatient surveillance system operated at Pingilikani since 2003.
Other traits were analyzed by either t-test or linear regression
assuming normal distributions, by Kruskal-Wallis equality-of-
populations rank test assuming non-parametric distribution or, if
proportion or count data, by Fisher’s exact test and Poisson logistic
regression, respectively. All analyses were performed with Stata
11.0 (StataCorp, College Station, TX).
Results
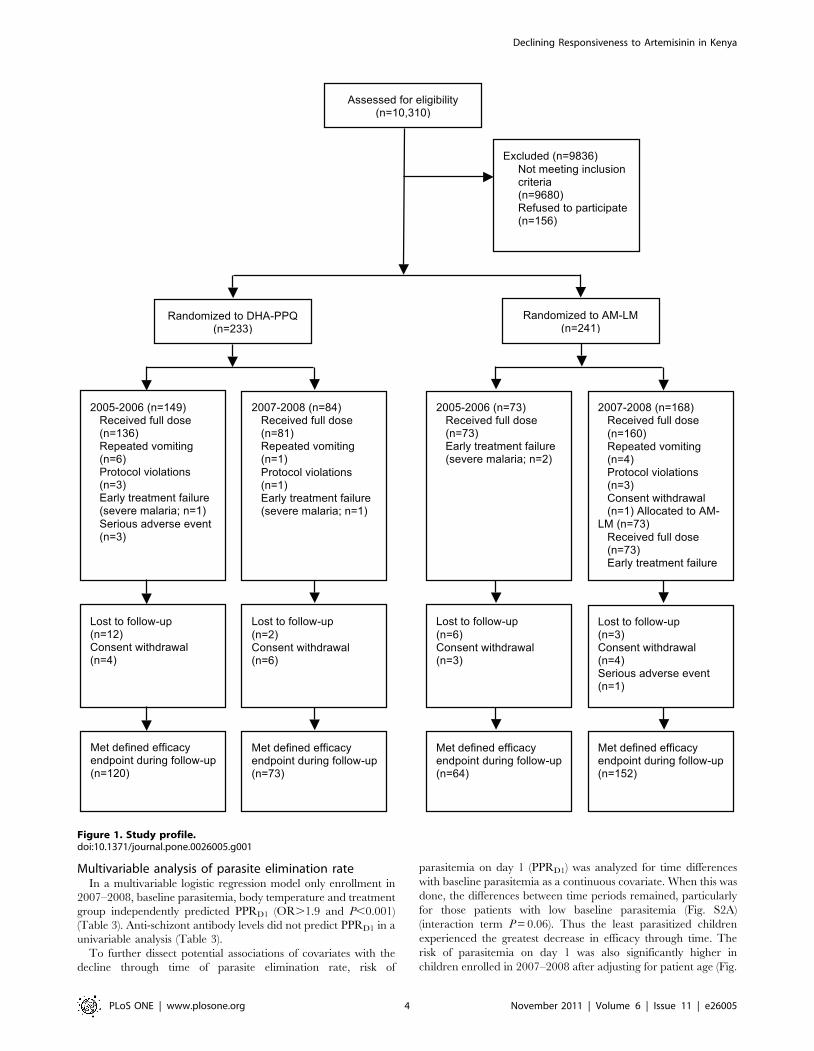
Study cohortBetween September 2005 and April 2008 we enrolled 474
patients. Enrollment was temporarily suspended between July
2006 and March 2007. 450 patients received a full treatment
course (Fig. 1). Repeated vomiting occurred in 7/233 (3%) and 4/
241 (2%) patients in the DHA-PPQ and AM-LM groups,
respectively (P.0.3) (Fig. 1). Early treatment failure due to severe
malaria occurred in 3 patients receiving DHA-PPQ and 1 patient
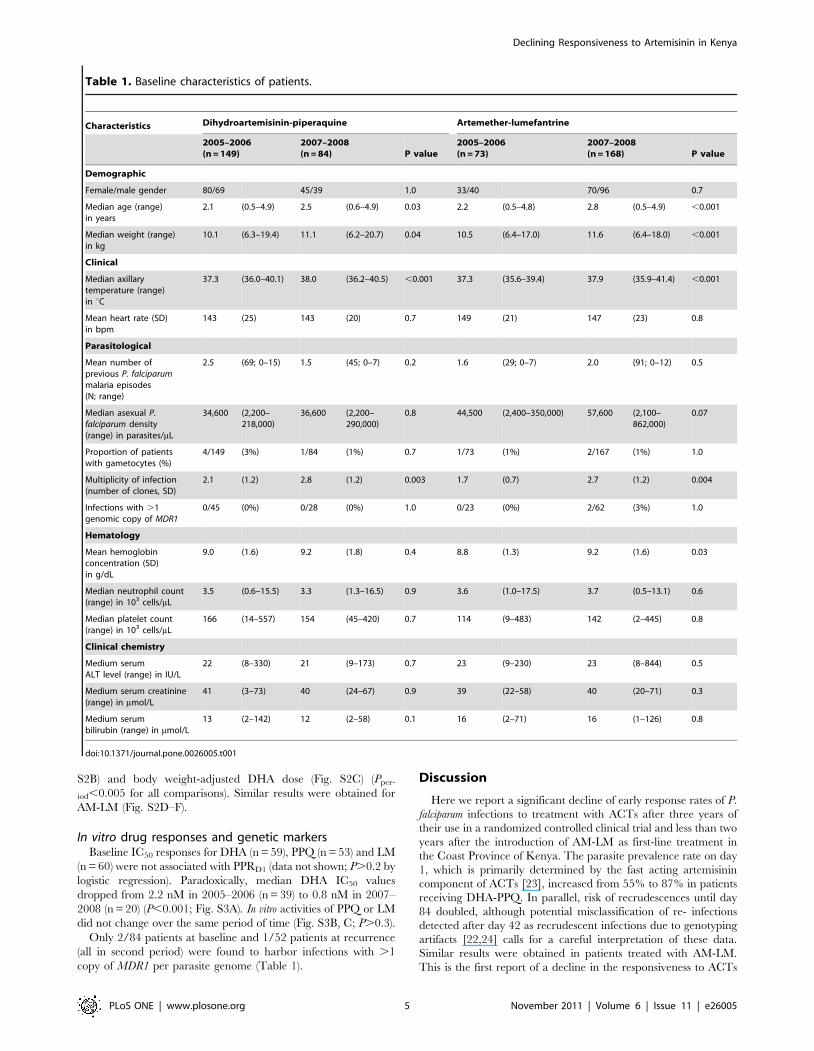
receiving AM-LM group (Fig. 1). Table 1 details baseline
characteristics of patients by treatment group and period of
enrollment. In a pooled analysis of both treatment groups, patients
enrolled in 2007–2008 were between 5 to 7 months older
(P,0.05), weighed about 1 kg more (P,0.05), had higher
parasitemias (P = 0.03) and axillary temperatures (P,0.001),
increased number of parasite clones as determined by MSP2
allele typing (P,0.01) and higher hemoglobin concentration
(P = 0.03 in AM-LM group only). Other characteristics, notably
platelet concentrations [21], were similar between enrollment
periods.
Parasitological and clinical treatment responsesTreatment with DHA-PPQ cleared parasites faster than AM-
LM (means of 41 hours vs. 48 hours, respectively; P,0.001)
resulting also in prompter clearance of fever (means of 27 hours vs.
30 hours respectively; P,0.001). By day 28, Kaplan-Meier (KM)-
estimated PCR-adjusted rates of recrudescent primary infections
were 1% (95% CI, 0–4) and 1% (95% CI, 0–4) in the DHA-PPQ
and AM-LM groups, respectively (HR = 0.9; 95% CI, 0.2–4.7). By
day 84 we noted considerably higher PCR-adjusted recrudescence
rates with both DHA-PPQ (10%; 95% CI, 6–15) and AM-LM
(13%; 95% CI, 8–18) (HR, 1.3; 95% CI, 0.7–2.4). By day 84
reinfections occurred in 39% (KM 95% CI, 33–47) and 42% (KM
95% CI, 35–49) of children treated with DHA-PPQ and AM-LM
groups, respectively (P = 0.7), with no difference in median time to
reinfection (Table 2).
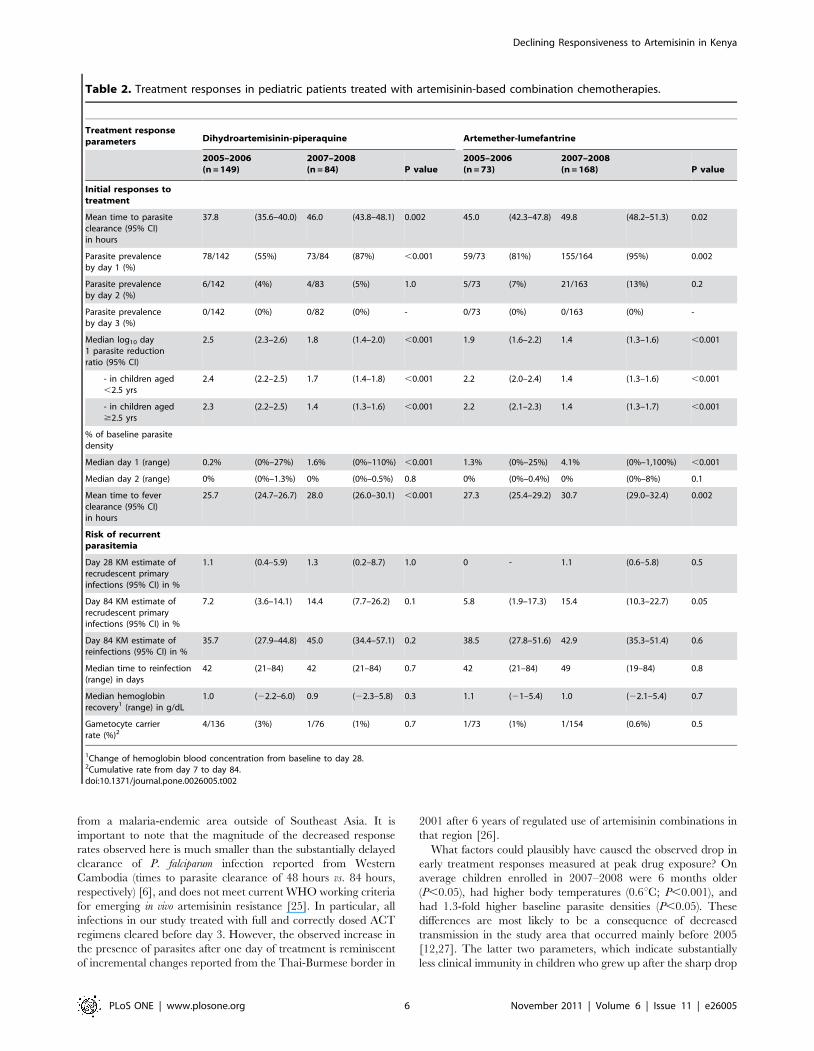
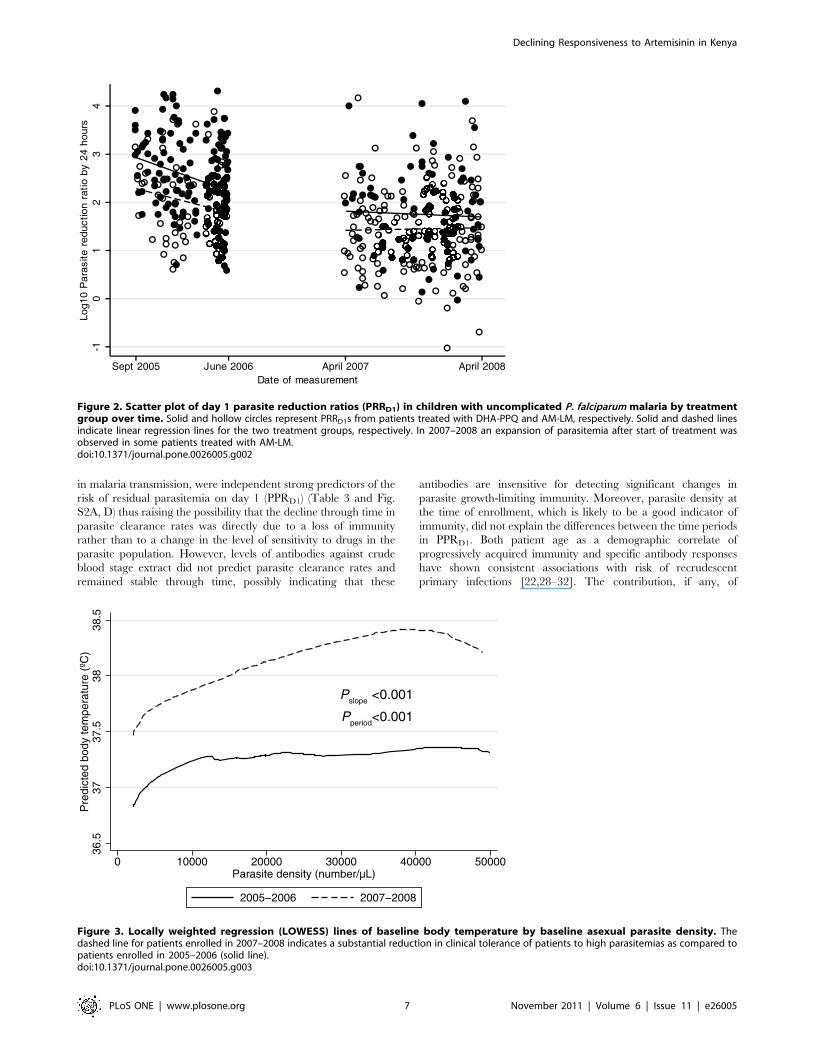
When comparing treatment responses in patients enrolled in
2005–2006 vs. 2007–2008 in a post-hoc analysis we observed a
striking increase in the proportion of children with detectable
parasitemia one day after initiation of treatment (day 1 parasite
prevalence rate, PPRD1; Table 2). This proportion rose from 55%
to 87% (odds ratio, 5.4, 95% CI, 2.7–11.1; P,0.001) in the DHA-
PPQ group and from 81% to 95% (OR, 4.1, 95% CI, 1.7–9.9;
P = 0.002) in the AM-LM group. Median day 1 parasite reduction
ratio in the DHA-PPQ group dropped by 78% (4.6-fold lower)
and in the AM-LM group by 69% (3.2-fold lower) between the
2005–2006 and 2007–2008 enrollment periods (P,0.001 by
logistic regression) and the same effect was observed within age
groups (Fig. 2 and Table 2). These changes in initial parasite
responses were accompanied by significantly prolonged mean
times to fever clearance (Table 2; P,0.002) and a more than two
fold risk of apparent recrudescent primary infections by day 84
(Table 2; P = 0.01 when pooling data across treatment groups).
Reinfection rates by day 84, which could have confounded PCR-
based classification of recrudescent primary infections [22], were
high but did not change over time (P.0.2; Table 2). Gametocyte
carrier rates during follow-up were low and independent of study
period (Table 2). Of note, median times to reinfection, a sensitive
measure for the post-treatment suppressive efficacy of the long-half
life companion drugs PPQ and LM remained stable throughout
the study (Table 2).
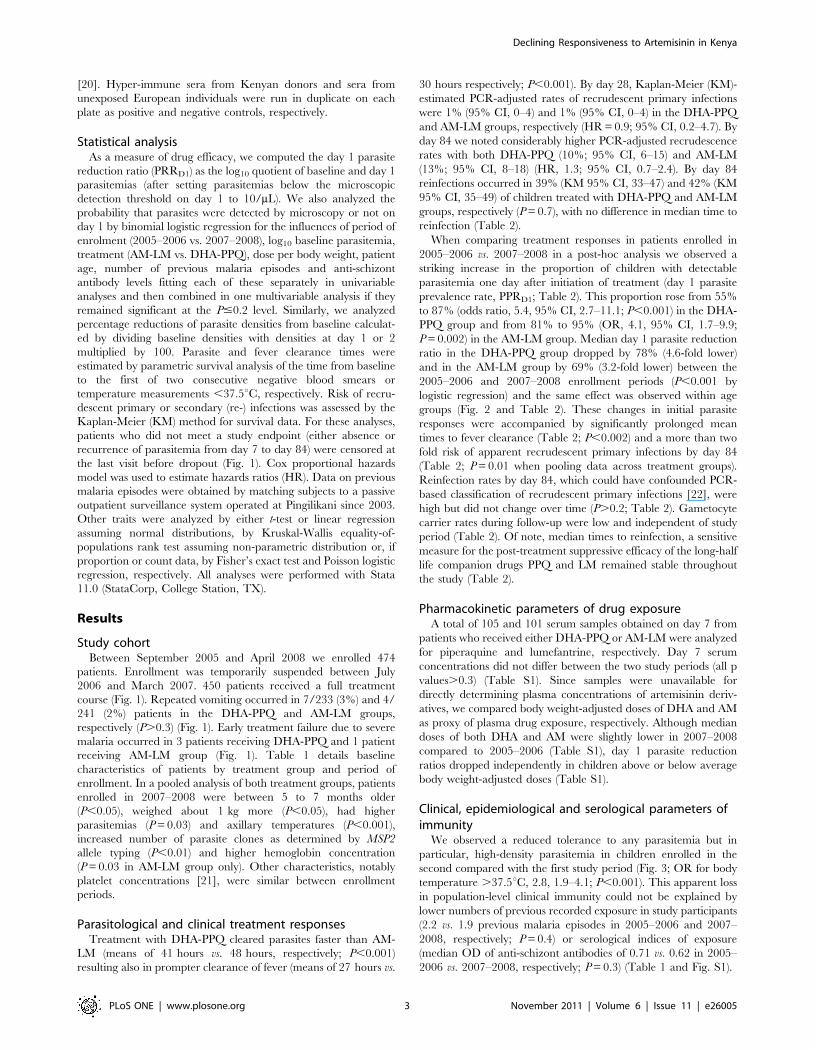
Pharmacokinetic parameters of drug exposureA total of 105 and 101 serum samples obtained on day 7 from
patients who received either DHA-PPQ or AM-LM were analyzed
for piperaquine and lumefantrine, respectively. Day 7 serum
concentrations did not differ between the two study periods (all p
values.0.3) (Table S1). Since samples were unavailable for
directly determining plasma concentrations of artemisinin deriv-
atives, we compared body weight-adjusted doses of DHA and AM
as proxy of plasma drug exposure, respectively. Although median
doses of both DHA and AM were slightly lower in 2007–2008
compared to 2005–2006 (Table S1), day 1 parasite reduction
ratios dropped independently in children above or below average
body weight-adjusted doses (Table S1).
Clinical, epidemiological and serological parameters ofimmunity
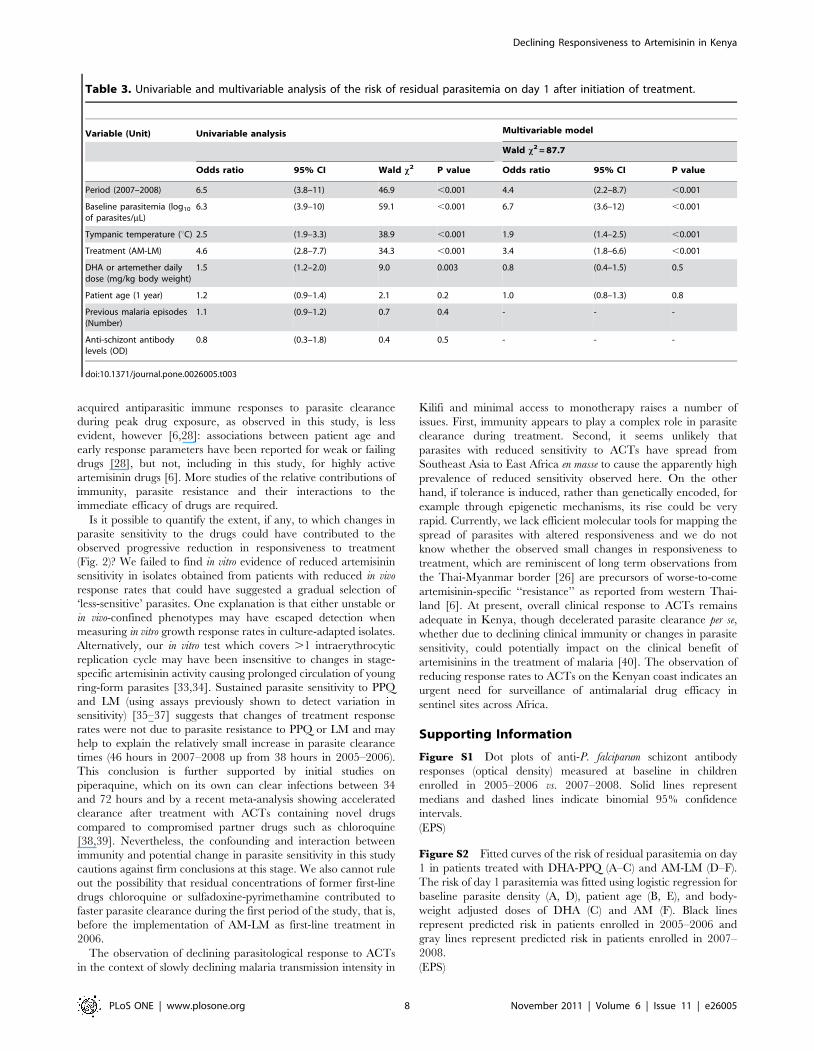
We observed a reduced tolerance to any parasitemia but in
particular, high-density parasitemia in children enrolled in the
second compared with the first study period (Fig. 3; OR for body
temperature .37.5uC, 2.8, 1.9–4.1; P,0.001). This apparent loss
in population-level clinical immunity could not be explained by
lower numbers of previous recorded exposure in study participants
(2.2 vs. 1.9 previous malaria episodes in 2005–2006 and 2007–
2008, respectively; P = 0.4) or serological indices of exposure
(median OD of anti-schizont antibodies of 0.71 vs. 0.62 in 2005–
2006 vs. 2007–2008, respectively; P = 0.3) (Table 1 and Fig. S1).
Declining Responsiveness to Artemisinin in Kenya
PLoS ONE | www.plosone.org 3 November 2011 | Volume 6 | Issue 11 | e26005
Multivariable analysis of parasite elimination rateIn a multivariable logistic regression model only enrollment in
2007–2008, baseline parasitemia, body temperature and treatment
group independently predicted PPRD1 (OR.1.9 and P,0.001)
(Table 3). Anti-schizont antibody levels did not predict PPRD1 in a
univariable analysis (Table 3).
To further dissect potential associations of covariates with the
decline through time of parasite elimination rate, risk of
parasitemia on day 1 (PPRD1) was analyzed for time differences
with baseline parasitemia as a continuous covariate. When this was
done, the differences between time periods remained, particularly
for those patients with low baseline parasitemia (Fig. S2A)
(interaction term P = 0.06). Thus the least parasitized children
experienced the greatest decrease in efficacy through time. The
risk of parasitemia on day 1 was also significantly higher in
children enrolled in 2007–2008 after adjusting for patient age (Fig.
Figure 1. Study profile.doi:10.1371/journal.pone.0026005.g001
Declining Responsiveness to Artemisinin in Kenya
PLoS ONE | www.plosone.org 4 November 2011 | Volume 6 | Issue 11 | e26005
S2B) and body weight-adjusted DHA dose (Fig. S2C) (Pper-
iod,0.005 for all comparisons). Similar results were obtained for
AM-LM (Fig. S2D–F).
In vitro drug responses and genetic markersBaseline IC50 responses for DHA (n = 59), PPQ (n = 53) and LM
(n = 60) were not associated with PPRD1 (data not shown; P.0.2 by
logistic regression). Paradoxically, median DHA IC50 values
dropped from 2.2 nM in 2005–2006 (n = 39) to 0.8 nM in 2007–
2008 (n = 20) (P,0.001; Fig. S3A). In vitro activities of PPQ or LM
did not change over the same period of time (Fig. S3B, C; P.0.3).
Only 2/84 patients at baseline and 1/52 patients at recurrence
(all in second period) were found to harbor infections with .1
copy of MDR1 per parasite genome (Table 1).
Discussion
Here we report a significant decline of early response rates of P.
falciparum infections to treatment with ACTs after three years of
their use in a randomized controlled clinical trial and less than two
years after the introduction of AM-LM as first-line treatment in
the Coast Province of Kenya. The parasite prevalence rate on day
1, which is primarily determined by the fast acting artemisinin
component of ACTs [23], increased from 55% to 87% in patients
receiving DHA-PPQ. In parallel, risk of recrudescences until day
84 doubled, although potential misclassification of re- infections
detected after day 42 as recrudescent infections due to genotyping
artifacts [22,24] calls for a careful interpretation of these data.
Similar results were obtained in patients treated with AM-LM.
This is the first report of a decline in the responsiveness to ACTs
Table 1. Baseline characteristics of patients.
Characteristics Dihydroartemisinin-piperaquine Artemether-lumefantrine
2005–2006(n = 149)
2007–2008(n = 84) P value
2005–2006(n = 73)
2007–2008(n = 168) P value
Demographic
Female/male gender 80/69 45/39 1.0 33/40 70/96 0.7
Median age (range)in years
2.1 (0.5–4.9) 2.5 (0.6–4.9) 0.03 2.2 (0.5–4.8) 2.8 (0.5–4.9) ,0.001
Median weight (range)in kg
10.1 (6.3–19.4) 11.1 (6.2–20.7) 0.04 10.5 (6.4–17.0) 11.6 (6.4–18.0) ,0.001
Clinical
Median axillarytemperature (range)in uC
37.3 (36.0–40.1) 38.0 (36.2–40.5) ,0.001 37.3 (35.6–39.4) 37.9 (35.9–41.4) ,0.001
Mean heart rate (SD)in bpm
143 (25) 143 (20) 0.7 149 (21) 147 (23) 0.8
Parasitological
Mean number ofprevious P. falciparummalaria episodes(N; range)
2.5 (69; 0–15) 1.5 (45; 0–7) 0.2 1.6 (29; 0–7) 2.0 (91; 0–12) 0.5
Median asexual P.falciparum density(range) in parasites/mL
34,600 (2,200–218,000)
36,600 (2,200–290,000)
0.8 44,500 (2,400–350,000) 57,600 (2,100–862,000)
0.07
Proportion of patientswith gametocytes (%)
4/149 (3%) 1/84 (1%) 0.7 1/73 (1%) 2/167 (1%) 1.0
Multiplicity of infection(number of clones, SD)
2.1 (1.2) 2.8 (1.2) 0.003 1.7 (0.7) 2.7 (1.2) 0.004
Infections with .1genomic copy of MDR1
0/45 (0%) 0/28 (0%) 1.0 0/23 (0%) 2/62 (3%) 1.0
Hematology
Mean hemoglobinconcentration (SD)in g/dL
9.0 (1.6) 9.2 (1.8) 0.4 8.8 (1.3) 9.2 (1.6) 0.03
Median neutrophil count(range) in 103 cells/mL
3.5 (0.6–15.5) 3.3 (1.3–16.5) 0.9 3.6 (1.0–17.5) 3.7 (0.5–13.1) 0.6
Median platelet count(range) in 103 cells/mL
166 (14–557) 154 (45–420) 0.7 114 (9–483) 142 (2–445) 0.8
Clinical chemistry
Medium serumALT level (range) in IU/L
22 (8–330) 21 (9–173) 0.7 23 (9–230) 23 (8–844) 0.5
Medium serum creatinine(range) in mmol/L
41 (3–73) 40 (24–67) 0.9 39 (22–58) 40 (20–71) 0.3
Medium serumbilirubin (range) in mmol/L
13 (2–142) 12 (2–58) 0.1 16 (2–71) 16 (1–126) 0.8
doi:10.1371/journal.pone.0026005.t001
Declining Responsiveness to Artemisinin in Kenya
PLoS ONE | www.plosone.org 5 November 2011 | Volume 6 | Issue 11 | e26005
from a malaria-endemic area outside of Southeast Asia. It is
important to note that the magnitude of the decreased response
rates observed here is much smaller than the substantially delayed
clearance of P. falciparum infection reported from Western
Cambodia (times to parasite clearance of 48 hours vs. 84 hours,
respectively) [6], and does not meet current WHO working criteria
for emerging in vivo artemisinin resistance [25]. In particular, all
infections in our study treated with full and correctly dosed ACT
regimens cleared before day 3. However, the observed increase in
the presence of parasites after one day of treatment is reminiscent
of incremental changes reported from the Thai-Burmese border in
2001 after 6 years of regulated use of artemisinin combinations in
that region [26].
What factors could plausibly have caused the observed drop in
early treatment responses measured at peak drug exposure? On
average children enrolled in 2007–2008 were 6 months older
(P,0.05), had higher body temperatures (0.6uC; P,0.001), and
had 1.3-fold higher baseline parasite densities (P,0.05). These
differences are most likely to be a consequence of decreased
transmission in the study area that occurred mainly before 2005
[12,27]. The latter two parameters, which indicate substantially
less clinical immunity in children who grew up after the sharp drop
Table 2. Treatment responses in pediatric patients treated with artemisinin-based combination chemotherapies.
Treatment responseparameters Dihydroartemisinin-piperaquine Artemether-lumefantrine
2005–2006(n = 149)
2007–2008(n = 84) P value
2005–2006(n = 73)
2007–2008(n = 168) P value
Initial responses totreatment
Mean time to parasiteclearance (95% CI)in hours
37.8 (35.6–40.0) 46.0 (43.8–48.1) 0.002 45.0 (42.3–47.8) 49.8 (48.2–51.3) 0.02
Parasite prevalenceby day 1 (%)
78/142 (55%) 73/84 (87%) ,0.001 59/73 (81%) 155/164 (95%) 0.002
Parasite prevalenceby day 2 (%)
6/142 (4%) 4/83 (5%) 1.0 5/73 (7%) 21/163 (13%) 0.2
Parasite prevalenceby day 3 (%)
0/142 (0%) 0/82 (0%) - 0/73 (0%) 0/163 (0%) -
Median log10 day1 parasite reductionratio (95% CI)
2.5 (2.3–2.6) 1.8 (1.4–2.0) ,0.001 1.9 (1.6–2.2) 1.4 (1.3–1.6) ,0.001
- in children aged,2.5 yrs
2.4 (2.2–2.5) 1.7 (1.4–1.8) ,0.001 2.2 (2.0–2.4) 1.4 (1.3–1.6) ,0.001
- in children aged$2.5 yrs
2.3 (2.2–2.5) 1.4 (1.3–1.6) ,0.001 2.2 (2.1–2.3) 1.4 (1.3–1.7) ,0.001
% of baseline parasitedensity
Median day 1 (range) 0.2% (0%–27%) 1.6% (0%–110%) ,0.001 1.3% (0%–25%) 4.1% (0%–1,100%) ,0.001
Median day 2 (range) 0% (0%–1.3%) 0% (0%–0.5%) 0.8 0% (0%–0.4%) 0% (0%–8%) 0.1
Mean time to feverclearance (95% CI)in hours
25.7 (24.7–26.7) 28.0 (26.0–30.1) ,0.001 27.3 (25.4–29.2) 30.7 (29.0–32.4) 0.002
Risk of recurrentparasitemia
Day 28 KM estimate ofrecrudescent primaryinfections (95% CI) in %
1.1 (0.4–5.9) 1.3 (0.2–8.7) 1.0 0 - 1.1 (0.6–5.8) 0.5
Day 84 KM estimate ofrecrudescent primaryinfections (95% CI) in %
7.2 (3.6–14.1) 14.4 (7.7–26.2) 0.1 5.8 (1.9–17.3) 15.4 (10.3–22.7) 0.05
Day 84 KM estimate ofreinfections (95% CI) in %
35.7 (27.9–44.8) 45.0 (34.4–57.1) 0.2 38.5 (27.8–51.6) 42.9 (35.3–51.4) 0.6
Median time to reinfection(range) in days
42 (21–84) 42 (21–84) 0.7 42 (21–84) 49 (19–84) 0.8
Median hemoglobinrecovery1 (range) in g/dL
1.0 (22.2–6.0) 0.9 (22.3–5.8) 0.3 1.1 (21–5.4) 1.0 (22.1–5.4) 0.7
Gametocyte carrierrate (%)2
4/136 (3%) 1/76 (1%) 0.7 1/73 (1%) 1/154 (0.6%) 0.5
1Change of hemoglobin blood concentration from baseline to day 28.2Cumulative rate from day 7 to day 84.doi:10.1371/journal.pone.0026005.t002
Declining Responsiveness to Artemisinin in Kenya
PLoS ONE | www.plosone.org 6 November 2011 | Volume 6 | Issue 11 | e26005
in malaria transmission, were independent strong predictors of the
risk of residual parasitemia on day 1 (PPRD1) (Table 3 and Fig.
S2A, D) thus raising the possibility that the decline through time in
parasite clearance rates was directly due to a loss of immunity
rather than to a change in the level of sensitivity to drugs in the
parasite population. However, levels of antibodies against crude
blood stage extract did not predict parasite clearance rates and
remained stable through time, possibly indicating that these
antibodies are insensitive for detecting significant changes in
parasite growth-limiting immunity. Moreover, parasite density at
the time of enrollment, which is likely to be a good indicator of
immunity, did not explain the differences between the time periods
in PPRD1. Both patient age as a demographic correlate of
progressively acquired immunity and specific antibody responses
have shown consistent associations with risk of recrudescent
primary infections [22,28–32]. The contribution, if any, of
Figure 2. Scatter plot of day 1 parasite reduction ratios (PRRD1) in children with uncomplicated P. falciparum malaria by treatmentgroup over time. Solid and hollow circles represent PRRD1s from patients treated with DHA-PPQ and AM-LM, respectively. Solid and dashed linesindicate linear regression lines for the two treatment groups, respectively. In 2007–2008 an expansion of parasitemia after start of treatment wasobserved in some patients treated with AM-LM.doi:10.1371/journal.pone.0026005.g002
Figure 3. Locally weighted regression (LOWESS) lines of baseline body temperature by baseline asexual parasite density. Thedashed line for patients enrolled in 2007–2008 indicates a substantial reduction in clinical tolerance of patients to high parasitemias as compared topatients enrolled in 2005–2006 (solid line).doi:10.1371/journal.pone.0026005.g003
Declining Responsiveness to Artemisinin in Kenya
PLoS ONE | www.plosone.org 7 November 2011 | Volume 6 | Issue 11 | e26005
acquired antiparasitic immune responses to parasite clearance
during peak drug exposure, as observed in this study, is less
evident, however [6,28]: associations between patient age and
early response parameters have been reported for weak or failing
drugs [28], but not, including in this study, for highly active
artemisinin drugs [6]. More studies of the relative contributions of
immunity, parasite resistance and their interactions to the
immediate efficacy of drugs are required.
Is it possible to quantify the extent, if any, to which changes in
parasite sensitivity to the drugs could have contributed to the
observed progressive reduction in responsiveness to treatment
(Fig. 2)? We failed to find in vitro evidence of reduced artemisinin
sensitivity in isolates obtained from patients with reduced in vivo
response rates that could have suggested a gradual selection of
‘less-sensitive’ parasites. One explanation is that either unstable or
in vivo-confined phenotypes may have escaped detection when
measuring in vitro growth response rates in culture-adapted isolates.
Alternatively, our in vitro test which covers .1 intraerythrocytic
replication cycle may have been insensitive to changes in stage-
specific artemisinin activity causing prolonged circulation of young
ring-form parasites [33,34]. Sustained parasite sensitivity to PPQ
and LM (using assays previously shown to detect variation in
sensitivity) [35–37] suggests that changes of treatment response
rates were not due to parasite resistance to PPQ or LM and may
help to explain the relatively small increase in parasite clearance
times (46 hours in 2007–2008 up from 38 hours in 2005–2006).
This conclusion is further supported by initial studies on
piperaquine, which on its own can clear infections between 34
and 72 hours and by a recent meta-analysis showing accelerated
clearance after treatment with ACTs containing novel drugs
compared to compromised partner drugs such as chloroquine
[38,39]. Nevertheless, the confounding and interaction between
immunity and potential change in parasite sensitivity in this study
cautions against firm conclusions at this stage. We also cannot rule
out the possibility that residual concentrations of former first-line
drugs chloroquine or sulfadoxine-pyrimethamine contributed to
faster parasite clearance during the first period of the study, that is,
before the implementation of AM-LM as first-line treatment in
2006.
The observation of declining parasitological response to ACTs
in the context of slowly declining malaria transmission intensity in
Kilifi and minimal access to monotherapy raises a number of
issues. First, immunity appears to play a complex role in parasite
clearance during treatment. Second, it seems unlikely that
parasites with reduced sensitivity to ACTs have spread from
Southeast Asia to East Africa en masse to cause the apparently high
prevalence of reduced sensitivity observed here. On the other
hand, if tolerance is induced, rather than genetically encoded, for
example through epigenetic mechanisms, its rise could be very
rapid. Currently, we lack efficient molecular tools for mapping the
spread of parasites with altered responsiveness and we do not
know whether the observed small changes in responsiveness to
treatment, which are reminiscent of long term observations from
the Thai-Myanmar border [26] are precursors of worse-to-come
artemisinin-specific ‘‘resistance’’ as reported from western Thai-
land [6]. At present, overall clinical response to ACTs remains
adequate in Kenya, though decelerated parasite clearance per se,
whether due to declining clinical immunity or changes in parasite
sensitivity, could potentially impact on the clinical benefit of
artemisinins in the treatment of malaria [40]. The observation of
reducing response rates to ACTs on the Kenyan coast indicates an
urgent need for surveillance of antimalarial drug efficacy in
sentinel sites across Africa.
Supporting Information
Figure S1 Dot plots of anti-P. falciparum schizont antibody
responses (optical density) measured at baseline in children
enrolled in 2005–2006 vs. 2007–2008. Solid lines represent
medians and dashed lines indicate binomial 95% confidence
intervals.
(EPS)
Figure S2 Fitted curves of the risk of residual parasitemia on day
1 in patients treated with DHA-PPQ (A–C) and AM-LM (D–F).
The risk of day 1 parasitemia was fitted using logistic regression for
baseline parasite density (A, D), patient age (B, E), and body-
weight adjusted doses of DHA (C) and AM (F). Black lines
represent predicted risk in patients enrolled in 2005–2006 and
gray lines represent predicted risk in patients enrolled in 2007–
2008.
(EPS)
Table 3. Univariable and multivariable analysis of the risk of residual parasitemia on day 1 after initiation of treatment.
Variable (Unit) Univariable analysis Multivariable model
Wald x2 = 87.7
Odds ratio 95% CI Wald x2 P value Odds ratio 95% CI P value
Period (2007–2008) 6.5 (3.8–11) 46.9 ,0.001 4.4 (2.2–8.7) ,0.001
Baseline parasitemia (log10
of parasites/mL)6.3 (3.9–10) 59.1 ,0.001 6.7 (3.6–12) ,0.001
Tympanic temperature (uC) 2.5 (1.9–3.3) 38.9 ,0.001 1.9 (1.4–2.5) ,0.001
Treatment (AM-LM) 4.6 (2.8–7.7) 34.3 ,0.001 3.4 (1.8–6.6) ,0.001
DHA or artemether dailydose (mg/kg body weight)
1.5 (1.2–2.0) 9.0 0.003 0.8 (0.4–1.5) 0.5
Patient age (1 year) 1.2 (0.9–1.4) 2.1 0.2 1.0 (0.8–1.3) 0.8
Previous malaria episodes(Number)
1.1 (0.9–1.2) 0.7 0.4 - - -
Anti-schizont antibodylevels (OD)
0.8 (0.3–1.8) 0.4 0.5 - - -
doi:10.1371/journal.pone.0026005.t003
Declining Responsiveness to Artemisinin in Kenya
PLoS ONE | www.plosone.org 8 November 2011 | Volume 6 | Issue 11 | e26005
Figure S3 Dot plots of half-maximal inhibitory concentrations
(IC50) of culture-adapted P. falciparum isolates collected from
patients in 2005–2006 and 2007–2008. IC50 responses were
determined for dihydroartemisinin (DHA) (Fig. S3A), piperaquine
(PPQ) (Fig. S3B) and lumefantrine (LM) (Fig. S3C).
(EPS)
Table S1 Relationship between pharmacokinetic and pharma-
codynamic parameters over time.
(DOC)
Protocol S1 Trial Protocol.
(DOC)
Checklist S1 CONSORT Checklist.
(DOC)
Acknowledgments
We are indebted to the participating children and their parents. We would
like to acknowledge the continued support by our colleagues at the Kenya
Medical Research Institute/Wellcome Trust Research Programme in Kilifi
for supporting this study, in particularly, the teams at the Clinical Trial
Facility (Jacinta Mutegi, Chemtai Kipkeu, Roma Chilengi and Trudie
Lang), the Pharmacology Laboratory (Simon Ndirangu), the Pharmacy
(Alex Muturi), the Clinical Trials Laboratory (Fixtan Njuga, Ken
Awuondo, Gabriel Mwambingu and James Njogu), the Immunology
Laboratory (Barnes Kitsao and Martin Mwakala) and the Social Science
Group (Dorcas Kamuya, Vicki Marsh and Sassy Molyneux). Special
thanks go to the passionate study nurses Ann Kithinji, Joy Lewa, and
Crispinah Kaulu. We thank Nimmo Gichero and Linda Murungi for
measurement of antibody responses. We would also like to thank Umberto
D’Alessandro and Chantal van Overmeir (Antwerp Institute of Tropical
Medicine) for sharing genotyping data and Ingrid Felger (Swiss Tropical
Institute) for critical help in establishing a capillary electrophoresis-based
genotyping protocol. In addition we wish to acknowledge the contributions
by Marco Corsi and Antonio Longo (SigmaTau) for provision of study
medication and drug quality testing; Marc Cousin, Gilbert Lefevre and
Nathan Mulure (Novartis) also for provision of study medication and
stability testing; Jo Hudson, Deirdre Marais and Ambrose Talisuna (MDS)
for monitoring and encouragement; David Ubben (MMV) for coordination
and Pascal Ringwald (WHO) for discussions.
Author Contributions
Conceived and designed the experiments: SB AN M. Mackinnon KM.
Performed the experiments: SB PS AA LM MB SM BT BL HF BS JP JP
WH AR M. Mosobo. Analyzed the data: SB PS EJ GF NL AN FO NP
KM M. Mackinnon. Wrote the paper: SB M. Mackinnon KM.
References
1. Trape JF, Pison G, Preziosi MP, Enel C, Desgrees du Lou A, et al. (1998) Impactof chloroquine resistance on malaria mortality. C R Acad Sci III 321: 689–697.
2. Baird JK (2005) Effectiveness of antimalarial drugs. N Engl J Med 352:
1565–1577.
3. Korenromp EL, Williams BG, Gouws E, Dye C, Snow RW (2003)
Measurement of trends in childhood malaria mortality in Africa: an assessmentof progress toward targets based on verbal autopsy. Lancet Infect Dis 3:
349–358.
4. Bhattarai A, Ali AS, Kachur SP, Martensson A, Abbas AK, et al. (2007) Impactof artemisinin-based combination therapy and insecticide-treated nets on
malaria burden in Zanzibar. PLoS Med 4: e309.
5. Barnes KI, Durrheim DN, Little F, Jackson A, Mehta U, et al. (2005) Effect ofArtemether-Lumefantrine Policy and Improved Vector Control on Malaria
Burden in KwaZulu-Natal, South Africa. PLoS Med 2: e330.
6. Dondorp AM, Nosten F, Yi P, Das D, Phyo AP, et al. (2009) Artemisininresistance in Plasmodium falciparum malaria. N Engl J Med 361: 455–467.
7. Noedl H, Se Y, Schaecher K, Smith BL, Socheat D, et al. (2008) Evidence of
artemisinin-resistant malaria in western Cambodia. N Engl J Med 359:2619–2620.
8. Noedl H, Socheat D, Satimai W (2009) Artemisinin-resistant malaria in Asia.
N Engl J Med 361: 540–541.
9. Dondorp AM, Yeung S, White L, Nguon C, Day NP, et al. (2010) Artemisininresistance: current status and scenarios for containment. Nat Rev Microbiol 8:
272–280.
10. Sasi P, Abdulrahaman A, Mwai L, Muriithi S, Straimer J, et al. (2009) In vivoand in vitro efficacy of amodiaquine against Plasmodium falciparum in an area
of continued use of 4-aminoquinolines in East Africa. J Infect Dis 199:1575–1582.
11. Olotu A, Fegan G, Williams TN, Sasi P, Ogada E, et al. (2010) Defining clinical
malaria: the specificity and incidence of endpoints from active and passivesurveillance of children in rural Kenya. PLoS ONE 5: e15569.
12. O’Meara WP, Bejon P, Mwangi TW, Okiro EA, Peshu N, et al. (2008) Effect of
a fall in malaria transmission on morbidity and mortality in Kilifi, Kenya. Lancet372: 1555–1562.
13. WHO (2008) Methods and techniques for clinical trials on antimalarial drug
efficacy. Geneva.
14. Bassat Q, Mulenga M, Tinto H, Piola P, Borrmann S, et al. (2009)
Dihydroartemisinin-piperaquine and artemether-lumefantrine for treating
uncomplicated malaria in African children: a randomised, non-inferiority trial.PLoS ONE 4: e7871.
15. Felger I, Beck HP (2002) Genotyping of Plasmodium falciparum. PCR-RFLP
analysis. Methods Mol Med 72: 117–129.
16. Falk N, Maire N, Sama W, Owusu-Agyei S, Smith T, et al. (2006) Comparison
of PCR-RFLP and Genescan-based genotyping for analyzing infection dynamics
of Plasmodium falciparum. Am J Trop Med Hyg 74: 944–950.
17. Price RN, Uhlemann AC, Brockman A, McGready R, Ashley E, et al. (2004)
Mefloquine resistance in Plasmodium falciparum and increased pfmdr1 gene
copy number. Lancet 364: 438–447.
18. Annerberg A, Singtoroj T, Tipmanee P, White NJ, Day NP, et al. (2005) High
throughput assay for the determination of lumefantrine in plasma.
J Chromatogr B Analyt Technol Biomed Life Sci 822: 330–333.
19. Lindegardh N, Annerberg A, White NJ, Day NP (2008) Development andvalidation of a liquid chromatographic-tandem mass spectrometric method for
determination of piperaquine in plasma stable isotope labeled internal standarddoes not always compensate for matrix effects. J Chromatogr B Analyt Technol
Biomed Life Sci 862: 227–236.
20. Osier FH, Fegan G, Polley SD, Murungi L, Verra F, et al. (2008) Breadth and
magnitude of antibody responses to multiple Plasmodium falciparum merozoiteantigens are associated with protection from clinical malaria. Infect Immun 76:
2240–2248.
21. McMorran BJ, Marshall VM, de Graaf C, Drysdale KE, Shabbar M, et al.
(2009) Platelets kill intraerythrocytic malarial parasites and mediate survival toinfection. Science 323: 797–800.
22. Borrmann S, Peto T, Snow RW, Gutteridge W, White NJ (2008) Revisiting thedesign of phase III clinical trials of antimalarial drugs for uncomplicated
Plasmodium falciparum malaria. Plos Med 5: e227.
23. White NJ (2004) Antimalarial drug resistance. J Clin Invest 113: 1084–1092.
24. Juliano JJ, Gadalla N, Sutherland CJ, Meshnick SR (2010) The perils of PCR:
can we accurately ‘correct’ antimalarial trials? Trends Parasitol 26: 119–124.
25. WHO (2010) World Malaria Report 2010. Geneva, .
26. Carrara VI, Zwang J, Ashley EA, Price RN, Stepniewska K, et al. (2009)
Changes in the treatment responses to artesunate-mefloquine on thenorthwestern border of Thailand during 13 years of continuous deployment.
PLoS ONE 4: e4551.
27. O’Meara WP, Mwangi TW, Williams TN, McKenzie FE, Snow RW, et al.
(2008) Relationship between exposure, clinical malaria, and age in an area ofchanging transmission intensity. Am J Trop Med Hyg 79: 185–191.
28. Borrmann S, Matsiegui PB, Missinou MA, Kremsner PG (2008) Effects of
Plasmodium falciparum parasite population size and patient age on early andlate parasitological outcomes of antimalarial treatment in children. Antimicrob
Agents Chemother 52: 1799–1805.
29. Djimde AA, Doumbo OK, Traore O, Guindo AB, Kayentao K, et al. (2003)
Clearance of drug-resistant parasites as a model for protective immunity inPlasmodium falciparum malaria. Am J Trop Med Hyg 69: 558–563.
30. Mawili-Mboumba DP, Borrmann S, Cavanagh DR, McBride JS, Matsiegui PB,et al. (2003) Antibody responses to Plasmodium falciparum merozoite surface
protein-1 and efficacy of amodiaquine in Gabonese children with P. falciparummalaria. J Infect Dis 187: 1137–1141.
31. Mayxay M, Chotivanich K, Pukrittayakamee S, Newton P, Looareesuwan S,et al. (2001) Contribution of humoral immunity to the therapeutic response in
falciparum malaria. Am J Trop Med Hyg 65: 918–923.
32. Cravo P, Culleton R, Hunt P, Walliker D, Mackinnon MJ (2001) Antimalarial
drugs clear resistant parasites from partially immune hosts. Antimicrob AgentsChemother 45: 2897–2901.
33. Anderson TJ, Nair S, Nkhoma S, Williams JT, Imwong M, et al. (2010) High
heritability of malaria parasite clearance rate indicates a genetic basis forartemisinin resistance in western Cambodia. J Infect Dis 201: 1326–1330.
34. Anderson TJ, Williams JT, Nair S, Sudimack D, Barends M, et al. (2010)Inferred relatedness and heritability in malaria parasites. Proc Biol Sci;(Epub
ahead of print).
35. Mwai L, Kiara SM, Abdirahman A, Pole L, Rippert A, et al. (2009) In vitro
activity of piperaquine, lumefantrine and dihydroartemisinin in Kenyan
Declining Responsiveness to Artemisinin in Kenya
PLoS ONE | www.plosone.org 9 November 2011 | Volume 6 | Issue 11 | e26005
Plasmodium falciparum isolates and polymorphisms in Pfcrt and Pfmdr1.
Antimicrob Agents Chemother 53: 5069–5073.36. Basco LK, Ringwald P (2003) In vitro activities of piperaquine and other 4-
aminoquinolines against clinical isolates of Plasmodium falciparum in Camer-
oon. Antimicrob Agents Chemother 47: 1391–1394.37. Wong RP, Lautu D, Tavul L, Hackett SL, Siba P, et al. (2010) In vitro sensitivity
of Plasmodium falciparum to conventional and novel antimalarial drugs inPapua New Guinea. Trop Med Int Health 15: 342–349.
38. Chen L, Qu FY, Zhou YC (1982) Field observations on the antimalarial
piperaquine. Chin Med J (Engl) 95: 281–286.
39. Stepniewska K, Ashley E, Lee SJ, Anstey N, Barnes KI, et al. (2010) In vivo
parasitological measures of artemisinin susceptibility. J Infect Dis 201: 570–579.
40. Dondorp A, Nosten F, Stepniewska K, Day N, White N (2005) Artesunate versus
quinine for treatment of severe falciparum malaria: a randomised trial. Lancet
366: 717–725.
Declining Responsiveness to Artemisinin in Kenya
PLoS ONE | www.plosone.org 10 November 2011 | Volume 6 | Issue 11 | e26005