DECISION MAKING IMPROVEMENT BY
EFFECTIVELY UTILISING ACTIVITY-BASED
COSTING AND ACTIVITY-BASED MANAGEMENT
TOOLS
VIVIAN JULIAN PALMER
BCOMM.
Treatise submitted in fulfilment of
the requirements for the degree
MAGISTER IN BUSINESS ADMINISTRATION
in the
Business School
at the
NELSON MANDELA METROPOLITAN UNIVERSITY
Promoter: Dr Margaret Cullen
Port Elizabeth
2009

i
ACKNOWLEDGEMENTS
I wish to acknowledge the contribution of the following people and instances to
the completion of my study:
• First and foremost, the LORD JESUS CHRIST whose unconditional love and
guidance sustained me. You gave me wisdom, faith, patience and endurance
to accomplish my goals. I PRAISE YOU.
• My wife Mellany, your love, support and understanding during difficult times
sustained me. I love you and may God bless you.
• Blaine and Jordyn my son and daughter, who released their Dad to working
late hours.
• Dr Margaret Cullen, my promoter and Senior Lecturer at the Nelson Mandela
Metropolitan University who always motivated me with her professional
commitment and rigour, and whose perceptive and valuable comments and
suggestions enabled me to complete my study.
• My parents, parents-in law, brothers, brothers-in-law, their families and my
two sisters, June and Eurica, for believing in me and always giving your
unconditional love, support and encouragement throughout my study. May
God bless you all.
• A special thank you to my sister June Palmer for her support, direction and
encouragement.
• Staff and management at Eskom Transmission, for their mutual co-operation,
respect and assistance in completing research questionnaires. Without you,
this study would not have been possible.
• The Nelson Mandela Metropolitan University (Business School)
administration office and library staff for their friendly support during my study.
ii
ABSTRACT
The aim of this study was to suggest ways to effectively utilise Activity-Based
Costing and Activity-Based Managment within Eskom Transmission Southern
Grid to improve decision making towards improved business and financial
performance. The ultimate purpose was to assist managers and staff to
implement ABC and ABM effectively for improved business and financial
performance.
The focus was on the following objective:
To suggest ways to effectively utilise ABC & ABM within Eskom Transmission
Southern Grid as to improve decision making and business financial
performance.
Given the selection of management tools available, instruments such as ABC
and ABM are usually not implemented alone, but may be supported by one or
more approaches. For this reason ABC and ABM are contrasted with several
other popular instruments mentioned in the literature. The instruments are:
• The value chain;
• Continuous improvement;
• The theory of constraints; and
• Total quality management.
Insight will be given to provide managers with more accurate information
regarding maintenance for the Grid and tools in identifying critical bottlenecks. By
applying the TOC, TQM and continuous improvement strategies, managers will
be able to make improved decisions, leading to improved financial performance
in the Eskom Transmission Southern Grid.
iii
The literature study revealed that ABC and ABM prove to be the cornerstone for
informed decision making. Since organisations are highly dependent on quality
information to make these informed decisions, ABC and ABM reorientate the
organisation towards understanding and managing work processes thus
impacting financial performance positively. ABC and ABM trace the cost of
activities such as engineering and procurement to how maintenance benefits
from these activities.
The empirical study consisted of a structured questionnaire distributed to a
sample population of engineers and managers in Eskom Transmission Southern
Grid in Port Elizabeth. It was aimed at gathering information about the use of
ABC and ABM within the Grid. Semi-structured interviews were also conducted
with financial staff in the Grid and a focus group interview with engineering staff
was done. The main findings of the empirical investigation revealed that
management and staff lack insight into the use of ABC and ABM and how it can
be integrated with existing improvement systems within the organisation.
This study is concluded with a number of recommendations. These
recommendations address the shortcomings and improvements that can be
made to improve the utilisation of ABC and ABM within the organisation. The
recommendations address the following:
• Ensuring full commitment towards organisational goals and broadening the
endorsement of ABC within the organisation;
• Highlighting the importance of financial performance throughout the Grid;
• Training of Managers, finance staff and engineers is required for proper
execution of the ABC system;

iv
• Implementers need skills and know-how of the ABC and ABM system
ensuring full utilisation;
• The main cost drivers are identified, prioritised and efforts channelled into
these activities;
• Tools such as the Theory Of Constraints and Total Quality Management from
the proposed model would assist the Grid in identifying the bottlenecks of a
system correctly, thus know explicitly the amount of slack capacity of each
activity available during a specific time period.
v
ABSTRAK
Die doel van hierdie studie was om metodes voor te stel hoe om
Aktiwiteitsgebaseerde Kosteberekening (ABC) en Aktiwiteitsgebaseerde Bestuur
(ABM) doeltreffend binne die Eskom Transmissie Suidelike Raamwerk aan te
wend ter wille van verbeterde sake- en finansiële prestasie. Die einddoel was om
om bestuurders en personeel te help om ABC en ABM doeltreffend te
implementeer, met verbeterde sake- en finansiële prestasie as oogmerk.
In die ontwikkeling van sodanige model was die fokus op die volgende doelwit:
Om metodes voor te stel hoe om ABC en ABM doeltreffend binne die Eskom
Transmissie Suidelike Raamwerk aan te wend ten einde besluitneming en sake-
finansiële prestasie te verbeter.
Gegewe die keuse van bestuurswerktuie wat beskikbaar is, word instrumente
soos ABC en ABM gewoonlik nie alleen geïmplementeer nie, maar kan dit deur
een of meer benaderings ondersteun word. Om hierdie rede word ABC en ABM
in die literatuur met verskeie ander, soortgelyke gewilde instrumente
gekontrasteer. Die instrumente is:
• Die waardeketting
• Voortdurende verbetering
• Die teorie van beperkings en
• Algehele gehaltebestuur
Insig sal verleen word om bestuurders voorsien van meer akkurate inligting
betreffende die instandhouding van die Raamwerk en werktuie om kritieke
opeenhopings (bottelnekke) te identifiseer. Deur die Teorie van Beperkings
(TOC), Totale Gehaltebestuur (TQM) en deurlopende verbeteringstrategieë toe
vi
te pas, sal bestuurders in staat wees om beter besluite te neem, wat sal lei tot
verhoogde finansiële prestasie in die Eskom Transmissie Suidelike Raamwerk.
Die literatuurstudie het aangetoon dat ABC en ABM die hoekstene vir ingeligte
besluitneming blyk te wees. Aangesien organisasies baie afhanklik is van
betroubare inligting om hierdie ingeligte besluite te neem, reoriënteer ABC en
ABM die organisasie ten opsigte van begrip en bestuurswerkprosesse, wat
gevolglik ʼn positiewe impak op finansiële prestasie het. ABC en ABM speur die
koste van aktiwiteite soos ingenieurswerke en aankope na om aan te toon hoe
instandhouding baat vind by hierdie aktiwiteite.
Die empiriese studie het bestaan uit ʼn gestruktureerde vraelys wat onder ʼn
steekproefgroep ingenieurs en bestuurders in die Eskom Transmissie Suidelike
Raamwerk in Port Elizabeth versprei is. Dit was daarop gemik om inligting
omtrent die gebruik van ABC en ABM binne die Raamwerk te versamel. Semi-
gestruktureerde onderhoude is voorts gevoer met finansiële personeel binne die
Raamwerk en ʼn fokusgroeponderhoud met ingenieurspersoneel is gereël. Die
vernaamste bevindings van die empiriese ondersoek het aangetoon dat bestuur
en personeel ʼn gebrek aan insig in die gebruik van ABC en ABM toon, asook hoe
dit met bestaande verbeteringsplanne binne die organisasie geïntegreer kan
word.
Hierdie studie word afgesluit met ʼn aantal aanbevelings. Hierdie aanbevelings
het die tekortkominge en verbeterings aangespreek wat gemaak kan word om
die toepassing van ABC en ABM binne die organisasie te verbeter. Die
aanbevelings spreek die volgende aan:
• Dit verseker algehele verbondenheid tot organisatoriese doelwitte en die
goedkeuring van ABC binne die organisasie.
vii
• Beklemtoon die belangrikheid van finansiële prestasie dwarsdeur die
Raamwerk.
• Opleiding (van bestuurders, finansiële personeel en ingenieurs) word benodig
vir die doeltreffende toepassing van die ABC-stelsel.
• Implementeerders benodig kennis en vaardighede rakende die ACB en ABM-
stelsels ten einde dit ten volle te gebruik.
• Die vernaamste kostekomponente word geïdentifiseer en in volgorde van
prioriteit geplaas, en pogings word in hierdie aktiwiteite gekanaliseer.
• Werktuie soos TOC en TQM van die voorgestelde model sal die Raamwerk
help om die bottelnekke van ʼn stelsel korrek te identifiseer, en dus gevolglik
presies te weet hoeveel onderbenutte kapasiteit elke aktiwiteit gedurende
enige spesifieke tyd beskikbaar het.
viii
TABLE OF CONTENT
CHAPTER ONE..................................................................................................1
ORIENTATION OF THE STUDY........................................................................1
1.1 INTRODUCTION ..................................................................................1
1.2 STATEMENT OF THE PROBLEM.......................................................2
1.3 AIM OF THE STUDY............................................................................4
1.4 RESEARCH METHODOLOGY............................................................4
1.4.1 Review of literature ...........................................................................5
1.4.1 Sample..............................................................................................5
1.5 RESEARCH DESIGN...........................................................................5
1.6 OUTLINE OF THE STUDY...................................................................7
1.7 CONTRIBUTION OF THE STUDY.......................................................9
1.8 GLOSSARY .......................................................................................10
CHAPTER TWO ...............................................................................................12
LITERATURE REVIEW OF ESKOM ................................................................12
2.1 INTRODUCTION ................................................................................12
2.2 ESKOM AS A POWER UTILITY IN SOUTH AFRICA .......................14
2.3 DIVISIONS WITHIN ESKOM..............................................................15
2.4 THE IMPORTANCE OF A SOUND TRANSMISSION NETWORK ....17
2.5 QUALITY OF SUPPLY TO THE GREATER NETWORK ..................19
2.6 CONCLUSION ...................................................................................21
ix
CHAPTER THREE ...........................................................................................22
LITERATURE REVIEW COSTING...................................................................22
3.1 INTRODUCTION ................................................................................22
3.2 COST ACCOUNTING ........................................................................23
3.2.1 Traditional cost Accounting methods ..............................................25
3.2.2 Traditional cost vs ABC...................................................................25
3.3 COST MANAGEMENT IN MODERN BUSINESS............................. 31
3.3.1 Value Chain ................................................................................... 31
3.3.2 Continuous Cost Improvement........................................................33
3.3.3 Quality Management .......................................................................35
3.4 BENEFITS OF IMPROVED COSTING IN BUSINESS.......................36
3.5 CONCLUSION ...................................................................................38
CHAPTER FOUR .............................................................................................39
ACTIVITY BASED COSTING AS A COST AND MANAGEMENT
STRATEGY ......................................................................................................39
4.1 INTRODUCTION ................................................................................39
4.2 ACTIVITY BASED COSTING AS A PROCESS ............................... 41
4.2.1 Defining Activity-Based Costing ..................................................... 41
4.2.2 Fundamentals of ABC.....................................................................43
4.2.3 Principles of ABC as used in business............................................48
4.2.4 Maintenance costing as an ABC approach .....................................49
4.3 THE THEORY OF CONTRAINT (TOC) .............................................51
4.3.1 Defining the TOC ............................................................................51
x
4.3.2 Integrating ABC and TOC ...............................................................52
4.3.3 TOC as a tool for effective ABC......................................................55
4.4 EFFECTIVE ACTIVITY BASED MANAGEMENT (ABM) ..................56
4.4.1 Understanding ABM and its importance..........................................57
4.4.2 The role of ABM in performance management systems .................59
4.4.3 The importance of linking ABM and ABC........................................60
4.5 ABC WITHIN ESKOM TRANSMISSION ...........................................62
4.6 CONCLUSION ...................................................................................65
CHAPTER FIVE................................................................................................66
RESEARCH METHODOLOGY ........................................................................66
5.1 INTRODUCTION ................................................................................66
5.2 RESEARCH DESIGN.........................................................................67
5.3 POPULATION AND SAMPLE SELECTION......................................69
5.4 RESEARCH METHODOLOGY..........................................................70
5.4.1 Positivistic paradigm .......................................................................71
5.4.2 Phenomenological paradigm ..........................................................73
5.4.3 Mixed-method approach .................................................................76
5.4.3.1 Design of the Questionnaires .........................................................78
5.4.3.2 Semi-structured Interviews.............................................................79
5.4.3.3 Focus group Interviews ..................................................................79
5.4.4 Rationale for selected paradigm .....................................................80
5.5 MEASUREMENT CHARACTERISTICS OF QUANTITATIVE
RESEARCH INSITRUMENTS............................................................81
xi
5.5.1 Validity ............................................................................................81
5.5.2 Reliability.........................................................................................82
5.6 SUMMARY .........................................................................................83
CHAPTER SIX..................................................................................................84
DATA ANALYSIS AND INTERPRETATION....................................................84
6.1 INTRODUCTION ................................................................................84
6.2 CHARACTERISTICS OF THE TARGETED SAMPLE.......................86
6.2.1 Response rate.................................................................................86
6.2.2 Demographic data...........................................................................87
6.2.3 Analysing and interpreting the data.................................................89
6.2.4 Analysis of the questionnaire ..........................................................90
6.3 DATA ANALYSIS ..............................................................................90
6.3.1 Cronbach’s Alpha Coefficient .........................................................91
6.3.2 Biographical data of respondents ...................................................91
6.3.2.1 Table and graph 6.3 .......................................................................92
6.3.2.2 General discussion of the results ...................................................93
6.3.2.3 Detailed discussion of the results ...................................................93
6.3.2.4 Summary of the results ..................................................................94
6.3.3.1 Table and graph 6.4 .......................................................................94
6.3.3.2 General discussion of the results ...................................................95
6.3.3.3 Detailed discussion of the results ...................................................95
6.3.3.4 Summary of results ........................................................................95
6.3.4.1 Table and graph 6.5 .......................................................................96
xii
6.3.4.2 General discussion of the results ...................................................97
6.3.4.3 Detailed discussion of the results ...................................................97
6.3.4.4 Summary of results ........................................................................97
6.3.5.1 Table and graph 6.6 .......................................................................98
6.3.5.2 General discussion of the results ...................................................98
6.3.5.3 Detailed discussion of the results ...................................................98
6.3.5.4 Summary of results ........................................................................99
6.4 CONCLUSION ...................................................................................99
6.5 ANALYSIS OF QUALITATIVE DATA..............................................100
6.5.1 Interpretation of qualitative data....................................................100
6.5.2 Analysing the data for semi-structured interviews.........................101
6.5.3 Feedback from semi-structured and focus group interviews.........101
6.6 CONCLUSION..............................................................................106
CHAPTER SEVEN .........................................................................................108
DISCUSSIONS, RECOMMENDATIONS AND CONCLUSIONS....................108
7.1 INTRODUCTION ..............................................................................108
7.2 SUMMARY.......................................................................................109
7.3 FINDINGS ........................................................................................111
7.4 RECOMMENDATIONS AND MOTIVATION OF THE RESEARCH 112
7.5 LIMITATIONS OF THE STUDY .......................................................116
7.6 OPPORTUNITIES FOR FURTHER RESEARCH.............................117
7.7 CONCLUDING REMARKS ..............................................................118
xiii
SOURCE OF REFERENCE ...........................................................................119
ADDENDUM A ...............................................................................................130
FORMAL PERMISSION FROM GRID MANAGER ........................................130
ADDENDUM B ...............................................................................................131
QUESTIONNAIRE/ VRAELYS .......................................................................131
ADDENDUM C ...............................................................................................132
SEMI-STRUCTURED INTERVIEWS ..............................................................132
ADDENDUM D ...............................................................................................133
FOCUS GROUP INTERVIEWS......................................................................133
xiv
LIST OF FIGURES AND TABLES
Figure 3.1 Association between usage and success of costing system........28
Figure 3.2 Traditional cost allocation ...........................................................30
Figure 3.3 Modern cost allocation (ABC) .....................................................30
Figure 3.4 The Value Chain .........................................................................32
Figure 4.1 The ABC model ..........................................................................45
Figure 4.2 S-Curve : ABC vs Traditional costing ..........................................47
Figure 4.3 Activity-Based Management Model .............................................58
Figure 4.4 ABM Model .................................................................................61
Figure 4.5 Proposed Eskom Transmission Model ........................................63
Figure 5.1 Mixed method approach .............................................................77
Table 6.1 Response rate of structured questionnaire ..................................87
Table 6.2 Demographic data of participants ................................................88
Table 6.3 Table and graph 6.3 .....................................................................92
Table 6.4 Table and graph 6.4.....................................................................94
Table 6.5 Table and graph 6.5 ....................................................................96
Table 6.6 Table and graph 6.6.....................................................................98
1
CHAPTER 1
ORIENTATION OF THE STUDY
1.1 INTRODUCTION
Every business challenge presents winners and losers. Companies that succeed
are those that are able to alter their focus and help improve opportunities. The
contribution of the finance and accounting function within any organisation is to
flex, change and meet their firm's needs (Schiff and Schiff, 2008: 48).
Market conditions characterised by increasingly aggressive competition and ever
more demanding customers pose serious questions about competitive strategies
and underline the importance of a reliable and efficient management information
system for effective pursuit of those strategies. The range and scope of
information required to optimise corporate performance in these conditions
continues to broaden, addressing diverse areas such as markets, competitors,
customers, product / service innovation, possible strategic alliances, etc. Not only
the need for externally oriented information expands; the demand for accurate,
reliable and versatile information on internal processes, and specifically costs,
also increases in these circumstances. The quality of management decisions has
been directly linked to the quality of costing information and issues relating to
costing system effectiveness therefore become important, such as how that
success is measured and what drives it (Pierce, 2006: 46).
Cost information should reveal problems to tackle and opportunities to exploit. It
allows one to identify problems and plot safe courses to solutions and
opportunities. It does this by providing cost and non-financial information about
activities and cost objects (Turney, 1991: 51). Activity-Based Costing and
2
Activity-Based Management empowers people with information and tools to
provide improved business performance (Turney, 1991: 3).
Activity-Based Costing and Activity-Based Management places an organisation
in a more favourable position to achieve its objectives and goals and, if correctly
applied, it should lead to improved outputs, higher quality, improved cycle time,
improved service and profitability (Wiersema, 1995: 39). ABC proves to be an
acceted costing tool within ESKOM Transmission.
For Eskom’s vision to become a reality, its leadership relies on management and
staff to use cost information to address problem areas, turning those areas into
opportunities and execute strategic objectives.
The study highlights how well cost information can be obtained through the
effective use of ABC and ABM as tools. The results of the study would help the
leadership of Eskom Transmission Southern Grid to practice sound business
strategy pertaining to continuous improvement with the aid of ABC and ABM that
will encourage informed decision making and effective business performance.
1.2. STATEMENT OF THE PROBLEM
Activity-Based Costing (ABC) provides the performance breakthrough for modern
business. ABC reveals the problems you need to correct and the profitable
opportunities that are available. Its ability to measure true business performance
ensures that you improve where it counts the most – the bottom line (Turney,
1991: 2).
Gupta and Baxendale (2008: 1) further emphasize the need for ABC by
highlighting the importance of cost accounting measurements and information
3
assisting management assess the profitability, effectiveness and efficiency of
sub-segments of a company such as products, processes and departments.
Accurate cost information is critical for every aspect of business, from product
design to performance reviews.
Maiga and Jacobs (2008: 1) argue that knowledge of the linkage between ABC
and firm performance, as well as the organisational circumstances under which
ABC can provide performance enhancements to companies, are essential inputs
to the investment and operational decisions that companies must make before
approving this important resource allocation decision. Many companies have
adopted ABC, and researchers have examined important issues related to the
financial impact of this organisational innovation.
It is clear that cost information is imperative to business. ABC and ABM are the
business tools assisting managers make informed financial and operational
decisions towards improve business performance. It is the researcher’s intention
to show that ABC and ABM will have a direct impact on management decisions
and will offer business improvement opportunities.
Based on the preceding information, the following research questions need to be
asked:
• To what extent do ABC and ABM contribute towards decision making?
• How can other continuous improvement tools assist ABC and ABM?
• What is the impact of ABC and ABM on financial performance and operational
decision-making in the Southern Grid?
The research problems formulated above imply that certain specific aims have to
be achieved through this present study.
4
1.3 AIM OF THE STUDY
The aim of this study was to suggest ways to effectively utilise ABC & ABM within
Eskom Transmission Southern Grid to improve decision making and business
financial performance.The results of the research could mould how ABC and
ABM in other Transmission Grids will be configured within the company.
The overall aim was operationalised by:
• presenting an overview of the organisation – Eskom Transmission Southern
Grid;
• exploring the need for a sound Transmission network towards economic
growth;
• providing a background and underlining the need for ABC and ABM in
modern business;
• suggesting how ABM can to be utilised in Eskom Transmission that will effect
improved decision making and sound business financial performance.
1.4 RESEARCH METHODOLOGY
According to Leedy and Ormrod (2005: 12) this refers to the researcher’s general
approach in carrying out the research project. The approach taken normally
indicates which research strategies or tools need to be selected. Both a
qualitative and quantitative reasearch method were employed in this study.
5
1.4.1 Review of literature
Leedy and Ormrod (2005: 64) state that a literature review describes the
theoretical perspectives and previous research findings regarding the research
problem. A literature study on what ABC and ABM is, its importance as a
business tool and the impact they (ABC and ABM) can have on sound business
decisions, will be done. In order to obtain relevant literature, a variety of
electronic databases, internet websites and internet search engines were utilized,
as well as accounting issued journals and text books.
1.4.2 Sample
For the purpose of this study, a purposive sample will be drawn from a population
of eleven middle managers, fifteen engineers and fifteen finance staff.
Christensen (2001: 198) believes this technique to be valid as it provides a
sample that is representative of the population.
Purposive sampling was used for this study. A purposive sample of managers
was selected for this study. From the sample, ten middle managers and twelve
engineers were selected at ESKOM Transmission Southern Grid in Port
Elizabeth to complete the questionnaire. Focus groups interviews with seven
engineers within Eskom Transmission Southern Grid was done.
1.5 RESEARCH DESIGN
A research design is the general strategy a researcher will follow to solve the
research problem, in that it provides the overall structure for the chosen
procedures (Leedy & Ormrod, 2005: 85). Research, as defined by (McMillan and
6
Schumacher, 1993:9) is a systematic process of collecting and logically
analysing information for some purpose. Research design is the specification of
procedures for collecting and analysing data to help identify or react to a problem
or opportunity (McMillan and Schumacher, 1993: 9).
A mixed method design was used for this study. This signifies a combined
quantitative and qualitative approach to data collection and analysis. According
to Leedy and Ormrod (2005:95), a quantitative researcher aims at, among other
things, establishing, confirming or validating relationships. In this way such
researchers hope to gain better insight into complex occurrences, events or
situations. In the final analysis, their work is often exploratory in nature and they
may even use their observations to build theory from the ground up (Leedy &
Ormrod, 2005: 95).
For the purposes of this study, a variety of data collection methods will be used.
These include the use of focus groups and semi-structured open-ended
interviews for the qualitative research and a questionnaire for the quantitative
research designs respectively. To gather the data for the investigation, the
researcher will conduct focus group interviews with ten middle managers within
ESKOM Transmission and semi-structured open-ended interviews will also be
conducted with senior managers to establish how they approach ABC and ABM
and probe current practices regarding decision-making and business
performance within the organisation.
The mixed method approach is usually applied when a researcher tends to base
knowledge on practical foundations. Both quantitative and qualitative data will
therefore be collected at the same time (McMillan & Schumacher, 2006: 28).
7
Muijs (2004: 9) states that a mixed method approach is a flexible approach
where the research design is determined by what the researcher wants to find
out, rather than by any predetermined epistemological position. In mixed method
research, qualitative or quantitative components can predominate, or both could
have equal status.
1.6 OUTLINE OF THE STUDY
The study is divided into five chapters. The research is divided into an
introductory chapter in which the problem is defined, the research motivated and
the aims as well as method of the study provided, the chapters following, are
organised as follows:
Chapters 2, 3 and 4: Literature Review
Chapters 2, 3 and 4 provide the literature review for this study. The literature
review section which is divided into three main chapters; and encapsulate a
review on the literature on Eskom Transmission, provides the concept of costing
and the literature on the importance of ABC and ABM in modern business.
Chapter 2 provides the background of ESKOM Transmission as a power utility,
its divisions and the impact it has on the greater economy. Chapter 3 of the
literature review focuses on costing and how it impacts any organisation, the
various cost improvement tools, the relevance of improved costing in modern
business and the importance of the value chain. Chapter 4 covers the core
aspects of ABC and ABM, specifically highlighting the aspects such as Activity-
Based Costing as a process, fundamentals of ABC; the principles of ABC as
used in business, maintenance costing as an ABC approach; the integration of
8
ABC and TOC (Theory of constraint); effective Activity Based Management
(ABM); understanding ABM and its importance and ABC within Eskom
Transmission Southern Grid.
Chapter 5: Research Methodology
The research methodology chapter describes the methodology employed in the
investigation of the relationship between ABC and ABM and effective decision
making and business performance. It identifies and briefly describes the
paradigm of the research and then goes on to describe how the sample was
determined; how the questionnaires were administered; the history of the
measuring instruments used; their reliability and validity. This chapter also sets
out the research design for the study.
Chapter 6: Analysis of results
This chapter contains the results, descriptions of the results followed by the
analysis of the relationship (interpretation of the results) and explanations on
what the researcher subscribes to the results.
Chapter 7: Discussion, recommendations and conclusions
The treatise ends with a discussion, concluding remarks and recommendations
on further research in ABC and ABM in modern business pertaining to its
importance in decision making and bottom-line profits.
9
1.7 CONTRIBUTION OF THE STUDY
Increased competition demands that companies improve the effectiveness of
decisions concerning products and customer mix, pricing, and product design.
Companies in their search for competitive strength found that they needed
accurate information relating to consumption of resources used to produce, sell
and deliver products and services to customers (Cooper, Kaplan, Maisel,
Morrissey and Oehm, 1992: v).
Glad and Becker (1994: 219) further state that organisations need reliable cost
information, which serves in many planning and decision support roles. An ABC
& M system can generate this quality information and interrelate superbly with
strategic planning to, inter alia, produce products of higher quality cost-effectively
and achieve overall customer satisfaction.
This study provides Eskom Transmission Southern Grid with possible tools to
respond to the demands brought about by change in the business environment
by utilising ABC and ABM as an accounting and business improvement tool. In
so doing, the managers are better equipped to meet customer expectations,
improved network quality of supply and business performance through effective
decision making.
The impact of this work in terms of enhancing accountants and managers
relations and communication and improving the accountant’s awareness of the
operations has been beneficial.
10
1.8 GLOSSARY
The following key aspects of this study are defined:
Activity-Based Costing - ABC is defined as an information system that allows
one to identify problems and plot safe courses to solutions and opportunities. The
author further states that ABC assumes that activities cause cost and that cost
objects create the demand for activities. ABC is a method for assigning cost and
measuring performance (Turney,1991: 51).
Activity-Based Management - ABM is the management and control of a firm’s
performance using ABC information as the focus for decision-making. ABM is
broken into several steps notably planning, education and awareness,
process/activity definition, data collection, performance improvement techniques,
planning the ongoing system, and implementation (Huang, 1999: 25).
Activities – Units of work performed within an organisation. A description of the
work that goes on in the organisation and consumes resources (Turney,1991:
51).
Continuous improvement – The relentless and on-going search for ways to
imprve business performance (Turney,1991: 317).
Cost drivers - Cost drivers can be defined as those factors or transactions that
are significant determinants of cost (Glad and Becker,1994: 22).
Efficiency – “doing things right”, maximising the input/output.

11
TOC - Huang (1999: 21) defined the theory of constraints (TOC) as a method
that deals with scheduling production through a pre-existing application that
maximizes profitability by maximising output.
TQM – away of ridding peoples lives of wasted effort by bring everyone into the
processes of improvemnent, so that results are achieved in less time (Oakland,
2000: 19).
The following chapter will focus on the historical background and Eskom as a
power utility.
12
CHAPTER 2
LITERATURE REVIEW ESKOM
2.1 INTRODUCTION
Power utilities in South Africa, have in recent years come under pressure.
Equally, increased pressure on the maintenance and management of the
services and utilities of these companies, have become national imperatives. It
is evident therefore that cost and the quality of management decisions impact on
the quality of electricity supply and services (Asher, 1999).
Eskom demonstrates its commitment to its vision of “together building the
powerbase for sustainable growth and development” through its core business
focus of electricity generation, transmission, energy trading and distribution. It
entrenches the values of excellence, innovation, customer satisfaction and
integrity across all business operations (Eskom, 2008).
According to Eskom (2008), achieving the Eskom vision requires in-depth
planning and implementation in a complex environment characterised by
economic growth, greater demand for electricity and the increased need for
significant infrastructure expansion, as well as competition for scarce materials
(coal and equipment), funding, skills and supplier inputs. Challenges are
compounded by the rising cost of primary energy and new components,
restructuring of the electricity distribution industry, the need to continually
improve our environmental performance and the growing involvement of
stakeholder groups (Eskom, 2008).
13
Competition in the global environment has greatly intensified and accurate
costing becomes very important as it may lead to better decisions made by
companies to survive and maintain profit margin (Wong and Rich, 2005). One of
the most problematic issues in cost management is the product costing, which
deals with assigning shared or indirect costs associated with production support
services (e.g. procurement, maintenance, quality control) to individual products
(Wong and Rich, 2000).
Therefore, it can be argued that cost is imperative in business, hence ABC
proves to be a dynamic approach to determine accurate costs by assigning them
to the principal activities performed within an organisation. Widely applied in
various manufacturing industries, it is not entirely new in the service industry
(Glad and Becker, 1994: 12).
Sale and Houston (2007: 3) support this argument by stating that ABC helps to
establish a link between the services offered and the activities that are necessary
to provide services and the expenditures necessary to perform the activities by
establishing this link, costs can be tracked and assigned to processes and
activities performed by the cooperative.
In this chapter, the researcher will provide discussion on ESKOM as a power
utility in South Africa, highlight the divisions within ESKOM, explore the
importance of a sound transmission network and discuss the importance of the
quality of supply to the greater network.
14
2.2 ESKOM AS A POWER UTILITY IN SOUTH AFRICA
Electricity is an essential service that contributes to the prosperity and quality of
life. It stands to reason that electricity supply companies should provide their
customers with a wide range of services that are essential in the delivery of such
vital services. In this section, the researcher will briefly explore South Africa’s
electricity utility namely the Electricity Supply Commission (ESKOM) and the
essential services it renders.
According to Khumalo (2004: 3) ESKOM has committed itself to the electrification
of South Africa and the improvement of the standard of living to support
economic growth in the country and to provide sustainable growth. ESKOM
(2008) reiterates that ESKOM is a vertically integrated operation that generates,
transmits and distributes electricity and plays a significant role in accelerating
growth in the South African economy by providing high quality of electricity
supply to satisfy the needs of the county.
Founded in 1923 at headquarters in Johannesburg, ESKOM has become the
largest generator and distributor of electrical power in Africa. ESKOM generates
ninety five percent of the electricity used in South Africa and is responsible for
the generation, transmission and distribution of electricity from its 24 power
stations, with a combined nominal capacity of 40,585 megawatts over 26, 461
kilometres of transmission lines (ESKOM Distribution, 2007). It is therefore
evident that, in order to support the provision of high quality electricity supply at
the lowest possible cost, a well-designed, efficiently operated and maintained,
reliable transmission network is required (Crisp, 2004: 21).
Sale and Houston (2007:4) posit that the services offered by ESKOM may be
broadly grouped into the areas of generation, transmission and distribution.
15
Generation includes the building and maintenance of generation stations to
produce power from any of a wide variety of fuels while transmission is the
process of moving the power in high-voltage over what may be long distances
and includes provision and maintenance of the lines and other necessary
equipment.
The authors highlight the area of distribution as transforming the power to lower
voltage and distributing it over smaller lines to the individual customer.
Distribution also incorporates the installation and maintenance of power
distribution lines to new and existing customers and the provision of emergency
response in the event of a disruption service (Sale & Houston, 2007: 5).
Crisp (2004: 23) states that transmission networks provide an essential service to
the communities served by ESKOM as these networks operate and maintain
electricity supply. Electricity transmission networks connect generators of
electricity with users of electricity. Domestic users of electricity are connected
through distribution networks. The point of connection between a distribution
network and a transmission network is often described as a bulk supply point.
For the purposes of the study, the different divisions within ESKOM will now be
discussed.
2.3 DIVISIONS WITHIN ESKOM
According to Sale & Houston (2007: 1) electric utility companies provide their
customers with a wide range of services that are essential in delivery of the
16
electricity. These services are broadly grouped into the areas of generation,
transmission, and distribution.
Generation includes the building and maintenance of generation stations to
produce power from any of a wide variety of fuels. Transmission is the process of
moving the power in high-voltage lines over what may be long distances to get it
to the general area of the customer and includes provision and maintenance of
the lines and other equipment necessary to the process (Sale and Houston,
2007).
Distribution includes transforming the power to lower voltage and distributing it
over smaller lines to the individual customer, installing and maintaining power
distribution lines to new and existing customers and providing emergency
response in the event of disruption of service. Distribution services include
metering, billings, and marketing. The electric utility industry is changing
dramatically. Traditionally customers were compelled to purchase power from the
company that provided the distribution service to the customer’s location (Sale
and Houston, 2007).
Financial results (2008) further state that ESKOM generates, transmits and
distributes electricity to industrial, mining, commercial, agricultural and residential
customers and redistributors. Additional power stations and major power lines
are being built to meet rising electricity demand in South Africa.
Power stations form the very backbone of ESKOM as a power utility. ESKOM’s
Generation Division is the power house of the South African economy. The
Division currently maintains and operates 24 power stations throughout South
Africa, with an installed capacity of over 40 000MW. These include coal-fired,
nuclear, hydro, pumped storage, wind turbine and gas turbine facilities. ESKOM
17
Holdings’ core existence is based on the generation, transmission and
distribution of electricity. Generation is responsible for managing the first part of
this value chain, which is the production of electricity utilising a total budget of
almost R38 billion. The division’s mandate is to operate and maintain ESKOM’s
generating assets at their optimum. This is done through the efforts of
approximately 10 000 employees spread evenly across the various power
stations and some at the head office, Megawatt Park (Generation, 2009).
Since the early 1990's ESKOM Distribution connected over three million homes
to the South African electricity distribution network. The network planning and
design criteria adopted by ESKOM Distribution maximised the number of
customers that could be connected with the available funding. Electricity
distribution is the final stage in the delivery (before retail) of electricity to end
users. A distribution system's network carries electricity from the
transmission system, and delivers it to consumers. Electric distribution
substations transform power from transmission voltage to the lower voltage used
for local distribution to homes and businesses. The modern distribution system
begin as the primary circuit leaves the sub-station and ends as the secondary
service enters the customer's meter socket. A variety of methods, materials, and
equipment are used among the various utility companies, but the end result is
similar (Nersa, 2008).
2.4 THE IMPORTANCE OF A SOUND TRANSMISSION NETWORK
ESKOM transmission networks provide an essential service to communities. The
quality of that service directly impacts on work productivity and quality of life. The
electricity network is therefore seen by many countries as being of strategic
importance.
18
The distinction between transmission and distribution network is not completely
clear - different jurisdictions use different voltages to define the point at which the
subtransmission/distribution network joins the transmission network. However,
transmission networks are often defined as operating at voltages above 100kV or
above 66kV. Such networks often operate with two or more different voltage
levels, the higher voltage parts of the network intended to transmit higher power
flows. The design of transmission networks usually incorporates a higher degree
of redundancy than is generally found in distribution networks. This is considered
necessary to provide reliability of supply to customers, since transmission lines
usually supply more customers per circuit than do distribution circuits (Crisp,
2004: 7).
Reliability is the first area of concern that needs to be addressed by any effective
electric transmission system. Transmission reliability entails several components
including adequacy (sufficient capacity) and security operational reliability (The
Division of Policy Analysis & Intergovernmental Liaison, 2001: 3).
The important aspects of any transmission business are maintenance and
operations. In order to have a sound transmission network, it remains imperative
to focus on these core issues. Sound decision making and relevant information
pertaining to these areas remains paramount.
It is in the light of the above, Miller (1996: 1) states that the purpose of
management information system is to track and provide information about
horizontal aspects (namely work activities and processes) of an organisation has
lagged significantly behind the needs of its managers. The author further states
that ABM fills this information need by providing activity, cost and operating
information that reflect the horizontal view. In addition to accurate information
about cost and related activities, ABM also provides useful information about
19
value analysis, cost drivers and performance measures to initiate drive or support
effective management decisions-making and organisational improvement (Miller,
1996:1).
This is further supported by Sale & Houston (2007: 34) explaining that ABM can
be used to perform detailed economic analysis of important activities to improve
strategic and operational decisions.
ABC systems thus assist managers in determining what causes costs, and how
they can manage activities or processes to reduce these costs. Management
uses ABC as a tool to determine more accurate costs of the various services
they offer and help determine the areas in which the company can be most
competitive (Sale & Houston, 2007: 34).
Khumalo (2004: 3) agrees that ESKOM has integrated sustainable development
issues into decision-making for many years. Given that the sector is long term in
nature and that many decisions have implications for decades, it is vital that
ESKOM take robust and responsible decisions. As the new build programme
progresses and decisions are taken on key operational practices and
programmes, many of the critical issues are identified and factored into
decisions.
2.5 QUALITY OF SUPPLY TO THE GREATER NETWORK
ESKOM’s sustainable development philosophy and practice form a vital and
integral part of ESKOM’s business which guides their vision. It ensures that the
organisation strives to continually improve their performance in consultation with
20
its stakeholders in a transparent manner. ESKOM’s performance is continually
benchmarked against international practice, as they strive to go beyond what is
required of them in terms of legislation (Nersa, 2008).
In order to uphold such world class standards, ESKOM continually attempts to
employ standards of continuous improvement and quality management systems.
Activity based costing is one of such tools for continuous improvement within
business.
A research study within ESKOM by Vajeth (2001: 1) revealed that the economic
impact of poor quality of supply to customers has not been adequately quantified.
Accurate quantification of these costs will lead to improved investment decisions
as far as mitigation measures are concerned.
This means investment decisions in the transmission network have the
probability to reduce in number, duration or magnitude of voltage dips, or it may
mean mitigation measures at the customer’s plant or in some cases it may lead
to no investment action at all. The importance of accurate quantification of cost
thus proves to be vital in the decision making process.
For Sangiovanni (2004:9) a particular challenge for regulators is to achieve an
appropriate balance between incentives. This implies minimising costs and
network charges on the one hand, and augmentation of transmission networks
on the other. Some concerns have been raised that regulators have been too
focused on reducing costs, at the expense of incentives for effective operational
performance and efficient maintenance and investment, leading to operational
decisions with substantial efficiency losses and financial costs for consumers and
market participants.
21
Understanding the relationship between performance and cost is a critical part of
any network performance improvement strategy. Fact based decision making
must be applied such that the maximum level of performance improvement can
be obtained with available funding (Carter-Brown, 2008: 1).
2.6 CONCLUSION
Chapter two has given insight to the founding of ESKOM as well as its
importance in the economy. Chapter three will deal with an in-depth
understanding of costing, the different basis of costing and a fundamental
difference between ABC and traditional costing systems.
22
CHAPTER 3
LITERATURE REVIEW; COSTING
3.1 INTRODUCTION
Dealing with today’s competition is a challenge enough, even when one has all
the information (Turney, 1991: 2). If one is responding to the wrong information, it
could be a losing battle. Incorrect cost information can create a crisis from which
one may never recover. It may lead to problems that one can ill afford in today’s
competitive environment. Focus might be on the wrong priorities and the wrong
problems might be solved (Turney, 1991: 2).
Pierce (2006: 3) states that intense competitive pressure has now become the
norm for most organisations. Market conditions characterised by increasingly
aggressive competition and ever more demanding customers pose serious
questions about competitive strategies and underline the importance of a reliable
and efficient management information system for effective pursuit of those
strategies.
Schiff and Schiff (2008: 4) posit that economic recessions usually spark a
renewed interest in rigorous, detailed and effective cost-management practices.
Given the lack of orientation, preparation or temperament for a recessionary
period, the first response and reaction of most managers typically involves a
"siege mentality" that includes: protecting one's turf; battening down the hatches;
slashing all general ledger expense categories; and viewing the finance's
department's role as a headcount "executioner".
23
The quality of management decisions has been directly linked to the quality of
costing information and issues relating to costing system effectiveness therefore
become important, such as how that success is measured and what drives it
(Pierce, 2006: 3).
The need for a sound costing model is seen as imperative in the quest for sound
business operations and decision making. Costing systems thus play an integral
part in business and should be prioritised. The researcher will now explore
traditional costing methods, cost management and the difference between ABC
and traditional costing systems.
3.2 COST ACCOUNTING
As with bookkeeping and accounting, the origin of cost accounting is unknown.
With the growth in the 14th century of domestic industries – work done at home
by artisans for capitalist and created the need for some form of industrial
accounting (Glad and Becker, 1994: 2).
There was a simpler time when a factory generally made a single product and
most of the costs were directly allocated to that product. Indirect costs were
limited to simple management and administrative functions and comprised a
small percentage of overall costs. However, over time factories became more
diversified and began producing more varied product lines. The companies
became more complex and factory overheads increased in size to accommodate
these changes. Ancillary functions such as Human Resources, Accounting,
Compliance Staff, Facilities Management and Information systems, also became
larger to deal with the increasing complexity. Pretty soon, indirect costs
comprised a hefty portion of operating costs. In order to track and control these
24
costs, a number of methodologies, philosophies and practices have been
developed over the years to allocate costs in a more meaningful way (Gubata,
2008).
Cost accounting measurements and information help management assess the
profitability, effectiveness, and efficiency of sub-segments of a company such as
products, processes, and departments. Accurate cost information is critical for
every aspect of a business, from its product designs to its pricing polices to its
performance reviews (Gupta and Baxendale, 2008: 1).
The assignment of indirect costs in a traditional costing system can lead to
product-cost subsidisation. This is where excessive costs are charged to high-
volume products and insufficient costs are charged to low-volume products. The
result can lead to increased consumer demand for the undercosted—and
underpriced—products and reduced customer demand for the overcosted—and
thus overpriced—high-volume product (Barton and MacArthur, 2003: 2).
Turney (1991: 38) states that to get going in the right direction, you need a
beacon, some kind of signal to guide you. For example, cost measures are
signals that stimulate action. People pay attention to cost signals, because they
are often used to gauge and reward performance. It is important therefore for a
cost system to send the right signals. The wrong signals may misdirect
improvement efforts, may encourage actions that interfere with improvement, and
may even endanger the company’s existence.
25
3.2.1 Traditional costing Accounting methods
Accounting systems, and particularly management accounting systems, have
shown relatively little change in the last century or two. However, several
important events occurred during the last decade, which are dramatically
changing the face of management accounting. Researchers and practitioners of
management accounting all over the world are seeking improved methods and
philosophies to measure and influence the financial behaviour of organisations
(Glad & Becker, 1994: 1).
In general and as might be expected, there is a strong association between the
extent to which managers use information from the costing systems for various
purposes and the overall level of success they ascribe to those systems (Pierce,
2006: 5).
3.2.2 Traditional cost vs. ABC
Conventional bases (mainly direct labour hours and material cost) were used to
unitise production overhead cost. The accountants have found difficulty
convincing managers of the efficacy of these rates. Indeed, the accountants
themselves accepted these rates hid the key underlying causal factors which
influenced some of the firm’s overheads and distorted reported cost in ways
which could mislead managers (Innes & Mitchell, 1991: 8).
Turney (1991: 24) reaffirms this saying that conventional cost systems are no
longer in tune with external and internal conditions affecting today’s business
environment. External conditions have changed because of global competition,
26
technological advances and access to low-cost information systems.” There’s a
new competitive environment out there that we must learn to thrive in.”
Advocates of ABC claimed traditional management accounting systems
generated misleading costs in a contemporary business environment and
implementing ABC would remedy this (Johnson and Kaplan, 1987; Jones and
Dugdale, 2002) as quoted by Sharman (2003: 132). Sharman (2003: 133) further
states that traditional cost accounting drove companies to emphasise low volume
and complex products, because insufficient overhead was allocated to them.
According to Cooper, Kaplan, Maisel, Morrissey and Oehm (1992: 10), activity
based cost systems differ from traditional systems by modeling the usage of all
organisational resources on the activities performed by these resources and then
linking the cost of these activities to outputs such as products, services,
customers and projects.
Glad and Becker (1994: 8) draw some very important conclusions in terms of the
applicability of traditional accounting systems in business. Some of these are
outlined below:
• Product costing based on manufacturing cost alone today represents an
unacceptably low proportion of total cost. Non-manufacturing product cost,
such as product selling and product distribution expenses are ignored for
costing purposes. This could lead to significant cross-subsidisation of cost
as the consumption of the latter cost is not known. An ABC system
addresses the treatment of all overhead-related cost. Material cost will be
treated as direct cost, except that all cost incurred in bringing the product
to its current state and location will be incurred;
27
• Labour as a basis for assigning manufacturing overhead, is irrelevant as it
is significantly less than overhead and many overheads do not bear any
relationship to labour cost or labour hours;
• The cost of technology is not assigned to products based on usage,
instead direct labour cost is being replaced by an indirect machine cost;
• Service-related costs have increased considerably in the last few
decades. Costing of services such as banking services, insurance
services and several internal services have expanded considerably in the
past decade, thus a greater awareness is needed in order to cost products
better to determine profitability:
• Cost affected or driven by time (interest and inflation) has increased
significantly, yet times does not feature in traditional cost systems as a
cost driver:
• Greater variety, diversity and complexity of products are not taken into
consideration in traditional systems:
• A much more sophisticated market, which calls for the production of goods
and rendering of services desired by the customer/client, and not those
thought proper by the supplier, accentuates the lack of customer focus in
traditional systems (Glad and Becker, 1994: 8).
The authors further state that one of the more important paradigm shifts in cost
accounting has been the utilisation of the factor which influences cost, namely
the cost driver, to determine product cost and to serve as a mechanism for
managing cost (Glad and Becker, 1994: 8).
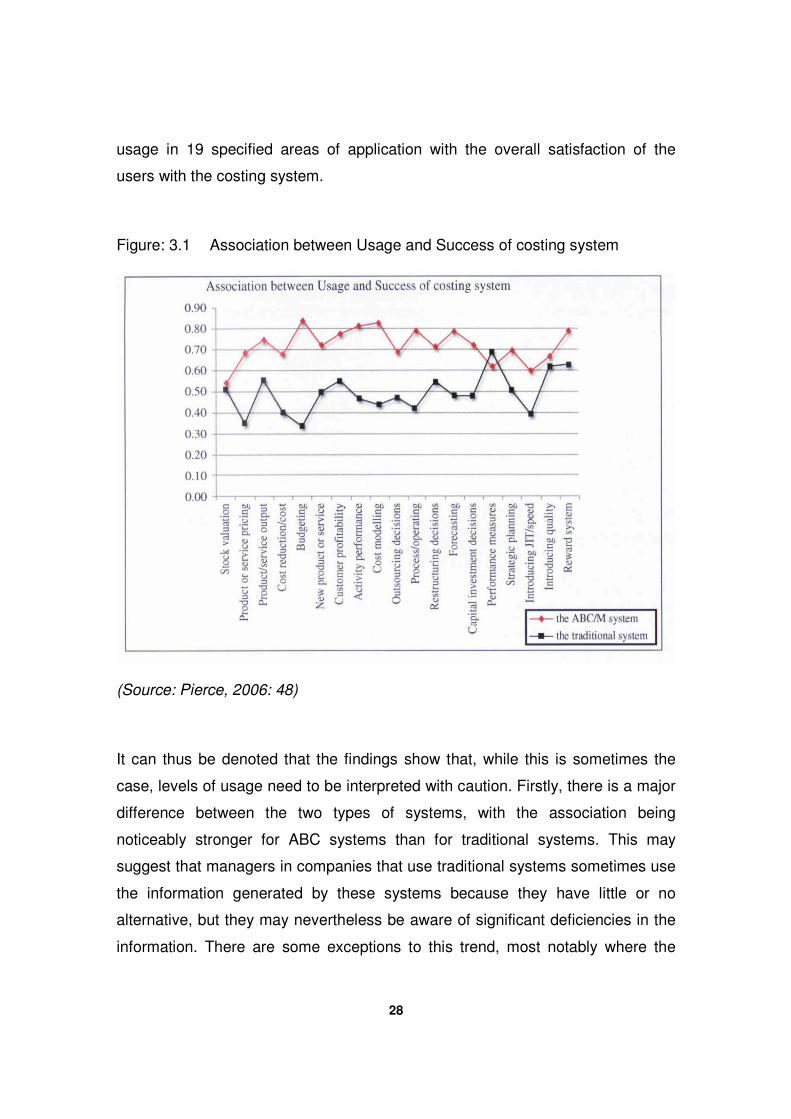
The analysis reported by Pierce (2006: 48), below in figure 3.1 was designed to
examine whether there was a link between the extent to which managers use the
costing information for each of a number of specified applications and the overall
assessment of user satisfaction with the costing system. This analysis was
conducted for both ABC and traditional systems by comparing the frequency of
28
usage in 19 specified areas of application with the overall satisfaction of the
users with the costing system.
Figure: 3.1 Association between Usage and Success of costing system
(Source: Pierce, 2006: 48)
It can thus be denoted that the findings show that, while this is sometimes the
case, levels of usage need to be interpreted with caution. Firstly, there is a major
difference between the two types of systems, with the association being
noticeably stronger for ABC systems than for traditional systems. This may
suggest that managers in companies that use traditional systems sometimes use
the information generated by these systems because they have little or no
alternative, but they may nevertheless be aware of significant deficiencies in the
information. There are some exceptions to this trend, most notably where the
29
system is used to generate information for performance evaluation, where the
pattern is reversed and the correlation between usage and success is actually
higher for traditional systems (Pierce, 2006: 49).
Secondly, the relationship shows wide variation across the range of applications.
One of the most interesting findings is in the area of budgeting, which has been
heavily criticised in recent years. The fact that traditional costing systems are
widely used to provide information for the purpose of budgeting is not necessarily
a sign that the costing systems are perceived to be successful - managers may
simply have no alternative (Pierce, 2006: 49).
Traditionally, the costs of manufacturing a product have been categorised as
direct material, direct labour, and overhead. Traditional cost systems, also called
volume based cost systems (VBC systems) trace overhead costs to the product
based on the assumption that products cause the costs. Very few allocation
bases have historically been used. The most common allocation base used in
VBC is direct labour hours. The amount of overhead allocated to a batch of
products increases linearly with the volume produced. So, it is assumed that as
volume of output increases, direct labour hours increase in a linear fashion
(Gurses, 1999: 3).
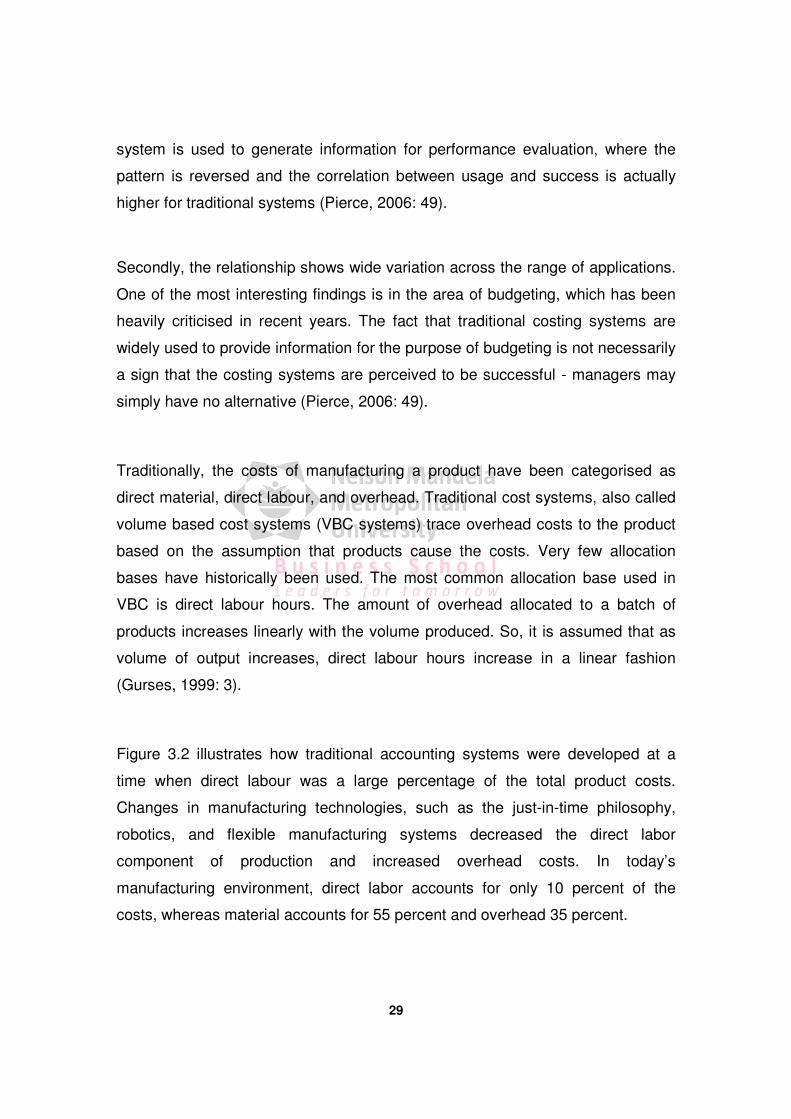
Figure 3.2 illustrates how traditional accounting systems were developed at a
time when direct labour was a large percentage of the total product costs.
Changes in manufacturing technologies, such as the just-in-time philosophy,
robotics, and flexible manufacturing systems decreased the direct labor
component of production and increased overhead costs. In today’s
manufacturing environment, direct labor accounts for only 10 percent of the
costs, whereas material accounts for 55 percent and overhead 35 percent.
30
Figure.3.2. Traditional cost allocation
(Source: Gurses, 1999: 22)
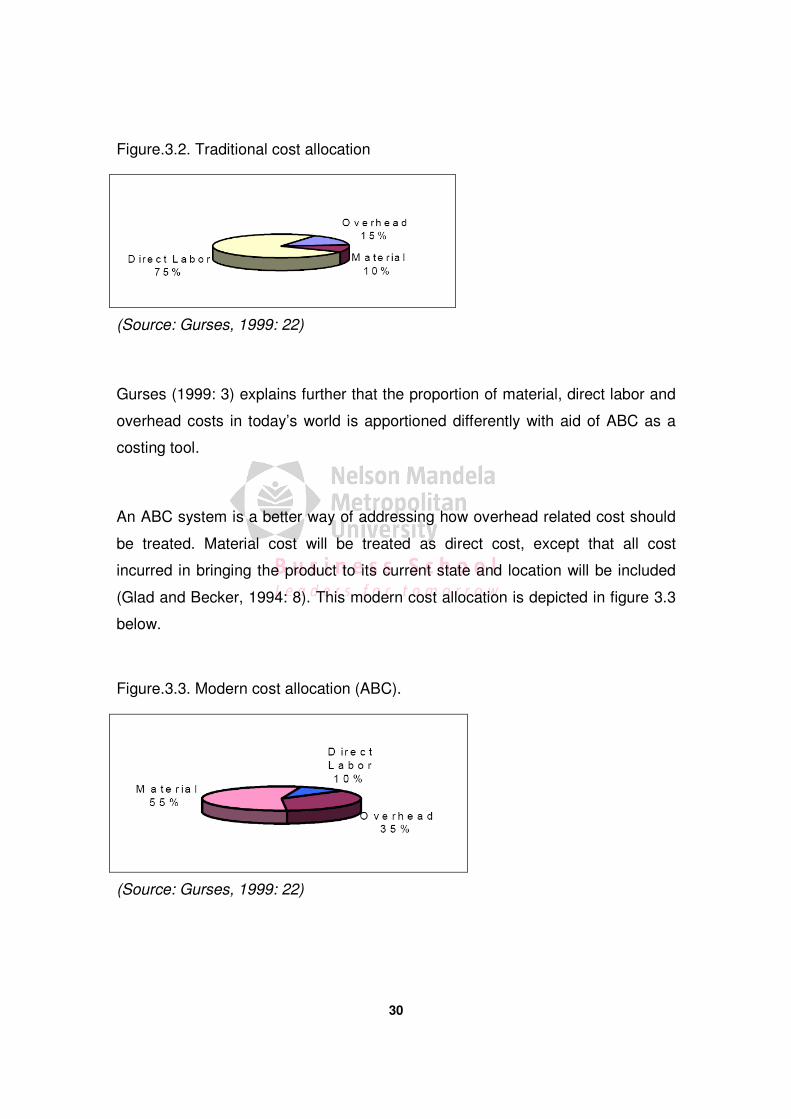
Gurses (1999: 3) explains further that the proportion of material, direct labor and
overhead costs in today’s world is apportioned differently with aid of ABC as a
costing tool.
An ABC system is a better way of addressing how overhead related cost should
be treated. Material cost will be treated as direct cost, except that all cost
incurred in bringing the product to its current state and location will be included
(Glad and Becker, 1994: 8). This modern cost allocation is depicted in figure 3.3
below.
Figure.3.3. Modern cost allocation (ABC).
(Source: Gurses, 1999: 22)
31
The solution to the product cost distortion problem is ABC. ABC provides the
information to identify the components of overhead more precisely such that
product design, development, production, and distribution decisions are better
grounded. ABC assigns resource costs to products more accurately, and as a
result it acts as a decision support tool for companies. Decisions are not
arbitrary, which is the case in traditional accounting systems, but based on facts
(Gurses, 1999: 22).
3.3 COST MANAGEMENT IN MODERN BUSINESS
Today, many financial services companies are grappling with cost pressures,
margin squeezes and sluggish topline growth. Many management teams
recognise the need to get a better handle on the profitability of various business
units within an organisation so that they can allocate scare resources more
effectively (Rafig and Garg, 2002: 1). In this section, the researcher examines,
explores the important aspects pertaining to cost management namely the value
chain, continuous cost improvement as well as what signifies quality
management in modern business.
3.3.1 Value Chain
Traditional accounting systems present summarised accounting information in
the form of manufacturing and trading accounts with other expenses summarised
as general and administrative expenses. This is a functional perspective of the
business and does not necessarily focus on the flow of business (Glad and
Becker, 1994:66).
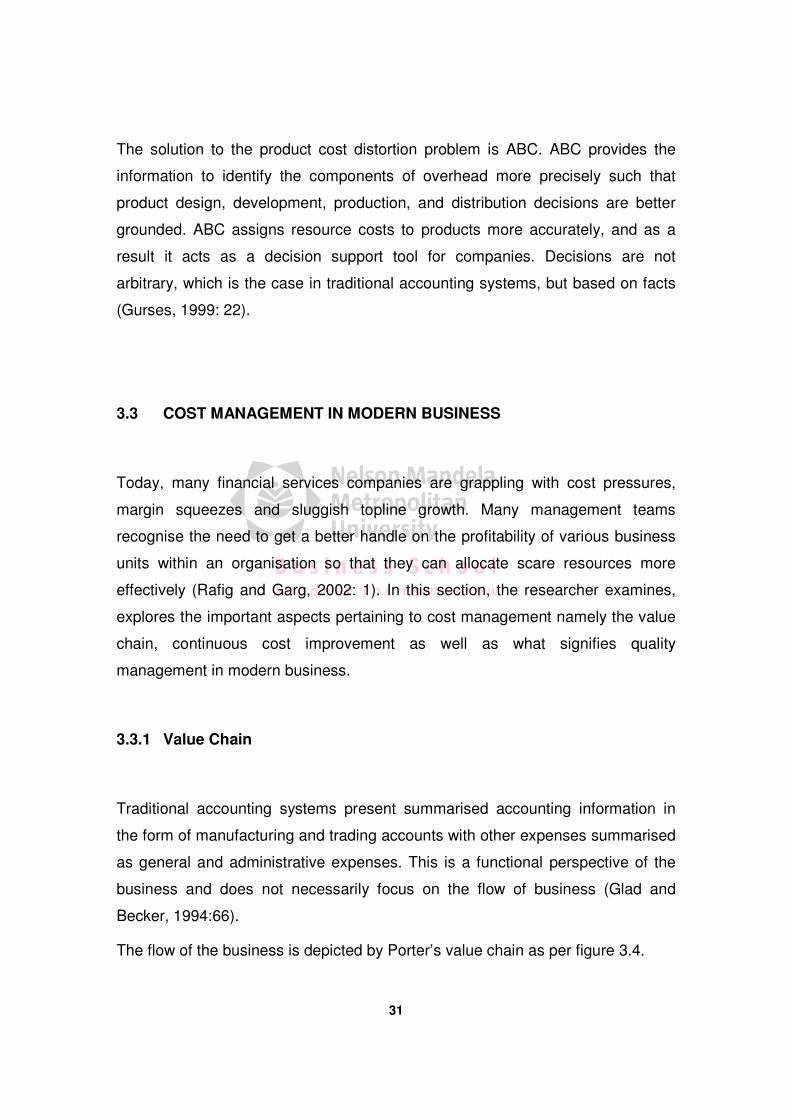
The flow of the business is depicted by Porter’s value chain as per figure 3.4.
32
Figure.3.4. The Value Chain
(Source: Porter, 1985)
Porter classifies the full value chain into nine interrelated primary and support
activities. Primary activities can be related to actions which the organisation
performs to satisfy external demands while secondary activities are performed to
serve the needs of internal customers (Glad and Becker, 1994: 13). Porter
depicts the value chain, comprising the above interrelated primary and secondary
activities. The above value chain activities can, to a greater extent, be found in
most businesses. The value chain serves as a useful mechanism to analyse an
organisation in order to determine what activities it performs to convert inputs to
outputs (Glad and Becker, 1994: 15).
Shank and Govindarajan (1993: 89) report that traditional cost analysis has
focused on the notion of value added (selling price less cost of purchased raw
materials) under the mistaken impression that this is the only area in which a firm
can influence cost. Value chain – not value added – is the more meaningful way
to explore competitive advantage.
Shank and Govindarajan (1993: 90) reiterate that because no two companies
compete in exactly the same set of value activities, value chain analysis is a
33
critical step in understanding how a firm is positioned in its industry. Building
sustainable competitive advantage requires knowledge of the value activities of
which the competitors are part of.
The authors also regard value chain analysis as relevant and imperative for all
firms and can be constructed and used by the following steps:
• Define the industry’s value chain and assign cost, revenues and assets to
each activity;
• Investigate the cost drivers regulating each value activity;
• Examine possibilities to build sustainable competitive advantage either
through controlling cost drivers better than competitors or reconfiguring the
value chain (Shank and Govindarajan.1993: 90).
Competitive advantage is affirmed as being imperative in the modern business
environment. Glad and Becker (1994:12) further emphasise that for an enterprise
to enjoy sustained competitive advantage it must carry out its activities in a more
cost-effective way that its competitors do. It is therefore clear that such an
enterprise needs to have a value chain in which:
• there are a minimum number of activities.;
• all activities are effective; and
• all activities are performed at a relatively low cost (Glad and Becker,
(1994:12).
3.3.2 Continuous Cost Improvement
According to Oakland (2000: 117) never-ending or continuous improvement is
probably the most powerful concept to guide management. It is a term not well
understood by many organisations, although that must begin to change if these
34
organisations are to survive. To maintain a wave of interest in quality, it is
necessary to develop generations of managers who not only understand but are
dedicated to the pursuit of never-ending improvement in meeting external and
internal customer needs.
The ABC system, which is compatible with the continuous improvement
philosophy, provides information about each process or activity (through which a
product moves) as a potential area for improvement, attention, and control. Since
quality can only be improved by identifying causes and reducing variations, ABC
necessitates input from all levels of workers, and it breaks down the barriers
between them. The ABC system has been recognised as the most powerful tool
in assessing the cost of not doing things right the first time (Gupta and
Baxendale, 2008: 7).
Total quality management (TQM) on the other hand has been recognised as an
important tool for achieving competitive advantage in businesses (Chinho &
Shofang, 2006: 469). According to Oakland (2000: 112) the gains of continuous
improvement and experimentation through TQM provide the basis for successful
organisational performance.
The role of management accountants has evolved from measuring and reporting
business activities to participating with other disciplines in designing and
implementing improvement initiatives. Recent years have witnessed an increase
of programs designed to increase product quality, reduce costs, and improve firm
performance. Examples include Just-in-Time (JIT), Total Quality Management
(TQM), Target Costing, Benchmarking, Process Re-engineering, Theory of
Constraints (TOC), Activity-based Costing/Management (ABC/ M), Balanced
Scorecard (BSC), Six Sigma, and Mass Customization (Albright and Lam,
2006:1)
35
3.3.3 Quality Management
Oakland (2000: 117) states that traditional performance measures and indicators
that have been derived from cost accounting information are often based on
outdated arbitrary principles. These provide little motivation to support attempts
to introduce Total Quality Management (TQM) and, in some cases, actually
inhibit continuous improvement because they are unable to map process
performance. In the organisation that is to succeed over the long term,
performance must begin to be measured by the improvements seen by the
customer. In the cycle of never-ending improvement, measurement plays an
important role in the following aspects outlined by (Oakland, 2000: 117).
• tracking progress against organisational goals;
• Identifying opportunities for improvement;
• Comparing performance against internal standards;
• Comparing performance against external standards.
Johnson and Kaplan (1987) were perhaps among the first researchers to discuss
the mismatch of traditional cost accounting measures with new manufacturing
practices. Cooper and Kaplan (1992) proposed activity based costing (ABC) as
an alternative to support the emerging management programs (e.g., total quality
management) and especially to deal with the impact of overhead on true cost
information (Gupta and Baxendale, 2008: 7).
TQM focuses on continuous improvement of the quality of products produced
and eliminating the costs associated with poor quality. The philosophy behind
TQM is that it is much more expensive to deal with the repercussions of poor
quality (detecting, fixing, customer complaints) than to prevent their occurrence in
the first place. A key measure for this practice is the Cost of Quality (COQ). This
includes prevention costs (avoiding quality issues), appraisal costs (inspecting for
36
errors or defects), internal failure costs fixing, external failure costs (customer
returns and other issues associated with defective items that were shipped)
(“Strategic cost management,” 2000). Thus, TQM focuses on reducing costs by
improving quality (Gubata, 2008).
It can therefore be argued that there exists real cost benefit from continuous
improvement techniques of which ABC forms a major part. The researcher will
now highlight the importance of improved costing in modern business with the
aim of depicting the role of costing in modern business.
3.4 BENEFITS OF IMPROVED COSTING IN BUSINESS
The range and scope of information required to optimise corporate performance
in these conditions continues to broaden, addressing diverse areas such as
markets, competitors, customers, product or service innovation, possible
strategic alliances, etc. Not only the need for externally oriented information
expands; the demand for accurate, reliable and versatile information on internal
processes, and specifically costs, also increases in these circumstances (Pierce,
2006: 1).
The quality of management decisions has been directly linked to the quality of
costing information and issues relating to costing system effectiveness therefore
become important, such as how that success is measured and what drives it
(Pierce, 2006: 1).
Cost-efficiency measures assess the degree to which costs per unit of output are
low. According to Porter (1980: 12), this strategy of cost efficiency entails that the
37
firm be constantly improving its ability to produce at costs lower than the
competition by emphasizing efficient-scale facilities, vigorously pursuing cost
reductions along the value chain driven by experience, tight cost and overhead
control, and cost minimisation (Spanos, Zaralis, and Lioukas, 2004: 1). This
strategy of cost efficiency can also provide above-average returns because it
allows the firm to lower prices to match those of competitors and still earn profits
(Hambrick, 1983; Henderson and Henderson, 1979; Miller and Friesen, 1986;
Porter, 1980, 1985). The extent that a firm succeeds in driving down costs per
unit of output, thereby increasing gross margins, should result in firm profitability,
ceteris paribus, increasing (Miller 1987; Porter 1980). Hence, cost improvement
is expected to transfer businesses' savings directly to the bottom line (Maiga and
Jacobs, 2008: 10).
Glad and Becker (1994: 80) further state that wastage does not normally feature
in a conventional accounting system and cost vanishes amongst other expenses.
Most quality management systems measure wastage and other non- quality
factors but in a physical manner. The ABC and Activity Based Management
system should help to quantify this price of non-conformance into financial terms
for integration into the costing system.
According to Turney (1991: 5) unreliable cost information is an open invitation to
disaster. And unintentional mispricing is only one of many possible disasters.
Cost information is used in making a wide range of strategic and operational
decisions. So with a flawed cost system, you are wide open for a variety of
competitive problems. The author emphasises the need for an Activity based
costing system as to combat these competitive problems. One cannot afford
competitive mistakes in today’s global economy. Companies need every possible
advantage over competitors you can get. Cost systems that send the wrong
signals can put a company on a crisis course from which recovery is difficult
(Turney, 1991: 5).
38
3.5 CONCLUSION
Chapter three has outlined costing as a general term. It has encapsulated the
very basics principles of business and the strive towards competitive advantage
and ultimately profits. Costing plays a vital role in business today. Incorrect cost
information can lead a company astray from which they may never recover. It
may lead to problems you can ill afford in today’s competitive environment. ABC
systems provide improved cost information for future decisions. It is therefore
imperative to explore ABC as the costing system for improved decision making,
better understanding of the product and customer profitability.
Chapter four will discuss Activity Based costing and Activity Based Management
in detail, fundamental concepts such as; the Theory of Constraints and
specifically ABC within ESKOM Transmission.
39
CHAPTER 4
ACTIVITY BASED COSTING AS A COST AND MANAGEMENT
STRATEGY
4.1 INTRODUCTION
Leading institutions are implementing ABC systems that allow them to better
understand resource consumption and the profitability of the products and
services they offer their customers (Capps and Timlin, 1998:1). Capps and Timlin
(1998:1) further state that ABC is a viable cost management concept for modern
businesses.
ABC is arguably one of the most written and talked about innovations in
management accounting since 1985 (Brown, Booth and Giacobbe, 2004: 44).
According to Miller (1996: 1) management information systems that track and
provide information about the horizontal aspects of business have lagged
significantly behind the needs of its managers (Miller, 1996: 1). ABC fills this
information need by providing cost and operating information that mirrors the
horizontal view (Miller, 1996: 1).
ABC’s originators recommended it for economic, normative, realist and
deterministic reasons – that is, it represents best value, accurately represents
financial events and aids rational decision-making and contracting (Hopper &
Major, 2007: 61)
40
Miller (1996: 1) further states that ABC makes cost and operating information
useful by providing value analysis, cost drivers and performance measures to
initiate, drive, or support improvement efforts and to improve decision making.
This statement is further emphasised by Gupta and Galloway (2003: 131) who
state that ABC can serve as a useful information system to support effective
decision-making processes related to quality initiatives.
According to Cooper and Kaplan (1992: 15) ABC systems have been suggested
as a management innovation that can lead to increased competitiveness and
enhanced profitability by firms (Cooper and Kaplan, 1992: 15). Since costs
associated with replacing a traditional costing system with ABC, including time
commitments by employees and management as well as direct investments in
technology and process interruptions are not insignificant, researchers and
business managers are naturally interested in whether this innovation produces
the positive financial results suggested (Cooper and Kaplan, 1992: 16).
For Innes and Mitchell (1991: 1) there are arguments for and against the value of
ABC in as much as its ability to enhance profitability in organisations.
Furthermore, the authors note that the technique suffers criticism based upon the
inability of any approach to costing to deal with the jointness of many product
costs in an organisation of any complexity and the inappropriateness of historic,
non-differential cost information for decision-making (Innes and Mitchell, 1991:
1).
The utility of ABC will be dependent on how well the system fits the
circumstances of the organisation concerned. Innes and Mitchell (1991: 1)
identify factors such as the design of the ABC system, its “fit” to the organisation
structure, the cost structure of the organisation, the diversity and complexity of
product, human relationships between accountants and others and the match
41
between the ABC system and the purpose for which it is intended, as those
which can influence the level of its success in a particular situation (Innes and
Mitchell, 1991: 1).
Turney (1991: 53) argues that knowing what activities cost, helps in identifying
important activities - those with the greatest potential for cost reduction.
Knowledge of activity cost also allows one to model the impact of cost reduction
actions and to subsequently confirm that savings were achieved. Garrison,
Noreen and Brewer (2006: 315) emphasise that ABC was originarily used to
supplement rather than replace company’s existing costing system – the official
costing system is used for preparing external financial reports and the ABC
system used for internal decision making.
This chapter focuses primarily on the ABC application, definitions and the
fundamental concepts of ABC. More specifically, the chapter deals with a basic
definition on ABC and how ABC is used and applied within modern business with
a view on cost reduction methods and effective decision-making.
4.2 ACTIVITY-BASED COSTING AS A PROCESS
4.2.1 Defining Activity-Based Costing
According to Barton and MacArthur (2003:1) ABC was originally developed by
companies to deal with the problem of product cost subsidisation in the traditional
costing system.
ABC is not the same as estimating or quoting, it provides information that makes
estimates and quoting more precise and reliable. ABC is a cost management
42
method that addresses shortcomings inherent in traditional costing methods for
handling the indirect cost (Needy and Bopaya, 2000: 31).
Turney (1991: 50) defines ABC as just an information system that allows one to
identify problems and plot safe courses to solutions and opportunities. The
author further states that ABC assumes that activities cause cost and that cost
objects create the demand for activities. ABC is a method for assigning cost and
measuring performance (Turney,1991: 51).
According to Baxendale and Spurlock (1997: 4) ABC assigns costs to products
by tracing overhead costs to "activities" (i.e., machining, production labour,
quality control, order processing, etc.). Each product is charged based on the
extent to which it used an activity. The result is a more accurate product cost,
helping management decide which products to promote and which to de-
emphasise. Some public utility customer segments, for example, demand more
of the activities than do other segments. These characteristics are not accurately
reflected in a customer segment costing approach that uses only kilowatt-hours
or labour costs as the basis for allocating these shared costs (Baxendale &
Spurlock, 1997: 4).
ABC involves identifying activities associated with specific cost objects (e.g. a
product). An activity could be, for example, a purchasing function for reordering
parts. The resources (time or labour, paper, phone, etc.) associated with this
activity are assigned a cost, and that cost is associated to the cost object (the
consumer of the activity) when it needs that activity performed. A cost driver
(what triggers the activity to be executed) is identified that links the activity with
the cost object to determine when an allocation is required (Gubata, 2008: 3).
43
It must be kept in mind that there are two basic cost accumulation methods
namely: job order costing and process costing. Garrison, Noreen and Brewer
(2006: 88) describe job order costing as a system used in situations where
different products are produced each period. Process costing being explained as
a situation where the company produces many units of a single product for long
periods. ABC is not a cost accumulation method, therefore it does not replace
these methods, but instead ABC is used to enhance the accuracy of the product
costs determined in both job cost and process cost environments (Martin, 2007:
5).
Another unique feature of ABC is that the focus of this approach is on activities
and the cost of those activities, rather than on products as in the traditional
costing systems. It is this feature of ABC that gives management the necessary
information to identify opportunities for process improvements and cost
reductions (Gurses, 1999: 9).
For the purposes of this study, the definition postulated by Glad and Becker
(1994: 26) will be used. The author defines ABC as a methodology that
measures the cost and performance of activities, resources and cost objects.
Resources are assigned to activities, then activities are assigned to cost objects
based on the use or consumption of the relevant activities. ABC recognises the
casual relationship of cost drivers to activities (Glad and Becker,1994: 26).
4.2.2 Fundamentals of ABC
The underlying assumption of ABC is quite different from that of conventional
costing. Conventional costing assumes that products cause cost. ABC is more
realistic. ABC assumes that activities cause cost and that cost objects create the
demand for activities (Turney, 1991: 51).
44
According to Garrison, Noreen and Brewer (2006: 315) only manufacturing costs
are assigned to products. Selling and administrative expenses are treated as
period expenses and not assigned to products. In ABC, products are assigned all
the overhead cost - non-manufacturing as well as manufacturing. In essence the
entire cost of the product needs to be determined.
The authors further state that ABC attempts to reflect the diverse factors more
accurately when costing products. It attempts to accomplish this goal by
identifying the major activities that consume overhead resources and thus cause
cost. An activity is any event that causes the consumption of overhead
resources. The costs of carrying out activities are assigned to the products that
cause the activities (Garrison, Noreen and Brewer, 2006: 315).
Glad and Becker (1994: 18) denote that the operations within an organisation are
executed by means of actions. Therefore, because of the great number of
actions that are normally performed, these actions are aggregated into
homogenous activities. Glad and Becker (1994: 18) define activities as:
• A physical perspective, i.e. those actions that could physically be seen to
be a homogenous group of tasks such as assembly;
• A logical perspective such as the quality perspective where all quality
related tasks are viewed as the definition of the activity and
• A cost perspective such as storage of inventories which can be viewed
from the cost driver perspective (Glad and Becker, 1994: 18).
In view of this, it becomes necessary to explore a model for ABC outlined by
Turney, 1991:81), containing two views which are regarded as important in
modern business.
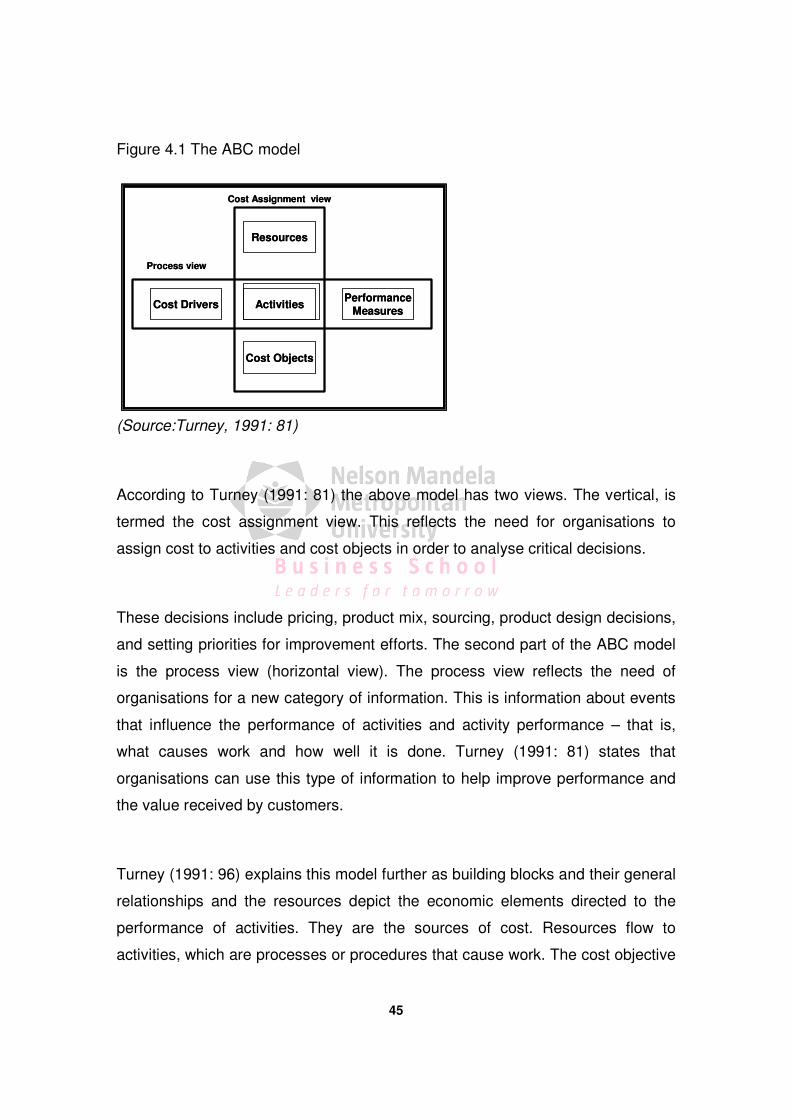
45
Figure 4.1 The ABC model
(Source:Turney, 1991: 81)
According to Turney (1991: 81) the above model has two views. The vertical, is
termed the cost assignment view. This reflects the need for organisations to
assign cost to activities and cost objects in order to analyse critical decisions.
These decisions include pricing, product mix, sourcing, product design decisions,
and setting priorities for improvement efforts. The second part of the ABC model
is the process view (horizontal view). The process view reflects the need of
organisations for a new category of information. This is information about events
that influence the performance of activities and activity performance – that is,
what causes work and how well it is done. Turney (1991: 81) states that
organisations can use this type of information to help improve performance and
the value received by customers.
Turney (1991: 96) explains this model further as building blocks and their general
relationships and the resources depict the economic elements directed to the
performance of activities. They are the sources of cost. Resources flow to
activities, which are processes or procedures that cause work. The cost objective
Resources
PerformanceMeasures
Cost Drivers Activities
Cost Objects
Process view
Cost Assignment view
Resources
PerformanceMeasures
Cost Drivers Activities
Cost Objects
Process view
Cost Assignment view
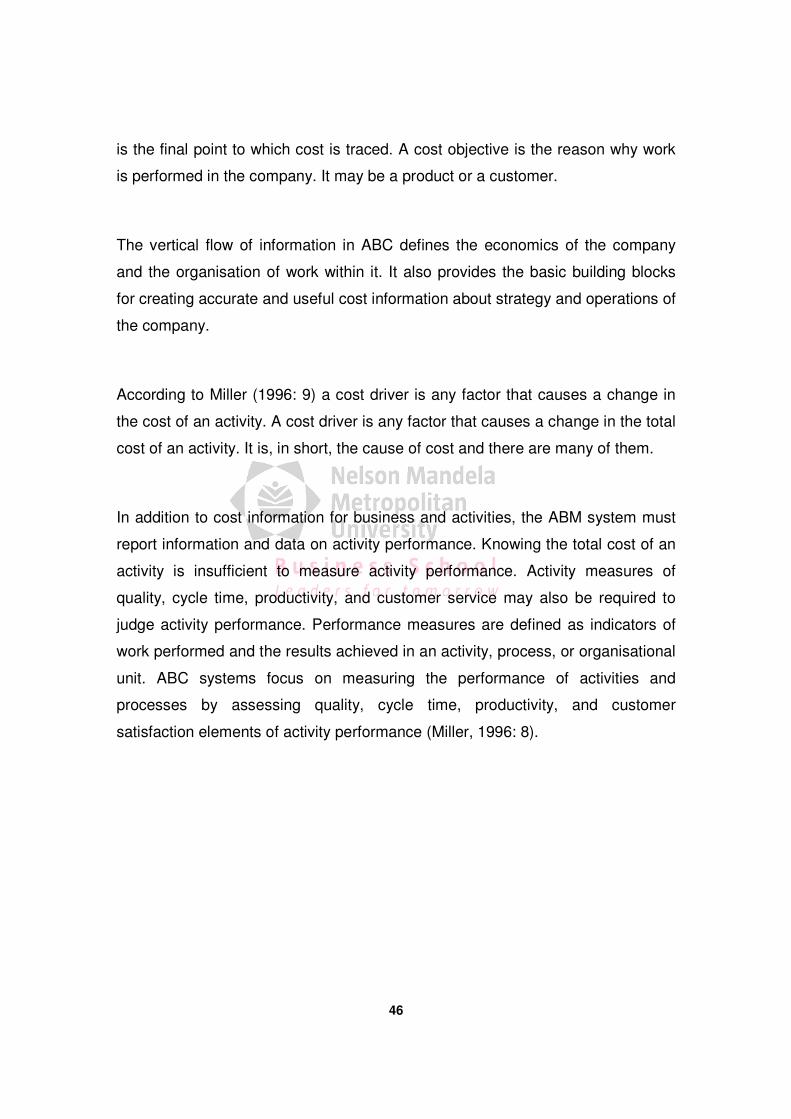
46
is the final point to which cost is traced. A cost objective is the reason why work
is performed in the company. It may be a product or a customer.
The vertical flow of information in ABC defines the economics of the company
and the organisation of work within it. It also provides the basic building blocks
for creating accurate and useful cost information about strategy and operations of
the company.
According to Miller (1996: 9) a cost driver is any factor that causes a change in
the cost of an activity. A cost driver is any factor that causes a change in the total
cost of an activity. It is, in short, the cause of cost and there are many of them.
In addition to cost information for business and activities, the ABM system must
report information and data on activity performance. Knowing the total cost of an
activity is insufficient to measure activity performance. Activity measures of
quality, cycle time, productivity, and customer service may also be required to
judge activity performance. Performance measures are defined as indicators of
work performed and the results achieved in an activity, process, or organisational
unit. ABC systems focus on measuring the performance of activities and
processes by assessing quality, cycle time, productivity, and customer
satisfaction elements of activity performance (Miller, 1996: 8).
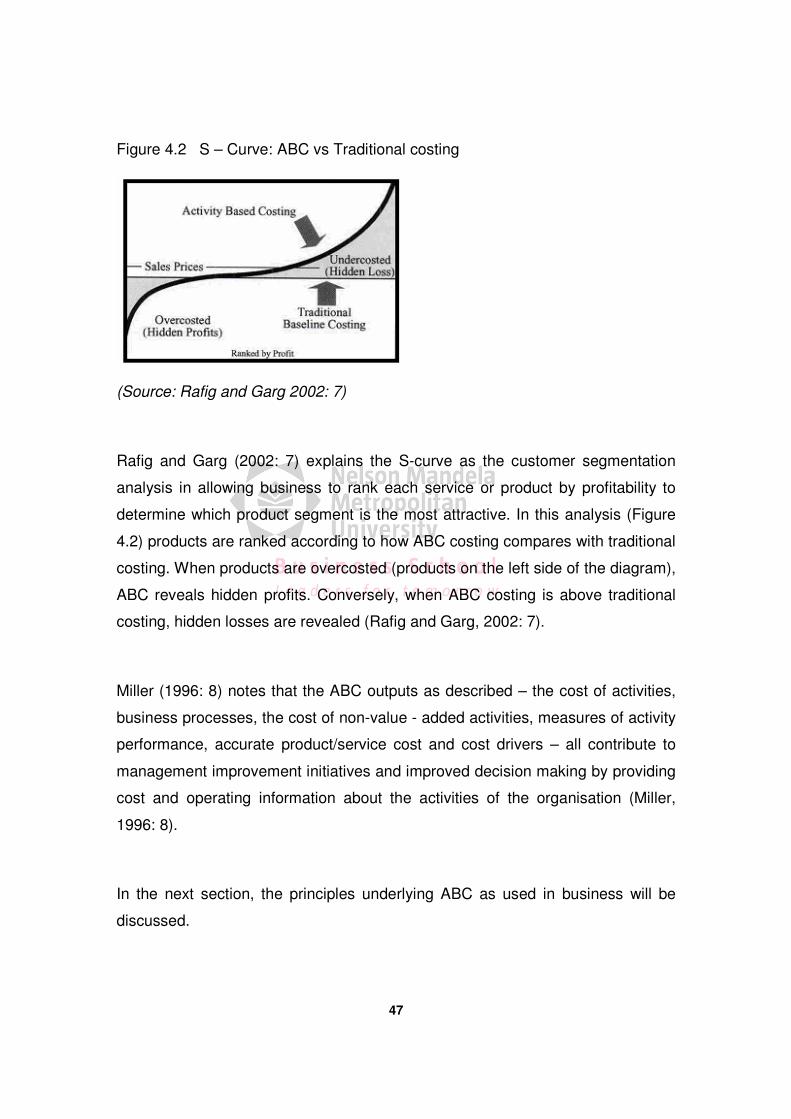
47
Figure 4.2 S – Curve: ABC vs Traditional costing
(Source: Rafig and Garg 2002: 7)
Rafig and Garg (2002: 7) explains the S-curve as the customer segmentation
analysis in allowing business to rank each service or product by profitability to
determine which product segment is the most attractive. In this analysis (Figure
4.2) products are ranked according to how ABC costing compares with traditional
costing. When products are overcosted (products on the left side of the diagram),
ABC reveals hidden profits. Conversely, when ABC costing is above traditional
costing, hidden losses are revealed (Rafig and Garg, 2002: 7).
Miller (1996: 8) notes that the ABC outputs as described – the cost of activities,
business processes, the cost of non-value - added activities, measures of activity
performance, accurate product/service cost and cost drivers – all contribute to
management improvement initiatives and improved decision making by providing
cost and operating information about the activities of the organisation (Miller,
1996: 8).
In the next section, the principles underlying ABC as used in business will be
discussed.
48
4.2.3 Principles of ABC as used in business
The ABC approach provides the potential for more accurate product costs for
management decisions concerning product planning, product design and
introduction, product design changes, product pricing, make versus buy, product
distribution, product service and product discontinuance. ABC also provides
potential benefits to many service oriented industries such as banking, insurance,
health care, and transportation (Rafig and Garg, 2002: 3).
As stipulated by Turney (1999: 68), conventional systems fail to report useful
information to the aspiring world-class company. Thus, in any business be-it
service or manufacturing industries, the following matters:
• The customer: ABC reports information about what matters to the
customer – how well each activity contributes to the needs of the
customer;
• Customer and product profitability: ABC reports accurate customer and
product cost. It does so by using more and more types of activity drivers to
assign cost to customers and products;
• Insight on how to improve: ABC supplies cost and non-financial
information about the company’s activities. This information directs
improvement efforts and provides feedback on what the improvement has
accomplished (Turney, 1999: 68).
Even the best run companies have problems and opportunities. Competition
is rife and tools are needed in business to stay ahead. The researcher will
now deal with maintenance costing as an ABC approach.
49
4.2.4 Maintenance costing as an ABC approach
An ABC methodology is basically comprised of resources, activities and cost
objects with resource drivers linking resources and activities and activity drivers
linking activities and cost objects. In the maintenance context, resources may
include maintenance and support crew, spare parts, maintenance tools and
materials and maintenance floor space. Major activities may include preventive
maintenance and unplanned or corrective maintenance. The main objective of
applying ABC approach in maintenance is to obtain accurate information on how
the shared indirect maintenance cost is assigned to each of the production
machines (Gubata, 2008: 3).
Wong and Rich (1997: 3) state that only organisations that seriously consider
good maintenance management practices realise the full benefits from doing so.
Furthermore the authors underline the importance of maintenance costing by
showing how accurate maintenance costing is important in the context of
maintenance management itself and other business analysis including the total
cost of ownership analysis and product costing. Gubata (2008: 3) supports this
sentiment stating that accurate maintenance costing will also provide a clear
metric for maintenance improvement and a means of demonstrating how
maintenance improvement activity contributes to the competitiveness of the firm.
Wong and Rich (1997: 3) further emphasise that ABC offers significant benefits
over more traditional forms of overhead and maintenance cost allocation namely
the general averaging of maintenance cost over all the assets employed or
through arbitrary depreciation methods. The first benefit lies in the identification
of activities consuming an organisation’s resources and through awareness of
these activities, the potential to improve these business processes. The second
benefit lies in the estimation of the cost of the activities by measuring the cost of
50
resources consumed to perform different activities. By doing this, management is
able to evaluate the efficiency of the business processes.
As maintenance is one of the activities in the value chain of the firm that relates
to the purchasing policy, accurate information on maintenance cost will contribute
to making a better purchasing decision. For manufacturing environments
operating different types of machines, making an accurate estimation on the
maintenance cost allocated to each machine is not trivial. The traditional cost
allocation methods use allocation bases to distribute maintenance costs among
machines, such as a uniform based allocation or price of the machine.
Unfortunately, these allocations can overestimate the costs of ‘more expensive’
machines and may not capture the complexities of ‘less expensive’ machines
(Gubata, 2008: 3).
The ABC approach presented in this paper enables managers to trace costs to
specific activities undertaken for maintenance purposes. Additional benefit of the
ABC approach is that it provides managers with much richer insight into why a
particular machine costs more than another in the maintenance context.
Ensuring proper maintenance of assets proved imperative to smooth operation,
thus by eliminating bottlenecks within systems of organisations can contribute
towards sound operations. The Theory of constraints proves to be an effective
tool in assisting organisations in identifying and eliminating such bottlenecks. In
the next section the researcher will consider the integration of ABC and the
theory of constraint.
51
4.3 THE THEORY OF CONTRAINT (TOC)
ABC, together with the TOC approach, can help to identify the bottlenecks, and
therefore, increase the throughput. The activities that have the smallest unused
capacity amounts will, most probably, form the bottleneck activities. As a result, it
can be said that ABC-based cost system provides the necessary information for
TOC. The system can also be used to perform sensitivity analysis, which will
show management the effects of the small changes in the activity levels, selling
prices, etc. on the bottom line figures (Gurses, 1999: 15).
4.3.1 Defining the TOC
According to Albright and Lam (2006: 164), Goldratt and Cox (1986) developed
the TOC which is a production-flow management system. In every system there
is one process, known as the constraint that has the least capacity or slowest
production rate. Output for the entire system is determined by the production rate
of this constraint, or bottleneck.
Huang (1999: 21) defined the theory of constraints (TOC) as a method that deals
with scheduling production through a pre-existing application that maximizes
profitability by maximising output.
TOC is a pull system which is based on identifying and optimising the bottleneck.
TOC argues production flow for the entire facility must be planned around the
constraint. TOC places safety stock in front of the constraint to minimize the
possibility of unscheduled downtime. Thus, TOC results in higher constraint
utilization and greater throughput levels. An additional advantage of safety stock
52
is that unexpected changes in stock levels are a signal of problems in the
production process (Albright and Lam, 2006: 164).
The interesting thing about TOC is that it moves always from the traditional
practice of focusing on costs, and instead improves the ability of the company to
optimise its moneymaking capabilities. In the course of this, relevant cost
reduction naturally takes place. The strength of TOC is in its simplicity (in
concept, if not in implementation) and the focus it creates within an organisation
to streamline its value chain processes. Unlike ABC, which focuses on allocating
overhead costs to identify inefficiencies, TOC lumps all overhead costs into one
bucket and doesn’t worry about allocation at all (Gubata, 2007: 5).
4.3.2 Integrating ABC and TOC
ABC together with the theory of constraints philosophy TOC and mathematical
programming, can provide management with more accurate information about
the optimal product mix of a company and can help to identify the right
bottlenecks that should be focused on to improve the system (Holmen, 1995: 23).
Holmen (1995: 23) posits that claims that ABC is superior to the TOC are
unfounded since the two management accounting tools cannot be compared
because they are based on different sets of assumptions. At first glance, the two
concepts appear to be at odds with one another. For instance, proponents of
TOC disagree with the claims of ABC advocates that problems in decision
making are caused of distortions in product costs. Such disagreements are
understandable considering that the assumptions of the two cost paradigms have
different time horizons. ABC has a long-run time horizon; therefore it assumes
that production capacity is permanent. On the other hand, TOC has a short-time
53
horizon, meaning that it assumes that costs will increasingly become variable.
ABC and TOC can be used side by side. The key is for management
accountants, is to determine which one works well for what set of circumstances
(Holmen, 1995: 23).
Holmen (1995: 24) further argues that ABC and TOC are based on different time
horizons. They have different assumptions about labour and overhead costs and
production capacity. These assumptions are valid depending on the time horizon.
In the short-run, labour and overhead costs and capacity can be considered
fixed. Under these circumstances, TOC can give the right information. However,
in the long-run, all costs tend to be variable and the capacity of a plant can be
either increased or decreased depending on the level of demand. Since the
assumptions of ABC are long-term oriented, it can reflect the expected costs of a
company correctly in this time frame. Since ABC and TOC are valid in different
time horizons, they can complement each other (Holmen, 1995: 24).
Gupta and Baxendale (2008: 12) state that ABC and TOC can be considered
complementary rather than conflicting or contradictory. The authors further states
that both of these approaches only provide information. Informed management
action using that information is necessary to increase the profitability of a
company. It also is believed that combining ABC and TOC approaches would
permit companies to answer traditional cost-volume-profit questions, facilitate the
evaluation of profitable product lines, and estimate the bottom-line figures more
accurately (Gupta, 2007: 12).
Huang (1999: 21) discusses three kinds of integration situations to combine ABC
and TOC principles:
• Short-term decision back (TOC) and long-term decision foundation (ABC).
The TOC is considered a useful short-term tool because costs are fixed;
meaning improving profitability is only accomplished by increasing
54
throughput. Thus, performance is measured by effectiveness as opposed to
efficiency, which is the traditional focus of standard costing. Short-run
decisions require management to accurately measure the effects produced by
alternative changes in inputs. While ABC is used primarily as a technique to
improve long-run decisions by improving product selection and mix, facility
size, and location in which all costs are considered variable. The economic
concept of short-run versus long-run depends on the expansion or contraction
of capacity within a production facility. The TOC and ABC is best applied in
their respective ranges (short-run & long-run) and not suited to the middle
range of decision types that involve a mix of fixed and variable elements.
Huang (1999: 21) comments that a possible solution to middle range
decisions is to use direct costing for continuous product costing and for
financial reporting along with ABC. This then does not violate ABC’s
proportionality assumptions (Huang,1999: 21).
• Mixed-Integer Programming Model. According to Huang (1999: 21) this
optimizes an objective function subject to constraints with continuous and
integer variables. An objective function is used to describe an organizational
goal while a second set of equations are used to model constraints that limit
of the objective. Once formulated, an algorithm is used to solve the resulting
set of equations. An algorithm provides variables that maximize objective
functions, maximize slack variables that measure excess resources of non-
constrained activities, and maximize the value of the objective function
(Huang, 1999: 21).
• TOC and ABC and Cycle-Time Management. Managing cycle times blend
ABC and the TOC. Once cycle times are broken into short intervals they
become manageable for processes associated with products, customer
orders, or batch goods. Managing cycle times by the TOC and ABC can be
done through various processes. One such process is to increase productivity
55
and then perform cost-benefit analysis. The TOC helps to increase
productivity by reducing cycle time without adding capacity and enables
timely delivery, increasing throughput in firms that have internal
manufacturing, and lowering average fixed costs per unit in the short-run
(Huang, 1999: 21).
In conclusion, Huang (1999: 21) makes a point that by taking advantage of
integrating the TOC and ABC a firm will attain quality decision-making.
ABC and TOC can be used side by side. The key is, for management
accountants to determine which one works well for what set of circumstances.
TOC as a tool for effective ABC will now be discussed in the quest towards
sound decision making.
4.3.3 TOC as a tool for effective ABC
Gubata (2008: 3) posits that the interesting thing about TOC is that it moves
always from the traditional practice of focusing on costs, and instead improves
the ability of the company to optimise its moneymaking capabilities. In the course
of this, relevant cost reduction naturally takes place. The strength of TOC is in its
simplicity (in concept, if not in implementation) and the focus it creates within an
organization to streamline its value chain processes (Gubata, 2008: 3).
Huang (1999: 23), describes the integration of ABC and the TOC as opposing
views of the nature of product costing. Product costing from an ABC perspective
assumes all costs are traceable to products and vary in proportion to certain cost
drivers. From a TOC perspective, costs are fixed and sunk relative to product
choices and production-level decisions. Thus, ABC cost information is inputted
into the TOC for product-mix decisions (Huang, 1999: 23).
56
The author states further that the TOC is considered a useful short-term tool
because costs are fixed and this means that improving profitability is only
accomplished by increasing throughput. Thus, performance is measured by
effectiveness as opposed to efficiency, which is the traditional focus of standard
costing. Short-run decisions require management to accurately measure the
effects produced by alternative changes in inputs (Huang, 1999: 24).
While ABC is used primarily as a technique to improve long-run decisions by
improving product selection and mix, facility size, and location in which all costs
are considered variable. The economic concept of short-run versus long-run
depends on the expansion or contraction of capacity within a production facility.
The TOC and ABC is best applied in their respective ranges (short-run & long-
run) and not suited to the middle range of decision types that involve a mix of
fixed and variable elements (Huang, 1999: 25).
Effective management of activities prove to be imperative as business strive to
implement ABC systems effectively. The researcher will now discuss effective
ABM.
4.4 EFFECTIVE ACTIIVITY-BASED MANAGEMENT (ABM)
Player and Keys (1999: 34) explain that those who look deeply into ABM will find
an area of management that will empower them with solid information about their
organisation that enables them to exercise leadership and wisdom in decision
making.
ABM is the management and control of a firm’s performance using ABC
information as the focus for decision-making. ABM is broken into several steps
notably planning, education and awareness, process/activity definition, data
57
collection, performance improvement techniques, planning the ongoing system,
and implementation (Huang, 1999: 25).
Campi (1992: 5) states that ABM requires a re-education of the organisation from
the top to the bottom. Activities are the common denominator in the business
process analysis. The author clarifies that only universal measures for global
competition today involve the time and resource consumption of activities that
support business processes. ABM is thus a total cost management approach
(Campi.1992: 5).
4.4.1 Understanding ABM and its importance
ABM supports excellence by providing a formal management system that
compels people to understand their work and how it contributes to achieving
strategic objectives" ABM changes traditional management practices to guide
managers to emulate best practices and establish process controls to ensure
consistently good performance (Brimson, 2008: 4).
Activity Based Management supports the quest for continuous improvement by
providing managers with new insights into customers of activities and business
processes and by permitting managers to adopt management practices with new
insights into customers of activities and business processes and by permitting
managers to adopt management practices that encourage greater value added
by all associates. Activity Based Management is the effective planning of the
enterprises activities and the achieving of consistency in performance of activities
to achieve its objectives (Brimson, 2008: 6).
Johnson (1990: 26) is of the opinion that ABM tools fail to guide companies
toward competitiveness and long-term profitability, because they do not generate
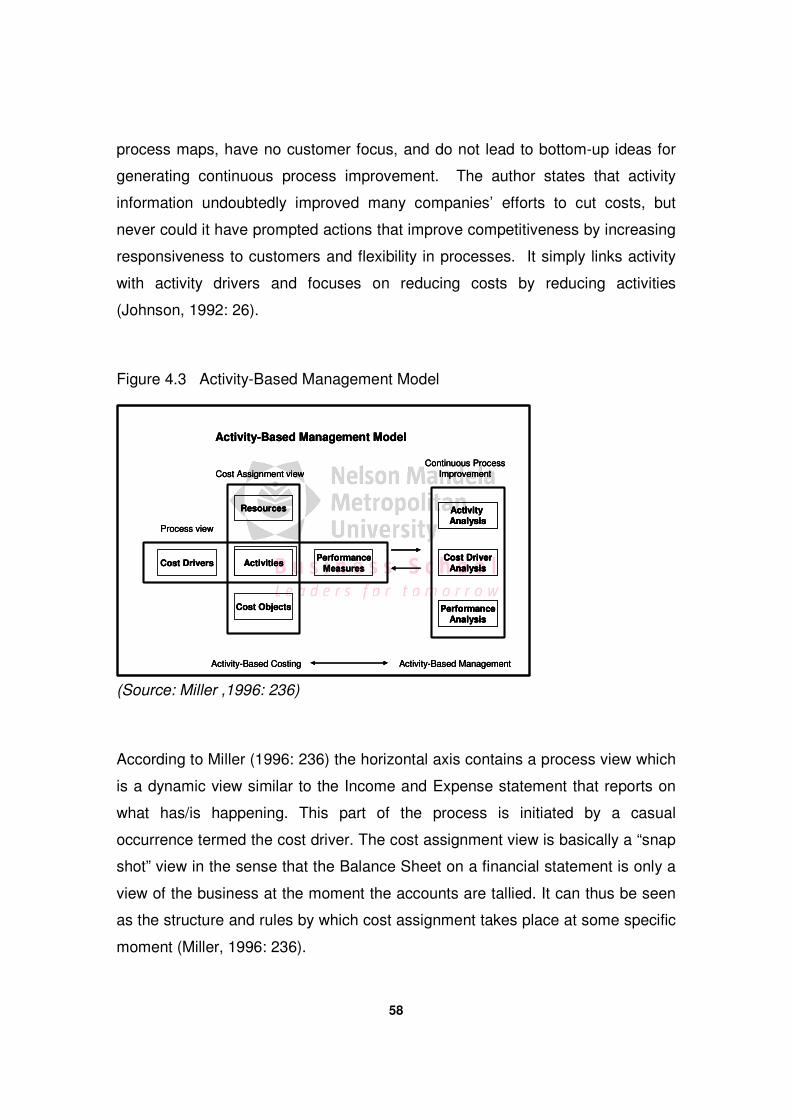
58
process maps, have no customer focus, and do not lead to bottom-up ideas for
generating continuous process improvement. The author states that activity
information undoubtedly improved many companies’ efforts to cut costs, but
never could it have prompted actions that improve competitiveness by increasing
responsiveness to customers and flexibility in processes. It simply links activity
with activity drivers and focuses on reducing costs by reducing activities
(Johnson, 1992: 26).
Figure 4.3 Activity-Based Management Model
(Source: Miller ,1996: 236)
According to Miller (1996: 236) the horizontal axis contains a process view which
is a dynamic view similar to the Income and Expense statement that reports on
what has/is happening. This part of the process is initiated by a casual
occurrence termed the cost driver. The cost assignment view is basically a “snap
shot” view in the sense that the Balance Sheet on a financial statement is only a
view of the business at the moment the accounts are tallied. It can thus be seen
as the structure and rules by which cost assignment takes place at some specific
moment (Miller, 1996: 236).
Resources
Performance
MeasuresCost Drivers Activities
Cost Objects
Activity-Based Management Model
Activity Analysis
Cost Driver
Analysis
PerformanceAnalysis
Continuous ProcessImprovement
Activity-Based Costing Activity-Based Management
Cost Assignment view
Process view
Resources
Performance
MeasuresCost Drivers Activities
Cost Objects
Activity-Based Management Model
Activity Analysis
Cost Driver
Analysis
PerformanceAnalysis
Continuous ProcessImprovement
Activity-Based Costing Activity-Based Management
Cost Assignment view
Process view
Resources
Performance
MeasuresCost Drivers Activities
Cost Objects
Activity-Based Management Model
Activity Analysis
Cost Driver
Analysis
PerformanceAnalysis
Activity Analysis
Cost Driver
Analysis
PerformanceAnalysis
Continuous ProcessImprovement
Activity-Based Costing Activity-Based Management
Cost Assignment view
Process view
59
Figure 4.3 depicts the key relationship between ABC, and the management
analysis tools that are needed to bring full realisation of the benefits of ABC to
the organisation. ABC is a methodology that can yield significant information
about cost drivers, activities, resources and performance measures. However,
ABM is a discipline that offers the organisation the opportunity to improve the
value of its products and services (Miller, 1996: 236). ABM impacts ABC through
various analyses as depicted in Figure 4.3 on the continuous improvement view.
The importance of ABM when implementing an ABC system cannot be denied
and should be used put to use in the drive towards continuous improvement in
business. In this regard, ABM in performance systems thus needs to be
explored.
4.4.2 The role of ABM in performance management systems
According to Gupta, Baxendale (2008: 11) the ABM system, which is compatible
with the continuous improvement philosophy, provides information about each
process or activity (through which a product moves) as a potential area for
improvement, attention, and control. Since quality can only be improved by
identifying causes and reducing variations, ABM necessitates input from all levels
of workers, and it breaks down the barriers between them.
The ABM system has been recognised as the most powerful tool in assessing
the cost of not doing things right the first time. The ABM system highlights this
area by attaching cost to activities to quantify the quality cost through quality
measurement system that are comprised of (Gupta, Baxendale, 2008: 11).
Miller (1996: 8) states that in addition to cost information for business processes
and activities, the ABM system must report information and data on activity
performance. Knowing the total cost of an activity is insufficient to measure
60
activity performance. Activity measures of quality, cycle time, productivity, and
customer service may also be required to judge activity performance. Activity-
based management systems focus on measuring such performance of activities.
Measuring the performance of activities provides a scorecard to report how well
improvement efforts are working and is an integral part of continuous
improvement (Miller, 1996: 8).
ABM includes the strategic cost information provided by ABC for decisions such
as product introduction, product pricing, and make versus buy, product
discontinuance and investment management. But ABM also includes non-
financial, process oriented information needed to measure and monitor the
sources of competitive value (Martin, 2007: 2).
The importance of linking ABC to ABM is important as ABM is management
analysis that brings the full benefit of ABC to the organisation. The two concepts
guide organisational efforts to adapt business strategies to better meet
competitive pressures and improve business operations.
4.4.3 The importance of linking ABM and ABC
ABC and ABM are made for each other. ABC supplies information needed to
manage activities for business improvement. ABM uses information in various
analyses designed to yield improvement. Figure 4.4 shows this relationship. ABC
is in the center, at the heart of activity-based management. ABM encircles ABC,
drawing its power from the ABC data base (Turney, 1991: 140).
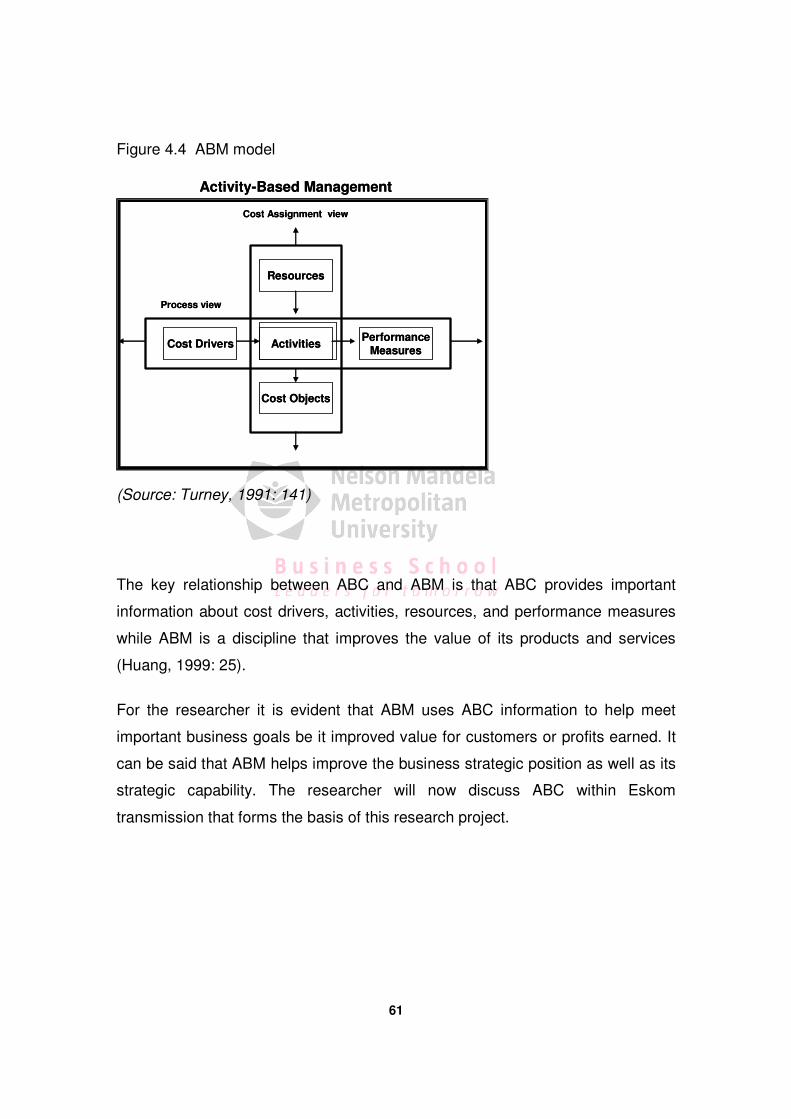
61
Figure 4.4 ABM model
(Source: Turney, 1991: 141)
The key relationship between ABC and ABM is that ABC provides important
information about cost drivers, activities, resources, and performance measures
while ABM is a discipline that improves the value of its products and services
(Huang, 1999: 25).
For the researcher it is evident that ABM uses ABC information to help meet
important business goals be it improved value for customers or profits earned. It
can be said that ABM helps improve the business strategic position as well as its
strategic capability. The researcher will now discuss ABC within Eskom
transmission that forms the basis of this research project.
Resources
PerformanceMeasures
Cost Drivers Activities
Cost Objects
Activity-Based Management
Process view
Cost Assignment view
Resources
PerformanceMeasures
Cost Drivers Activities
Cost Objects
Activity-Based Management
Process view
Cost Assignment view
62
4.5 ABC WITHIN ESKOM TRANSMISSION
ESKOM Transmission currently employs an accounting software system called
SAPR3. This system (SAPR3) makes provision for the use of an Activity based
costing system to be utilised. It is believed that Eskom Transmission and
Transmission Southern Grid in particular are following an activity based costing
approach. The foundation of this research is to ascertain the use of such
system’s effective contribution towards decision-making and any shortcomings
that might exist.
Maintenance and labour are seen as the main cost drivers in this service related
industry. Over the years ABC has made a significant contribution towards cost
reduction and decision-making however, the question exists if ABC has been
properly implemented, exercised and applied.
A model that will follow, depicts Eskom Transmissions current status from
initiation through to utilisation of the ABC system.
According to Innes and Mitchell (1991: 21) the value of regular cost reports for
maintenance remains imperative as each asset can be seen as an individual cost
driver. This direct attention on those machines/assets, which suffer the greatest
maintenance cost, will be useful in focusing preventative maintenance effort, and
capital investment strategy.
Cost of maintenance in the electricity supply industry is primary. ABC work in this
area initially followed a similar pattern to that described for material related
overhead, but found to have a significant common cost driver i.e. the incidence of
asset breakdown and preventative maintenance (Innes and Mitchell, 1991: 21).
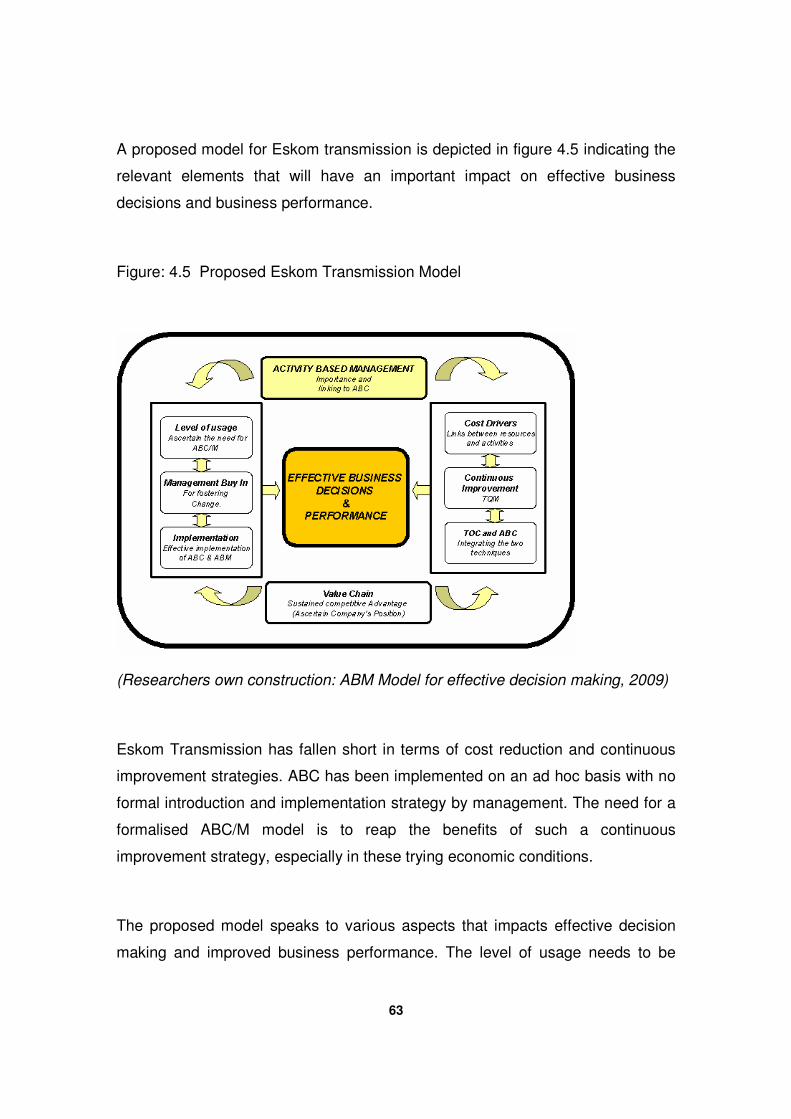
63
A proposed model for Eskom transmission is depicted in figure 4.5 indicating the
relevant elements that will have an important impact on effective business
decisions and business performance.
Figure: 4.5 Proposed Eskom Transmission Model
(Researchers own construction: ABM Model for effective decision making, 2009)
Eskom Transmission has fallen short in terms of cost reduction and continuous
improvement strategies. ABC has been implemented on an ad hoc basis with no
formal introduction and implementation strategy by management. The need for a
formalised ABC/M model is to reap the benefits of such a continuous
improvement strategy, especially in these trying economic conditions.
The proposed model speaks to various aspects that impacts effective decision
making and improved business performance. The level of usage needs to be
64
established first in determining the need for the use of an ABC system within the
organisation. Secondly management buy in is crucial as this forms the backbone
for effective implementation. Management buy in is most crucial in the success of
ABC implementation. Garrison and Noreen (2000: 325) argue that top
management is needed as it is difficult to implement changes in an organisation
without their full support, and to make sure the system is used for its intended
purpose.
The effective implementation of ABC is the next step which involves establishing
the requirements and financial position of the business. ABC is an evolving
discipline that requires substantial professional judgment and creativity if it is to
be successfully implemented. Nevertheless, the effort can translate cost data into
a reliable information source that management can employ to make sound
decisions (Whittaker, 2005: 2).
Fourthly, the value chain is a critical process in establishing the firm’s position in
the industry and its competitive advantage. The value chain speaks to these
elements as primary activities need to be identified to supply the needs of
customers in the quest towards competitive advantage. Once this is established,
the value chain further contributes towards continuous improvement strategies
such as TOC, TQM and ABC as stipulated in this figure. Lastly, integrating TOC
and ABC is a sound principle as this ensures emphasis on both short term and
long term constraints towards improved decision making.
As indicated in the literature, the various elements such as management buy-in
and sound implementation need to be taken cognisance of. The various
continuous improvement aspects such as TOC, TQM and the importance of cost
drivers form an integral part of the process towards much desired sound decision
making and business performance
65
There exists a strong linkage between ABM and the various elements depicted in
figure 4.5. Initial need, buy in and implementation are interrelated and precedes
each other.
4.6 CONCLUSION
ABM focuses on the effective restructuring of work to achieve lasting cost
reductions through the use of ABC. This involves reducing time and effort to
perform activities, eliminating unnecessary activities and deploying resources
made available by improvement efforts. These efforts are likely to improve quality
as they reduce cost.
ABM as a management strategy brings information empowerment to a business
aspiring world class status. It puts ABC information in the hands of people doing
the improvement and analysis of this information increases their power to
improve.
ABC & ABM’s process and activity analysis is one of the most powerful tools at
the disposal of management. It facilitates proper visibility of an organisation’s
processes and activities leading to a better understanding of the business.
Chapter 4 dealt with ABC and ABM as a cost strategy for business, the study will
now attempt to confirm the value and relevance of ABC and as an effective
instrument towards better decision making and performance in business.
Chapter five will deal with the methodology of this study.
66
CHAPTER 5
RESEARCH METHODOLOGY
5.1 INTRODUCTION
Gupta and Baxendale (2008: 11) state that when a business is in economic
recession, the company will learn to survive by reviving itself by adopting new
techniques or innovations. Accurate information is imperative if a company wants
to seize competitive advantage. ABC, which is an advanced management
accounting system, focusing on accuracy of product costs, is claimed to be able
to provide such accurate information for effective decision making and business
performance (Chongruksut, 2002: 97).
The framework for the empirical research was provided in chapters two, three
and four which formed the literature study for this research. The focus of this
chapter is on the research instruments which were central to the gathering of
data for this study. This includes, amongst others, a discussion on the research
concerning the measuring instruments, reasons for selecting a questionnaire as
a quantitative instrument as well as focus group discussions and semi-structured
interviews as qualitative instruments. The construction of question items is
provided and the format of the final questionnaires is included. This chapter also
outlines how the sample was determined and how the questionnaires were
distributed.
The objective of this study as indicated in Chapter one pg 1 was to:
67
Determine the importance of ABC for improved costing at ESKOM Transmission
Southern Grid;
Investigate the importance of ABM and ABC for improved business decisions
making ;and
Suggest how ABC and ABM can be utilized at ESKOM Transmission in the
pursuit of improved business performance.
The purpose of this chapter is to identify the research methodology most
appropriate to address the research problem: measuring the impact of ABC and
ABM as decision making tools on effective business performance within Eskom
Transmission Southern Grid. This will be done by discussing the research design
and methodology and outlining the population and sampling techniques
employed to gather data for this investigation.
What follows in the next section is a discussion on the research design for this
study.
5.2 RESEARCH DESIGN
To operationalise the objectives of this study, it is important to explore the
research design which forms the framework of the investigation.
Research design refers to the strategy to integrate the different components of
the research project in a cohesive and coherent way. Feng (2006: 8) posits that
research design may be regarded as a means to structure a research project in
order to address a defined set of questions. According to Adams and
Schvaneveldt (1985: 103) “research design refers to a plan, blueprint or guide for
68
data collection and interpretation – a set of rules that enables the investigator to
conceptualise and observe the problem under study”.
Research design is the general strategy a researcher will follow to solve the
research problem, in that it provides the overall structure for the chosen
procedures (Leedy and Ormrod, 2005: 85).
The research design for this study may be conceptualised as follows:
The research will be conducted at ESKOM Transmission, Southern Grid in Port
Elizabeth. As outlined in Chapter 2, this division of ESKOM is responsible for the
transportation of bulk electricity and maintenance of key assets. To yield data for
this investigation, a mixed - method design will be used for data collection. This
involves employing a combination of quantitative and qualitative techniques
which minimises the weaknesses of a single approach thus increasing both the
reliability and validity of the data. To this end, a purposive sample will be drawn
from the population which include middle managers, engineers and finance staff
at ESKOM Transmission Southern Grid. A questionnaire will be administered to
this representative sample and focus group interviews as well as semi-structured
interviews will be conducted.
The researcher will now provide a brief description of the sampling technique
employed in this study.
69
5.3 POPULATION AND SAMPLE SELECTION
Blaikie (2003: 161) defines a population as an aggregate of all units or cases that
conform to some designated set of criteria. Population elements are single
members or units of a population; they can be such things as people, social
actions, events, places or times. A population is defined according to the
purposes of the research being undertaken. It can be whatever the researcher
needs it to be (Blaikie, 2003: 161).
The target population of this study comprised professionals (managers,
engineers and technicians) of all races who have been with the company for
more than three years. Purposive sampling was used as the researcher identified
these professionals employed by ESKOM in the Transmission division, Southern
Grid in Port Elizabeth.
According to Scott and Morrison (2006: 219) sampling refers to the activities
involved in selecting a subset of persons or things from a larger population, also
known as a sampling frame. Methods used to select the sample will determine
the nature and validity of the findings that are generated form the study of that
sample.
Christensen (2001: 198) defines representative sampling as the sample where
participants have the same characteristics as the people in the population.
For the purpose of this study, a purposive sample will be drawn from a population
of eleven middle managers, fifteen engineers and fifteen finance staff.
Christensen (2001: 198) believes this technique to be valid as it provides a
sample that is representative of the population.
70
Purposive sampling was used for this study. A purposive sample of managers
was selected for this study. From the sample, ten middle managers and twelve
engineers were selected at ESKOM Transmission Southern Grid in Port
Elizabeth to complete the questionnaire. Focus groups interviews with seven
engineers and semi-structured interviews with seven finance staff were also
conducted. The research methodology will be presented in the next section.
5.4 RESEARCH METHODOLOGY
According to Leedy and Ormrod (2005: 12) this refers to the researcher’s general
approach in carrying out the research project. The approach taken normally
indicates which research strategies or tools need to be selected. The term
method is used to indicate which approach the researcher decides to follow in
gathering and analysing the data.
Collis and Hussey (2003: 53) identify a continuum comprising two main research
paradigms, namely the positivistic paradigm which signifies quantitative research
method and the phenomenological paradigm which signifies the qualitative
method.
The positivistic approach attempts to explain social phenomena by establishing a
relation between variables which are information converted into numbers. The
phenomenological paradigm suggests that social reality lies within the unit of
research, and that the act of investigating the reality has an effect on that reality.
This paradigm pays considerable regard to the subjective state of the individual
(Collis and Hussey, 2003: 54)
71
The research method for this study includes a combination of qualitative and
quantitative research.
A discussion on the two approaches will now be presented.
5.4.1 Positivistic paradigm
Historically the positivistic paradigm (quantitative research) in the social sciences
is based on the approach used in the natural sciences, such as biology, botany
and physics. The positivistic approach seeks the facts or causes of social
phenomena, with little regard to the subjective state of the individual. Thus logical
reasoning is applied to the research so that precision, objectivity, and rigour
replace hunches, experiences, and intuition as the means of investigating
research problems. Positivism is founded on the same way as studies conducted
in the natural sciences. It is based on the assumption that social reality is
independent of us and exists regardless of whether we are aware of it (Collis &
Hussey, 2003: 84).
Sutter (1998: 87) describes quantitative research as studies that test specific
hypotheses, usually stated in advance, and that incorporate measures which can
be analysed statistically. This type of research, the author states, uses tables or
charts to display findings which can be generalised beyond the sample to a wider
population. The researcher is distant in a sense, and guards against bias and
other influences which may skew the results.
The primary characteristic of positivistic research is that it is a descriptive type of
research where the goal is to attempt to provide an accurate description or
picture of a particular situation or phenomenon. This approach attempts to
72
identify variables that exist in a given situation and, at times to describe the
relationship that exists between variables (Collis & Hussey, 2003: 86).
Winberg (1997: 30) states that quantitative research feels like proper research
and it can be very satisfying to do. The methods and approaches are clear and
usually involve the following steps:
• Pose of the research question;
• Gather data relevant to the research question;
• Systematise or order the data in ways that makes sense to the researcher;
• Analyse the data and
• Come to conclusions, and or make recommendations, based on the research
findings.
Essentially, positivists look for the existence of a constant relationship between
events, or between two variables. The positivist notion is that science becomes
credible and possible because every scientist looking at the same bit of reality
sees the same thing. However, it has been amply demonstrated that what
observers ‘see’ is not determined simply by the characteristics of the thing
observed; the characteristics and perspective of the observer also have an effect
(Robson, 2002: 21).
For the purpose of this study the researcher selected a structured questionnaire
which was administered to ten middle management and twelve engineers as the
research instrument for the quantitative method.
73
The focus now turns to the phenomenological paradigm as the other method
used to gather data for this investigation.
5.4.2 Phenomenological paradigm
The phenomenological paradigm is also known as the qualitative research
method to data collection. Qualitative research is an imperative, multi-method
approach that investigates people in their natural environment (Denzin & Lincoln,
2003). This definition has three primary components that are essential to
understanding the nature of qualitative research. The first component is that
qualitative research is interpretative. The second component is that qualitative
research is multi-method. This means that a variety of methods are used to
collect data. The third component is that it is conducted in the field or in the
person natural surroundings, such as a school classroom, the playground, a
board meeting, or a therapy setting (Christensen, 2001: 51).
Robson (2002: 175) reiterates that phenomenological approaches to qualitative
research stress the importance of reflexivity, i.e. an awareness of the ways in
which the researcher as an individual with a particular social identity and
background has an impact on the research process. They take the view that
‘the ability to put aside personal feelings and preconceptions is more a function
of how reflexive one is rather than how objective one is because it is not
possible for researchers to set aside things about which they are not aware.
Phenomenological research focuses on the subjective experience of the
individuals studies. What is their experience like? How can one understand and
describe what happens to them from their own point of view? As the term
suggests, at its heart is the attempt to understand a particular phenomenon.
Phenomenology also had a major influence on the general development of
74
qualitative methodology (Robson, 2002: 195). The idea of qualitative research is
to purposefully select informants (or documentation or visual material) that will
answer the research question. Qualitative research thus requires that the data to
be collected must be rich in description of people and places (Thomas, 2003:
65).
De Vos (2005: 357) describes qualitative research as a “multi- perspective
approach (utilizing different qualitative techniques and data collection methods)
to social interaction, aimed at describing, making sense of, interpreting or
reconstructing this interaction in terms of the meanings the subject attach to it”
Van Maanen (1993) is of the opinion that qualitative data is “rich, full, earthy,
holistic,” real”; their face validity unimpeachable, they preserve chorological flow
where that is important and suffer minimally from retrospective distortion; and
they, in principle, offer a far more precise way to asses causality in organisational
affairs” .
Qualitative research is inductive rather than deductive. Qualitative researchers
develop their understanding in the course of the research process; they don’t
collect data in order to support preconceived hypotheses or theories. In
qualitative methodology the researchers looks at people in their contexts. The
contexts can include people’s past as well as the situations in which they
currently find themselves. People are not reduced to variables in qualitative
research. Qualitative methods allow researchers to stay close to the real or
empirical world (Winberg, 1997: 41).
For the purposes of this study, focus group interviews were conducted with
engineers and semi-structured interviews with seven finance staff at ESKOM
Transmission Southern Grid in Port Elizabeth. Welman, Kruger and Mitchell
75
(2005: 201) state that focus groups are also described as group in-depth
interviews. These groups consist of a small number of individuals or
interviewees who are drawn together for the purpose of expressing their opinions
on a specific set of open questions.
Focus group interviews are essentially a qualitative technique for collecting
information. The researcher directs the interaction and inquiry either in a very
structured or unstructured manner, depending on the aim of the investigation.
The aim of using such focus group interviews is not to replace individual
interviewing, but to gather information that can perhaps not be collected easily by
members of individual interviews (Welman, Kruger and Mitchell, 2005: 201).
Wilkinson and Birmingham (2003: 45) state that the semi-structured interview
allows the interviewer and participant more flexibility. The interviewer directs the
interview more closely. More questions are pre-determined though there is
sufficient flexibility to allow the participant an opportunity to shape the flow of
information.
Scott and Usher (2000: 109) posit that in a semi-structured interview, participants
are encouraged to set the agenda of the interview, though the presence of an
interviewer and other forms of control exerted by them means that the participant
never has full control of the setting. The interviewer sets up the interview, is
involved in the negotiation of place, purpose and agenda at the initial stages and
asks questions, prompts answers and elicits reformulations of responses.
Participants provide answers and give accounts of their lives in terms of their
understanding of the settings in which they are located. Thus, gender, race,
class and other types of power relations are conveyed by the researcher and
form an essential backdrop to the answers that participants provide (Scott &
Usher, 2000: 109).
76
To collect data for the qualitative method, semi-structured interviews will be
conducted with finance staff at ESKOM Transmission, Southern Grid in Port
Elizabeth.
In the next section the researcher will provide a detailed discussion on the mixed
method approach.
5.4.3 Mixed-method approach
A mixed-method approach for data collection will be used in this study.
De Vos (2005: 358) states that a combined-method study can be described as
one in which the researcher uses multiple methods of data collection and
analysis. According to the author, mixed-method studies are those that combine
the qualitative and quantitative approaches into the research methodology of a
single study or multi-phased study.
The authors state further that the quantitative approach is highly formalised, and
more explicitly controlled than the qualitative approach with a range that is more
exactly defined, and that is relatively close to the social sciences. In
contradistinction, qualitative approaches are those in which the procedures are
not as strictly formalised, while the scope is more likely to be undefined, and a
more philosophical mode of operation is adopted (Mouton & Marais, as quoted
by De Vos, 2005: 357).
Muijs (2004: 9) refers to this combination of qualitative and quantitative methods
as a mixed method design. Mixed method, the author states, is a flexible
approach where the research design is determined by what the researcher wants
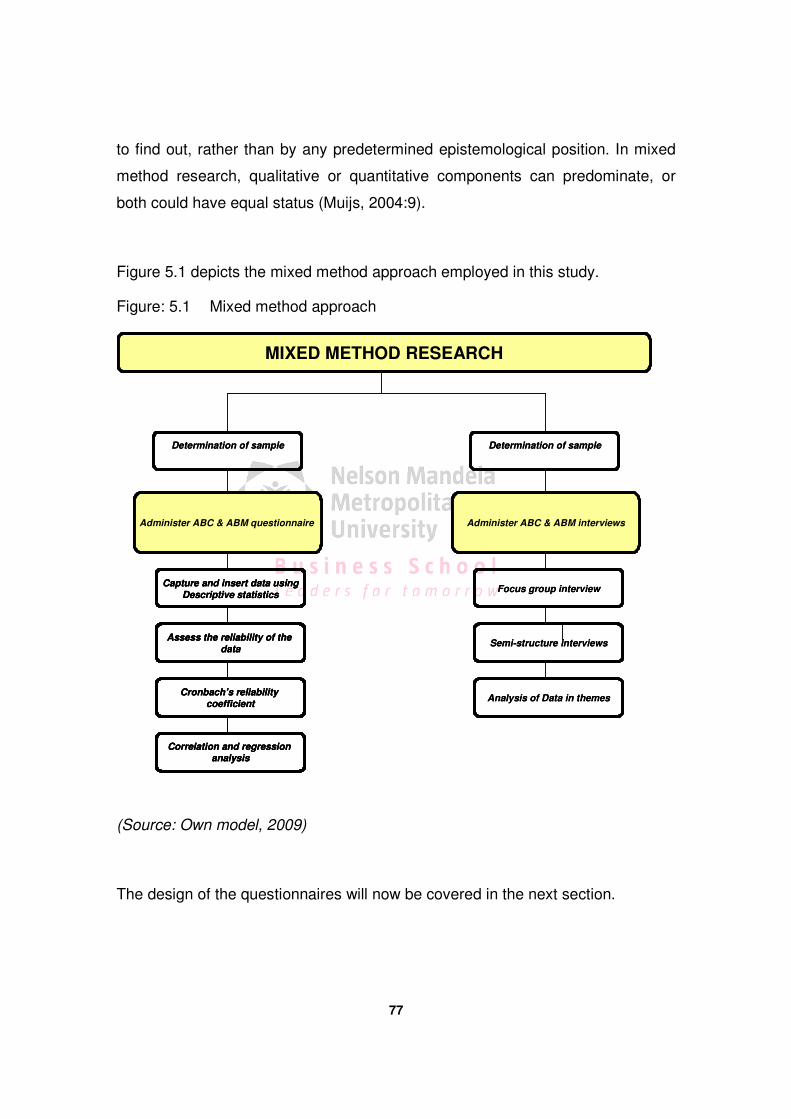
77
to find out, rather than by any predetermined epistemological position. In mixed
method research, qualitative or quantitative components can predominate, or
both could have equal status (Muijs, 2004:9).
Figure 5.1 depicts the mixed method approach employed in this study.
Figure: 5.1 Mixed method approach
(Source: Own model, 2009)
The design of the questionnaires will now be covered in the next section.
Determination of sample
Focus group interview
Semi-structure interviews
Analysis of Data in themes
Determination of sample
MIXED METHOD RESEARCH
Administer ABC & ABM questionnaire
Correlation and regression analysis
Capture and insert data using
Descriptive statistics
Assess the reliability of the
data
Cronbach’s reliability
coefficient
Administer ABC & ABM interviews
Determination of sample
Focus group interview
Semi-structure interviews
Analysis of Data in themes
Determination of sample
MIXED METHOD RESEARCH
Administer ABC & ABM questionnaire
Correlation and regression analysis
Capture and insert data using
Descriptive statistics
Assess the reliability of the
data
Cronbach’s reliability
coefficient
Correlation and regression analysis
Capture and insert data using
Descriptive statistics
Assess the reliability of the
data
Cronbach’s reliability
coefficient
Administer ABC & ABM interviews
78
5.4.3.1 Design of the Questionnaires
For the purposes of the study, structured questionnaires will be distributed to ten
middle-mangers and twelve engineers at ESKOM Transmission Southern Grid to
complete. This forms part of the quantitative method of data collection.
Scott and Morrison (2006: 192) posit that the key issue is that questionnaires are
designed to provide measurement. Above all, this requires questions that must
be judged in terms of the question’s capacity to promote responses that are
linked directly to that which the researcher set out to measure, and an
equivalence in each question and its asking.
Muijs (2004: 45) points out that it is important for researchers to take heed not
only of the way questionnaires are designed, but also of how questions are
worded as these aspects will affect the answers participants give. It is therefore
important; the author states that researchers think carefully about what kind of
questions are asked.
One questionnaire was used in this research to obtain information on ABC and
ABM’s impact on the organisation business performance through improved
decision making. The questionnaire used in this study contains 40 statements
that identify and measure the key aspects of ABC and ABM. Each statement
corresponds to the model for improved decision making and business
performance as stipulated in Fig. 4.5.
The questionnaire comprises a 4 point scale and the respondents were
instructed during the administration of the questionnaires by the researcher to
mark the most suitable answer. The scale ranges from 0 to 4 as follows:
79
1. Strongly agree;
2. Agree;
3. Strongly disagree;
4. Disagree.
5.4.3.2 Semi-structured Interviews
For the purposes of this study, semi-structured interviews will be conducted with
seven finance staff members within Eskom Transmission Southern Grid. This
forms part of the quantitative method of data collection for this study.
Scott and Usher (2000: 109) posit that in a semi-structured interview, participants
are encouraged to set the agenda of the interview, though the presence of an
interviewer and other forms of control exerted by them means that the participant
never has full control of the setting. The interviewer sets up the interview, is
involved in the negotiation of place, purpose and agenda at the initial stages and
asks questions, prompts answers and elicits reformulations of responses.
Participants provide answers and give accounts of their lives in terms of their
understanding of the settings in which they are located. Thus, gender, race,
class and other types of power relations are conveyed by the researcher and
form an essential backdrop to the answers that participants provide (Scott &
Usher, 2000: 109).
5.4.3.3 Focus group interviews
Focus group interviews will be conducted with seven engineers within Eskom
Transmission Southern Grid.
80
Robson (2002: 284-285) describes a focus group as a group interview on a
specific topic, which is where the focus comes from. It is an open-ended group
discussion guided by the researcher, typically extending over at least an hour,
possibly two or more. In terms of the size of the group, Robson (2002:285)
further states that figures of eight to twelve are usually thought suitable although
smaller group sizes have been used.
A rationale for the selected mixed-method approach for this study will now be
provided.
5.4.4 Rationale for selected paradigm
The author will be conducting both a phenomenological and positivistic study.
The nature of the research topic warrants both paradigms as direct relationship
between the dependent and independent variables can be found and the need
for the researcher and respondents’ full involvement in the research program.
The author intends gathering information from groups or individuals in order to
arrive at a meaningful conclusion. It is the researcher’s intention to analyse the
data for this study using both these methods, hence a sound understanding of
the concepts is deemed necessary.
Verma and Mallick (1999: 27) posit that qualitative research involves the
gathering of evidence that reflects the experiences, feelings or judgments of
individuals taking part in the investigation of a research problem or issue whether
as subjects of as observers at the scene. The authors state further that
qualitative research is often concerned with social processes and that the main
feature of qualitative research is that the meaningful explanations of social
activities requires substantial appreciation of the perspectives, culture and world-
view of the actors involved (Verma and Mallick, 1999: 27).
81
Christensen (2001: 34) is of the opinion that quantitative research is a descriptive
type of research where the goal is to attempt to provide an accurate description
or picture of a particular situation or phenomenon. This approach does not try to
ferret out cause-and-effect relationships. Instead it attempts to identify variables
that exist in a given situation and, at times to describe the relationship that exists
between these variables.
A combined-method study can be described as one in which the researcher uses
multiple methods of data collection and analysis (De Vos, 2005: 358). According
to the author, mixed-method studies are those that combine the qualitative and
quantitative approaches into the research methodology of a single study or multi-
phased study.
5.5 MEASUREMENT CHARACTERISTICS OF A QUANTITATIVE
RESEARCH INSTRUMENT
Two distinct aspects need to be considered under a quantitative research
instrument namely validity and reliability.
5.5.1 Validity
Validity was arrived at by considering both content validity and construct validity.
The content validity was supported by the specific questionnaire items
constructed strictly according to the definition of each section. The construct
validity was underpinned by the fact that although the questionnaire focused on
different sections, the items all dealt with aspects which were important
82
concerning developing sound ABC and ABM practices that lead to improved
decision-making.
Validity is a measure of the how well the research design captures the variable
under inquiry. Thinking back to how variables are operationalised, validity then
concerns the degree to which the variables in question purport to measure a
given phenomenon (Feng, 2006: 12).
Denscombe (2002: 101) describes validity as the accuracy of questions asked,
the data collected and the explanations offered. Generally it relates to the data
and the analysis used in the research. It refers to the quality of data and
explanations and the confidence once might have that it accord with what is true
and what is real.
5.5.2 Reliability
Reliability is a measure of the repeatability and stability. With the question of
reliability, the concern is whether the results will be consistent under similar
conditions (Feng, 2006: 12). Hollaway and Jefferson (2000: 79) further state that
reliability refers to the consistency and repeatability of results.
Denscombe (2002: 101) posits that reliability relates to the methods of data
collection and the concern that they should be consistent and not distort the
findings. Generally it entails an evaluation of the methods and techniques used to
collect data. It refers to the ability of a research process to provide results that do
not vary from occasion to occasion and that do not vary according to the
particular undertaking the research.
83
This study employed focus group interviews and semi-structured interviews to
support the reliability of especially the qualitative research findings.
5.6 SUMMARY
This chapter set out the methods for data collection and enquiry. The approach
of this study is the utilisation of a mixed-method approach in an investigation to
determine the utilisation and impact of ABC methods within ESKOM
Transmission and to provide a model to improve the effectiveness of decision-
making for improved business performance in the organisation.
To gather data for the investigation, focus group interviews were conducted with
engineers and semi-structured open-ended interviews with (senior/middle?)
management at ESKOM Transmission, Southern Grid in Port Elizabeth. Manage
ment also completed a questionnaire.
The data analysis was done by running frequencies and cross-tabulations of
elicited responses by making use of the statistical package SPSS10 (Statistical
Package for the Social Sciences)
The next chapter explores the data analysis for this study.
84
CHAPTER 6
DATA ANALYSIS AND INTERPRETATION
6.1 INTRODUCTION
The previous chapter discussed the methodology followed within this research
study. The goals of the research objectives were presented. A schematic
description of the research design was represented in Figure 5.1. The chapter
also alluded to the research population and sample; the respective reliability and
validity of the methodology, the process of data collection, capturing and
analysis. This chapter presents and discusses the results of the correlation
analysis of the research and the assessment of the reliability of the research
data. Descriptive statistics was used to summarise quantitative data and
relationships if any, which are not apparent in the raw data.
According to Schoenbach (2004: 461) whether or not we believe, in Albert
Einstein’s words, that “the Lord God doesn’t play dice with the universe”, there
are many events in the world that we ascribe to “chance”. When we roll a die,
the resulting number is generally unpredictable and does not (or at least, should
not) follow any evident pattern. Similarly, when we draw five cards from a freshly-
shuffled, unmarked deck, we know that some outcomes are more or less likely
than others (e.g., a pair is more likely than three of a kind), but we cannot predict
what cards we will draw. The theories of probability and statistics were born in
the gaming parlours of Monte Carlo and came of age in the fields of the British
countryside. The computer revolution put their power, for good or for whatever,
into the hands of any of us who can click a mouse (Schoenbach, 2004: 461).

85
This study employed a mixed-method approach, which involved the quantitative
and qualitative method of data collection. Golafshani (2003: 598) states that a
quantitative researcher attempts to fragment and delimit phenomena into
measurable or common categories that can be applied to all of the subjects or
wider and similar situations. The researcher's methods involve the "use of
standardised measures so that the varying perspectives and experiences of
people can be fitted into a limited number of predetermined response categories
to which numbers are assigned (Golafshani, 2003: 598).
Denzin and Lincoln (2003: 9-11) concede that qualitative research, as a set of
interpretive activities, privileges no single methodological practice over another.
The authors explain that qualitative research, as a set of practices, embraces
within its own multiple disciplinary histories constant tensions and contradictions
over the project itself, including its methods and the forms its findings and
interpretations take. The field sprawls between and crosscuts all of the human
disciplines and its practitioners are sensitive to the value of the multi-method
approach.
De Vos (2005: 335) states that a qualitative study involves an inseparable
relationship between data collection and data analysis in order to build a
coherent interpretation of the data. An assumption of the qualitative researcher
is that the human instrument is capable of ongoing fine-tuning in order to
generate the most fertile array of data.
The data collection for this study took place in April and May 2009 and was
carried out by the researcher. Eskom Transmission Southern Grid was focused
on for relevance and easy access for research purposes. This assisted for quick
response rates, efficiency gathering the data, and to minimize the disruption
within the targeted departments.
86
The following empirical methods were used to collect data for this study:
Questionnaires – Ten managers and twelve engineers were conducted in Eskom
Transmission Southern grid. Each section had to complete one questionnaire.
Semi-structured interviews – conducted with seven engineers.
Focus group interviews – conducted with finance staff of Eskom Transmission
Southern grid.
The focus now turns to the interpretation and analysis of the data for this study.
6.2 CHARACTERISTICS OF THE TARGETED SAMPLE
The characteristics of the targeted sample will now be described and discussed.
6.2.1 Response rate
As indicated in Table 6.1, a total of 22 questionnaires were e-mailed to a sample
of Eskom Transmission personnel in the Southern Grid: middle management,
finance manager and engineers. The participants in the study was representative
of engineers, managers and finance staff who utilise and implement ABC and
ABM strategies.These were considered the major sections dealing directly with
ABC. 22 questionnaires were acknowledged by the addressees. 21
questionnaires were returned by the participants who represent a response rate
of 95.4percent. The response rates are reflected in Table 6.1.
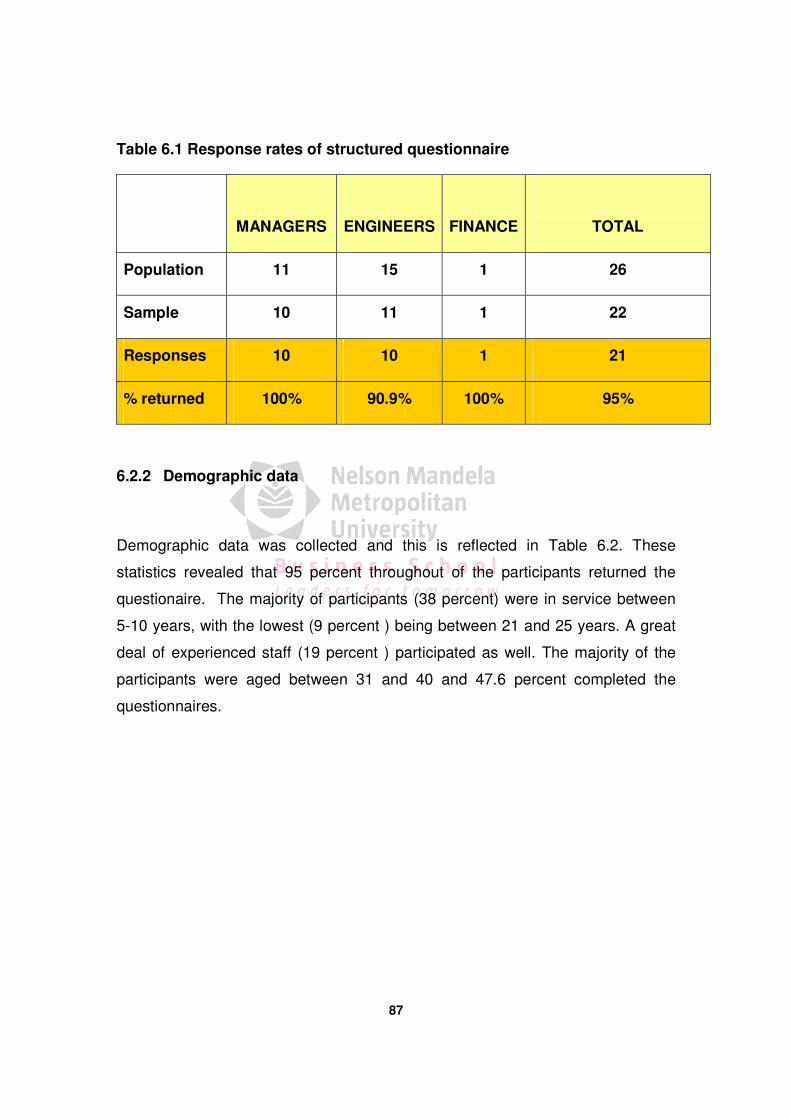
87
Table 6.1 Response rates of structured questionnaire
MANAGERS
ENGINEERS
FINANCE
TOTAL
Population 11 15 1 26
Sample 10 11 1 22
Responses 10 10 1 21
% returned 100% 90.9% 100% 95%
6.2.2 Demographic data
Demographic data was collected and this is reflected in Table 6.2. These
statistics revealed that 95 percent throughout of the participants returned the
questionaire. The majority of participants (38 percent) were in service between
5-10 years, with the lowest (9 percent ) being between 21 and 25 years. A great
deal of experienced staff (19 percent ) participated as well. The majority of the
participants were aged between 31 and 40 and 47.6 percent completed the
questionnaires.
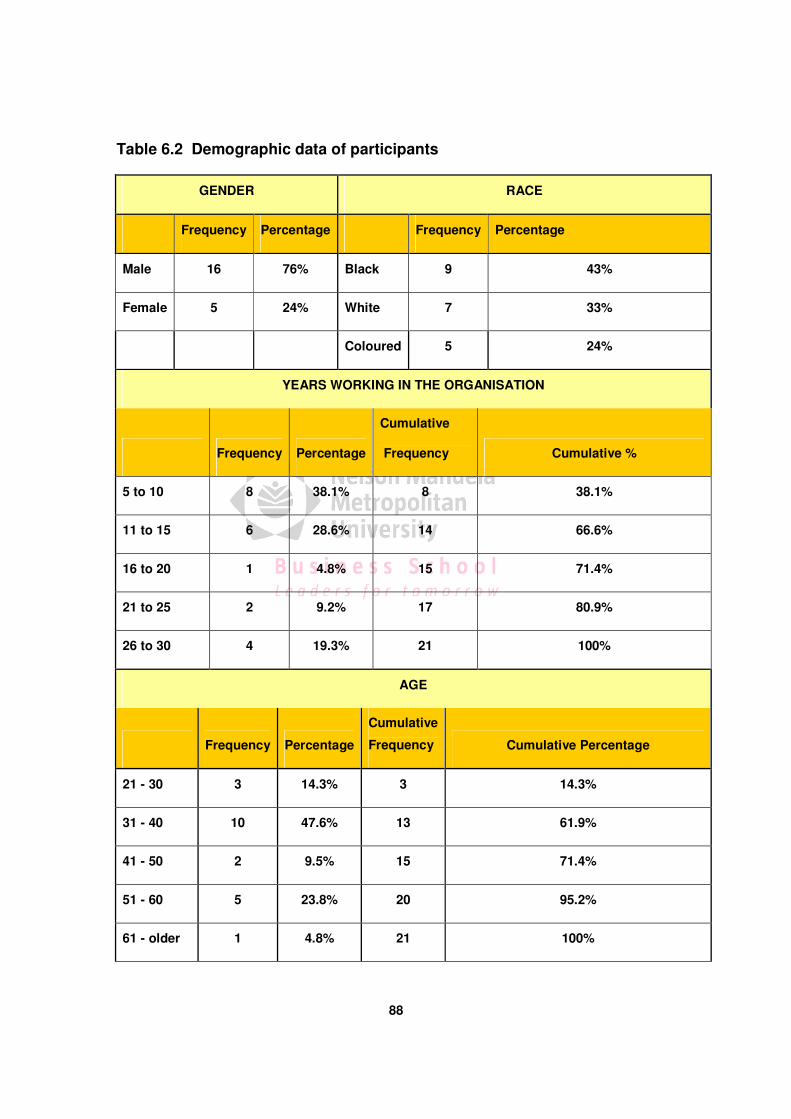
88
Table 6.2 Demographic data of participants
GENDER RACE
Frequency Percentage Frequency Percentage
Male 16 76% Black 9 43%
Female 5 24% White 7 33%
Coloured 5 24%
YEARS WORKING IN THE ORGANISATION
Frequency Percentage
Cumulative
Frequency Cumulative %
5 to 10 8 38.1% 8 38.1%
11 to 15 6 28.6% 14 66.6%
16 to 20 1 4.8% 15 71.4%
21 to 25 2 9.2% 17 80.9%
26 to 30 4 19.3% 21 100%
AGE
Frequency Percentage
Cumulative
Frequency Cumulative Percentage
21 - 30 3 14.3% 3 14.3%
31 - 40 10 47.6% 13 61.9%
41 - 50 2 9.5% 15 71.4%
51 - 60 5 23.8% 20 95.2%
61 - older 1 4.8% 21 100%
89
In the next section aspects in the analysis and interpretation of the data will be
considered.
6.2.3 Analysing and interpreting the data
Schoenbach (2004: 461) posits that the usual analysis approach is to begin with
descriptive analyses, to explore and gain a “feel” for the data. The analyst then
turns to address specific questions from the study aims or hypotheses, from
findings and questions from studies reported in the literature, and form patterns
suggested by the descriptive analyses. Before analysis begins in earnest,
though, a considerable amount of preparatory work must be carried out.
Schoenbach (2004: 461) outlines the following as the major objectives to
consider in analysis of data for research studies:
• Evaluate and enhance data quality;
• Describe the study population and its relationship to some presumed
source (accounts for all in-scope potential subjects; compare the available
study population with the target population);
• Assess potential for bias (e.g., non-response, refusal, and attrition,
comparison groups);
• Estimate measures of frequency and extent (prevalence, incidence,
means, medians);
• Estimate measures of strength of association or effect;
• Assess the degree of uncertainty from random noise (“chance”);
• Control and examine effects of other relevant factors;
• Seek further insight into the relationships observed or not observed
• Evaluate impact or importance (Schoenbach, 2004: 461).
90
For the purposes of this study, the questionnaire will be analysed as follows:
6.2.4 Analysis of the questionnaire
For this study, composite tables and graphs were used. The mean values were
used to answer the research question. The most positive and most negative
responses were also discussed. This will give insight into how staff within
ESKOM Transmission Southern Grid perceived ABC as a decision making tool
towards improved financial business performance. SPSS will be used to analyse
the data gathered for interpretation.
SPSS is a programme which provides a very wide range of statistical
procedures. Creating a data set with SPSS simply involves defining the
characteristics for each column in the data set. SPSS provides a wide range of
summary statistics also commonly known as descriptive statistics, while at the
same time also providing for incorporating summary statistics into graphical
displays (Robson, 2002:407).
The researcher will now present the data analysis of this research.
6.3 DATA ANALYSIS
Once data were collected, it was necessary to employ statistical techniques to
analyse the information, as this study is quantitative in nature too.
91
6.3.1 Cronbach’s Alpha Coefficient
Cronbach’s Alpha coefficient is typically equated with internal consistency (De
Vellis, 1991). The Cronbach’s Alpha is interpreted as a coefficient Alpha and its
value ranges from 0 to 1. Sekaran (2000) advises that when calculating
Cronbach’s reliability coefficient, reliabilities less than 0.6 are considered poor,
reliabilities within 0.7 ranges are considered acceptable and those coefficients
over 0.8 are considered good.
6.3.2 Biographical data of respondents
The quantitative phase of research provides for biographical data of the
respondents. The aim of the items in this section (Section A of the questionnaire,
items 1 to 7) was to gather information which could possibly be utilised when
interpreting data.
This study makes use of the 4-point Lickert scale to obtain ratings, on a
continuum from strongly agree to (1) to strongly disagree (4). The means scores
represent the aggregate of the responses on the range from "strongly agree" to
"strongly disagree". In the interpretation of the individual items, mean scores are
interpreted in the following manner:
• A score of 2.25 and below indicates a high level of satisfaction;
• A score of between 2.25 and 3 indicates an acceptable level of
satisfaction;
• A score of between 3 and 3.75 indicates room for improvement;
• A score of 3.75 and above signals a problem that is in need of urgent
attention.
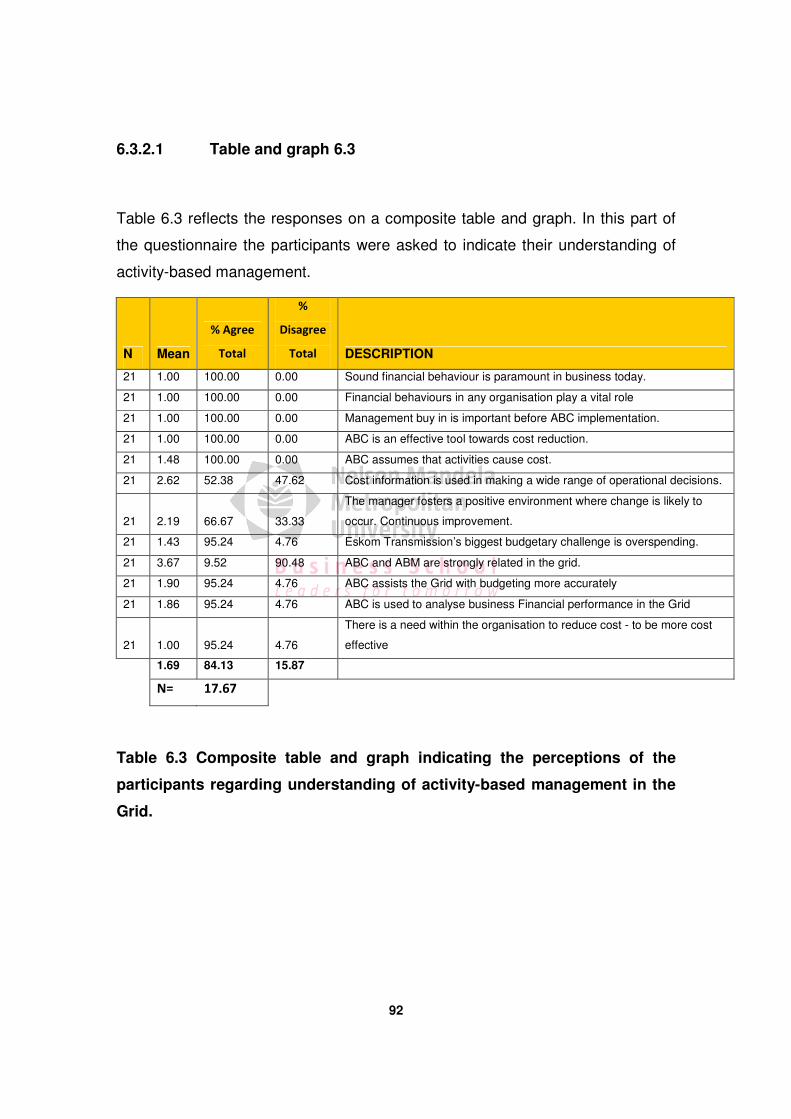
92
6.3.2.1 Table and graph 6.3
Table 6.3 reflects the responses on a composite table and graph. In this part of
the questionnaire the participants were asked to indicate their understanding of
activity-based management.
N Mean
% Agree
Total
%
Disagree
Total DESCRIPTION
21 1.00 100.00 0.00 Sound financial behaviour is paramount in business today.
21 1.00 100.00 0.00 Financial behaviours in any organisation play a vital role
21 1.00 100.00 0.00 Management buy in is important before ABC implementation.
21 1.00 100.00 0.00 ABC is an effective tool towards cost reduction.
21 1.48 100.00 0.00 ABC assumes that activities cause cost.
21 2.62 52.38 47.62 Cost information is used in making a wide range of operational decisions.
21 2.19 66.67 33.33
The manager fosters a positive environment where change is likely to
occur. Continuous improvement.
21 1.43 95.24 4.76 Eskom Transmission’s biggest budgetary challenge is overspending.
21 3.67 9.52 90.48 ABC and ABM are strongly related in the grid.
21 1.90 95.24 4.76 ABC assists the Grid with budgeting more accurately
21 1.86 95.24 4.76 ABC is used to analyse business Financial performance in the Grid
21 1.00 95.24 4.76
There is a need within the organisation to reduce cost - to be more cost
effective
1.69 84.13 15.87
N= 17.67
Table 6.3 Composite table and graph indicating the perceptions of the
participants regarding understanding of activity-based management in the
Grid.
93
6.3.2.2 General discussion of the results
In table 6.3, most of the respondents (84 percent ) indicated that they possessed
a good understanding of ABC in the Grid. Only 16 percent of the respondents
disagreed with statements posed that constituted a poor understanding of ABC.
What was positive is the high level of understanding of the concept ABC in the
Grid as most respondents could present a good explanantion of the concept.
This foundation is imperative in making the concept effective and useful in the
Grid.
6.3.2.3 Detailed discussion of the results
The research revealed that the following factors were of significant importance in
the Grid, is stipulated as follows:
• 100 percent of the participants concurred that sound financial behaviour is
paramount in business today, thus management buy-in is important before
ABC implementation;
• ABC however needs a management controlling system and it was
concerning to see that participants not recognising the relationship
between ABC and ABM. Only 9.5 percent of the participants agreed a
relationship existed, with the majority (90.5 percent) feeling no relationship
exists;
• Whilst cost information is imperative to make a wide range of operational
decisions, only 47 percent of the participants agreed that it was imperative
in decision making, 52 percent disagreed.
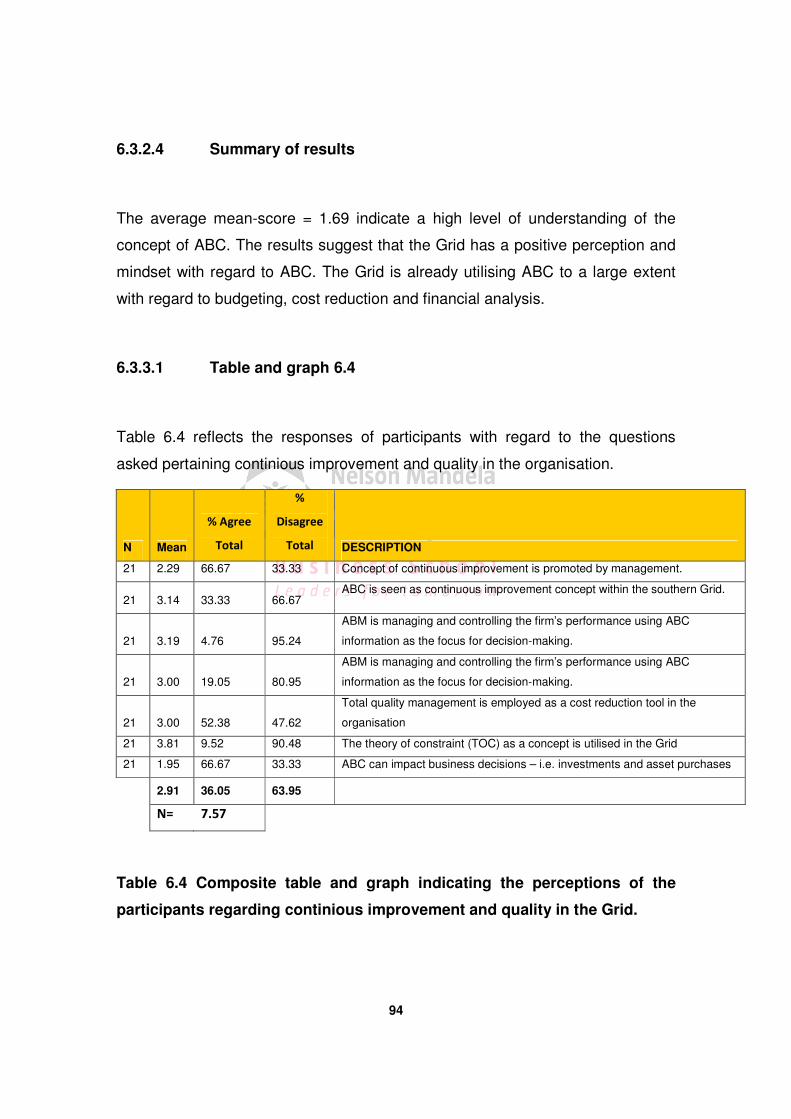
94
6.3.2.4 Summary of results
The average mean-score = 1.69 indicate a high level of understanding of the
concept of ABC. The results suggest that the Grid has a positive perception and
mindset with regard to ABC. The Grid is already utilising ABC to a large extent
with regard to budgeting, cost reduction and financial analysis.
6.3.3.1 Table and graph 6.4
Table 6.4 reflects the responses of participants with regard to the questions
asked pertaining continious improvement and quality in the organisation.
N Mean
% Agree
Total
%
Disagree
Total DESCRIPTION
21 2.29 66.67 33.33 Concept of continuous improvement is promoted by management.
21 3.14 33.33 66.67 ABC is seen as continuous improvement concept within the southern Grid.
21 3.19 4.76 95.24
ABM is managing and controlling the firm’s performance using ABC
information as the focus for decision-making.
21 3.00 19.05 80.95
ABM is managing and controlling the firm’s performance using ABC
information as the focus for decision-making.
21 3.00 52.38 47.62
Total quality management is employed as a cost reduction tool in the
organisation
21 3.81 9.52 90.48 The theory of constraint (TOC) as a concept is utilised in the Grid
21 1.95 66.67 33.33 ABC can impact business decisions – i.e. investments and asset purchases
2.91 36.05 63.95
N= 7.57
Table 6.4 Composite table and graph indicating the perceptions of the
participants regarding continious improvement and quality in the Grid.
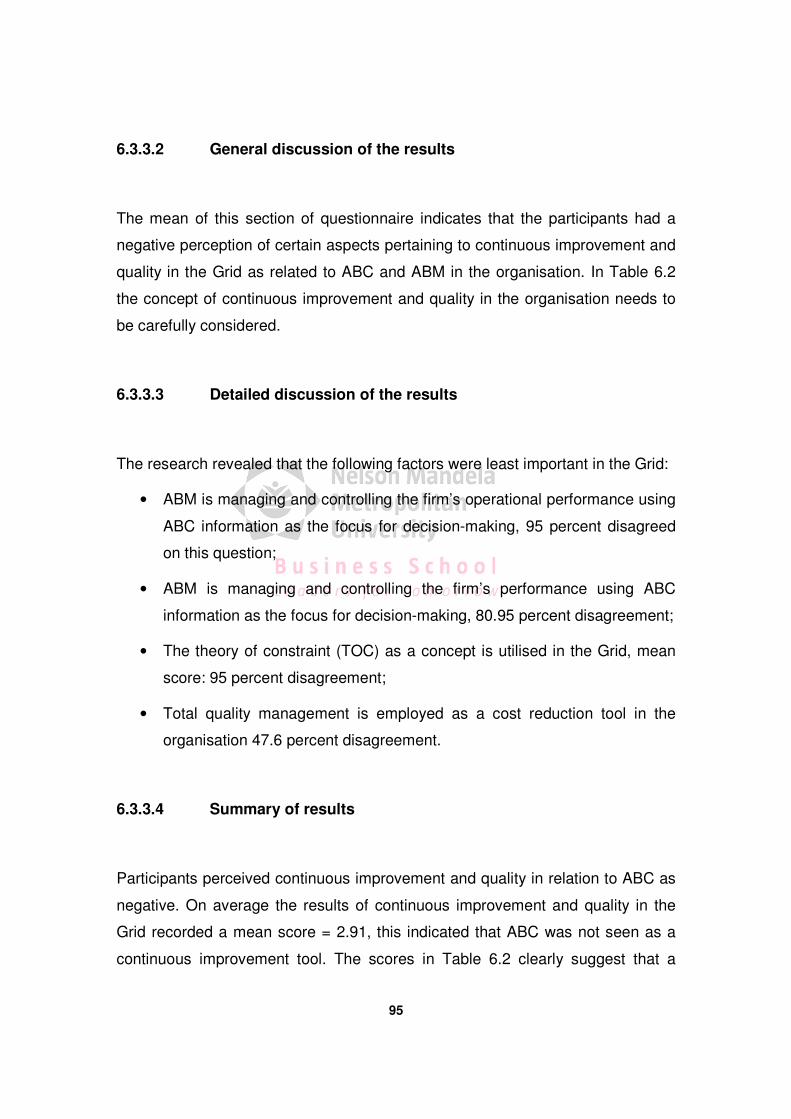
95
6.3.3.2 General discussion of the results
The mean of this section of questionnaire indicates that the participants had a
negative perception of certain aspects pertaining to continuous improvement and
quality in the Grid as related to ABC and ABM in the organisation. In Table 6.2
the concept of continuous improvement and quality in the organisation needs to
be carefully considered.
6.3.3.3 Detailed discussion of the results
The research revealed that the following factors were least important in the Grid:
• ABM is managing and controlling the firm’s operational performance using
ABC information as the focus for decision-making, 95 percent disagreed
on this question;
• ABM is managing and controlling the firm’s performance using ABC
information as the focus for decision-making, 80.95 percent disagreement;
• The theory of constraint (TOC) as a concept is utilised in the Grid, mean
score: 95 percent disagreement;
• Total quality management is employed as a cost reduction tool in the
organisation 47.6 percent disagreement.
6.3.3.4 Summary of results
Participants perceived continuous improvement and quality in relation to ABC as
negative. On average the results of continuous improvement and quality in the
Grid recorded a mean score = 2.91, this indicated that ABC was not seen as a
continuous improvement tool. The scores in Table 6.2 clearly suggest that a
96
significant amount of central tendency existed, as the means of all components
are relatively close.
The interrelatedness between ABC as a continuous improvement tool and other
improvement tools needs to recognised and explored especially in the strong
engineering environment such as ESKOM.
6.3.4.1 Table and graph 6.5
Table 6.5 reflects the responses of participants with regard to the questions
asked pertaining the administration and application of ABC and ABM in the Grid.
N Mean
% Agree
Total
%
Disagree
Total DESCRIPTION
21 3.10 19.05 80.95 ABC as a method is well managed in Eskom Transmission.
21 1.71 90.48 9.52 ABC provides strong direction for the business’s budgeting process.
21 2.52 52.38 47.62
ABC is used in Eskom Transmission Southern Grid as a cost reduction
method/tool
21 2.67 33.33 66.67 The main cost drivers within the Grid can be identified for cost control.
21 3.76 4.76 95.24 ABM is used as a process and business improvement model in the Grid.
21 1.00 95.24 4.76 ABC can impact business performance in the Grid
21 1.48 80.95 19.05
A strong association exists between the extent to which ABC uses
information in normal business operations
21 3.00 9.52 90.48 ABC information is used in investment decisions
21 2.71 42.86 57.14 The main cost drivers within the Grid are well controlled.
2.44 47.62 52.38
N= 10.00
Table 6.5 Composite table and graph indicating the perceptions of the
participants regarding administration and the application of ABC and ABM
in the Grid.
97
6.3.4.2 General discussion of the results
Administration and application of ABC and ABM remain important. In this section
the questionnaire, mean values are acceptable but require attention, with the
average mean value being 2.44.
6.3.4.3 Detailed discussion of the results
The research revealed that the following factors were of significant importance in
the Grid:
• Though most participants (95.2 percent) agreed that ABC can impact
business performance in the Grid;
• a significant contrast was observed on the question whether ABC was well
managed in the Grid, with a 80.9 percent disagreement on this question;
• Disconcerting was the level of financial information that was used in
making investment decisions. 90.4 percent disgreed that ABC information
is used in making investment decsions;
• ABC is well utilised as a budgeting tool for the Grid. 90.4 percent of the
participants agreed to the use of ABC for budgeting purposes.
6.3.4.4 Summary of results
The administration of ABC and ABM remains a vital part of in the success of its
utilisation as an effective business tool. ABC administration and application in
this regard has an average mean score of 2.44 necesitating improvement.
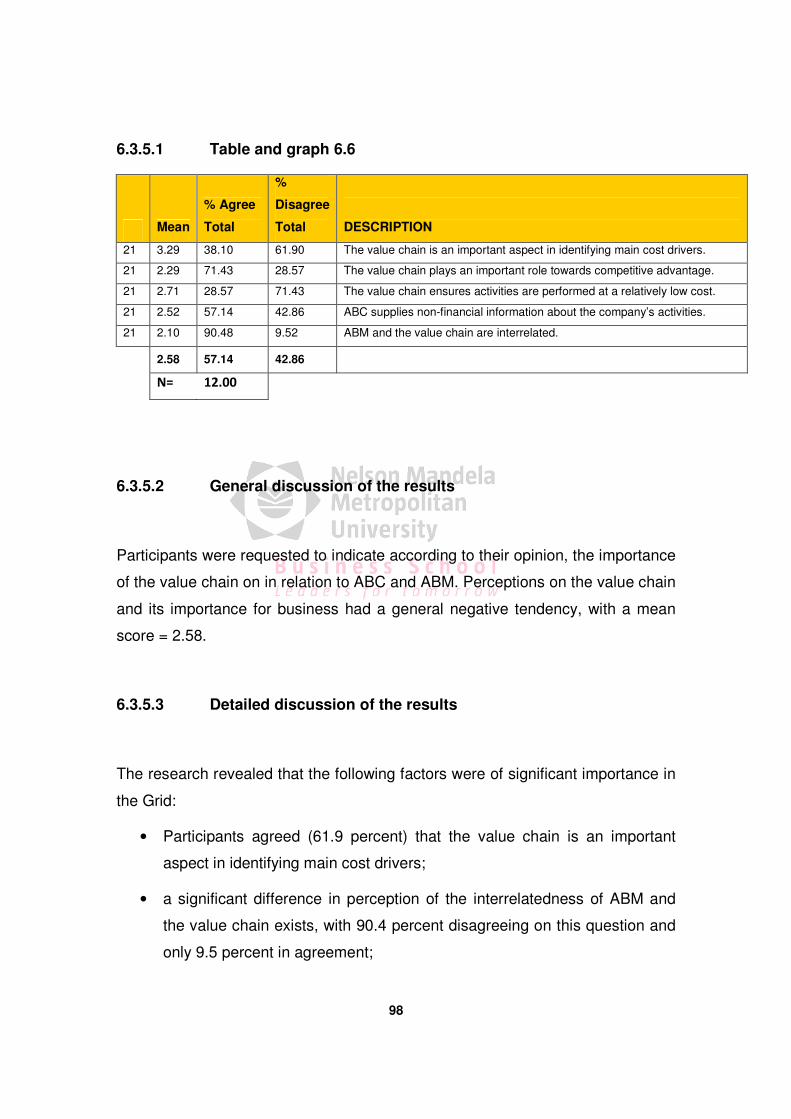
98
6.3.5.1 Table and graph 6.6
Mean
% Agree
Total
%
Disagree
Total
DESCRIPTION
21 3.29 38.10 61.90 The value chain is an important aspect in identifying main cost drivers.
21 2.29 71.43 28.57 The value chain plays an important role towards competitive advantage.
21 2.71 28.57 71.43 The value chain ensures activities are performed at a relatively low cost.
21 2.52 57.14 42.86 ABC supplies non-financial information about the company’s activities.
21 2.10 90.48 9.52 ABM and the value chain are interrelated.
2.58 57.14 42.86
N= 12.00
6.3.5.2 General discussion of the results
Participants were requested to indicate according to their opinion, the importance
of the value chain on in relation to ABC and ABM. Perceptions on the value chain
and its importance for business had a general negative tendency, with a mean
score = 2.58.
6.3.5.3 Detailed discussion of the results
The research revealed that the following factors were of significant importance in
the Grid:
• Participants agreed (61.9 percent) that the value chain is an important
aspect in identifying main cost drivers;
• a significant difference in perception of the interrelatedness of ABM and
the value chain exists, with 90.4 percent disagreeing on this question and
only 9.5 percent in agreement;
99
6.3.5.4 Summary of results
The importance of the value chain in relation to ABC and ABM provides
significant benefit to an organisation. The results indicated that the Grid is aware
of such benefits, however the application and implementation of this concept in
conjuction with ABC and ABM is lacking. A mean score of 2.58 is a clear
indication of the need of improvement in this area.
6.4 CONCLUSION
The results for this study reflect Garrison and Noreen’s (2000: 25) statement that
the active support of top management is the most crucial factor in the success of
ABC and ABM. Furthermore Gurses (1999: 9) confirms that companies where
accountants retain ownership and are unsuccessful in sharing the system (ABC
and ABM) with non-accountants struggled with getting benefit from ABC and
ABM.
According to Turney (1991: 184) the findings confirmed that the system can be
effectively utilised for budgeting purposes within the organisation by using ABC
to help estimate work load and resource requirements.
It is evident from the study that participants realise the importance ABC plays in
cost reduction. The same could not be said about continuous improvement as
ABC and ABM was deemed by most as to be not contributing towards
continuous improvement. Literature firmly relates the two concepts as Gupta and
Baxendale (2008: 7) state that reducing cost the ABC way, almost always
improves quality. ABM fits well with any quality improvement. This is confirmed
100
by Glad and Becker (1994: 136) stating that through the implementation of
quality management programmes with costing systems, not only identify wastage
but also to develop methods to value and eradicate it.
The focus now shifts to a qualitative analysis. A qualitative view is deemed
necessary to strike the balance for drawing parallel between the two research
methodologies.
6.5 ANALYSIS OF QUALITATIVE DATA
The researcher now turns the focus of this study to the qualitative analysis and
the interpretation of information gathered for this purpose.
6.5.1 Interpretation of qualitative data
Qualitative research can isolate target populations, show the immediate effects of
certain programs on such groups, and isolate the constraints that operate against
policy changes in such settings (Denzin and Lincoln, 1998: 226).
There is no single interpretative truth. Interpretations are narrative, or storied,
accounts. Interpretation-as-storytelling may privilege any of a number of different
narrative positions. Separate interpretive styles are associated with these
traditions, including the theoretical form of the text (substantive, formal, critical)
and its narrative structure (Denzin and Lincoln, 1998: 227).
101
Leedy and Ormrod (2005: 97) state that qualitative researchers construct
interpretive narrative from their data and try to capture the complexity of the
phenomenon under study. They use a more personal, literary style, and they
often include the participant’s own language and perspectives.
6.5.2 Analysing the data for semi-structured interviews
In recent times, the tradition of interviewing has been twofold. Interviewing found
greater popularity and widespread use in clinical diagnosis and counselling,
where the concern was on the quality of the response, and later interviewing
came to be widely employed with emphasis on measurement (Denzin and
Lincoln, 1998: 49).
Denzin and Lincoln (1998: 53) further state that structured interviewing refers to a
situation in which an interviewer asks each respondent a series if pre-established
questions with a limited set of response categories. There is generally little room
for variation in response except where an infrequent open-ended question may
be used.
The researcher will now provide the qualitative data analysis of semi-structured
interviews and focus group interviews conducted for this study.
6.5.3 Feedback from semi-structured and focus group interviews
According to the results yielded for the focus group discussions, it was evident
that although ABC is used within the Grid as accounting tool, very few
participants really knew the basics of the concept.
102
To question 1: To what extent can ABC/M be utilised as a decision making model
for business? Participants responded:
We acknowledge the concept of ABC; however I strongly feel that this is an
accounting concept and should not be the responsibility of engineers to drive.
ABC is used very well for our budgeting process and should be kept that way. I
can’t see how ABC could assist with plant decisions as plant decisions are based
on engineering and historical facts (Engineer).
In the focus group interviews conducted, it was asked why sound financial
behaviour should be paramount in business.
Participants unanimously concurred that it is of high importance as this gives
organisations a good basis to work from as discipline is installed. They were also
of the opinion that in modern business this becomes an ethical aspect with
people working in the organisation
To question 2 : Have costing models evolved and why new costing models
should be explored, participants responded:
Yes, costing models were designed to talk to financial officers where information
assisted financial direction. ABC is a new model and now can assist operations
with information to help make other operational and investment decisions
(Finance – staff).
Yes, old cost accounting did not make much of overhead cost. Modern
businesses expense highly in this area. ABC being a newer model speaks to this
aspect (Engineer).
103
The question of whether ABC/M can be utilised as a cost reduction and decision
making model for business, yielded mixed responses:
No, ABC/M is a budgeting tool and I cannot see how we can save cost through
utilising this model. Reports are given on activities that already happened. I don’t
see how ABC can influence cost reduction (Engineer- Secondary plant).
ABC/M can definitely assist in cost reduction as the activities can be analysed
and main cost drivers can be identified and thus better control measure put in
place. Though this is reactive, future planning can thus save us cost as the same
mistakes will not be made again (Finance officer – Finance).
To question 3: Staying within budget is one of the budgetary concerns in Eskom
Transmission. How did ABC assist the Grid in staying within budget? A manager
responded:
Adhering strictly to budgetary targets was not met completely. Though ABC
assisted management and staff knowing and accounting for cost, a certain
measure of overspending was still being realised (Manager – Finance).
It was the researcher’s observation that though it was acknowledged by the
participants that ABC/M can be utilised as a decision making tool for any
business, it was not done in the Grid. Finance staff recognised such benefits;
however engineers still believed that technical decisions required technical know-
how and little financial input besides that of procuring and paying for equipment
and spares (i.e. financial related outputs).
104
It was evident that decisions were mostly made on historical information rather
than current trends and available financial information. Thus in the question
asked as to what extent can ABC/M be utilised as a decision making model for
business, participants responded:
It can assist with business process/operational decisions as well. The
information provided can assist management not only for financial decisions
pertaining to cost, but can assist with business process decisions as well
(Finance staff).
Finance staff and mangers were asked whether departmental heads exercise
confidence in financial information derived from ABC for business decisions and
how ABC/M assists business with improved forward planning. Participants
responded:
Departmental heads see costing as a financial department output to a large
extent as a financial department output, hence reliance on such information to
make operational decisions in respective departments is taken with reluctance
(Finance staff).
Concerning the question if attention towards better maintenance and improved
performance is essential and has Eskom transmission improved on maintenance
performance in the past 3 years and can it be attributed to ABC/M, participants
responded:
Yes, it has improved, however it cannot be attributed to ABC/M as most
improvement came from improved discipline rather than improved processes and
systems (Engineer).
105
Yes, much emphasis was place on training and thus multi-skilling employees.
Though this made a steady contribution towards maintenance performance in the
grid, constraints of the network together with slicker and improved process
remains a challenge (Manager - Engineering).
On the question as to whether cost information is used in making a wide range of
operational decisions. It was remarked that:
Departmental heads see costing as a financial department output to a large
extent as a financial department output, hence reliance on such information to
make operational decisions in respective departments is taken with reluctance
(Manager Engineering).
ABC is used for analysis of cost and assists management with forward planning.
ABC is used for the budgeting process in the Grid mostly. ABC cannot be mixed
up with engineering pertaining planning for maintenance and operations
(Engineer).
Finance staff seemed more knowledgeable and hands on in terms of the concept
of ABC than engineers. The question was then posed whether ABC is seen as a
continuous improvement tool in the organisation. Most respondents emphatically
disagreed that ABC aids continuous improvement. The question was posed as to
whether ABC seen as continuous improvement concept within the Southern Grid
yielded the following responses:
No, engineering is seen as the core business, the link between accounting (ABC)
and continuous improvement in engineering terms (SIGMA) has not yet been
106
realised in our Grid. I’m not of the opinion that the two are related in terms of the
process of continious improvement (Engineer).
To question 6 whether ABC/M can be utilised as a cost reduction and decision
making model for business, the participants responded:
Yes, better allocation of resources in business can lead to improved costing and
hence cost reduction in certain activities. Activities are better monitored and
controlled and this will assist our Grid business with better costing, hence cost
reduction. By controlling the activities, better and informed decisions can be
realised as cost driver activities are easily identified and can be better controlled
(Finance officer).
Yes, we have seen positive results from our last budget review where main cost
activities responsible for over expenditure could be identified easily. This led to
better planning for the next financial year (Accountant).
6.6 CONCLUSION
The empirical results of the research were presented in this chapter. Descriptive
statistics and reliability analyses were presented to provide further insight.
The management information produced from the research will familiarise all with
the challenges and issues facing the Grid and it is encouraging to note that ABC
is already in use and requires certain improvements to realise the full benefit
from this system.

107
The researcher will now focus on the summary and recommendations that will be
dealt with in chapter 7.
108
CHAPTER 7
DISCUSSION, RECOMMENDATIONS AND CONCLUSIONS
7.1 INTRODUCTION
After presenting the results of the research in the previous chapter, the
implications of these results are now discussed in the light of the literature
reviewed in the first few chapters of this research. Research limitations are
identified and future research areas are also discussed in this chapter.
As indicated in the literature (page 22), Turney (1991: 44) posits that the key to
success in any business lies in the quality of its information and how this is
applied in the organisation. In order to make the right strategic decisions and to
remain competitive, management is reliant on accurate, up to date information of
activities performed. This treatise emphasises the importance of quality
information and will prove that ABC and ABM are useful tools providing
management with the information for effective decision-making for improved
business performance.
The literature (page 31) advocates that the quality of management decisions has
been directly linked to the quality of information . Glad and Becker (1994: 219)
agree and state further that, as a guide for planning and to choose among
alternatives, organisations need information about the financial consequences of
intended actions. They especially need reliable cost information, which serves in
many planning and decision support roles. An ABC and ABM system can
generate this quality information and interrelate superbly with strategic planning
to produce products of higher quality cost-effectively and achieve overall
customer satisfaction.
109
The research (page 33) indicates that ABC and ABM are quite different from
“business as usual” approaches to improvement. It involves analysing activities in
the search for waste. It includes looking for and eliminating the negative effects
of cost drivers and it involves measuring what matters to the customer in order to
focus on improvement efforts. ABC and ABM integrates all the improvement
efforts into one package. It ensures that the benefits apply to the overall
company and that the results go straight to the bottom line (Turney, 1991: 311).
Extent of ABC use is not directly associated with plant profitability, rather the
relationship is through operational performance measures quality improvement
and cost improvement that act as intervening variables between extent of ABC
use and profitability. Hence, this study contributes to the literature by heightening
our understanding of how ABC improves quality, cost and improve plant
performance and profitability. The importance of improving quality while
improving cost also becomes critical to managers interested in retaining
customers and enticing them to buy goods or services. Thus, this study provides
strong evidence to suggest that ABC implementation efforts by managers
generate an increased tendency toward improved financial business
performance through effective decision making on both financial and operational
performance levels. These competencies were discussed in Chapter 4 (page 60).
7.2 SUMMARY
Chapter 1 highlighted the purpose of the study and its importance to the
workplace and contribution to the body of knowledge.
In Chapter 2, background on Eskom in general, the organisation that formed the
focus of this study, was supplied. The importance of ESKOM as a power utility in
110
South Africa was discussed, followed by a discussion on the divisions within
ESKOM. The chapter continued with a discussion in the importance of a sound
transmission network and concluded with the quality of supply in the
Transmission network.
Chapter 3 focused on costing and its importance in modern business. The
chapter introduced the reader to the concept of costing. This was followed with
background on traditional cost accounting methods, a comparison of traditional
costing versus activity based costing and cost management in modern business.
Various other core business aspects such as the value chain, continuous
improvement and quality management were discussed in detail. The chapter was
concluded with the benefits of improved costing in business.
Chapter 4 outlined the definition of ABC and highlighted the fundamentals and
principles of ABC, the principles of ABC as used in business, maintenance
costing as an ABC approach and aspects regarding the theory of constraint and
integrating TOC with ABC.
In chapter 5 a discussion on the research methodology of the study was
supplied. Other aspects such as the research design, research methodology
utilised, sampling and measuring characteristics of the research instruments
were also outlined.
In chapter 6 the quantitative data were analysed and ranked according to
frequencies and percentages of items. Qualitative data were analysed and
interpreted.
The researcher will now follow this up with the main findings of the study.
111
7.3 FINDINGS
Research findings and conclusions will be discussed around the proposed ABC
and ABM model. The interview results suggest that certain aspects are not
followed by Eskom Transmission as indicated in the ABC and ABM model which
is critical in trying to achieve increased business performance.
Active management support for ABM as a concept is lacking and is crucial for the
successful implementation and process. Apart from proving the resources and
means for implementation, management should play an active role to support
staff and encourage continuous improvement if ABC and ABM is to succeed.
Currently Transmission Southern grid does not have the entire management and
staff buy-in on the concept of ABC. Though it is being used, the extent of its
power and use is still unknown.
Although ABC is a well known concept with most respondents in the Grid, basic
knowledge on ABM seriously lacks. The relation is logically identified in the
questionnaires, however upon closer interviews, it was found that understanding
of this concept lacked.
Ownership of the accounting tool ABC and ABM is seen as being retained by the
accountant. An essential contribution towards business success would be to
have involvement from all departments as to ensure effective buy-in and
ownership by all.
The impact of the value chain is not fully realised as management and staff are
employing the value chain fully as a cost reduction tool towards the quest for
competitive advantage. Eskom is traditionally seen a monopolistic company with
112
no direct competitors, however indirect competitors are seizing opportunities left
by not enhancing its existing competitive advantage.
As business improvement concepts, ABC interrelates and uses various other
tools to help the organisation achieve their goals. The lack of knowledge of these
tools was evident in the research study as concepts such as TQM, TOC and the
impact of the value chain on ABC lacked respondent input.
ESKOM Southern Grid in the study has implemented ABC for more that three
years however, the exact length of implementation to assess the time lag effects
of the extent of ABC use is unknown.
7.4 RECOMMENDATIONS AND MOTIVATION OF THE RESEARCH
Recommendation 1
Management should have the organisations goal and objectives in mind that is
locked up in the mission and vision of the company. Business today is dynamic
and change is constantly needed to keep abreast with competitors. Concepts
such as ABC and ABM need to be embraced and driven by management.
Motivation 1
It is imperative for management to lead from the front as staff will take the cue
from them. Broad endorsement is needed to be able to place ABC and ABM at
113
the top of anyone’s agenda, this is needed to remove barriers of acceptance and
obtain full commitment.
Recommendation 2
Dissemination of financial performance to all staff is needed as an awareness
drive of how the business is performing. Key focus areas need to be highlighted.
Motivation 2
A sense of transparency on financial performance and how it can impact
operations will create a good platform amongst all staff for ownership of the ABC
and ABM system. ABC and ABM cannot be seen in isolation, indicating that it is
not a finance department priority only. Collectively through ownership this
improvement tool can work effectively.
Recommendation 3
Training (for managers, finance staff and engineers) is required for proper
execution of the ABC system. The objective is to obtain high levels of “buy-in”.
Different types of training pertaining to ABC fundamentals and ABM needs to be
established and undertaken.
Motivation 3
Implementers need skills and know-how of the ABC and ABM system as to
ensure proper utilisation. Users should understand what information is available
114
from ABC and how that information should be used in decision making. The
objective would be to train them to use ABC in a program of ABM.
Recommendation 4
ABC and ABM should be applied to ensure main cost drivers and priority
activities are identified. ABC and ABM ensure that the main cost drivers are
highlighted and thus full attention can be given to it.
Motivation 4
It is imperative that the right activities be identified and efforts channeled into
these important activities. Ensuring the business’s operational activities are clear
as per the value chain, enables the Grid to make strategic operational decisions.
The use of ABC is an aid in strategic decision making and cost reduction as the
allocation of resources can be efficiently allocated through key activity
identification.
Recommendation 5
Continuous training on concepts that have a direct impact on the benefits that
could be derived from ABC is important to realise. TOC and TQM needs to be
used as continuous improvement concepts in conjunction with ABC and ABM
towards effective decision making and improved business financial performance.
115
Motivation 5
Thus improving on quality as an example, ABC, ABM and quality management
go hand-in-hand in any improvement program.
Recommendation 6
Tools such as TOC and TQM from the proposed model would assist the Grid in
identifying the bottlenecks of a system correctly, thus know explicitly the amount
of slack capacity of each activity available during a specific time period. Knowing
the excess capacity that will be available during a specific period ahead of time
will help managers to decide whether they can employ this capacity to other core
activities during that period, and therefore will help to improve business
performance (operational and financial performance). Without ABC, managers
will not have accurate information regarding the critical bottlenecks.
Motivation 6
All Grids experience bottlenecks in the performing maintenance and operating
key equipment. Knowing how to identify bottlenecks and dealing with it promptly
and accurately enables the Grid to have cost reductions as ABC information
assists management to attach monetary value to the cost of these bottlenecks.
The results confirmed that there exists a lack of value chain integration into ABC
systems to ascertain the customer’s needs and to obtain the true process
activities. Respondent’s feedback was scored relatively low on the question and
indicated that the concept was not understood and implemented.
116
The results also confirmed the findings of Gurses (1999:9) that companies which
have not had a good ABC and ABM experience was due to accountants retaining
ownership and unsuccessful sharing with non-accountants, whereas the two
should be seen as joint owners of the system.
Most departments viewed ABC and ABM as a finance tool and of no help to an
engineering department. ABC information was thus not utilised for decision
making since no real reliance is placed on such information for engineering and
related operational decision making.
It can be assumed that the improvements on quality serve as a base for cost
improvements because processes become more stable and reliable, and less
time and cost are required for rework.
7.5 LIMITATIONS OF THE STUDY
The findings of this study should be viewed with certain limitations in mind.
These limitations however, present opportunities for future research studies.
Firstly, a possible limitation of this study was the sensitivity of respondents to
disseminate information about the company, as Eskom’s image in the public eye
remains a challenging issue.
Secondly, the scope of the study is limited by the sample size, which included
only Eskom Transmission Southern Grid staff. This may reveal only a small
117
portion of the Eskom Transmission findings. The finings of this study may have
been different if a broader range of Transmission staff had been selected.
Thirdly, the level of ABC knowledge was average though the Grid was employing
this tool for more than three years. In some cases an explanation of what ABM
was needed too communicate what the questionnaires meant.
7.6 OPPORTUNITIES FOR FURTHER RESEARCH
This research is not a full representation of Eskom Transmission in general as
only the Southern Grid was concentrated on. It is thus expected that the results
pertaining to key ABC and ABM opinions might differ on a broader study
undertaking all regional Eskom Transmission offices.
Research could be carried out to other divisions within Eskom and results
compared to the results obtained in Transmission. A study can then be
conducted to ascertain whether ABC and ABM benefit are fully being realised
and to continue with its use as a continuous improvement tool. The current study
can also be broadened for the whole of Eskom Transmission to establish
whether if consistency in the findings from one Grid was found in others Grids
throughout South Africa.
In summary, the challenge for further research is to provide insights that are
relevant and useful for practitioners to allow management accounting research to
have more of an impact on practice.
118
7.7 CONCLUDING REMARKS
It has been postulated throughout that the success of this study is dependant on
management’s support , the quality of information and how this information will
be applied through the use of ABC and ABM. The literature thus correlates with
the results of this study indicated in the proposed model (page 62).
The results indicate that ownership by all parties and departments lacks within
the Grid. ABC is seen as purely a finance related tool hence little or no
involvement by core departments such as engineering is evident. Departments
working together towards continuous improvement would be a step in the right
direction for the Grid.
It is evident from this research that in order for management to achieve greater
returns from their investment in ABC, they must also use ABC to improve both
internal quality drivers and cycle time while using fewer resources to achieve
both of these objectives. Thus, if managers believe that their organisation's
strategic emphasis must be either on quality or cost improvement, but not both,
then they may behave sub optimally. In addition managers who believe that
using ABC to drive new quality enhancement initiatives, can result in both
revenue expansion and cost reduction for the Grid.
The results are of particular interest to accountants and finance managers
because they are the primary proponents and designers of ABC systems. The
results are also of particular interest to both operational managers and engineers
who are interested in preserving their quality image in order to influence
operational activities, while controlling departmental costs at the same time.
Thus, the results of this study should enhance the management’s of Eskom’s
confidence in operational and financial performance with aid of ABC and ABM.
119
SOURCE OF REFERENCE
Adams, G.R. and Schvaneveldt, J.D. 1985. Understanding Research
Methods. New York: Longman.
Albright,T. & Lam, M. 2006. Managerial Accounting and Continuous
Improvement Initiatives: A Retrospective and Framework. Journal of Managerial
Issues, 18(2), 161-162.
Asher, A. 1999. Public Enterprises [Online]. Available from:
http://www.accc.gov.au/content/item/ (accessed: 21 January 2009).
Barton, T.L. & MacArthur, J.B. 2003. Activity Based Costing and Predatory
Pricing: The Case of the Petroleum Retail Industry. Management Accounting
Qaurterly, 4, 3 - 15.
Baxendale, and Spurlock, 1997. Activity Based Costing [Online]. Available from:
http://www.allbusiness.com/management/business-process-analysis/376206-
1.html (accessed: 19 January 2009).
Blaikie, N. 1993. Approaches to Social Enquiry, Cambridge: Polity press.
Brimson, J.A. 2008. Activity Based Costing [Online]. Available from:
http://www.activitybasedmgmt.com/Activity_Based_Costing.htm (accessed: 19
January 2009).
120
Brown, D.A. & Booth, P. & Giacobbe, F. 2004. Accounting and Finance.
Published by Blackwell Publishing, 44 (2): 329–356.
Campi, J.P. 1992. It’s not as easy as ABC. Journal of Cost Management, 5-11.
Capps, D. & Timlin, P.S. 1998. ABC's of activity-based costing [Online].
Available from: http://www.conference.iproms.org/sites/conference.iproms.org
(accessed: 19 February 2009).
Carter-Brown, C. 2008. Determining a relationship between Eskom Distribution
network. Available from: www.nersa.org.za/ (Accessed: 23 January 2009).
Chinho, L. & Shofang, C. 2006. Exploring TQM's Impact on The Causal Linkage
Between Manufacturing Objective And Organizational Performance. Total Quality
Management & Business Excellence, 17(4): 465-484.
Chongruksut, W. 2002. The adoption of Activity Based Costing. Unpublished
Doctoral Research. Victoria University.
Christensen, B. 2001. Experimental Methodology, (8th ed.). USA: Pearson.
Collis, J.C. and Hussey, R. 2003. Business research. Palgrave: New York.
Cooper, R. & Kaplan, R.S. 1992. Activity-based systems. Measuring the costs of
resource usage. Accounting Horizons, 6 (3), 1-13.
121
Cooper, R. & Kaplan, R.S. & Maisel, L.S.& Morrissey, E. & Oehm, R.M. 1992.
Implementing Activity-Based Cost Management: Moving from Analysis to Action.
Montvale, NJ: Institute of Management Accountants.
Crisp, J.J. 2004. Asset Management in Electricity Transmission Utilities.
Available from: http://www.eprints.qut.edu.au/ (accessed: 15 January 2009).
Denscombe, M. 2002. Ground Rules for Good Research. Philadelphia: Open
university press.
Denzin N.K. and Lincoln, Y.S. 1998. Collecting and interpreting qualitative
materials. London: Sage Publications.
Denzin, N.K. & Lincoln, Y.S. 2003. The landscape of qualitative research.
Theories and issues. London: Sage Publications.
De Vellis, R.F. 1991. Scale Development: Theory and Application. California:
Sage.
De Vos, A.S. 2005. Combined quantitative and qualitative approach. Pretoria:
Van Schaik.
Distribution [Online]. 2007. Available from:
http://www.taitworld.com/main/index.cfm/1,796,539,45,html/Eskom-Distribution-
South-Africa/ (accessed: 15 January 2009).
122
Eskom [Online]. 2008. Available from:
http://wwww.financialresults.co.za/eskom_ar2008/ar2008/downloads/profile.pdf/
(accessed: 15 January 2009).
Feng, F. 2006. Research [Online]. Available from:
www.cust.educ.ubc.ca/wcourses/EDUC500 (accessed: 02 April 2009).
Garrison, R.H. and Noreen, E.W. 2000. Managerial Accounting. 9th Ed. New
York: McGraw-Hill.
Garrison, R.H. & Noreen, E.W. & Brewer, P.C. 2006. Managerial Accounting.
New York: McGraw-Hill.
Generation [Online]. 2009. Available from: http://www.
genweb.eskom.co.za/live/content.php?Category_ID=3/ (accessed: 15 January
2009).
Glad, E and Becker, H. 1994. Actvity-Based Costing and Management.
Johannessburg, Rustica Press.
Golafshani, N. 2003. Understanding Reliability and Validity in Qualitative
Research [Online]. Available from: http://www.nova.edu/ssss/QR/QR8-
4/golafshani.pdf (accessed: 05 May 2009).
Goldratt, E.M. and Cox, J. 1986. The Coal: A Process of Ongoing Improvement.
Great Barrington, MA: North River Press.
123
Gubata, J. 2008. Operational Cost [Online]. Available from:
http:www.//search.ebscohost.com (accessed: 19 January 2009).
Gupta, M. & Baxendale, S. & McNamara, K. 1997. Integrating TOC and ABCM in
a Health Care Company. Journal of Cost Management. 23-33.
Gupta, M and Baxendale, S. 2008. The Enabling Role of ABC systems in
Operations Management. Louisville, Kentucky.
Gupta, M. & K. Galloway. 2003. Activity-based costing. Management and its
implications for operations management. Technovation, 23 (2), 131-8.
Gurses, P.A. 1999. An activity base costing and theory of contrains model for
Product mix decisions. Unpublished Masters Dissertation. Viginia Polytechnic
Institute and State University. Blackburg. Viginia.
Hambrick, D.C. 1983. High profit strategies in mature capital goods industries: A
contingency approach. Academy of Management Journal 26 (4): 687-707.
Henderson, B,, and D, Henderson, 1979, Corporate strategy. Cambridge, MA:
Abt Books, Hill, C. W,L, 1988, Differentiation versus low cost or differentiation
and low cost: A contingency framework. Academy of Management Review 13
(3): 401-12.
Hollaway, W. & Jefferson, T. 2000. Doing qualitative research differently.
London: Sage Publications.
124
Holmen, J.S. 1995. ABC-vs-TOC. [Online]. Available from:
http://www.faqs.org/abstracts/Business-general/ABC-vs-TOC-its-a-matter-of-
time-Distribution-channel-profitability.html (accessed: 19 January 2009).
Hopper, T. & Major, M. 2007. Extending Institutional Analysis through Theoretical
Triangulation European. Accounting Review,16(1), 59 - 97.
Huang, L. 1999. The integration of Activity-Based Costing and the Theory of
Constraints. Journal of Cost Management, 5, 21-27.
Innes, J. & Mitchell, F. 1991. Activity Based Costing. A review with Case Studies,
London: The Chartered Institute of Management Accountants.
Johnson, T.H. 1990. Beyond product costing: challenges to cost management’s
conventional wisdom. Journal of Cost Management, 4, 15–21.
Khumalo, N. 2004. Eskom News. [Online]. Available from:
http://www.eskomtxweb.co.za/ (accessed: 11 January 2009).
Leedy, P.D. & Ormod, J.E. 2005. Practical research: planning and design. Upper
Saddle River: Pearson Merril Prentice Hall.
Maiga, A.S. & Jacobs, F.A. 2008. Extent of ABC Use and Its Consequences
[Online]. Available from: http:www.//search.ebscohost.com (accessed: 19
January 2009).
125
Martin, J.R. 2007. Management Accounting [Online]. Available from web:
http://www.maaw.com/ (accessed: 19 January 2009).
McMillan, J. & Schumacher, S. 1993. Research in education. New York: Harper
Collins College Publishers.
Miller, J.A. 1996. Implementing Activity-Based Costing in Daily Operations. New
York: John Wiley and Son, Inc.
Miller, D. 1987. The stmctural and environmental correlates of business strategy.
Strategic Management Journal 8 (1): 55-76.
Miller, D., and P. H. Friesen. 1986. Porter's (1980) generic strategies and
performance: An empirical examination with American data: Part 1 Testing
Porter. Organizational Studies 1-35.
Muijs, D. 2004. Doing quantitative research in education with SPSS. London:
Sage Publications
Needy, L.K. and Bopaya, B. 2000. A model to develop, assess and valdate an
Activity-based Costing system for small manufacturers. Engineering journal.
March: 12(1): 8-31.
Nepad [Online]. 2008. Available from:
http://www.nepadbusinessfoundation.org/nepad/press-11-06-08-Eskom.jsp/
(accessed: 15 January 2009).
126
Nersa [Online]. 2008. Available from: http:// www.Nersa.org.za/ (accessed: 11
January 2009).
Oakland, J.S. 2000. Total Quality Management (2nd ed.). Britain: Butterworth.
Pierce, B. 2006. Costing Systems [Online]. Available from: Available from:
http:www.//search.ebscohost.com (accessed: 19 January 2009).
Player, S. & Keys, E. 1999. Activity-Based Management: Andersen's Lessons
from the ABM Battlefield (2nd ed.). New York: Wiley.
Porter, M.E. 1980. Competitive strategy: Techniques for analyzing industries and
competitors. New York: Free Press.
Porter, M.E. 1985. Competitive advantage: Creating and sustaining superior
performance. New York: Free Press.
Rafig, A. and Garg, A. 2002. Activty Based Costing and Financial institutions; Old
wine in New Bottles or Corporate Panacea. Association for Management
Information. Journal of Bank Cost and Management Accounting, 15(2): 1-15.
Robson, C. 2002. Real world research. Oxford: Blackwell Publishing.

127
Sale, M.L. & Houston, S. 2007. Accounting to meet the needs of a changing
market. [Online]. Available from:
http://www.alliedacademies.org/Publications/Papers/JIACS/ (accessed: 15
January 2009).
Sangiovanni, J. 2004. Transmission services. [Online]. Available from:
www.aer.gov.au/ (accessed: 15 January 2009).
Sekaran, U. 2000. Research methods for Business: a skills building approach.
(3rd ed.). New York: John Wiley & Sons.
Schiff, J and Schiff, A.I. 2008, accessed: Focusing On Cost Management During
Economic Downturns [Online]. Available from: www.financialexecutives.org
(accessed: 19 January 2009).
Schoenbach, A. 2004. Data analysis and interpretation [Online]. Available from:
http://www.epidemiolog.net (accessed: 05 May 2009).
Scott, D. & Morrison, M. 2006. Key ideas in research. New York: Continuum
International Publishing Group.
Scott, D. & Usher, R. 2000. Researching education. Data, methods and theory
in educational enquiry. London: Continuum.
Shank, J., and V, Govindarajan, 1993. Strategic cost management: The value
chain perspective. Journal of Management Accounting Research 4: 179-97.
128
Sharman, P.A. 2003. The case for management accounting. Strategic Finance
[Online]. Available from: http:www.//search.ebscohost.com (accessed: 19
January 2009).
Spanos, Y.E., Zaralis, G. and Lioukas. S. 2004. Strategy and industry effects on
profitability: Evidence from Greece. Strategic Management Journal 25 (2): 139-
65.
Sutter, W.N. 1998. Primer of educational research. Boston: Allyn and Bacon.
The Division of Policy Analysis & Intergovernmental Liaison [Online]. 2001.
Market Power in a Transitioning Electric Industry. Available from:
http://www.psc.state.fl.us/publications/pdf/pai/markpwr.pdf/ (accessed: 10
February 2009).
Thomas, R.M. 2003. Blending Qualitative and Quantitative research methods in
Theses and Dissertations. California: Corwin Press Inc.
Turney, P.B.B. 1991. Common Cents: The ABC Performance Breakthrough.
Hillsboro. USA.
Vajeth, J. 2001. Eskom News. [Online]. Available from:
http://www.eskomtxweb.co.za/ (accessed: 11 January 2009).
Verma, G.K. & Mallick, K. 1999. Researching education: perspectives and
techniques. London: Falmer Press.
129
Van Maanen, J. 1993. Qualitative methodology. Sage Publications Limited.
United States of America.
Welman, C. & Kruger, F. & Mitchell, B. 2005. Research methodology. Cape
Town: Oxford University Press.
Whittaker, K. 2005. Five ways to deploying activity based costing [Online].
Available from: http://www.activitybasedmgmt.com/ (accessed: 19 February
2009).
Wiersema, W.H. 1995. Activity-Based Management: Today’s powerful new tool
for controling cost and creating profits. United States of America: American
Management Association.
Wilkinson, D. & Birmingham, P. 2003. Using research instruments: a guide for
researchers. London: Routledge Falmer.
Winberg, C. 1997. How to Research and Evaluate. Cape Town: Juta.
Wong, H. & Rich, N. 2000. Maintenance costing [Online]. Available from:
http://conference.iproms.org/sites/conference.iproms.org/files/PID177754.pdf
(accessed: 19 February 2009).

130
ADDENDUM A
FORMAL PERMISSION FROM THE GRID MANAGER OF ESKOM
TRANSMISSION SOUTHERN GRID

131
ADDENDUM B
QUESTIONNAIRE/ VRAELYS

132
ADDENDUM C
SEMI STRUCTURED INTERVIEW

133
ADDENDUM D
FOCUS GROUP INTERVIEWS