1
®
Customer Supplier Agreement (CSA)
Process Lead Time Reduction
LSS Project Update
Project Leads: Nadya Ramel-Barnes, Isabel Navarro
Team: Cyndi Muldoon, Mury Salls, Steven Krejick, Sebastian Aguiari, Sharon Harrison, Kelly Lorchick, Kevin Bray, Lance Bell, Joe Eagle,
Prat Shah, Rick Baxter
Project Champion: Lauren Zalewski
May 2015
To listen to a recording of this presentation: Click here
2
® Agenda
Project Overview
Pilot Site Updates
Primary Metric Control charts
Bin codes Dispatch & Routing (D&R) tags (TMS)
Next Steps
3
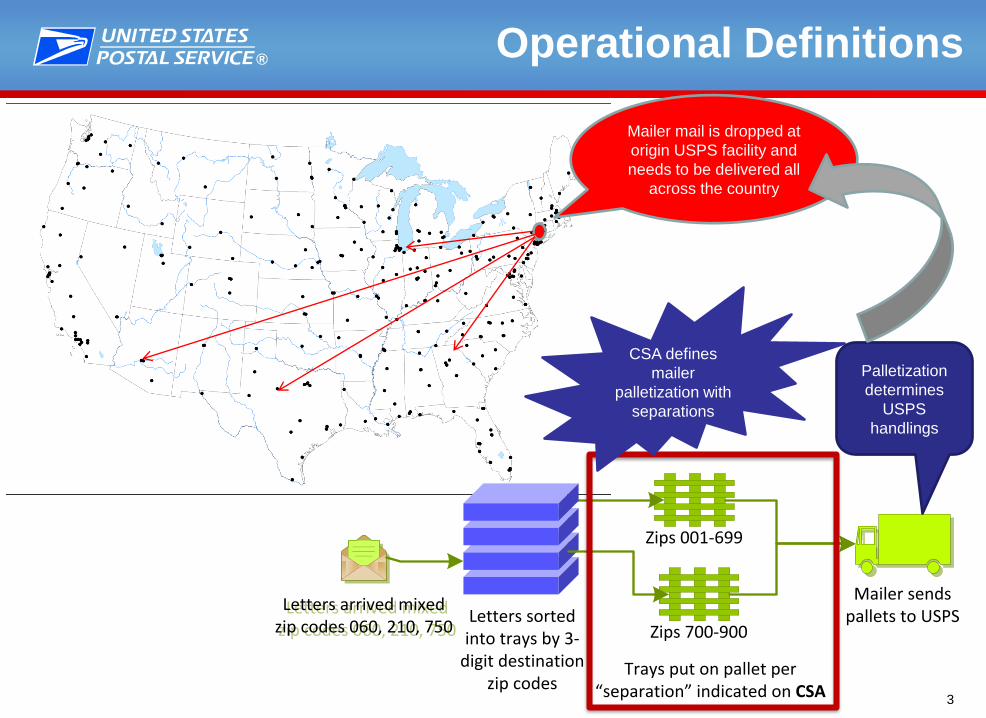
® Operational Definitions
Mailer sends pallets to USPS
Zips 001-699
Letters arrived mixed zip codes 060, 210, 750
Letters arrived mixed zip codes 060, 210, 750 Zips 700-900
Trays put on pallet per “separation” indicated on CSA
Letters sorted into trays by 3-
digit destination zip codes
CSA defines
mailer
palletization with
separations
Palletization
determines
USPS
handlings
Mailer mail is dropped at
origin USPS facility and
needs to be delivered all
across the country
4
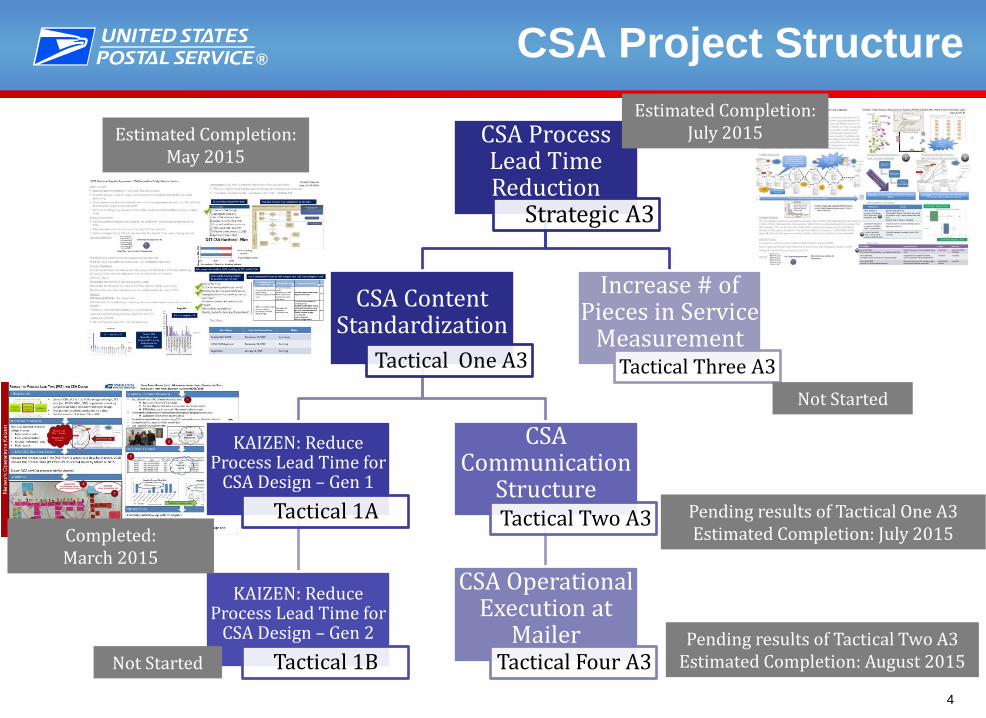
® CSA Project Structure
CSA Process Lead Time Reduction
Strategic A3
CSA Content Standardization
Tactical One A3
KAIZEN: Reduce Process Lead Time for
CSA Design – Gen 1
Tactical 1A
KAIZEN: Reduce Process Lead Time for
CSA Design – Gen 2
Tactical 1B
CSA Communication
Structure Tactical Two A3
CSA Operational Execution at
Mailer Tactical Four A3
Increase # of Pieces in Service
Measurement Tactical Three A3
Pending results of Tactical One A3 Estimated Completion: July 2015
Not Started
Pending results of Tactical Two A3 Estimated Completion: August 2015
Estimated Completion: May 2015
Estimated Completion: July 2015
Completed: March 2015
Not Started
5
®
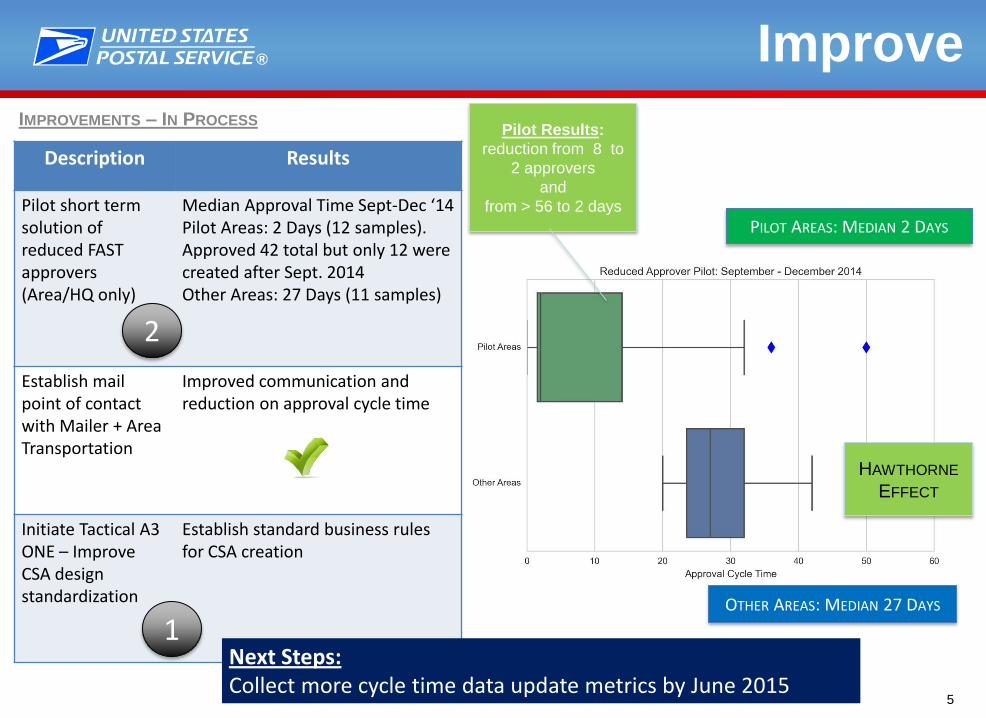
IMPROVEMENTS – IN PROCESS
Improve
Description Results
Pilot short term solution of reduced FAST approvers (Area/HQ only)
Median Approval Time Sept-Dec ‘14 Pilot Areas: 2 Days (12 samples). Approved 42 total but only 12 were created after Sept. 2014 Other Areas: 27 Days (11 samples)
Establish mail point of contact with Mailer + Area Transportation
Improved communication and reduction on approval cycle time
Initiate Tactical A3 ONE – Improve CSA design standardization
Establish standard business rules for CSA creation
2
PILOT AREAS: MEDIAN 2 DAYS
OTHER AREAS: MEDIAN 27 DAYS
1
HAWTHORNE
EFFECT
Pilot Results:
reduction from 8 to
2 approvers
and
from > 56 to 2 days
Next Steps: Collect more cycle time data update metrics by June 2015
6
®
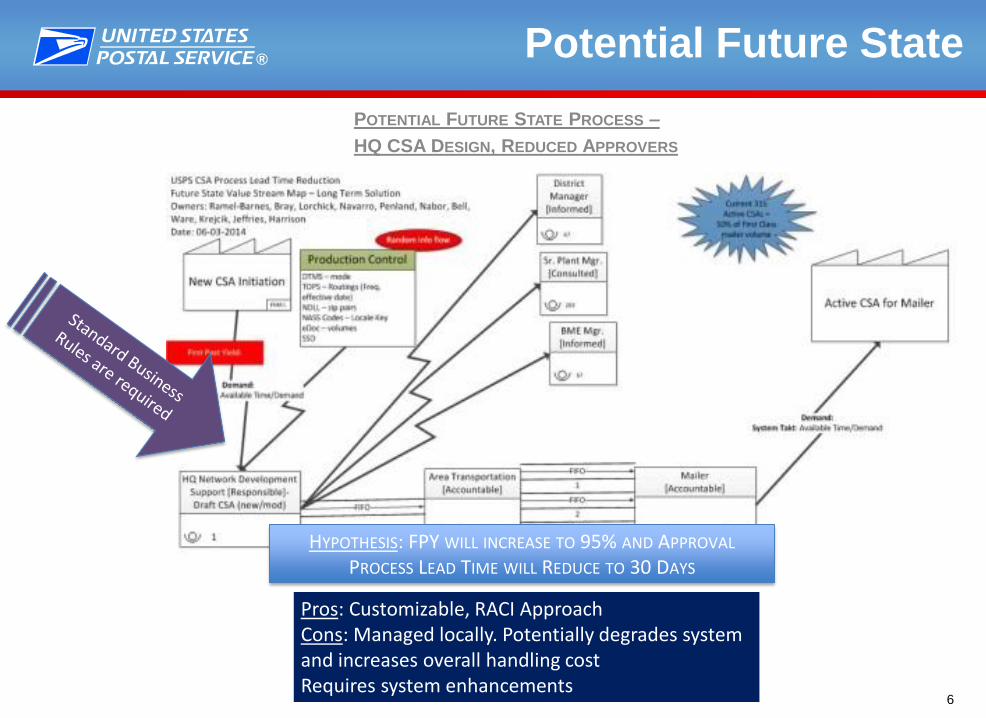
POTENTIAL FUTURE STATE PROCESS –
HQ CSA DESIGN, REDUCED APPROVERS
Potential Future State
HYPOTHESIS: FPY WILL INCREASE TO 95% AND APPROVAL PROCESS LEAD TIME WILL REDUCE TO 30 DAYS
Pros: Customizable, RACI Approach Cons: Managed locally. Potentially degrades system and increases overall handling cost Requires system enhancements
7
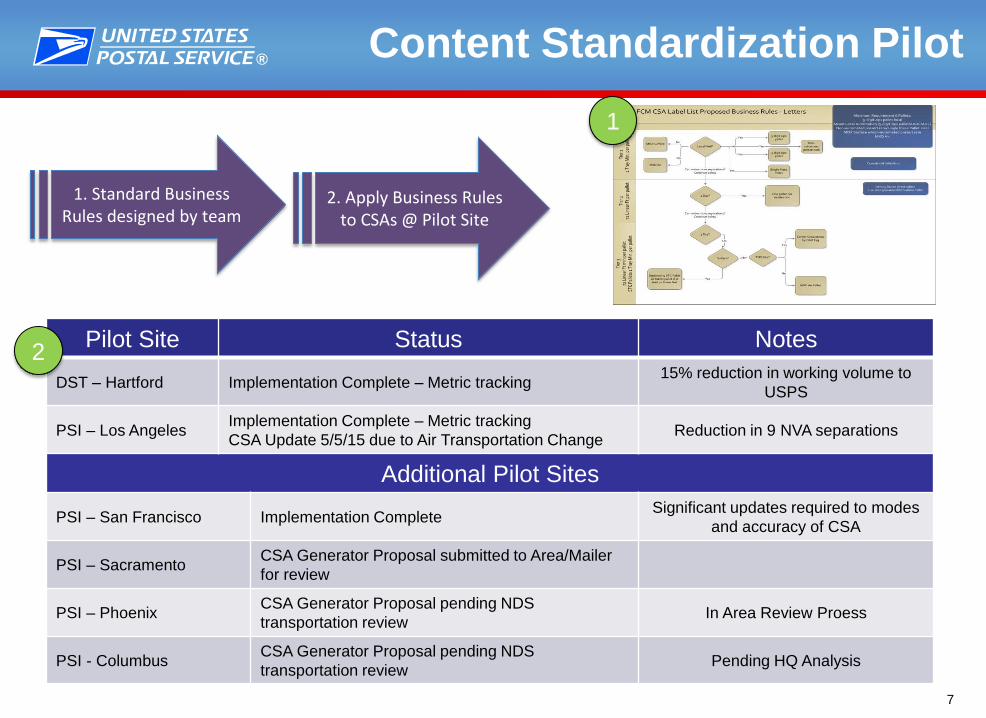
® Content Standardization Pilot
Pilot Site Status Notes
DST – Hartford Implementation Complete – Metric tracking 15% reduction in working volume to
USPS
PSI – Los Angeles Implementation Complete – Metric tracking
CSA Update 5/5/15 due to Air Transportation Change Reduction in 9 NVA separations
Additional Pilot Sites
PSI – San Francisco Implementation Complete Significant updates required to modes
and accuracy of CSA
PSI – Sacramento CSA Generator Proposal submitted to Area/Mailer
for review
PSI – Phoenix CSA Generator Proposal pending NDS
transportation review In Area Review Proess
PSI - Columbus CSA Generator Proposal pending NDS
transportation review Pending HQ Analysis
1. Standard Business Rules designed by team
2. Apply Business Rules to CSAs @ Pilot Site
1
2
8
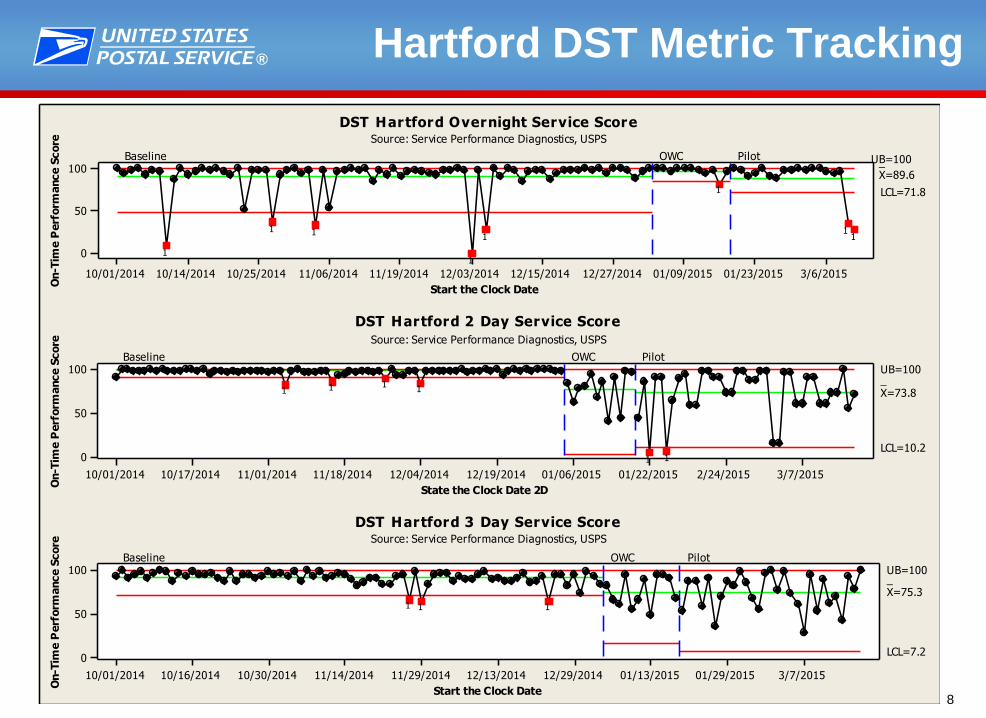
® Hartford DST Metric Tracking
3/6/201501/23/201501/09/201512/27/201412/15/201412/03/201411/19/201411/06/201410/25/201410/14/201410/01/2014
100
50
0
Start the Clock Date
On-T
ime P
erf
orm
ance S
core
UB=100
LCL=71.8
Baseline OWC Pilot_X=89.6
3/7/20152/24/201501/22/201501/06/201512/19/201412/04/201411/18/201411/01/201410/17/201410/01/2014
100
50
0
State the Clock Date 2D
On-T
ime P
erf
orm
ance S
core
_X=73.8
UB=100
LCL=10.2
Baseline OWC Pilot
3/7/201501/29/201501/13/201512/29/201412/13/201411/29/201411/14/201410/30/201410/16/201410/01/2014
100
50
0
Start the Clock Date
On-T
ime P
erf
orm
ance S
core
_X=75.3
UB=100
LCL=7.2
Baseline OWC Pilot
11
1
1
1
11
1
11
1111
111
Source: Service Performance Diagnostics, USPS
DST Hartford Overnight Service Score
DST Hartford 2 Day Service Score
Source: Service Performance Diagnostics, USPS
DST Hartford 3 Day Service ScoreSource: Service Performance Diagnostics, USPS
9
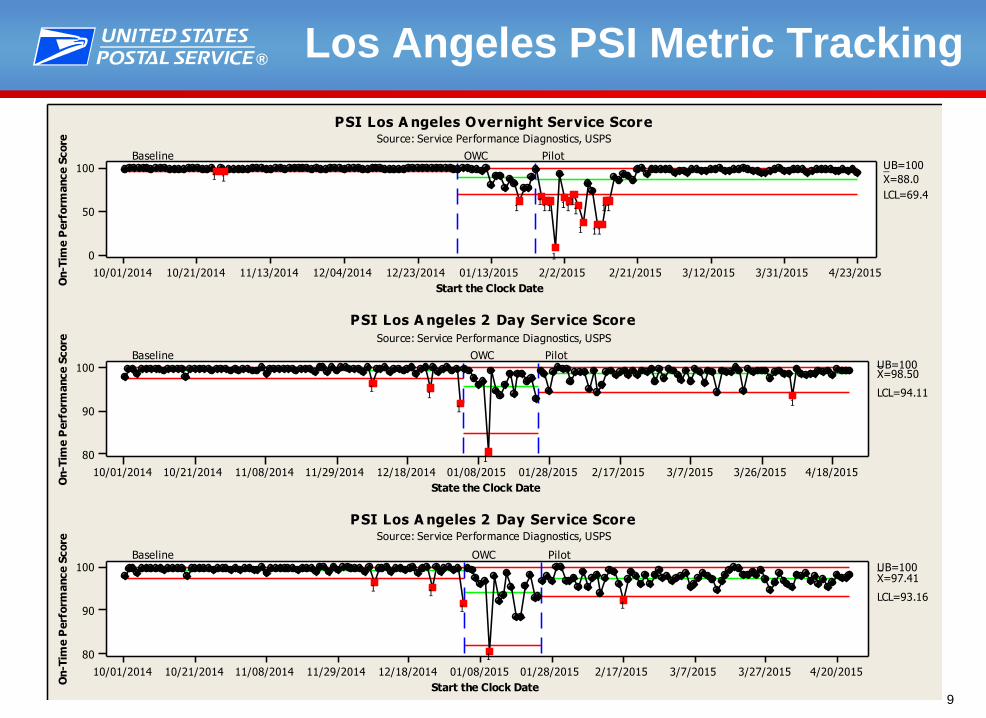
® Los Angeles PSI Metric Tracking
4/23/20153/31/20153/12/20152/21/20152/2/201501/13/201512/23/201412/04/201411/13/201410/21/201410/01/2014
100
50
0
Start the Clock Date
On-T
ime P
erf
orm
ance S
core
_X=88.0
LCL=69.4
Baseline OWC PilotUB=100
4/18/20153/26/20153/7/20152/17/201501/28/201501/08/201512/18/201411/29/201411/08/201410/21/201410/01/2014
100
90
80
State the Clock Date
On-T
ime P
erf
orm
ance S
core
_X=98.50UB=100
LCL=94.11
Baseline OWC Pilot
4/20/20153/27/20153/7/20152/17/201501/28/201501/08/201512/18/201411/29/201411/08/201410/21/201410/01/2014
100
90
80
Start the Clock Date
On-T
ime P
erf
orm
ance S
core
_X=97.41UB=100
LCL=93.16
Baseline OWC Pilot
11
111
11
11
1
111
1
11
1
1
1
11
1
1
1
11
PSI Los A ngeles Overnight Service ScoreSource: Service Performance Diagnostics, USPS
PSI Los A ngeles 2 Day Service Score
Source: Service Performance Diagnostics, USPS
Source: Service Performance Diagnostics, USPS
PSI Los A ngeles 2 Day Service Score
10
® Pilot – Lessons Learned
TMS/SAM-S @ Mailers
Bin Codes
Air Network Changes
Air/Surface mode changes
Measured Pieces
Mail is excluded from service measurement due to entry facility challenges
11
® Next Steps
Continue proof of concept pilots
Expanding CSA Design Standardization Pilot Sites
Continue content clean up
Start CSA Communication Structure Project