CTA-2045 Water Heater Demonstration Report
Including
A Business Case for CTA-2045
Market Transformation
BPA Technology Innovation Project 336
November 9, 2018

Demand Response Market Transformation and Business Case Report
Keywords: CTA-2045, demand response, grid responsive, market transformation, renewable integration, smart water heaters, thermal storage, transactive energy
Demand Response Market Transformation and Business Case Report
Table of Contents
Executive Summary............................................................................................................................................... i
1 Introduction ..................................................................................................................................................... 1
Background ............................................................................................................................................ 1
Why CTA-2045? .................................................................................................................................... 2
Vision ........................................................................................................................................................ 4
Objectives ................................................................................................................................................ 6
2 Project Approach ........................................................................................................................................... 7
Project Activities by Phase ............................................................................................................... 7
Recruitment Methods ......................................................................................................................... 9
Project Set-Up ..................................................................................................................................... 10
Evolution of Evaluation Plan ........................................................................................................ 10
Customer Satisfaction Assessment ............................................................................................ 12
Project Technology and Vendors ................................................................................................ 12
3 Findings .......................................................................................................................................................... 14
Background ......................................................................................................................................... 14
Approach to Reporting Evaluation Results............................................................................. 16
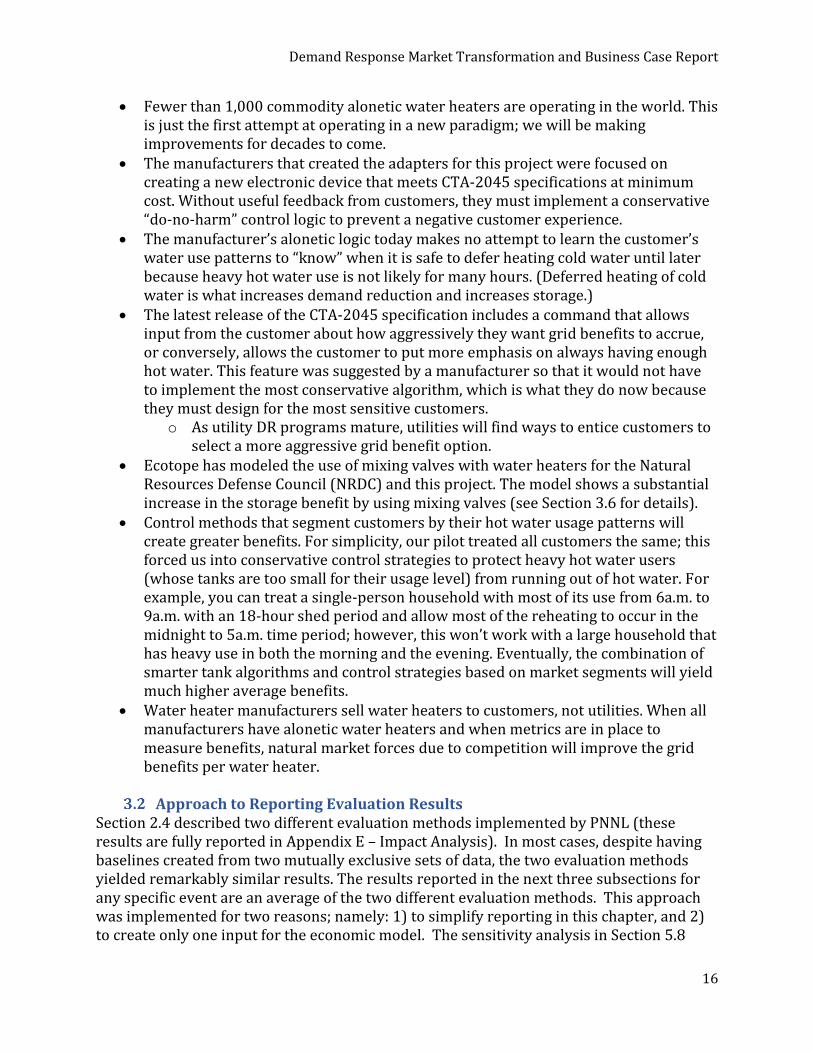
Peak Demand Mitigation and System Benefits ...................................................................... 17
Grid Emergency Benefits ............................................................................................................... 18
Energy Shift Benefits ....................................................................................................................... 18
Ecotope Load Shifting Study Findings: HPWH with Mixing Valves ............................... 21
3.6.1 Background ........................................................................................................................... 21
3.6.2 Results ..................................................................................................................................... 22
3.6.3 Comparison to Energy Shifting Using “Smart” Water Heaters ......................... 22
Improvements in Benefit Using Market Segmentation ...................................................... 23
Customer Acceptance Findings ................................................................................................... 24
Lessons Learned ................................................................................................................................ 26
4 The Market Transformation Plan – How We Plan to Do It ......................................................... 28
Market Opportunities ...................................................................................................................... 28
Market Barriers ................................................................................................................................. 29
Vision of End State of Transformed Electric Water Heater Market .............................. 31
4.3.1 Program Vision .................................................................................................................... 31
4.3.2 Scope of this Market Transformation Plan ............................................................... 32
Development of the Market Transformation Plan ............................................................... 32
Market Transformation Strategies ............................................................................................. 32
4.5.1 Strategy #1: Non-Recurring Manufacturing Costs ................................................ 33
4.5.2 Strategy #2: Offsetting the per-Unit Incremental Cost ........................................ 34
4.5.3 Strategy #3: Integration in Codes and Standards .................................................. 36
Implementation Approaches ........................................................................................................ 36
4.6.1 Aggregator or Market Actor Funds All the NRE and the Incremental Costs to Bring CTA-2045 to the Market for One or More of the Key OEMs. ................................ 37
Demand Response Market Transformation and Business Case Report
4.6.2 Non-Utility Market Actor Invests in One or More Water Heater Manufacturers and Funds All the NRE and the Incremental Costs. .............................. 37
Proposed Market Engagement (Utilities, Customers, and Manufacturers) ............... 37
4.7.1 Cohort One Campaign (begins 2020).......................................................................... 39
4.7.2 Cohort Two Campaign (begins 2021) ......................................................................... 39
4.7.3 Cohort Three Campaign (begins 2022) ...................................................................... 40
Awareness and Outreach Plan with Customers .................................................................... 41
4.8.1 Assumptions Driving Cross-Product Leverage ....................................................... 42
4.8.2 Goals ........................................................................................................................................ 43
Penetration of CTA-2045-Equipped Water Heaters in Oregon and Washington .... 43
5 Business Case – Benefits/Costs ............................................................................................................. 44
Method to Estimate Total Resource Availability .................................................................. 46
5.1.1 General Approach to Modeling Customer Enrollments ....................................... 46
5.1.2 The Estimate of Total Resource Availability in the Base Case Scenario ........ 50
Benefits for Four Different Types of Operating Utilities ................................................... 52
Total Cost Assumptions .................................................................................................................. 52
5.3.1 One-time Expenditures to Implement Market Transformation Plan ............. 52
5.3.2 One-Time Program Costs ................................................................................................. 53
5.3.3 Recurring Program Costs ................................................................................................ 54
General Approach to the Business Case Analysis ................................................................. 54
5.4.1 Establish DR-Ready Tank in the PNW: 2020 through 2024 .............................. 55
5.4.2 Water Heater Replacement Cycle: 2025 through 2039 ....................................... 55
5.4.3 Operations Period: 2040 through 2054 ..................................................................... 55
Summary of Net Economic Benefits .......................................................................................... 56
Other Economic Benefits ............................................................................................................... 57
Key Financial Assumptions ........................................................................................................... 58
Sensitivity Analysis .......................................................................................................................... 59
Additional Benefits ........................................................................................................................... 60
6 Conclusions and Recommendations .................................................................................................... 64
Conclusions and High-Level Findings ....................................................................................... 64
Recommendations for Next Steps .............................................................................................. 65
References ............................................................................................................................................................ 66
Appendix A – Definition of Terms ............................................................................................................... 68
Appendix B – NRDC Load Shifting Method .............................................................................................. 77
Value of a Mixing Valve Attached to Water Heater ........................................................................ 77
Heat Pump Water Heater Electric Load Shifting: A Modeling Study ...................................... 81
Appendix C – CTA-2045 Commands and Related Specifications .................................................. 110
C-1. Introduction ...................................................................................................................................... 110
C-2. CTA-2045 Background and Future .......................................................................................... 111
C-3. AWHS Specification ........................................................................................................................ 117
C-4. CEE Specification............................................................................................................................. 140
C-5. CEC Title 24 Draft Specification ................................................................................................ 147
Demand Response Market Transformation and Business Case Report
Appendix D – Study Method: BPA Water Heater Demand Response (CTA-2045) Evaluation, Measurement, & Verification Plan ............................................................................................................. 157
Project Research Goals ........................................................................................................................... 157
Measurement and Verification Plan .................................................................................................. 159
Appendix E – Impact Analysis ..................................................................................................................... 168
Load Shifting Using Storage Water Heaters in the Pacific Northwest .................................. 169
Appendix F – Lessons Learned ................................................................................................................... 190
Appendix G – Customer Interactions ....................................................................................................... 196
Initial Demographic Survey Results .................................................................................................. 196
Bimonthly Feedback Surveys ............................................................................................................... 200
Final Satisfaction Surveys ...................................................................................................................... 206
Loss of Participants during Project .................................................................................................... 211
Examples of Marketing Materials for Customers ......................................................................... 212
Appendix H – Utility Survey Feedback .................................................................................................... 216
Appendix I – Market Transformation Plan ............................................................................................ 225
I-1. The Market Transformation Plan – How We Plan to Do It ....................................................... 226
I-2. Logic Model – Assets, Barriers, Opportunities, Activities, Outputs, Outcomes, and Impacts ................................................................................................................................................................. 244
I-3. Market Baseline Study of Demand Response................................................................................. 252
Demand Response Market Transformation and Business Case Report
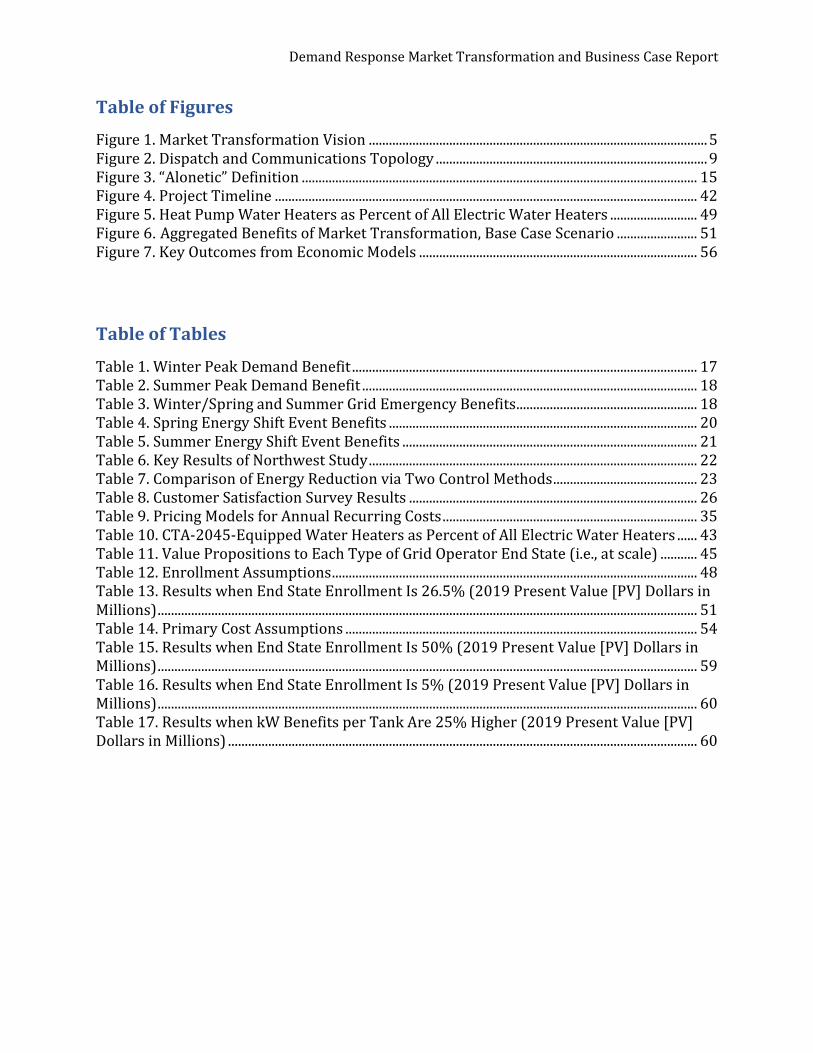
Table of Figures
Figure 1. Market Transformation Vision ..................................................................................................... 5 Figure 2. Dispatch and Communications Topology ................................................................................. 9 Figure 3. “Alonetic” Definition ...................................................................................................................... 15 Figure 4. Project Timeline .............................................................................................................................. 42 Figure 5. Heat Pump Water Heaters as Percent of All Electric Water Heaters .......................... 49 Figure 6. Aggregated Benefits of Market Transformation, Base Case Scenario ........................ 51 Figure 7. Key Outcomes from Economic Models ................................................................................... 56
Table of Tables
Table 1. Winter Peak Demand Benefit ....................................................................................................... 17
Table 2. Summer Peak Demand Benefit .................................................................................................... 18
Table 3. Winter/Spring and Summer Grid Emergency Benefits ...................................................... 18
Table 4. Spring Energy Shift Event Benefits ............................................................................................ 20
Table 5. Summer Energy Shift Event Benefits ........................................................................................ 21
Table 6. Key Results of Northwest Study .................................................................................................. 22
Table 7. Comparison of Energy Reduction via Two Control Methods ........................................... 23
Table 8. Customer Satisfaction Survey Results ...................................................................................... 26
Table 9. Pricing Models for Annual Recurring Costs ............................................................................ 35
Table 10. CTA-2045-Equipped Water Heaters as Percent of All Electric Water Heaters ...... 43
Table 11. Value Propositions to Each Type of Grid Operator End State (i.e., at scale) ........... 45
Table 12. Enrollment Assumptions ............................................................................................................. 48
Table 13. Results when End State Enrollment Is 26.5% (2019 Present Value [PV] Dollars in Millions) ................................................................................................................................................................. 51
Table 14. Primary Cost Assumptions ......................................................................................................... 54
Table 15. Results when End State Enrollment Is 50% (2019 Present Value [PV] Dollars in Millions) ................................................................................................................................................................. 59
Table 16. Results when End State Enrollment Is 5% (2019 Present Value [PV] Dollars in Millions) ................................................................................................................................................................. 60
Table 17. Results when kW Benefits per Tank Are 25% Higher (2019 Present Value [PV] Dollars in Millions) ............................................................................................................................................ 60
Demand Response Market Transformation and Business Case Report
Acknowledgements Bonneville Power Administration (BPA) wishes to acknowledge several people and organizations that have provided steady and ongoing support. First, thanks to Conrad Eustis with Portland General Electric (PGE). Conrad was co-lead primary investigator with BPA project lead Tony Koch, and was a key resource in helping to shape the project and a technical problem solver. We are in debt to eight retail utilities, and their staffs, who joined the project to serve as the customer recruitment and customer care functions. These are: Matt Babbitts and Larry Blaufus with Clark PUD; Rob Currier with Emerald PUD; Linda Esparza, Todd Blackman, and Richard Sargent with Franklin PUD; Conrad Eustis with PGE; Jon Fairless, Chris Boroughs, Jackie Kao, and Christina Crowell with Puget Sound Energy; Suzanne Frew and Kevin Watier with Snohomish PUD; DeeAnn Starr with Springfield Utility Board; and Breanna Chance, Bruce Carter, and Bill Dickens with Tacoma Power. All these utility employees and their colleagues provided their services in-kind. Many thanks to Geoff Wickes, with NEEA, our market transformation partner. Geoff was our water heater manufacturer ambassador, providing the project much market intelligence and water heater delivery infrastructure support. Thanks to Kelly Whitty, via NEEA, for the coordination of this project report. We are very thankful for bulk data processing and analysis functions provided by a small team at Pacific Northwest National Laboratory (PNNL), Cheryn Metzger, Sadie Bender, and Travis Ashley. We wish to recognize and thank six vendors who provided critical goods and service to the project. These are: Jackson Wang and Dan Nephin with e-Radio (communication modules and DR event dispatch and data collection portal), Bill Hosken and Brian Branecky with AO Smith (communication port adapters and resistance water heaters), Jared Potter and Chad Andrews with Ferguson (distribution of resistance water heaters), Beaumont Boyd and Tomas Garces with First Build (GE communication port adapters), Scott Shaffer and his team with GE Appliances (design of GeoSpring adapter), and Eliot Gardepe with Branditecture (customer recruitment marketing collateral). At least 4,000 hours were contributed by the in-house BPA team: Eva Urbatsch, Phillip Kelsven, Margaret Lewis, Michael Gross, Kari Nordquist, Shane Ripley, Keshmira McVey, Nathan Kelly, and Tony Koch. And lastly, we want to thank the 277 participants who acted as the first pioneers participating in a pilot using smart appliances. We learned a lot about how to design a future program because of their participation and feedback. Following are the participants who agreed to be acknowledged by name in our report:

Demand Response Market Transformation and Business Case Report
Demand Response Market Transformation and Business Case Report
i
Executive Summary Background The electric grid and the people who operate it are facing changes at a pace unprecedented since the days when Tesla and Edison fought over whether AC or DC electricity would be distributed. One thing is certain: renewable energy from wind and solar is here to stay as energy resources for the grid. Not only are these resources cost-competitive at scale with conventional power plants, but more importantly: customers, at least on the West Coast, overwhelmingly support renewable energy as a source they expect utilities to provide. A grid very rich in renewable energy from wind and solar resources will have large amounts of excess energy when the sun shines or the wind blows. While we will need electric storage to support the hours when neither wind nor solar energy is available, behavior-driven energy shifting to periods of excess renewables is a zero-cost measure, and appliances with built-in capability is a near-zero-cost measure in the end-state. When readers think “storage,” they might think electric batteries; however, this report addresses the concept of hot water heaters as “storage” and the ability to shift electric usage as occurs with battery storage. The demonstration pilot described in this report was conceived to create a market transformation plan that would put the Pacific Northwest1 (PNW) on a path to make hot water heating load shifting simple for customers without affecting their lifestyle. The key to customer simplicity and resource cost-effectiveness, as identified by a broad consortium of stakeholders2 [SGIP 2014], is widespread adoption of a standardized approach to communicating to loads that have flexibility about when they use electricity. This standard needs a marketing name, but the technical specification is called ANSI/CTA-2045. This communication interface is comparable in concept to a USB socket on a camera, TV, or computer, but this socket is specifically designed for appliances. The standard is discussed in Section 1.2. The analogy of a marketing name to a technical standard is the well-known marketing name of Wi-Fi vs. its technical standard, IEEE-802.11. Project Scope This project encompasses two major efforts:
1. Run DR Events: Recruit and install communications on residential CTA-2045-equipped water heaters, followed by running a set of demand response events from winter through summer season. Collect a rich set of data including load shift performance and customer experience. Chapters 2 and 3 present this first component. Data analysis from these events was the input for formulating a business case for a future market transformation effort.
1 Defined as the BPA transmission footprint of Washington, Oregon, Idaho, and western Montana 2 https://sepapower.org/resource/barriers-responsive-appliances-scale/
Demand Response Market Transformation and Business Case Report
ii
2. Create a market transformation plan and a business case to justify the cost:
The project was initiated because we anticipated if market transformation caused every water heater purchased in the next 15 years to be a CTA-2045-equipped water heater, then we could create a large cost-effective demand response resource that could be used on a daily basis. Chapter 4 describes the market transformation plan and Chapter 5, using the results reported in Chapter 3, shows that the costs of the market transformation plan would be cost-effective with a benefit/cost ratio of about 2.0.
Water heaters equipped with a CTA-2045 interface allow utilities to send frequent load curtailment requests to them; a smart algorithm in the control circuit of the heating elements designed by the tank manufacturer ignores the utilities’ request in order to ensure a large supply of hot water for the customer.3 This new approach to demand response greatly reduces the cost of controlling water heaters, while at the same time allowing daily control and improving the customer experience. Run DR Events This project was a unique demand response (DR) pilot for the following reasons:
• The largest smart water heater pilot ever implemented. • The first large demonstration of heat pump water heaters participating in DR
events. • Eight utilities all cooperating to implement the same event schedule. • Multiple DR events every day—over 600 events in 220 days; advance notice of
events was never provided. • Close coordination with key water heater manufacturers to prove out
communications and commands. In addition to the above-noted “firsts” in technology, process, and number of events, we ended with outstanding levels of success and satisfaction among the participants.
• 80% of customers were very satisfied with the pilot. • 94% of customers would be very likely or somewhat likely to a join a program based
on this technology in the future—our economic model assumes 26.5%. • Most if not all of the eight utilities found the experience favorable.
3 In this report, we call a water heater manufactured with this type of “smart” behavior – namely, behavior that can benefit the utility but prioritizes the needs of the customer first – a smart water heater. Throughout this report, we use the terms “CTA-2045-equipped water heater” and “smart water heater” interchangeably to mean the same thing.
Demand Response Market Transformation and Business Case Report
iii
This water heater pilot tested both electric resistance and heat pump water heaters and was conceived and implemented to collect statistically valid data for peak load mitigation and energy shifting to justify the cost of implementing a market transformation plan. Write a Business Case and a Market Transformation Plan The project was successful. This report includes the business case that justifies implementation of the next phase: Implementing a market transformation plan. The numbers provided, as well as the time required to roll out the program, are very conservative. If the region is interested in moving faster and achieving more benefits, then a more aggressive market transformation can be deployed. The highlights of the business case include (in the aggregate of Washington and Oregon):
• Creation of a 301MW peaking plant equivalent by 2039. • A long-term net present value (total resource) of $106 million, double this if
evaluated at a direct load control level. • A benefit-cost ratio of 1.74 compared to a simple peaking generation plant (2.45 as
direct load control). • 340 to 800 MWh of battery storage equivalence depending on time of day and year. • Numerous other benefits described in Section 5.9 that could not be economically
quantified. Important assumptions are tied to these results:
• By 2039 that 26.5% of all electric tanks will be enrolled in a demand response program.
• To achieve the 26.5% level, we need an average customer enrollment of 48% from participating utilities sufficient to represent 55% of the households in Oregon and Washington. One example that would achieve this level would be participation by six of the eight largest utilities in these states.
• The benefit-cost ratio is 1.0 even if customer participation is as low as 5%. • The economics assume that at least five large utilities participate in funding the
market transformation plan because they see the value of additional flexible-capacity resources before 2035. BPA does not currently project sustained capacity needs, but most of the regional utilities with coal plants will need additional capacity resources as coal plants are retired.
• The economic analysis observes a 35-year period—5 years to ramp up CTA-2045-equipped water heaters via the market transformation plan, 15 years to build the resource, i.e., replace the old water heaters, and 15 years of operation. Fifteen years is the average life of a water heater, so it takes that long for all old tanks to be replaced by the new smart water heaters.
Demand Response Market Transformation and Business Case Report
iv
• Present value costs stated in 2019 dollars include $28 million for market transformation (could be less if codes can be enacted sooner than 2028); $46 million for marketing and communication equipment; and $70 million in recurring program costs.
• Even though resistance tanks will represent only an estimated 69% of installed electric water heaters in 2039, they would represent 80% of the benefits. This fact creates urgency to start market transformation sooner, since the business case economics will erode for each year of delay.
The project was launched to gain experience in managing flexible loads with the ultimate expectation of influencing all flexible loads, not just water heaters. The benefits of this, the first market transformation plan to support a standardized, demand-responsive appliance, have far-reaching societal benefits beyond those quantified for hot water heaters in the Pacific Northwest. If launched, this plan would have national implications. For example:
• Electric water heaters in Oregon and Washington represent only 6% of the US total; the $106+ million present value (PV) benefits would extrapolate to approximately $2 billion across the US.
• Once the model of using a standardized interface is proven with water heaters, it would be easy for policymakers to require a similar approach for appliances that have no hope of being managed economically without standardization, such as refrigerators, dishwashers, and clothes dryers. In view of customer flexibility or the innate thermal storage available in refrigerators, these loads all offer flexibility to shift electric use to times of excess renewable energy.
• This open standard model is a highly desirable alternative compared to a model of going through a manufacturer to control load—i.e., the approach being used for thermostats. The proprietary interface model, often referred to as an application programming interface (API), has the advantage of being introduced first, but it is inferior on many dimensions that will limit the value of flexible loads because this approach won’t scale. Deficits include:
o At scale, third-party cybersecurity methods may not meet North American
Electric Reliability Corporation (NERC) and Federal Energy Regulatory Commission (FERC) requirements.
o This approach is contrary to the proven open model that puts the customer in charge of putting apps on their smartphone.
o It requires the cost of a bilateral legal agreement between every energy service provider and the manufacturer of a load worthy of control. Picture 40 major device makers and 2,000 utilities; now picture 80,000 legal agreements that would have to be created and maintained.
o The third party has the right to change its application interface to the energy service provider, even if only to provide enhancements; now picture 2,000 IT departments having to modify interfaces to 40 major manufacturers.
o The added costs of working through a third party, altogether unnecessary in an open model, would make control of many loads cost-prohibitive.
Demand Response Market Transformation and Business Case Report
v
o It complicates the enrollment process for the customer and they wouldn’t have a direct line of sight to their energy provider, who is the source of any monetary benefits, not to mention diminished benefits to cover third-party costs.
o For some loads such as water heaters that can be used multiple times per day, the required dynamic feedback through a third party is cumbersome, if not altogether impossible, based on the privacy policy the third party might have with its customer.
o Using Wi-Fi requires constant maintenance by the consumer. If changes occurred to a customer’s Wi-Fi or provider, all device connections would need to be re-established. Water heaters are a low priority for most consumers; unless they fail to provide hot water, most customers don’t even know what type or size water heater they have, let alone how or why to connect to it.
The proposed market transformation plan starts in 2020. All the years cited in the report are relative to this starting time. It is important to understand that we need a critical mass of utility participants before we can begin. Thus, 2020 is a relative starting point that could be labeled Year 1; however, citing actual years simplifies synchronizing all the parts of this report. The market transformation plan is summarized in Chapter 4 of this report and the full assessment is provided in Appendix I – Market Transformation Plan. Chapter 4 provides sufficient detail so that we can estimate the cost to implement the plan, a cost expenditure that is justified by the business case provided in Chapter 5. After an analysis of the water heater market and the barriers and opportunities that affect the market transformation objective—namely, that all electric water heaters arrive in the Pacific Northwest with a native CTA-2045 communication port—a plan must be created detailing a series of actionable milestones that lead to the stated objective. With a specific, detailed plan, the timeline and cost to implement that plan can be estimated. The market transformation plan recognizes that there are three major water heater manufacturers, and each must be engaged and educated on what functionality the internal control program of a demand responsive tank must perform. Chapter 4 explains how we used the markets of Portland, Seattle, and a third market to be determined, to develop capability in each of these manufacturers before scaling up volume in all the manufacturer’s distribution channels in Oregon and Washington. In 2020 we would launch the first manufacturer in metro Portland, since Portland General Electric is already implementing a water heater demand response program. A year later, the second manufacturer would launch in the metro Seattle area with one or more utilities in that area, and in 2022, the third manufacturer would launch with utilities still to be determined. Each launch starts with a limited, two-year test period to provide for testing of the functionality developed by the manufacturer to ensure performance conforms to requirements.
Demand Response Market Transformation and Business Case Report
vi
After each test period, and permanently thereafter, each manufacturer would distribute a full product line of popular tanks with the CTA-2045 interface into a broad geographic area and stop shipping tanks that don’t have the interface. The market transformation plan must fund the incremental cost difference for the manufacturer to remain competitive and maintain its market share. Thus, by 2024, all three manufacturers would be shipping mostly CTA-2045 electric water heaters (standard electric and heat pump) to all distribution channels in Oregon and Washington. About 67% of all market transformation dollars spent in 2020 to 2024 would cover the Original Equipment Manufacturers’ (OEMs’) incremental cost to make DR-ready tanks. In 2025 and 2026, the percentage increases to nearly 88%. The incremental cost per tank in these later years is estimated at roughly 8% of the tank’s retail price; incremental costs must remain in the plan until state codes are in effect to require a level playing field for all manufacturers. The other cost components of the plan include 1) test systems, 2) labor to coordinate with utilities and manufacturers, 3) regional education efforts for customers and utilities, 4) covering non-recurring engineering cost of the manufacturers, and 5) funding development of aggregators to simplify the ability and cost for small utilities to run DR programs. The current plan and business case are based on implementation in only Oregon and Washington, to leverage the economies of scale in the larger urban areas. However, when a host utility in Montana or Idaho steps forward, we will cover those states as well. More importantly, the plan welcomes participants anywhere in the US. In fact, once this report is published, we will approach a number of utilities that have followed the progress of this pilot. There is just one requirement to enable participation outside the PNW: namely, a commitment to cover the incremental cost of CTA-2045-equipped tanks throughout a large geographic area. The reasons for the large area are 1) to simplify distribution logistics for the manufacturers, and 2) to simplify future DR program marketing. The last reason bears further explanation. Marketing to customers to join a DR program must target those that have purchased a tank with the standard communication interface. A large geographic area ensures that the education campaign via radio, TV, and newspaper would be cost-efficient. Even though there would be an icon to identify suitable tanks, messaging would be more effective if we can say “Most tanks purchased after 2024 will qualify for our program.” The market transformation plan is just that at this point: a “plan.” As with all market transformation efforts, it relies on regular feedback and adjustment to address the changing landscape. The plan will deploy the “agile” development concept with high iteration cycles, and with constant focus on the end result with ever-improving action to maximize impact and delivery. Given the variety of benefits stated in Chapter 5, we encourage both the regulators of investor-owned utilities and the boards that govern public utilities to view investment in the market transformation plan recommended in this report in the interest of the end-use customers they represent, for the utility(s) under their purview as a prudent, or even mandatory effort as part of a utility’s near-term action plan to meet long-term resource needs. For various reasons stated throughout the report, we need to start this effort as

Demand Response Market Transformation and Business Case Report
vii
soon as possible. Even if resource capacity (the primary benefit quantified in this report) for a specific utility is not an identified need, the methods to monetize the other benefits of Sections 5.6 and 5.9 are likely to become viable in the next 20 years; however, since the resource takes 20 years to fully build, we need to start the market transformation process as soon as we can establish sufficient commitment. If we get the 55% utility participation (weighted by customers) assumed for the base case scenario, the pro rata share of the market transformation cost would be $1.75 per residential customer per year for eight years. This amounts to about $254 per CTA-2045-equipped electric water heater. Fewer years and less cost per year is needed if state codes requiring CTA-2045 on tanks can be implemented before 2027. In closing, this project, the market transformation plan, and the business case delineate an important call for action, the first steps toward changing the customer paradigm for the 21st century. Our customers are asking for leadership to bring greater percentages of renewable energy onto the grid; they also expect leadership to keep electric price increases to a minimum. What most customers don’t know yet is that they have a role to play in keeping prices down. For the past 125 years, the customer expected that whenever they turned on an electric load that the grid would be there with sufficient power. In the renewable era, customers will need to participate to help shift energy use to when renewable energy is available. Based on the final customer survey, the vast majority of the 277 residential customer pioneers cited in the Acknowledgements section are ready to support this new ethic now.5 All industry stakeholders reading this report have a responsibility to meet the needs of their customers. Changing the customer paradigm to use flexible loads will take more than a decade of persistent education and messaging. Our role is to make it easy for customers to participate. Your role as an industry leader is to find the support to fund this market transformation plan.
4 $25 = $1.75 * 8 years/0.56. 56% represents the total percentage of electric water heaters in all residential homes in the PNW. 5 See Section 3.8

Demand Response Market Transformation and Business Case Report
1
1 Introduction The regional CTA-2045 Water Heater project began in 2015 as a proposal jointly created by the Bonneville Power Administration (BPA) and Portland General Electric (PGE) with funding from BPA’s Technology Innovation Program to implement a large regional pilot project using the CTA-2045 technology on electric water heaters. The primary objective was to collect statistically valid results from demand response (DR) control events that would economically justify a market transformation effort to fund manufacturers to add the CTA-2045 communication interface into all electric water heaters shipped to the Pacific Northwest. (Section 1.2 describes the reasons behind the interest in CTA-2045.) This report is the successful conclusion to that project: BPA TIP-336 [BPA 2015]. The primary deliverable for BPA TIP-336 is a market transformation plan and business case, to be finalized by November 12, 2018. The execution of that plan is outside the scope of the project and requires a new effort and new funding. For reference purposes, we use calendar years (for out years) to designate when specific activities and milestones would be completed in the implementation plan and the model. That said, if the planning process or coalition-building took longer, the project would simply start later. Appendix A – Definition of Terms defines many of the acronyms and phrases used throughout this report.
Background The Northwest Power & Conservation Council’s (NPCC’s) Seventh Power Plan [NPCC 2016] finds that the region uses capacity resources under most future scenarios. As many utilities decommission older gas and coal plants, they create a capacity deficit that demand response can partially fulfill. BPA’s DR supply curve shows that by using traditional water heater control methods, the resource is small and only marginally cost-effective.6 With CTA-2045 technology, the regional economic potential increases to 1,200 MW; this report assumes a 26.5% customer enrollment level, which we believe creates a conservative resource opportunity of 301 MW. Another value of this resource is the ability to use “smart”7 water heaters like batteries to help integrate renewable energy from wind and solar generation.8 It is well-understood
6 https://www.bpa.gov/EE/Technology/demand-response/Documents/180319_BPA_DR_Potential_Assessment.pdf Figure 1, executive summary page vii 7 Smart water heaters differ from traditional water heater demand response through installation of a control switch that cycles the electric supply to the water heater. In brief, the technical differences allow the water heater to be cycled more than 500 times per year instead of five to 10 times to mitigate system peak demand. A “smart” manufacturer’s control algorithm at the water heater prevents the customer from running out of hot water. 8 In this report, references to renewable generation will strictly mean new stochastic generation resources such as wind and solar, and not hydroelectric generation which, although renewable, is easily controlled.
Demand Response Market Transformation and Business Case Report
2
that smart electric water heaters, by controlling when they heat cold water, can be used as thermal batteries to capture all the valuable benefits sought from electric storage batteries at a fraction of the cost, or for “free” if the program is first implemented as a peak demand resource [Brattle Group 2016]. An explanation of the tank as a battery is in Appendix B – NRDC Load Shifting Method. Fifty-five percent of the region’s households have electric water heaters, and roughly seven percent of electric water heaters fail and are replaced with new water heaters every year; this yields ~220K electric water heaters a year coming into the region. This turn-over is a great opportunity to promote efficiency and connected “smart” water heaters to help out the grid. In many parts of the United States, but especially on the West Coast, major initiatives are in progress to reach high levels of renewable generation. Oregon has a state-mandated legislation to reach 50% renewable energy before 2040 and California just passed a law to reach 100% renewables by 2045. Many jurisdictions have aspirational goals of 100% renewable energy. Many private sector companies are seeking 100% renewables to fuel their business activities to demonstrate to their customers their commitment to sustainable practices. Because of the limited hours of production relative to conventional generation, a commitment to 50% of energy demand generated from wind and solar means that during a significant fraction of the year, the output from these resources will exceed the load they were built to serve. On more than 30 days in 2017, the real-time energy market prices in California went negative due to excess renewable generation. In other words, the California Independent System Operator (CAISO) paid utilities to take energy rather than curtail generation output [Penn 2017]. A 26.5% enrollment of smart water heaters in the Pacific Northwest (PNW) would allow system operators to choose, up to twice daily, when water heaters consume about 700 MWh on average. This might be to absorb excess solar energy mid-day or excess wind energy at night. If we assume 200 days with an average $35/MWh savings by shifting load, this creates a $4.9 million benefit per year.
Why CTA-2045? The Northwest Power and Conservation Council’s Seventh Plan recognizes the potential of water heater storage; however, current technologies are only marginally cost-effective. Since the market transformation plan proposed in this report establishes the use of a single communication interface in water heaters, it is useful to know a bit more about this standard and why it was selected. “CTA-2045” refers to a specification published by the Consumer Technology Association (CTA) and dual-listed by the American National Standards Institute (ANSI). From 2008
Demand Response Market Transformation and Business Case Report
3
through 2012, this national standard was created through a collaborative and collective effort by Electric Power Research Institute(EPRI), the Smart Grid Interoperability Panel (SGIP),9 manufacturers, utilities, and a number of standards experts from the high-tech industry. The closest and most similar existing standard is for the ubiquitous USB socket. Like USB, the specification defines two devices: the primary device (e.g., a laptop or TV) which has the socket, and the device that gets plugged into the socket (e.g., a mouse or memory drive). In CTA-2045, the primary device is called the smart grid device (SGD), which could be any significant appliance such as a water heater. Since the standard was created to facilitate demand response, the second device is called the universal communication module (UCM). From 2012 through 2015, EPRI, together with about 20 utilities (including BPA and PGE), engaged manufacturers of specific products such as water heaters, thermostats, and electric vehicle (EV) chargers to define demand responsive behavior, specific to each product, in response to a number of CTA-2045 application layer commands. After reaching consensus, about half of the utilities tested CTA-2045-equipped prototypes for each product in employee homes. To further commercialize the CTA-2045 technology, this regional pilot began where the EPRI work ended. The most important purpose of the standard is to define how to pass information from the UCM to the SGD through the socket. The design of the standard is generic; a UCM will never know what type of appliance it might get plugged into, and the SGD does not care about where or how the UCM sends data to somebody or something. A lot of policy makers are concerned about picking a standard, instead preferring to “let the market work.” However, the two reasons below explain why policy makers should take action on this standard now. First, our market is defined by more than 2,000 utilities and 40 major appliance makers.10 Unlike the computer and phone industries, which are dominated by a few players who can, or have, created market standards, there is little hope that a single standard will emerge without the support of policy makers. A single, open standard is critical for DR cost-effectiveness and a simple customer experience. The lack of either of these would greatly diminish the scale of flexible loads that get enrolled in programs.
9 SGIP (the Smart Grid Interoperability Panel), a group of 700 diverse industry stakeholders, was formed in 2008 by the National Institute of Standards and Technology (NIST) as directed by Congress as part of its responsibilities under the Energy Independence and Security Act of 2007. 10 In the US: 10 major “white goods” makers, six major HVAC makers, three major water heater makers, 10 major EV makers, three major pool pump makers, four major thermostat makers, and four in-home communication makers

Demand Response Market Transformation and Business Case Report
4
Second are these facts about the advantages of a “socket” standard compared to others:
• A socket approach enables all other standards advocates talk about. It: o Enables any external communication method placed inside the UCM, e.g., Wi-Fi,
Zigbee, 4G LTE, Z-Wave, Bluetooth, FM broadcast, and any future method, e.g., 5G .
o Enables any DR command language used by a service provider, e.g., OpenADR, SEP 2.0, BACnet.
• It puts the customer in charge of how communication links to their appliances will occur.
• It will never be obsolete; when you put it on a water heater, that open standard will work exactly the same in 20 years when we have new communication methods. The customer may change the UCM to enable new business models or service providers, but the demand response functionality embedded by the OEM will always be as available over the 15- to 30-year life of the appliance as on the day it was made.
• A single, open socket standard means UCMs can be produced in volume, greatly lowering its price.
• There is no other suitable socket standard defined, except for USB. More details about the port on the water heater, the communications module, and commands can be seen in Appendix C – CTA-2045 Commands and Related Specifications.
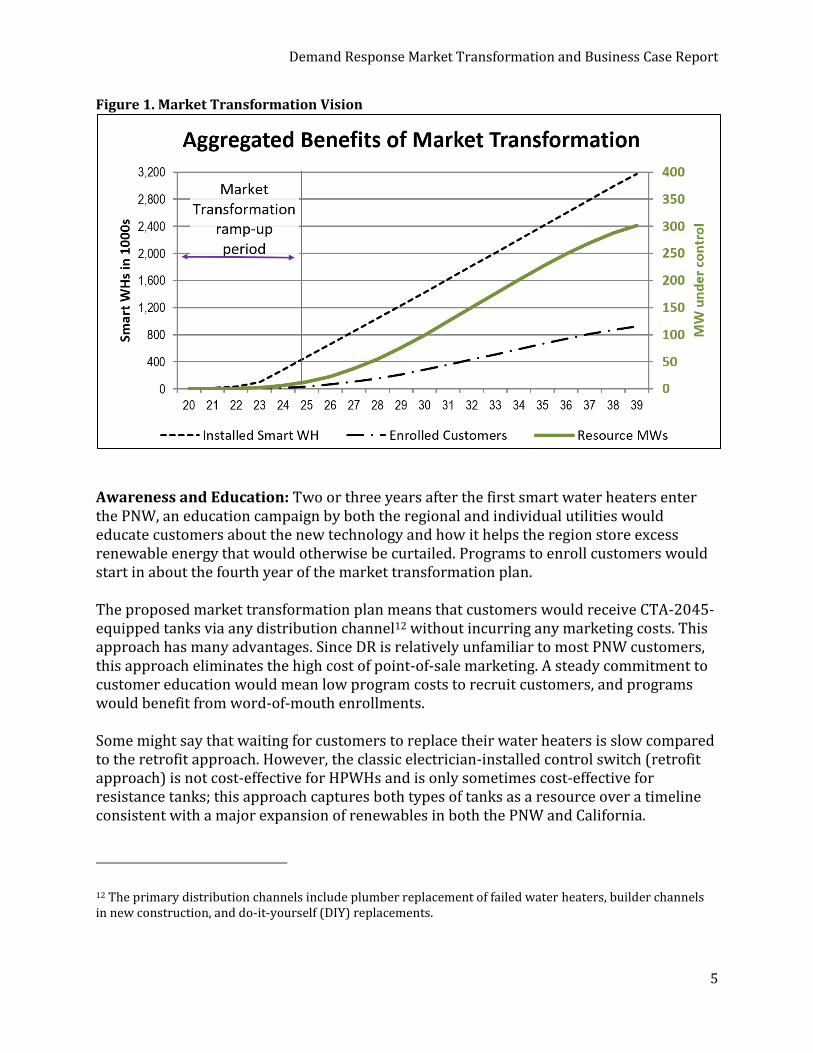
Vision As of 2017, the PNW had an installed electric water heater base (tanks 40 gallons and larger) of about 3.3 million homes.11 Fulfilling the objective of a successful market transformation plan would mean that all new tanks would arrive in the PNW from the manufacturer with the CTA-2045 technology added in the tank. The ramp-up period would take about five years; after another 15 years, 95% of all electric tanks would be demand response (DR)-ready (see Figure 1).
11 The Pacific Northwest had about 5.9 million households in 2017. https://www.census.gov/housing/hvs/definitions.pdf
Demand Response Market Transformation and Business Case Report
5
Figure 1. Market Transformation Vision
Awareness and Education: Two or three years after the first smart water heaters enter the PNW, an education campaign by both the regional and individual utilities would educate customers about the new technology and how it helps the region store excess renewable energy that would otherwise be curtailed. Programs to enroll customers would start in about the fourth year of the market transformation plan. The proposed market transformation plan means that customers would receive CTA-2045-equipped tanks via any distribution channel12 without incurring any marketing costs. This approach has many advantages. Since DR is relatively unfamiliar to most PNW customers, this approach eliminates the high cost of point-of-sale marketing. A steady commitment to customer education would mean low program costs to recruit customers, and programs would benefit from word-of-mouth enrollments. Some might say that waiting for customers to replace their water heaters is slow compared to the retrofit approach. However, the classic electrician-installed control switch (retrofit approach) is not cost-effective for HPWHs and is only sometimes cost-effective for resistance tanks; this approach captures both types of tanks as a resource over a timeline consistent with a major expansion of renewables in both the PNW and California.
12 The primary distribution channels include plumber replacement of failed water heaters, builder channels in new construction, and do-it-yourself (DIY) replacements.
Demand Response Market Transformation and Business Case Report
6
The expected resource in Figure 1 is based on participation in 26.5% of homes that have electric water heaters. This assumption is based on 55% of utilities (weighted by the number of residential customers) achieving 48% participation of their customers with electric water heaters by 2039. Since many PNW utilities may not have an immediate need and a defined plan for capacity or storage, the market transformation plan describes how to engage with utilities both in and out of the region.
Objectives From the perspective of justifying implementation of the market transformation plan, this project had four main objectives:
1) Create a market transformation plan that provides for all electric water heaters 40 gallons and larger to enter the PNW with CTA-2045 technology, and estimate the cost to implement this plan. (Chapter 4).
2) Implement a pilot that enrolls customers and run sufficient events on smart water heaters to create a statistically significant quantification of the benefits to a) shed load from peak demand periods (Section 3.2) and b) shift energy into periods of likely excess renewable generation (Section 3.5).
3) Create a business case based on the benefits that justifies the market transformation and other implementation costs (Section 5.5) to enroll and gain acceptance with regional utilities to implement an electric water heater demand response program.
4) Demonstrate survey results of customer acceptance that justifies the adoption rates stated in the business case (Section 3.8).
The remainder of this report explains the results of this project as they relate to these objectives.
Demand Response Market Transformation and Business Case Report
7
2 Project Approach The project used fully commercial, commodity electric water heaters produced by AO Smith and GE Appliances as sold through existing distribution channels. All of the tanks used had a communication interface in the product, albeit a proprietary interface unique to the manufacturer. Although fully commercialized, these interfaces exist on only 5% to 8% of all electric water heaters sold. To make these tanks “smart,” we engaged the manufacturers to create a communication adapter that provided key functionality; namely, 1) a standard CTA-2045 communication interface, and 2) demand responsive behavior as defined by the EPRI [EPRI 2014]. The research goals for this pilot (from Appendix D – Study Method: BPA Water Heater Demand Response (CTA-2045) Evaluation, Measurement, & Verification Plan) were:
1. Determine a statistically valid kW reduction (on-peak) from "smart" resistance and HPWHs by hour (i.e., how it changes over the duration of an event). This will be done for different commands including shed and grid emergencies.
2. Demonstrate a 24x7 control paradigm for shifting load and renewables integration. 3. Evaluate customer acceptance/impact of 24x7 DR operation of their water heaters. 4. Analyze data reported from universal communication modules (UCMs). 5. Do smart water heaters work? 6. Identify and answer other research questions that come up from reported data.
Project Activities by Phase
In a parallel effort, the project engaged a CTA-2045 communication vendor and utilities to participate in the project. The summary below highlights all of the activities included in the project before we could recruit customers, start running control events, and analyzing the impact of control events. The project had three major phases, each taking about a year. Activities in Year 1 included:
a) Engaging with the three primary suppliers: AO Smith, General Electric Appliances, and e-Radio with requirements, creation of scopes of work, and contracting.
b) Engaging with interested utilities in the BPA operating area to explain the project and gain preliminary commitments.
Demand Response Market Transformation and Business Case Report
8
Activities in Year 2 included:
a) Gaining firm commitments from utilities. b) Creating purchase contracts from the three suppliers. c) End-to-end testing of the communication equipment provided by the three
suppliers. d) Developing the customer recruitment process with participating utilities. e) Development of marketing, training, and installation collateral for customers,
including the customer agreement, and plumbers. f) Development of the evaluation plan and gaining the support of Pacific Northwest
National Laboratory (PNNL) to implement the detailed event impact analysis (see Appendix E – Impact Analysis).
Activities in Year 3 included:
a) Recruiting customers. b) Implementing control events (demand response events). c) Perfecting the impact analysis method. d) Implementing customer surveys and the evaluation of customer experiences. e) Creation of this report. f) Creation of the market transformation plan for CTA-2045-equipped water heaters. g) Creation and vetting of the business case that supports the plan above.
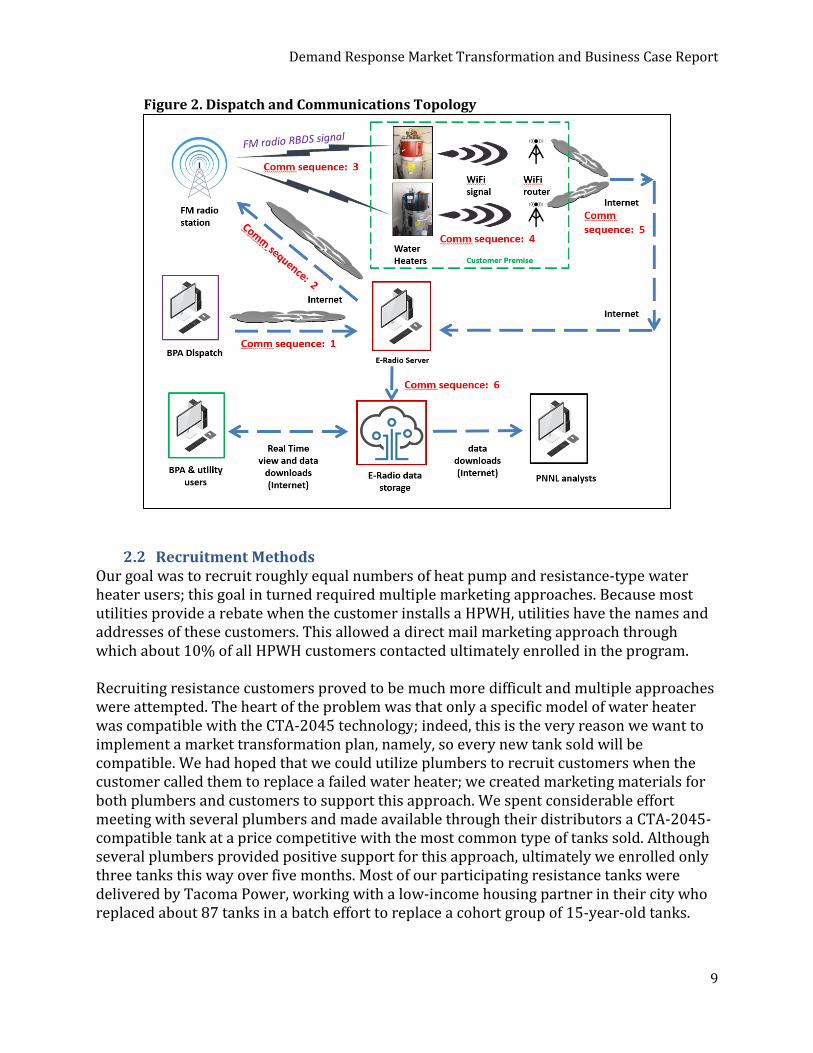
The basic approach was to find water heater manufacturers that would add CTA-2045 technology to their existing water heater tanks, both heat pump and resistance, by building devices that would translate their proprietary communication interface to the CTA-2045 standard. AO Smith and General Electric Appliances were the participating manufacturers. Since we wanted a diverse selection of utilities in multiple locations throughout the PNW, we needed a single CTA-2045 communication provider that could easily deploy the communication technology. The next step was to recruit utilities throughout the PNW to participate in the pilot; these utilities would in turn recruit customers to participate in the pilot. With the participating utilities known (see box at right), we selected a vendor – e-Radio – that could provide communication services to all locations via CTA-2045. We selected e-Radio because both BPA and PGE were familiar with the technology and because the control signals would be sent to all geographic areas nearly simultaneously from a broadcast FM radio in each area. The e-Radio device used a hybrid technology: the protocol FM Radio Broadcast Data System (RBDS) created the control signal to the water heaters, and the customer’s Wi-Fi system was used to collect data about the water heater’s status.
Participating Utilities • Clark Public Utilities • Emerald PUD • Franklin County PUD • Portland General Electric • Puget Sound Energy • Snohomish County PUD • Springfield Utility Board • Tacoma Power
Demand Response Market Transformation and Business Case Report
9
Figure 2. Dispatch and Communications Topology
Recruitment Methods Our goal was to recruit roughly equal numbers of heat pump and resistance-type water heater users; this goal in turned required multiple marketing approaches. Because most utilities provide a rebate when the customer installs a HPWH, utilities have the names and addresses of these customers. This allowed a direct mail marketing approach through which about 10% of all HPWH customers contacted ultimately enrolled in the program. Recruiting resistance customers proved to be much more difficult and multiple approaches were attempted. The heart of the problem was that only a specific model of water heater was compatible with the CTA-2045 technology; indeed, this is the very reason we want to implement a market transformation plan, namely, so every new tank sold will be compatible. We had hoped that we could utilize plumbers to recruit customers when the customer called them to replace a failed water heater; we created marketing materials for both plumbers and customers to support this approach. We spent considerable effort meeting with several plumbers and made available through their distributors a CTA-2045-compatible tank at a price competitive with the most common type of tanks sold. Although several plumbers provided positive support for this approach, ultimately we enrolled only three tanks this way over five months. Most of our participating resistance tanks were delivered by Tacoma Power, working with a low-income housing partner in their city who replaced about 87 tanks in a batch effort to replace a cohort group of 15-year-old tanks.
Demand Response Market Transformation and Business Case Report
10
More explanation of the disappointing plumber delivery channel is discussed in Appendix F – Lessons Learned. The enrollment period occurred primarily between July 2017 and January 2018. Utilities directed all enrollment efforts starting with marketing materials developed by the project. When the customer was enrolled, the utility provided the customer a demographic survey used by all the utilities. Only the utilities had personal customer data. The utility assigned an alias ID to each customer during the enrollment process; in the operating software run by BPA, the customer is known only by the alias. All data collected from customers (e.g., water heater usage data, customer surveys and comments) is identified to the project stakeholders by only the alias assignment.
Project Set-Up In late July 2017, we started running simple events to develop all the processes required to support the project. These processes included creating weekly event plans, scheduling processes, defining criteria for determining peak system day events, developing answers to customer issues and questions, establishing how to best implement the impact evaluation, etc. On Monday August 21, we started running one 2-hour event every day of the week; by the week of September 25, we were running one 3-hour event every day of the week. To simplify the evaluation curtailment, events were always run in increments of whole hours and always started at the top of an hour; however, in a real program, events could be started at any time and for any duration. In mid-November we started running events on resistance tanks; previously, events had been scheduled for only HPWHs. To our knowledge, this was the first water heater demand response pilot in which two or more events were being run every day, presumably forever, on commodity water heaters. Another notable difference in this pilot compared to established water heater demand response programs is that customers were never notified when a control event would be run on their water heater. The manufacturer’s “smart” algorithm constituted the primary means of protecting customers from a loss of hot water; when the hot water supply was too low, the algorithm would ignore the curtailment command issued by the utility.13 The customer also had two ways to opt out of control events for 24 hours, which they could choose as often as they wanted. The opt-out could be selected by pushing a button on the water heater, or the customer could log in to their personal web page to select an opt-out period.
Evolution of Evaluation Plan Because of the frequent number of events, we had the opportunity to create a new type of evaluation plan. We initially conceived four analytic methods, but settled on implementing three of them. All three methods compared the usage of customers that experience curtailment requests, the “event group,” to a baseline usage pattern that represented
13 Section 3.5 provides more details on this feature.
Demand Response Market Transformation and Business Case Report
11
normal usage. The three methods were distinguished because “normal,” or baseline, usage was determined by a unique calculation. Appendix D – Study Method: BPA Water Heater Demand Response (CTA-2045) Evaluation, Measurement, & Verification Plan, provides details about the calculation of each baseline method. After we gained experience, we continued with the two baseline calculation methods described below. Baseline method #1 required splitting all the tanks into two roughly equal groups. In each week, curtailment events were run on the event group, while the other group served as the control group whose usage established the baseline usage pattern. In the subsequent week, the role of the two groups was reversed. This pattern of alternating which group received a week of control events (Monday through Sunday) continued for the entire project. To determine the impact of the curtailment events, the difference in the average load of each group was computed for each hour of the event. Baseline method #2 used usage data from participants of the event group as the baseline by using data from the two earlier weeks when it served as the control group. For example, when Group 2 served as the event group in week 4, the baseline for week 4 was calculated from the average hourly usage of Group 2 from the previous week 1 and week 3—weeks when Group 2 experienced no curtailment events. Initially the group assignments were made randomly, but in November 2017, we learned that to improve results from using baseline method #1, we needed to balance the two groups to be more similar in terms of their daily load shapes. The details of this “balancing” are explained in Appendix D – Study Method: BPA Water Heater Demand Response (CTA-2045) Evaluation, Measurement, & Verification Plan. Most of the customer enrollments and rebalancing of the “two” heat pump groups occurred in the 4th quarter of 2017. Rebalancing of the resistance groups was also necessary, but that did not occur until the first week in April 2018. The impact analysis team gained confidence in the methods by early January 2018 and decided on three seasons of evaluation:
Winter: January 22 thru April 1; Spring: April 2 through June 10; and Summer: June 11 through August 26.
Energy shift events were run almost every day in the three seasons. Based on day-ahead weather forecasts, the 10 coldest days in winter and the 10 hottest days in summer were noted and analyzed as system peak demand days. If necessary on peak days, the hours of shed events (see Appendix C – CTA-2045 Commands and Related Specifications) were changed to match the time of system peak load. Grid emergency is defined in the CTA-2045 specification as a command to be used only as the name suggests. When the command is issued it generally acts to shed all load, regardless of the customer’s need for hot water. As such, if used on a regular basis it would interfere with customer satisfaction. The grid emergency event was tested for 10 events in

Demand Response Market Transformation and Business Case Report
12
winter and spring and nine events in summer in order to identify the additional benefit to be achieved during a grid emergency. Events lasted between 1 and 3 hours. In summary, we ran and analyzed three types of events. Energy shift events were run at all hours of the day, every day except the days when we ran grid emergency events. On the 10 hottest and coldest days we ensured energy shift events between 6a.m.–10a.m. and 5p.m.–9p.m. in winter, but only between 5p.m.–9p.m. in summer; these times coincide with system peak demand periods. The quantitative results of the analysis determine the kW demand reduction and the available storage value in kWh, as a function of time of day, and are presented in the next chapter. The economic value of these physical impacts is evaluated in Chapter 5. However, the economic value also depends on when and what percentage of the customers in a geographic area will enroll in a demand response program. These important variables are the outcomes of the Market Transformation summarized in Chapter 4. The market transformation plan and the positive economic outcome explained in Chapter 5 were the primary objectives of this three-year demonstration pilot. While the results are specific to the market of the Pacific Northwest, the results can be extrapolated to derive a national benefit that is 10 times larger than the base in the Pacific Northwest, based on the national saturation of electric water heaters.
Customer Satisfaction Assessment The customer satisfaction assessment was based on three inputs: 1) a bi-monthly survey to ask about lack of hot water in the previous week, 2) a final customer satisfaction survey at the end of the project, and 3) comments that the customer could submit at any time on their personal web page. Section 3.8 provides a summary of the most important findings.
Project Technology and Vendors As stated in the original proposal to BPA, the purpose of this three-year pilot was to take the ANSI/CTA-2045 technology readiness level from a prototype level in an operational environment (Level 7) established by Electric Power Research Institute (EPRI) projects, to a proven system through successful mission operations (Level 9). In this project, AO Smith and General Electric (GE) both supported the CTA-2045 interface on their respective water heaters by supplying a device that connects to their existing, but proprietary, communication socket. This device, which we usually refer to as the CTA-2045 adapter, provides protocol translation between their proprietary command protocol used inside the water heater to the CTA-2045 command protocol. By using a standard protocol, we could use a single communication technology in the four geographic areas of our eight participating utilities. Our CTA-2045 communication device made by e-Radio implements a hybrid communication method. It uses FM Radio Broadcast Data System (FM RBDS), a digital standard protocol used by FM radio stations as a subchannel on their analog FM radio broadcasts. FM RBDS provides for a low-latency method to communicate with millions of devices. At scale, FM RDBS is a low-cost technology that will accommodate privacy-sensitive customers who do not want appliance-specific usage information leaving the home. In this project the communication module also includes Wi-Fi so we can collect hot water electric usage data every minute.
Demand Response Market Transformation and Business Case Report
13
Besides being an open communication interface, the CTA-2045 specification includes a rich set of demand response commands; our manufacturers implemented this application standard (as opposed to, for example OpenADR) since we required this language for this pilot. We chose this language because AO Smith in its previous work in the EPRI project had experience with this command set. Without previous experience, GE was able to create a “beta” CTA-2045 device in six months, including our end-to-end testing. If another water heater manufacturer chooses to use a different standard such as OpenADR within the water heater,14 the UCM vendor can translate the command language used by the DR aggregator within the UCM without having to encumber the water heater manufacturer to change the command language they implemented.
14 “Within the water heater” raises an important point in that it contrasts the model of a proprietary standard within the water heater and an open command standard in the “cloud.” The latter approach forces a service provider to have a service agreement with the manufacturer before DR can be implemented. The “socket” approach does not prevent the manufacturer from providing cloud service; however, it does let the customer determine the communication approach they prefer. Specifically, it enables service through any alternative provider, e.g., their utility, or “Alexa,” Siri, Google Home, or from any entrepreneur in the future.
Demand Response Market Transformation and Business Case Report
14
3 Findings This section summarizes15 the kW and kWh impact results from running about 600 events over 220 days. These findings form the foundation for determining the economic benefits that smart water heaters will bring to the region as a result of customer participation. The kW results show the reduction in on-peak demand and the kWh results show the energy shifting potential from the daily use of the tanks as thermal batteries to shift customary energy consumption from on-peak periods to low-cost power periods. In the future, low-cost periods will be highly coincident with periods of excess solar and wind energy. The need to shift energy consumption to periods of excess renewable generation will be the defining feature of the 21st century electric grid. While these two findings are the economic basis for the business case for this report, the business case chapter (Chapter 5) describes other economic benefits in Section 5.6 as well. The findings uncovered in this study are described in this chapter.
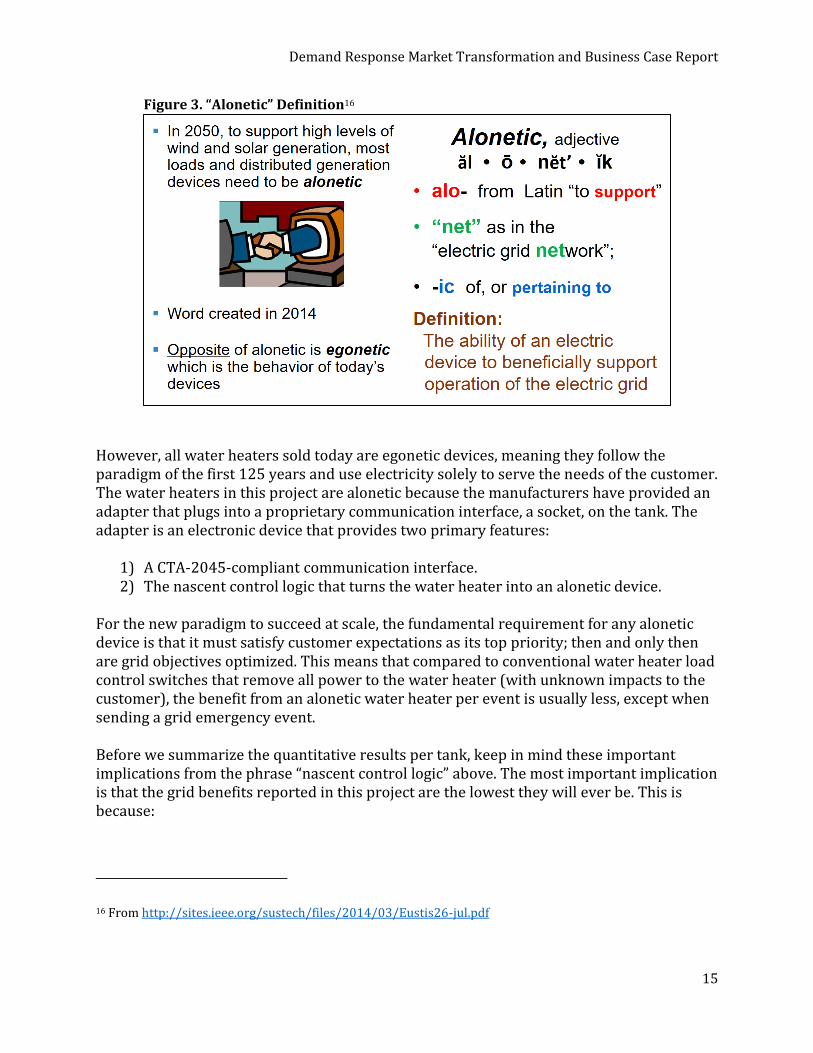
Background Understanding the historical context of this regional pilot is important. For more than 125 years customers have bought and used electric devices with the idea that the grid is always available to supply the electric device’s power with no expectation except to pay later for the electricity used. In other words, utilities added generation resources in order to serve every load a customer might turn on regardless of when they wanted it. This demonstration was marketed to customers with the idea that during the pilot, “water heating will be slightly scaled back during peak times, or be increased to absorb available wind or solar energy” (see Appendix G – Customer Interactions for more detail). In this single sentence, a new paradigm for the next 125 years has been introduced. The new idea is that a grid that depends heavily on solar and wind generation will need customers to allow their electric devices to help grid operators use energy when it is available—not when they want it. The adjective “alonetic” (see Figure 3) has been coined to describe the behavior in this new paradigm. In the next 125 years we will need alonetic electric devices to help manage the stochastic nature of wind and solar generation; alonetic loads are the cheapest method to integrate wind and solar. Because of the inherent thermal storage in a tank, water heaters are an ideal alonetic load.
15 Appendix E – Impact Analysis reports the detailed event results based on the detailed evaluation method explained in Appendix D – Study Method: BPA Water Heater Demand Response (CTA-2045) Evaluation, Measurement, & Verification Plan.
Demand Response Market Transformation and Business Case Report
15
Figure 3. “Alonetic” Definition16
However, all water heaters sold today are egonetic devices, meaning they follow the paradigm of the first 125 years and use electricity solely to serve the needs of the customer. The water heaters in this project are alonetic because the manufacturers have provided an adapter that plugs into a proprietary communication interface, a socket, on the tank. The adapter is an electronic device that provides two primary features:
1) A CTA-2045-compliant communication interface. 2) The nascent control logic that turns the water heater into an alonetic device.
For the new paradigm to succeed at scale, the fundamental requirement for any alonetic device is that it must satisfy customer expectations as its top priority; then and only then are grid objectives optimized. This means that compared to conventional water heater load control switches that remove all power to the water heater (with unknown impacts to the customer), the benefit from an alonetic water heater per event is usually less, except when sending a grid emergency event. Before we summarize the quantitative results per tank, keep in mind these important implications from the phrase “nascent control logic” above. The most important implication is that the grid benefits reported in this project are the lowest they will ever be. This is because:
16 From http://sites.ieee.org/sustech/files/2014/03/Eustis26-jul.pdf
Demand Response Market Transformation and Business Case Report
16
• Fewer than 1,000 commodity alonetic water heaters are operating in the world. This is just the first attempt at operating in a new paradigm; we will be making improvements for decades to come.
• The manufacturers that created the adapters for this project were focused on creating a new electronic device that meets CTA-2045 specifications at minimum cost. Without useful feedback from customers, they must implement a conservative “do-no-harm” control logic to prevent a negative customer experience.
• The manufacturer’s alonetic logic today makes no attempt to learn the customer’s water use patterns to “know” when it is safe to defer heating cold water until later because heavy hot water use is not likely for many hours. (Deferred heating of cold water is what increases demand reduction and increases storage.)
• The latest release of the CTA-2045 specification includes a command that allows input from the customer about how aggressively they want grid benefits to accrue, or conversely, allows the customer to put more emphasis on always having enough hot water. This feature was suggested by a manufacturer so that it would not have to implement the most conservative algorithm, which is what they do now because they must design for the most sensitive customers.
o As utility DR programs mature, utilities will find ways to entice customers to select a more aggressive grid benefit option.
• Ecotope has modeled the use of mixing valves with water heaters for the Natural Resources Defense Council (NRDC) and this project. The model shows a substantial increase in the storage benefit by using mixing valves (see Section 3.6 for details).
• Control methods that segment customers by their hot water usage patterns will create greater benefits. For simplicity, our pilot treated all customers the same; this forced us into conservative control strategies to protect heavy hot water users (whose tanks are too small for their usage level) from running out of hot water. For example, you can treat a single-person household with most of its use from 6a.m. to 9a.m. with an 18-hour shed period and allow most of the reheating to occur in the midnight to 5a.m. time period; however, this won’t work with a large household that has heavy use in both the morning and the evening. Eventually, the combination of smarter tank algorithms and control strategies based on market segments will yield much higher average benefits.
• Water heater manufacturers sell water heaters to customers, not utilities. When all manufacturers have alonetic water heaters and when metrics are in place to measure benefits, natural market forces due to competition will improve the grid benefits per water heater.
Approach to Reporting Evaluation Results
Section 2.4 described two different evaluation methods implemented by PNNL (these results are fully reported in Appendix E – Impact Analysis). In most cases, despite having baselines created from two mutually exclusive sets of data, the two evaluation methods yielded remarkably similar results. The results reported in the next three subsections for any specific event are an average of the two different evaluation methods. This approach was implemented for two reasons; namely: 1) to simplify reporting in this chapter, and 2) to create only one input for the economic model. The sensitivity analysis in Section 5.8
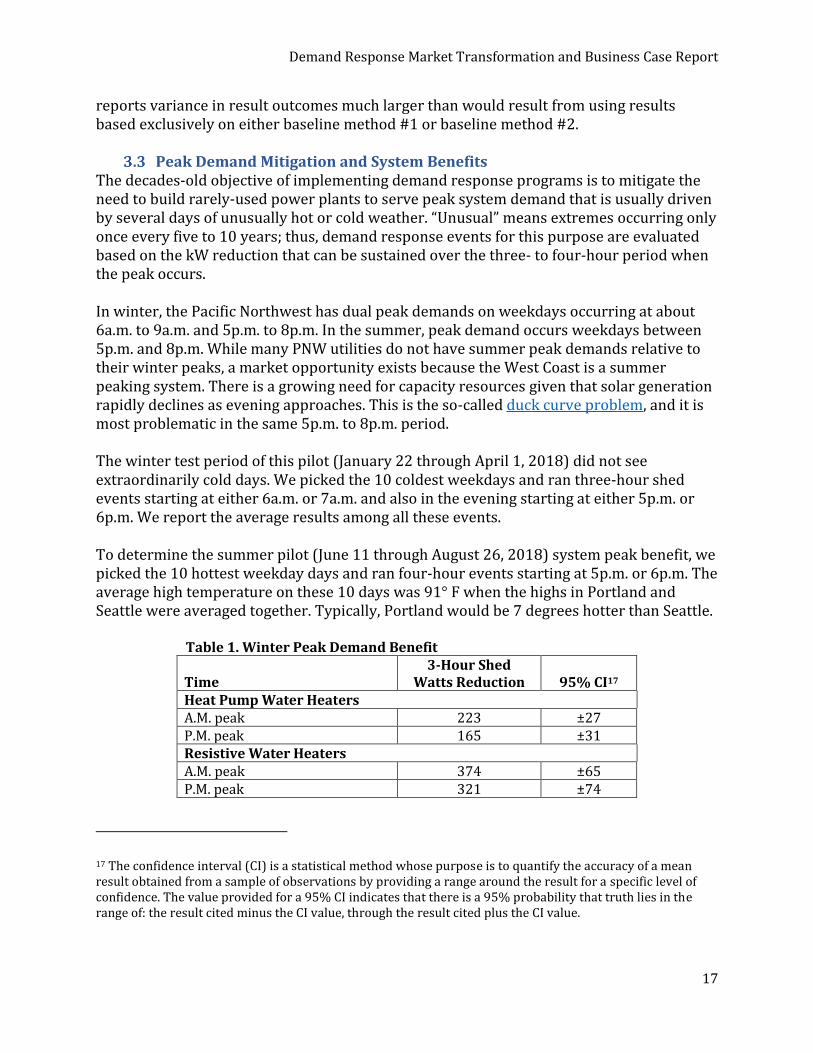
Demand Response Market Transformation and Business Case Report
17
reports variance in result outcomes much larger than would result from using results based exclusively on either baseline method #1 or baseline method #2.
Peak Demand Mitigation and System Benefits The decades-old objective of implementing demand response programs is to mitigate the need to build rarely-used power plants to serve peak system demand that is usually driven by several days of unusually hot or cold weather. “Unusual” means extremes occurring only once every five to 10 years; thus, demand response events for this purpose are evaluated based on the kW reduction that can be sustained over the three- to four-hour period when the peak occurs. In winter, the Pacific Northwest has dual peak demands on weekdays occurring at about 6a.m. to 9a.m. and 5p.m. to 8p.m. In the summer, peak demand occurs weekdays between 5p.m. and 8p.m. While many PNW utilities do not have summer peak demands relative to their winter peaks, a market opportunity exists because the West Coast is a summer peaking system. There is a growing need for capacity resources given that solar generation rapidly declines as evening approaches. This is the so-called duck curve problem, and it is most problematic in the same 5p.m. to 8p.m. period. The winter test period of this pilot (January 22 through April 1, 2018) did not see extraordinarily cold days. We picked the 10 coldest weekdays and ran three-hour shed events starting at either 6a.m. or 7a.m. and also in the evening starting at either 5p.m. or 6p.m. We report the average results among all these events. To determine the summer pilot (June 11 through August 26, 2018) system peak benefit, we picked the 10 hottest weekday days and ran four-hour events starting at 5p.m. or 6p.m. The average high temperature on these 10 days was 91° F when the highs in Portland and Seattle were averaged together. Typically, Portland would be 7 degrees hotter than Seattle.
Table 1. Winter Peak Demand Benefit
Time 3-Hour Shed
Watts Reduction 95% CI17 Heat Pump Water Heaters A.M. peak 223 ±27 P.M. peak 165 ±31 Resistive Water Heaters A.M. peak 374 ±65 P.M. peak 321 ±74
17 The confidence interval (CI) is a statistical method whose purpose is to quantify the accuracy of a mean result obtained from a sample of observations by providing a range around the result for a specific level of confidence. The value provided for a 95% CI indicates that there is a 95% probability that truth lies in the range of: the result cited minus the CI value, through the result cited plus the CI value.
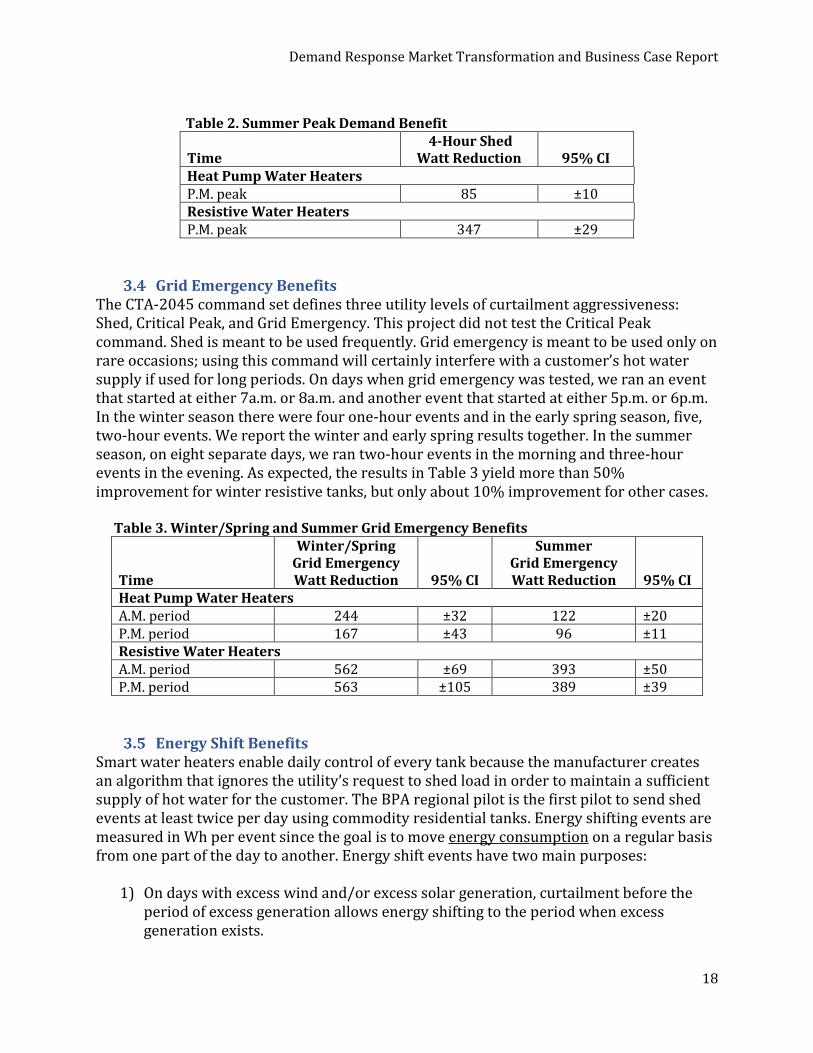
Demand Response Market Transformation and Business Case Report
18
Table 2. Summer Peak Demand Benefit
Time 4-Hour Shed
Watt Reduction 95% CI Heat Pump Water Heaters P.M. peak 85 ±10 Resistive Water Heaters P.M. peak 347 ±29
Grid Emergency Benefits The CTA-2045 command set defines three utility levels of curtailment aggressiveness: Shed, Critical Peak, and Grid Emergency. This project did not test the Critical Peak command. Shed is meant to be used frequently. Grid emergency is meant to be used only on rare occasions; using this command will certainly interfere with a customer’s hot water supply if used for long periods. On days when grid emergency was tested, we ran an event that started at either 7a.m. or 8a.m. and another event that started at either 5p.m. or 6p.m. In the winter season there were four one-hour events and in the early spring season, five, two-hour events. We report the winter and early spring results together. In the summer season, on eight separate days, we ran two-hour events in the morning and three-hour events in the evening. As expected, the results in Table 3 yield more than 50% improvement for winter resistive tanks, but only about 10% improvement for other cases.
Table 3. Winter/Spring and Summer Grid Emergency Benefits
Time
Winter/Spring Grid Emergency Watt Reduction 95% CI
Summer Grid Emergency Watt Reduction 95% CI
Heat Pump Water Heaters A.M. period 244 ±32 122 ±20 P.M. period 167 ±43 96 ±11 Resistive Water Heaters A.M. period 562 ±69 393 ±50 P.M. period 563 ±105 389 ±39
Energy Shift Benefits Smart water heaters enable daily control of every tank because the manufacturer creates an algorithm that ignores the utility’s request to shed load in order to maintain a sufficient supply of hot water for the customer. The BPA regional pilot is the first pilot to send shed events at least twice per day using commodity residential tanks. Energy shifting events are measured in Wh per event since the goal is to move energy consumption on a regular basis from one part of the day to another. Energy shift events have two main purposes:
1) On days with excess wind and/or excess solar generation, curtailment before the period of excess generation allows energy shifting to the period when excess generation exists.

Demand Response Market Transformation and Business Case Report
19
2) On days without periods of excess renewable generation, usage for hot water can be shifted from high-cost periods to low-cost periods; in most cases this also reduces the marginal carbon emissions since off-peak resources, usually gas-fired now, are more efficient than gas power plants used on peak. On rare occasions today, this might be a coal plant, but by 2035 when the smart water heater resource will still be approaching a peak enrollment level, most coal plants in the Western Electricity Coordinating Council (WECC) operating area will be retired. Energy shifting will be a least-cost resource, compared to using batteries, at the heart of integrating wind and solar generation into the grid.
As demonstrated in the pilot, two to three energy shifts can be implemented per day; care must be exercised with customers that have HPWHs and heavy hot water usage to ensure the heat pump can recharge the tank before the next heavy hot water draw. Ninety-eight percent of the events run during the pilot qualified as energy shift events. Different events were called, starting in every hour of the day, in order to understand the maximum energy usage that could be deferred as a function of time and season. Most spring events were two and a half to three hours in duration and most summer events were four hours in duration. To improve the quality of the results, all events within defined time blocks were grouped and analyzed together. While we ran energy shift events in the winter season, most events were only two hours. We learned how to run longer energy shift events for the spring season, so we only report those results. The inlet cold water temperature in spring is very similar to the winter season, so the shift results of winter will be very similar, if not slightly greater than those for spring. In January 2018, when the first results became available, we decided that rebalancing the groups would be beneficial to reduce the uncertainty in results. The analysis team also decided to organize the event start times to better coincide with energy shifting 1) to mid-day (to correlate with the time of excess solar generation) and 2) to early morning (to correlate with the lowest-cost hours and/or times of excess wind generation). Events from April 2 through June 10 were run in six time blocks.

Demand Response Market Transformation and Business Case Report
20
Table 4. Spring Energy Shift Event Benefits
Average Watt-hr Reduction for
a Typical 3-hour Shed Time Block All days Std. Dev.18 Heat Pump Water Heaters 7a.m. to 11a.m. 512 184 11a.m. to 2p.m. 418 101 2p.m. to 5p.m. 281 43 5p.m. to 9p.m. 330 50 9p.m. to 1a.m. 394 121 1a.m. to 7a.m. 222 96 Resistive Water Heaters 7a.m. to 11a.m. 1162 229 11a.m. to 2p.m. 1155 305 2p.m. to 5p.m. 982 290 5p.m. to 9p.m. 1218 185 9p.m. to 1a.m. 884 187 1a.m. to 7a.m. 433 149
Summer control events ran from June 11 to August 26, 2018, in the same time blocks as during spring (see Table 5).
18 For the energy shift evaluation, we calculate a standard deviation metric based on the average of 6 to 11 data points that are each the average of multiple discrete events during a week of events; it was not appropriate to apply the confidence interval metric to observations that are themselves averages. For the grid emergency and system peak demand shed events, we use a confidence interval metric which can be computed for the 10 or so discrete events that we created, and this is a preferred metric. Both metrics provide an indication on the variation of a specific result.
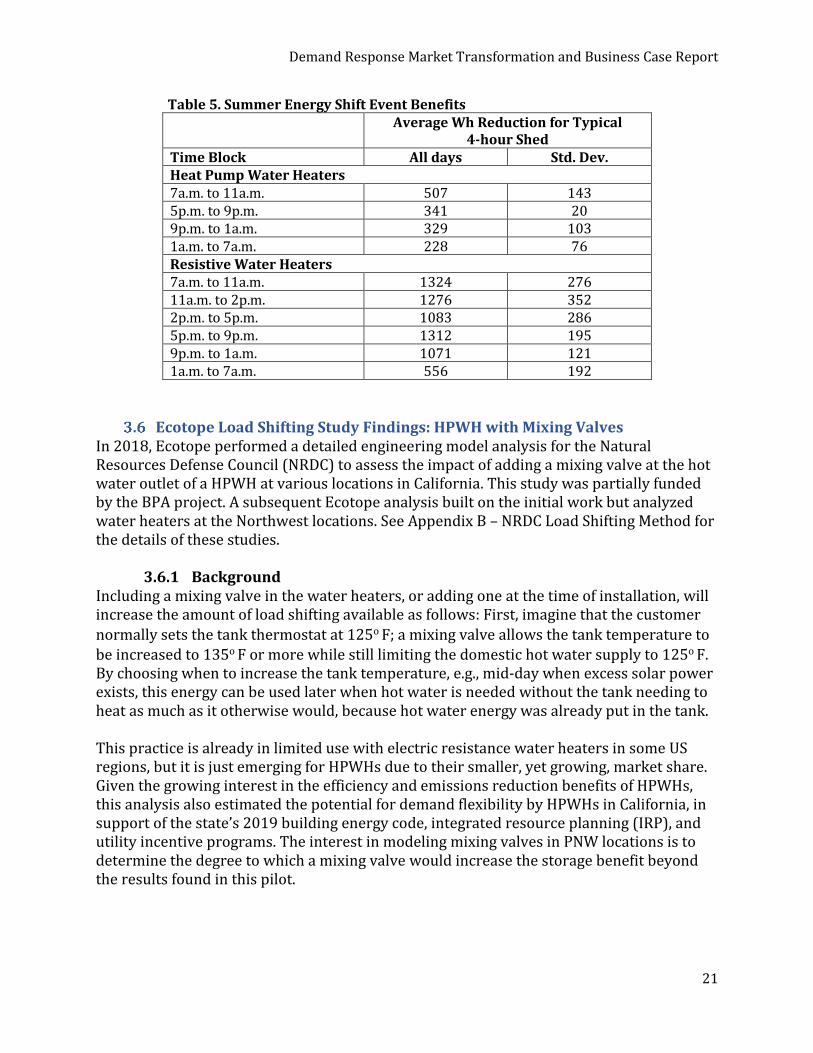
Demand Response Market Transformation and Business Case Report
21
Table 5. Summer Energy Shift Event Benefits
Average Wh Reduction for Typical
4-hour Shed Time Block All days Std. Dev. Heat Pump Water Heaters 7a.m. to 11a.m. 507 143 5p.m. to 9p.m. 341 20 9p.m. to 1a.m. 329 103 1a.m. to 7a.m. 228 76 Resistive Water Heaters 7a.m. to 11a.m. 1324 276 11a.m. to 2p.m. 1276 352 2p.m. to 5p.m. 1083 286 5p.m. to 9p.m. 1312 195 9p.m. to 1a.m. 1071 121 1a.m. to 7a.m. 556 192
Ecotope Load Shifting Study Findings: HPWH with Mixing Valves In 2018, Ecotope performed a detailed engineering model analysis for the Natural Resources Defense Council (NRDC) to assess the impact of adding a mixing valve at the hot water outlet of a HPWH at various locations in California. This study was partially funded by the BPA project. A subsequent Ecotope analysis built on the initial work but analyzed water heaters at the Northwest locations. See Appendix B – NRDC Load Shifting Method for the details of these studies.
3.6.1 Background Including a mixing valve in the water heaters, or adding one at the time of installation, will increase the amount of load shifting available as follows: First, imagine that the customer
normally sets the tank thermostat at 125o F; a mixing valve allows the tank temperature to be increased to 135o F or more while still limiting the domestic hot water supply to 125o F. By choosing when to increase the tank temperature, e.g., mid-day when excess solar power exists, this energy can be used later when hot water is needed without the tank needing to heat as much as it otherwise would, because hot water energy was already put in the tank. This practice is already in limited use with electric resistance water heaters in some US regions, but it is just emerging for HPWHs due to their smaller, yet growing, market share. Given the growing interest in the efficiency and emissions reduction benefits of HPWHs, this analysis also estimated the potential for demand flexibility by HPWHs in California, in support of the state’s 2019 building energy code, integrated resource planning (IRP), and utility incentive programs. The interest in modeling mixing valves in PNW locations is to determine the degree to which a mixing valve would increase the storage benefit beyond the results found in this pilot.
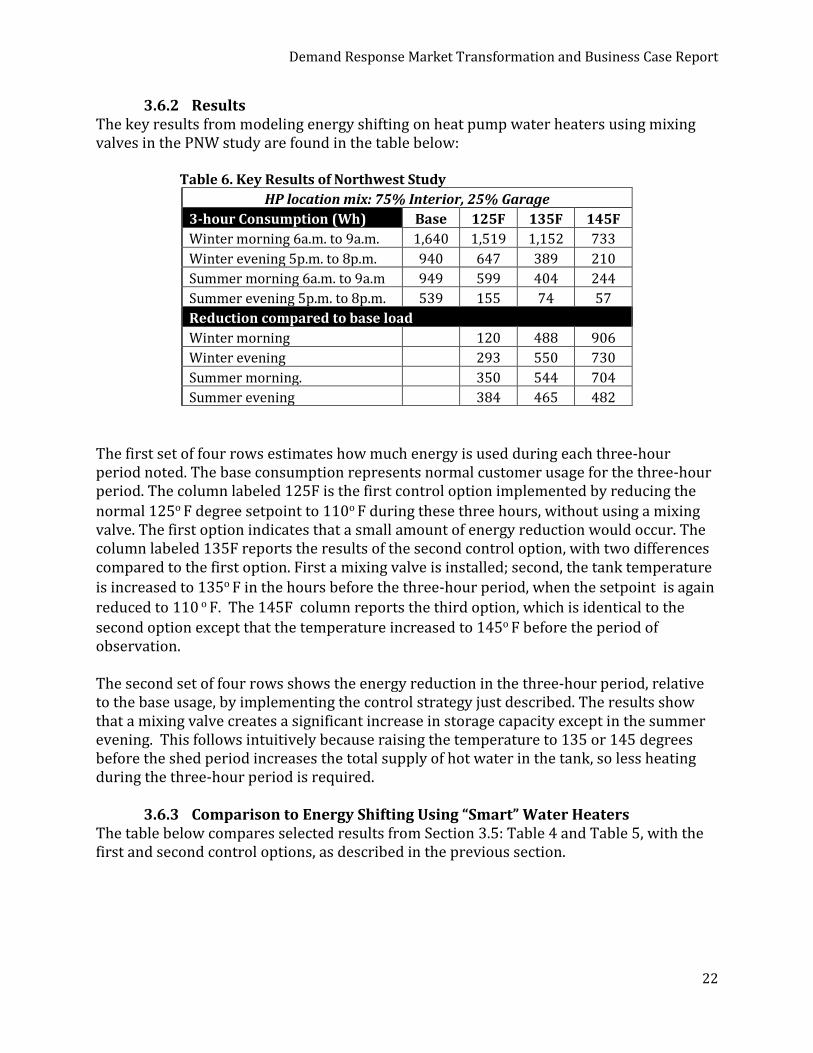
Demand Response Market Transformation and Business Case Report
22
3.6.2 Results The key results from modeling energy shifting on heat pump water heaters using mixing valves in the PNW study are found in the table below:
Table 6. Key Results of Northwest Study
HP location mix: 75% Interior, 25% Garage
3-hour Consumption (Wh) Base 125F 135F 145F
Winter morning 6a.m. to 9a.m. 1,640 1,519 1,152 733
Winter evening 5p.m. to 8p.m. 940 647 389 210
Summer morning 6a.m. to 9a.m 949 599 404 244
Summer evening 5p.m. to 8p.m. 539 155 74 57
Reduction compared to base load
Winter morning 120 488 906
Winter evening 293 550 730
Summer morning. 350 544 704
Summer evening 384 465 482
The first set of four rows estimates how much energy is used during each three-hour period noted. The base consumption represents normal customer usage for the three-hour period. The column labeled 125F is the first control option implemented by reducing the
normal 125o F degree setpoint to 110o F during these three hours, without using a mixing valve. The first option indicates that a small amount of energy reduction would occur. The column labeled 135F reports the results of the second control option, with two differences compared to the first option. First a mixing valve is installed; second, the tank temperature
is increased to 135o F in the hours before the three-hour period, when the setpoint is again
reduced to 110 o F. The 145F column reports the third option, which is identical to the
second option except that the temperature increased to 145o F before the period of observation. The second set of four rows shows the energy reduction in the three-hour period, relative to the base usage, by implementing the control strategy just described. The results show that a mixing valve creates a significant increase in storage capacity except in the summer evening. This follows intuitively because raising the temperature to 135 or 145 degrees before the shed period increases the total supply of hot water in the tank, so less heating during the three-hour period is required.
3.6.3 Comparison to Energy Shifting Using “Smart” Water Heaters The table below compares selected results from Section 3.5: Table 4 and Table 5, with the first and second control options, as described in the previous section.
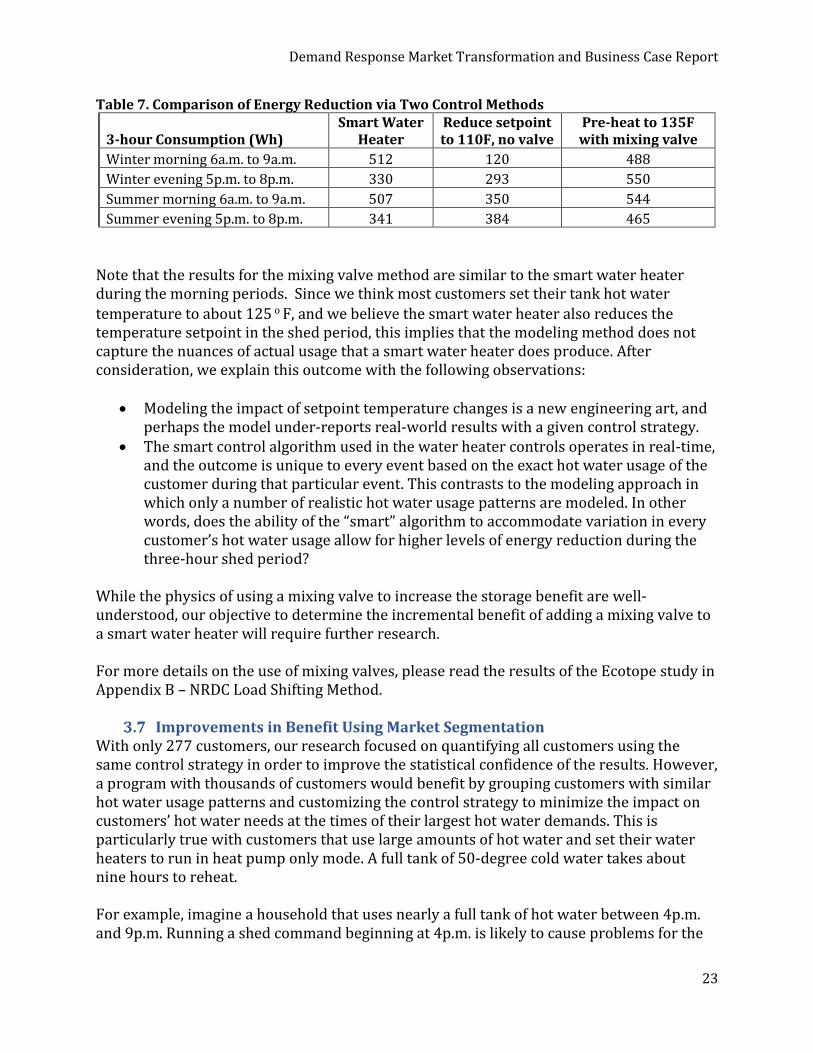
Demand Response Market Transformation and Business Case Report
23
Table 7. Comparison of Energy Reduction via Two Control Methods
3-hour Consumption (Wh) Smart Water
Heater Reduce setpoint to 110F, no valve
Pre-heat to 135F with mixing valve
Winter morning 6a.m. to 9a.m. 512 120 488
Winter evening 5p.m. to 8p.m. 330 293 550
Summer morning 6a.m. to 9a.m. 507 350 544
Summer evening 5p.m. to 8p.m. 341 384 465
Note that the results for the mixing valve method are similar to the smart water heater during the morning periods. Since we think most customers set their tank hot water
temperature to about 125 o F, and we believe the smart water heater also reduces the temperature setpoint in the shed period, this implies that the modeling method does not capture the nuances of actual usage that a smart water heater does produce. After consideration, we explain this outcome with the following observations:
• Modeling the impact of setpoint temperature changes is a new engineering art, and perhaps the model under-reports real-world results with a given control strategy.
• The smart control algorithm used in the water heater controls operates in real-time, and the outcome is unique to every event based on the exact hot water usage of the customer during that particular event. This contrasts to the modeling approach in which only a number of realistic hot water usage patterns are modeled. In other words, does the ability of the “smart” algorithm to accommodate variation in every customer’s hot water usage allow for higher levels of energy reduction during the three-hour shed period?
While the physics of using a mixing valve to increase the storage benefit are well-understood, our objective to determine the incremental benefit of adding a mixing valve to a smart water heater will require further research. For more details on the use of mixing valves, please read the results of the Ecotope study in Appendix B – NRDC Load Shifting Method.
Improvements in Benefit Using Market Segmentation With only 277 customers, our research focused on quantifying all customers using the same control strategy in order to improve the statistical confidence of the results. However, a program with thousands of customers would benefit by grouping customers with similar hot water usage patterns and customizing the control strategy to minimize the impact on customers’ hot water needs at the times of their largest hot water demands. This is particularly true with customers that use large amounts of hot water and set their water heaters to run in heat pump only mode. A full tank of 50-degree cold water takes about nine hours to reheat. For example, imagine a household that uses nearly a full tank of hot water between 4p.m. and 9p.m. Running a shed command beginning at 4p.m. is likely to cause problems for the
Demand Response Market Transformation and Business Case Report
24
customer. But if the goal is to shift energy use into the 11p.m. to 5a.m. time period, running a shed event from 9p.m. to 1a.m. would accomplish this result without impacting the normal use period. On the other hand, a household with one person who uses most of the hot water in the morning can be controlled with a shed from 5a.m. to 11a.m. and from 4p.m. to 11p.m. without any impact to lifestyle. This control strategy maximizes the ability to absorb both solar energy by day and wind energy by night.
Customer Acceptance Findings The customer feedback, much of which is described in Appendix G – Customer Interactions, was based on five indicators of customer acceptance:
1. Reporting loss of hot water by comment. 2. Reporting loss of hot water in a bi-monthly survey. 3. Exiting the program because of the effect of events. 4. Setting of an override to suspend control of utility events for 24 hours. 5. The end of pilot satisfaction survey.
Indicator 1 Only 12 out of 191 customers reported loss of, or reduced, hot water by comment. 50% of these were due to improper reset of temperature to normal setpoint by GE adapters. Some of these could be fixed by asking the customer to raise the temperature of the tank by 5 to 10 degrees from the 120° F default setpoint. GE tanks have a wide deadband which leaves water in the tank at 105° F before heating turns on. Indicator 2 Seventy-three unique customers reported loss of hot water from five bi-monthly surveys. We tried to issue the surveys on Mondays to ask about the experience from the previous week (Monday through Sunday). We selected the weeks of the survey so that the specific group of customers that had experienced events in the prior week would alternate with each survey. This means about half the customers in each survey had not experienced any events in the prior week. The 73 unique customers reported a collective 155 days with some loss of hot water. The responses were correlated to whether curtailment events were being run or not. Fifty percent of the hot water losses were reported in weeks without curtailment events, 41% did occur in weeks with events, and 9% were inconclusive. Of course, some customers might have recalled a problem not from the previous week, but from the week before, in which case we were running events. However, since half the shortages were due to simple heavy hot water usage, there is no basis to conclude that our
Demand Response Market Transformation and Business Case Report
25
curtailment requests resulted in more shortages than did experiences from customers with heavy hot water usage during the week we did call events with them.19 Indicator 3 Only two customers with HPWHs, out of the 277, left the program due to excessive problems from curtailment events. One of these customers had energy use at 230% of average, the other customer at 140% of average. This means in programs we should do early screening to determine customers with very high hot water use since any loss of tank capacity will be problematic. A 1% loss of customers due to these criteria constitutes an outstanding level of success. Indicator 4 Setting of an override is not a sign of a customer problem unless it occurs after the hot water loss is experienced. It can mean one of two things: On one hand, a proactive setting of override means the customer expects house guests, or some other atypical high-use situation, and the customer understands the tools at their disposal to ensure a positive experience. On the other hand, it could mean dissatisfaction with the DR events and an effort to solve a cold-water situation. It is interesting to note that only 22 customers (about 10%) ever set an override. Fifteen customers used the option only once or twice, and five customers used the option an average of five times. One customer used the option 24 times and then left the program because they had four extended family members visiting for over a month, and they were frustrated with needing to reset the override every day. It is believed this element needs more study and investigation through work with manufacturers, customers, and utilities to get the right solution in place. This is not a showstopper; it just requires sensitivity and adjustment to program design. Indicator 5 The results in Table 8 below show a very positive overall experience and low impact from the fact that customers experienced multiple curtailment events per day every other week.
19 This is an example to illustrate the statement. Suppose we learned that 60% of all shortages were reported in a week with events and 40% in a week with no events. The basis for hot water shortages in a week with no control events must be heavy hot water usage. Thus, in the week with events, 60% - 40% of shortages are probably caused by our events. 20% of 73 customers is 15 shortages over five weeks, meaning that three customers per week (out of 191 reporting on surveys) might experience shortages caused by our events. However, our actual results indicated that shortages were experienced equally in weeks with, and without, events occurring (assume all the inconclusive data as coincident with our events), or 50 - 50 = 0 incremental shortages caused by our events. This is what we mean by “no basis.” Undoubtedly some occurrences of hot water shortage must be caused by control events, but there is no way for us to quantify the impact with a sample as small as we have in our pilot.
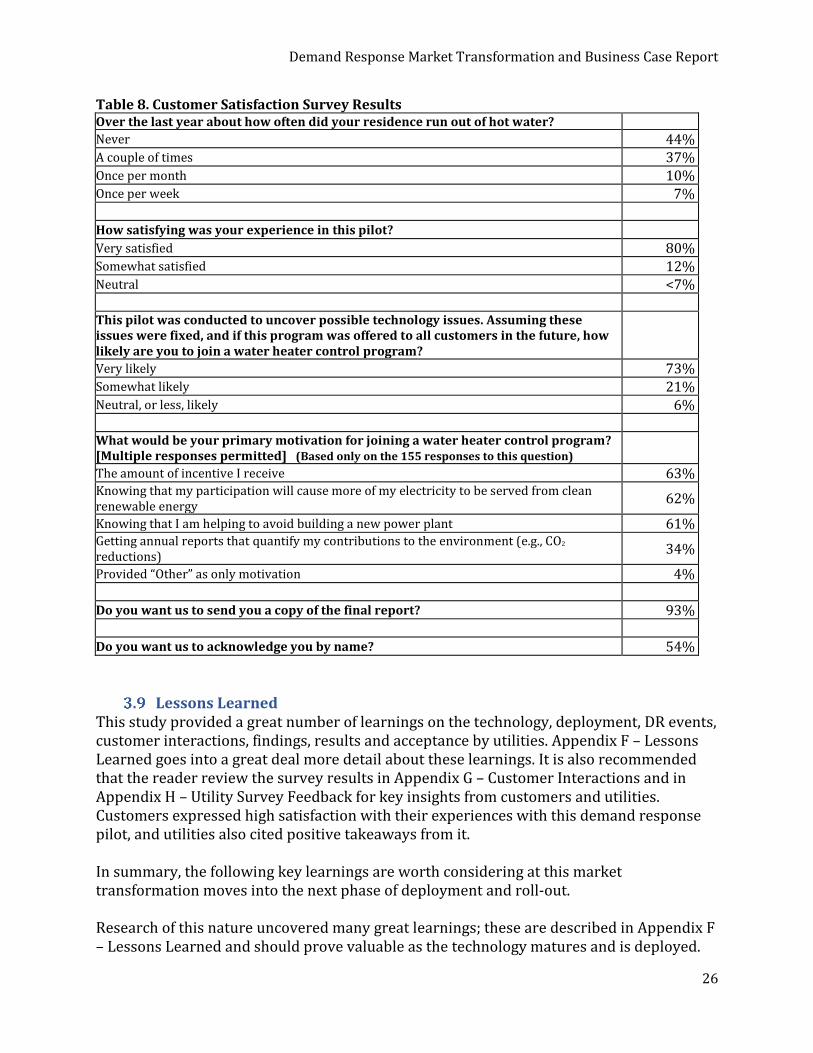
Demand Response Market Transformation and Business Case Report
26
Table 8. Customer Satisfaction Survey Results Over the last year about how often did your residence run out of hot water? Never 44% A couple of times 37% Once per month 10% Once per week 7% How satisfying was your experience in this pilot? Very satisfied 80% Somewhat satisfied 12% Neutral <7% This pilot was conducted to uncover possible technology issues. Assuming these issues were fixed, and if this program was offered to all customers in the future, how likely are you to join a water heater control program?
Very likely 73% Somewhat likely 21% Neutral, or less, likely 6% What would be your primary motivation for joining a water heater control program? [Multiple responses permitted] (Based only on the 155 responses to this question)
The amount of incentive I receive 63% Knowing that my participation will cause more of my electricity to be served from clean renewable energy
62%
Knowing that I am helping to avoid building a new power plant 61% Getting annual reports that quantify my contributions to the environment (e.g., CO2
reductions) 34%
Provided “Other” as only motivation 4% Do you want us to send you a copy of the final report? 93% Do you want us to acknowledge you by name? 54%
Lessons Learned This study provided a great number of learnings on the technology, deployment, DR events, customer interactions, findings, results and acceptance by utilities. Appendix F – Lessons Learned goes into a great deal more detail about these learnings. It is also recommended that the reader review the survey results in Appendix G – Customer Interactions and in Appendix H – Utility Survey Feedback for key insights from customers and utilities. Customers expressed high satisfaction with their experiences with this demand response pilot, and utilities also cited positive takeaways from it. In summary, the following key learnings are worth considering at this market transformation moves into the next phase of deployment and roll-out. Research of this nature uncovered many great learnings; these are described in Appendix F – Lessons Learned and should prove valuable as the technology matures and is deployed.
Demand Response Market Transformation and Business Case Report
27
As demand response gets rolled out and scaled up, it is imperative that we leverage these learnings and continue to improve. The list below provides insights into different aspects of the roll-out of a large-scale deployment, including learnings about communication methods and challenges, recruiting, enrollment and retention of customers, trade ally engagement, water heater performance control characteristics, response latency, and saving calculations. These learnings, as detailed in Appendix F – Lessons Learned, fall into four broad categories:
1. Recruitment. 2. Project participation problems. 3. Customer complaints. 4. Technological immaturity.
In general, DR programs need to:
• Be simple for the customer to engage. • Demonstrate that the DR “smart” water heater is the only solution for the supply
chain. • Steer clear of Wi-Fi as a communication strategy whenever possible. • Understand the customers’ needs, patterns, and performance and make sure that
the water heater logic can leverage technology to maximize the DR benefit.
Demand Response Market Transformation and Business Case Report
28
4 The Market Transformation Plan – How We Plan to Do It Over-Arching Problem Statement As pointed out in the Smart Grid Interoperability Panel’s white paper entitled “Barriers to Responsive Appliances at Scale” [SGIP 2014], the grid-responsive water heater presents a traditional “chicken-and-egg” challenge. Demand response for water heaters touches all aspects of the water heating market from customers, the supply chain, OEMs, utilities, and aggregators to regulators (See Appendix A – Definition of Terms for definitions of these entities). As noted earlier, aggregated at the regional level, grid-responsive water heaters represent a capacity value of 301 MW based on what we believe are conservative assumptions. If grid-interactive controls are included at the time of manufacture and are simple to enable with minimal customer interaction, then the cost per kW of this flexible resource could be quite low, potentially within the realm of becoming an embedded cost for the standard product offering. On the other hand, there is currently no compelling business case for manufacturers to include this capability in their standard product. Without the cost reduction from full-scale manufacturing, the per-unit costs for retrofitting controls exceeds the calculable benefits to Northwest regional utilities. This brings us to the key problem statement: “How can utilities influence manufacturers of water heating equipment to integrate grid-interactive controls as a standard component of manufacture that enables cost reductions from mass production that will produce sufficient demand response benefits that exceed the costs of production and customer engagement?”
Market Opportunities A number of opportunities within the current water heater markets would facilitate or drive inclusion of grid-responsive features as standard features. 1. Codes and standards. Far and away the highest leverage tools for transforming the
market for water heaters are building codes and manufacturing standards. These tools are on regular cycles for revision and therefore create periodic opportunities for engagement and change. Current federal manufacturing standards cover minimum efficiency requirements for water heaters and are preemptive of state-level efficiency standards. State-level standards for other features such as demand response controls are still possible, as are building code requirements where efficiency is not a requirement.
2. Digital controls in premium products. Manufacturers looking for differentiation are increasingly adding digital controls and associated components in their premium models. Historically, this has provided the funding platform to pay for product development of advanced technology and the identification of cost-reduction opportunities. These cost reductions will advance the technologies included in less
Demand Response Market Transformation and Business Case Report
29
sophisticated product lines. These product enhancements will allow the manufacturers to see a path to a relatively low-cost implementation of the grid-enabled controls as a standard product component.
3. Increasing consumer interest in “smart” appliances. There has been significant proliferation of “smart” enabled equipment and the various “hubs” that engage them. Nest’s “learning” thermostat is an example of a smart device that is also serving as a hub for control of other devices. Alexa and Google Home are other devices that are looking to add functionality and control of many other home appliances, including water heaters. These platforms offer an attractive entry point for a “smart” water heater that can automatically engage with the grid to minimize costs and environmental impacts without sacrificing comfort or convenience.
4. Insurance requirements/rewards for leak detection and notification. While not directly an energy issue, insurance requirements/rewards for leak detection and notification provide additional benefits for some of the components of grid enablement – most notably the communication capability and intelligent controls that could also be used for grid interaction.
Market Barriers
Despite these opportunities, there remain some very significant barriers to large-scale market adoption. These include: 1. Lack of grid-to-manufacturer value exchange model. Currently, no business model has emerged that would allow for the direct transfer of grid benefits to appliance manufacturers to fund the costs of manufacturing connected devices at scale, or to incent the customer to be willing to pay the incremental cost for the feature. 2. Lack of end-customer value proposition. The majority of Northwest consumers do not have the option to participate in a demand response program that would provide the rationale for purchasing a “grid-enabled” water heater. Nationally, the situation is not much better. While there are large areas with organized wholesale electric capacity markets (California, Mid-Atlantic, Midwest and New England regions), the ability for an end consumer to “opt-in” and receive economic benefit is dependent on a third-party aggregator that is “bidding into” the capacity market for a limited period usually much shorter (1-3 years) than the lifetime of the water heater. 3. Variability of demand-side capacity value to the Northwest grid. In any given year, the Northwest hydroelectric system provides a very large capacity resource that has the potential to meet almost all the peak demand of the bulk power system. However, constraints on water flows to support fish and wildlife, flood control, and transportation along with hydrological availability from snow and rainfall across the region create high levels of uncertainty in the actual capacity available in any given year. This uncertainty makes it difficult to quantify the actual value of a grid-enabled water heater. At the distribution system level, there can be significant benefits for components that are approaching maximum capacity; however, these tend to be very localized and difficult to translate to a market that manufactures water heaters on a national scale. This variability
Demand Response Market Transformation and Business Case Report
30
in capacity value has largely inhibited traditional water heating demand response programs in the Northwest. 4. Competing communication standards. As noted in Section 1.2, USB is the only communication standard that competes with CTA-2045 in terms of functionality. A socket-based communication interface accommodates all standards commonly discussed with regard to command languages or wireless/wired interfaces. 5. Consumers do not think about water heaters until time of replacement. Unlike other appliances or equipment, consumers generally do not interact with or even think about their water heater until it fails or is otherwise affecting water heating performance. Further, because water heaters generally last for 15 years before replacement, generalized marketing and awareness to consumers will be largely meaningless to all but a small segment of the population faced with a replacement decision. 6. Consumer concerns about privacy, security, and performance. Privacy, security, and performance are standard concerns for any consumer facing a demand response program. However, water heaters provide some additional challenges since they are largely invisible to the end-consumer. A lack of hot water availability resulting from a grid event creates the potential for additional anxiety compared to grid management of a thermostat where there is a high degree of pre-existing engagement with the customer. 7. Grid Security from foreign hackers. When demand response and distributed energy resource scale over time, most stakeholders rightfully raise issues about protecting distributed assets from cyber-attacks. The CTA-2045 socket approach is the robust solution to security since if the communication module that gets “plugged in” cannot be upgraded over its communication link outside the home to address attack vectors, then the UCM can simply be replaced with one that offers this capability. By comparison, embedding Wi-Fi in an appliance increases the exposure because the firmware inside the appliance may be difficult to upgrade. The Need for Intervention Given the significance of the barriers described above, market opportunities alone are unlikely to drive the water heating market to add “grid-enabled controls” to products without external intervention. Solving “grid efficiency” appears to be outside the motivation of any single market actor (customer, manufacturer, utility, regulator, or federal agency). In contrast to energy efficiency, the customer, at the time of product purchase, derives no inherent benefit from a demand response-enabled product. Manufacturers have little interest in adding features and subsequent costs to products for which the customer will not pay. While a purely market-based solution may be preferable, a number of different market mechanisms have been tried since the passage of the Energy Independence and Security Act in 2007; however, no such solution has yet proven effective.
Demand Response Market Transformation and Business Case Report
31
Direct intervention that provides financial incentives to consumers, utilities, and/or appliance manufacturers will likely be necessary in order to overcome the large barriers described above until the opportunities identified can become enough of a driving force that subsidies are no longer necessary. In addition to subsidies, garnering industry and regulatory consensus around common grid-response command structures and communications protocols will be needed to reduce implementation costs. However, although many such protocols exist, manufacturers will pick a lower-cost proprietary method only in the absence of a single protocol desired by all stakeholders. Regulators don’t like to select one protocol among many, utilities are usually averse to speak with one voice, and customers are not asking manufacturers for anything. Lastly, consumers’ perceived costs, which include loss of convenience and flexibility in addition to economic costs, must be minimized. Responsive appliances should:
• Require very little or no consumer interaction once installed. • Inform consumers, while preserving privacy. • Enable consumer override capability at any time. • Provide ease of implementation and consistency in operation and coverage.
This effort will need to touch on motivations and drivers other than simple return on investment. Solving this problem is a long-term play for utilities, consumers, manufacturers, and the supply chain actors. Benefits will not be seen right away; however, if utility planners are looking for a cost-effective solution at scale in 10 to 20 years, then water heaters will be very cost-effective as thermal batteries and a peak load resource.
Vision of End State of Transformed Electric Water Heater Market In order to develop an effective market transformation plan, we need to first establish a clear vision of the endpoint of the proposed interventions.
4.3.1 Program Vision
All electric water heaters 40 gallons and larger that are shipped to the Pacific Northwest have an open-source communication interface (CTA-2045); the interface is a socket much like a USB port, but designed to accommodate demand response functionality. The plan includes both traditional electric resistance (ER) and heat pump (HPWH) water heaters. All three major water heater manufacturers (AO Smith, Bradford White, Rheem) agree to an open-source (CTA-2045 communication port and supporting technologies) standard with a minimum set of DR functionality enabled in the water heater. All utilities support and promote an open-source, standard demand response (DR) protocol; if not the ANSI/CTA-2045 application layer, then another open-source protocol that supports the same minimum functionality. To enable widespread adoption, there will be regionally-qualified, third-party DR operators that can provide turnkey services to make adoption easy for regional utilities. Stakeholders will coordinate to maximize the value of messages that promote the benefits of connected flexible load communications. ENERGY STAR and the
Demand Response Market Transformation and Business Case Report
32
DOE recognize and promote ANSI/CTA-2045 communication ports on key products, specifically water heaters. In five to 10 years, code officials will require communication ports on all electric water heaters 40 gallons and larger.
4.3.2 Scope of this Market Transformation Plan The Northwest Energy Efficiency Alliance (NEEA) is a nonprofit organization working to accelerate energy efficiency in the Pacific Northwest through the acceleration and adoption of energy-efficient products, services, and practices through a process called market transformation. NEEA is supported by and works in partnership with more than 140 Northwest utilities.NEEA proposes that the scope of this market transformation plan be defined as leveraging the capabilities of the customer’s electric water heating controlled via a CTA-2045 communication interface, managed by either utilities or aggregators (acting as agents for the utility, or independently) to meet capacity needs of the Northwest Power & Conservation Council’s (NPCC’s) applicable Power Plan [NPCC 2016] and in advanced applications to use the thermal storage attributes of tanks to improve the integration of renewables to create overall grid efficiencies, while still delivering a positive customer water heater experience (cost and performance).
Development of the Market Transformation Plan NEEA, in collaboration with BPA and utility stakeholders, developed the plan in this report through its established analysis method. The term market transformation is the strategic process of intervening in a market to create lasting change in market behavior by removing identified barriers or exploiting opportunities to accelerate the adoption of all cost solutions as a matter of standard practice. The process of market transformation identifies barriers, challenges, opportunities, interventions, outcomes, and impacts that end in a transformed market. In summary, this analysis examines the market challenges and barriers in view of the program vision stated above. It also examines market assets and general opportunities that support the transformation effort. This analysis leads to a systematic plan of activities and metrics to reach the defined vision (detailed in Appendix I – Market Transformation Plan). The results of this analysis suggest multiple strategies, and we detail the most likely approach in Section 4.5.
Market Transformation Strategies There are three primary strategies to overcome barriers and leverage the opportunities described above. The key elements for the first two are to work closely with the three OEMs to overcome the non-recurring engineering (NRE) costs (Strategy #1), offset the incremental costs (Strategy #2), and finally, to work with code officials to change the code to encourage a path to compliance via Strategy #3.

Demand Response Market Transformation and Business Case Report
33
4.5.1 Strategy #1: Non-Recurring Manufacturing Costs NEEA has had positive initial conversations with all three of the major water heater manufacturers (US market shares are: AO Smith [44%], Rheem [34%], and Bradford White [15%]). In addition, GE has continued to work with the test team20 to improve the adapter code as the field tests were rolled out. NEEA has identified this as a two-step process that will require a great deal of coordination with all the regional and national consortia of utilities to fund and implement this phase. Listed below are the steps and the estimated costs for the NRE and the incremental costs. The business model reflects this approach and costs. There are two elements to the cost for the manufacturers: first, the non-recurring engineering costs (NRE) (engineering and testing of new design) and second, the incremental costs (costs for added parts, features, or benefits). We use calendar years (for out years) to designate completion dates for specific activities and milestones in the implementation plan and the model. No definitive schedule has yet been set.
4.5.1.1. Manufacturer Technology Assistance Phase 1 This phase includes funding of the non-recurring engineering (NRE) for all three of the major OEMs (AO Smith, Rheem, and Bradford White). Grants would be negotiated independently with each of the three manufacturers, with the general principle that the grants would be higher for the first mover to delivery of embedded CTA-2045 into products, such that the only element needed to communicate with the “smart” electric water heater would be a plug-in communication module. The current estimated total amount for the NRE would be $950K spread among the three major OEMs, with the larger portion going to the first movers. The elements for inclusion in this phase are:
1) CTA-2045 plug native on tank (physical layer) on all electric and HPWH water tanks 40 gallons and larger.
2) Inclusion of communication protocol per CTA-2045. 3) Inclusion of the full set of standard CTA-2045 commands as of the time of
agreements.
20 General Electric was a major HPWH market disruptor from 2009-2016. They successfully brought customer-friendly products with remote management capabilities to the market. GE developed a prototype CTA-2045 conversion module. Given that GE had good penetration of HPWHs in the Pacific Northwest, it made sense for this study to leverage the installed base. In August of 2016, GE announced that it would be closing down its HPWH line and putting it up for sale. This was done due to internal pressures of profitability and GE Appliances being sold to Haier. GE continued to support the communication protocol even after the sale of the line to Bradford White. GE sees the value of connectivity of its products in its consumer product division for business profitability reasons. (Market intelligence from NEEA Product Management team)
Demand Response Market Transformation and Business Case Report
34
4) Temperature regulation and reporting accuracy to be +/- 2 degrees F and 1 degree C.
5) Response time to enable CTA-2045 commands within five seconds. 6) Ability to have 1,000 or more DR events per year for the life of the product.
This phase could start as early as the end of Q4 2018 and run through Q4 2019, depending on when the utility coalition is formed and funded. Products would start to show up in market test areas as early as 2019 or one year after the formation of the coalition and be at full capacity by 2022 or two years after the start of the funding process. The first and second OEMs would come to market with an interim adapter solution by offering universal communication modules (UCMs) that could be plugged in. Sufficient inventory of UCMs would need to be procured so that the CTA-2045 water heaters wouldn’t become stranded assets in the future. Adapter phase – This adapter would convert the existing proprietary OEM plug into a universal standard CTA-2045 plug in both AC and DC form factors. The adapter also creates a platform to test the “smart” algorithm without the need to recertify the UL listing with each change. The estimated cost per adapter would be $60, based on 2018 pricing at sufficient volume.
4.5.2 Strategy #2: Offsetting the per-Unit Incremental Cost The incremental costs per tank for early phase non-recurring engineering to move from proprietary to native CTA-2045 would be approximately $20 per tank for electric resistance and $2 for HPWH. The universal communication module (UCM) is the element that allows the utility to select the preferred communication module (FM, cellular, Wi-Fi or others); it plugs into a standard CTA-2045 port. This would be a one-time fee per tank. Prices are based on hundreds to thousands of units. Cost per tank: initially $100 to $75 dropping to $25 over 10 years as volume increases. The final end state of Strategies #1 and #2 would be to have the CTA-2045 plug native per tank (i.e., installed on all tanks shipped to the Pacific Northwest): During this phase, the OEM would have CTA-2045 native21 on the tank, thus not requiring an adapter, which allows the UCM to be plugged directly into the water heater by the customer. Early numbers estimate this would cost between $2 and $30 per tank; the incremental cost depends on total volume of an OEM’s product portfolio on a national basis.
21 Native is considered as follows: CTA-2045 plug, onboard communication software, and standard set of basic DR commands.
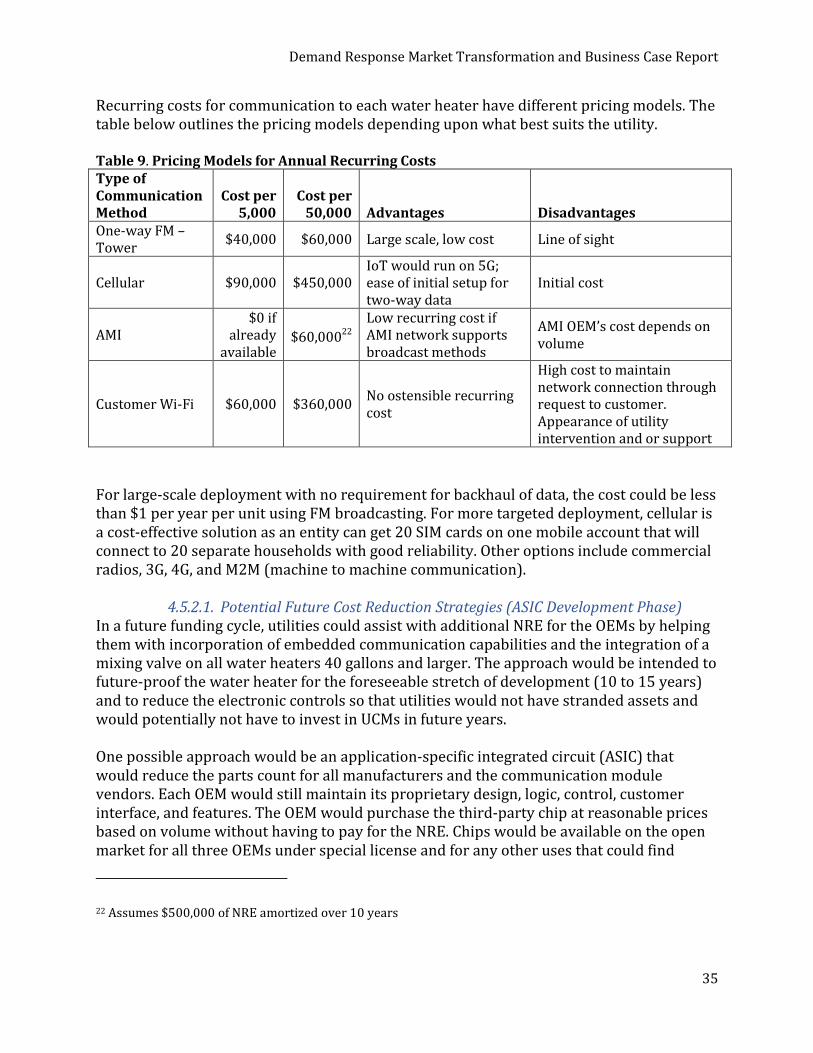
Demand Response Market Transformation and Business Case Report
35
Recurring costs for communication to each water heater have different pricing models. The table below outlines the pricing models depending upon what best suits the utility. Table 9. Pricing Models for Annual Recurring Costs Type of Communication Method
Cost per 5,000
Cost per 50,000 Advantages Disadvantages
One-way FM – Tower
$40,000 $60,000 Large scale, low cost Line of sight
Cellular $90,000 $450,000 IoT would run on 5G; ease of initial setup for two-way data
Initial cost
AMI $0 if
already available
$60,00022
Low recurring cost if AMI network supports broadcast methods
AMI OEM’s cost depends on volume
Customer Wi-Fi $60,000 $360,000 No ostensible recurring cost
High cost to maintain network connection through request to customer. Appearance of utility intervention and or support
For large-scale deployment with no requirement for backhaul of data, the cost could be less than $1 per year per unit using FM broadcasting. For more targeted deployment, cellular is a cost-effective solution as an entity can get 20 SIM cards on one mobile account that will connect to 20 separate households with good reliability. Other options include commercial radios, 3G, 4G, and M2M (machine to machine communication).
4.5.2.1. Potential Future Cost Reduction Strategies (ASIC Development Phase) In a future funding cycle, utilities could assist with additional NRE for the OEMs by helping them with incorporation of embedded communication capabilities and the integration of a mixing valve on all water heaters 40 gallons and larger. The approach would be intended to future-proof the water heater for the foreseeable stretch of development (10 to 15 years) and to reduce the electronic controls so that utilities would not have stranded assets and would potentially not have to invest in UCMs in future years. One possible approach would be an application-specific integrated circuit (ASIC) that would reduce the parts count for all manufacturers and the communication module vendors. Each OEM would still maintain its proprietary design, logic, control, customer interface, and features. The OEM would purchase the third-party chip at reasonable prices based on volume without having to pay for the NRE. Chips would be available on the open market for all three OEMs under special license and for any other uses that could find
22 Assumes $500,000 of NRE amortized over 10 years
Demand Response Market Transformation and Business Case Report
36
applications. The elements for inclusion in this phase would be collaboration and coordination with all three OEMs, selected aggregators, and market actors to develop an ASIC that would provide standard elements of CTA-2045. This phase would start at least five years after the initial OEM non-recurring engineering (NRE) phase and would complete after 36 months. OEMs would start integrating the technology into product lines as they roll out and improve product platforms. Cost savings to OEMs should be significant so that uptake would be as rapid as economically feasible. The addition of the mixing valve would increase the capabilities and capacity of both ER and HPWHs.
4.5.3 Strategy #3: Integration in Codes and Standards The code cycle for each state is different. Washington would be the first to move, followed by Oregon; states that use the International Energy Conservation Code (IECC), Montana and Idaho, would phase in later. In the ideal world, communication protocols would be added earlier rather than later. The model uses 2028 as the year that code is expected to be in place for Washington and Oregon, and a couple years later for the remaining states. Code changes often occur after voluntary standards are adopted such as the Advanced Water Heating Specification (AWHS), which calls out specific requirements (See Appendix C – CTA-2045 Commands and Related Specifications) and/or programs that are implemented across the US, often driven by the Consortium for Energy Efficiency (CEE) specification and program description (See Appendix C – CTA-2045 Commands and Related Specifications) that specifically call out the inclusion of CTA-2045 as a requirement of different tier levels.
Implementation Approaches NEEA has identified potential funding mechanisms to the implementation of DR on all electric water heaters (ER and HP). The rest of this section details the option on which we will focus; while the steps involved are potentially transferable to other options, they will generally be out of the region’s control. A consortium of utilities (regional and/or national) would work with OEMs to reduce the NRE and the incremental costs to implement their product lines to all move to CTA-2045. This could be regional and or national in scale and is the most logical and probable option (Section 4.5.1). The Pacific Northwest would lead the coalition of early-adopter utilities. This group’s activities are described in more detail in Chapter 6 of this report under Recommendations for Next Steps. Basically, it would provide the seed funding that would lead to a unified voice of the utilities both in the PNW and outside the region to fund the strategies listed above (NRE, incremental costs, and continued improvements). This coalition would create a method to pool resources, create agreements with OEMs, and make commitments on which markets would move first.
Demand Response Market Transformation and Business Case Report
37
4.6.1 Aggregator or Market Actor Funds All the NRE and the Incremental Costs to Bring CTA-2045 to the Market for One or More of the Key OEMs.
NEEA has recently heard there might be market actors with vision and deep pockets to fund all the NRE listed in Section 4.5.1 as well as the incremental cost to have CTA-2045 installed on all electric water heaters (ER and HPWH) 40 gallons and larger. While having someone else fund the effort could be considered a great intervention, it does introduce other variables and reduces control of the market transition to a DR-enabled flexible load by having a private interest group drive the direction of the solution. Imagine if Google or Amazon were to take on this effort and their focus was on selling products rather than on societal good or grid optimization; we might find that the third-party approach would render desirable grid features not cost-effective. While there are numerous risks with this approach, it could lead to significant cost reductions and even some risk reductions for the utilities.
4.6.2 Non-Utility Market Actor Invests in One or More Water Heater Manufacturers and Funds All the NRE and the Incremental Costs.
NEEA has also heard of a couple of large non-utility or philanthropic organizations that have an interest in making significant impacts in energy efficiency and assisting the grid to shift to more renewables by leveraging the water heater market and thus reducing CO2 emissions. One organization estimated that with a $5-$20 million targeted investment, it could shift the market here on the West Coast. Here again, while this could be an ideal solution, the devil is in the details and many of these organizations may not have the expertise in-house to properly execute; this could create challenges for the utilities individually or collectively. This option then introduces challenges on control and ownership of the resources and who would capture the carbon value of DR.
Proposed Market Engagement (Utilities, Customers, and Manufacturers) Cohort Group Implementation / CTA-2045 Roll-out Penetration of CTA-2045-equipped tanks would be a three-phase approach with an offset by 12 months for each OEM starting in 2020. For reference purposes, we use calendar years (for out years) to designate when specific activities and milestones would be completed in the implementation plan and the model. That said, if the planning process or coalition building takes a little longer, the project would just start out a year or two after the completion of the report. The overarching efforts are to:
• Educate and learn what utilities need to launch a DR program with their customers. • Work with the OEM and its supply chain to determine how it can phase in its
product line to have CTA-2045 native on popular and less-popular products. • Work with utilities, the Bonneville Power Administration (BPA), and others to
create a value proposition to create programs for aggregators to engage with Northwest utilities.
• Gain understanding of how the public would embrace a demand response for water heaters across markets (retrofit, new construction, emergency replacement, and proactive replacement).
Demand Response Market Transformation and Business Case Report
38
NEEA would engage with the three OEMs to determine the best way to roll out the CTA-2045 strategy. If OEMs want a moderate ramp, then NEEA would propose a three-phase market implementation; this is the base case detailed below and used in the economic model. If the OEMs would rather go for a full Pacific Northwest approach, NEEA would aggregate all the utilities and gain commitments to fund the incremental costs for all electric water heaters 40 gallons and larger shipping into the four-state region. If the approach is a phased market test, then NEEA would convene all utilities involved in the target markets and provide an economic structure, aggregation, and management of all funds to implement the program (incremental costs, outreach and communication, awareness campaigns, coordination with regional and extra-regional utilities, aggregators, and suppliers). Working with the three-phase market test would enable the market transformation team to deploy agile development strategies (continuously learning and correcting). Additionally, each utility test group would have different markets and approaches, so the intervention would need to be tailored to different utilities and different markets. The market test would also allow the utility to gain deep knowledge and experience to better understand the capabilities of and challenges with demand response in the residential market. Participating utilities would oversee direct communication with customers regarding participation in their respective demand response programs. NEEA would develop three typical outreach or business model campaigns for utilities to choose from that could be further customized. Assumptions are as follows:
• Existing distribution channel would maintain brand loyalty. • Existing water heater sales channels would provide technical and channel product
training. • Additional testing and validation would be required before going fully native. • OEMs would determine which products would have adapters for CTA-2045 and
which would be native during the specific phases of the roll-out. • In the first two years of the implementation phase for each cohort, using tanks that
require CTA-2045 adapters, the market transformation team will, if needed, implement control commands under the utilities’ direction.
• The market transformation team would offer a universal communication module (UCM) platform as an option until utilities have the sophistication to make the appropriate technology decisions.
• For the first five years, utilities would focus on peak demand events and learning about energy shifting and regional critical-need events.
NEEA would provide tracking and reporting of sales and administer the incremental cost incentives directly to the OEMs and channel partners.

Demand Response Market Transformation and Business Case Report
39
4.7.1 Cohort One Campaign (begins 2020) This cohort would cover PGE and Clark County PUD territory23 (Portland/Vancouver market) (~3,800 units years 1 and 2). The purpose of this phase is to educate utilities on how to engage with third-party aggregators to deliver CTA-2045 demand response capability. This cohort is selected because it has one contiguous marketplace and one demand response-experienced utility (PGE). Steps involved are as follows:
1) Work with the first OEM to stock the market with CTA-2045-ready products. Start with 50-gallon electric resistance and HPWHs, then bring in all smaller tanks of 40 gallons or more opportunistically over a two-year period. This first phase of Cohort One would use adapters for the first two years and then migrate to an onboard CTA-2045 port in Year 3 as stock allows and as the OEM rolls out technology.
2) Provide upstream incremental cost to offset additional costs so that distribution and installers are not adversely impacted.
3) Partner with key distribution houses (e.g., Ferguson) and retailers (e.g., Lowe’s) to maintain price parity with other market actors.
4) Implement incentives in the adapter phase to get customer names and engagement. 5) Educate high-volume plumbers about the change and teach them how to embrace
the value of the enhanced feature set product. 6) Start the public awareness campaign in Year 3 (see Section 4.8). Work with existing
market channels to promote brand loyalty and awareness of demand response available water heaters.
7) Once second and third manufacturers come online, repeat the above steps. 8) Evaluate performance and lessons learned (technical aspects and market effect).
Cohort One would start in Q1 2020 and run through 2025. The active and investigative portion of the test would be in 2020 and 2021. Beginning in 2022, OEM #1 would ship only CTA-2045-equipped tanks to the entire metro Portland market: 11,400 tanks in 2022 to 17,000 tanks by 2024. Utilities would explore enrollment strategies and provide insights and feedback.
4.7.2 Cohort Two Campaign (begins 2021) This cohort would cover the Puget Sound area – Snohomish PUD, Seattle City Light, Puget Sound Energy, and Tacoma Power (4,100 units years 1 and 2). This phase is a bigger market with a mixture of utilities experienced and non-experienced in demand response. Education and familiarization with DR aggregators is key:
23 Consider all utilities named in Section 4.7 as proxies for the utilities yet to be determined. We use named utilities only so we can estimate the ramp-up period quantity and costs.

Demand Response Market Transformation and Business Case Report
40
1) Work with first and the second OEMs to fill the distribution channel and market with CTA-2045 products for major product categories first (50-gallon electric resistance and HPWH) Then bring in all smaller electric tanks of 40 gallons or more opportunistically. The first two years of the market test would use adapters if the second OEM hadn’t started to install CTA-2045 as native. Ensure a sufficient number of adapters for late adopters of the CTA-2045 first-generation tanks for future demand response programs.
2) Provide upstream incremental cost offset so that distributors and installers are not adversely impacted.
3) Partner with key distribution houses and retail to maintain price parity. 4) Educate high-volume plumbers about the change and teach them how to promote
the enhanced feature set product. 5) Expand the general awareness campaign into the Puget Sound market in Year 3 of
Cohort One (see Section 4.8). Work with existing market channels to promote brand loyalty and awareness.
6) Once second and third manufacturers come online, repeat the above steps. 7) Evaluate performance and lessons learned (technical aspects and market effect).
Cohort Two would start at the end of Q4 2020 and would run through 2024. The active and investigative portion of the test would be in 2021 and 2022. Beginning in 2023 both OEMs #1 and #2 are shipping tanks equipped with CTA-2045 to the Seattle metro area: about 28,000 tanks growing to 45,000 by 2024. OEM #2 is also shipping nearly 14,000 tanks in the Portland metro area.
4.7.3 Cohort Three Campaign (begins 2022) The third cohort campaign would begin with one or more utilities, yet to be identified, but outside the metro Portland and Seattle areas. We expect the third OEM to enter this market with 5,800 tanks that require an adapter in 2022 and 2023. After two years, with the third OEM qualified, 17,200 native CTA-2045 tanks would arrive in 2024 throughout Oregon and Washington, together with about 69,000 tanks from OEMs 1 and 2. At the end of 2024, all the major water heater manufacturers would be shipping CTA-2045 product throughout Oregon and Washington, and the market transformation “ramp-up” period is complete.
1) Work with all three manufacturers to flood the market with CTA-2045 products for major movers first (50-gallon electric resistance and HPWH) then move to greater than 50 gallons up to 80 gallons. Next, bring in all smaller tanks of 40 gallons or more opportunistically.
2) Provide upstream incremental cost offset so that distribution and installers are not adversely impacted.
3) Partner with key distribution houses and retail to maintain price parity. 4) Educate high-volume plumbers about the change and teach them how to promote
the enhanced feature set product. 5) Start the general awareness campaign (see Section 4.8) in Year 3 of Cohort One.
Work with existing market channels to promote brand loyalty and awareness. 6) Once the second and third manufacturers come online, repeat the above steps. 7) Evaluate performance and lessons learned (technical aspects and market effect).
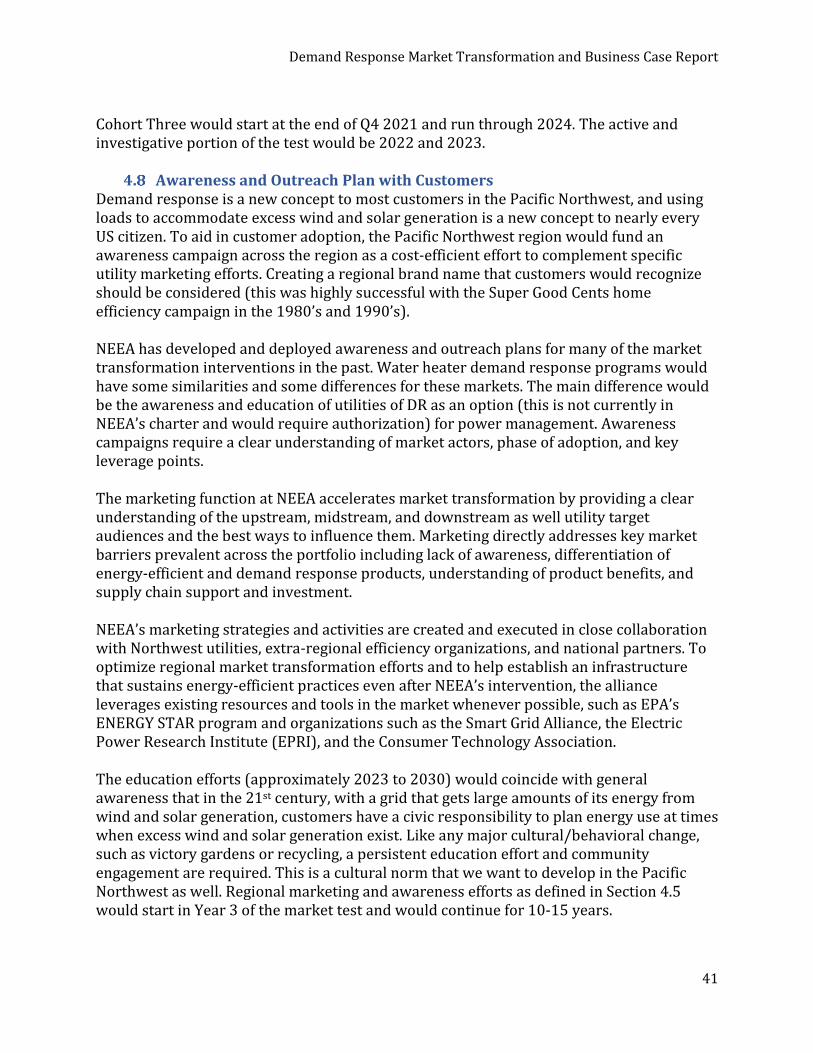
Demand Response Market Transformation and Business Case Report
41
Cohort Three would start at the end of Q4 2021 and run through 2024. The active and investigative portion of the test would be 2022 and 2023.
Awareness and Outreach Plan with Customers Demand response is a new concept to most customers in the Pacific Northwest, and using loads to accommodate excess wind and solar generation is a new concept to nearly every US citizen. To aid in customer adoption, the Pacific Northwest region would fund an awareness campaign across the region as a cost-efficient effort to complement specific utility marketing efforts. Creating a regional brand name that customers would recognize should be considered (this was highly successful with the Super Good Cents home efficiency campaign in the 1980’s and 1990’s). NEEA has developed and deployed awareness and outreach plans for many of the market transformation interventions in the past. Water heater demand response programs would have some similarities and some differences for these markets. The main difference would be the awareness and education of utilities of DR as an option (this is not currently in NEEA’s charter and would require authorization) for power management. Awareness campaigns require a clear understanding of market actors, phase of adoption, and key leverage points. The marketing function at NEEA accelerates market transformation by providing a clear understanding of the upstream, midstream, and downstream as well utility target audiences and the best ways to influence them. Marketing directly addresses key market barriers prevalent across the portfolio including lack of awareness, differentiation of energy-efficient and demand response products, understanding of product benefits, and supply chain support and investment. NEEA’s marketing strategies and activities are created and executed in close collaboration with Northwest utilities, extra-regional efficiency organizations, and national partners. To optimize regional market transformation efforts and to help establish an infrastructure that sustains energy-efficient practices even after NEEA’s intervention, the alliance leverages existing resources and tools in the market whenever possible, such as EPA’s ENERGY STAR program and organizations such as the Smart Grid Alliance, the Electric Power Research Institute (EPRI), and the Consumer Technology Association. The education efforts (approximately 2023 to 2030) would coincide with general awareness that in the 21st century, with a grid that gets large amounts of its energy from wind and solar generation, customers have a civic responsibility to plan energy use at times when excess wind and solar generation exist. Like any major cultural/behavioral change, such as victory gardens or recycling, a persistent education effort and community engagement are required. This is a cultural norm that we want to develop in the Pacific Northwest as well. Regional marketing and awareness efforts as defined in Section 4.5 would start in Year 3 of the market test and would continue for 10-15 years.
Demand Response Market Transformation and Business Case Report
42
Figure 4. Project Timeline
4.8.1 Assumptions Driving Cross-Product Leverage Through economies of scale enabled by pooling resources across the region, NEEA and its funders attract and influence national and international organizations such as manufacturers, industry associations, market actors, aggregators, and extra-regional utilities. Marketing is a key support function NEEA provides its partners to increase the adoption of its energy-efficient and demand response products and practices.
1) Effective market transformation requires influencing the supply chain and the decision makers, utilities, regulators and end users of the technologies and practices. This can be reinforced through the inclusion of language in the Advanced Water Heating Specification (AWHS), the Consortium for Energy Efficiency (CEE) specification and the ongoing updates to the CTA-2045 specification. Appendix C – CTA-2045 Commands and Related Specifications provides more details on existing specifications and test procedures.
2) Marketing efforts, when implemented in concert with manufacturers, distributors, funders, utilities, and others to drive quicker adoption of products in the market, are a primary value and influence point of the alliance with the supply chain and with national and regional organizations.
3) Marketing strategies and tactics are more efficient when developed and deployed at scale.
4) Websites and other digital communications are a vital part of market transformation efforts. The proliferation of mobile devices and an established reliance on web searches for information across all markets provide an opportunity to educate and inform target audiences through websites and other digital media. Digital channels have become so ingrained in day-to-day business practices and consumer behavior that the absence of a digital strategy limits the impact of transformation efforts.
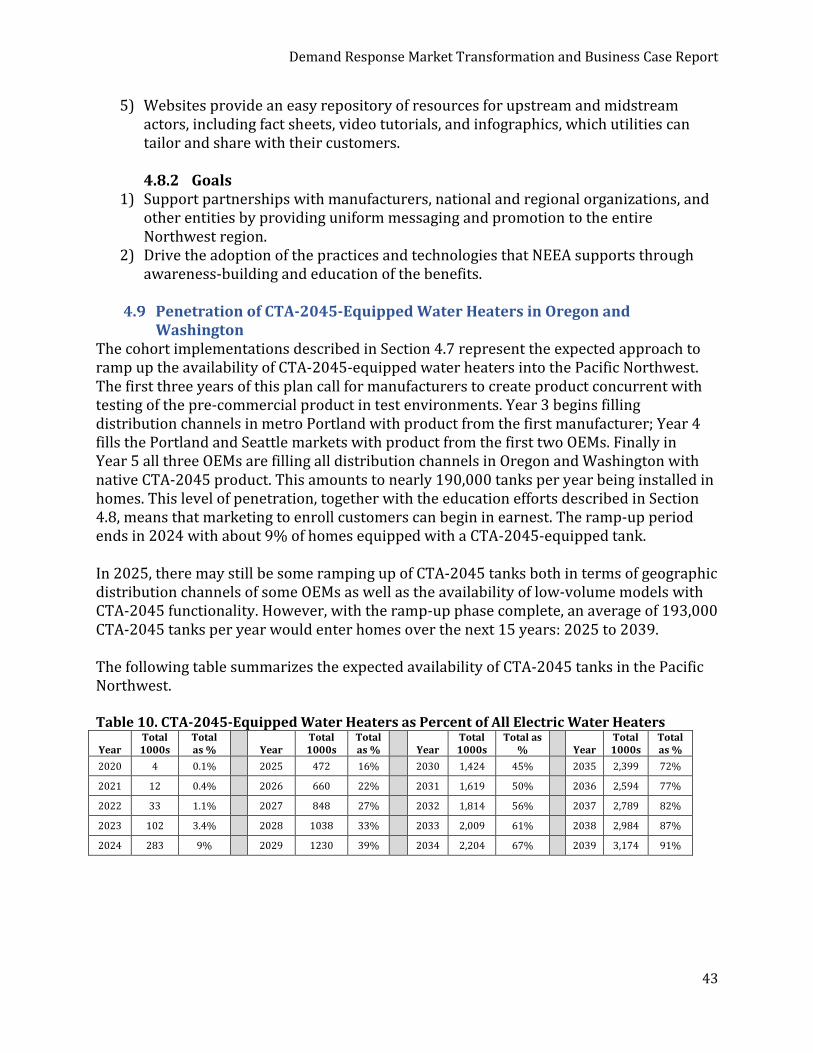
Demand Response Market Transformation and Business Case Report
43
5) Websites provide an easy repository of resources for upstream and midstream actors, including fact sheets, video tutorials, and infographics, which utilities can tailor and share with their customers.
4.8.2 Goals
1) Support partnerships with manufacturers, national and regional organizations, and other entities by providing uniform messaging and promotion to the entire Northwest region.
2) Drive the adoption of the practices and technologies that NEEA supports through awareness-building and education of the benefits.
Penetration of CTA-2045-Equipped Water Heaters in Oregon and
Washington The cohort implementations described in Section 4.7 represent the expected approach to ramp up the availability of CTA-2045-equipped water heaters into the Pacific Northwest. The first three years of this plan call for manufacturers to create product concurrent with testing of the pre-commercial product in test environments. Year 3 begins filling distribution channels in metro Portland with product from the first manufacturer; Year 4 fills the Portland and Seattle markets with product from the first two OEMs. Finally in Year 5 all three OEMs are filling all distribution channels in Oregon and Washington with native CTA-2045 product. This amounts to nearly 190,000 tanks per year being installed in homes. This level of penetration, together with the education efforts described in Section 4.8, means that marketing to enroll customers can begin in earnest. The ramp-up period ends in 2024 with about 9% of homes equipped with a CTA-2045-equipped tank. In 2025, there may still be some ramping up of CTA-2045 tanks both in terms of geographic distribution channels of some OEMs as well as the availability of low-volume models with CTA-2045 functionality. However, with the ramp-up phase complete, an average of 193,000 CTA-2045 tanks per year would enter homes over the next 15 years: 2025 to 2039. The following table summarizes the expected availability of CTA-2045 tanks in the Pacific Northwest. Table 10. CTA-2045-Equipped Water Heaters as Percent of All Electric Water Heaters
Year Total 1000s
Total as % Year
Total 1000s
Total as % Year
Total 1000s
Total as % Year
Total 1000s
Total as %
2020 4 0.1% 2025 472 16% 2030 1,424 45% 2035 2,399 72%
2021 12 0.4% 2026 660 22% 2031 1,619 50% 2036 2,594 77%
2022 33 1.1% 2027 848 27% 2032 1,814 56% 2037 2,789 82%
2023 102 3.4% 2028 1038 33% 2033 2,009 61% 2038 2,984 87%
2024 283 9% 2029 1230 39% 2034 2,204 67% 2039 3,174 91%

Demand Response Market Transformation and Business Case Report
44
5 Business Case – Benefits/Costs A major transformation of the grid and grid operations is underway. The major drivers of this transformation are the growing levels of wind and solar generation being added to the grid, both traditional utility scale resources as well as local resources on the distribution system. The second-largest driver is the ability for customers and third parties to control devices, e.g., batteries, thermostats, EVs, solar panels, etc. located on their premises. The enabler of this trend is the so-called Internet of Things, or IoT for short. Control of loads and customer generation devices is a lowest-cost resource to deal with random behavior of wind and solar generation. Some utilities are developing programs to control loads by working through a vendor; while this captures some of the benefit, in many cases it comes at the cost of a direct marketing opportunity with the customer, less flexibility over the control of device, and the unnecessary costs associated with third-party control of the device. Unfortunately, utilities are generally arriving late to IoT engagement with customers. Sections 5.1 through 5.4 explain the details of how we estimate a conservative benefit-cost ratio of 1.74 and a present value benefit in Section 5.5 for this market transformation initiative at $106 million dollars in today’s dollars. This estimate is based on the sole benefit of avoiding the construction of an equivalent amount of peaking capacity. The biggest reason for utilities to support a CTA-2045 market transformation effort is not because of the resource benefit and the dollar savings that it creates, but to gain a direct approach to engage with our customers so we can demonstrate our desire to avoid building conventional power plants and to communicate how they can directly aid in the integration of renewable energy. Equally valuable is the ability to establish a customer engagement approach that can be used by utilities outside the PNW and to establish a successful model for direct control to other major loads and distributed generation devices. In other words, market transformation on the lowly water heater is the gateway to a successful path for utilities to engage with customers in the IoT space (e.g., other appliances and loads in every home). The value streams created by controlling water heaters are listed in the rows of Table 11. The table differentiates (in the columns) the four key utility actors: investor-owned utilities (IOUs), public utilities with generation, full requirement public utilities, and BPA as a regional balancing authority, because benefits vary significantly according to their relationships to end-use customers and interactions with grid operators.
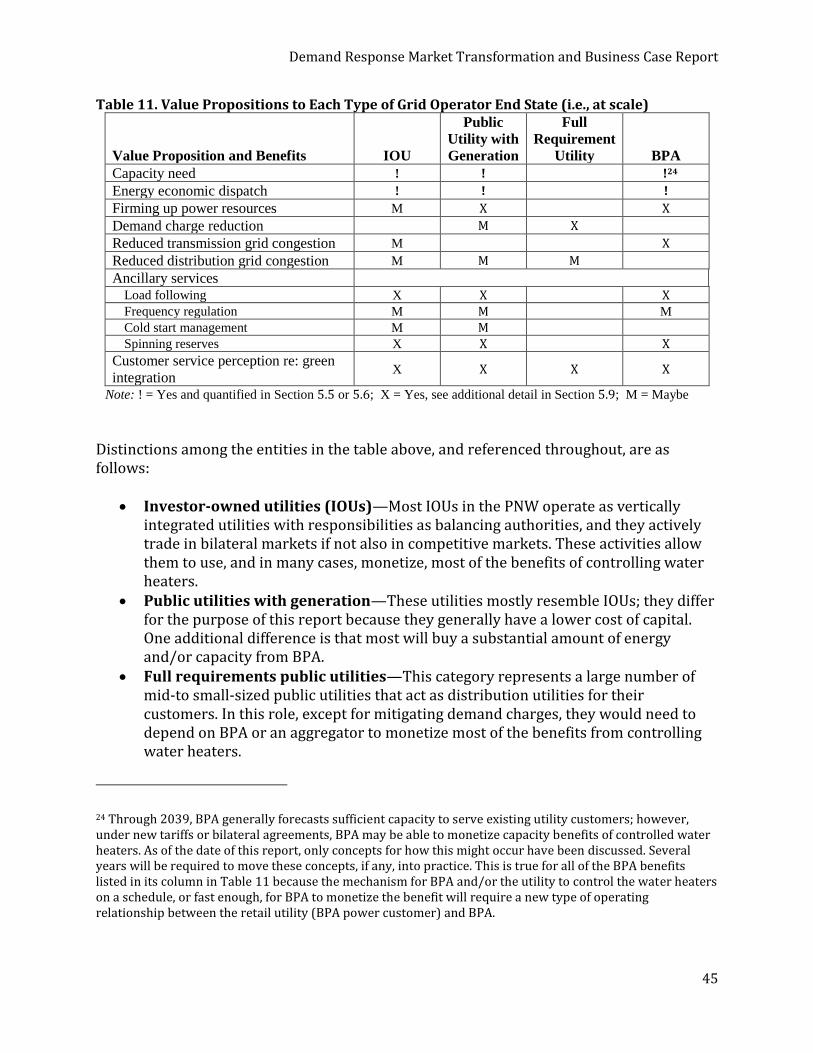
Demand Response Market Transformation and Business Case Report
45
Table 11. Value Propositions to Each Type of Grid Operator End State (i.e., at scale)
Value Proposition and Benefits IOU
Public
Utility with
Generation
Full
Requirement
Utility BPA
Capacity need ! ! !24
Energy economic dispatch ! ! !
Firming up power resources M X X
Demand charge reduction M X
Reduced transmission grid congestion M X
Reduced distribution grid congestion M M M
Ancillary services
Load following X X X
Frequency regulation M M M
Cold start management M M Spinning reserves X X X
Customer service perception re: green
integration X X X X
Note: ! = Yes and quantified in Section 5.5 or 5.6; X = Yes, see additional detail in Section 5.9; M = Maybe
Distinctions among the entities in the table above, and referenced throughout, are as follows:
• Investor-owned utilities (IOUs)—Most IOUs in the PNW operate as vertically integrated utilities with responsibilities as balancing authorities, and they actively trade in bilateral markets if not also in competitive markets. These activities allow them to use, and in many cases, monetize, most of the benefits of controlling water heaters.
• Public utilities with generation—These utilities mostly resemble IOUs; they differ for the purpose of this report because they generally have a lower cost of capital. One additional difference is that most will buy a substantial amount of energy and/or capacity from BPA.
• Full requirements public utilities—This category represents a large number of mid-to small-sized public utilities that act as distribution utilities for their customers. In this role, except for mitigating demand charges, they would need to depend on BPA or an aggregator to monetize most of the benefits from controlling water heaters.
24 Through 2039, BPA generally forecasts sufficient capacity to serve existing utility customers; however, under new tariffs or bilateral agreements, BPA may be able to monetize capacity benefits of controlled water heaters. As of the date of this report, only concepts for how this might occur have been discussed. Several years will be required to move these concepts, if any, into practice. This is true for all of the BPA benefits listed in its column in Table 11 because the mechanism for BPA and/or the utility to control the water heaters on a schedule, or fast enough, for BPA to monetize the benefit will require a new type of operating relationship between the retail utility (BPA power customer) and BPA.
Demand Response Market Transformation and Business Case Report
46
• BPA or system operators—BPA plays a major role as the region’s primary transmission provider. It provides hydro energy and/or capacity to most public retail utilities in the PNW under a number of different arrangements.
Method to Estimate Total Resource Availability
As a result of market transformation described in Chapter 4, DR-enabled water heaters enter the Pacific Northwest at the pace shown in Table 10. Section 5.1.1 estimates how many of these tanks become enrolled in a DR program, and Section 5.1.2 determines the capacity benefits in MW by applying the findings of this research, which were reported in Section 3.2. Simply stated, the resource availability is the product of tanks enrolled in a DR program times the kW benefit derived per enrollment. The following subsections of 5.1 describe how we estimate expected resource availability of CTA-2045-equipped tanks. To clarify this important benefit, Peak capacity savings is the ability to reduce the load of operating water heaters to reduce the costs of meeting load demand during system peak periods (typically, cold-weather-driven morning and evening peaks in mid-winter, and afternoon-evening demand in summer heat waves). A report from Advanced Energy Economy (AEE) found that 10% of the country’s electrical system is built to meet demand for just 1% of the year’s hours [AEE 2015].
5.1.1 General Approach to Modeling Customer Enrollments The assumptions below assume implementation of the awareness campaign described in Section 4.8. This effort would include descriptions of a DR-ready water heater, how the customer might come to own one, and why utilities would launch programs to enroll their customers’ new water heaters to create a new type of “power plant.” This education effort is critical to achieving the enrollment levels below. Enrollments depend on the total number of CTA-2045 tanks in the market each year, as described in Section 4.7. Enrollments also depend on how soon after installation of a CTA-2045-equipped tank in a home that a customer enrolls (if ever) this tank in a control program. Compared to market transformation for a conventional energy efficient product, DR market transformation has two important variables that make it different, and more difficult, to estimate the rate of benefit accrual:
1) The first variable depends on when a DR device is enrolled; that is, a DR-ready device does not produce benefits when installed, but rather only after the customer enrolls in the program. The estimate is created by taking the estimate of DR-ready tank installations defined in Section 4.9, and then estimating when (in years after installation) a customer enrolls their tank. Since demand response is new to most customers in the region, this might often be years after the installation because of the amount of awareness-building and education that needs to occur.
Demand Response Market Transformation and Business Case Report
47
2) The second variable is the adoption rate of HPWHs as a percent of all electric water heaters, since the kW and kWh yield is less per HPWH.
Three other variables that determine total resource availability are similar to variables found in energy efficiency adoption models, namely:
3) The markets (within the PNW) that participate in implementing and running DR programs.
4) The final saturation level of customer adoption of the technology. However, note that with DR programs, this is stated as the end-state equilibrium level, i.e., the percentage of customers enrolled when the number of new annual enrollments equals the number that leave the program.
5) The kW savings and energy shift ability in kWh, per tank, which are the primary findings of the research field pilot discussed in Sections 3.2 and 3.5 respectively.
Sections 5.1.1.1 through 5.1.1.5 define the assumptions about each of these five variables used in the aggregation model.
5.1.1.1. Variable #1: Customer Enrollment Assumptions For modeling customer enrollment, two phases of customer marketing efforts are assumed. The first effort seeks to enroll customers shortly after they purchase the tank. For example, marketing materials, at the point of sale or included with the tank, could motivate the customer to reach out to their utility to enroll. In the model, we assume that a small but increasing percentage of customers would enroll shortly after purchase. Table 12A shows the percentage of tanks shipped that get enrolled. The percentages in years 2020 through 2022 are relatively high because purchase rebates are used to find where the CTA-2045-ready tanks are being installed so a direct mail marketing effort can be implemented. The second marketing effort is coordinated with the awareness and education campaigns. This is a general marketing effort through local media, lasting at least 10 years, aimed at enrolling any CTA-2045-equipped tank that is not already enrolled. Table 12B shows that in the model, we assume enrollments follow an “S” curve adoption pattern applied to all unenrolled, CTA-2045-equipped tanks, regardless of age. In early years, “S” curves start with a small percentage of adoption that grows as awareness grows. As awareness becomes widespread, the percentage of adoption declines because most people have made a decision to enroll or to not enroll. The low adoption in the last few years occurred because all installed water heaters are now CTA-2045-equipped, and almost all customers are aware of their option to enroll in a DR program. The tables below show the enrollment assumptions used in the base case scenario. Customer adoption rate is the variable with the highest uncertainty; accordingly, these numbers are changed in the sensitivity analysis to test the effect on the benefit-cost outcome as discussed in Section 5.8.
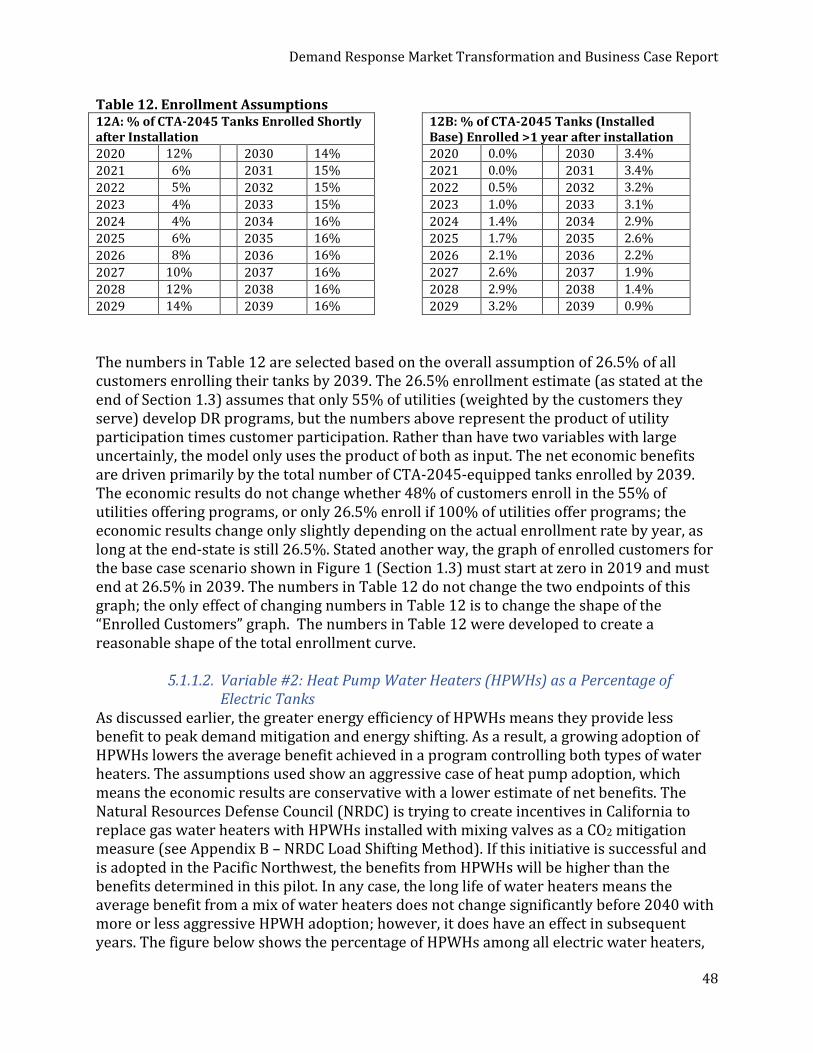
Demand Response Market Transformation and Business Case Report
48
Table 12. Enrollment Assumptions 12A: % of CTA-2045 Tanks Enrolled Shortly after Installation
12B: % of CTA-2045 Tanks (Installed Base) Enrolled >1 year after installation
2020 12% 2030 14% 2020 0.0% 2030 3.4%
2021 6% 2031 15% 2021 0.0% 2031 3.4%
2022 5% 2032 15% 2022 0.5% 2032 3.2%
2023 4% 2033 15% 2023 1.0% 2033 3.1%
2024 4% 2034 16% 2024 1.4% 2034 2.9%
2025 6% 2035 16% 2025 1.7% 2035 2.6%
2026 8% 2036 16% 2026 2.1% 2036 2.2%
2027 10% 2037 16% 2027 2.6% 2037 1.9%
2028 12% 2038 16% 2028 2.9% 2038 1.4%
2029 14% 2039 16% 2029 3.2% 2039 0.9%
The numbers in Table 12 are selected based on the overall assumption of 26.5% of all customers enrolling their tanks by 2039. The 26.5% enrollment estimate (as stated at the end of Section 1.3) assumes that only 55% of utilities (weighted by the customers they serve) develop DR programs, but the numbers above represent the product of utility participation times customer participation. Rather than have two variables with large uncertainly, the model only uses the product of both as input. The net economic benefits are driven primarily by the total number of CTA-2045-equipped tanks enrolled by 2039. The economic results do not change whether 48% of customers enroll in the 55% of utilities offering programs, or only 26.5% enroll if 100% of utilities offer programs; the economic results change only slightly depending on the actual enrollment rate by year, as long at the end-state is still 26.5%. Stated another way, the graph of enrolled customers for the base case scenario shown in Figure 1 (Section 1.3) must start at zero in 2019 and must end at 26.5% in 2039. The numbers in Table 12 do not change the two endpoints of this graph; the only effect of changing numbers in Table 12 is to change the shape of the “Enrolled Customers” graph. The numbers in Table 12 were developed to create a reasonable shape of the total enrollment curve.
5.1.1.2. Variable #2: Heat Pump Water Heaters (HPWHs) as a Percentage of Electric Tanks
As discussed earlier, the greater energy efficiency of HPWHs means they provide less benefit to peak demand mitigation and energy shifting. As a result, a growing adoption of HPWHs lowers the average benefit achieved in a program controlling both types of water heaters. The assumptions used show an aggressive case of heat pump adoption, which means the economic results are conservative with a lower estimate of net benefits. The Natural Resources Defense Council (NRDC) is trying to create incentives in California to replace gas water heaters with HPWHs installed with mixing valves as a CO2 mitigation measure (see Appendix B – NRDC Load Shifting Method). If this initiative is successful and is adopted in the Pacific Northwest, the benefits from HPWHs will be higher than the benefits determined in this pilot. In any case, the long life of water heaters means the average benefit from a mix of water heaters does not change significantly before 2040 with more or less aggressive HPWH adoption; however, it does have an effect in subsequent years. The figure below shows the percentage of HPWHs among all electric water heaters,
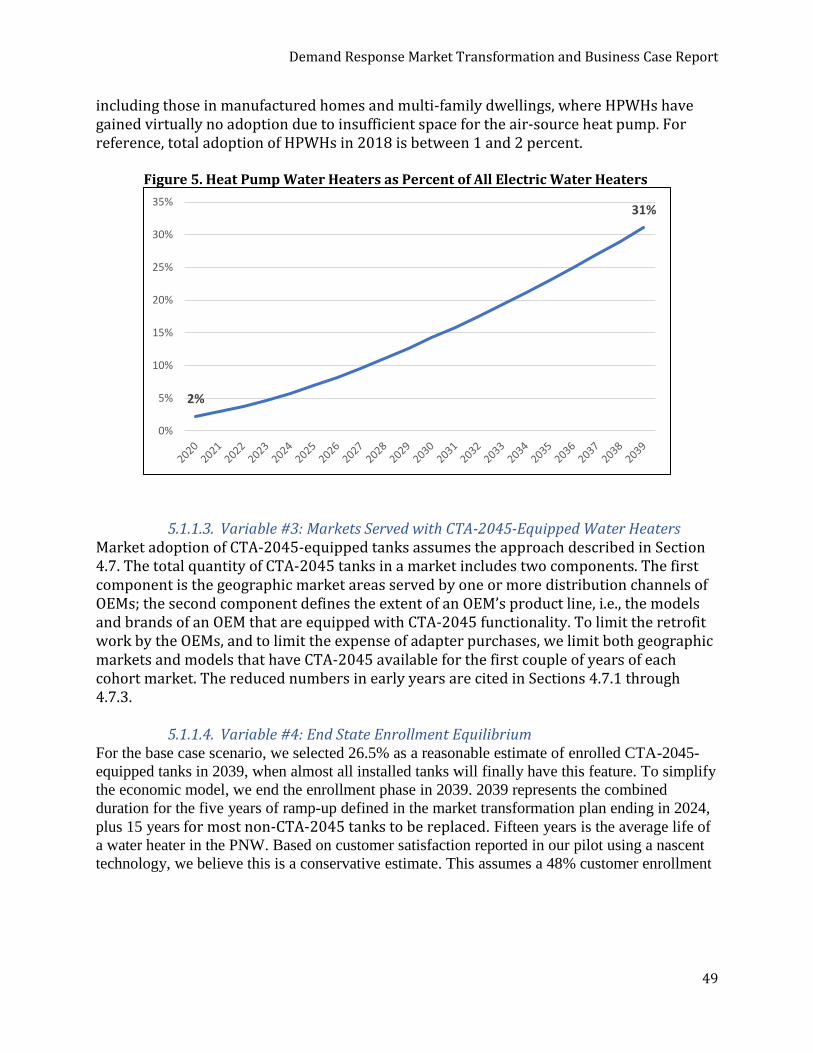
Demand Response Market Transformation and Business Case Report
49
including those in manufactured homes and multi-family dwellings, where HPWHs have gained virtually no adoption due to insufficient space for the air-source heat pump. For reference, total adoption of HPWHs in 2018 is between 1 and 2 percent.
Figure 5. Heat Pump Water Heaters as Percent of All Electric Water Heaters
5.1.1.3. Variable #3: Markets Served with CTA-2045-Equipped Water Heaters Market adoption of CTA-2045-equipped tanks assumes the approach described in Section 4.7. The total quantity of CTA-2045 tanks in a market includes two components. The first component is the geographic market areas served by one or more distribution channels of OEMs; the second component defines the extent of an OEM’s product line, i.e., the models and brands of an OEM that are equipped with CTA-2045 functionality. To limit the retrofit work by the OEMs, and to limit the expense of adapter purchases, we limit both geographic markets and models that have CTA-2045 available for the first couple of years of each cohort market. The reduced numbers in early years are cited in Sections 4.7.1 through 4.7.3.
5.1.1.4. Variable #4: End State Enrollment Equilibrium For the base case scenario, we selected 26.5% as a reasonable estimate of enrolled CTA-2045-
equipped tanks in 2039, when almost all installed tanks will finally have this feature. To simplify
the economic model, we end the enrollment phase in 2039. 2039 represents the combined
duration for the five years of ramp-up defined in the market transformation plan ending in 2024,
plus 15 years for most non-CTA-2045 tanks to be replaced. Fifteen years is the average life of
a water heater in the PNW. Based on customer satisfaction reported in our pilot using a nascent
technology, we believe this is a conservative estimate. This assumes a 48% customer enrollment
2%
31%
0%
5%
10%
15%
20%
25%
30%
35%
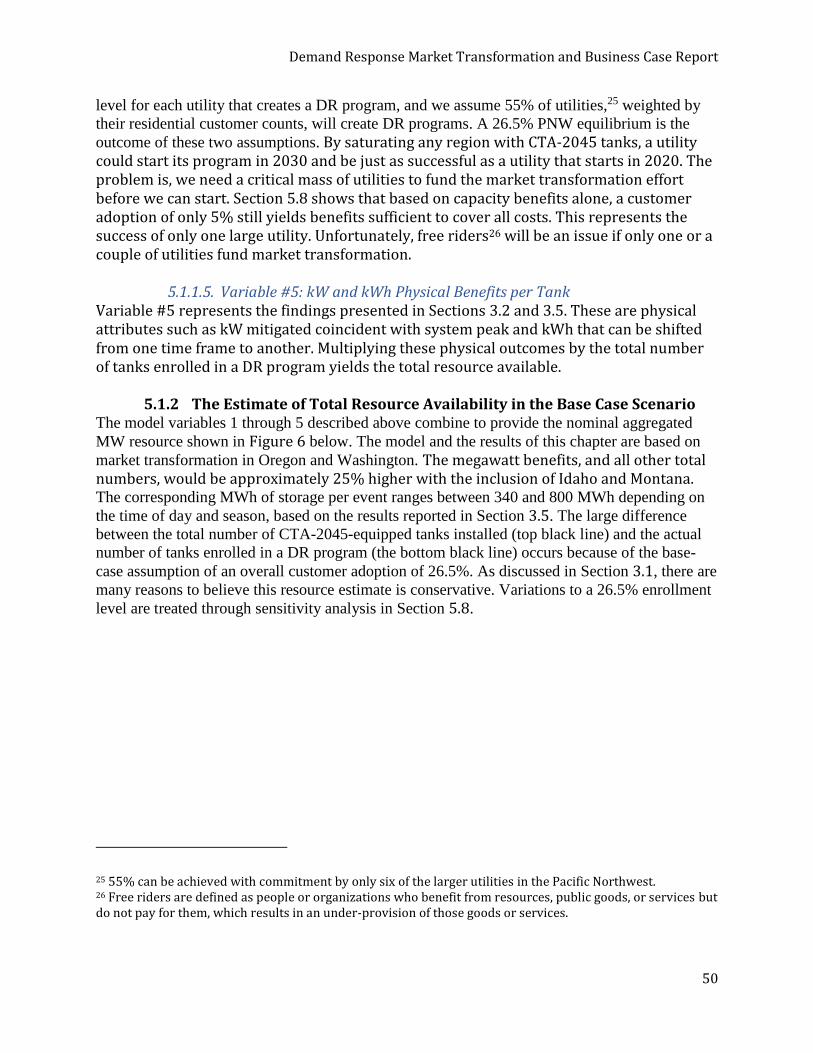
Demand Response Market Transformation and Business Case Report
50
level for each utility that creates a DR program, and we assume 55% of utilities,25 weighted by
their residential customer counts, will create DR programs. A 26.5% PNW equilibrium is the
outcome of these two assumptions. By saturating any region with CTA-2045 tanks, a utility could start its program in 2030 and be just as successful as a utility that starts in 2020. The problem is, we need a critical mass of utilities to fund the market transformation effort before we can start. Section 5.8 shows that based on capacity benefits alone, a customer adoption of only 5% still yields benefits sufficient to cover all costs. This represents the success of only one large utility. Unfortunately, free riders26 will be an issue if only one or a couple of utilities fund market transformation.
5.1.1.5. Variable #5: kW and kWh Physical Benefits per Tank Variable #5 represents the findings presented in Sections 3.2 and 3.5. These are physical attributes such as kW mitigated coincident with system peak and kWh that can be shifted from one time frame to another. Multiplying these physical outcomes by the total number of tanks enrolled in a DR program yields the total resource available.
5.1.2 The Estimate of Total Resource Availability in the Base Case Scenario The model variables 1 through 5 described above combine to provide the nominal aggregated
MW resource shown in Figure 6 below. The model and the results of this chapter are based on
market transformation in Oregon and Washington. The megawatt benefits, and all other total numbers, would be approximately 25% higher with the inclusion of Idaho and Montana. The corresponding MWh of storage per event ranges between 340 and 800 MWh depending on
the time of day and season, based on the results reported in Section 3.5. The large difference
between the total number of CTA-2045-equipped tanks installed (top black line) and the actual
number of tanks enrolled in a DR program (the bottom black line) occurs because of the base-
case assumption of an overall customer adoption of 26.5%. As discussed in Section 3.1, there are
many reasons to believe this resource estimate is conservative. Variations to a 26.5% enrollment
level are treated through sensitivity analysis in Section 5.8.
25 55% can be achieved with commitment by only six of the larger utilities in the Pacific Northwest. 26 Free riders are defined as people or organizations who benefit from resources, public goods, or services but do not pay for them, which results in an under-provision of those goods or services.
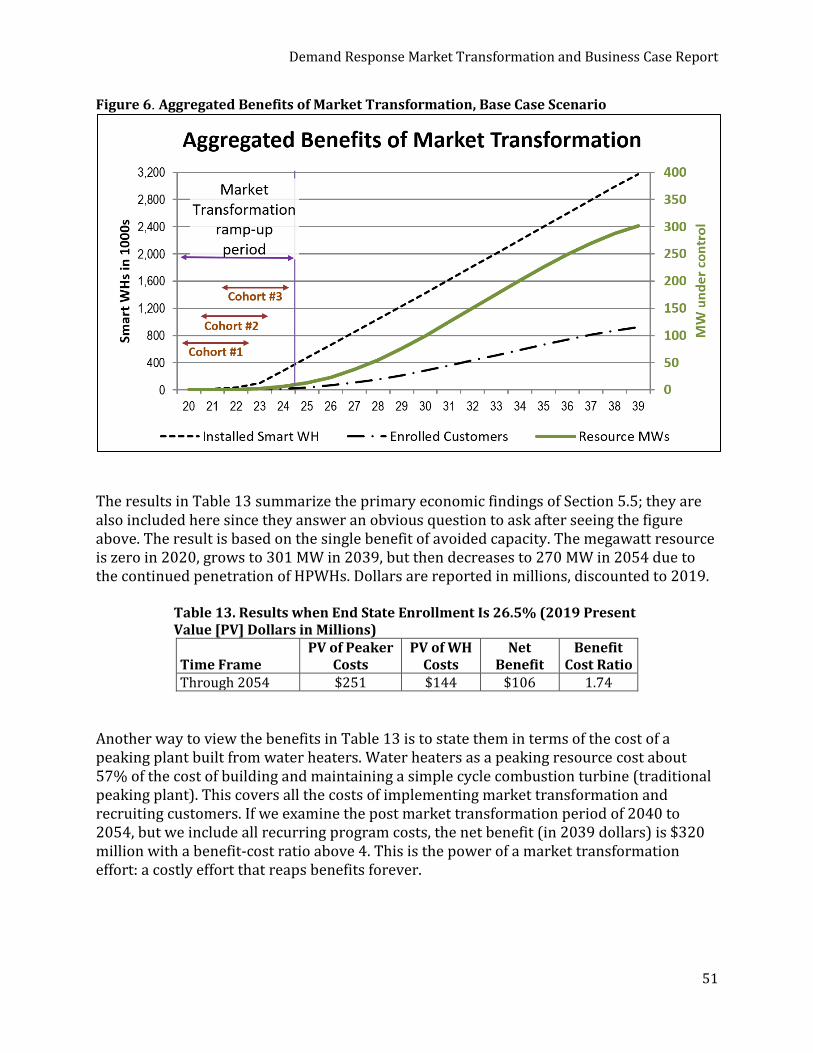
Demand Response Market Transformation and Business Case Report
51
Figure 6. Aggregated Benefits of Market Transformation, Base Case Scenario
The results in Table 13 summarize the primary economic findings of Section 5.5; they are also included here since they answer an obvious question to ask after seeing the figure above. The result is based on the single benefit of avoided capacity. The megawatt resource is zero in 2020, grows to 301 MW in 2039, but then decreases to 270 MW in 2054 due to the continued penetration of HPWHs. Dollars are reported in millions, discounted to 2019.
Table 13. Results when End State Enrollment Is 26.5% (2019 Present Value [PV] Dollars in Millions)
Time Frame PV of Peaker
Costs PV of WH
Costs Net
Benefit Benefit
Cost Ratio Through 2054 $251 $144 $106 1.74
Another way to view the benefits in Table 13 is to state them in terms of the cost of a peaking plant built from water heaters. Water heaters as a peaking resource cost about 57% of the cost of building and maintaining a simple cycle combustion turbine (traditional peaking plant). This covers all the costs of implementing market transformation and recruiting customers. If we examine the post market transformation period of 2040 to 2054, but we include all recurring program costs, the net benefit (in 2039 dollars) is $320 million with a benefit-cost ratio above 4. This is the power of a market transformation effort: a costly effort that reaps benefits forever.
Demand Response Market Transformation and Business Case Report
52
Benefits for Four Different Types of Operating Utilities As discussed at the beginning of this chapter, benefits vary among the four basic utility business models. However, when talking about the value of capacity, which is the primary benefit of this business case, only two different economic models are required; they differ primarily in the discount factors assumed and the annual value of the avoided capacity plant alternative. Through Section 5.5, we explore only capacity benefits. Section 5.6 briefly estimates the economic value of water heaters used as thermal batteries to shift energy use for the purpose of economic dispatch, and the potential economic value of locational benefits, so-called because distribution of resources at scale can circumvent the need to add capacity in certain “locations” of the transmission and distribution (T&D) system that suffer from grid congestion in certain hours. Section 5.8 reports the sensitivity analysis to the key economic variables. To close this chapter, Section 5.9 returns to the discussion of other benefits that were not quantified for this report but often have a significant economic benefit.
However, this project only had the resources to quantify two common benefits, namely the value
of water heaters to provide capacity at times of peak load, and the value of shifting energy use by
the water heater to gain benefits of economic dispatch.
Total Cost Assumptions
This section discusses all costs incurred to implement the water heater resource in three categories of expenditures, by year:
1. One-time expenditures incurred to implement the market transformation plan. 2. One-time DR implementation program costs for utilities. 3. Recurring DR program costs.
These three expenditure types are described in Sections 5.3.1 through 5.3.3 below.
5.3.1 One-time Expenditures to Implement Market Transformation Plan As described in the market transformation approach of Chapter 4, this includes expenditures to:
• Fund NRE by the OEMs. • Buy down the cost of CTA-2045-ready tanks so they will be market-competitive
with tanks not equipped with this feature. • Educate customers and utilities about the value of participating in DR programs. • Fund employees and contractors required to implement the plan.
The assumptions of Chapter 4 result in the total cost shown in Column G in Table 14.

Demand Response Market Transformation and Business Case Report
53
5.3.2 One-Time Program Costs We assume the market transformation effort starts in 2020. We cite calendar years in this report to designate completion dates for specific activities and milestones in the implementation plan; this is necessary to estimate costs in the economic model. No definitive schedule has yet been set; the reader should consider all years as relative time references. One-time utility program costs can be simplified into two elements for each water heater enrolled. The first is the average marketing cost spent per enrollment, as shown in Column A in Table 14; actual total costs are shown in Column E. The decline per year is based on increased awareness from the regional awareness campaign, cumulative messaging, and eventually from word of mouth and messages enclosed with the bill. The second one-time cost is for the communication module sent to the customer for installation on the water heater. The cost assumption is shown in Column B of Table 14 with total cost shown in Column F. As demonstrated in the pilot, one advantage of CTA-2045 is that 80% of customers can install the communication device without assistance. Another 15% can install the device with only phone support. A significant difficulty discovered during the pilot was connecting to the customer’s Wi-Fi network. In real programs we expect to use communication methods that do not rely on the customer’s network, so only a screwdriver would be needed to connect the communication device. The declining cost follows the pattern of all mass market electronics, which depend on increasing volume and advances in electronics that reduce the component count.
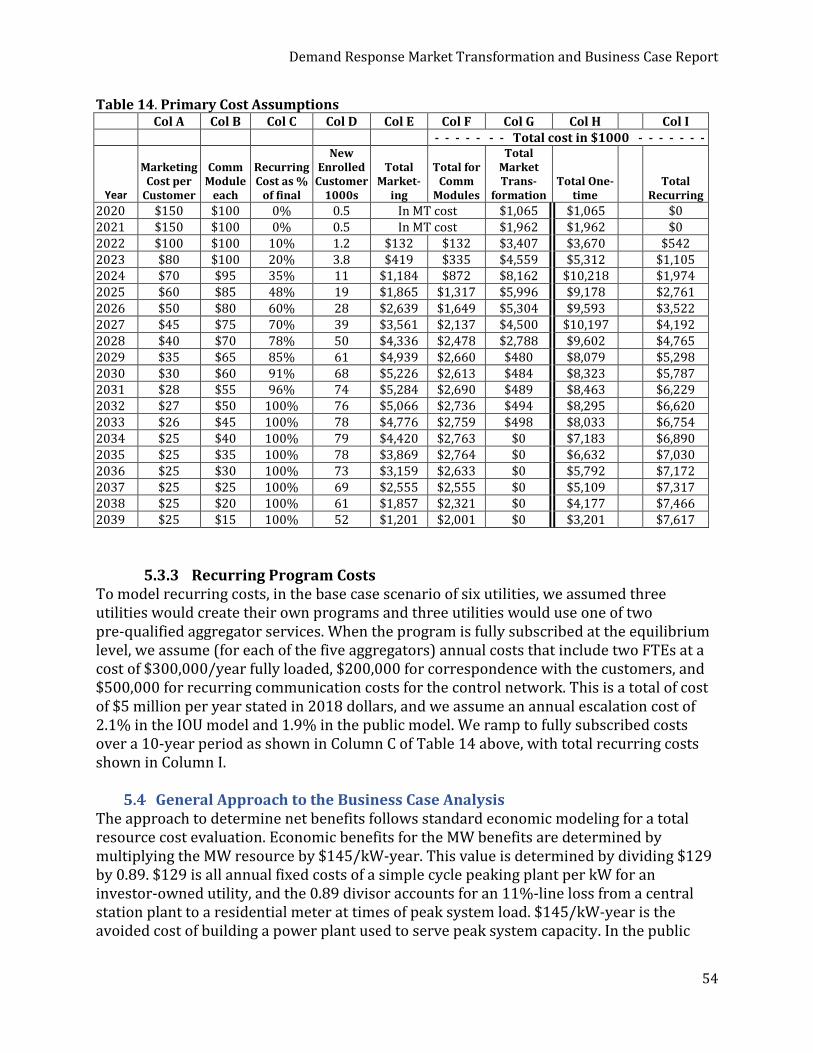
Demand Response Market Transformation and Business Case Report
54
Table 14. Primary Cost Assumptions Col A Col B Col C Col D Col E Col F Col G Col H Col I - - - - - - - Total cost in $1000 - - - - - - -
Year
Marketing Cost per
Customer
Comm Module
each
Recurring Cost as %
of final
New Enrolled
Customer 1000s
Total Market-
ing
Total for Comm
Modules
Total Market Trans-
formation Total One-
time
Total Recurring
2020 $150 $100 0% 0.5 In MT cost $1,065 $1,065 $0 2021 $150 $100 0% 0.5 In MT cost $1,962 $1,962 $0 2022 $100 $100 10% 1.2 $132 $132 $3,407 $3,670 $542 2023 $80 $100 20% 3.8 $419 $335 $4,559 $5,312 $1,105 2024 $70 $95 35% 11 $1,184 $872 $8,162 $10,218 $1,974 2025 $60 $85 48% 19 $1,865 $1,317 $5,996 $9,178 $2,761 2026 $50 $80 60% 28 $2,639 $1,649 $5,304 $9,593 $3,522 2027 $45 $75 70% 39 $3,561 $2,137 $4,500 $10,197 $4,192 2028 $40 $70 78% 50 $4,336 $2,478 $2,788 $9,602 $4,765 2029 $35 $65 85% 61 $4,939 $2,660 $480 $8,079 $5,298 2030 $30 $60 91% 68 $5,226 $2,613 $484 $8,323 $5,787 2031 $28 $55 96% 74 $5,284 $2,690 $489 $8,463 $6,229 2032 $27 $50 100% 76 $5,066 $2,736 $494 $8,295 $6,620 2033 $26 $45 100% 78 $4,776 $2,759 $498 $8,033 $6,754 2034 $25 $40 100% 79 $4,420 $2,763 $0 $7,183 $6,890 2035 $25 $35 100% 78 $3,869 $2,764 $0 $6,632 $7,030 2036 $25 $30 100% 73 $3,159 $2,633 $0 $5,792 $7,172 2037 $25 $25 100% 69 $2,555 $2,555 $0 $5,109 $7,317 2038 $25 $20 100% 61 $1,857 $2,321 $0 $4,177 $7,466 2039 $25 $15 100% 52 $1,201 $2,001 $0 $3,201 $7,617
5.3.3 Recurring Program Costs To model recurring costs, in the base case scenario of six utilities, we assumed three utilities would create their own programs and three utilities would use one of two pre-qualified aggregator services. When the program is fully subscribed at the equilibrium level, we assume (for each of the five aggregators) annual costs that include two FTEs at a cost of $300,000/year fully loaded, $200,000 for correspondence with the customers, and $500,000 for recurring communication costs for the control network. This is a total of cost of $5 million per year stated in 2018 dollars, and we assume an annual escalation cost of 2.1% in the IOU model and 1.9% in the public model. We ramp to fully subscribed costs over a 10-year period as shown in Column C of Table 14 above, with total recurring costs shown in Column I.
General Approach to the Business Case Analysis The approach to determine net benefits follows standard economic modeling for a total resource cost evaluation. Economic benefits for the MW benefits are determined by multiplying the MW resource by $145/kW-year. This value is determined by dividing $129 by 0.89. $129 is all annual fixed costs of a simple cycle peaking plant per kW for an investor-owned utility, and the 0.89 divisor accounts for an 11%-line loss from a central station plant to a residential meter at times of peak system load. $145/kW-year is the avoided cost of building a power plant used to serve peak system capacity. In the public
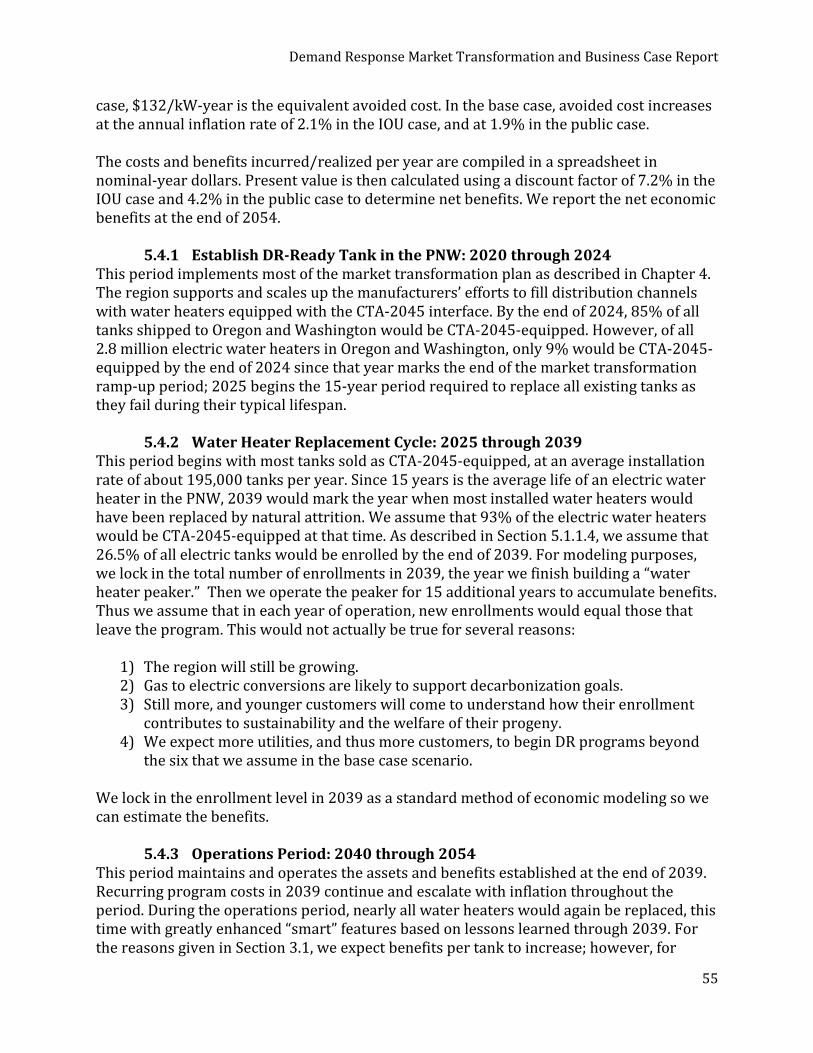
Demand Response Market Transformation and Business Case Report
55
case, $132/kW-year is the equivalent avoided cost. In the base case, avoided cost increases at the annual inflation rate of 2.1% in the IOU case, and at 1.9% in the public case. The costs and benefits incurred/realized per year are compiled in a spreadsheet in nominal-year dollars. Present value is then calculated using a discount factor of 7.2% in the IOU case and 4.2% in the public case to determine net benefits. We report the net economic benefits at the end of 2054.
5.4.1 Establish DR-Ready Tank in the PNW: 2020 through 2024 This period implements most of the market transformation plan as described in Chapter 4. The region supports and scales up the manufacturers’ efforts to fill distribution channels with water heaters equipped with the CTA-2045 interface. By the end of 2024, 85% of all tanks shipped to Oregon and Washington would be CTA-2045-equipped. However, of all 2.8 million electric water heaters in Oregon and Washington, only 9% would be CTA-2045-equipped by the end of 2024 since that year marks the end of the market transformation ramp-up period; 2025 begins the 15-year period required to replace all existing tanks as they fail during their typical lifespan.
5.4.2 Water Heater Replacement Cycle: 2025 through 2039 This period begins with most tanks sold as CTA-2045-equipped, at an average installation rate of about 195,000 tanks per year. Since 15 years is the average life of an electric water heater in the PNW, 2039 would mark the year when most installed water heaters would have been replaced by natural attrition. We assume that 93% of the electric water heaters would be CTA-2045-equipped at that time. As described in Section 5.1.1.4, we assume that 26.5% of all electric tanks would be enrolled by the end of 2039. For modeling purposes, we lock in the total number of enrollments in 2039, the year we finish building a “water heater peaker.” Then we operate the peaker for 15 additional years to accumulate benefits. Thus we assume that in each year of operation, new enrollments would equal those that leave the program. This would not actually be true for several reasons:
1) The region will still be growing. 2) Gas to electric conversions are likely to support decarbonization goals. 3) Still more, and younger customers will come to understand how their enrollment
contributes to sustainability and the welfare of their progeny. 4) We expect more utilities, and thus more customers, to begin DR programs beyond
the six that we assume in the base case scenario. We lock in the enrollment level in 2039 as a standard method of economic modeling so we can estimate the benefits.
5.4.3 Operations Period: 2040 through 2054 This period maintains and operates the assets and benefits established at the end of 2039. Recurring program costs in 2039 continue and escalate with inflation throughout the period. During the operations period, nearly all water heaters would again be replaced, this time with greatly enhanced “smart” features based on lessons learned through 2039. For the reasons given in Section 3.1, we expect benefits per tank to increase; however, for
Demand Response Market Transformation and Business Case Report
56
conservative results we do not increase benefits per tank beyond what we measured in 2018. In fact, the average benefit declines during this period since we assume that heat pumps continue to gain market share over resistance tanks.
Summary of Net Economic Benefits Because the discount factor is substantially different between the pubic and IOU perspectives, we create two, nearly identical economic models to facilitate proper analysis of the key differences between the two perspectives. Then we meld the two models in the proportions of public and IOU customers that participate. The base case assumption is that one-third of participants are from public utilities and two-thirds from IOUs. The figure below shows the key outcomes from the two models and the melded mix which is the basis for the results reported in Table 13 of Section 5.1.2.
Figure 7. Key Outcomes from Economic Models
Since the net benefits depend on the avoidance of building a power plant for capacity, one critical point must be understood: Not all utilities have a need for incremental capacity in the next 21 years, i.e., the period defined to build the water heater peaking plant defined in this report. However, many large utilities own a share of a coal plant to supply energy and capacity for at least the winter system peak demand period. Announcements to retire most of these coal plants in the next 21 years means, in the context of long-term resource planning, that almost all of these utilities will be short on capacity needs. Many of these same utilities have stated their intention to meet a large part of their energy needs with wind and/or solar generation. As described in the next section, the thermal storage value of water heaters adds incremental value to increase the use of wind and solar energy during periods when they would otherwise be curtailed as excess generation. These same periods
Demand Response Market Transformation and Business Case Report
57
will coincide with very low, if not negative, market prices. This means smart water heaters add value that a peaking plant cannot. For all the benefits stated in this chapter, we encourage both the regulators of investor-owned utilities and the boards that govern public utilities to view investment in the market transformation plan recommended in this report in the interest of the end-use customers they represent, for the utility(s) under their purview as a prudent, or even mandatory effort as part of a utility’s near-term action plan to meet long-term resource needs. For various reasons stated throughout this report, we need to start this effort as soon as possible. Even if resource capacity (the primary benefit quantified in this report) for a specific utility is not an identified need, the methods to monetize the other benefits of Sections 5.6 and 5.9 are likely to become viable in the next 20 years; however, since the resource takes 20 years to full build, we need to start the market transformation process today. If we get the 55% utility participation (weighted by customers) assumed for the base case scenario, the pro rata share of the market transformation cost would be $1.75 per residential customer per year for eight years. (The cost would be $0.96 per residential customer if we got 100% utility participation.) Fewer years and less cost per year is needed if state codes requiring CTA-2045 on tanks can be implemented before 2027.
Other Economic Benefits This section makes estimates of two additional benefits, specifically a) economic dispatch using the storage value of water heaters and b) the locational benefits to mitigate expenditures on T&D assets using water heaters to reduce T&D capacity loading. Neither of these benefits has been included in the economic value reported in Section 5.5. As discussed in Section 5.1.2, the corresponding MWh of storage from water heaters ranges
between 340 and 800 MWh depending on the time of day and season. The larger numbers occur
at the times of the daily peak load, which generally also correspond to the times of highest
market prices. If we curtail water heating from 8:00a.m. to 11:00a.m., then we can shift this heating need to consume excess solar energy in mid-day. If we curtail from 8:00p.m. to midnight, we can shift energy use to consume excess wind energy from midnight to 5:00a.m. To demonstrate an example of economic dispatch in 2039, when levels of excess generation from wind and solar will be much greater, assume there are 200 days with an average price spread of $35/MWh between the high-price curtailment period and a low-cost period that follows27. Based on the findings in Section 3.5, we can shift about 700 MWh per shed among our enrolled customers. The result will create an economic dispatch benefit of $4.9 million per year. Future price spreads 15 to 45 years from now are very
27 The U.S. Energy Information Administration (EIA) base gas forecast estimated a wholesale gas price of $5.67 in 2039, A CCCT plant with a heat rate of 7500 Btu/kWh would create a variable price of $42.50 per MWh. This is a reasonable price estimate that would exist most mornings at sunrise and most evenings at sunset. These are times when excess solar energy will not exist, and homes are using a lot of hot water. If there are 200 days with excess solar energy midday, or excess wind energy at night at a price below $7/MWh, a $35 MWh price spread would exist.
Demand Response Market Transformation and Business Case Report
58
difficult to estimate, but a broad range of forecasts indicate the $106 million benefit reported in Section 5.5 could be increased by between 10% and 25%. Regardless of the economic value, the optics of using water heaters to consume excess renewable energy will create a significant and positive image impact on the PNW utilities that have this capability. A classic example of location value is a substation transformer that is forecast to be overloaded, thus requiring an expensive upgrade to accommodate the growing load. If distributed resources are available at sufficient scale, e.g., at least 10% of the substation rating, then the substation upgrade can be deferred for a number of years if not permanently. The deferred revenue requirements for the substation improvements create the basis for defining location benefits. The Northwest Power & Conservation Council’s (NPCC’s) Seventh Power Plan [NPCC 2016] estimated the value of locational benefits at $57 per kW-year. At this level, the $106 million benefit reported in Section 5.5 would increase to $209 million and the benefit-cost ratio would increase from 1.74 to 2.45. This is a very large benefit increase; however, the Council has begun a significant effort to re-evaluate this number for the next plan, and the early indications are that the number will be significantly lower because 1) the amount and duration of avoided capital is likely to be lower, and 2) to account for the significant number of T&D assets, as a percent of all assets, that are not in danger of exceeding design limits. Another concern raised by at least one utility is that the vast majority of its T&D improvements are now based on holistic designs to replace old T&D infrastructure with a significantly higher probability of failure, while at the same time enabling modern distribution automation methods. These designs are prioritized to prevent the costliest outage events to customers based on the probability of failure in old assets. This new approach adds capacity at low or no cost, but the distributed energy resource approach (to defer new infrastructure) does nothing to prevent the costs for old equipment that fails. The costs incurred include: outage cost to customers, the cost of replacing failed equipment, the incremental cost of equipment replaced on a reactive basis instead of a planned approach, and finally, implementing an integrated “smart” grid design is more expensive and accrual of benefits is delayed when most new assets are installed on a reactive basis. The new Council number, an average for the region, is likely to be between $10 and $25 per kW-year. The actual value will vary between $0 and $60 per kW-year based on specific location and utility T&D design practices. Using the $10 to $25 range would add $18 and $45 million, respectively, to the PV benefit of $106 million reported in Section 5.5.
Key Financial Assumptions One important point affecting the economic benefits of demand response requires understanding because it differs substantially from those of energy efficiency programs, the latter of which engender consumer benefits from the day of installation; there is no enrollment equivalent. For several reasons (e.g., privacy concerns or perceived loss of hot water benefit), not every customer who purchases a CTA-2045-equipped tank will enroll it in a control program.
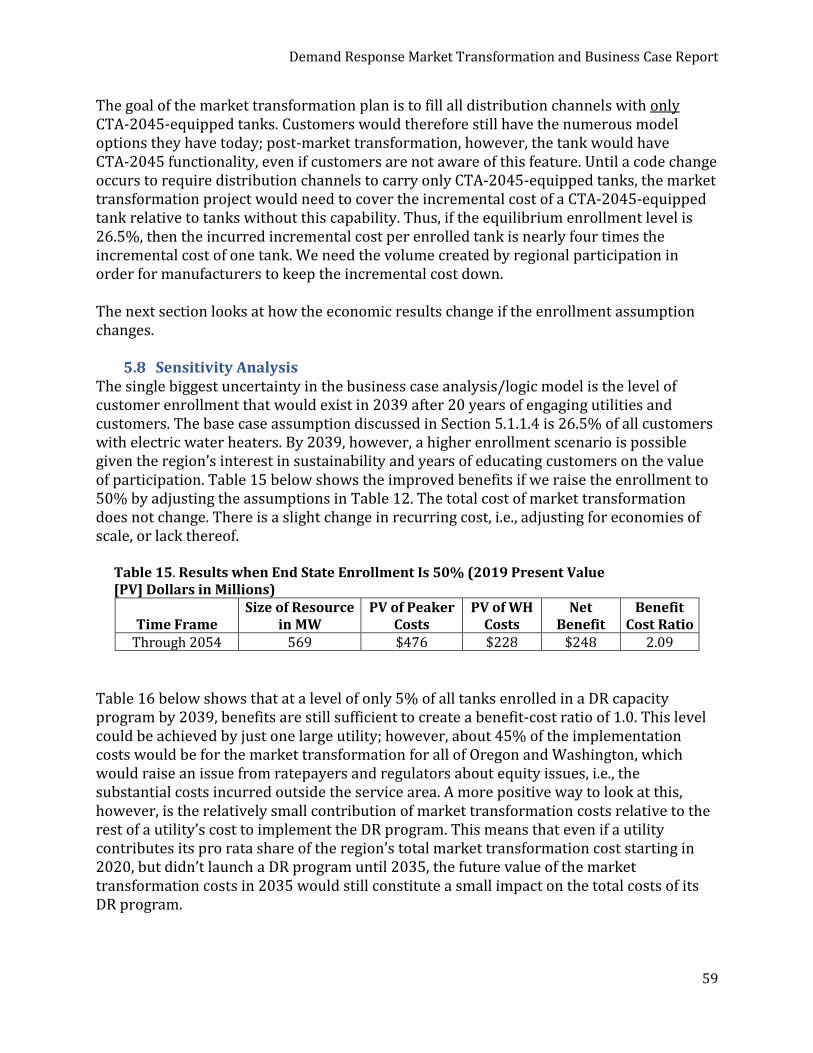
Demand Response Market Transformation and Business Case Report
59
The goal of the market transformation plan is to fill all distribution channels with only CTA-2045-equipped tanks. Customers would therefore still have the numerous model options they have today; post-market transformation, however, the tank would have CTA-2045 functionality, even if customers are not aware of this feature. Until a code change occurs to require distribution channels to carry only CTA-2045-equipped tanks, the market transformation project would need to cover the incremental cost of a CTA-2045-equipped tank relative to tanks without this capability. Thus, if the equilibrium enrollment level is 26.5%, then the incurred incremental cost per enrolled tank is nearly four times the incremental cost of one tank. We need the volume created by regional participation in order for manufacturers to keep the incremental cost down. The next section looks at how the economic results change if the enrollment assumption changes.
Sensitivity Analysis The single biggest uncertainty in the business case analysis/logic model is the level of customer enrollment that would exist in 2039 after 20 years of engaging utilities and customers. The base case assumption discussed in Section 5.1.1.4 is 26.5% of all customers with electric water heaters. By 2039, however, a higher enrollment scenario is possible given the region’s interest in sustainability and years of educating customers on the value of participation. Table 15 below shows the improved benefits if we raise the enrollment to 50% by adjusting the assumptions in Table 12. The total cost of market transformation does not change. There is a slight change in recurring cost, i.e., adjusting for economies of scale, or lack thereof.
Table 15. Results when End State Enrollment Is 50% (2019 Present Value [PV] Dollars in Millions)
Time Frame Size of Resource
in MW PV of Peaker
Costs PV of WH
Costs Net
Benefit Benefit
Cost Ratio Through 2054 569 $476 $228 $248 2.09
Table 16 below shows that at a level of only 5% of all tanks enrolled in a DR capacity program by 2039, benefits are still sufficient to create a benefit-cost ratio of 1.0. This level could be achieved by just one large utility; however, about 45% of the implementation costs would be for the market transformation for all of Oregon and Washington, which would raise an issue from ratepayers and regulators about equity issues, i.e., the substantial costs incurred outside the service area. A more positive way to look at this, however, is the relatively small contribution of market transformation costs relative to the rest of a utility’s cost to implement the DR program. This means that even if a utility contributes its pro rata share of the region’s total market transformation cost starting in 2020, but didn’t launch a DR program until 2035, the future value of the market transformation costs in 2035 would still constitute a small impact on the total costs of its DR program.
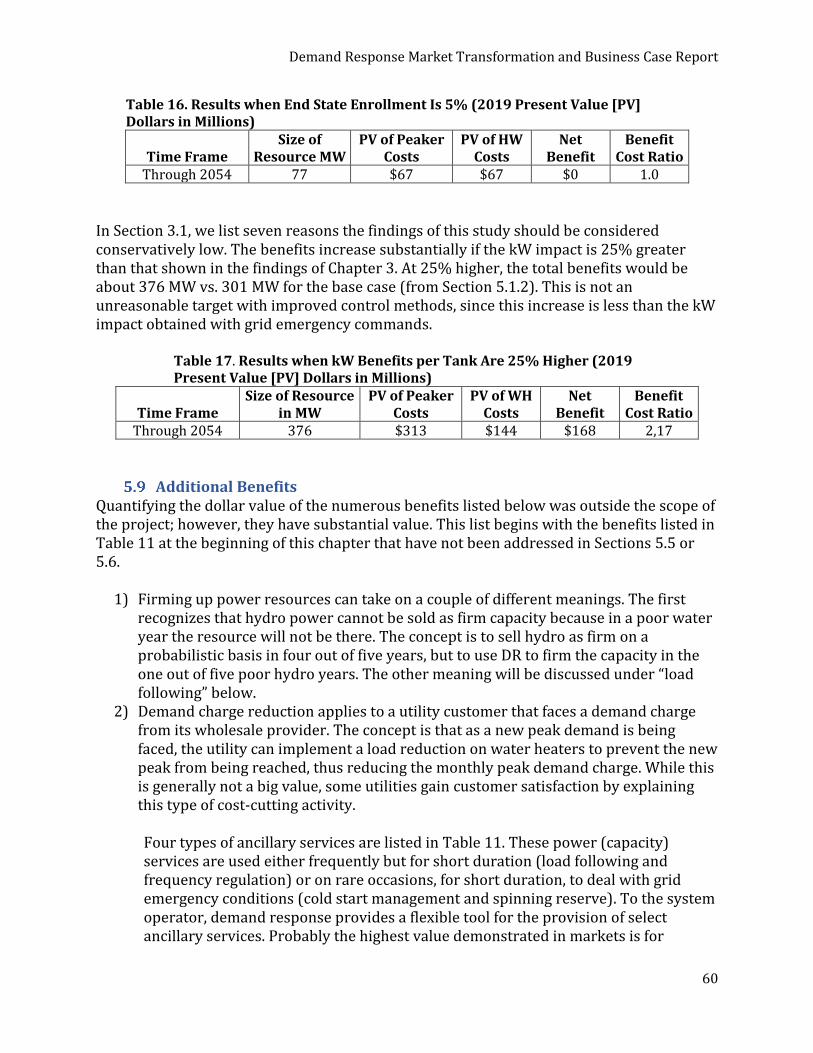
Demand Response Market Transformation and Business Case Report
60
Table 16. Results when End State Enrollment Is 5% (2019 Present Value [PV] Dollars in Millions)
Time Frame Size of
Resource MW PV of Peaker
Costs PV of HW
Costs Net
Benefit Benefit
Cost Ratio Through 2054 77 $67 $67 $0 1.0
In Section 3.1, we list seven reasons the findings of this study should be considered conservatively low. The benefits increase substantially if the kW impact is 25% greater than that shown in the findings of Chapter 3. At 25% higher, the total benefits would be about 376 MW vs. 301 MW for the base case (from Section 5.1.2). This is not an unreasonable target with improved control methods, since this increase is less than the kW impact obtained with grid emergency commands.
Table 17. Results when kW Benefits per Tank Are 25% Higher (2019 Present Value [PV] Dollars in Millions)
Time Frame Size of Resource
in MW PV of Peaker
Costs PV of WH
Costs Net
Benefit Benefit
Cost Ratio Through 2054 376 $313 $144 $168 2,17
Additional Benefits Quantifying the dollar value of the numerous benefits listed below was outside the scope of the project; however, they have substantial value. This list begins with the benefits listed in Table 11 at the beginning of this chapter that have not been addressed in Sections 5.5 or 5.6.
1) Firming up power resources can take on a couple of different meanings. The first recognizes that hydro power cannot be sold as firm capacity because in a poor water year the resource will not be there. The concept is to sell hydro as firm on a probabilistic basis in four out of five years, but to use DR to firm the capacity in the one out of five poor hydro years. The other meaning will be discussed under “load following” below.
2) Demand charge reduction applies to a utility customer that faces a demand charge from its wholesale provider. The concept is that as a new peak demand is being faced, the utility can implement a load reduction on water heaters to prevent the new peak from being reached, thus reducing the monthly peak demand charge. While this is generally not a big value, some utilities gain customer satisfaction by explaining this type of cost-cutting activity.
Four types of ancillary services are listed in Table 11. These power (capacity) services are used either frequently but for short duration (load following and frequency regulation) or on rare occasions, for short duration, to deal with grid emergency conditions (cold start management and spinning reserve). To the system operator, demand response provides a flexible tool for the provision of select ancillary services. Probably the highest value demonstrated in markets is for
Demand Response Market Transformation and Business Case Report
61
regulation, and to a lesser extent, spinning reserves. Six regional transmission operators (RTOs) and independent system operators (ISOs) currently allow demand response to be bid into ancillary services markets, including the California ISO (CAISO), Midwest ISO (MISO), ISO-New England (ISO-NE), New York ISO (NYISO), Electric Reliability Council of Texas (ERCOT), and Pennsylvania-New Jersey-Maryland ISO (PJM). Load following is the concept that over the day, total load is either increasing or decreasing and generation output must be modified to accommodate the changes. A load following resource is typically one that has a low cost to change its power output. Traditionally hydro has been used for load following; however, the flexibility of the hydro system is constrained by seasonal and inter-annual variation in snowpack and runoff and by operating requirements for grid reliability, flood risk management, navigation, fish and wildlife protection, and other factors. Water heaters could be used more effectively since there are no such restrictions. Frequency regulation requires constant adjustment to generation output to maintain the grid frequency at 60Hz. With modest improvements to the power relays in the water heaters, water heaters could be used for frequency regulation; however, the net benefits of this improvement are unknown at this point. Frequency regulation using water heaters has been proven with resistance water heaters in PJM, but it requires replacing the power relays controlling the heating elements with a variety that cycles hundreds of times per day instead of ten. While we think this is a sizable benefit in PJM, by the time “smart” commodity water heaters saturate the market, smart inverters on battery storage are likely to reach a capacity level several times greater than the resource required for frequency regulation. The need for energy storage for time-shifting excess generation, on the other hand, will grow faster than the rate at which renewable generation is added to the grid.28 Cold start management is required in areas that have had a multi-day outage during cold weather. Because water heaters and space heaters turn on automatically when power is restored, a labor-intensive effort turns on a small section of each distribution feeder at a time to prevent current overloads. Being able to prevent water heaters from turning on immediately, means larger segments of the feeder can be re-energized at one time, thus restoring power to all customers more quickly and with less cost. Spinning reserves are a promising future benefit for BPA. Spinning reserves are called upon infrequently as part of the integrated operation of the entire western grid any time a major power plant trips offline or a major transmission line opens unexpectedly. Spinning [capacity] reserves must be brought on line very quickly by
28 For more details, see the Brattle report [Brattle 2016].
Demand Response Market Transformation and Business Case Report
62
a balancing authority; for BPA, this might mean hundreds of MWs within a minute. Water heaters can be curtailed within five seconds; by using the grid emergency command, this project demonstrated a 427 MW resource for short duration, compared to 301 MW with the simple shed command.
3) The region’s first significant DR capability: The Northwest Power & Conservation Council’s (NPCC’s) Seventh Power Plan [NPCC 2016] calls for the need, but educating stakeholders and building initial capabilities (e.g., creation of aggregators, a Demand Response Management System [DRMS], and developing suitable communication networks) would be borne on the back of this first rollout. (Benefit approximately $5 million)
4) Green customer perception. There exists the value in creating customer satisfaction by providing customers a way to reduce their electric bill and feel ownership in contributing to bringing more renewable energy onto the grid. Besides this aspect, many customers will appreciate knowing they are reducing their carbon footprint. Beyond perception, if CO2 taxes are put in place there will be quantifiable CO2 reductions. We estimate a reduction of about 250 pounds of CO2 per year per water heater (115,000 tons per year by 2039 in the base case scenario) due only to the flexibility of controlling the water heaters on a 24x7x365 basis. At $50 per ton, this would be worth about $5.7 million per year. This estimate is based on 26.5% market adoption in Oregon and Washington.
5) Other societal benefits. Although societal costs can be difficult to quantify, they are as real as any other cost and should not be ignored, simply because someone else bears the burden. Decades of research on emissions such as sulfur dioxide, nitrogen oxide, and particulates have shown that power plant emissions can have widespread and serious health impacts. To the extent that demand response can prevent older, inefficient power plants from being dispatched and operating, it can lower emissions and thereby improve societal welfare.
6) Market trading opportunities. For BPA and other utilities participating in regional power markets (including trading hubs such as Mid-Columbia [Mid-C], California-Oregon Border [COB], and the western Energy Imbalance Market [EIM]), real-time control of water heaters might find greater value in the market than in being used for utilities’ local needs.
7) Value outside the PNW. Being the first market transformation for CTA-2045-equipped tanks would educate future stakeholders throughout the US on the value of smart devices. (Benefit greater than $100 million)
8) Regional education. This is the first project that proposes regional education of customers on the value of DR; this is a new concept for most residents of the PNW and the general undertaking would require substantial effort to message the first time. The marketing concept of the “Rule of Seven”29 applies in this project, and every subsequent DR effort would benefit from this project. (Benefit approximately $5 million)
29 https://www.tutorialspoint.com/management_concepts/the_rule_of_seven.htm
Demand Response Market Transformation and Business Case Report
63
9) Hedge against market inelasticity. As the region witnessed in the energy crisis in 2001, some of the impact could have been averted had we continued to invest in both energy efficiency and demand response from 1995 to 2001. While we don’t have counterfactual information, we can posit that had we aggressively invested in energy efficiency, the energy crisis and market manipulation of the early 2000s could have been averted. 10. Demand response can help to mitigate high wholesale spot pricing. Demand charges continue to go up. If measures can be put in place to reduce the rate of increase, we should see a flattening of the kW pricing. The demand for electricity is inelastic. Pricing of electricity during times of extreme peak demand and resource scarcity has historically risen to many times its value during more stable periods of supply adequacy. The role of demand response under peak demand conditions can be important to deter market power and to temper pricing in wholesale power markets, through what is called demand reduction induced price effects (DRIPE). By suppressing peak demand with either energy efficiency or demand response, studies have found peak wholesale prices to be reduced by an estimated $25-$50 per megawatt-hour [RAP 2015].30 The total extent of savings is affected by how long the price effect continues.
In addition to DRIPE in times of extreme peak pricing, there is a more common impact upon wholesale power markets. As generation demand increases and moves through merit-order dispatch of power plants, increasingly less-efficient plants are run to serve the growing demand. To the extent that demand response can reduce or prevent relatively inefficient plants that operate on-the-margin from being dispatched, it can help to reduce wholesale power pricing by lowering total generation costs.
30 In “The Value of Demand Reduction Induced Price Effects (DRIPE),” authors Paul Chernick and Chris Neme found that a 1% reduction in demand in Illinois results in approximately $0.25-$0.50 per MWh reduction in wholesale power market prices. This in turn affects another 99 MWh of demand, resulting in the $25-$50/MWh estimated range of the total demand reduction-induced price effects in their study (for every one MWh avoided, another 99 MWh was still demanded from the market and was being affected by the price reduction). The study in Illinois found lower price impacts from DRIPE than other studies have found for different regions.
Demand Response Market Transformation and Business Case Report
64
6 Conclusions and Recommendations
Conclusions and High-Level Findings • After extensive study and analysis, this study shows that demand response with
“smart connected” water heaters, both electric resistance and heat pump, will yield significant cost savings compared to building peaking plants.
• At scale, this solution could yield significant load shifting capabilities and opportunities here in the Pacific Northwest as well as in other regions across the US to enable more renewables and improve grid efficiencies. Using the base case assumption of 26.5% customer enrollment, the study shows 301 MW of demand response potential in Oregon and Washington by 2039.
• An individual utility or a single manufacturer lacks sufficient influence to cause widespread adoption of smart water heaters. It’s a typical “chicken and egg” problem that requires a carefully-orchestrated market transformation intervention.
• The most cost-effective solution is to have a standardized physical communications port at the water heater with “smart” water heater logic installed at time of manufacturing. Retrofitting and aftermarket solutions push up install costs for DR of water heaters by a factor of at least 2X in the near term31 and by 8X after 203932.
• The region must have a critical mass of supportive utilities, or even better, the region should act as a bloc to implement the next phase of enabling this technology through a market transformation plan. This means working together with the major OEMs, extra-regional utilities, customers, regulators/boards, and aggregators.
• Customers in our study appear receptive and willing to have demand response as part of their households now. However, more education and further study of customer adoption is needed to fully understand the end-state level of customer adoption.
• The nascent CTA-2045 technology works well, with negligible customer impact despite at least two control events daily; the technology has significant potential to become even better with new water heater designs in the coming years.
• NEEA’s work on market transformation for HPWHs influences the OEMs to incorporate CTA-2045 functionality into HPWHs. NEEA will have no role in implementing or operating a DR program. The current expectation is that only utilities, or their designated aggregators, will implement DR programs.
31 The average costs for the first 510,000 enrollments through the year 2033, including all market transformation costs, is $200 each; this compares to an average cost of $400 in a single family retrofit today (consisting of $100 for the switch, $100 for marketing, and $200 for installation labor, permits, and a reserve to remove some of the units in the future). 32 This compares to an average cost for marketing and the communication module of $51 in today’s dollars for the years 2035 to 2039.
Demand Response Market Transformation and Business Case Report
65
Recommendations for Next Steps
• Build a coalition across a broad group of utilities, OEMs, regulators, aggregators and customer advocacy groups. (2019)
• Develop an action-oriented plan for a scaled roll-out of “smart-connected” water heaters that OEMs can support based on a revised business case specific to the stakeholder funding the rollout. (2019)
• Four key pillars of work that need be implemented in parallel (2019): o Sell the value proposition to utilities, aggregators, utility commissions and
system operators. o Engage with OEMs to identify which specific product requirements and
markets to roll into first, and then second, third, etc. o Work closely with utility commissions and public utility boards to find
appropriate methods to recover the cost of the market transformation prior to the roll-out of a DR program.
o Develop a strategy and sequencing of incorporating “smart-connected” water heaters into local, state, and national codes and standards.
After a coalition is formed, undertake the following logical steps:
1. Create sufficient funding for a) the planning phase (2019) and b) the multi-year market transformation implementation starting in 2020, or later if needed.
2. As part of Step 1.a: Create agreements with OEMs to pay for NRE and the incremental costs for the first period (2020-2025). As part of Step 1.b: Secure long-term funding for NRE and incremental costs for the OEMs.
3. Revise the market transformation plan based on information gained in 2019 to facilitate the supply chain and minimize expense and mis-steps.
4. Develop white papers and case studies for utilities interested in implementing DR programs. For those with no direct interest in DR, introduce the possibility that their customers may participate in DR programs operated by others but that provide financial benefit to that utility.
5. Provide and promote needed information for Codes and Standards and help implement those inclusions as early as possible.
6. Work closely with the National Rural Electric Cooperative Association (NRECA), EPRI, the American Public Power Association (APPA), Peak Load Management Alliance, GreenTech, Smart Energy Partnership Alliance, and other influential organizations to ensure alignment. Additionally, it is crucial that the coalition work closely with the PUCs, ACEEE, USDOE, and organizations such as the Tennessee Valley Authority (TVA).
7. Build training and awareness programs for all groups (utilities, aggregators, system operators, commissions and consumers).
8. Launch DR programs with the initial utility participants and water heater distributors with attention focused on appropriate training.
9. Continuously monitor and make course corrections as the plan develops and rolls out.
Demand Response Market Transformation and Business Case Report
66
References AEE (Advanced Energy Economy). 2015. Peak Demand Reduction Strategy. Washington, DC.
Retrieved from https://info.aee.net/peak-demand-reduction-report. BPA (Bonneville Power Administration). 2015. TIP 336: Scaled Deployment and
Demonstration of Demand Response using Water Heaters with CTA 2045 Technology. Portland, Oregon. Accessed 4/10/18 from https://www.bpa.gov/Doing%20Business/TechnologyInnovation/TIPProjectBriefs/2018-DR-TIP%20336-final.pdf.
BPA (Bonneville Power Administration) Technology Innovation. 2016. TIP 336: Scaled
Deployment of DR using Water Heaters with CEA-2045 (PowerPoint presentation). Portland, Oregon.
The Brattle Group. 2016. The Hidden Battery: Opportunities in Electric Water Heating.
Cambridge, Massachusetts. Retrieved from http://files.brattle.com/files/7167_the_hidden_battery_-_opportunities_in_electric_water_heating.pdf.
CEE (Consortium for Energy Efficiency). 2018. Residential Water Heating Initiative [Draft].
Boston, Massachusetts. CTA (Consumer Technology Association). 2018. CTA-2045-A: Modular Communication
Interface for Energy Management Standard. https://www.cta.tech/Research-Standards/Standards.aspx?cat=ModularCommunicationsInterfaceForEnergyManagement
CTA (Consumer Technology Association). 2013. ANSI/CTA-2045-A: Modular Communication
Interface for Energy Management Standard. Retrieved from https://www.cta.tech/getattachment/21ada038-961a-4ea0-ba5d-7d610cedcb90/attachment.aspx.
EPRI (Electric Power Research Institute). 2014. Demand Response-Ready Domestic Water
Heater Specification: Preliminary Requirements for CEA-2045 Field Demonstration. Palo Alto, California. Retrieved from https://www.epri.com/#/pages/product/000000003002002710/?lang=en.
LBNL (Lawrence Berkeley National Laboratory). 2017. 2025 California Demand Response
Potential Study: Charting California’s Demand Response Future. Berkeley, California. Retrieved from http://www.cpuc.ca.gov/WorkArea/DownloadAsset.aspx?id=6442452698.

Demand Response Market Transformation and Business Case Report
67
NPCC (Northwest Power & Conservation Council). 2016. Seventh Power Plan. Portland, Oregon. Retrieved from https://www.nwcouncil.org/energy/powerplan/7/plan/.
NRDC (Natural Resources Defense Council). 2018. Proposed Specification for Electric Water
Heating with Load Management for California Title 24 2019 Building Codes Standards [Draft]. San Francisco, California.
Penn, Ivan. 2017. California invested heavily in solar power. Now there's so much that other
states are sometimes paid to take it. Los Angeles Times, June 22, 2017. Retrieved from http://www.latimes.com/projects/la-fi-electricity-solar/.
RAP (Regulatory Assistance Project). 2015. The Value of Demand Reduction
Induced Price Effects (DRIPE). Montpelier, Vermont. Retrieved from https://www.raponline.org/wp-content/uploads/2016/05/efg-ri-dripewebinarslidedeck-2015-mar-18-revised.pdf.
SGIP (Smart Grid Interoperability Panel). 2014. Barriers to Responsive Appliances at Scale
[White paper]. Washington, DC. Retrieved from https://sepapower.org/resource/barriers-responsive-appliances-scale/.
USDOE (US Department of Energy). 2006. Benefits of Demand Response in Electricity
Markets and Recommendations for Achieving Them. A Report to the United States Congress Pursuant to Section 1252 of the Energy Policy Act of 2005. Washington, DC. p. ix. Retrieved from https://www.energy.gov/sites/prod/files/oeprod/DocumentsandMedia/DOE_Benefits_of_Demand_Response_in_Electricity_Markets_and_Recommendations_for_Achieving_Them_Report_to_Congress.pdf.
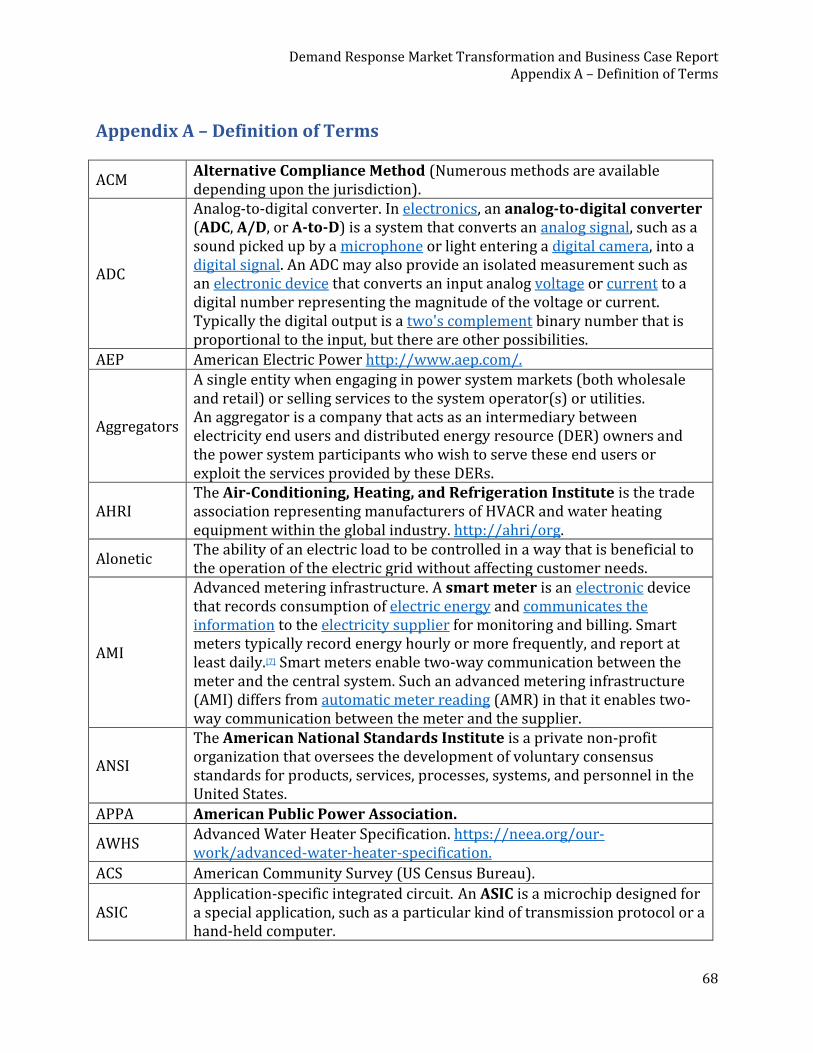
Demand Response Market Transformation and Business Case Report Appendix A – Definition of Terms
68
Appendix A – Definition of Terms
ACM Alternative Compliance Method (Numerous methods are available depending upon the jurisdiction).
ADC
Analog-to-digital converter. In electronics, an analog-to-digital converter (ADC, A/D, or A-to-D) is a system that converts an analog signal, such as a sound picked up by a microphone or light entering a digital camera, into a digital signal. An ADC may also provide an isolated measurement such as an electronic device that converts an input analog voltage or current to a digital number representing the magnitude of the voltage or current. Typically the digital output is a two's complement binary number that is proportional to the input, but there are other possibilities.
AEP American Electric Power http://www.aep.com/.
Aggregators
A single entity when engaging in power system markets (both wholesale and retail) or selling services to the system operator(s) or utilities. An aggregator is a company that acts as an intermediary between electricity end users and distributed energy resource (DER) owners and the power system participants who wish to serve these end users or exploit the services provided by these DERs.
AHRI The Air-Conditioning, Heating, and Refrigeration Institute is the trade association representing manufacturers of HVACR and water heating equipment within the global industry. http://ahri/org.
Alonetic The ability of an electric load to be controlled in a way that is beneficial to the operation of the electric grid without affecting customer needs.
AMI
Advanced metering infrastructure. A smart meter is an electronic device that records consumption of electric energy and communicates the information to the electricity supplier for monitoring and billing. Smart meters typically record energy hourly or more frequently, and report at least daily.[7] Smart meters enable two-way communication between the meter and the central system. Such an advanced metering infrastructure (AMI) differs from automatic meter reading (AMR) in that it enables two-way communication between the meter and the supplier.
ANSI
The American National Standards Institute is a private non-profit organization that oversees the development of voluntary consensus standards for products, services, processes, systems, and personnel in the United States.
APPA American Public Power Association.
AWHS Advanced Water Heater Specification. https://neea.org/our-work/advanced-water-heater-specification.
ACS American Community Survey (US Census Bureau).
ASIC Application-specific integrated circuit. An ASIC is a microchip designed for a special application, such as a particular kind of transmission protocol or a hand-held computer.
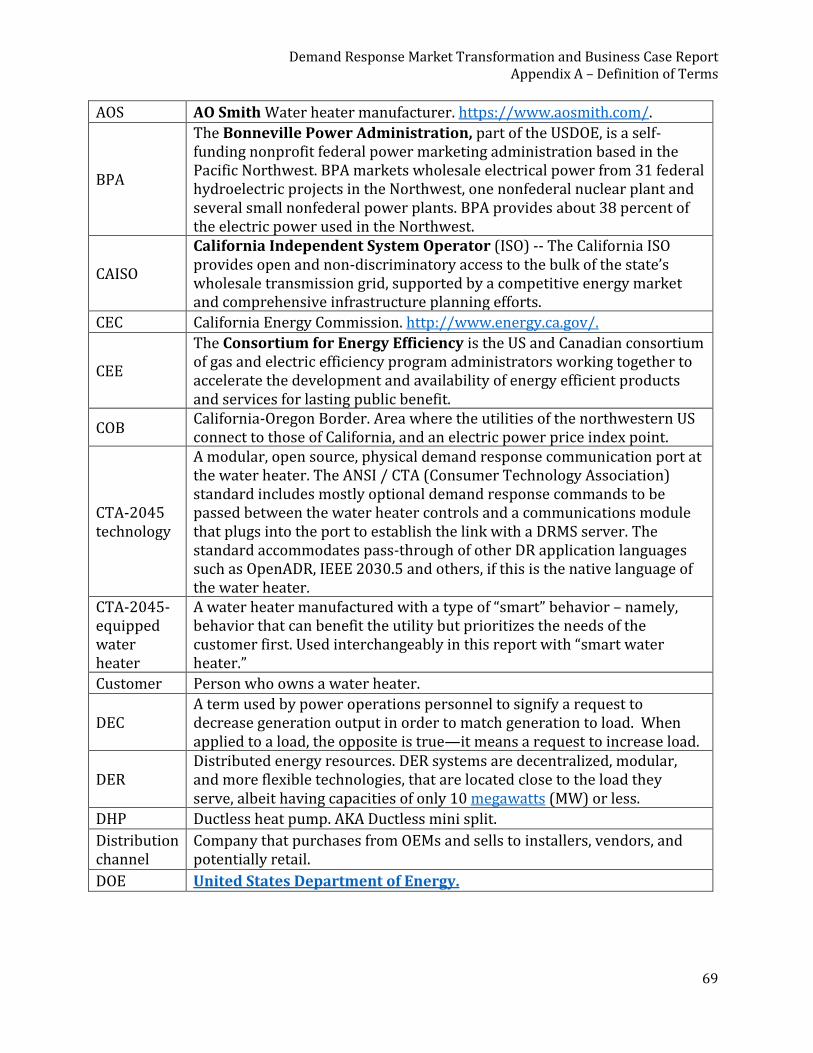
Demand Response Market Transformation and Business Case Report Appendix A – Definition of Terms
69
AOS AO Smith Water heater manufacturer. https://www.aosmith.com/.
BPA
The Bonneville Power Administration, part of the USDOE, is a self-funding nonprofit federal power marketing administration based in the Pacific Northwest. BPA markets wholesale electrical power from 31 federal hydroelectric projects in the Northwest, one nonfederal nuclear plant and several small nonfederal power plants. BPA provides about 38 percent of the electric power used in the Northwest.
CAISO
California Independent System Operator (ISO) -- The California ISO provides open and non-discriminatory access to the bulk of the state’s wholesale transmission grid, supported by a competitive energy market and comprehensive infrastructure planning efforts.
CEC California Energy Commission. http://www.energy.ca.gov/.
CEE
The Consortium for Energy Efficiency is the US and Canadian consortium of gas and electric efficiency program administrators working together to accelerate the development and availability of energy efficient products and services for lasting public benefit.
COB California-Oregon Border. Area where the utilities of the northwestern US connect to those of California, and an electric power price index point.
CTA-2045 technology
A modular, open source, physical demand response communication port at the water heater. The ANSI / CTA (Consumer Technology Association) standard includes mostly optional demand response commands to be passed between the water heater controls and a communications module that plugs into the port to establish the link with a DRMS server. The standard accommodates pass-through of other DR application languages such as OpenADR, IEEE 2030.5 and others, if this is the native language of the water heater.
CTA-2045-equipped water heater
A water heater manufactured with a type of “smart” behavior – namely, behavior that can benefit the utility but prioritizes the needs of the customer first. Used interchangeably in this report with “smart water heater.”
Customer Person who owns a water heater.
DEC A term used by power operations personnel to signify a request to decrease generation output in order to match generation to load. When applied to a load, the opposite is true—it means a request to increase load.
DER Distributed energy resources. DER systems are decentralized, modular, and more flexible technologies, that are located close to the load they serve, albeit having capacities of only 10 megawatts (MW) or less.
DHP Ductless heat pump. AKA Ductless mini split.
Distribution channel
Company that purchases from OEMs and sells to installers, vendors, and potentially retail.
DOE United States Department of Energy.
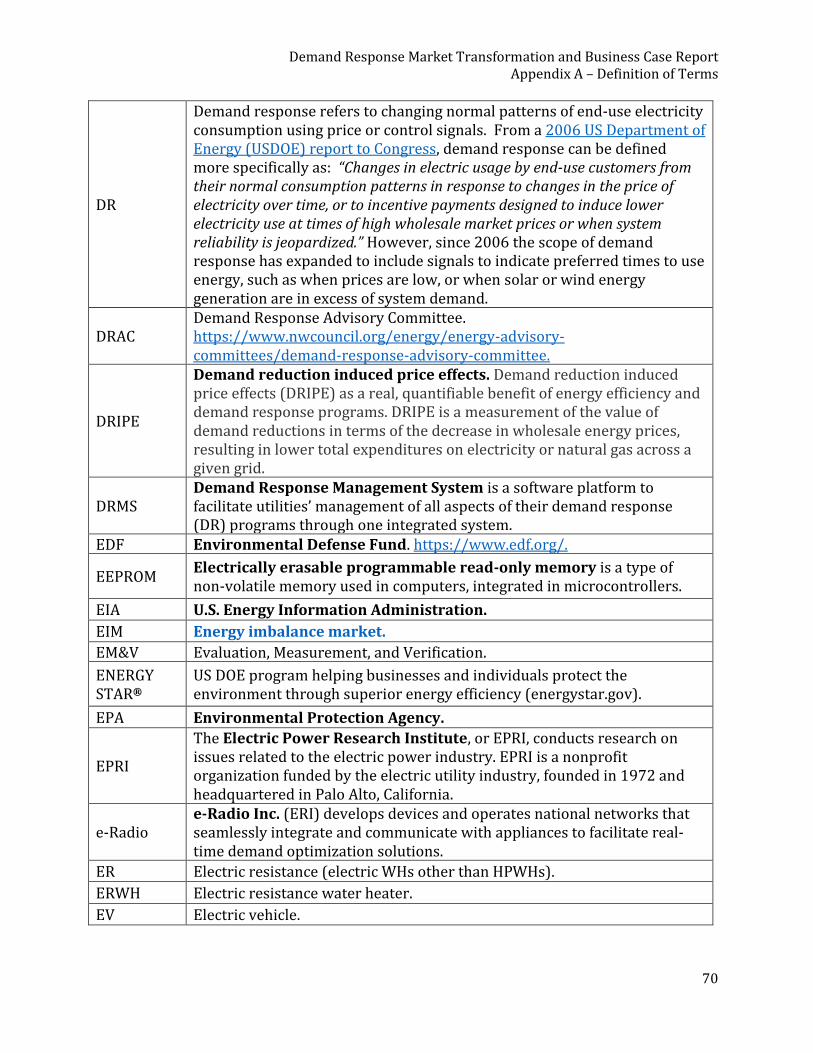
Demand Response Market Transformation and Business Case Report Appendix A – Definition of Terms
70
DR
Demand response refers to changing normal patterns of end-use electricity consumption using price or control signals. From a 2006 US Department of Energy (USDOE) report to Congress, demand response can be defined more specifically as: “Changes in electric usage by end-use customers from their normal consumption patterns in response to changes in the price of electricity over time, or to incentive payments designed to induce lower electricity use at times of high wholesale market prices or when system reliability is jeopardized.” However, since 2006 the scope of demand response has expanded to include signals to indicate preferred times to use energy, such as when prices are low, or when solar or wind energy generation are in excess of system demand.
DRAC Demand Response Advisory Committee. https://www.nwcouncil.org/energy/energy-advisory-committees/demand-response-advisory-committee.
DRIPE
Demand reduction induced price effects. Demand reduction induced price effects (DRIPE) as a real, quantifiable benefit of energy efficiency and demand response programs. DRIPE is a measurement of the value of demand reductions in terms of the decrease in wholesale energy prices, resulting in lower total expenditures on electricity or natural gas across a given grid.
DRMS Demand Response Management System is a software platform to facilitate utilities’ management of all aspects of their demand response (DR) programs through one integrated system.
EDF Environmental Defense Fund. https://www.edf.org/.
EEPROM Electrically erasable programmable read-only memory is a type of non-volatile memory used in computers, integrated in microcontrollers.
EIA U.S. Energy Information Administration.
EIM Energy imbalance market.
EM&V Evaluation, Measurement, and Verification.
ENERGY STAR®
US DOE program helping businesses and individuals protect the environment through superior energy efficiency (energystar.gov).
EPA Environmental Protection Agency.
EPRI
The Electric Power Research Institute, or EPRI, conducts research on issues related to the electric power industry. EPRI is a nonprofit organization funded by the electric utility industry, founded in 1972 and headquartered in Palo Alto, California.
e-Radio e-Radio Inc. (ERI) develops devices and operates national networks that seamlessly integrate and communicate with appliances to facilitate real-time demand optimization solutions.
ER Electric resistance (electric WHs other than HPWHs).
ERWH Electric resistance water heater.
EV Electric vehicle.
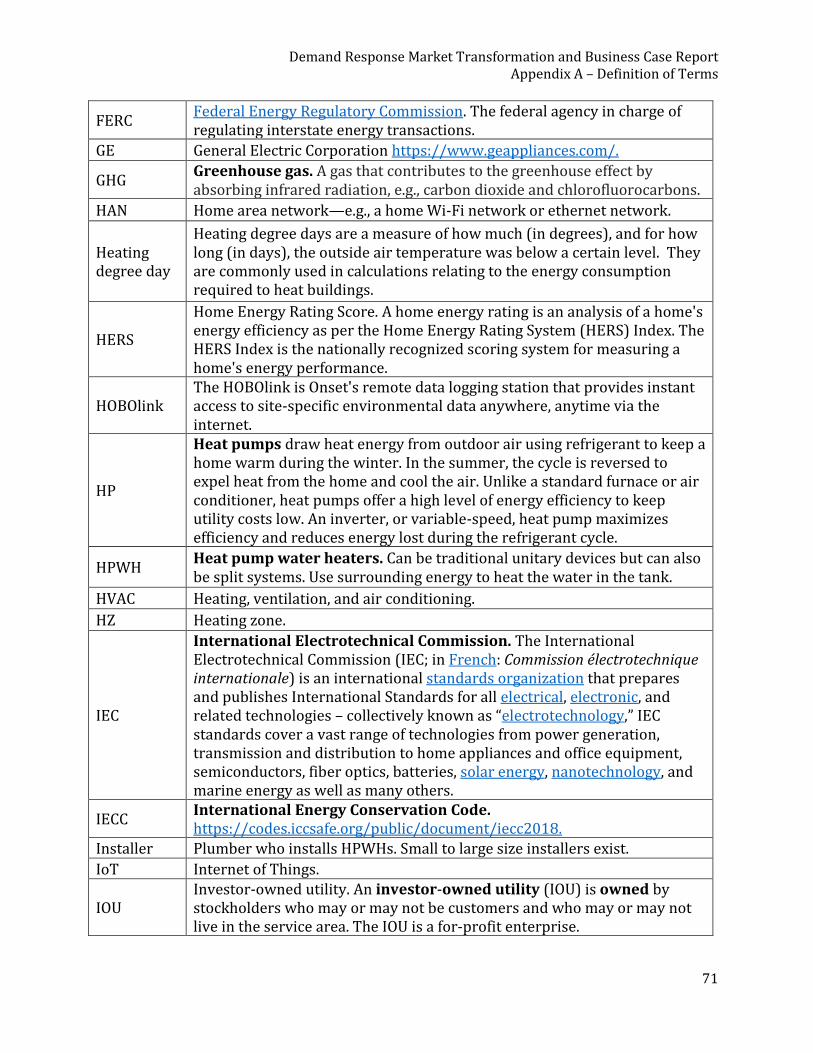
Demand Response Market Transformation and Business Case Report Appendix A – Definition of Terms
71
FERC Federal Energy Regulatory Commission. The federal agency in charge of regulating interstate energy transactions.
GE General Electric Corporation https://www.geappliances.com/.
GHG 1. Greenhouse gas. A gas that contributes to the greenhouse effect by
absorbing infrared radiation, e.g., carbon dioxide and chlorofluorocarbons.
HAN Home area network—e.g., a home Wi-Fi network or ethernet network.
Heating degree day
Heating degree days are a measure of how much (in degrees), and for how long (in days), the outside air temperature was below a certain level. They are commonly used in calculations relating to the energy consumption required to heat buildings.
HERS
Home Energy Rating Score. A home energy rating is an analysis of a home's energy efficiency as per the Home Energy Rating System (HERS) Index. The HERS Index is the nationally recognized scoring system for measuring a home's energy performance.
HOBOlink The HOBOlink is Onset's remote data logging station that provides instant access to site-specific environmental data anywhere, anytime via the internet.
HP
Heat pumps draw heat energy from outdoor air using refrigerant to keep a home warm during the winter. In the summer, the cycle is reversed to expel heat from the home and cool the air. Unlike a standard furnace or air conditioner, heat pumps offer a high level of energy efficiency to keep utility costs low. An inverter, or variable-speed, heat pump maximizes efficiency and reduces energy lost during the refrigerant cycle.
HPWH Heat pump water heaters. Can be traditional unitary devices but can also be split systems. Use surrounding energy to heat the water in the tank.
HVAC Heating, ventilation, and air conditioning.
HZ Heating zone.
IEC
International Electrotechnical Commission. The International Electrotechnical Commission (IEC; in French: Commission électrotechnique internationale) is an international standards organization that prepares and publishes International Standards for all electrical, electronic, and related technologies – collectively known as “electrotechnology,” IEC standards cover a vast range of technologies from power generation, transmission and distribution to home appliances and office equipment, semiconductors, fiber optics, batteries, solar energy, nanotechnology, and marine energy as well as many others.
IECC International Energy Conservation Code. https://codes.iccsafe.org/public/document/iecc2018.
Installer Plumber who installs HPWHs. Small to large size installers exist.
IoT Internet of Things.
IOU Investor-owned utility. An investor-owned utility (IOU) is owned by stockholders who may or may not be customers and who may or may not live in the service area. The IOU is a for-profit enterprise.
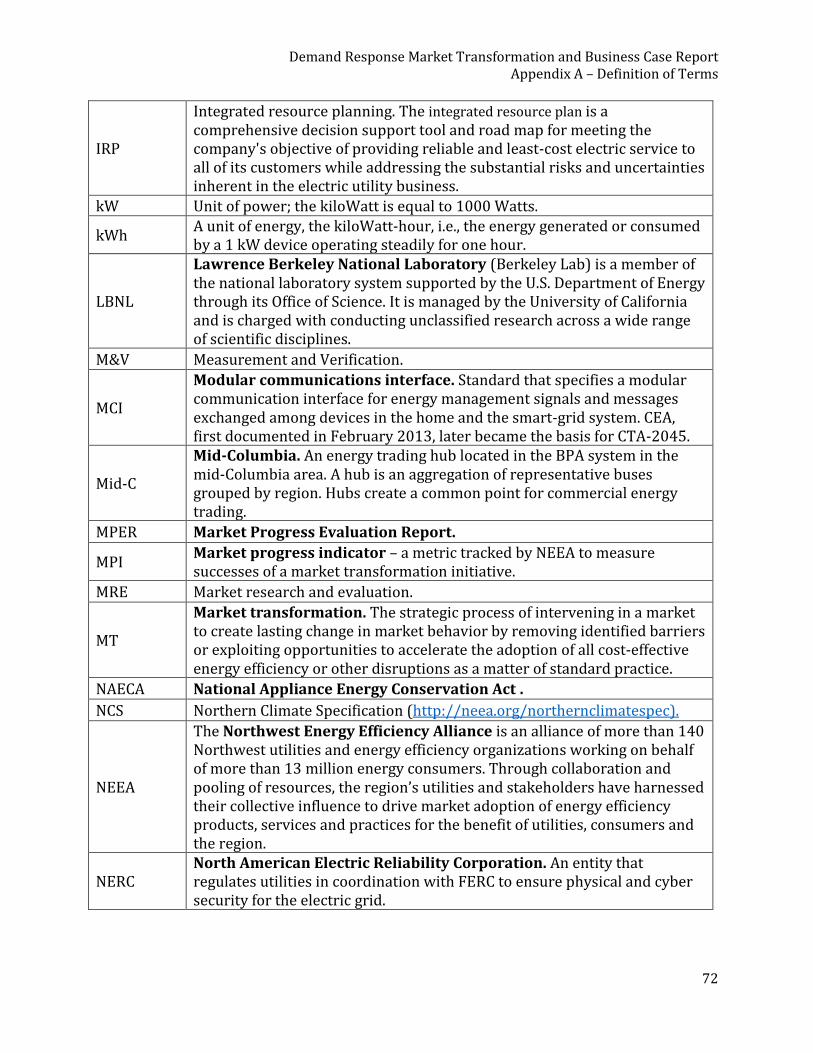
Demand Response Market Transformation and Business Case Report Appendix A – Definition of Terms
72
IRP
Integrated resource planning. The integrated resource plan is a comprehensive decision support tool and road map for meeting the company's objective of providing reliable and least-cost electric service to all of its customers while addressing the substantial risks and uncertainties inherent in the electric utility business.
kW Unit of power; the kiloWatt is equal to 1000 Watts.
kWh A unit of energy, the kiloWatt-hour, i.e., the energy generated or consumed by a 1 kW device operating steadily for one hour.
LBNL
Lawrence Berkeley National Laboratory (Berkeley Lab) is a member of the national laboratory system supported by the U.S. Department of Energy through its Office of Science. It is managed by the University of California and is charged with conducting unclassified research across a wide range of scientific disciplines.
M&V Measurement and Verification.
MCI
Modular communications interface. Standard that specifies a modular communication interface for energy management signals and messages exchanged among devices in the home and the smart-grid system. CEA, first documented in February 2013, later became the basis for CTA-2045.
Mid-C
Mid-Columbia. An energy trading hub located in the BPA system in the mid-Columbia area. A hub is an aggregation of representative buses grouped by region. Hubs create a common point for commercial energy trading.
MPER Market Progress Evaluation Report.
MPI Market progress indicator – a metric tracked by NEEA to measure successes of a market transformation initiative.
MRE Market research and evaluation.
MT
Market transformation. The strategic process of intervening in a market to create lasting change in market behavior by removing identified barriers or exploiting opportunities to accelerate the adoption of all cost-effective energy efficiency or other disruptions as a matter of standard practice.
NAECA National Appliance Energy Conservation Act .
NCS Northern Climate Specification (http://neea.org/northernclimatespec).
NEEA
The Northwest Energy Efficiency Alliance is an alliance of more than 140 Northwest utilities and energy efficiency organizations working on behalf of more than 13 million energy consumers. Through collaboration and pooling of resources, the region’s utilities and stakeholders have harnessed their collective influence to drive market adoption of energy efficiency products, services and practices for the benefit of utilities, consumers and the region.
NERC North American Electric Reliability Corporation. An entity that regulates utilities in coordination with FERC to ensure physical and cyber security for the electric grid.
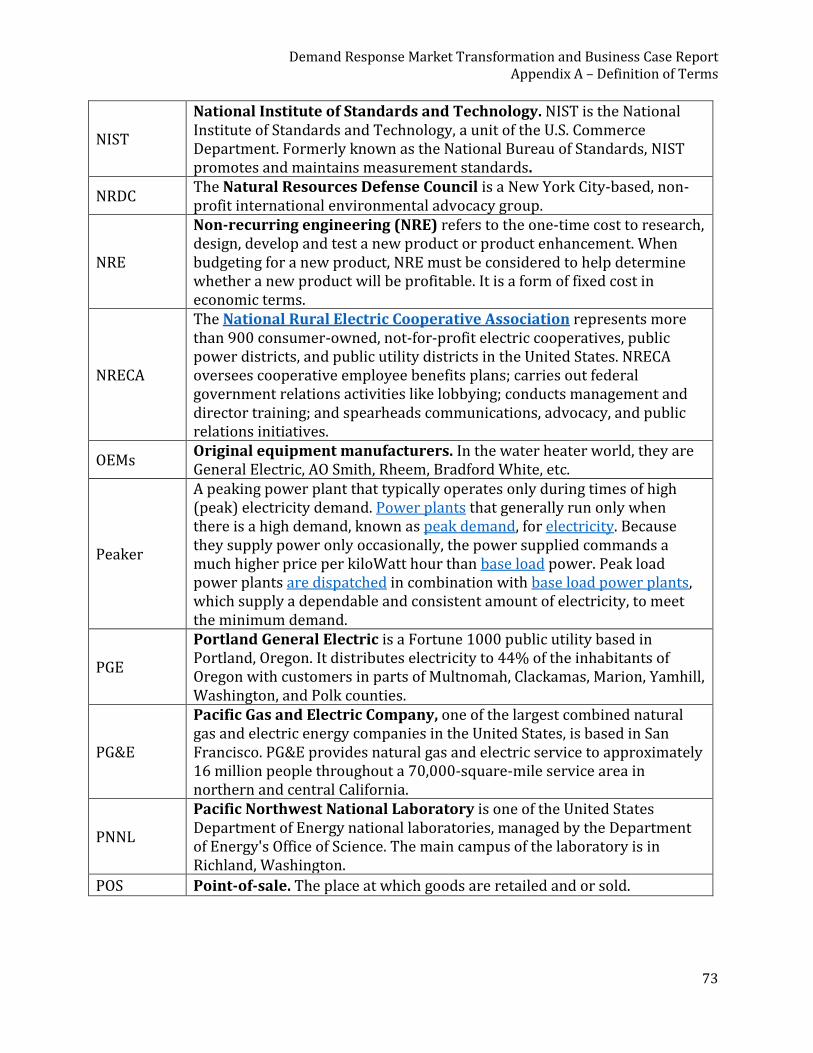
Demand Response Market Transformation and Business Case Report Appendix A – Definition of Terms
73
NIST
National Institute of Standards and Technology. NIST is the National Institute of Standards and Technology, a unit of the U.S. Commerce Department. Formerly known as the National Bureau of Standards, NIST promotes and maintains measurement standards.
NRDC The Natural Resources Defense Council is a New York City-based, non-profit international environmental advocacy group.
NRE
Non-recurring engineering (NRE) refers to the one-time cost to research, design, develop and test a new product or product enhancement. When budgeting for a new product, NRE must be considered to help determine whether a new product will be profitable. It is a form of fixed cost in economic terms.
NRECA
The National Rural Electric Cooperative Association represents more than 900 consumer-owned, not-for-profit electric cooperatives, public power districts, and public utility districts in the United States. NRECA oversees cooperative employee benefits plans; carries out federal government relations activities like lobbying; conducts management and director training; and spearheads communications, advocacy, and public relations initiatives.
OEMs Original equipment manufacturers. In the water heater world, they are General Electric, AO Smith, Rheem, Bradford White, etc.
Peaker
A peaking power plant that typically operates only during times of high (peak) electricity demand. Power plants that generally run only when there is a high demand, known as peak demand, for electricity. Because they supply power only occasionally, the power supplied commands a much higher price per kiloWatt hour than base load power. Peak load power plants are dispatched in combination with base load power plants, which supply a dependable and consistent amount of electricity, to meet the minimum demand.
PGE
Portland General Electric is a Fortune 1000 public utility based in Portland, Oregon. It distributes electricity to 44% of the inhabitants of Oregon with customers in parts of Multnomah, Clackamas, Marion, Yamhill, Washington, and Polk counties.
PG&E
Pacific Gas and Electric Company, one of the largest combined natural gas and electric energy companies in the United States, is based in San Francisco. PG&E provides natural gas and electric service to approximately 16 million people throughout a 70,000-square-mile service area in northern and central California.
PNNL
Pacific Northwest National Laboratory is one of the United States Department of Energy national laboratories, managed by the Department of Energy's Office of Science. The main campus of the laboratory is in Richland, Washington.
POS Point-of-sale. The place at which goods are retailed and or sold.
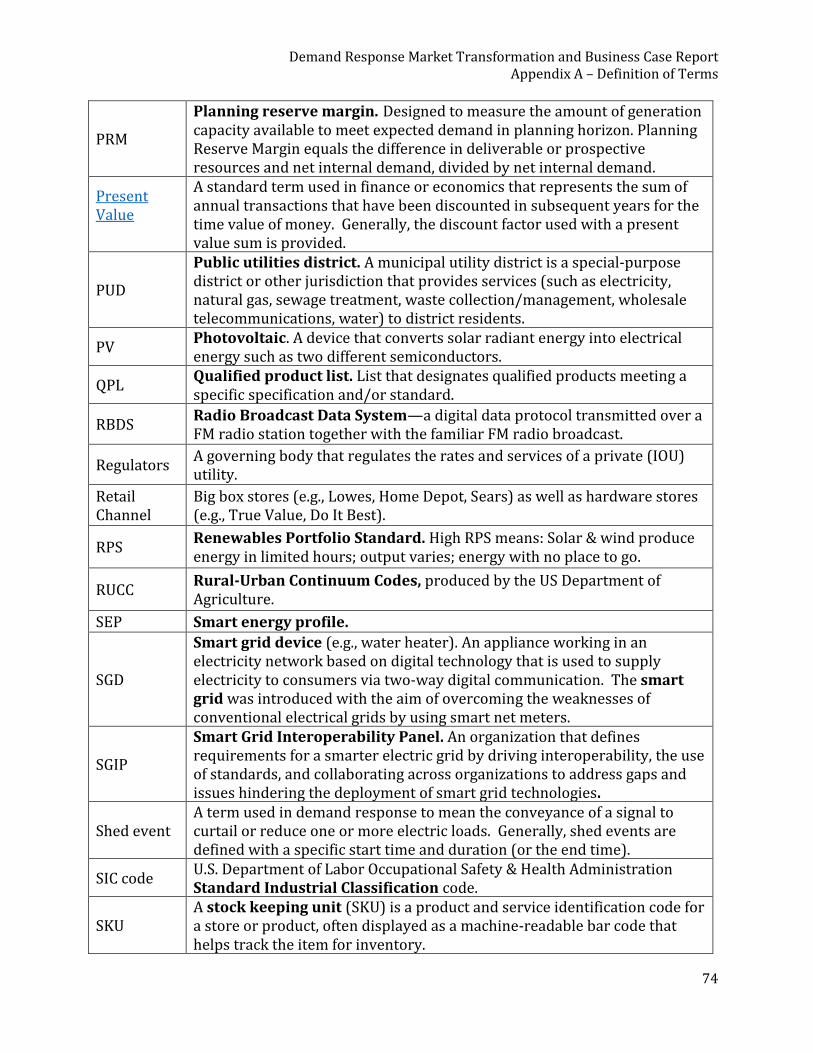
Demand Response Market Transformation and Business Case Report Appendix A – Definition of Terms
74
PRM
Planning reserve margin. Designed to measure the amount of generation capacity available to meet expected demand in planning horizon. Planning Reserve Margin equals the difference in deliverable or prospective resources and net internal demand, divided by net internal demand.
Present Value
A standard term used in finance or economics that represents the sum of annual transactions that have been discounted in subsequent years for the time value of money. Generally, the discount factor used with a present value sum is provided.
PUD
Public utilities district. A municipal utility district is a special-purpose district or other jurisdiction that provides services (such as electricity, natural gas, sewage treatment, waste collection/management, wholesale telecommunications, water) to district residents.
PV Photovoltaic. A device that converts solar radiant energy into electrical energy such as two different semiconductors.
QPL Qualified product list. List that designates qualified products meeting a specific specification and/or standard.
RBDS Radio Broadcast Data System—a digital data protocol transmitted over a FM radio station together with the familiar FM radio broadcast.
Regulators A governing body that regulates the rates and services of a private (IOU) utility.
Retail Channel
Big box stores (e.g., Lowes, Home Depot, Sears) as well as hardware stores (e.g., True Value, Do It Best).
RPS Renewables Portfolio Standard. High RPS means: Solar & wind produce energy in limited hours; output varies; energy with no place to go.
RUCC Rural-Urban Continuum Codes, produced by the US Department of Agriculture.
SEP Smart energy profile.
SGD
Smart grid device (e.g., water heater). An appliance working in an electricity network based on digital technology that is used to supply electricity to consumers via two-way digital communication. The smart grid was introduced with the aim of overcoming the weaknesses of conventional electrical grids by using smart net meters.
SGIP
Smart Grid Interoperability Panel. An organization that defines requirements for a smarter electric grid by driving interoperability, the use of standards, and collaborating across organizations to address gaps and issues hindering the deployment of smart grid technologies.
Shed event A term used in demand response to mean the conveyance of a signal to curtail or reduce one or more electric loads. Generally, shed events are defined with a specific start time and duration (or the end time).
SIC code U.S. Department of Labor Occupational Safety & Health Administration Standard Industrial Classification code.
SKU A stock keeping unit (SKU) is a product and service identification code for a store or product, often displayed as a machine-readable bar code that helps track the item for inventory.
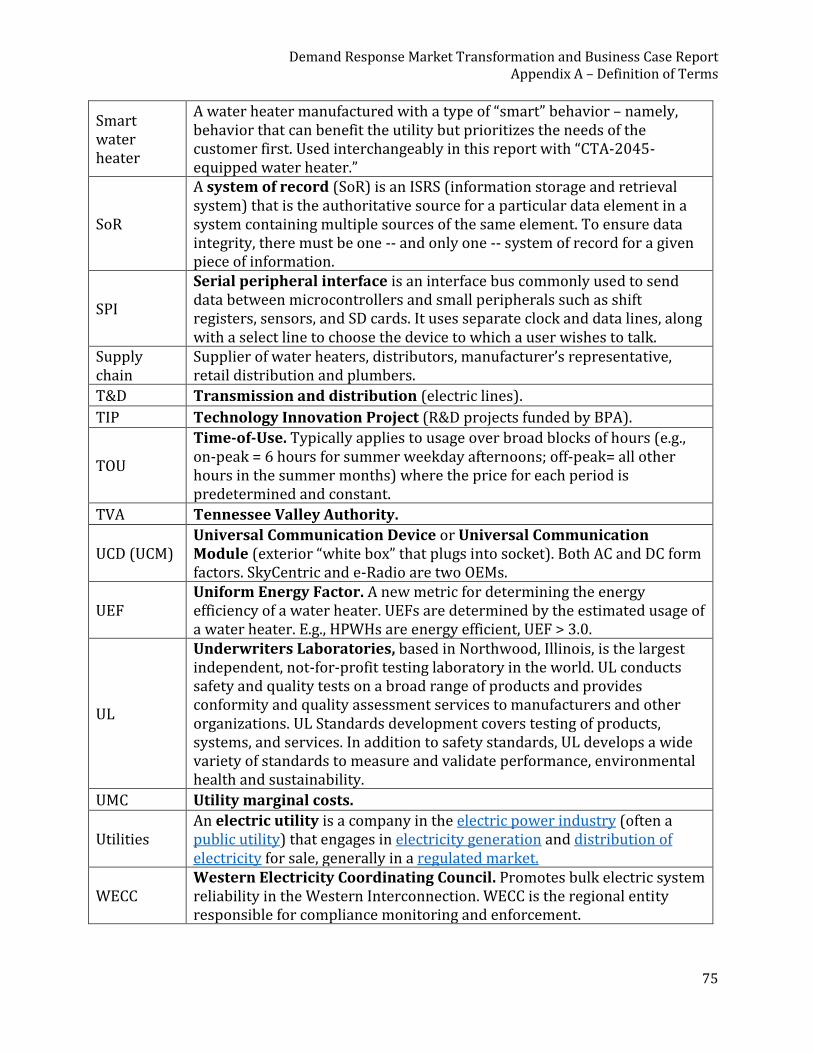
Demand Response Market Transformation and Business Case Report Appendix A – Definition of Terms
75
Smart water heater
A water heater manufactured with a type of “smart” behavior – namely, behavior that can benefit the utility but prioritizes the needs of the customer first. Used interchangeably in this report with “CTA-2045-equipped water heater.”
SoR
A system of record (SoR) is an ISRS (information storage and retrieval system) that is the authoritative source for a particular data element in a system containing multiple sources of the same element. To ensure data integrity, there must be one -- and only one -- system of record for a given piece of information.
SPI
Serial peripheral interface is an interface bus commonly used to send data between microcontrollers and small peripherals such as shift registers, sensors, and SD cards. It uses separate clock and data lines, along with a select line to choose the device to which a user wishes to talk.
Supply chain
Supplier of water heaters, distributors, manufacturer’s representative, retail distribution and plumbers.
T&D Transmission and distribution (electric lines).
TIP Technology Innovation Project (R&D projects funded by BPA).
TOU
Time-of-Use. Typically applies to usage over broad blocks of hours (e.g., on-peak = 6 hours for summer weekday afternoons; off-peak= all other hours in the summer months) where the price for each period is predetermined and constant.
TVA Tennessee Valley Authority.
UCD (UCM) Universal Communication Device or Universal Communication Module (exterior “white box” that plugs into socket). Both AC and DC form factors. SkyCentric and e-Radio are two OEMs.
UEF Uniform Energy Factor. A new metric for determining the energy efficiency of a water heater. UEFs are determined by the estimated usage of a water heater. E.g., HPWHs are energy efficient, UEF > 3.0.
UL
Underwriters Laboratories, based in Northwood, Illinois, is the largest independent, not-for-profit testing laboratory in the world. UL conducts safety and quality tests on a broad range of products and provides conformity and quality assessment services to manufacturers and other organizations. UL Standards development covers testing of products, systems, and services. In addition to safety standards, UL develops a wide variety of standards to measure and validate performance, environmental health and sustainability.
UMC Utility marginal costs.
Utilities An electric utility is a company in the electric power industry (often a public utility) that engages in electricity generation and distribution of electricity for sale, generally in a regulated market.
WECC Western Electricity Coordinating Council. Promotes bulk electric system reliability in the Western Interconnection. WECC is the regional entity responsible for compliance monitoring and enforcement.

Demand Response Market Transformation and Business Case Report Appendix A – Definition of Terms
76
Wh Watt-hour. A unit of energy equal to 3,600 Joules. Also equivalent to the energy consumed by a one Watt (1 W) load running for one hour.
WRI World Resources Institute https://www.wri.org/.
WWV
WWV is the call sign of the US National Institute of Standards and Technology’s (NIST’s) HF ("shortwave") radio station. These carrier frequencies and time signals are controlled by local atomic clocks traceable to NIST’s primary standard in Boulder, Colorado by GPS common view observations and other time transfer methods.
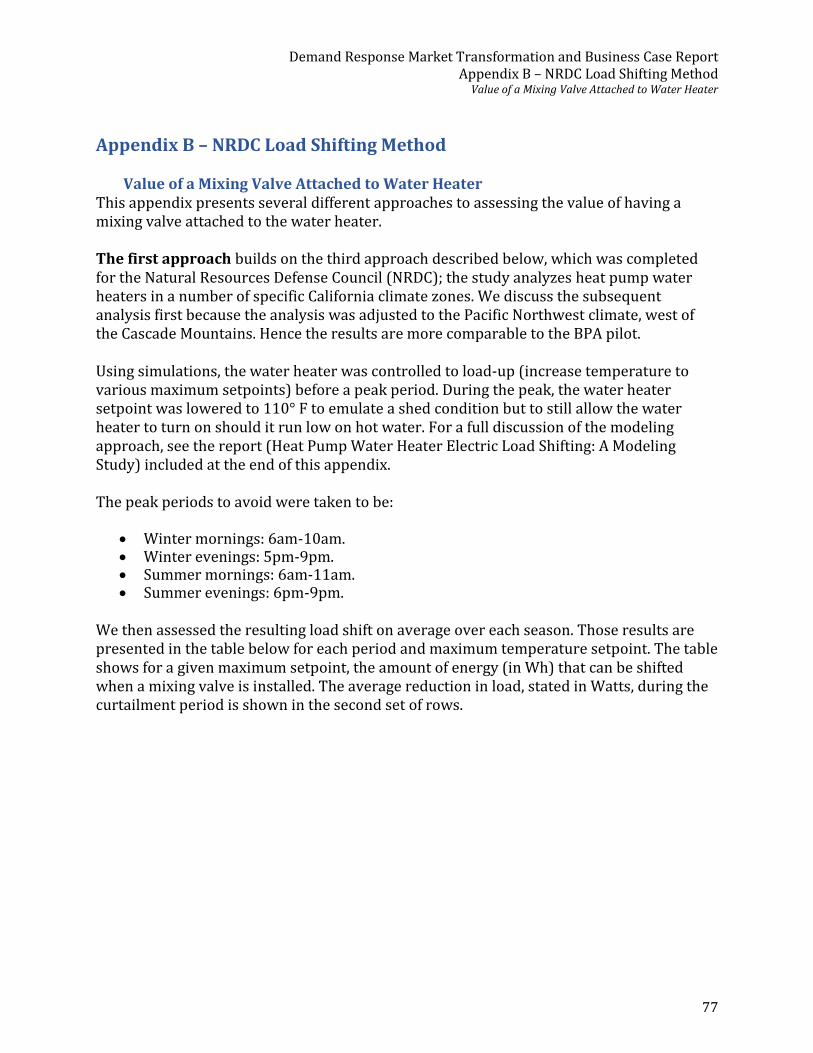
Demand Response Market Transformation and Business Case Report Appendix B – NRDC Load Shifting Method
Value of a Mixing Valve Attached to Water Heater
77
Appendix B – NRDC Load Shifting Method
Value of a Mixing Valve Attached to Water Heater This appendix presents several different approaches to assessing the value of having a mixing valve attached to the water heater. The first approach builds on the third approach described below, which was completed for the Natural Resources Defense Council (NRDC); the study analyzes heat pump water heaters in a number of specific California climate zones. We discuss the subsequent analysis first because the analysis was adjusted to the Pacific Northwest climate, west of the Cascade Mountains. Hence the results are more comparable to the BPA pilot. Using simulations, the water heater was controlled to load-up (increase temperature to various maximum setpoints) before a peak period. During the peak, the water heater setpoint was lowered to 110° F to emulate a shed condition but to still allow the water heater to turn on should it run low on hot water. For a full discussion of the modeling approach, see the report (Heat Pump Water Heater Electric Load Shifting: A Modeling Study) included at the end of this appendix. The peak periods to avoid were taken to be:
• Winter mornings: 6am-10am. • Winter evenings: 5pm-9pm. • Summer mornings: 6am-11am. • Summer evenings: 6pm-9pm.
We then assessed the resulting load shift on average over each season. Those results are presented in the table below for each period and maximum temperature setpoint. The table shows for a given maximum setpoint, the amount of energy (in Wh) that can be shifted when a mixing valve is installed. The average reduction in load, stated in Watts, during the curtailment period is shown in the second set of rows.
Demand Response Market Transformation and Business Case Report Appendix B – NRDC Load Shifting Method
Value of a Mixing Valve Attached to Water Heater
78
Average Load Shift and Load Reduction by Season
Combined Interior (75%) and Garage (25%) Installation Scenarios
Shift (Wh) Base 125F 135F 145F
Winter morning na 120 488 906
Winter evening na 293 550 730
Summer morning na 350 544 704
Summer evening na 384 465 482
Load Reduction (W) Base 125F 135F 145F
Winter morning na 40 163 302
Winter evening na 98 183 243
Summer morning na 87 136 176
Summer evening na 128 155 161
The 125F column represents a control strategy without a mixing value that increases tank temperature to 125° F during low-cost periods and to 110° F in the curtailment periods. While this was not the strategy used by the water heater manufacturers in our project, this column best represents the temperature profile created in our tanks during the shed events called during the peak hour periods defined above. The second approach, discussed further in the next section (Benefits from Using a Mixing Valve to Elevate Hot Water Storage Temperature – Engineering Calculation Approach), is a simplistic engineering calculation that loosely estimates the amount of energy that can be stored in the tank, and shifted out of peak periods, via use of elevated setpoints. When subsequently compared to more sophisticated approaches, the results were found to be remarkably similar. The third approach considered is a detailed modeling study conducted by Ecotope and the Natural Resources Defense Council (NRDC). The full report is included below. In short, this is a sophisticated and computationally intensive approach to assessing the value of being able to store water at higher temperatures. The study sought to optimize the cost of operating a HPWH by using it as a thermal battery. The study used an in-depth modeling approach that considered price schedules, simulations of HPWH equipment, and hot water draw profiles to explore multiple control strategies. The results presented in the associated report are more specific to the California market.
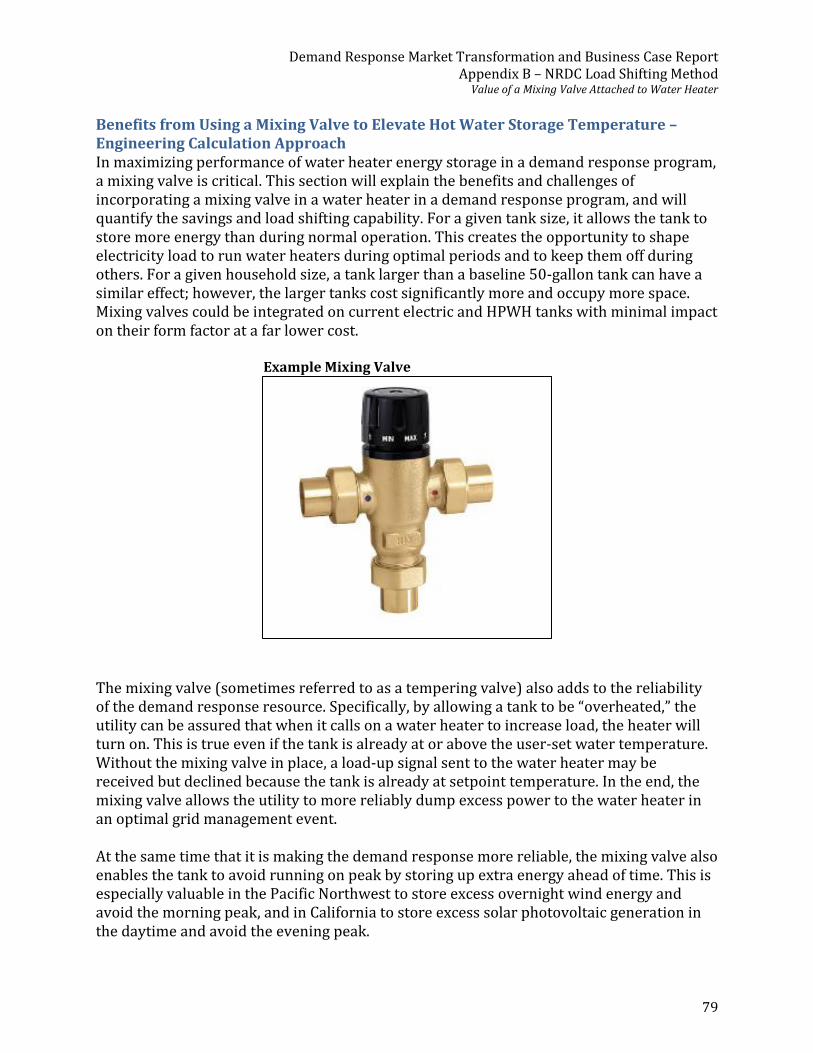
Demand Response Market Transformation and Business Case Report Appendix B – NRDC Load Shifting Method
Value of a Mixing Valve Attached to Water Heater
79
Benefits from Using a Mixing Valve to Elevate Hot Water Storage Temperature – Engineering Calculation Approach In maximizing performance of water heater energy storage in a demand response program, a mixing valve is critical. This section will explain the benefits and challenges of incorporating a mixing valve in a water heater in a demand response program, and will quantify the savings and load shifting capability. For a given tank size, it allows the tank to store more energy than during normal operation. This creates the opportunity to shape electricity load to run water heaters during optimal periods and to keep them off during others. For a given household size, a tank larger than a baseline 50-gallon tank can have a similar effect; however, the larger tanks cost significantly more and occupy more space. Mixing valves could be integrated on current electric and HPWH tanks with minimal impact on their form factor at a far lower cost.
Example Mixing Valve
The mixing valve (sometimes referred to as a tempering valve) also adds to the reliability of the demand response resource. Specifically, by allowing a tank to be “overheated,” the utility can be assured that when it calls on a water heater to increase load, the heater will turn on. This is true even if the tank is already at or above the user-set water temperature. Without the mixing valve in place, a load-up signal sent to the water heater may be received but declined because the tank is already at setpoint temperature. In the end, the mixing valve allows the utility to more reliably dump excess power to the water heater in an optimal grid management event. At the same time that it is making the demand response more reliable, the mixing valve also enables the tank to avoid running on peak by storing up extra energy ahead of time. This is especially valuable in the Pacific Northwest to store excess overnight wind energy and avoid the morning peak, and in California to store excess solar photovoltaic generation in the daytime and avoid the evening peak.
Demand Response Market Transformation and Business Case Report Appendix B – NRDC Load Shifting Method
Value of a Mixing Valve Attached to Water Heater
80
The amount of energy stored in a water heater is directly proportional to the tank size and temperature. The NRDC load shifting study showed that the “sweet range” for storing extra energy in HPWHs is a setpoint of 130°-140° F (the optimum temperature for electric resistance tanks is likely somewhat higher given that they have no heating performance loss in raising the tank to a higher temperature). This is a seemingly small increase in temperature over 125° F, but it balances increased energy storage against reduced compressor operating efficiency and increased heat loss. Higher temperatures may be warranted on occasion, during extreme grid events, but for day-to-day load shifting, the modest increase proved most useful. In a nominal 50-gallon HPWH tank, elevating the temperature from 125° F to 140° F increases stored energy by roughly 25% or the equivalent of 5.5 kBtu (1.6 kWh). Since the HPWH operates with a coefficient of performance (COP) greater than 1, the amount of electricity needed to “create” that extra stored water energy is 1.6 kWh divided by the COP. At those warm water temperatures and an ambient air temperature of 65° F, measurements show the COP is ~2.5. Consequently, the amount of electricity from the grid that can be effectively stored in this scenario is 0.65 kWh. Higher tank temperatures would result in more storage room. The compressor system on HPWHs typically draws 300-600 Watts depending on water and ambient air temperature conditions. Most often, they operate in the 400-500 Watt range. Continuing the scenario from above means that the mixing valve alone creates an opportunity to either run or block the HPWH from operating for 1-1.5 hours at 0.4-0.5 kW. This works both ways – for both load shed and load-up events. The energy storage space is available for the grid to use because the occupant’s needs are already met with the standard 125° F storage temperature. On an individual scale, the HPWH with mixing valve offers a dispatchable load of 0.4-0.5 kW, but the full value of the demand response comes with the large deployment scale when we must take in to account the availability of the resource. That availability is set by the baseline energy use profile or the load shape. In turn, the underlying hot water use pattern determines when the baseline HPWH operates. For the NRDC load shifting study, we simulated a population of households with diverse, representative water draw patterns to create a baseline. We then simulated HPWHs under demand response control to see how much load could be shifted out of the California evening peak while still maintaining hot water for the occupants. The study found that the effective storage capacity for the evening peak, with the resource availability taken into account, was 0.3-0.6 kWh. This was enabled by the mixing valve allowing the tank to store up energy in the daytime and coast through the evening. Finally, it should be noted that the full amount of water heater load shifting is a combination of its inherent storage capacity and the mixing valve. That is, during a morning peak event, the water heater can delay recovery time beyond that of the standard control while still not disrupting the user experience. For example, instead of turning on

Demand Response Market Transformation and Business Case Report Appendix B – NRDC Load Shifting Method
Value of a Mixing Valve Attached to Water Heater
81
immediately after a 10-gallon shower, the heater can wait an extra hour before engaging because there is still plenty of water at the top of the tank at a useable temperature. Adding in the storage created by the mixing valve increases the total load shifting energy amount so that the water heaters can avoid running entirely during a two-hour morning peak window if instructed to do so. Mixing valves could be field-added or ideally be integrated into water heaters at the factory, and be field-settable to ensure code compliance and customer satisfaction. Field-installed mixing valves are more expensive than a factory-installed solution. Little to no maintenance is required for well-engineered and -manufactured mixing valves. All properly-designed mixing valves are fail-safe (i.e., they will prevent a scalding situation if the product fails). The Ecotope report entitled Heat Pump Water Heater Electric Load Shifting: A Modeling Study begins on the next page and constitutes the remainder of this appendix.
Demand Response Market Transformation and Business Case Report Appendix B – NRDC Load Shifting Method
Heat Pump Water Heater Electric Load Shifting: A Modeling Study
82
Heat Pump Water Heater Electric Load Shifting: A Modeling Study
June 8, 2018
Prepared by:
Nick Carew, Ben Larson, Logan Piepmeier, and Michael Logsdon
Ecotope, Inc.
Demand Response Market Transformation and Business Case Report Appendix B – NRDC Load Shifting Method
Heat Pump Water Heater Electric Load Shifting Study Report
83
Table of Contents (Note: Page numbers in this TOC do not match page numbers in
the footer of this report due to insertion into this Demand Response appendix.)
Introduction .............................................................................................................................. 3
Background .............................................................................................................................. 3
Methodology............................................................................................................................. 4
Simulation .............................................................................................................................. 4
Simulation Inputs ................................................................................................................ 4
Hot Water Draw Patterns .................................................................................................... 4
Lab Testing ............................................................................................................................ 5
Test Plan ............................................................................................................................ 6
Testing Outcomes ............................................................................................................... 6
Simulations .............................................................................................................................. 9
Price Signals .......................................................................................................................... 9
TDV+NEM2 ........................................................................................................................ 9
Utility Marginal Costs .........................................................................................................10
Residential Time-of-Use Electricity Rates ..........................................................................10
Control Strategies ..................................................................................................................10
Simplest: Allow/Block .........................................................................................................11
Smarter: Load-Up & Shed ..................................................................................................11
Smartest: Optimal Price .....................................................................................................14
Bi-Directional: State-of-Charge ..........................................................................................17
Results .....................................................................................................................................19
Sensitivity of Customer Savings ............................................................................................24
CO2 HPWH Discussion ..........................................................................................................24
Conclusions ............................................................................................................................25
References ..............................................................................................................................28
Demand Response Market Transformation and Business Case Report Appendix B – NRDC Load Shifting Method
Heat Pump Water Heater Electric Load Shifting Study Report
84
Introduction
The National Resources Defense Council (NRDC)-Ecotope HPWH Load Flexibility project aims to
assess the potential for load flexibility via heat pump water heaters (HPWH). The concept is simple: to
shift load away from unfavorable times, create hotter water when favorable conditions exist and store the
energy in the HPWH tanks to be used later. This study primarily focuses on shifting load away from times
when electricity is expensive, although the developed strategies could be used to avoid any unfavorable
condition with an hourly schedule (e.g. greenhouse gas emissions).
For the purposes of this study, a series of price schedules were analyzed representing the costs as seen by
the various stakeholders (i.e. utilities & consumers). These prices schedules, along with the HPWH
simulation engine (HPWHsim33) developed by Ecotope, provide the basis for the optimization. The
objective is to find the lowest cost without running out of hot water. Several control strategies were
developed, with various levels of complexity, to transform these price schedules into control signals that
dictate the operation of the HPWHs.
The strategies are tied to the functionality of the equipment. All but one of the strategies require
additional control functions that do not currently exist in HPWHs, making this a future-looking exercise.
The strategies range from creating a simple on/off signal to dynamically changing the HPWH setpoint
temperature. The resulting control signal schedules were then fed into HPWHsim to investigate the
effects on overall cost of operation, energy consumption, hot water delivery, and greenhouse gas (GHG)
emissions.
Background
Electric storage water heaters can act as thermal batteries. They can be controlled to shift operation from
peak hours to off-peak hours, and to heat water at a higher temperature than the conventional setpoint to
maximize storage capacity. This demand flexibility can help reduce peak demand and better utilize
renewable energy when it is abundant, helping balance the grid, integrate high levels of renewable energy,
and reduce GHG emissions.
This practice is already in limited use with electric resistance water heaters in some U.S. regions, but it is
just emerging for HPWHs due to their smaller, yet growing, market share. Given the growing interest in
the efficiency and emissions reduction benefits of HPWH, this project aims to assess the potential for
demand flexibility by HPWH in California, in support of the state’s 2019 building energy code, integrated
resource planning (IRP), and utility incentive programs. The simulation is focused on California, and uses
state-specific climate, water usage, and grid conditions. However, the findings can be informative to other
states and regions. Further, the same methods developed here, could be employed in other regions given
those state-specific circumstances.
33 https://github.com/EcotopeResearch/HPWHsim
Demand Response Market Transformation and Business Case Report Appendix B – NRDC Load Shifting Method
Heat Pump Water Heater Electric Load Shifting Study Report
85
Methodology
Simulation
To help understand and estimate the amount of energy savings that can be achieved through heat pump
water heating, a HPWH simulation (HPWHsim) was written by Ecotope beginning in 2012 (Ecotope Inc.,
2015). The simulation was designed to run quickly, as the typical use case would see many simulations
run, each representing a year of activity. The HPWHsim engine is currently used by the California
Building Energy Compliance Calculator (CBECC-Res34) and by the Regional Technical Forum to
determine energy use associated with mass deployment of HPWHs in the residential sector (Regional
Technical Forum, 2018).
The simulation was designed to model storage tank water heaters, specifically HPWHs. The configuration
of a HPWH varies between different models so the simulation must accommodate these variations.
Common variables are the number and position of electric resistance elements, the arrangement of the
condensing coils, and the performance of the compressor system, among others. In addition to the
physical properties of the HPWH and the topology of its heat sources, each model of HPWH has a unique
set of criteria which direct it to engage or disengage its various heat sources. This control logic is
specifiable as well, by choosing from a set of standard decision criteria, such as the temperature of the top
third of the tank, and supplying setpoints for those criteria.
The simulation takes a hot water set-point, inlet water temperature, and ambient space temperature and
steps through a draw schedule at one-minute increments, tracking tank temperature and activating heating
components accordingly. The inlet water and ambient space temperatures are dependent on the climate
zone and the location of the water heater in the house. It is assumed for this project that all water heaters
are located in the garage since this is the case for the overwhelming majority of residential water heaters
in California. The draw profile is supplied to the simulation by the user.
Simulation Inputs
An important guideline for the project was to align as closely as possible with existing modeling tools and
assumptions in California. Therefore, the important inputs to the simulation, including inlet water
temperature, ambient space temperature, and draw profile all come from CBECC-Res. Specifically for
this project, the CBECC-Res software team provided hourly values for inlet water temperature, garage
temperature, outside air temperature, and draw profiles for 1-, 2-, 3-, 4-, and 5-bedroom prototype houses
across California’s 16 climate zones. These values are either direct inputs to CBECC-Res from weather
files or calculations the software performs. By using these hourly values, we are able to run HPWHsim
outside of CBECC-Res which was necessary due to the sheer number of simulations and computation
time required.
34 http://www.bwilcox.com/BEES/cbecc2016.html
Demand Response Market Transformation and Business Case Report Appendix B – NRDC Load Shifting Method
Heat Pump Water Heater Electric Load Shifting Study Report
86
Hot Water Draw Patterns
The hot water draw patterns used in this study warrant special mention. As a general comment, the
operation of HPWHs, and especially those with resistance elements, is highly complex, interdependent,
and non-linear. The solution for overcoming the interdependent complexity of draws, control logic, and
operating conditions, is to simulate using draw patterns with as much randomness as possible. Simulating
the same daily draw profile over and over again for an entire year creates an estimate that is extremely
fragile and sensitive to operating conditions, such as ambient temperature, inlet water temperature, and
setpoint. It is preferable to either define a unique draw profile for each day of the year based on real-life
water usage data, or for a more compact representation repeating a given daily/weekly draw pattern with
added stochastic variations. The draw profiles used in CBECC-Res follow the latter approach and provide
exactly what we need.
The draw schedules used in CBECC-Res are based off real hot water usage data that is linked to house
occupancy.35 Briefly described, an annual draw pattern consists of discrete, real, weekday, weekend, and
holiday days. The total annual draw volume is determined by the number of bedrooms selected for a
house so that 1-bedroom households have the lowest use and volume increases with bedroom count.
Within the annual patterns, weekday draw patterns, which typically peak in the morning and evening, are
assigned to real, calendar weekdays. Likewise, for weekends, which tend to have more spread-out use,
and also for holidays. In all, there are a total of 48 unique draw pattern days that are mixed and matched
to create each annual draw pattern. Further, for draw events like showers, where a user balances hot and
cold water to mix to a set temperature, the hot water volumes change over the year. This is due to the
changing cold water temperature – more hot water is needed in the winter to mix with cold to create the
same shower temperature. All of this variation is very effective in reflecting the complex reality of hot
water usage. Consequently, the simulations in this project have a reliable foundation of inputs to rest on.
Lab Testing
To both inform and ensure the accuracy of the simulation, laboratory testing was completed for a range of
current product offerings from Bradford White, Rheem, AO Smith, and Sanden. We investigated a range
of nominal tank sizes spanning 50 to 80 gallons. The Bradford White, Rheem, and AO Smith products are
all integrated, hybrid units using R-134a refrigerant. That is, they have the heat pump components sitting
atop the tank and have two electric resistance elements. The Sanden product has the heat pump
components, using CO2 refrigerant, located remote from the tank in a package designed for outside
installations.
A substantial body of testing data was available as a result of work funded by the Northwest Energy
Efficiency Alliance to study most resident HPWHs on the market (Kvaltine & Larson, 2015a, 2015b;
Larson & Kvaltine, 2015). That previous work was more general in nature whereas input needs for the
load shifting aspects of the simulation required specific additional information. In particular, previous lab
work had characterized compressor efficiency only up to typical tank water operating temperatures of
125°F-135°F. The heat pump efficiency, output capacity, and input power all vary substantially over the
35 http://www.bwilcox.com/BEES/docs/Kruis%20-%20Dhw%20Analysis%205.docx
Demand Response Market Transformation and Business Case Report Appendix B – NRDC Load Shifting Method
Heat Pump Water Heater Electric Load Shifting Study Report
87
range of water temperatures encountered in the tank. Consequently, the simulations in this project
explored setpoints as high as 160°F so we needed lab measurements in that range to accurately predict
performance.
Under the default controls for these HPWH products, there is a fixed, upper limit setpoint. The value
varies slightly by the equipment model but is typically 145°F. The limit is not due to physical limitations
of the R-134a vapor compression cycle so we asked the product manufacturers for special controls on the
water heaters to observe operation at even higher temperatures. Two of the three integrated product
manufacturers were able to provide tanks that allowed the setpoint to reach in excess of 165°F which
proved extremely beneficial to the testing. Note that previous lab measurements of the split-system, CO2
Sanden HPWH had characterized performance well in to the high water temperature range so further
detailed measurements were not explored for this product.
Test Plan
The laboratory testing, specific to the needs of this project, was completed at the Pacific Gas & Electric
(PG&E) Applied Technology Services test facility in San Ramon (CA). A test matrix was developed by
Frontier Energy and Ecotope consisting of three different test types:
▪ Coefficient of Performance (COP) – The relatively simple goal of the COP tests was to map the
heat pump performance as a function of water and air temperature.
▪ Behavior/Changing Controls – The goal of the Behavior testing was to identify the behavior of
the HPWH in response to changes in setpoint, and in response to potential changes in control
logic. These were used to explore which heating components, under the manufacturer’s current
control scheme, turn on or off after the setpoint was dramatically increased or decreased. We
would expect future products, designed with full load shifting capability in mind, to have
different control responses. Further, the water heater’s default controls may be moot because a
fully functioning load shifting program would likely implement direct control over the heat pump
and resistance element operation, rather than setpoint control.
▪ Draw Profiles - The Draw Profile testing serves two purposes. The first is to demonstrate, with
actual equipment, as opposed to a computer simulation, that the load shifting we are considering
is possible. Second is to provide a data set that we can validate the simulation against. For this
task, two demanding draw patterns, each comprising a day, from the CBECC-Res draw profiles
were selected. Those two days we explicitly selected to demonstrate the ability of the water heater
to ride out the late afternoon / early evening peak time under challenging circumstances. The
original project design had hoped to control each water heater with a remote signal. Due to
limitations in both the products themselves and the lab environment, this was not possible.
Instead, control was exercised over the equipment by manual changes in setpoint. A “load-up”
event was simulated by increasing the tank setpoint. Then, during the peak price period, the tank
setpoint was lowered.
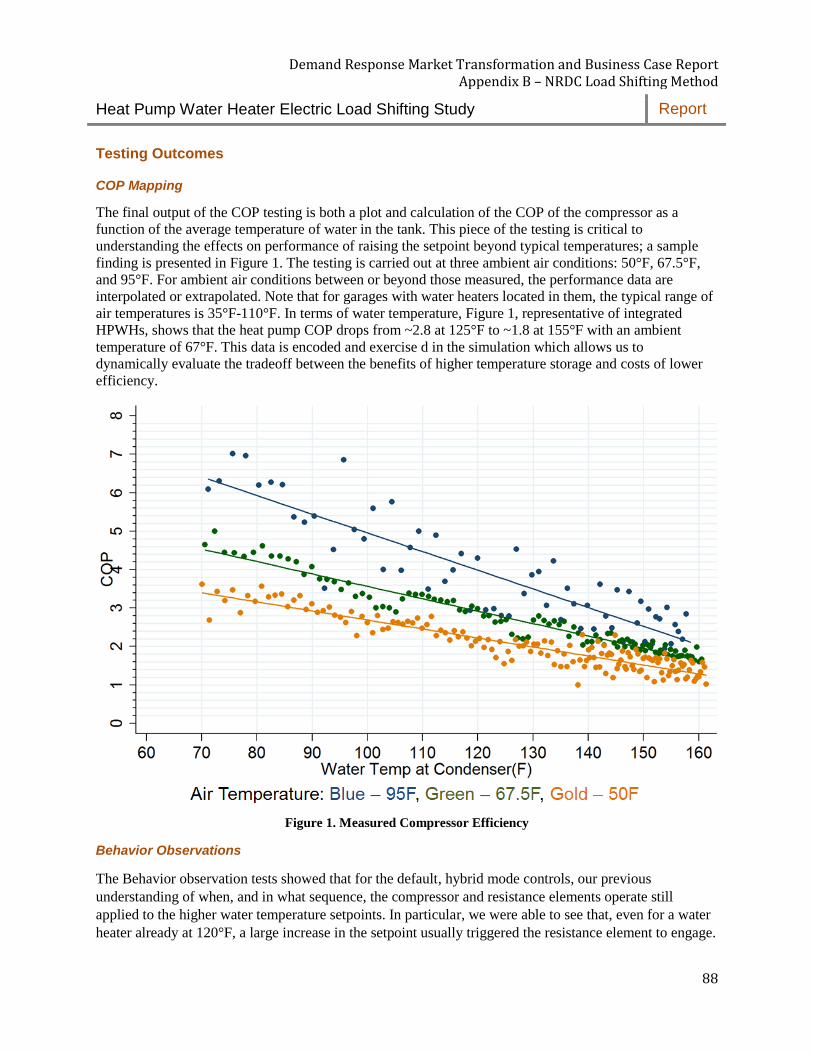
Demand Response Market Transformation and Business Case Report Appendix B – NRDC Load Shifting Method
Heat Pump Water Heater Electric Load Shifting Study Report
88
Testing Outcomes
COP Mapping
The final output of the COP testing is both a plot and calculation of the COP of the compressor as a
function of the average temperature of water in the tank. This piece of the testing is critical to
understanding the effects on performance of raising the setpoint beyond typical temperatures; a sample
finding is presented in Figure 1. The testing is carried out at three ambient air conditions: 50°F, 67.5°F,
and 95°F. For ambient air conditions between or beyond those measured, the performance data are
interpolated or extrapolated. Note that for garages with water heaters located in them, the typical range of
air temperatures is 35°F-110°F. In terms of water temperature, Figure 1, representative of integrated
HPWHs, shows that the heat pump COP drops from ~2.8 at 125°F to ~1.8 at 155°F with an ambient
temperature of 67°F. This data is encoded and exercise d in the simulation which allows us to
dynamically evaluate the tradeoff between the benefits of higher temperature storage and costs of lower
efficiency.
Figure 1. Measured Compressor Efficiency
Behavior Observations
The Behavior observation tests showed that for the default, hybrid mode controls, our previous
understanding of when, and in what sequence, the compressor and resistance elements operate still
applied to the higher water temperature setpoints. In particular, we were able to see that, even for a water
heater already at 120°F, a large increase in the setpoint usually triggered the resistance element to engage.
Demand Response Market Transformation and Business Case Report Appendix B – NRDC Load Shifting Method
Heat Pump Water Heater Electric Load Shifting Study Report
89
Similarly, starting with a 150°F tank, decreasing the setpoint to 120°F and conducting a large hot water
draw triggered the resistance elements on as if there wasn’t an added benefit of having 150°F water at the
top of the tank. In the end, we were able to use these test results to inform how we would conduct the
Draw Profile tests. The plan was to step the setpoint up in smaller increments to avoid the resistance heat
use.
The observations also informed how we conducted the simulations. For one, we reasoned future
equipment, with specific demand response controls would be designed to minimize the use of resistance
heat. Therefore, we changed element temperature controls to be on an absolute basis and not one relative
to setpoint. This made effective use of the extra hot water storage in the tank. Second, much like the way
we conducted the Draw Profile tests in the lab, we deployed a setpoint increase in smaller steps to avoid
unnecessary resistance heat use when loading up the tank.
Draw Profile Validation
The simulation controls have been previously calibrated and validated under baseline operation – that is
when the tanks operate at a constant setpoint and are not controlled to shift load (Ecotope 2015 and RTF
2018). This project took the validation one step farther to assess how the simulation compared to
measured load shifting draw profiles in the lab. In picking draw profiles to use, we turned to the CBECC-
Res collection and selected two out of a possible forty-eight daily profiles. Those profiles are identified as
2D1 and 4E1. They were selected because they are the largest profiles from the collection that coincide
with peak electricity draw. In other words, they have large afternoon/evening water uses. They also total
95 and 114 gallons per day respectively. Importantly, these are not the average draw profiles found in
CBECC-Res which are much lower. Again, these were purposefully selected for their heavy use. To
replicate a load-up and shed scenario, the lab test elevated the tank setpoint at 9am and then returned it to
125F at 5pm so the water heater could coast through the evening peak. The water heaters were left in
hybrid mode.
The validation process was one of seeing how closely the simulation could replicate the observed
behavior. The simulation was provided with the same draw profile, inlet water temperature, ambient air
temperature, and setpoint schedule over the 24 hours of the lab test. Then, the resulting simulated energy
was compared to the measured energy.
The starting point for of the calibrated control parameters were those used in CBECC-Res for the water
heaters in question. Those were calibrated to ~5 lab tests – mostly available from compliance testing with
the Advanced Water Heater Specification. Next, before load shifting simulations were conducted, we had
an additional, limited set of lab tests from PG&E ATS facility which gave us more information with
which to tweak the control parameters. These were the behavior tests but not the full suite of draw profile
results. We used these because, generally, more information is better. Then, the load shifting simulation
work was conducted. Subsequently, with the draw profile tests complete from the lab, we assessed the
ability of the simulation to replicate the measured behavior (validation step).
The comparison showed the simulation over-predicted energy use of the 2D1 and 4E1 profiles in both the
fixed and variable setpoint cases by 15-20% for two of the integrated HPWHs and by >35% for a third.
The finding does not necessarily indicate a flaw in the simulation that needs correction, but rather, serves
to highlight the difficulties with both calibrating and validating a simulation. To do both, one needs
copious data points which is generally hard to come by in the water heating realm. First, the dataset to
Demand Response Market Transformation and Business Case Report Appendix B – NRDC Load Shifting Method
Heat Pump Water Heater Electric Load Shifting Study Report
90
which the simulation was calibrated was relatively small. Second, the dataset the simulation was validated
against (the 2D1 and 4E1) was not representative of typical water use. Those draw profiles are skewed to
high demand situations. Overall, we are not so much interested in how the simulation compares to those
scenarios but, instead, how it compares with the average water heating use. In retrospect, it is clear a more
thorough validation dataset would be one that involved 10-20 days of lab tests, which enforced variability
of low, average, and high draw days or 30+ days of field data. Such datasets would likely contain enough
diversity as well as average behavior to provide a useful platform for calibration.
As it stands, the validation work shows the simulations could be over-predicting energy use somewhat in
load shifting scenarios. If that is the case, we could expect real world installations to offer slightly higher
energy and cost savings from load shifting than modeled here. Further, the simulations for the third unit,
which showed over-prediction of more than 35% were excluded from our ultimate findings summaries.
Last, the split-system HPWH was excluded from the validation analysis due to project budget and time
constraints, however, that water heater has no resistance element whose operation was the focus of the
validation efforts.
Simulations
With the independent simulation inputs of the draw patterns, inlet water temperature, and ambient air
conditions established and the simulation further informed by the lab testing results, we move on to
consider the price signals sent to the water heater and possible ways to respond to them (algorithms or
control strategies). Since we did not know a priori the best control algorithms, it was important to
consider a wide range of parameters to identify the most effective load shifting method. Additionally, we
needed to consider how well the methods worked across a wide range of climate zones and household
sizes. Doing both implies exploring a parameter space over many simulation runs. Table 1 displays the
parameters of the optimization and exploration process. It is worth noting that the baseline case was taken
to be uncontrolled water heaters with a 125°F setpoint.
Table 1. Optimization Parameters
Parameter # of values
Load shaping metric to optimize (Price Signals): TDV&NEM2, Utility Marginal Costs, Time-of-Use 3
Units: Generic Resistance Heat Tanks [50, 65, & 80 gallons], Bradford White [50, 80, 80(hp-only)], AOSmith
HPTU [50, 66, 66(hp-only), 80], Rheem Gen4 [50, 50(hp-only), 65, 80], Sanden Gen3 [80] 15
Max temperature: 125, 135, 145, 155 4
Climate zone: CZ1-CZ16 16
House size: 1-5 bedrooms 5
Control algorithms: Allow/Block, Load-Up/Shed, Optimal Price, Optimal Price w/ Cold Weather Load-Up,
State-of-Charge 5
Total 72,000
Price Signals
The control signals provided to the HPWHs are based solely on the price signals provided as inputs to the
algorithms. Three different price signals were considered in this study as described below.
TDV+NEM2
The California Energy Commission (CEC) has developed a time-dependent valuation (TDV) of energy
for use in California’s building energy codes. The concept behind TDV is that energy efficiency measure
Demand Response Market Transformation and Business Case Report Appendix B – NRDC Load Shifting Method
Heat Pump Water Heater Electric Load Shifting Study Report
91
savings should be valued differently depending on which time of day and day of the year the savings
occur, to better reflect the actual costs of energy to consumers, to the utility system, and to society
(California Energy Commission, 2017). The TDV price signal is essentially a 30-year present value
projection of grid energy costs, calculated for each climate zone in California. The values of TDV are
constructed from a long-term forecast of hourly electricity, natural gas, and propane costs to building
owners consistent with the latest CEC forecasts and outlook for California’s energy sectors. The time
dependent nature of TDV reflects the underlying marginal cost of producing and delivering an additional
unit of energy, similar to a time of use retail tariff, and the resulting economic signal aligns energy
savings with the cost of producing and delivering energy to consumers (California Energy Commission,
2017).
The NEM2 component of the price signal stands for Net Energy Metering version 2 which compensates
user-produced electricity exports at the retail electricity rate less 2-3 cents of non-bypassable charges, or
the NEM2-adjusted retail rate. This component of the price signal was included to reflect the 2019
building code for homes with solar production, as it is expected that most new buildings will have solar
starting in 2020 as a result of the 2019 building code update.
The resulting hourly price signal is dynamic relative to a fixed time-of-use rate schedule, however, still
relatively flat for much of the year. Large price spikes are relatively few thus limiting the opportunity for
significant amounts of load shifting. And roughly half of the annual TDV value comes from a “retail
adder”, which limits how low TDV values go, even when wholesale marginal prices are negative.
Utility Marginal Costs
The source of this price schedule is the PG&E 2024 hourly marginal costs. The utility marginal costs
factor in the costs of energy, emissions, capacity, transmission and distribution of electricity. These costs
do not include a retail rate adder, they reflect the actual marginal costs to the utility, which may (and
does) dip to negative prices when production exceeds demand in the middle of the day when solar peaks
and inflexible baseload resources cannot ramp down sufficiently. This provides an opportunity for the
utility to actually get paid to use connected HPWHs to store energy during the surplus power hours and
then lower peak demand later.
Residential Time-of-Use Electricity Rates
Time-of-use (TOU) retail rates better represent the value of load shifting to the consumer. These rates can
change hourly but, in practice, are set for several specific blocks of time each day for a given season.
Table 2 details the breakdown of TOU prices by day type.
Table 2. Time-of-Use Price Schedule Detail
Season Day Type 2hr Morning
Peak
2hr Pre-Peak
Shoulder
4hr Afternoon
Peak
3hr Post-Peak
Shoulder
Winter weekday X X X
weekend X
Summer weekday X X X X
weekend X X
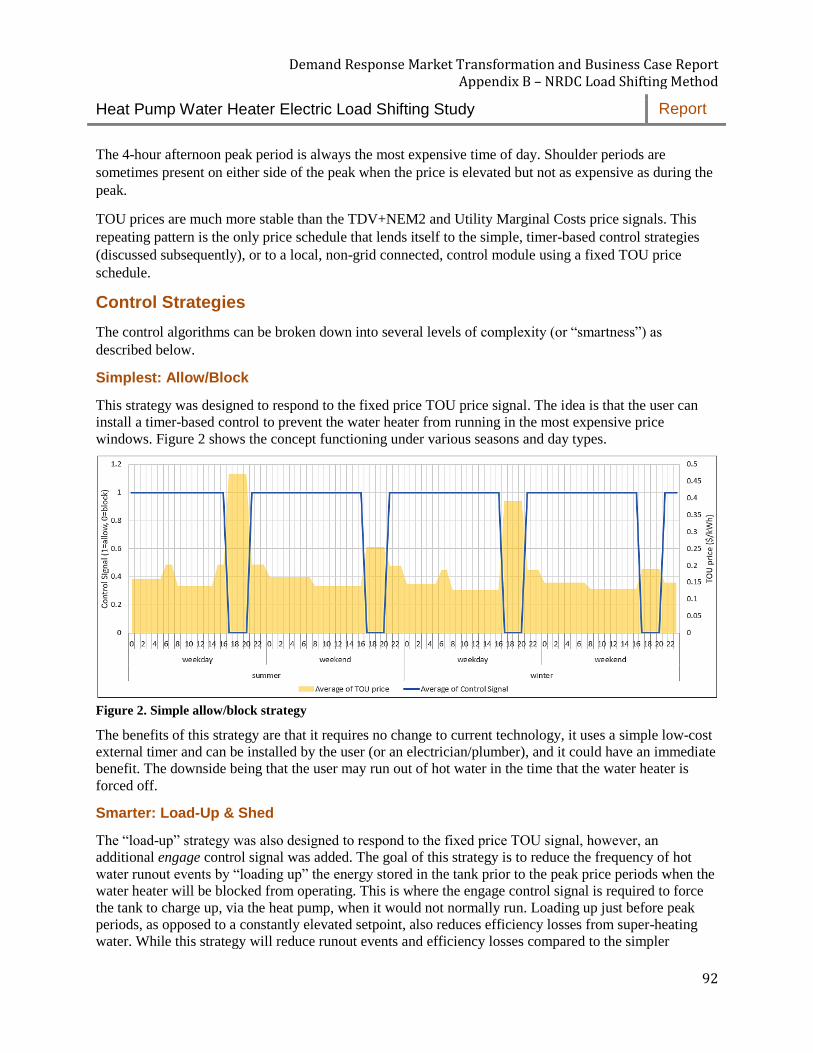
Demand Response Market Transformation and Business Case Report Appendix B – NRDC Load Shifting Method
Heat Pump Water Heater Electric Load Shifting Study Report
92
The 4-hour afternoon peak period is always the most expensive time of day. Shoulder periods are
sometimes present on either side of the peak when the price is elevated but not as expensive as during the
peak.
TOU prices are much more stable than the TDV+NEM2 and Utility Marginal Costs price signals. This
repeating pattern is the only price schedule that lends itself to the simple, timer-based control strategies
(discussed subsequently), or to a local, non-grid connected, control module using a fixed TOU price
schedule.
Control Strategies
The control algorithms can be broken down into several levels of complexity (or “smartness”) as
described below.
Simplest: Allow/Block
This strategy was designed to respond to the fixed price TOU price signal. The idea is that the user can
install a timer-based control to prevent the water heater from running in the most expensive price
windows. Figure 2 shows the concept functioning under various seasons and day types.
Figure 2. Simple allow/block strategy
The benefits of this strategy are that it requires no change to current technology, it uses a simple low-cost
external timer and can be installed by the user (or an electrician/plumber), and it could have an immediate
benefit. The downside being that the user may run out of hot water in the time that the water heater is
forced off.
Smarter: Load-Up & Shed
The “load-up” strategy was also designed to respond to the fixed price TOU signal, however, an
additional engage control signal was added. The goal of this strategy is to reduce the frequency of hot
water runout events by “loading up” the energy stored in the tank prior to the peak price periods when the
water heater will be blocked from operating. This is where the engage control signal is required to force
the tank to charge up, via the heat pump, when it would not normally run. Loading up just before peak
periods, as opposed to a constantly elevated setpoint, also reduces efficiency losses from super-heating
water. While this strategy will reduce runout events and efficiency losses compared to the simpler
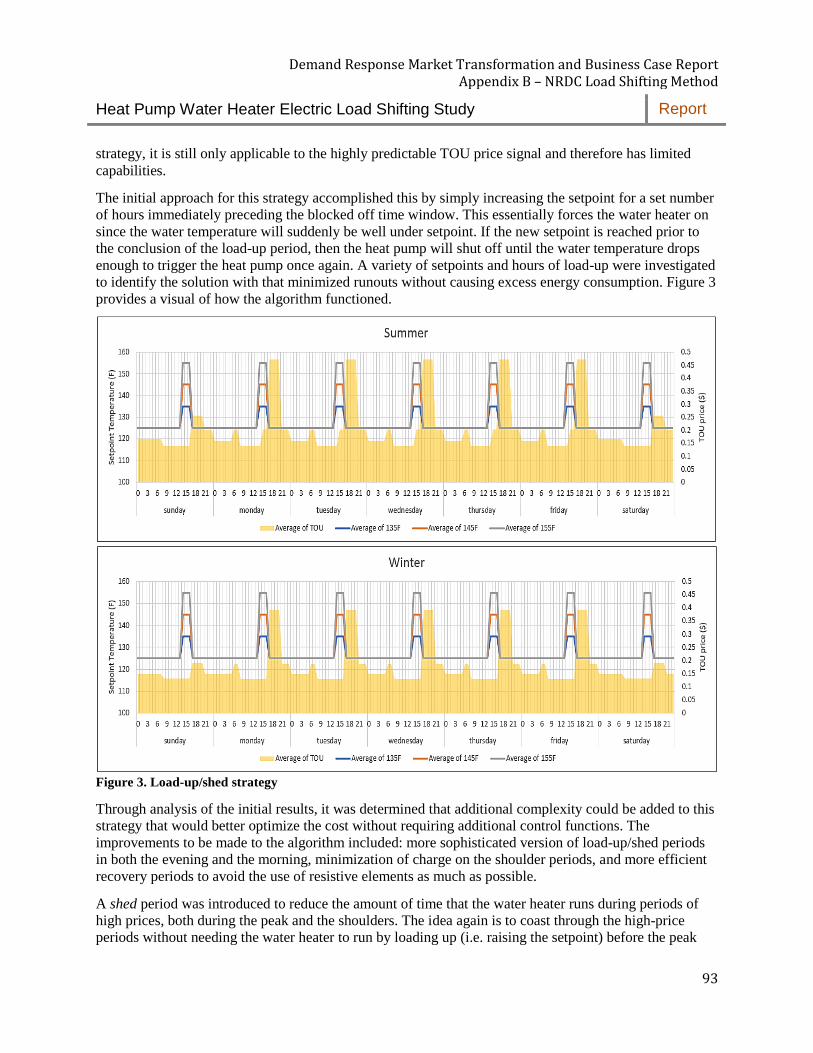
Demand Response Market Transformation and Business Case Report Appendix B – NRDC Load Shifting Method
Heat Pump Water Heater Electric Load Shifting Study Report
93
strategy, it is still only applicable to the highly predictable TOU price signal and therefore has limited
capabilities.
The initial approach for this strategy accomplished this by simply increasing the setpoint for a set number
of hours immediately preceding the blocked off time window. This essentially forces the water heater on
since the water temperature will suddenly be well under setpoint. If the new setpoint is reached prior to
the conclusion of the load-up period, then the heat pump will shut off until the water temperature drops
enough to trigger the heat pump once again. A variety of setpoints and hours of load-up were investigated
to identify the solution with that minimized runouts without causing excess energy consumption. Figure 3
provides a visual of how the algorithm functioned.
Figure 3. Load-up/shed strategy
Through analysis of the initial results, it was determined that additional complexity could be added to this
strategy that would better optimize the cost without requiring additional control functions. The
improvements to be made to the algorithm included: more sophisticated version of load-up/shed periods
in both the evening and the morning, minimization of charge on the shoulder periods, and more efficient
recovery periods to avoid the use of resistive elements as much as possible.
A shed period was introduced to reduce the amount of time that the water heater runs during periods of
high prices, both during the peak and the shoulders. The idea again is to coast through the high-price
periods without needing the water heater to run by loading up (i.e. raising the setpoint) before the peak
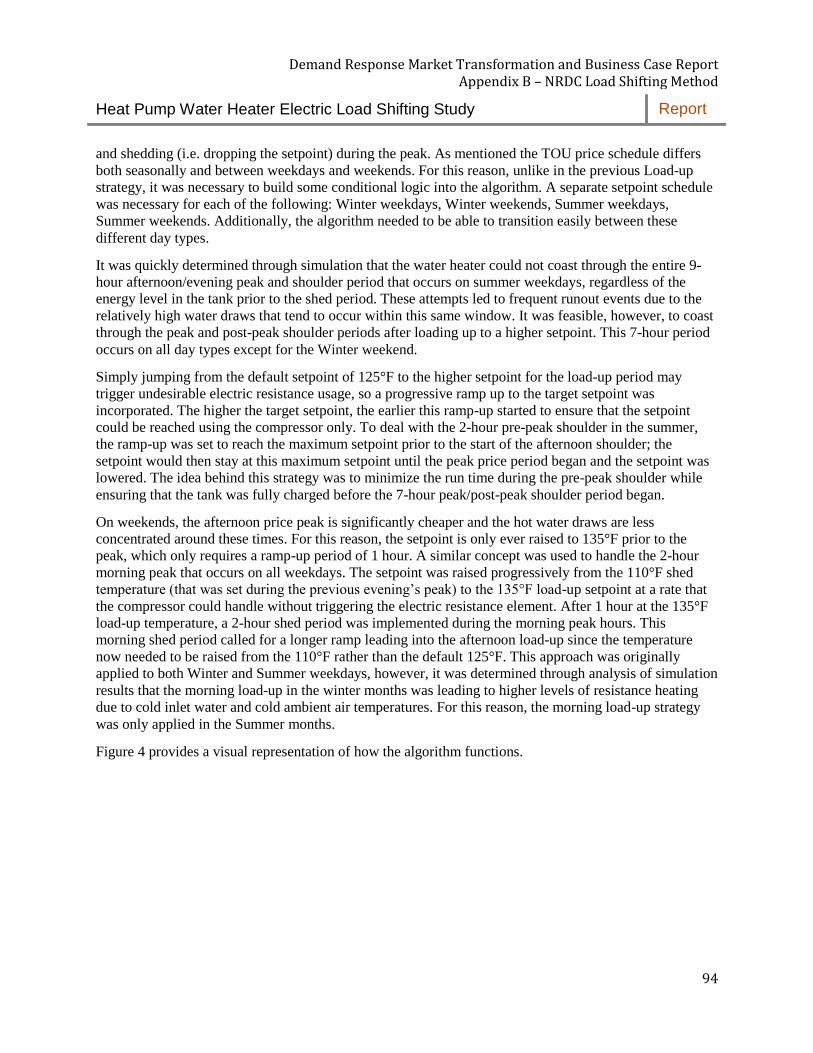
Demand Response Market Transformation and Business Case Report Appendix B – NRDC Load Shifting Method
Heat Pump Water Heater Electric Load Shifting Study Report
94
and shedding (i.e. dropping the setpoint) during the peak. As mentioned the TOU price schedule differs
both seasonally and between weekdays and weekends. For this reason, unlike in the previous Load-up
strategy, it was necessary to build some conditional logic into the algorithm. A separate setpoint schedule
was necessary for each of the following: Winter weekdays, Winter weekends, Summer weekdays,
Summer weekends. Additionally, the algorithm needed to be able to transition easily between these
different day types.
It was quickly determined through simulation that the water heater could not coast through the entire 9-
hour afternoon/evening peak and shoulder period that occurs on summer weekdays, regardless of the
energy level in the tank prior to the shed period. These attempts led to frequent runout events due to the
relatively high water draws that tend to occur within this same window. It was feasible, however, to coast
through the peak and post-peak shoulder periods after loading up to a higher setpoint. This 7-hour period
occurs on all day types except for the Winter weekend.
Simply jumping from the default setpoint of 125°F to the higher setpoint for the load-up period may
trigger undesirable electric resistance usage, so a progressive ramp up to the target setpoint was
incorporated. The higher the target setpoint, the earlier this ramp-up started to ensure that the setpoint
could be reached using the compressor only. To deal with the 2-hour pre-peak shoulder in the summer,
the ramp-up was set to reach the maximum setpoint prior to the start of the afternoon shoulder; the
setpoint would then stay at this maximum setpoint until the peak price period began and the setpoint was
lowered. The idea behind this strategy was to minimize the run time during the pre-peak shoulder while
ensuring that the tank was fully charged before the 7-hour peak/post-peak shoulder period began.
On weekends, the afternoon price peak is significantly cheaper and the hot water draws are less
concentrated around these times. For this reason, the setpoint is only ever raised to 135°F prior to the
peak, which only requires a ramp-up period of 1 hour. A similar concept was used to handle the 2-hour
morning peak that occurs on all weekdays. The setpoint was raised progressively from the 110°F shed
temperature (that was set during the previous evening’s peak) to the 135°F load-up setpoint at a rate that
the compressor could handle without triggering the electric resistance element. After 1 hour at the 135°F
load-up temperature, a 2-hour shed period was implemented during the morning peak hours. This
morning shed period called for a longer ramp leading into the afternoon load-up since the temperature
now needed to be raised from the 110°F rather than the default 125°F. This approach was originally
applied to both Winter and Summer weekdays, however, it was determined through analysis of simulation
results that the morning load-up in the winter months was leading to higher levels of resistance heating
due to cold inlet water and cold ambient air temperatures. For this reason, the morning load-up strategy
was only applied in the Summer months.
Figure 4 provides a visual representation of how the algorithm functions.
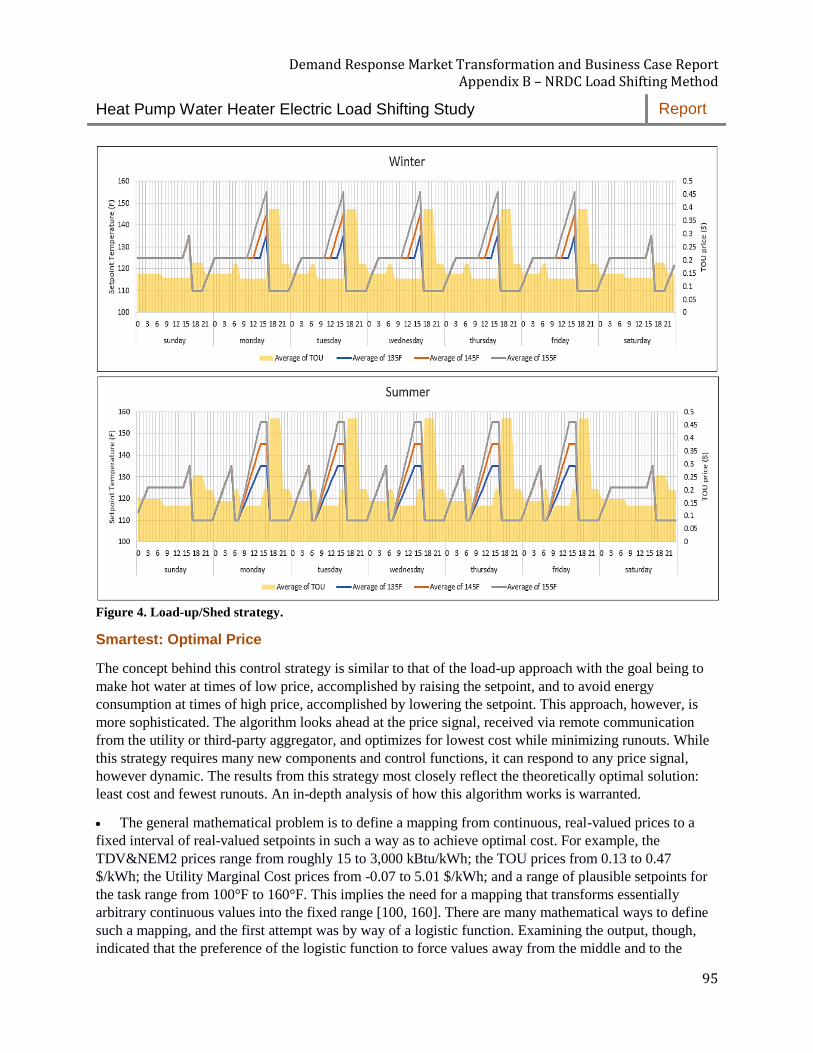
Demand Response Market Transformation and Business Case Report Appendix B – NRDC Load Shifting Method
Heat Pump Water Heater Electric Load Shifting Study Report
95
Figure 4. Load-up/Shed strategy.
Smartest: Optimal Price
The concept behind this control strategy is similar to that of the load-up approach with the goal being to
make hot water at times of low price, accomplished by raising the setpoint, and to avoid energy
consumption at times of high price, accomplished by lowering the setpoint. This approach, however, is
more sophisticated. The algorithm looks ahead at the price signal, received via remote communication
from the utility or third-party aggregator, and optimizes for lowest cost while minimizing runouts. While
this strategy requires many new components and control functions, it can respond to any price signal,
however dynamic. The results from this strategy most closely reflect the theoretically optimal solution:
least cost and fewest runouts. An in-depth analysis of how this algorithm works is warranted.
• The general mathematical problem is to define a mapping from continuous, real-valued prices to a
fixed interval of real-valued setpoints in such a way as to achieve optimal cost. For example, the
TDV&NEM2 prices range from roughly 15 to 3,000 kBtu/kWh; the TOU prices from 0.13 to 0.47
$/kWh; the Utility Marginal Cost prices from -0.07 to 5.01 $/kWh; and a range of plausible setpoints for
the task range from 100°F to 160°F. This implies the need for a mapping that transforms essentially
arbitrary continuous values into the fixed range [100, 160]. There are many mathematical ways to define
such a mapping, and the first attempt was by way of a logistic function. Examining the output, though,
indicated that the preference of the logistic function to force values away from the middle and to the
Demand Response Market Transformation and Business Case Report Appendix B – NRDC Load Shifting Method
Heat Pump Water Heater Electric Load Shifting Study Report
96
extremes led to, absent intervention to the contrary, many hours at maximum setpoint and many hours at
minimum setpoint.
• This laid plain the tradeoff required for this task with heat pump water heaters. Loading up the tank
comes at its own price. Standby losses increase but more significantly, the heat pump COP declines with
tank temperature. Loading the tank up to 160°F may represent a loss of a full COP point compared to the
standard operating regime at 125°F. Furthermore, a quirk of loading the tank to higher temperatures is
that it may result in additional energy being delivered, and hence an even higher load than the base case.
For example, machine draws (e.g. washing machine, dishwasher) will consume a fixed volume of water.
With a hotter tank equipped with a mixing valve, this fixed volume of water would always be delivered at
125°F and never below that setpoint. With a traditional tank, floating within a temperature deadband, that
fixed volume draw may average 119-121°F outlet temperature. Human draws which mix hot and cold at
the point of use (e.g. showers), would likely consume an equivalent amount of energy as they would in
the base case. Because of these factors, loading up the tank imposes its own penalty on kWh, and so an
optimal solution must weigh the advantage of hitting the price schedule most favorably against the
disadvantage of loading up the tank.
• The logistic function's preference for minimum and maximum setpoint temperatures tended to err on
the side of too much load shifting, where the disadvantages in COP, standby, and delivered energy
frequently outweighed the advantages of favorable pricing. Efforts were made to ameliorate this problem,
but as it was endemic to the nature of the mapping a second approach was proposed. As an alternative
mapping between prices and setpoint, we consider a partitioned Gaussian distribution, with variance
scaled by a “load shifting severity” factor.
The current version of the Optimal Price algorithm works as follows. Once per day, the subsequent 24
hours of the price schedule is considered. The dynamic range is calculated by taking the ratio of the
maximum and minimum price. The “load shifting severity” is calculated as a piecewise linear function of
that value, where if it is below a certain limit then no load shifting will be performed, otherwise it is a
linear function of the dynamic range. Then, the 24 prices are transformed into “z-scores” by subtracting
the mean and dividing by the standard deviation, then scaled by the load shifting severity and translated
by a setpoint bias factor. Finally, those resultant values are binned by the following thresholds: [less than
-1.5, -1.5 to -0.5, -0.5 to 0.5, 0.5 to 1.5, greater than 1.5] which maps to five different setpoints. For
example, the five different setpoints could be 100, 112.5, 125, 137.5, and 150 for a 150°F max
temperature scenario. Although this may sound complicated, the result is that the specifics of the
algorithm are controlled by only five parameters that can be adapted for various price schedules: the
threshold to invoke load shifting, the slope and intercept of the load shifting severity function, the setpoint
bias factor, and the maximum setpoint.
Figure 6 graphically shows the relationship between the z-score of the price at a given hour and the
setpoint. In cases where there is little variation in the price over the next 24 hours, the load shifting
severity will be low (blue lines in Figure 5). Those low values will encourage the water heater to remain
at the default setpoint. For example, if the TDV ranges from 23 to 25 over the next time period, it is not
worth the energy penalty to load up the water heater to a 150°F setpoint. A small fraction of price could
be gained by running the HPWH at TDV of 23 compared to 25 but the energy losses of the high
temperature would outweigh the benefits. Likewise, a proportionally incremental change in setpoint (to,
say, 127°F) in the low TDV time has such an infinitesimal impact on stored energy availability, it’s not
worth it. In the opposite case, were the TDV is forecast to range from 20 to 600 over the next 24 hours,
the load shifting severity will be high (green lines in Figure 5). Those high values will encourage the
Demand Response Market Transformation and Business Case Report Appendix B – NRDC Load Shifting Method
Heat Pump Water Heater Electric Load Shifting Study Report
97
water heater to drastically alter its setpoint over the time period to only run at the cheap times and avoid
the peaks.
If the ability exists to load up the tank every day, it can also be beneficial to operate the water heater at a
generally lower setpoint at all other time periods. For example, it can be useful to bias the tank
temperature low overnight when little water is used knowing that it’s possible to load up in the middle of
the day. This is the setpoint bias factor which shifts the curves in Figure 5 right or left.
Figure 5. Partitioned Gaussian Setpoint Shifting Concept
Figure 6 provides an example of the setpoint response to the TDV&NEM2 schedule. It shows six days
starting July 8th. For the first two days, the TDV is relatively flat and it is not worthwhile to shift load so
the setpoint remains constant. For the next four days, there are spikes in the TDV which, at values over
2,000 are literally off the chart. In response to those spikes, on the afternoon of day three, the setpoint is
dropped down to 100°F ensuring the HPWH will not run. Then, as soon as the price spike is over, the
setpoint returns to normal. In day four, the algorithm sees that the price spike is tall and wide so it runs
the water heater at a high setpoint of 160°F during the cheap hours. Days five and six continue in much
the same way as day three. The takeaway is that the algorithm can handle varying circumstances.
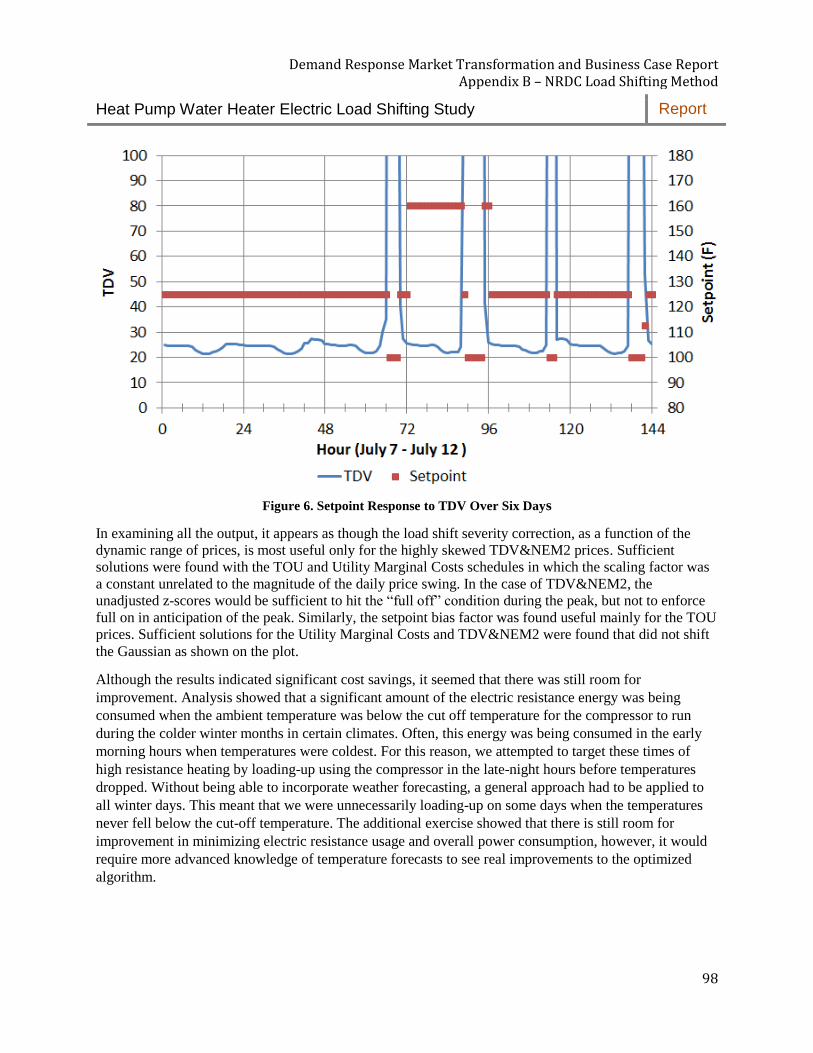
Demand Response Market Transformation and Business Case Report Appendix B – NRDC Load Shifting Method
Heat Pump Water Heater Electric Load Shifting Study Report
98
Figure 6. Setpoint Response to TDV Over Six Days
In examining all the output, it appears as though the load shift severity correction, as a function of the
dynamic range of prices, is most useful only for the highly skewed TDV&NEM2 prices. Sufficient
solutions were found with the TOU and Utility Marginal Costs schedules in which the scaling factor was
a constant unrelated to the magnitude of the daily price swing. In the case of TDV&NEM2, the
unadjusted z-scores would be sufficient to hit the “full off” condition during the peak, but not to enforce
full on in anticipation of the peak. Similarly, the setpoint bias factor was found useful mainly for the TOU
prices. Sufficient solutions for the Utility Marginal Costs and TDV&NEM2 were found that did not shift
the Gaussian as shown on the plot.
Although the results indicated significant cost savings, it seemed that there was still room for
improvement. Analysis showed that a significant amount of the electric resistance energy was being
consumed when the ambient temperature was below the cut off temperature for the compressor to run
during the colder winter months in certain climates. Often, this energy was being consumed in the early
morning hours when temperatures were coldest. For this reason, we attempted to target these times of
high resistance heating by loading-up using the compressor in the late-night hours before temperatures
dropped. Without being able to incorporate weather forecasting, a general approach had to be applied to
all winter days. This meant that we were unnecessarily loading-up on some days when the temperatures
never fell below the cut-off temperature. The additional exercise showed that there is still room for
improvement in minimizing electric resistance usage and overall power consumption, however, it would
require more advanced knowledge of temperature forecasts to see real improvements to the optimized
algorithm.
Demand Response Market Transformation and Business Case Report Appendix B – NRDC Load Shifting Method
Heat Pump Water Heater Electric Load Shifting Study Report
99
Bi-Directional: State-of-Charge
All the previous strategies involved sending a signal to the water heater from the controller telling it how
to operate for the subsequent hour. The final strategy that was investigated requires two-way
communication between the water heater tank and the controller, allowing the controller to know the
quantity of hot water available in the tank at each hour. The concept being that the controller can assess
whether it has enough hot water to meet an expected demand for a fixed number of hours and, if not,
determine the cheapest times to add energy to the tank while avoiding runout events.
As mentioned, this algorithm operates using an expected draw schedule. The expected draw is either the
50th, 75th, or 90th percentile, calculated over all the draw patterns used in CBECC-Res spanning all
house sizes and climate zones.
It also uses three setpoints, which are referred to as minimum, default, and catch-up. The minimum
setpoint is the minimum allowable temperature for water delivered to the fixtures, to be used whenever
the tank contains enough hot water to meet the expected demand. The catch-up setpoint is used when
expected demand is larger than the tank's current charge plus it's future capacity at the default setpoint.
The setpoints serve as a crude stand-in for "do nothing", "add to state of charge with compressor", and
"add to state of charge by any means necessary", respectively. In this simulation we used a minimum
setpoint of 110°F, a default setpoint of 125°F, and a catch-up setpoint of 140°F.
Variables used in the algorithm are defined as follows:
Capacity: We calculate the capacity of the heat pump as the number of liters of water at the
minimum deliverable temperature that can be produced over some period of time by running the
heat pump given the current inlet water temperature and tank temperature near the coil. This
relationship is estimated using lab testing data.
Lookahead period: The lookahead period refers to the number of hours of future expected draws
that are considered when making a decision about setpoint.
State-of-charge: The state-of-charge is defined as the volume of water known to be above the
minimum deliverable water temperature (defined as 110°F for this simulation). In the "ideal"
case, we calculate this using all six temperature nodes in the HPWHsim model. Therefore, our
state-of-charge has a resolution of 1/5 the volume of the tank (there are nodes at the very top and
bottom of the tank). In the "realistic" case, we assume there are only two thermocouples in the
tank, located at nodes 1 and 4 (bottom and 3/5 from the bottom). In this case, we only know if the
tank is completely uncharged, less than 3/5 full, or at least 3/5 full. Note that the state-of-charge is
assumed to only be reduced by draw (that is, we do not account for heat loss). This results in a
slightly optimistic prediction of whether we can meet demand, however we will generally make a
pessimistic prediction about what that demand will be.
The algorithm checks at each timepoint whether the state-of-charge will meet demand without adding
additional energy. If not, it decides whether it can find cheaper times to run before demand overtakes
capacity. It also decides whether an unexpected draw has forced it to trigger the catch-up setpoint, which
will presumably trigger the electric resistance element, but may help prevent a runout.
At the beginning of every hour, the simulation calculates the following:
Demand Response Market Transformation and Business Case Report Appendix B – NRDC Load Shifting Method
Heat Pump Water Heater Electric Load Shifting Study Report
100
• Current state of charge tank in liters (either "ideal" or "realistic")
• Expected demand over the lookahead period (4, 8, or 12 hours) in liters
If the state-of-charge exceeds the expected demand, we can meet demand without additional hot water
and can therefore save energy by lowering to the minimum setpoint. The next step checks for a catch-up
condition (i.e. we expect to run out of hot water in the next hour) and, if present, increase the setpoint to
the maximum to immediately add energy to the tank.
If the expected demand exceeds the state-of-charge, but there is no threat of run out in the following hour,
a decision must be made to minimize energy consumption while avoiding the potential run out. We now
look at the following: number of hours until the tank will run out of hot water, the expected demand until
runout, and the expected hourly capacity to produce hot water. One of three scenarios will then play out
depending on the current conditions:
• Running compressor at all hours until runout that are cheaper than the present will meet or exceed
demand
o We don't need to add charge now and can drop the setpoint to the minimum
• Running compressor at all hours until runout will meet or exceed demand
o We need to start adding charge now and therefore choose the default setpoint
• Running compressor at all hours until runout will not produce enough water to meet demand
o We need to charge the tank by any means necessary to avoid runout and therefore must
increase to the maximum setpoint
This method utilizes knowledge of the energy stored in the tank to inform decisions of when to run and
when not to run. The concept should save energy by not running unnecessarily, allowing the tank
temperature to drift down when no large draws are expected in the near-term. It should also help avoid
run-out events by adding energy to the tank when needed.
In practice, the simulation runs that utilized this strategy led to higher costs and more runouts than both
the Optimal Price and Load-up/Shed strategies. This can mostly be attributed to the divergence of the
draw patterns from the average draw profile that was used as a basis of decision making in the algorithm.
This draw profile is the average across all house sizes and climate zones. As discussed previously, the
simulations were run using the 50th, 75th, and 90th percentiles of this profile.
In an extreme case, the 50th percentile expected load is much too low for a 5-bedroom house. This leads to
more runouts than in the base case because the tank isn’t expecting a big enough need for hot water.
Conversely, in the 1-bedroom case, the 50th percentile expected load is too large, so the tank is kept
unnecessarily warm. If a large water draw was anticipated and the price was relatively inexpensive, the
tank was heated. If this hot water draw never materialized, then the tank was heated unnecessarily.
In testing, it was also found that the “realistic” cases generally performed worse than the “ideal” cases. In
the former, there is simply not enough information about the state-of-charge inside the tank. Most
integrated HPWHs have two temperature measurements; one nearly the bottom of the tank and one near
the top. Therefore, because the tanks are always stratified, the tank knows three states. The thermocline is:
below the bottom temperature sensor, between the two sensors, or above the top sensor. There is a large
volume between the two sensors where most of the important action occurs. Not knowing if you have 15
gallons or 40 gallons of hot water is a big problem for predicting what to do. The upshot is that, in order
to get the state-of-charge algorithm to work in the physical world, you need more temperature sensors (or
a flow meter on the tank). A total of 6 sensors were used in the ideal case for this simulation.
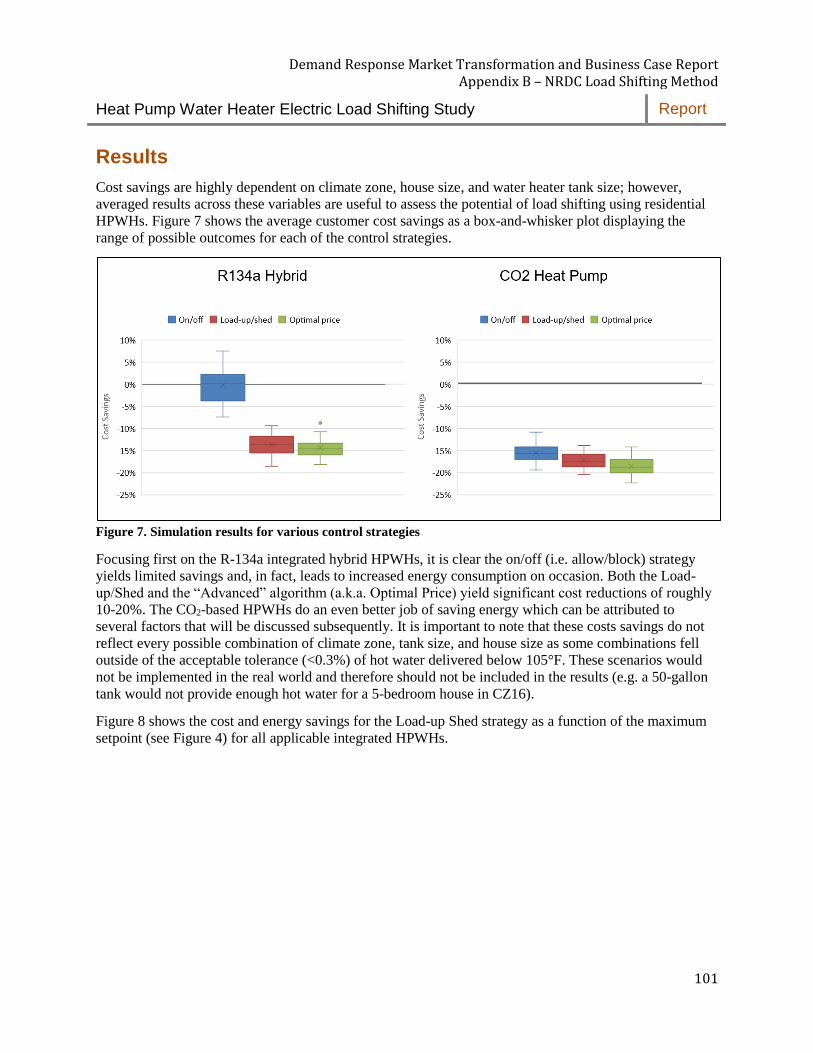
Demand Response Market Transformation and Business Case Report Appendix B – NRDC Load Shifting Method
Heat Pump Water Heater Electric Load Shifting Study Report
101
Results
Cost savings are highly dependent on climate zone, house size, and water heater tank size; however,
averaged results across these variables are useful to assess the potential of load shifting using residential
HPWHs. Figure 7 shows the average customer cost savings as a box-and-whisker plot displaying the
range of possible outcomes for each of the control strategies.
Figure 7. Simulation results for various control strategies
Focusing first on the R-134a integrated hybrid HPWHs, it is clear the on/off (i.e. allow/block) strategy
yields limited savings and, in fact, leads to increased energy consumption on occasion. Both the Load-
up/Shed and the “Advanced” algorithm (a.k.a. Optimal Price) yield significant cost reductions of roughly
10-20%. The CO2-based HPWHs do an even better job of saving energy which can be attributed to
several factors that will be discussed subsequently. It is important to note that these costs savings do not
reflect every possible combination of climate zone, tank size, and house size as some combinations fell
outside of the acceptable tolerance (<0.3%) of hot water delivered below 105°F. These scenarios would
not be implemented in the real world and therefore should not be included in the results (e.g. a 50-gallon
tank would not provide enough hot water for a 5-bedroom house in CZ16).
Figure 8 shows the cost and energy savings for the Load-up Shed strategy as a function of the maximum
setpoint (see Figure 4) for all applicable integrated HPWHs.
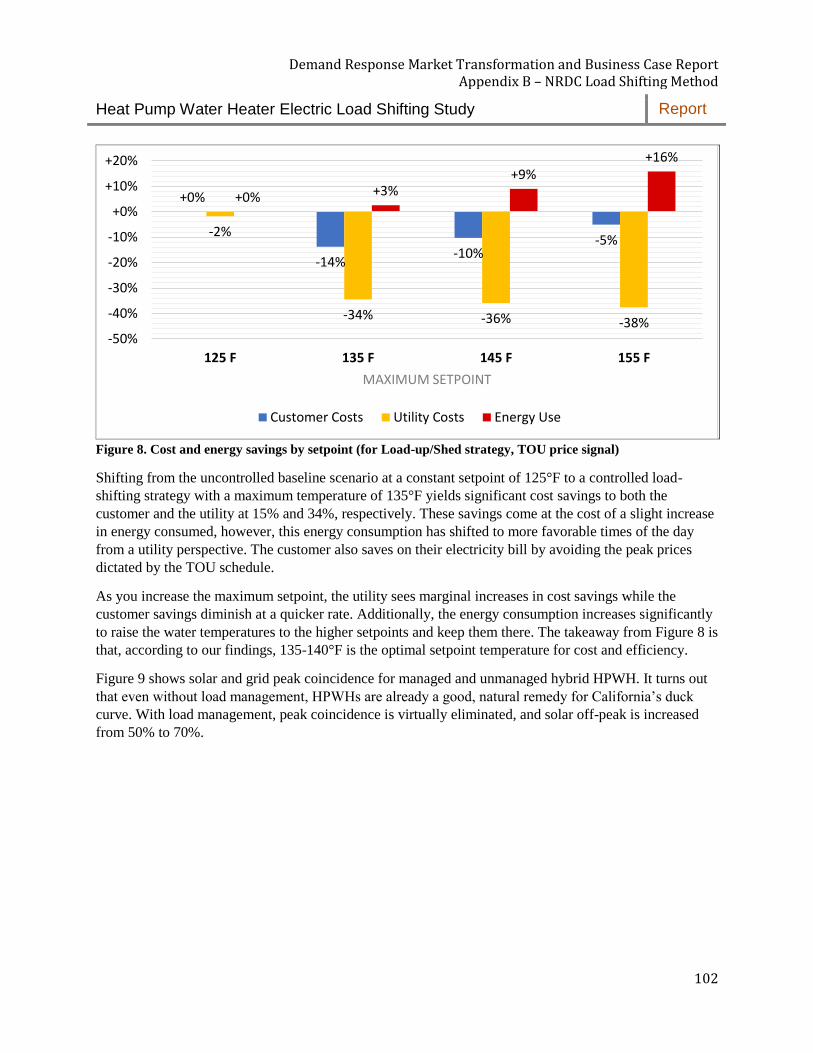
Demand Response Market Transformation and Business Case Report Appendix B – NRDC Load Shifting Method
Heat Pump Water Heater Electric Load Shifting Study Report
102
Figure 8. Cost and energy savings by setpoint (for Load-up/Shed strategy, TOU price signal)
Shifting from the uncontrolled baseline scenario at a constant setpoint of 125°F to a controlled load-
shifting strategy with a maximum temperature of 135°F yields significant cost savings to both the
customer and the utility at 15% and 34%, respectively. These savings come at the cost of a slight increase
in energy consumed, however, this energy consumption has shifted to more favorable times of the day
from a utility perspective. The customer also saves on their electricity bill by avoiding the peak prices
dictated by the TOU schedule.
As you increase the maximum setpoint, the utility sees marginal increases in cost savings while the
customer savings diminish at a quicker rate. Additionally, the energy consumption increases significantly
to raise the water temperatures to the higher setpoints and keep them there. The takeaway from Figure 8 is
that, according to our findings, 135-140°F is the optimal setpoint temperature for cost and efficiency.
Figure 9 shows solar and grid peak coincidence for managed and unmanaged hybrid HPWH. It turns out
that even without load management, HPWHs are already a good, natural remedy for California’s duck
curve. With load management, peak coincidence is virtually eliminated, and solar off-peak is increased
from 50% to 70%.
+0%
-14%-10%
-5%-2%
-34% -36% -38%
+0% +3%+9%
+16%
-50%
-40%
-30%
-20%
-10%
+0%
+10%
+20%
125 F 135 F 145 F 155 F
MAXIMUM SETPOINT
Customer Costs Utility Costs Energy Use
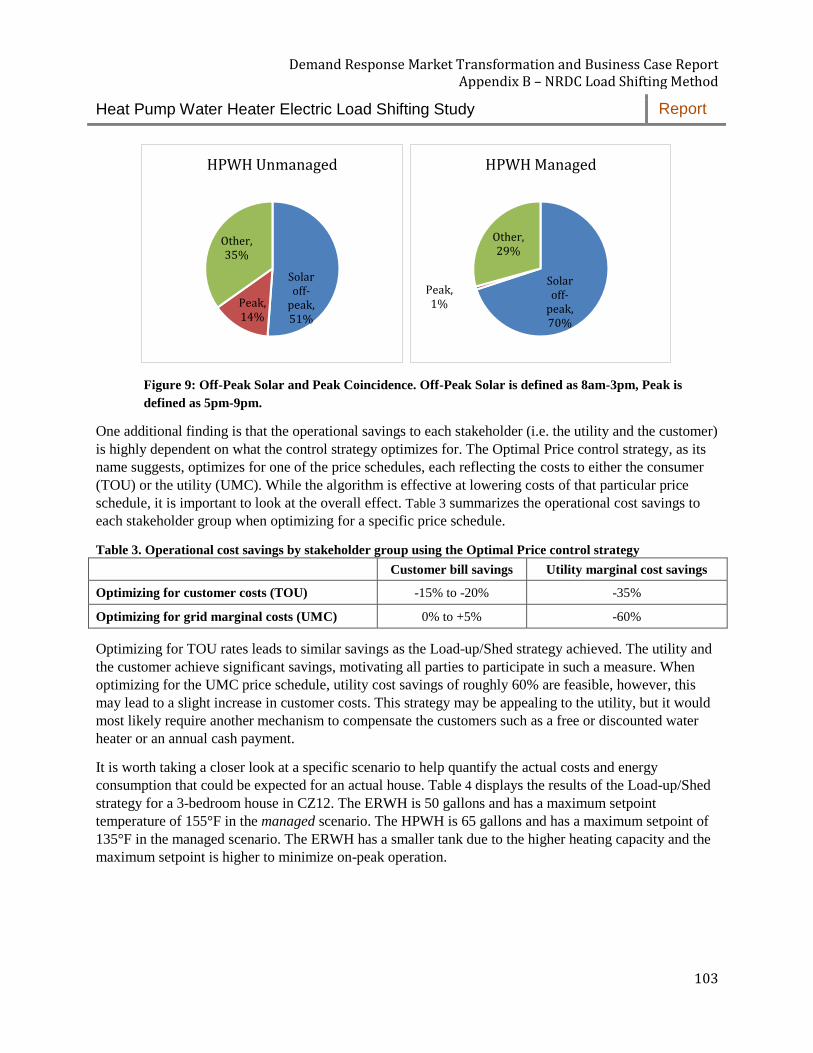
Demand Response Market Transformation and Business Case Report Appendix B – NRDC Load Shifting Method
Heat Pump Water Heater Electric Load Shifting Study Report
103
Figure 9: Off-Peak Solar and Peak Coincidence. Off-Peak Solar is defined as 8am-3pm, Peak is
defined as 5pm-9pm.
One additional finding is that the operational savings to each stakeholder (i.e. the utility and the customer)
is highly dependent on what the control strategy optimizes for. The Optimal Price control strategy, as its
name suggests, optimizes for one of the price schedules, each reflecting the costs to either the consumer
(TOU) or the utility (UMC). While the algorithm is effective at lowering costs of that particular price
schedule, it is important to look at the overall effect. Table 3 summarizes the operational cost savings to
each stakeholder group when optimizing for a specific price schedule.
Table 3. Operational cost savings by stakeholder group using the Optimal Price control strategy
Customer bill savings Utility marginal cost savings
Optimizing for customer costs (TOU) -15% to -20% -35%
Optimizing for grid marginal costs (UMC) 0% to +5% -60%
Optimizing for TOU rates leads to similar savings as the Load-up/Shed strategy achieved. The utility and
the customer achieve significant savings, motivating all parties to participate in such a measure. When
optimizing for the UMC price schedule, utility cost savings of roughly 60% are feasible, however, this
may lead to a slight increase in customer costs. This strategy may be appealing to the utility, but it would
most likely require another mechanism to compensate the customers such as a free or discounted water
heater or an annual cash payment.
It is worth taking a closer look at a specific scenario to help quantify the actual costs and energy
consumption that could be expected for an actual house. Table 4 displays the results of the Load-up/Shed
strategy for a 3-bedroom house in CZ12. The ERWH is 50 gallons and has a maximum setpoint
temperature of 155°F in the managed scenario. The HPWH is 65 gallons and has a maximum setpoint of
135°F in the managed scenario. The ERWH has a smaller tank due to the higher heating capacity and the
maximum setpoint is higher to minimize on-peak operation.
Solar off-
peak, 51%
Peak, 14%
Other, 35%
HPWH Unmanaged
Solar off-
peak, 70%
Peak, 1%
Other, 29%
HPWH Managed
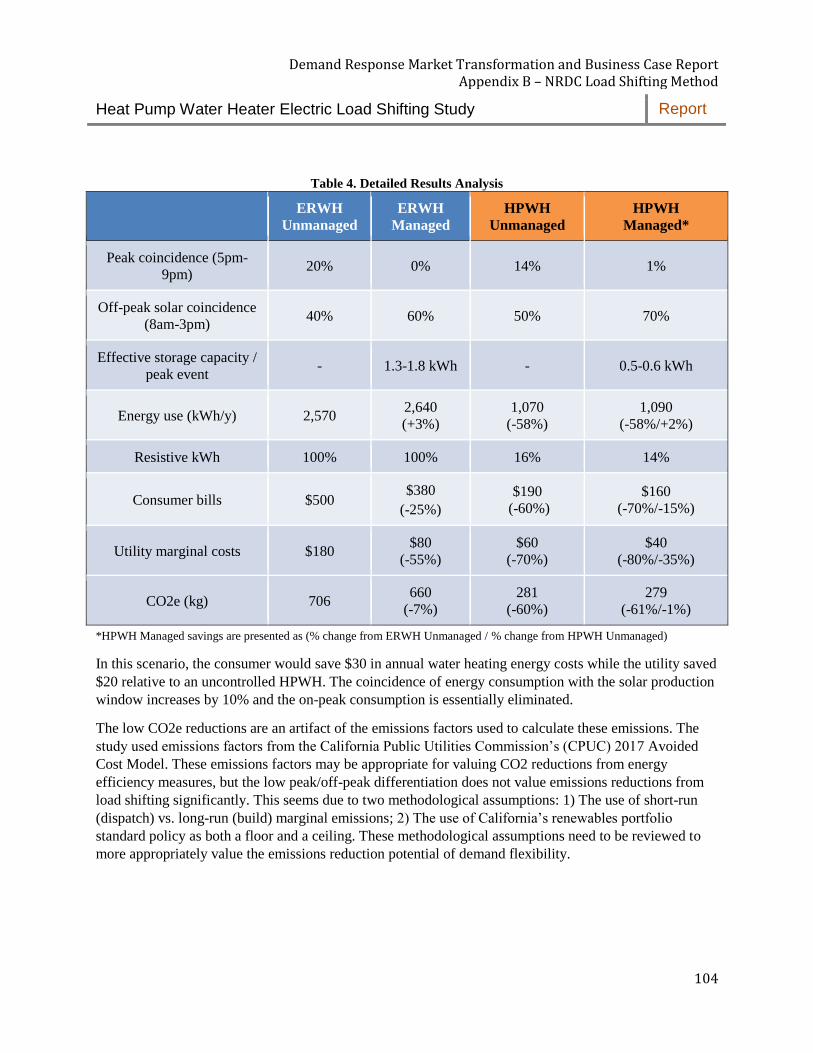
Demand Response Market Transformation and Business Case Report Appendix B – NRDC Load Shifting Method
Heat Pump Water Heater Electric Load Shifting Study Report
104
Table 4. Detailed Results Analysis
ERWH
Unmanaged
ERWH
Managed
HPWH
Unmanaged
HPWH
Managed*
Peak coincidence (5pm-
9pm) 20% 0% 14% 1%
Off-peak solar coincidence
(8am-3pm) 40% 60% 50% 70%
Effective storage capacity /
peak event - 1.3-1.8 kWh - 0.5-0.6 kWh
Energy use (kWh/y) 2,570 2,640
(+3%)
1,070
(-58%)
1,090
(-58%/+2%)
Resistive kWh 100% 100% 16% 14%
Consumer bills $500 $380
(-25%)
$190
(-60%)
$160
(-70%/-15%)
Utility marginal costs $180 $80
(-55%)
$60
(-70%)
$40
(-80%/-35%)
CO2e (kg) 706 660
(-7%)
281
(-60%)
279
(-61%/-1%)
*HPWH Managed savings are presented as (% change from ERWH Unmanaged / % change from HPWH Unmanaged)
In this scenario, the consumer would save $30 in annual water heating energy costs while the utility saved
$20 relative to an uncontrolled HPWH. The coincidence of energy consumption with the solar production
window increases by 10% and the on-peak consumption is essentially eliminated.
The low CO2e reductions are an artifact of the emissions factors used to calculate these emissions. The
study used emissions factors from the California Public Utilities Commission’s (CPUC) 2017 Avoided
Cost Model. These emissions factors may be appropriate for valuing CO2 reductions from energy
efficiency measures, but the low peak/off-peak differentiation does not value emissions reductions from
load shifting significantly. This seems due to two methodological assumptions: 1) The use of short-run
(dispatch) vs. long-run (build) marginal emissions; 2) The use of California’s renewables portfolio
standard policy as both a floor and a ceiling. These methodological assumptions need to be reviewed to
more appropriately value the emissions reduction potential of demand flexibility.
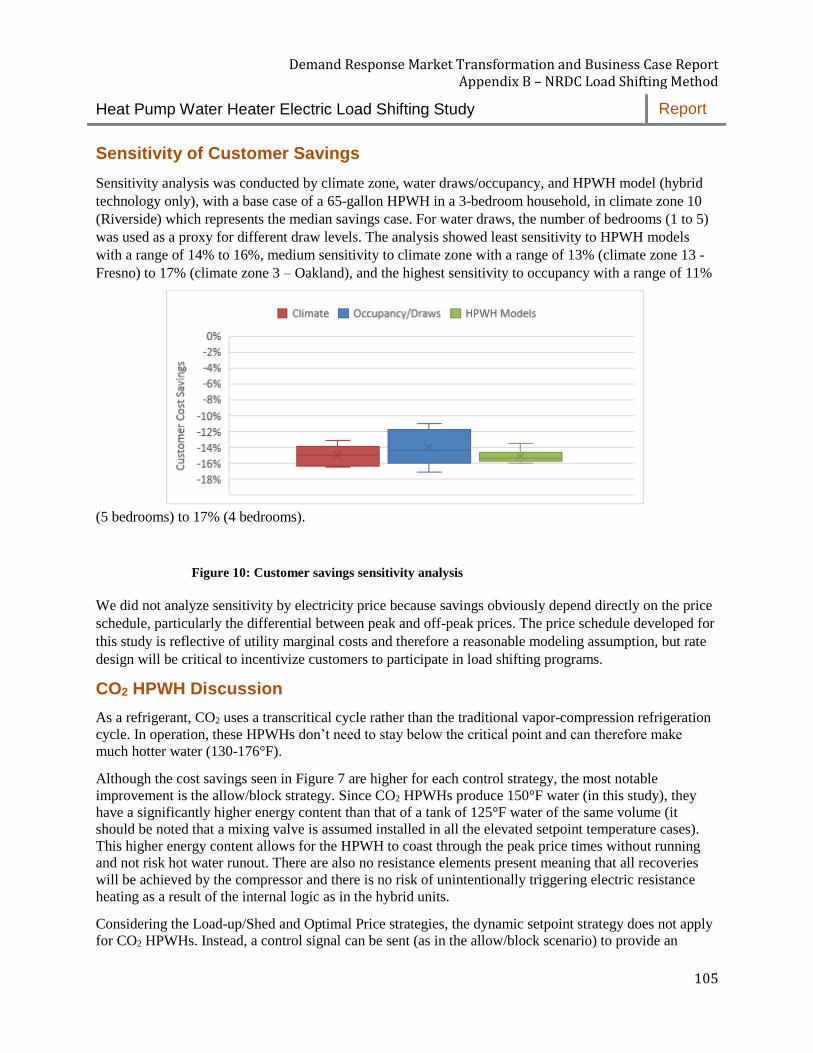
Demand Response Market Transformation and Business Case Report Appendix B – NRDC Load Shifting Method
Heat Pump Water Heater Electric Load Shifting Study Report
105
Sensitivity of Customer Savings
Sensitivity analysis was conducted by climate zone, water draws/occupancy, and HPWH model (hybrid
technology only), with a base case of a 65-gallon HPWH in a 3-bedroom household, in climate zone 10
(Riverside) which represents the median savings case. For water draws, the number of bedrooms (1 to 5)
was used as a proxy for different draw levels. The analysis showed least sensitivity to HPWH models
with a range of 14% to 16%, medium sensitivity to climate zone with a range of 13% (climate zone 13 -
Fresno) to 17% (climate zone 3 – Oakland), and the highest sensitivity to occupancy with a range of 11%
(5 bedrooms) to 17% (4 bedrooms).
Figure 10: Customer savings sensitivity analysis
We did not analyze sensitivity by electricity price because savings obviously depend directly on the price
schedule, particularly the differential between peak and off-peak prices. The price schedule developed for
this study is reflective of utility marginal costs and therefore a reasonable modeling assumption, but rate
design will be critical to incentivize customers to participate in load shifting programs.
CO2 HPWH Discussion
As a refrigerant, CO2 uses a transcritical cycle rather than the traditional vapor-compression refrigeration
cycle. In operation, these HPWHs don’t need to stay below the critical point and can therefore make
much hotter water (130-176°F).
Although the cost savings seen in Figure 7 are higher for each control strategy, the most notable
improvement is the allow/block strategy. Since CO2 HPWHs produce 150°F water (in this study), they
have a significantly higher energy content than that of a tank of 125°F water of the same volume (it
should be noted that a mixing valve is assumed installed in all the elevated setpoint temperature cases).
This higher energy content allows for the HPWH to coast through the peak price times without running
and not risk hot water runout. There are also no resistance elements present meaning that all recoveries
will be achieved by the compressor and there is no risk of unintentionally triggering electric resistance
heating as a result of the internal logic as in the hybrid units.
Considering the Load-up/Shed and Optimal Price strategies, the dynamic setpoint strategy does not apply
for CO2 HPWHs. Instead, a control signal can be sent (as in the allow/block scenario) to provide an
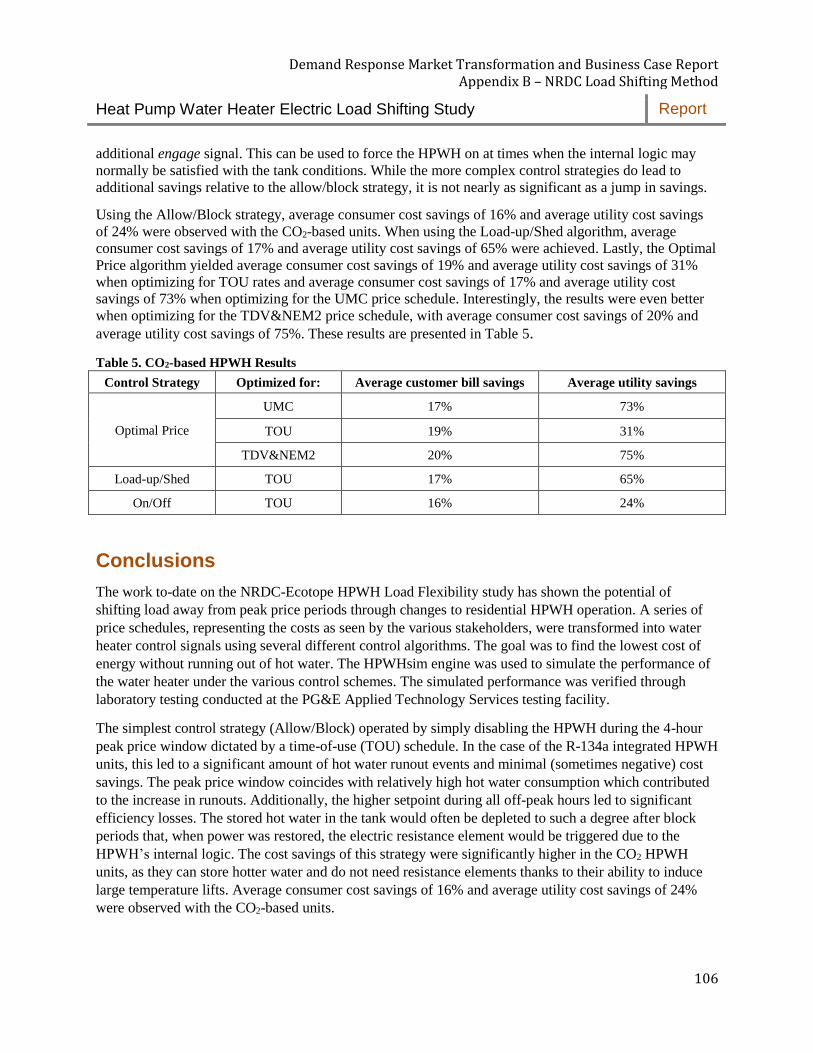
Demand Response Market Transformation and Business Case Report Appendix B – NRDC Load Shifting Method
Heat Pump Water Heater Electric Load Shifting Study Report
106
additional engage signal. This can be used to force the HPWH on at times when the internal logic may
normally be satisfied with the tank conditions. While the more complex control strategies do lead to
additional savings relative to the allow/block strategy, it is not nearly as significant as a jump in savings.
Using the Allow/Block strategy, average consumer cost savings of 16% and average utility cost savings
of 24% were observed with the CO2-based units. When using the Load-up/Shed algorithm, average
consumer cost savings of 17% and average utility cost savings of 65% were achieved. Lastly, the Optimal
Price algorithm yielded average consumer cost savings of 19% and average utility cost savings of 31%
when optimizing for TOU rates and average consumer cost savings of 17% and average utility cost
savings of 73% when optimizing for the UMC price schedule. Interestingly, the results were even better
when optimizing for the TDV&NEM2 price schedule, with average consumer cost savings of 20% and
average utility cost savings of 75%. These results are presented in Table 5.
Table 5. CO2-based HPWH Results
Control Strategy Optimized for: Average customer bill savings Average utility savings
Optimal Price
UMC 17% 73%
TOU 19% 31%
TDV&NEM2 20% 75%
Load-up/Shed TOU 17% 65%
On/Off TOU 16% 24%
Conclusions
The work to-date on the NRDC-Ecotope HPWH Load Flexibility study has shown the potential of
shifting load away from peak price periods through changes to residential HPWH operation. A series of
price schedules, representing the costs as seen by the various stakeholders, were transformed into water
heater control signals using several different control algorithms. The goal was to find the lowest cost of
energy without running out of hot water. The HPWHsim engine was used to simulate the performance of
the water heater under the various control schemes. The simulated performance was verified through
laboratory testing conducted at the PG&E Applied Technology Services testing facility.
The simplest control strategy (Allow/Block) operated by simply disabling the HPWH during the 4-hour
peak price window dictated by a time-of-use (TOU) schedule. In the case of the R-134a integrated HPWH
units, this led to a significant amount of hot water runout events and minimal (sometimes negative) cost
savings. The peak price window coincides with relatively high hot water consumption which contributed
to the increase in runouts. Additionally, the higher setpoint during all off-peak hours led to significant
efficiency losses. The stored hot water in the tank would often be depleted to such a degree after block
periods that, when power was restored, the electric resistance element would be triggered due to the
HPWH’s internal logic. The cost savings of this strategy were significantly higher in the CO2 HPWH
units, as they can store hotter water and do not need resistance elements thanks to their ability to induce
large temperature lifts. Average consumer cost savings of 16% and average utility cost savings of 24%
were observed with the CO2-based units.

Demand Response Market Transformation and Business Case Report Appendix B – NRDC Load Shifting Method
Heat Pump Water Heater Electric Load Shifting Study Report
107
The more sophisticated Load-up/Shed strategy attempted to resolve the issues of the Allow/Block strategy
without adding too much additional complexity. Since runouts during the “Block” periods were an issue
in the previous strategy, a “Load-up” period was added prior to the peak price times to add energy to the
tanks. To accomplish this, a setpoint schedule was created that progressively transitioned between high
and low setpoints to trick the HPWH to run at less expensive times and not run at peak times. Three
different maximum setpoints were investigated in an attempt to identify the point at which raising the
setpoint becomes counterproductive.
Under the Load-up/Shed control strategy, customer energy costs were reduced by roughly 10-20% for
appropriately sized integrated HPWHs with a maximum setpoint temperature of 135°F. Above this
setpoint, marginal reductions in utility costs were observed, but at the expense of significantly lower
customer savings and higher energy consumption. While reducing customer costs was the primary goal in
this scenario (due to the TOU rate schedule that it was based off), the utility also saw a reduction in costs
of approximately 34-35%. This makes sense since the TOU rate schedule is designed to help avoid
producing power at peak times and to utilize times when generation is less expensive. Improvements from
the Allow/Block strategy were also seen in the CO2 HPWH units, showing average consumer cost savings
of 17% and average utility cost savings of 65%.
The Optimal Price control strategy, as its name suggests, optimizes for one of the price schedules, each
reflecting the costs to either the consumer (TOU) or the utility (utility marginal costs). While the previous
two strategies can only be applied to a fixed TOU-style rate schedule, this algorithm works with any price
schedule, regardless how dynamic it is. Utility marginal costs (UMC) factors in the costs of energy,
emissions, capacity, transmission and distribution of electricity and are quite sensitive to these
parameters, leading to a fairly dynamic schedule. The Optimal Price algorithm looks ahead at the
upcoming UMC prices and determines a setpoint based on the “load shifting severity” (or spread) of the
given prices. If the upcoming prices are relatively similar, the water heater is encouraged to remain at the
default setpoint since there is little cost benefit to load shifting and potentially heavy energy impacts.
Conversely, when a significant price spike is forecasted, load shifting becomes more desirable and the
water heater is encouraged to vary it’s setpoint to avoid peak times and take advantage of inexpensive
times.
Optimizing for customer savings (TOU) leads to similar savings as the Load-up/Shed strategy achieved.
The utility and the customer achieve significant savings, motivating all parties to participate in such a
measure. When optimizing for the UMC price schedule, utility cost savings of approximately 60% are
feasible, however, this may lead to a slight increase in customer costs. This strategy may be appealing to
the utility, but it would most likely require another mechanism to compensate the customers such as a free
or discounted water heater or an annual cash payment. Again, the CO2 HPWH units achieved greater
savings with the more advanced control strategy, achieving average consumer cost savings of 19% and
average utility cost savings of 31% when optimizing for TOU rates. Optimizing for the UMC price
schedule yields average consumer cost savings of 17% and average utility cost savings of 73%.
A fourth control strategy deemed the State-of-Charge algorithm was investigated. The idea of this
strategy was to utilize knowledge of the energy stored in the tank and a predicted water draw profile to
inform decisions of when to run and when not to run. Theoretically, this concept would save energy by
not running the HPWH unnecessarily, allowing the tank temperature to drift down when no large draws
were expected. It would also help avoid run-out events by adding energy to the tank when needed. In
Demand Response Market Transformation and Business Case Report Appendix B – NRDC Load Shifting Method
Heat Pump Water Heater Electric Load Shifting Study Report
108
practice, however, the concept was limited by the fact that real draw patterns are unpredictable and often
stray from the average profile. A predictive algorithm that learns the occupants’ behavior may help
overcome this issue and increase the load shifting potential.
This study was not intended to find the absolute maximum benefits to load shifting HPWHs, but to
demonstrate that the benefit potential is significant. We trust that manufacturers and load management
aggregators will create even more effective algorithms to maximize customer and societal benefits. To
this end, the study was successful in demonstrating the savings potential of load shifting to both the utility
and the customer.
Demand Response Market Transformation and Business Case Report Appendix B – NRDC Load Shifting Method
Heat Pump Water Heater Electric Load Shifting Study Report
109
References
California Energy Commission. (2017). Time Dependent Valuation of Energy for Developing Building Efficiency Standards. Retrieved from http://www.energy.ca.gov/title24/2013standards/prerulemaking/documents/general_cec_documents/Title24_2013_TDV_Methodology_Report_23Feb2011.pdf
Ecotope Inc. (2015). Heat Pump Water Heater Model Validation. Retrieved from https://neea.org/resources/heat-pump-water-heater-model-validation-study
Kvaltine, N., & Larson, B. (2015a). Laboratory Assessment of A.O. Smith HPTU Series Heat Pump Water Heaters. Retrieved from http://neea.org/docs/default-source/lab-test-reports/hpwh-lab-report_ao-smith_hptu_12-09-2015.pdf?sfvrsn=2
Kvaltine, N., & Larson, B. (2015b). Laboratory Assessment of Stiebel-Eltron Accelera 220 E Heat Pump Water Heater. Retrieved from http://neea.org/docs/default-source/lab-test-reports/hpwh-lab-report_stiebel_220e_07-15-2015.pdf?sfvrsn=4
Larson, B., & Kvaltine, N. (2015). Laboratory Assessment of GE GEH50DFEJSRA Heat Pump Water Heater. Retrieved from http://neea.org/docs/default-source/lab-test-reports/hpwh-lab-report_ge_h50dfejsra_04-09-2015.pdf?sfvrsn=2
Regional Technical Forum. (2018). Residential Heat Pump Water Heater UES Update. Retrieved from https://nwcouncil.app.box.com/v/20180130ResHPWHPres
Demand Response Market Transformation and Business Case Report Appendix C – CTA-2045 Commands and Related Specifications
Introduction
110
Appendix C – CTA-2045 Commands and Related Specifications C-1. Introduction As utilities wrestle with how to integrate “smart grid home appliances,” it is key to have common standards, connections, and communication protocols as well as certifications. CTA 2045 is one of the key enabling standards to promote and ease the integration of major electric loads; central to this report, especially, is CTA-2045 for electric water heaters, both resistance and HPWHs. With any Market Transformation effort, there is a mixture of codes, standards, certifications, testing requirements, and labels to distinguish different levels of performance. Part of the ultimate Market Transformation plan is to incorporate CTA-2045 (see logic model in Appendix I – Market Transformation Plan) in ratings such as Department of Energy (DOE), ENERGY STAR, California Energy Commission (CEC), and other nationally- and or internationally-recognized organizations. At this point CTA-2045 is gaining some traction, but for it to become a standard and/or code, it will need significant traction in voluntary programs such as the ones listed below in order to build a following: Advanced Water Heating Specification (AWHS) and CEE Water Heating Specification. This appendix begins with an overview and background of the ANSI/CTA-2045 standard and then follows with three specifications that cite the use of CTA-2045. These three specifications should be used as reference only.
• The first specification (published in 2016) is the AWHS (see Section C-3), published and promoted by NEEA. CTA-2045 is clearly delineated in the tier levels, although the testing and certification is light. NEEA is in the process of updating this voluntary specification to better describe the requirements of CTA-2045 and how it is verified.
• The second (published in 2018) is the CEE Water Heating specification (see Section C-4), in which CTA 2045 and other open architecture protocols are clearly called out.
• Finally, the third reference is the CEC Title 24 Draft Specification Q2 2018 (see Section C-5).
For more in-depth information on each of these specifications, it is recommended the reader reach out to the originating organizations.

Demand Response Market Transformation and Business Case Report Appendix C – CTA-2045 Commands and Related Specifications
CTA-2045 Background and Future
111
C-2. CTA-2045 Background and Future “ANSI/CTA‐2045,” CTA-2045 for short, refers to a specification published by the Consumer Technology Association (CTA) and dual‐listed by the American National Standards Institute (ANSI). As an open standard, it available to anyone.36
History & Purpose From 2008 through 2012, this national standard was created through the collective effort of EPRI, the Smart Grid Interoperability Panel (SGIP),37 manufacturers, utilities, and a number of standards experts from the high‐tech industry. The most important purpose of the standard is to define how to pass information between two devices through a defined physical, data interface, also referred to as socket or port. The specification defines two devices: the primary device is called the smart grid device (SGD), which could be any significant appliance such as a water heater. The second device is called the universal communication module (UCM). The design of the standard is generic; a UCM will never know what type of appliance it might get plugged into, and the SGD does not care about where or how the UCM sends data to somebody or something. The standard defines specifications at three communication layers.38 The physical layer at the SGD defines the physical dimensions of the socket, the pins that carry power to the 36 The standard can be downloaded for free at https://members.cta.tech/ctaPublicationDetails/?id=3bef3c65-081c-e811-90cf-0003ff52c08a. 37 SGIP (the Smart Grid Interoperability Panel), a group of 700 diverse industry stakeholders, was formed in 2008 by NIST as directed by Congress as part of its responsibilities under the Energy Independence and Security Act of 2007. 38 The discipline of communication engineering has broken down communication between two devices or people into seven communication layers as described in the overview https://www.webopedia.com/quick_ref/OSI_Layers.asp. One key takeaway should be that there is no such thing as a single communication standard. The most basic types of communication between devices or even human to human rely on defining at least three separate standards: one at the physical layer, the data link layer, and the application layer. As humans, we are born with the same physical layers (sensors and annunciators) that we more commonly call eyes, ears, and vocal cords. We learn the data link layer (how to start, stop, and format oral and written conversations) as we grow up. The most obvious difference between human communications is the application layer or what we call language: English, Chinese, Swahili, etc. As with computers, the purpose of the application language is to convey concepts between two people e.g., “John, cross the road.” The concept just stated in English can be conveyed in any language, but unless you know that language you won’t be able to communicate. With the power of today’s computers, we can translate languages using, for example, Google Translate. This idea, which is easy for computers to translate language, is also relevant to digital communication at the application layer between devices. As with humans, it is the most costly communication layer, if not standardized. The cost of a human coping with deafness or blindness is considerable. The most important part of the CTA-2045 standard is the physical layer, because without a standard physical layer we need a different physical communication device to connect with each appliance in the home. In the digital world, physical devices consume a disproportionate amount of the cost in communication to mass market devices. The best way to lower cost is through a single physical standard so that economies of scale can lower the cost of making the device. As an analogy, consider that every 120-volt
Demand Response Market Transformation and Business Case Report Appendix C – CTA-2045 Commands and Related Specifications
CTA-2045 Background and Future
112
UCM, and the pins that carry digital information. The data link layer allows the UCM to discover what kind of appliance it is, the model number, the firmware version on which it operates, and most importantly, the DR language it speaks. The third layer defined in the CTA-2045 specification is a mostly optional application layer. The application layer is where the demand response commands live, for example start a shed that last 4 hours; the grid price is high; consume more energy if possible, etc. However, the standard was built fully expecting that the manufacturers might choose to use a different open standard such as OpenADR, SEP 2.0 (IEEE 2030.5), BACnet, etc. More importantly, the standard anticipates the creation of new DR application languages. The data link layer of CTA-2045 allows the UCM to discover which of these languages the SGD prefers to speak, and then to use that language. The application language spoken by the SGDs in this pilot used the application layer of CTA-2045, mostly because the manufacturers had already started using the language or were open to using that language. We were also limited to UCM vendors that had proven products that could speak the CTA-2045 application language. However, the most important reason to use the CTA-2045 application language is because demand responsive behavior is defined for CTA-2045 commands. OpenADR was created by LBNL specifically to allow reliable and secure internet-based communications for commercial and industrial DR applications. OpenADR is ideal in these settings because behind the end-node that receives the shed commands from a utility or aggregator is an energy management system that all buildings or process engineers use to control and monitor individual loads such as chillers, lighting, and ventilation, etc. In other words, OpenADR excels at launching and ending DR events because the response at each building or industrial process is determined or approved by an energy management professional. However, in 99% of homes there is no energy control professional and more guidance is needed than a simple command to start or stop. As mentioned earlier, CTA-2045 commands are structured for any major residential appliance; however, not all commands make sense for all appliances. From 2013 through 2016, EPRI managed a consortium of 20 utilities and about eight manufacturers for the purpose of defining how a specific type of appliance would respond to a generic CTA-2045 command. The process began with utilities stating how they would like manufacturers to
appliance in your home came with a different type of plug and you had to buy an adapter for every lamp, kitchen appliance, hair dryer, electronic device, etc. You would demand a standard for convenience and to avoid the cost of the adapter. In fact, every appliance maker already bears the cost of a power cord; the cost to standardize on a single plug design is only the cost of cooperation. In the world of smart appliances, today, every manufacturer is shipping products with a different physical communication interface; this cost burden of proprietary interfaces is the single biggest factor in limiting the growth of demand response with smart appliances. The requirement to adopt the physical layer of the CTA-2045 standard could change the trajectory dramatically.
Demand Response Market Transformation and Business Case Report Appendix C – CTA-2045 Commands and Related Specifications
CTA-2045 Background and Future
113
respond to a command. The manufacturers considered the request and countered with what they could actually do. The process iterated until EPRI drafted a specification to which all parties could agree. As a result, EPRI has published in the public domain demand responsive specifications for resistance water heaters, heat pump water heaters, EV chargers, pool pumps, water heater retrofit control switches, and thermostats. Through AHRI 1380 (proposed), demand responsive behavior has been defined for advanced variable speed heat pumps. These demand responsive specifications were built into a prototype product made the manufacturers that was delivered to utilities for testing in residential homes. This EPRI project proved the robustness and interoperability of the CTA-2045 specification. Additionally, this proved the same UCM from a communication vendor such as e-Radio could be “plugged” into an EV charger or a water heater or pool pump, and the desired DR response for each appliance would take place using the same generic CTA commands issued by the utility. Also, any of the three different UCM vendors/products could be substituted in one appliance, and this time, regardless of UCM vendor, the same demand responsive behavior would occur at the appliance. As the 2013-2016 EPRI project was winding down, BPA and PGE, which were two of the 20 participating utilities, seized on the success of the EPRI project to move the CTA-2045 technology to the next scale of commercial implementation. Chapter 2 of this report describes how this project was launched. As this project progressed, lessons learned from all implementations were incorporated through the CTA standard revision process and on March 15, 2018, CTA-2045-A was published to replace CTA-2045. The new standard is backward-compatible with the old, but provides additional functionality. One important new function, which we had hoped to test in this project, is the more comfort/more savings feature. This feature allows the customer to provide input about how aggressively they want the grid to benefit, or conversely, allows the customer to put more emphasis on always having enough hot water. This feature was suggested by a manufacturer so that it would not have to implement the most conservative algorithm, which is what they do now because they must design for the most sensitive customers. With this feature, a future DR program design will cause a utility to motivate customers to select the most aggressive grid benefit option that works for their lifestyle.
The Socket Enables All Other Communication Standards The advantages of a “standard” socket compared to a proprietary socket is that it enables all other standards to communicate with each other. The following list of attributes speaks to some of the key advantages:
• It enables any external communication method placed inside the UCM, e.g., Wi‐Fi, Zigbee, 4G LTE, Z‐Wave, Bluetooth, FM broadcast, and any future method, e.g., 5G.
• It enables any DR command language used by a service provider, e.g., OpenADR, SEP 2.0, BACnet to be translated in the UCM to match any language used by the SGD.
Demand Response Market Transformation and Business Case Report Appendix C – CTA-2045 Commands and Related Specifications
CTA-2045 Background and Future
114
• It allows the customer to be in charge of how communication links to their appliances will occur.
• It future-proofs a long-lived appliance. The open standard will work exactly the same in 20 years when we have new communication methods. The customer may change the UCM to enable new business models or service providers, but the 15‐ to 30‐year life of the appliance will be as always be as functional as the day it was sold.
• A single, open socket standard means UCMs can be produced in volume, greatly lowering their price.
• There is no other suitable socket standard defined, except for USB. The UCM that gets “plugged in” to the socket will often incorporate additional layers of the communication model. The UCMs can be designed with infinite flexibility to enable any type of communication path to another device or devices anywhere. The socket relieves the manufacturer of all responsibility to implement and maintain a communication pathway and the constant security updates that come with a communication network. At the same time, using three layers of open protocols at the socket empowers every entrepreneur or intrapreneur to create innovative functionality on behalf of every customer that has a device with a CTA-2045 communication interface. “Three open layers of open protocols” is not a model that has emerged for smart appliances. Instead many vendors are implementing an approach called “open” in the internet cloud. Nothing about the open socket model prevents a manufacturer from implementing services in the cloud, but “open-in-the-cloud” means a proprietary application layer exists at the device and this does impose severe limitation on the growth of DR to higher costs for DR aggregators, complexity and/or reduced functionality for customers, and restricted innovation by entrepreneurs. Examples of problems created with open-in-the-cloud versus the approach of “three open layers of open protocols” at the device follow:
• About 16% of Americans do not have a broadband subscription in their household.39 “Open-in-the-cloud” means they cannot support a DR program. To implement DR, the communications link to the household must be continuous. Utilities in rural areas have other methods available to them with their smart meter networks, or they can implement an FM communication control path, as was demonstrated in this project. Non-subscription is more concentrated in rural areas that have a higher usage of electricity per household, and where DR programs are most cost-effective. Just as customers have dropped terrestrial-based phone lines in favor of mobile phones, the percentage of terrestrial-based broadband is likely to decrease in the
39 https://www.statista.com/statistics/185602/broadband-and-dial-up-internet-connection-usage-in-the-us/
Demand Response Market Transformation and Business Case Report Appendix C – CTA-2045 Commands and Related Specifications
CTA-2045 Background and Future
115
future as customers drop the terrestrial connection as speeds increase and costs per gigabyte drop with mobile 5G phone service.
• At scale, third-party cybersecurity methods may not meet North American Electric Reliability Corporation (NERC) and Federal Energy Regulatory Commission (FERC) requirements.
• This approach is contrary to the proven open model that puts the customer in charge of putting apps on their smartphone.
• It requires the cost of a bilateral legal agreement between every energy service provider and the manufacturer of a load worthy of control. Picture 40 major device makers and 2,000 utilities; now picture 80,000 legal agreements that would have to be created and maintained.
• The third party has the right to change its application interface to the energy service provider, even if only to provide enhancements; now picture 2,000 IT departments having to modify interfaces to 40 major manufacturers.
• The added costs of working through a third party, altogether unnecessary in an open model, would make control of many loads cost-prohibitive.
• It complicates the enrollment process for the customer and they wouldn’t have a direct line of sight to their energy provider, who is the source of any monetary benefits, not to mention diminished benefits to cover third-party costs.
• For some loads, such as water heaters that can be used multiple times per day, the required dynamic feedback through a third party is cumbersome, if not altogether impossible, based on the privacy policy the third party might have with its customer.
• Using Wi-Fi requires regular maintenance by the consumer. If changes occurred to a customer’s Wi-Fi or provider, all device connections would need to be re-established. Water heaters are a low priority for most consumers; unless they fail to provide hot water, most customers don’t even know what type or size water heater they have, let alone how or why to connect to it.
• It prevents the customer from determining the control approach they prefer. Specifically, it prevents or slows service through any alternative provider, e.g., their utility or “Alexa,” Siri, Google Home, or from home energy management systems that might emerge in the future.
The Future
As part of building a coalition to fund the market transformation plan of this report, a subset of the stakeholders plans to meet with water heater manufacturers and revisit the demand responsive functionality we expect the market transformation will deliver. The consensus will be codified in a table such as Table C-3 near the end of this appendix. The last column of the table shows the generic CTA-2045 application layer command, but an additional column could state the functionally-equivalent OpenADR command. EPRI has
Demand Response Market Transformation and Business Case Report Appendix C – CTA-2045 Commands and Related Specifications
CTA-2045 Background and Future
116
just completed (in September 2018) a mapping of equivalent OpenADR commands to equivalent CTA-2045 application layer commands. This specification will be placed into the public domain shortly.40 This mapping can easily be coded into a UCM so that a manufacturer or a DR aggregator can use the application language they prefer, and let a microprocessor and program code make the necessary translations. These “translations” are common with computers today and are better known as device drivers. The “drivers” get added to your computer every time you add a new device to your computer system. The most familiar might be the printer driver that gets installed before you can use your new printer. Another important part of the collaboration will define the types of telemetry data that get passed between the water heaters and the UCM. An example of this type of specification is Table C-4 near the end of this appendix. It should be pointed out that while utilities find the data described in this table highly valuable and at some statistical level critical to validation of program efficacy, the end-state of flexible loads responding dynamically to price and control signals will require a one-way signal path to a significant market segment that will oppose the type of data defined in Table C-4 being provided to anyone. The CTA-2045 approach allows the use of FM broadcast signals as demonstrated in this project. Not only will this satisfy customers seeking privacy, but as indicated in Section 4.5.2 of this report, this is also the least expensive way to communicate to hundreds of thousands of households at scale.
40 To obtain any of the open domain CTA-2045 products: demand responsive specifications, testing tools, CTA-2045 to OpenADR mapping, etc., contact Chuck Thomas at [email protected].

Demand Response Market Transformation and Business Case Report Appendix C – CTA-2045 Commands and Related Specifications
AWHS Specification
117
C-3. AWHS Specification
A Specification for Residential Water Heaters Advanced Water Heating Specification Formerly known as the Northern Climate Specification
Version 6.0
Updated May 10, 2016 Final
Background In the early 1980s, electric utilities in colder portions of North America introduced heat pump technology into the residential water heating market. Heat pump water heater programs have subsequently spanned three generations of technology and produced detailed measurements of technical performance and consumer acceptance. The experience gained from these programs yields definitive direction about key consumer needs as well as important technical and reliability criteria for proper application of this technology throughout a range of climates. The ENERGY STAR® program released its first specification for residential water heaters in 2008, which included qualifying criteria for heat pump water heaters (HPWHs). ENERGY STAR included requirements for efficiency (EF 2.0 or better), capacity (first hour rating 50 gallons per hour), longevity (warranty ≥ 6 years), and electrical safety (UL 174 and UL 1995). While these requirements are important, the ENERGY STAR program did not address critical performance and comfort issues that have inhibited widespread adoption of HPWHs in colder climates. In 2009, several major manufacturers launched integrated HPWH units in North American markets that were ENERGY STAR-qualified but failed to address key performance issues. While this specification initially focused on “Northern” climates (generally considered to be any location in the International Energy Conservation Code Climate Zones 4 or colder), it provides a framework that extends to other climates. By prioritizing heat pump use over resistance elements, additional performance-related functionality, and consumer satisfaction, this specification and testing methodology will produce high efficiency water heating in all climates.
1.0 Purpose This specification provides guidance to manufacturers and market actors who are interested in developing products that not only meet ENERGY STAR criteria but are able to provide high levels of consumer satisfaction and energy performance in a range of climates. The end goal of this effort is to ensure that the North American introduction of new generations of HPWH products will be as successful as possible to pave the way for HPWHs to become the standard product for the electric water heating market. The expansion of the additional tiers in this version of the specification is not meant to require manufacturers to provide product; instead, it is a guideline for where the specification will trend over the
Demand Response Market Transformation and Business Case Report Appendix C – CTA-2045 Commands and Related Specifications
AWHS Specification
118
next two to 10 years. For example, these tiers could be obtained by split systems and that test procedure is not yet defined in this document. Utilities and other entities that invest in market transformation programs and/or incentives require reliable energy savings. Accordingly, the specification is also intended as a foundational document for utility program efforts that will work in partnership with manufacturers to accelerate market adoption of HPWH for any American and Canadian climates. Using this specification will help to improve market acceptance, reduce the number of geographic targeted SKUs for manufacturers, and ensure the expected savings materialize and are persistent on the grid. This specification addresses key topics that fall into four main categories:
• Comfort/satisfaction – sufficient hot water for customer needs, exhaust air, noise, ease of installation, serviceability
• Performance - energy efficiency and savings, condensate management, freeze protection, user controls, reliability
• Consideration of challenging installations – central locations with limited access to heat sources
• Integration of demand response (DR)-enabling technologies as optional for Tier levels 1-3 and required for Tiers 4 & 5
2.0 Scope 2.1 Equipment Type. This specification covers integrated (with tank) electric heat pump water heaters.41 Heat pump water heaters configured to “add on” to existing storage tanks are not covered by this specification. “Split-system” units that separate the storage tank and the pump, as well as combination space + water systems, are not currently covered by this specification. A future version of this specification (or a related specification) will address these systems. 2.2 Applications. The focus of this specification is on replacements for existing electric resistance storage water heaters and alternatives to new electric resistance water heaters. As such, storage tanks shall be configured to meet the space installation and code requirements for typical electric resistance storage water heaters. Units meeting Tier 1 of this specification are expected to provide configuration options for semi-conditioned
41Electric heat pump water heater is defined as a water heater that uses electricity as the energy source, to power the compressor and all auxiliary equipment such as fans, pumps, controls, and any resistive elements. It is designed to transfer thermal energy from one temperature level to another for the purpose of heating water, and is designed to heat and store water at a thermostatically-controlled temperature.

Demand Response Market Transformation and Business Case Report Appendix C – CTA-2045 Commands and Related Specifications
AWHS Specification
119
spaces such as unheated basements and unconditioned spaces such as garages and crawl spaces. Units meeting Tiers 2 and above are expected to provide configuration options for semi-conditioned, unconditioned, and conditioned spaces such as heated utility rooms. Outside applications are not covered by this specification. 2.3 Climate. This specification is intended to ensure high performance in climates with 4,000 heating degree days or higher and average ambient temperatures below 60 degrees Fahrenheit. This equates roughly to locations in North America within the International Energy Conservation Code climate zones 4 or higher, herein referred to as “Northern climates.”42 Meeting performance standards in these climates ensures additional savings in all other climates in North America.
42 Includes International Energy Conservation Code 2012 Climate Zones 4, 5, 6, 8 and the following states: Alaska, Colorado, Connecticut, California, Idaho, Illinois, Indiana, Iowa, Kansas, Maine, Massachusetts, Michigan, Minnesota, Missouri, Montana, Nebraska, New Hampshire, New Jersey, New York, North Dakota, Nevada, Ohio, Oregon, Pennsylvania, Rhode Island, South Dakota, Utah, Vermont, Washington, West Virginia, Wisconsin, and Wyoming (as listed in proposed 10 CFR Part 430.32(e)(1)(iii), as published in Federal Register 76, No. 123, June 27, 2011, p. 37548.)
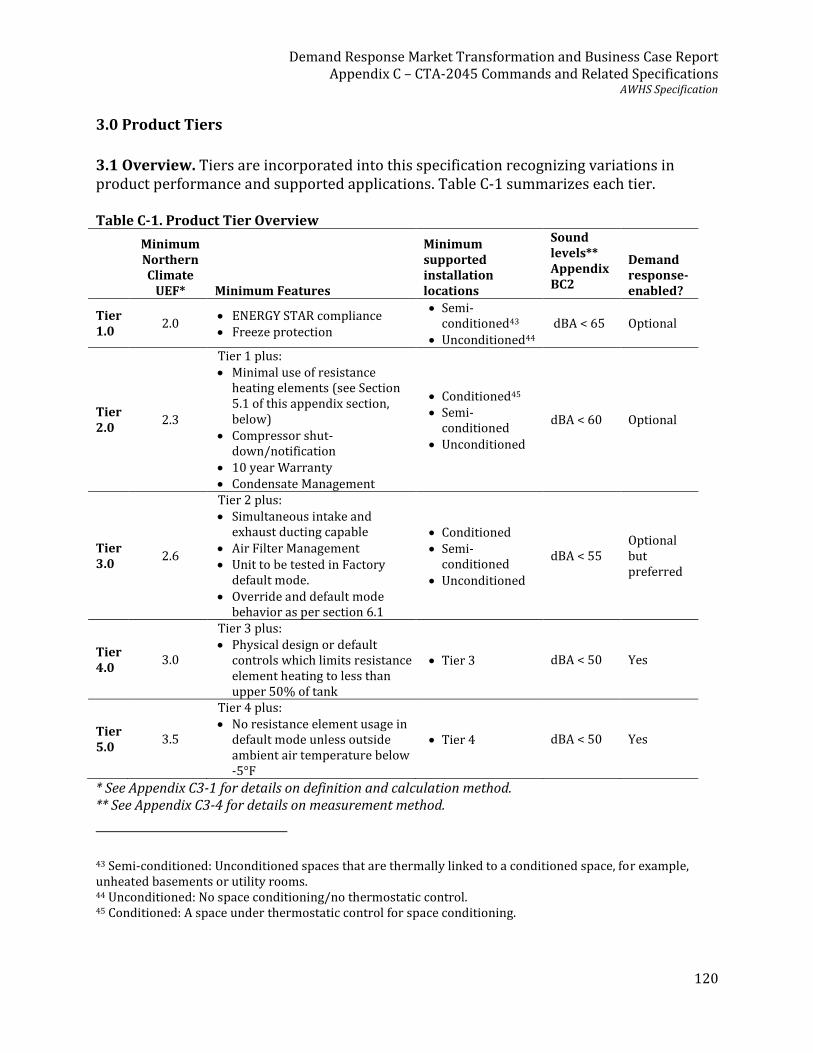
Demand Response Market Transformation and Business Case Report Appendix C – CTA-2045 Commands and Related Specifications
AWHS Specification
120
3.0 Product Tiers
3.1 Overview. Tiers are incorporated into this specification recognizing variations in product performance and supported applications. Table C-1 summarizes each tier. Table C-1. Product Tier Overview
Minimum Northern Climate
UEF* Minimum Features
Minimum supported installation locations
Sound levels** Appendix BC2
Demand response-enabled?
Tier 1.0
2.0 • ENERGY STAR compliance • Freeze protection
• Semi-conditioned43
• Unconditioned44 dBA < 65 Optional
Tier 2.0
2.3
Tier 1 plus: • Minimal use of resistance
heating elements (see Section 5.1 of this appendix section, below)
• Compressor shut-down/notification
• 10 year Warranty • Condensate Management
• Conditioned45 • Semi-
conditioned • Unconditioned
dBA < 60 Optional
Tier 3.0
2.6
Tier 2 plus: • Simultaneous intake and
exhaust ducting capable • Air Filter Management • Unit to be tested in Factory
default mode. • Override and default mode
behavior as per section 6.1
• Conditioned • Semi-
conditioned • Unconditioned
dBA < 55 Optional but preferred
Tier 4.0
3.0
Tier 3 plus: • Physical design or default
controls which limits resistance element heating to less than upper 50% of tank
• Tier 3 dBA < 50 Yes
Tier 5.0
3.5
Tier 4 plus: • No resistance element usage in
default mode unless outside ambient air temperature below -5°F
• Tier 4 dBA < 50 Yes
* See Appendix C3-1 for details on definition and calculation method. ** See Appendix C3-4 for details on measurement method.
43 Semi-conditioned: Unconditioned spaces that are thermally linked to a conditioned space, for example, unheated basements or utility rooms. 44 Unconditioned: No space conditioning/no thermostatic control. 45 Conditioned: A space under thermostatic control for space conditioning.

Demand Response Market Transformation and Business Case Report Appendix C – CTA-2045 Commands and Related Specifications
AWHS Specification
121
4.0 Requirements for All Units (Tiers 1.0, 2.0, 3.0, 4.0 and 5.0) 4.1 UL or equivalent approved. Unit shall be UL, ETL or equivalent approval and have the ability to be installed in the US and/or Canada. 4.2 ENERGY STAR Compliance. The unit shall meet ENERGY STAR criteria effective at time of manufacture. 4.3 Northern Climate Energy Factor. The unit shall meet minimum Northern Climate Energy Factor values under default operating mode settings according to Table C-1. See Appendix C3-1 for the Northern Climate Performance EF Test Procedure and corresponding Northern Climate EF Calculation Method. 4.4 Northern Climate Delivery Rating. To aid in proper sizing, the unit shall be rated on its ability to deliver hot water in cool ambient conditions while maintaining high efficiency operation. Reported in “number of showers” rounded to the nearest ½ shower. See Appendix C3-2 for Northern Climate Delivery Rating Method. 4.5 Sound Levels. The unit shall not exceed maximum sound levels according to Table C-1. See Appendix C3-4 for Sound Measurement Test Method. 4.6 Freeze Protection Test. For units circulating water outside the hot water tank for purposes other than delivery to the house (i.e., to a heat exchanger for heating), the unit shall pass 24 hour power-off freeze protection test as specified in Appendix C3-3. The key reason for this test is to insure that water heaters do not freeze during power outages. Manufacturers should clearly state in installation manuals how to install units to prevent freezing. 4.7 Remote Heat Pump Application. If unit employs remote heat pump, unit shall be tested with a 25’ standard length line set. All supporting equipment including fans, pumps, line set insulation, and required heaters will be measured in total energy consumption for calculations. 4.8 Installation Guidance. Installation guidance shall be provided so unit is installed with adequate clearance for all airflow to and from the evaporator. Manual shall provide several possible configuration and or installation scenarios to assist the installer.
5.0 Additional and Optional Requirements for Tiers 2.0 and Above
5.1 Minimal Use of Electric Resistance Heating Elements. In default operating mode, units shall make minimal or no use of electric resistance heating elements in order to maximize energy savings potential. During the first draw of the standard DOE First Hour

Demand Response Market Transformation and Business Case Report Appendix C – CTA-2045 Commands and Related Specifications
AWHS Specification
122
Rating Test46, the electric resistance heating element shall not be turned on until at least 66% of the tank’s measured water volume has been withdrawn. Measured volume is defined as the amount of water the unit under test actually stores and not the nominal rated tank volume. 5.2 Compressor Shut-down, Notification. The unit shall provide notification to the consumer that the heat-pump operation of the product has been disabled due to normal events, user selected override, or product failure.
5.2.1 Normal, Temporary Event. The unit shall display that the heat pump is not currently operating if the compressor is temporarily disabled due to specific operational controls (e.g. low intake temperature or defrosting). The controls shall automatically restore compressor operation as soon as conditions return to allowable control parameters (e.g. return to minimum intake temperature or completion of the defrost cycle). 5.2.2 User Selected Override and or Power Failure. If the unit has a temporary, user selectable heat pump override option, the unit shall provide a default override period of up to 72 hours before returning to the previously selected operating mode (preferably to the as shipped or better settings) except 100% electric resistance. 5.2.3 Product Failure Alarm. The unit shall provide an audible and visible alarm to the consumer (on the interior unit) that the unit’s heat pump has a failure and requires service. The unit shall provide a consumer acknowledgement feature which turns off the audible alarm. Audible alarm shall be at least 50 dBA at specified location in Appendix C3-4 for measuring noise level on the HPWH. The visual alarm shall be visible without removal of panels and or covers with clear nomenclature and enunciation to the homeowner to take needed action to solve the problem.
5.3 Warranty and Service. The unit shall carry a warranty of a minimum of 10 years for all system parts as well as a minimum of 1 year for labor from date of installation.
5.3.1 Contact Information. The unit shall include clear information on how to obtain warranty service, replacement filters or other maintenance items, and technical support via a toll-free phone number clearly marked on the exterior of the unit.
46 http://www.ecfr.gov/cgi-bin/text-idx?SID=80dfa785ea350ebeee184bb0ae03e7f0&mc=true&node=ap10.3.430_127.e&rgn=div9

Demand Response Market Transformation and Business Case Report Appendix C – CTA-2045 Commands and Related Specifications
AWHS Specification
123
5.5 Condensate Management. Condensate shall be drained away according to local plumbing codes and industry best practices.
5.5.1 Acceptable Condensate Piping. The unit shall include a minimum standard piping connection for condensate drainage of proper size to function for the life of the product under normal use (field installation materials to be acquired by the installer for the connection). The manufacturer shall supply appropriate condensate piping specifications including piping diameter, length, allowable turns, and acceptable termination for gravity drains and for condensate pumping in locations, such as basements, where gravity drainage is not possible. Instructions for the installer shall highlight importance of correct condensate line installation practices and adherence to local plumbing code. 5.5.2 Condensate Overflow Shut-off and Alarm. Units shall include a safety switch to shut off compressor operation in the event of a blockage of the condensate removal system for any units installed in interior applications. An audible (See audible alarm section in section X) and visible alarm shall be activated to signal the need for service in the event of a compressor shut-off due to condensate drain failure. 5.5.3 Condensate Collection Pan and Drain Service. The condensate collection pan and drain shall be designed to not require regular maintenance or interaction by the consumer for the life of the product. In the event of a blockage, the pan and drain shall be designed to allow the consumer to be able to clear the drain with normal household tools and restore normal operation of the condensate line. Collection pan equipment and installation shall meet local code.
5.6 OPTIONAL: Exhaust Ducting. The unit may have a manufacturer-supplied optional ducting kit to provide for exhaust air ducting (“ducting kit”), available from same distribution/retail channels as the unit. For installations within conditioned spaces with exhaust ducting installed (and no intake ducting), manufacturers shall provide installation guidance to achieve exhaust airflow of no more than 250 CFM.47 Exhaust ducting capabilities shall comply with the same requirements for both inlet and exhaust ducting as specified in section 6.2. 5.7 Demand Response Features. Units shall be configured and shipped with the capability of responding appropriately to Demand Response and grid emergency and efficiency messages over a standard communication protocol and hardware interface. Units to have communication port that operates in compliance with CTA-2045 (or equivalent
47 Any amount of exhaust airflow will increase the infiltration rate and energy use of the building. Lower airflow is better and 250 CFM is set as an acceptable threshold.

Demand Response Market Transformation and Business Case Report Appendix C – CTA-2045 Commands and Related Specifications
AWHS Specification
124
open modular interface standard) with specific Demand Response signals such as shed, end shed and etc. If product is Demand Response qualified it must revert to user’s previously selected mode (or factory settings) after DR event.
6.0 Additional Requirements Tiers 3.0, 4.0, and 5.0 6.1 Default Settings. The unit shall be shipped in the default operational mode used in demonstrating compliance to Federal energy efficiency standards. Enhanced efficiency operational modes may be selected by the consumer during installation. Should a user initiate an override to a mode less energy efficient than the default condition, such selection will expire after a 72 hour period. Upon expiration, the appliance shall then automatically return to the mode previously selected by the user unless that mode was less efficient that the default, in which case, it shall return to the default. The customer, technician, and/or installer shall have the ability to override the default setting. In the event of total power loss to the unit, it shall revert to the last settings selected as long as it is not electric only. 6.2 Intake and Exhaust ducting. The unit may have a manufacturer-supplied optional ducting kit to provide for simultaneous intake and exhaust air ducting (“ducting kit”), available from same distribution/retail channels as the unit.
6.2.1 Ducting Hardware. The unit shall include all necessary flanges, collars, or other connections that are capable of directly connecting to common ducting products. Alternatively, manufacturer-supplied add-on ducting modifications may be used if they provide the same capabilities.
6.2.2 Minimum Flow Rate/Pressure Drop. The unit shall maintain 80% of the necessary airflow to achieve the rated performance (EFnc) when the fan is subject to an external static pressure of up to 0.2 inches water column.
6.2.3 Application Options. The unit shall be capable of operating with or without ducting installed. Manufacturers shall clearly identify which models are configured for which applications along with a clear description (e.g., parts list and drawings) of the appropriate layout/configurations and accessory parts necessary to meet the requirements for specific applications.
6.3 Air Filters: Routine Maintenance and Homeowner Notification. If any air filters are present, they shall be either 1) permanent, washable media or 2) replaceable, standard filters in shape and form that are obtainable at a typical hardware store. The unit shall provide visible notification to the homeowner of appropriate need to change, or service, the filter in order to prevent compromise of performance of the heat pump from reduced air flow. Recommendations to be defined by the manufacturer.
Demand Response Market Transformation and Business Case Report Appendix C – CTA-2045 Commands and Related Specifications
AWHS Specification
125
Appendix C3-1: Northern Climate Uniform Energy Factor Overview: Measure and calculate a Northern Climate Uniform Energy Factor (UEFNC)
representative of water heater performance for equipment installed in semi-conditioned
(e.g., basements, unheated utility rooms) and unconditioned (e.g., garages, crawl spaces)
locations in northern climates.
Determining the UEFNC consists of lab measurement of Uniform Energy Factors at 67°F and
50°F (UEF67 and UEF50), compressor cut-off temperature, and a temperature bin-based
calculation procedure.
Definitions:
UEF67 – Uniform Energy Factor from the standard DOE 24-hour test, at 67.5°F.
UEF50 – Uniform Energy Factor based on the standard DOE 24-hour test, at 50°F.
UEFR – Uniform Energy Factor for the HPWH operating in resistance-only heat mode
Ccutoff is the compressor cut-off temperature. See Appendix C3-5.
1.0 Test setup and procedure:
UEF67: Follow standard DOE 24-hour test procedure (Section 6 of 10 CFR Pt. 430,
Subpart B, App. E as published in Federal Register Vol. 79 No. 122, July 11, 2014).
UEF50: Follow standard DOE 24-hour test procedure with the following adjustments:
• Ambient conditions shall be 50°F dry bulb, 43.5°F wet bulb (58% R.H).
• Inlet water temperature: 50°F
2.0 Calculation Methodology:
The UEFNC utilizes a temperature bin weighted calculation.48 Figure C-1 below provides
several graphical examples of the end result of the calculation. The temperature bins for
use in the UEF weightings are given in Table C-2.
48 The method is based on the Heating Seasonal Performance Factor (HSPF) method for space conditioning heat pumps.
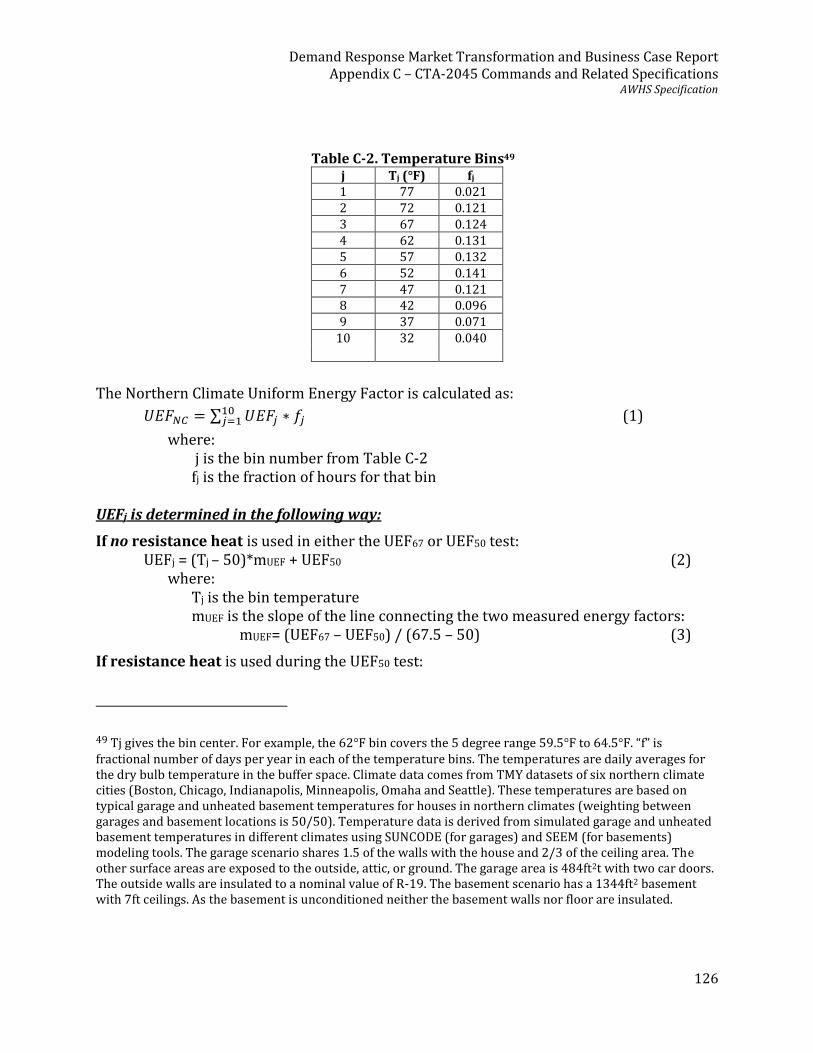
Demand Response Market Transformation and Business Case Report Appendix C – CTA-2045 Commands and Related Specifications
AWHS Specification
126
Table C-2. Temperature Bins49 j Tj (°F) fj 1 77 0.021 2 72 0.121 3 67 0.124 4 62 0.131 5 57 0.132 6 52 0.141 7 47 0.121 8 42 0.096 9 37 0.071
10 32 0.040
The Northern Climate Uniform Energy Factor is calculated as:
𝑈𝐸𝐹𝑁𝐶 = ∑ 𝑈𝐸𝐹𝑗 ∗ 𝑓𝑗10𝑗=1 (1)
where: j is the bin number from Table C-2 fj is the fraction of hours for that bin
UEFj is determined in the following way:
If no resistance heat is used in either the UEF67 or UEF50 test: UEFj = (Tj – 50)*mUEF + UEF50 (2)
where: Tj is the bin temperature mUEF is the slope of the line connecting the two measured energy factors:
mUEF= (UEF67 – UEF50) / (67.5 – 50) (3)
If resistance heat is used during the UEF50 test:
49 Tj gives the bin center. For example, the 62°F bin covers the 5 degree range 59.5°F to 64.5°F. “f” is fractional number of days per year in each of the temperature bins. The temperatures are daily averages for the dry bulb temperature in the buffer space. Climate data comes from TMY datasets of six northern climate cities (Boston, Chicago, Indianapolis, Minneapolis, Omaha and Seattle). These temperatures are based on typical garage and unheated basement temperatures for houses in northern climates (weighting between garages and basement locations is 50/50). Temperature data is derived from simulated garage and unheated basement temperatures in different climates using SUNCODE (for garages) and SEEM (for basements) modeling tools. The garage scenario shares 1.5 of the walls with the house and 2/3 of the ceiling area. The other surface areas are exposed to the outside, attic, or ground. The garage area is 484ft2t with two car doors. The outside walls are insulated to a nominal value of R-19. The basement scenario has a 1344ft2 basement with 7ft ceilings. As the basement is unconditioned neither the basement walls nor floor are insulated.
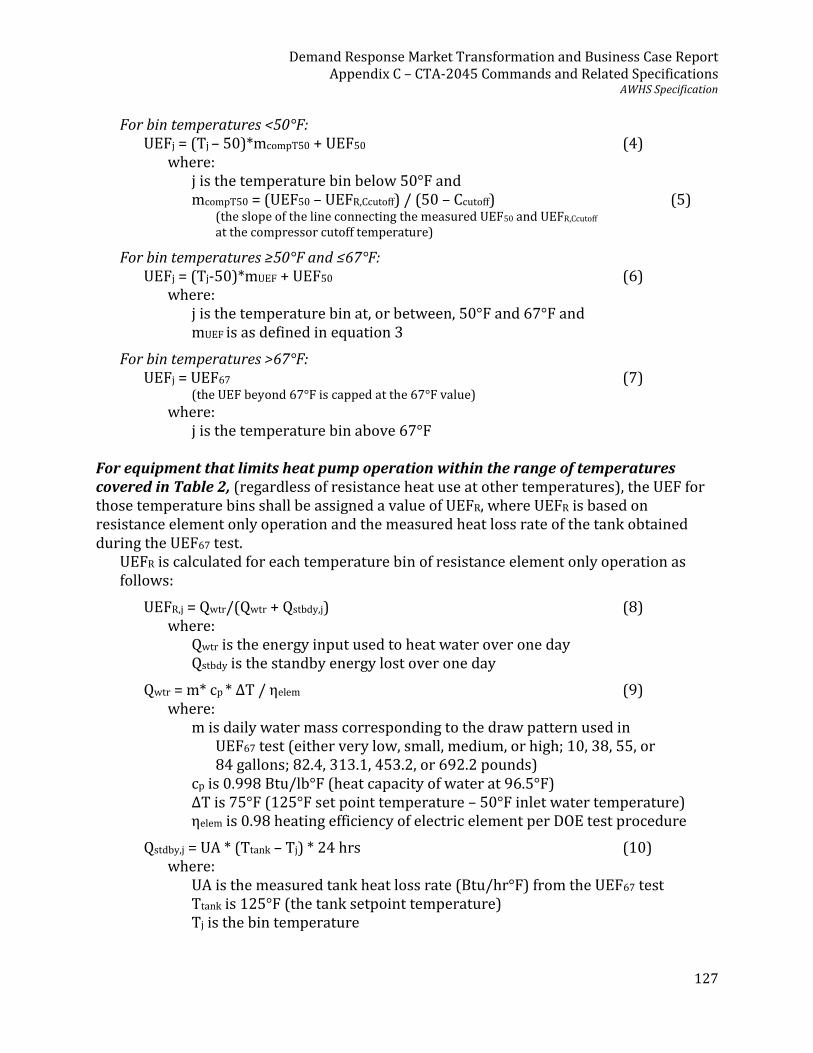
Demand Response Market Transformation and Business Case Report Appendix C – CTA-2045 Commands and Related Specifications
AWHS Specification
127
For bin temperatures <50°F: UEFj = (Tj – 50)*mcompT50 + UEF50 (4)
where: j is the temperature bin below 50°F and mcompT50 = (UEF50 – UEFR,Ccutoff) / (50 – Ccutoff) (5)
(the slope of the line connecting the measured UEF50 and UEFR,Ccutoff
at the compressor cutoff temperature)
For bin temperatures ≥50°F and ≤67°F: UEFj = (Tj-50)*mUEF + UEF50 (6)
where: j is the temperature bin at, or between, 50°F and 67°F and mUEF is as defined in equation 3
For bin temperatures >67°F: UEFj = UEF67 (7)
(the UEF beyond 67°F is capped at the 67°F value)
where: j is the temperature bin above 67°F
For equipment that limits heat pump operation within the range of temperatures covered in Table 2, (regardless of resistance heat use at other temperatures), the UEF for those temperature bins shall be assigned a value of UEFR, where UEFR is based on resistance element only operation and the measured heat loss rate of the tank obtained during the UEF67 test.
UEFR is calculated for each temperature bin of resistance element only operation as follows:
UEFR,j = Qwtr/(Qwtr + Qstbdy,j) (8) where:
Qwtr is the energy input used to heat water over one day Qstbdy is the standby energy lost over one day
Qwtr = m* cp * ΔT / ηelem (9) where:
m is daily water mass corresponding to the draw pattern used in UEF67 test (either very low, small, medium, or high; 10, 38, 55, or 84 gallons; 82.4, 313.1, 453.2, or 692.2 pounds)
cp is 0.998 Btu/lb°F (heat capacity of water at 96.5°F) ΔT is 75°F (125°F set point temperature – 50°F inlet water temperature) ηelem is 0.98 heating efficiency of electric element per DOE test procedure
Qstdby,j = UA * (Ttank – Tj) * 24 hrs (10) where:
UA is the measured tank heat loss rate (Btu/hr°F) from the UEF67 test Ttank is 125°F (the tank setpoint temperature) Tj is the bin temperature
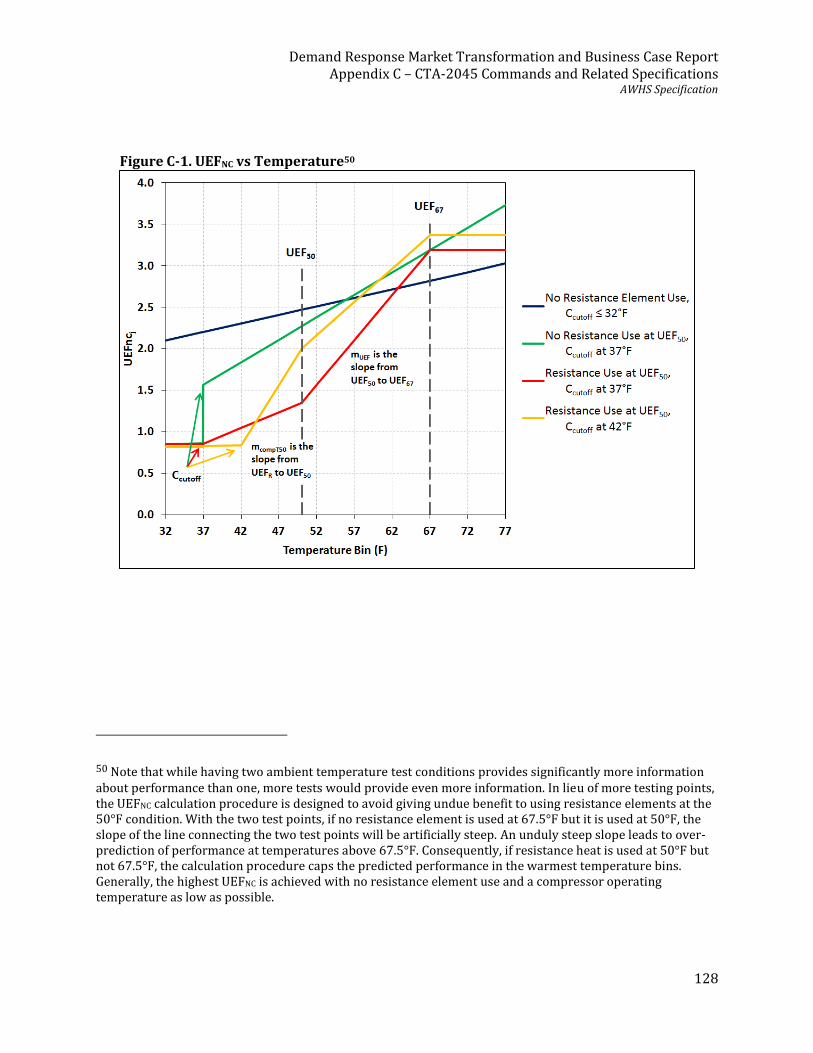
Demand Response Market Transformation and Business Case Report Appendix C – CTA-2045 Commands and Related Specifications
AWHS Specification
128
Figure C-1. UEFNC vs Temperature50
50 Note that while having two ambient temperature test conditions provides significantly more information about performance than one, more tests would provide even more information. In lieu of more testing points, the UEFNC calculation procedure is designed to avoid giving undue benefit to using resistance elements at the 50°F condition. With the two test points, if no resistance element is used at 67.5°F but it is used at 50°F, the slope of the line connecting the two test points will be artificially steep. An unduly steep slope leads to over-prediction of performance at temperatures above 67.5°F. Consequently, if resistance heat is used at 50°F but not 67.5°F, the calculation procedure caps the predicted performance in the warmest temperature bins. Generally, the highest UEFNC is achieved with no resistance element use and a compressor operating temperature as low as possible.
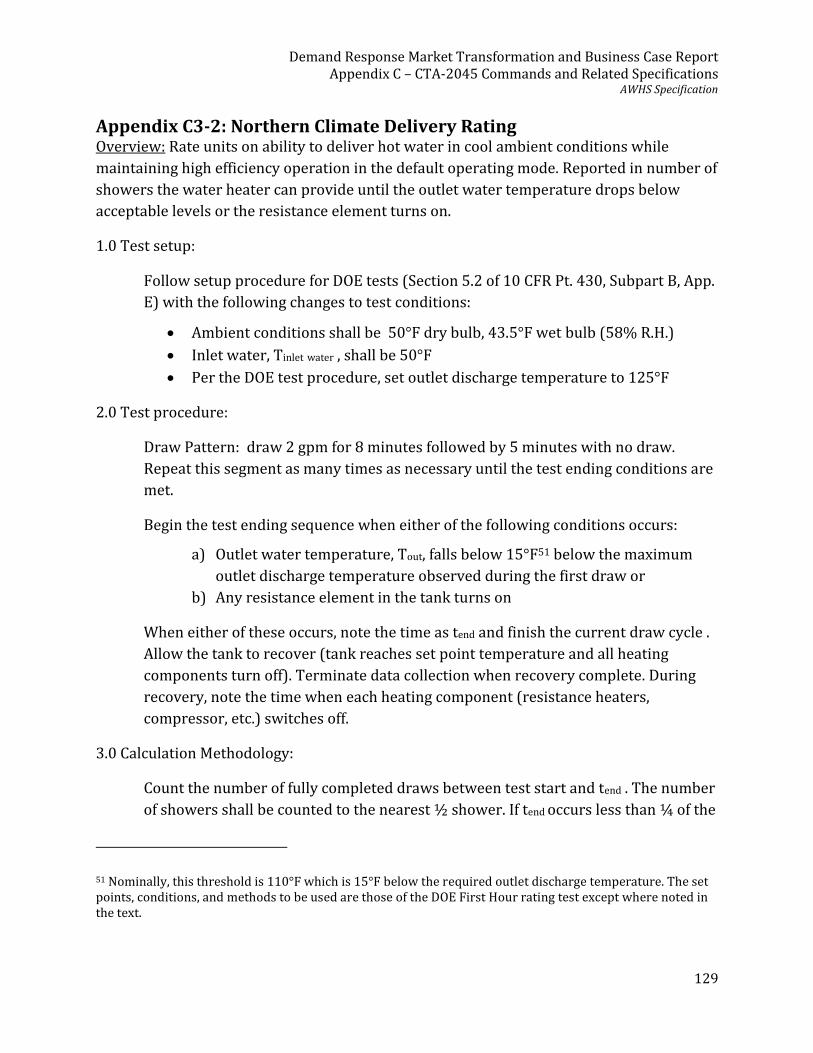
Demand Response Market Transformation and Business Case Report Appendix C – CTA-2045 Commands and Related Specifications
AWHS Specification
129
Appendix C3-2: Northern Climate Delivery Rating Overview: Rate units on ability to deliver hot water in cool ambient conditions while
maintaining high efficiency operation in the default operating mode. Reported in number of
showers the water heater can provide until the outlet water temperature drops below
acceptable levels or the resistance element turns on.
1.0 Test setup:
Follow setup procedure for DOE tests (Section 5.2 of 10 CFR Pt. 430, Subpart B, App.
E) with the following changes to test conditions:
• Ambient conditions shall be 50°F dry bulb, 43.5°F wet bulb (58% R.H.)
• Inlet water, Tinlet water , shall be 50°F
• Per the DOE test procedure, set outlet discharge temperature to 125°F
2.0 Test procedure:
Draw Pattern: draw 2 gpm for 8 minutes followed by 5 minutes with no draw.
Repeat this segment as many times as necessary until the test ending conditions are
met.
Begin the test ending sequence when either of the following conditions occurs:
a) Outlet water temperature, Tout, falls below 15°F51 below the maximum
outlet discharge temperature observed during the first draw or
b) Any resistance element in the tank turns on
When either of these occurs, note the time as tend and finish the current draw cycle .
Allow the tank to recover (tank reaches set point temperature and all heating
components turn off). Terminate data collection when recovery complete. During
recovery, note the time when each heating component (resistance heaters,
compressor, etc.) switches off.
3.0 Calculation Methodology:
Count the number of fully completed draws between test start and tend . The number
of showers shall be counted to the nearest ½ shower. If tend occurs less than ¼ of the
51 Nominally, this threshold is 110°F which is 15°F below the required outlet discharge temperature. The set points, conditions, and methods to be used are those of the DOE First Hour rating test except where noted in the text.

Demand Response Market Transformation and Business Case Report Appendix C – CTA-2045 Commands and Related Specifications
AWHS Specification
130
way through the draw, do not count the draw towards a shower. If tend occurs
between ¼ and ¾ of the way through the draw, count the draw as ½ shower. If tend
occurs after ¾ of the way through the draw, count the draw as 1 shower.
Appendix C3-3: Freeze Protection Test Overview: For units circulating water outside the hot water tank for purposes other than
delivery to the house (i.e. to a heat exchanger for heating), test the water heater’s ability to
withstand adverse environmental events and still remain functional afterwards as defined
in 3.0 below.
1.0 Test setup:
• The ambient air in which the water heater is located shall be maintained at 20°F dry
bulb for the duration of the test.
• Set tank delivery water temperature set point to 125°F.
• Set equipment to the default operating mode
• Inlet and outlet water lines shall be insulated to provide an R value between 4 and 8
h-ft2-F/Btu for a minimum of 2 feet from the tank with 1” thick pipe insulation.
2.0 Test procedure:
• Establish normal water heater operation: If water heater not operating, initiate a
draw. Terminate that draw when equipment cut-in occurs. When the tank recovers
and the heaters cut-out, wait 5 minutes. Then, shut off all power to the water heater
for 24 hours.
• After 24 hours, turn on power to the water heater and allow it to recover to the set
point.
• Initiate a draw until the water heater compressor cuts in. Allow tank to recover to
the set point.
• Shut off power to the water heater and inspect for damage.
3.0 Functionality. The water heater will have passed the test if all the following criteria are
met:
• The compressor runs and the tank recovers after the 24hr off period.
• There is no freezing or rupture of any water-related connections or components
including but not limited to heat exchangers, pumps, condensate lines, or other heat
pump components apart from the standard plumbing connections required for a
traditional electric resistance water heater.

Demand Response Market Transformation and Business Case Report Appendix C – CTA-2045 Commands and Related Specifications
AWHS Specification
131
Appendix C3-4: Sound Pressure Measurement Test Method Overview: A simplified, repeatable test to measure sound pressure level 1.0 Test setup:
• The testing room shall approximate a reverberation chamber. The approximate reverberation room is defined as follows: most surfaces are relatively hard - standard laboratory flooring materials such as concrete or linoleum, and cinder block or drywall walls; the room need not be empty of other equipment, though other noise sources should be turned off. Efforts to dampen noise, such as applying anechoic tiles or baffles shall not be done. Measurements made in an anechoic or semi-anechoic style chamber are not valid. The test concept is to approximate a typical garage, basement, or house utility room.
• Place the water heater 6” away from one wall in the room. o All other walls or objects shall be at least 1.5 meters away from the water
heater. o Ambient noise shall be less than or equal to 35dBA. o Unit shall be run without ducting attached for those units where this is an
option. • Initiate normal water heater operation under an operating mode which uses all
moving components simultaneously including, but not limited to, the compressor, fan, or pumps. Allow the unit to operate in this mode for one minute before proceeding and ensure that a steady state of operation is maintained during the entire sound measurement procedure.
o Inlet water temperature shall be 58 °F ±10°F o Ambient air conditions shall be 67°F ±18°F
2.0 Test procedure:
• Measure the A-weighted sound pressure level: o At five points 1 meter distant from the water heater surface at 1.8 meter
height above the base of the water heater. Points 3L and 3R should be 12” from the wall.
o If the water heater has an airflow intake or exhaust flow path around the circumference of the equipment, position the unit, as follows, so the air flow is not directly aimed at a measurement point: aim the intake or exhaust between either points (3L, 2L), (2L, 1), (1, 2R), and/or (2R, 3R). In no case should the flow path be directed towards the wall between points (3L, 3R).
• Average all five measurements into a single sound value.
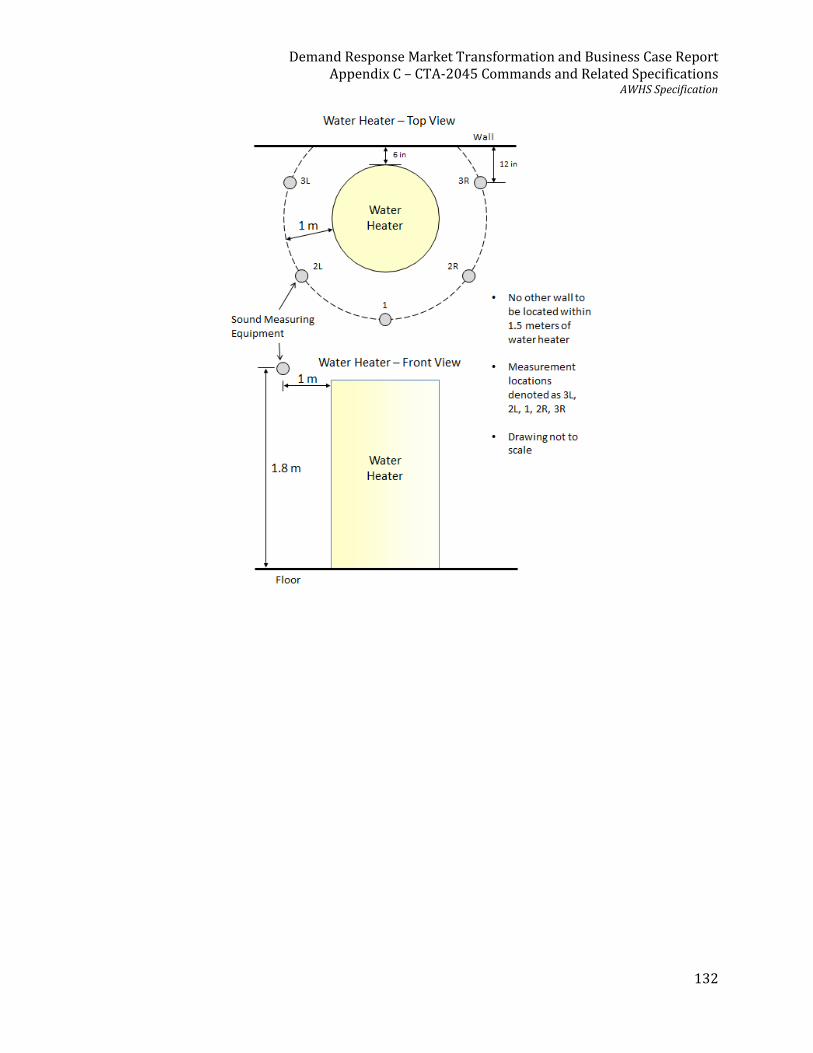
Demand Response Market Transformation and Business Case Report Appendix C – CTA-2045 Commands and Related Specifications
AWHS Specification
132
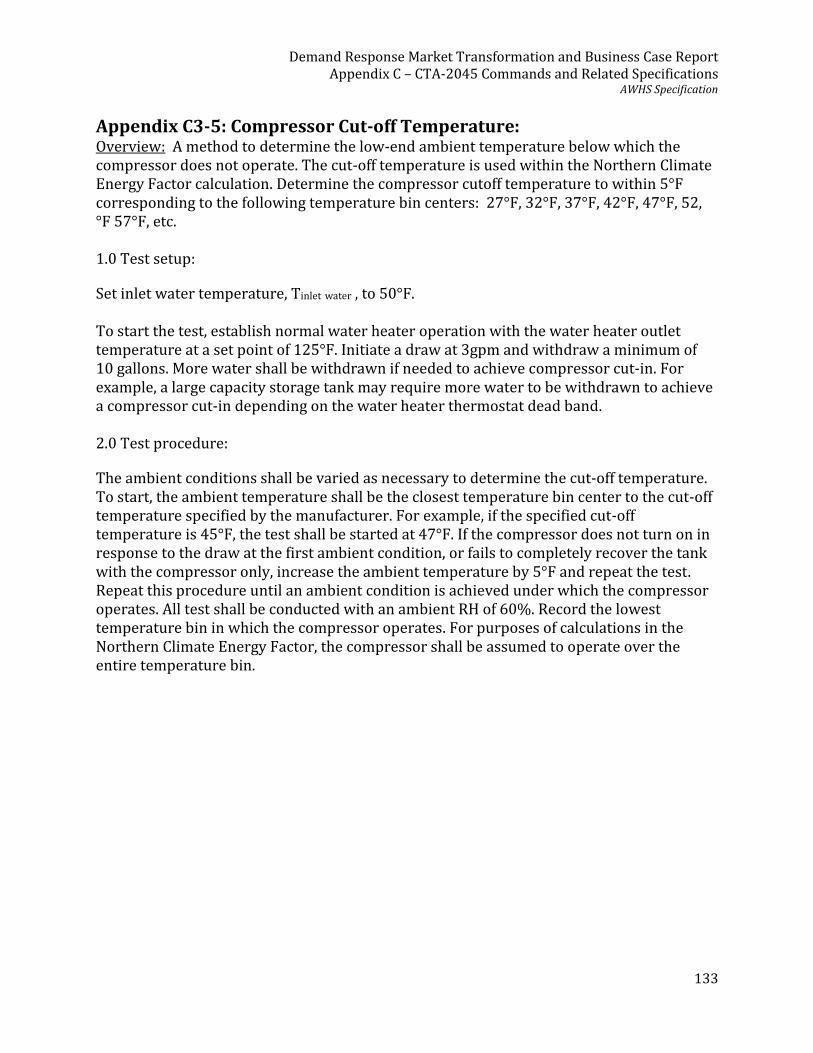
Demand Response Market Transformation and Business Case Report Appendix C – CTA-2045 Commands and Related Specifications
AWHS Specification
133
Appendix C3-5: Compressor Cut-off Temperature: Overview: A method to determine the low-end ambient temperature below which the compressor does not operate. The cut-off temperature is used within the Northern Climate Energy Factor calculation. Determine the compressor cutoff temperature to within 5°F corresponding to the following temperature bin centers: 27°F, 32°F, 37°F, 42°F, 47°F, 52, °F 57°F, etc. 1.0 Test setup:
Set inlet water temperature, Tinlet water , to 50°F. To start the test, establish normal water heater operation with the water heater outlet temperature at a set point of 125°F. Initiate a draw at 3gpm and withdraw a minimum of 10 gallons. More water shall be withdrawn if needed to achieve compressor cut-in. For example, a large capacity storage tank may require more water to be withdrawn to achieve a compressor cut-in depending on the water heater thermostat dead band. 2.0 Test procedure:
The ambient conditions shall be varied as necessary to determine the cut-off temperature. To start, the ambient temperature shall be the closest temperature bin center to the cut-off temperature specified by the manufacturer. For example, if the specified cut-off temperature is 45°F, the test shall be started at 47°F. If the compressor does not turn on in response to the draw at the first ambient condition, or fails to completely recover the tank with the compressor only, increase the ambient temperature by 5°F and repeat the test. Repeat this procedure until an ambient condition is achieved under which the compressor operates. All test shall be conducted with an ambient RH of 60%. Record the lowest temperature bin in which the compressor operates. For purposes of calculations in the Northern Climate Energy Factor, the compressor shall be assumed to operate over the entire temperature bin.

Demand Response Market Transformation and Business Case Report Appendix C – CTA-2045 Commands and Related Specifications
AWHS Specification
134
Appendix C3-6 Airflow Measurement Overview: For units with a ducting kit, measure and verify the airflow in a simulated duct system. Per section 6.2.2 of the Specification, the equipment shall maintain its nominal airflow, so as not to reduce heat pump performance, when attached to a duct system subject to 0.2” water column of total external static pressure. The external static pressure (ESP), is measured across the complete airflow path of the system. Conceptually, for exhaust ducting, with a typical HPWH, this includes the filter at the air intake, the evaporator coil, the duct attachment kit, the exhaust duct itself, and an end cap. For dual-ducted systems, this could also include intake ducting and intake air grills. Definitions:
Nominal Airflow – is the airflow across the evaporator at which the equipment is rated in the UEF67 test.
1.0 Test setup and procedure Each HPWH may have a unique airflow path and, therefore, measurement setup. The setup presented in this section is done so as one possible example. Refer to Figure C-2 for a diagram. For specific questions and clarifications, contact NEEA.
• Attach ducting kit to airflow outlet • Attach an approximately 6 foot length of straight, round, sheet metal duct to the
duct kit at a diameter matching the two. • Install an adjustable damper at the outlet end of the duct • Insert an airflow measurement station and a static pressure tap in the middle
section of the duct. Connect each to a pressure gauge 2.0 Procedure
• Adjust damper position, to increase ESP to 0.2” w.c. and record the airflow • Compare airflow at 0.2” w.c. to nominal airflow.
o If airflow at 0.2” w.c. at least 80% of the nominal airflow, the equipment passes the requirement.
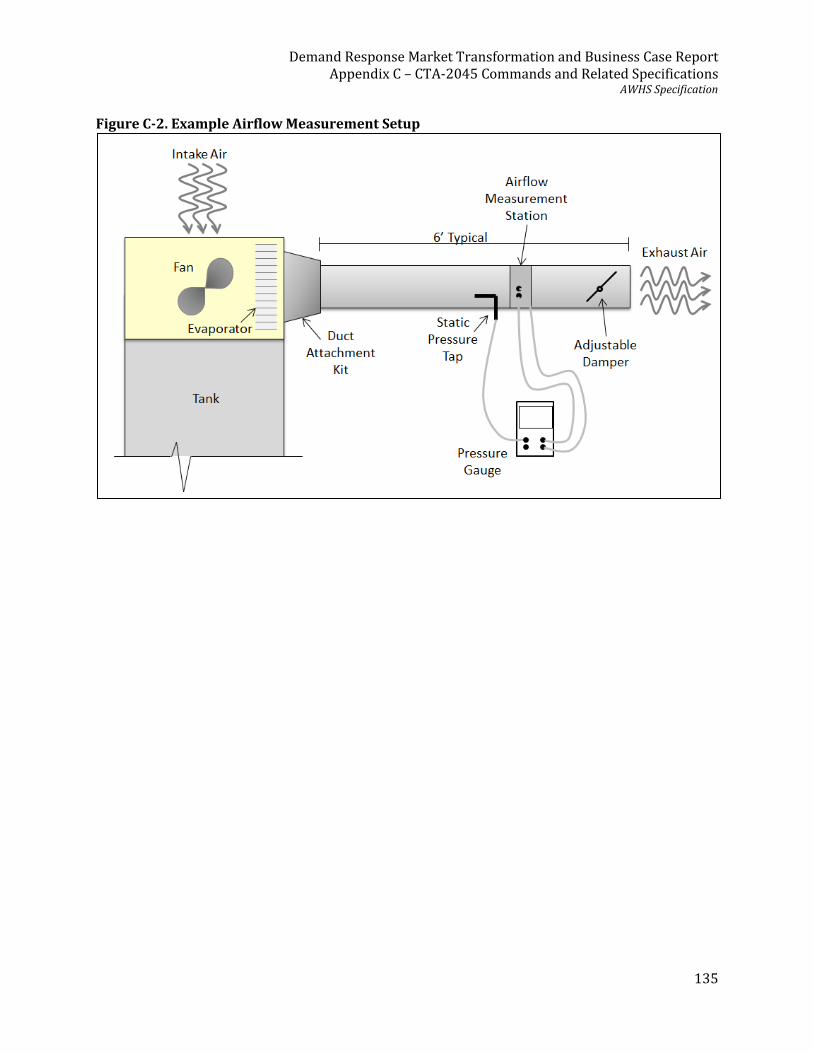
Demand Response Market Transformation and Business Case Report Appendix C – CTA-2045 Commands and Related Specifications
AWHS Specification
135
Figure C-2. Example Airflow Measurement Setup

Demand Response Market Transformation and Business Case Report Appendix C – CTA-2045 Commands and Related Specifications
AWHS Specification
136
Appendix C3-7 Demand Response Validation TEST Recommendation shall be provided from BPA, PGE, TVA, Duke, PJM, EPRI and USNAP as they develop. Nothing specified other than the physical connection required at this point either an AC or DC connection as per CTA-2045. All product will be compliant with either UL, ETL, and or CSA. (Testing method yet to be determined)

Demand Response Market Transformation and Business Case Report Appendix C – CTA-2045 Commands and Related Specifications
AWHS Specification
137
Appendix C3-8 Qualification Process The qualification process for the Advanced Water Heater Specification begins when a manufacturer submits the “Heat Pump Water Heater Product Assessment Worksheet” to the managing agency (currently NEEA) . The most current version of this worksheet is at http://www.neea.org/northernclimatespec. Manufacturers are encouraged to perform their own Advanced Water Heater Specification testing through any third-party EPA-recognized laboratory (see https://www.energystar.gov/index.cfm?fuseaction=recognized_bodies_list.show_RCB_search_form). In the event that the manufacturer does not perform this testing (and submits an incomplete assessment worksheet), qualification will be delayed until managing agency or the manufacturer performs (If they are self-certified and validated by NEEA or its designated managing agency.) the requisite testing. Upon meeting all the requirements for qualification, a product will be added to the Qualified Products List and classified into the appropriate tier level. For the current list, and for a complete description of the current process flow for the qualification process, see http://www.neea.org/northernclimatespec.
Demand Response Market Transformation and Business Case Report Appendix C – CTA-2045 Commands and Related Specifications
AWHS Specification
138
Appendix C3-9 Disqualification and Re-qualification Process NEEA and/or the managing agency may test a Product at any time to ensure that the Product meets the requirements of the Advanced Water Heater Specification.
1) Products that have previously been qualified to the Specification may no longer qualify, or qualify for a different tier level. This may be the result of re-testing new versions of the product in a lab, or by inspection of the product in the event that certain product features are no longer commercially available that were available at the time of initial qualification.
2) Challenge to Qualified Products: 1. In the event that an entity (manufacturer, regulatory agency or advocacy group)
does not believe the test results of a Qualified Product list (QPL) listed product, it may trigger a challenge event. A challenge event consists of the party challenging the results contacting the QPL managing agency (currently NEEA) in writing that potential discrepancies in test results may exist. The managing agency will notify the challenged party in writing and will coordinate a mutually agreeable testing lab for verification testing. Random units will be pulled from distribution and sent to the testing lab. The full cost of doing the test (including procurement, shipping and testing) will be borne by the entity found in error.
2. In the event that a previously qualified product is found to not meet specifications and/or the specified tier level, the product will be delisted and units of the product will need to be pulled from distribution. The cost of pulling inventory from distribution will be the burden of the manufacturer or supplier.
3) In-field testing reveals substantial differences between in-field performance and lab tested performance (greater than 5%). “Substantial” is here defined as having a material impact on the aggregate performance in the population of products under study, such that the product in aggregate no longer qualifies to meet the minimum tier (Tier 1) of the Specification or qualifies for a different tier.
4) Product safety issues are observed in the field, or otherwise discovered in lab or field testing.
In all of the above scenarios, NEEA and/or the managing agency will share the information with the HPWH Program and Technical Workgroups for review. Upon review, NEEA and/or the managing agency may decide to proceed with the disqualification/tier-reclassification, or to proceed no further for reasons such as lab or field testing errors, insufficient confidence in testing results, or administrative errors in the testing process. NEEA and/or the managing agency may request that the manufacturer provide additional information, or perform additional third-party testing, to determine the outcome. Upon deciding to proceed with disqualification/tier-reclassification, NEEA and/or the managing agency shall inform the manufacturer and provide 20 days for a written response from the date of notice. NEEA shall share the written response (if any) with the HPWH Workgroups, gather feedback, make a final decision, and inform the manufacturer of the decision.

Demand Response Market Transformation and Business Case Report Appendix C – CTA-2045 Commands and Related Specifications
AWHS Specification
139
Once products are disqualified or have been assigned to a different tier, the manufacturer may petition for requalification or assignment to the original tier level. The information provided in the petition (such as updated lab and field tests, manufacturing process or design changes) will be analyzed by NEEA and/or the managing agency and shared with the HPWH Workgroups. At that point a decision will be made and communicated to the manufacturer.
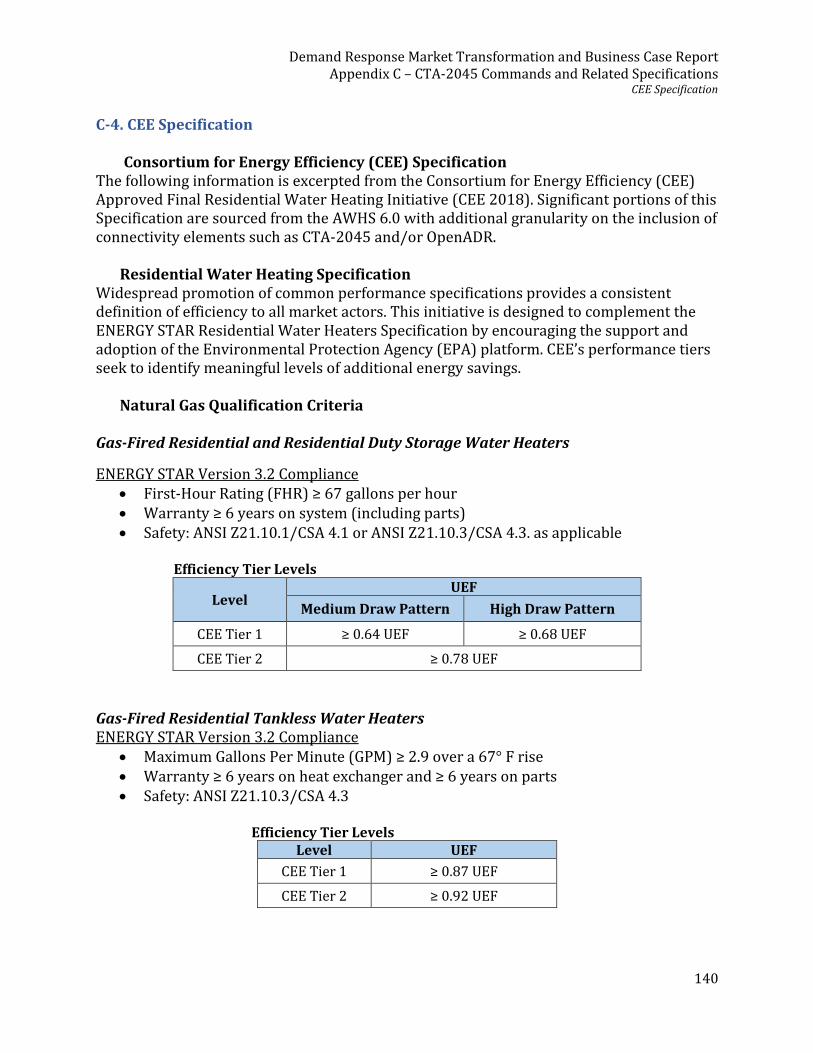
Demand Response Market Transformation and Business Case Report Appendix C – CTA-2045 Commands and Related Specifications
CEE Specification
140
C-4. CEE Specification
Consortium for Energy Efficiency (CEE) Specification The following information is excerpted from the Consortium for Energy Efficiency (CEE) Approved Final Residential Water Heating Initiative (CEE 2018). Significant portions of this Specification are sourced from the AWHS 6.0 with additional granularity on the inclusion of connectivity elements such as CTA-2045 and/or OpenADR.
Residential Water Heating Specification Widespread promotion of common performance specifications provides a consistent definition of efficiency to all market actors. This initiative is designed to complement the ENERGY STAR Residential Water Heaters Specification by encouraging the support and adoption of the Environmental Protection Agency (EPA) platform. CEE’s performance tiers seek to identify meaningful levels of additional energy savings.
Natural Gas Qualification Criteria Gas-Fired Residential and Residential Duty Storage Water Heaters
ENERGY STAR Version 3.2 Compliance • First-Hour Rating (FHR) ≥ 67 gallons per hour • Warranty ≥ 6 years on system (including parts) • Safety: ANSI Z21.10.1/CSA 4.1 or ANSI Z21.10.3/CSA 4.3. as applicable
Efficiency Tier Levels
Level UEF
Medium Draw Pattern High Draw Pattern
CEE Tier 1 ≥ 0.64 UEF ≥ 0.68 UEF
CEE Tier 2 ≥ 0.78 UEF
Gas-Fired Residential Tankless Water Heaters
ENERGY STAR Version 3.2 Compliance • Maximum Gallons Per Minute (GPM) ≥ 2.9 over a 67° F rise • Warranty ≥ 6 years on heat exchanger and ≥ 6 years on parts • Safety: ANSI Z21.10.3/CSA 4.3
Efficiency Tier Levels
Level UEF
CEE Tier 1 ≥ 0.87 UEF
CEE Tier 2 ≥ 0.92 UEF
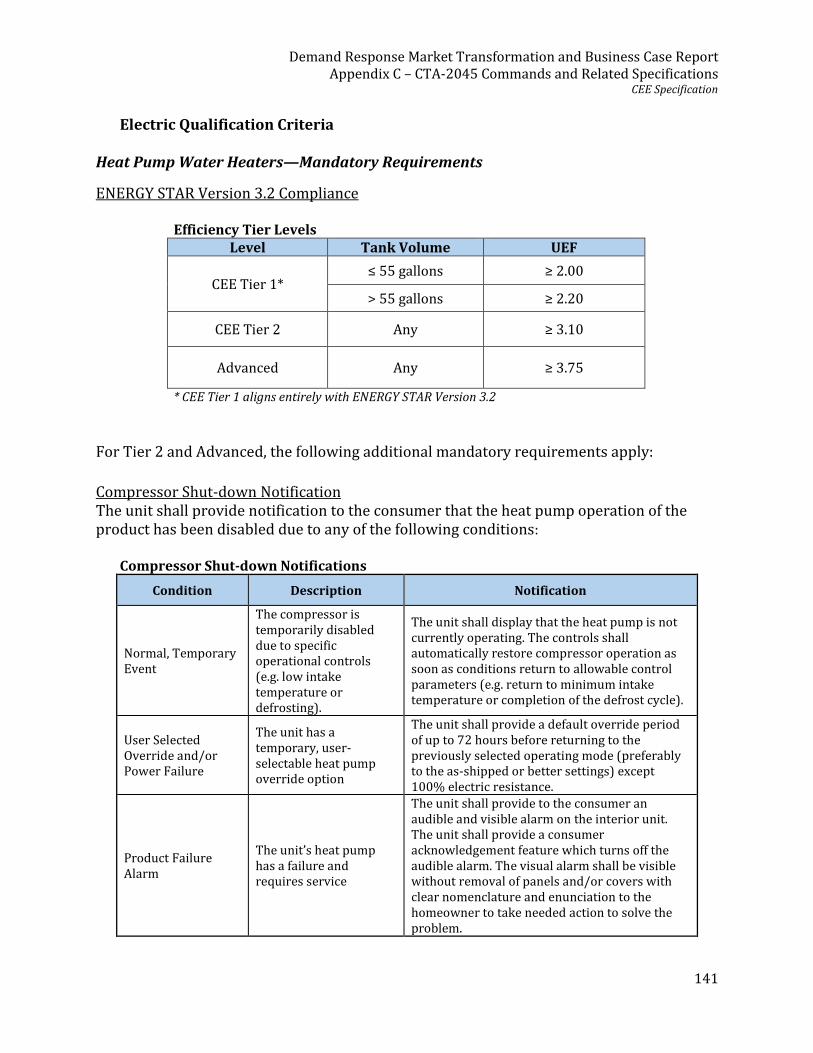
Demand Response Market Transformation and Business Case Report Appendix C – CTA-2045 Commands and Related Specifications
CEE Specification
141
Electric Qualification Criteria Heat Pump Water Heaters—Mandatory Requirements
ENERGY STAR Version 3.2 Compliance
Efficiency Tier Levels Level Tank Volume UEF
CEE Tier 1* ≤ 55 gallons ≥ 2.00
> 55 gallons ≥ 2.20
CEE Tier 2 Any ≥ 3.10
Advanced Any ≥ 3.75
* CEE Tier 1 aligns entirely with ENERGY STAR Version 3.2
For Tier 2 and Advanced, the following additional mandatory requirements apply:
Compressor Shut-down Notification The unit shall provide notification to the consumer that the heat pump operation of the product has been disabled due to any of the following conditions:
Compressor Shut-down Notifications
Condition Description Notification
Normal, Temporary Event
The compressor is temporarily disabled due to specific operational controls (e.g. low intake temperature or defrosting).
The unit shall display that the heat pump is not currently operating. The controls shall automatically restore compressor operation as soon as conditions return to allowable control parameters (e.g. return to minimum intake temperature or completion of the defrost cycle).
User Selected Override and/or Power Failure
The unit has a temporary, user‐selectable heat pump override option
The unit shall provide a default override period of up to 72 hours before returning to the previously selected operating mode (preferably to the as‐shipped or better settings) except 100% electric resistance.
Product Failure Alarm
The unit’s heat pump has a failure and requires service
The unit shall provide to the consumer an audible and visible alarm on the interior unit. The unit shall provide a consumer acknowledgement feature which turns off the audible alarm. The visual alarm shall be visible without removal of panels and/or covers with clear nomenclature and enunciation to the homeowner to take needed action to solve the problem.
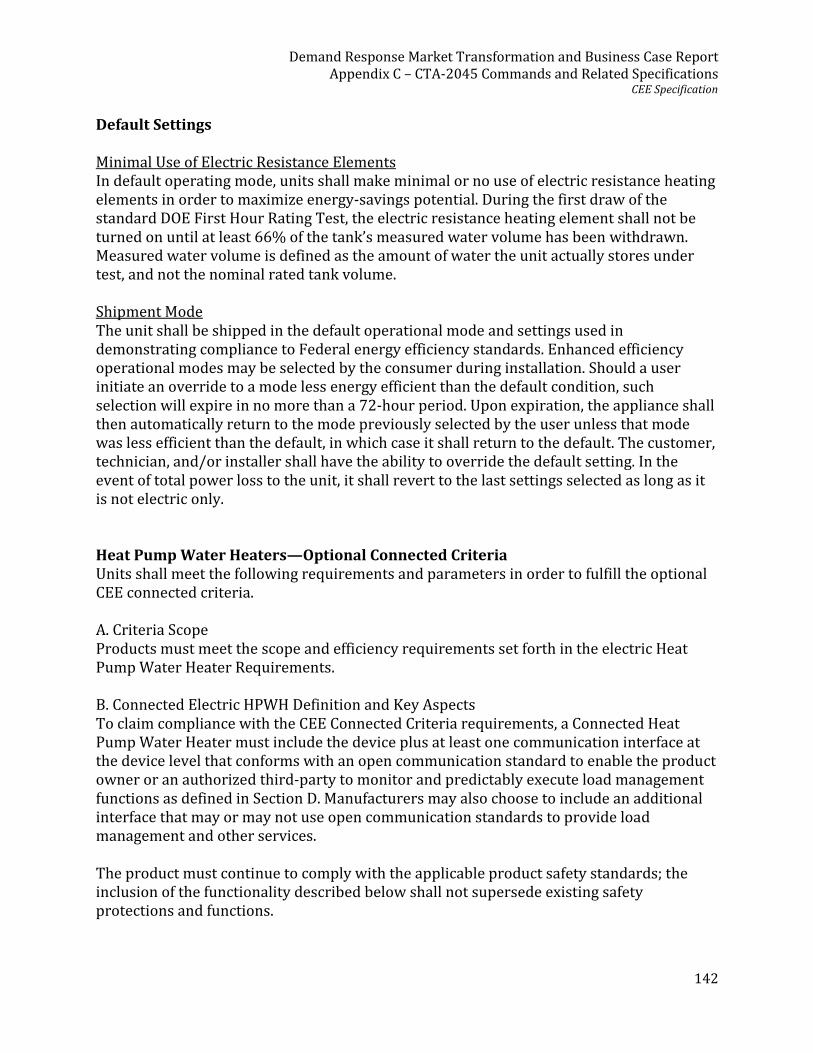
Demand Response Market Transformation and Business Case Report Appendix C – CTA-2045 Commands and Related Specifications
CEE Specification
142
Default Settings Minimal Use of Electric Resistance Elements In default operating mode, units shall make minimal or no use of electric resistance heating elements in order to maximize energy-savings potential. During the first draw of the standard DOE First Hour Rating Test, the electric resistance heating element shall not be turned on until at least 66% of the tank’s measured water volume has been withdrawn. Measured water volume is defined as the amount of water the unit actually stores under test, and not the nominal rated tank volume. Shipment Mode The unit shall be shipped in the default operational mode and settings used in demonstrating compliance to Federal energy efficiency standards. Enhanced efficiency operational modes may be selected by the consumer during installation. Should a user initiate an override to a mode less energy efficient than the default condition, such selection will expire in no more than a 72-hour period. Upon expiration, the appliance shall then automatically return to the mode previously selected by the user unless that mode was less efficient than the default, in which case it shall return to the default. The customer, technician, and/or installer shall have the ability to override the default setting. In the event of total power loss to the unit, it shall revert to the last settings selected as long as it is not electric only. Heat Pump Water Heaters—Optional Connected Criteria Units shall meet the following requirements and parameters in order to fulfill the optional CEE connected criteria. A. Criteria Scope Products must meet the scope and efficiency requirements set forth in the electric Heat Pump Water Heater Requirements. B. Connected Electric HPWH Definition and Key Aspects To claim compliance with the CEE Connected Criteria requirements, a Connected Heat Pump Water Heater must include the device plus at least one communication interface at the device level that conforms with an open communication standard to enable the product owner or an authorized third-party to monitor and predictably execute load management functions as defined in Section D. Manufacturers may also choose to include an additional interface that may or may not use open communication standards to provide load management and other services. The product must continue to comply with the applicable product safety standards; the inclusion of the functionality described below shall not supersede existing safety protections and functions.
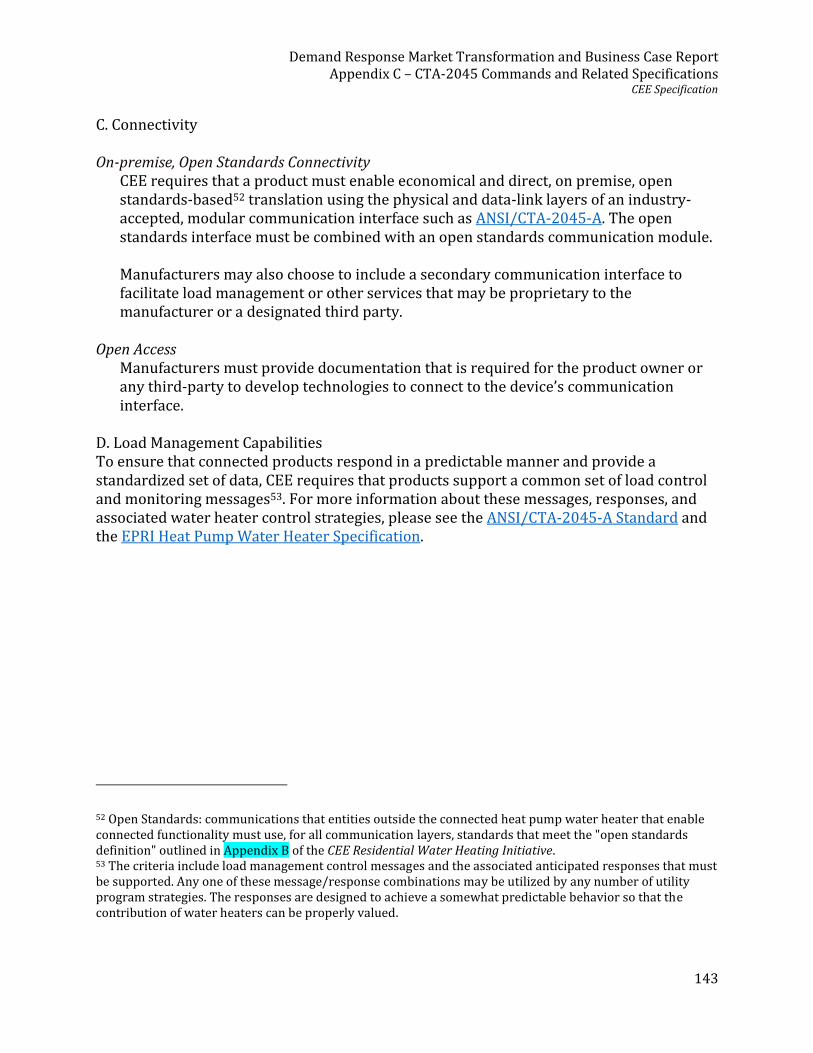
Demand Response Market Transformation and Business Case Report Appendix C – CTA-2045 Commands and Related Specifications
CEE Specification
143
C. Connectivity On-premise, Open Standards Connectivity
CEE requires that a product must enable economical and direct, on premise, open standards-based52 translation using the physical and data-link layers of an industry-accepted, modular communication interface such as ANSI/CTA-2045-A. The open standards interface must be combined with an open standards communication module. Manufacturers may also choose to include a secondary communication interface to facilitate load management or other services that may be proprietary to the manufacturer or a designated third party.
Open Access
Manufacturers must provide documentation that is required for the product owner or any third-party to develop technologies to connect to the device’s communication interface.
D. Load Management Capabilities To ensure that connected products respond in a predictable manner and provide a standardized set of data, CEE requires that products support a common set of load control and monitoring messages53. For more information about these messages, responses, and associated water heater control strategies, please see the ANSI/CTA-2045-A Standard and the EPRI Heat Pump Water Heater Specification.
52 Open Standards: communications that entities outside the connected heat pump water heater that enable connected functionality must use, for all communication layers, standards that meet the "open standards definition" outlined in Appendix B of the CEE Residential Water Heating Initiative. 53 The criteria include load management control messages and the associated anticipated responses that must be supported. Any one of these message/response combinations may be utilized by any number of utility program strategies. The responses are designed to achieve a somewhat predictable behavior so that the contribution of water heaters can be properly valued.
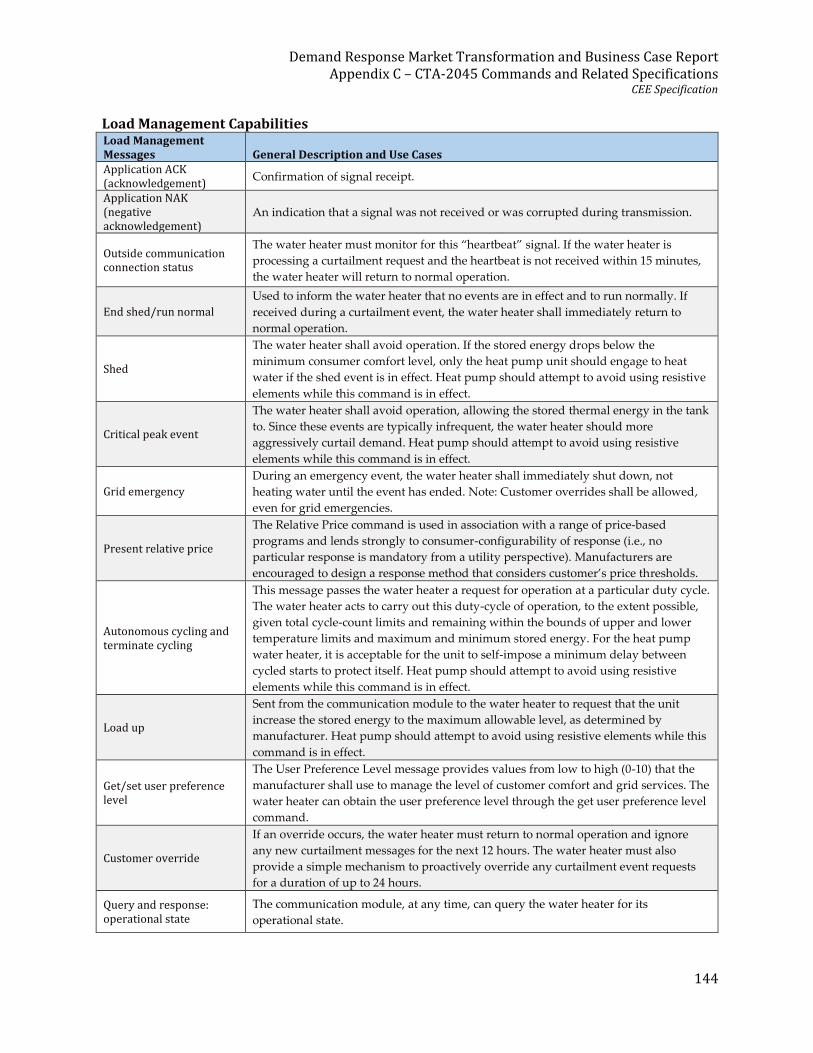
Demand Response Market Transformation and Business Case Report Appendix C – CTA-2045 Commands and Related Specifications
CEE Specification
144
Load Management Capabilities Load Management Messages General Description and Use Cases Application ACK (acknowledgement)
Confirmation of signal receipt.
Application NAK (negative acknowledgement)
An indication that a signal was not received or was corrupted during transmission.
Outside communication connection status
The water heater must monitor for this “heartbeat” signal. If the water heater is
processing a curtailment request and the heartbeat is not received within 15 minutes,
the water heater will return to normal operation.
End shed/run normal
Used to inform the water heater that no events are in effect and to run normally. If
received during a curtailment event, the water heater shall immediately return to
normal operation.
Shed
The water heater shall avoid operation. If the stored energy drops below the
minimum consumer comfort level, only the heat pump unit should engage to heat
water if the shed event is in effect. Heat pump should attempt to avoid using resistive
elements while this command is in effect.
Critical peak event
The water heater shall avoid operation, allowing the stored thermal energy in the tank
to. Since these events are typically infrequent, the water heater should more
aggressively curtail demand. Heat pump should attempt to avoid using resistive
elements while this command is in effect.
Grid emergency
During an emergency event, the water heater shall immediately shut down, not
heating water until the event has ended. Note: Customer overrides shall be allowed,
even for grid emergencies.
Present relative price
The Relative Price command is used in association with a range of price-based
programs and lends strongly to consumer-configurability of response (i.e., no
particular response is mandatory from a utility perspective). Manufacturers are
encouraged to design a response method that considers customer’s price thresholds.
Autonomous cycling and terminate cycling
This message passes the water heater a request for operation at a particular duty cycle.
The water heater acts to carry out this duty-cycle of operation, to the extent possible,
given total cycle-count limits and remaining within the bounds of upper and lower
temperature limits and maximum and minimum stored energy. For the heat pump
water heater, it is acceptable for the unit to self-impose a minimum delay between
cycled starts to protect itself. Heat pump should attempt to avoid using resistive
elements while this command is in effect.
Load up
Sent from the communication module to the water heater to request that the unit
increase the stored energy to the maximum allowable level, as determined by
manufacturer. Heat pump should attempt to avoid using resistive elements while this
command is in effect.
Get/set user preference level
The User Preference Level message provides values from low to high (0-10) that the
manufacturer shall use to manage the level of customer comfort and grid services. The
water heater can obtain the user preference level through the get user preference level
command.
Customer override
If an override occurs, the water heater must return to normal operation and ignore
any new curtailment messages for the next 12 hours. The water heater must also
provide a simple mechanism to proactively override any curtailment event requests
for a duration of up to 24 hours.
Query and response: operational state
The communication module, at any time, can query the water heater for its
operational state.
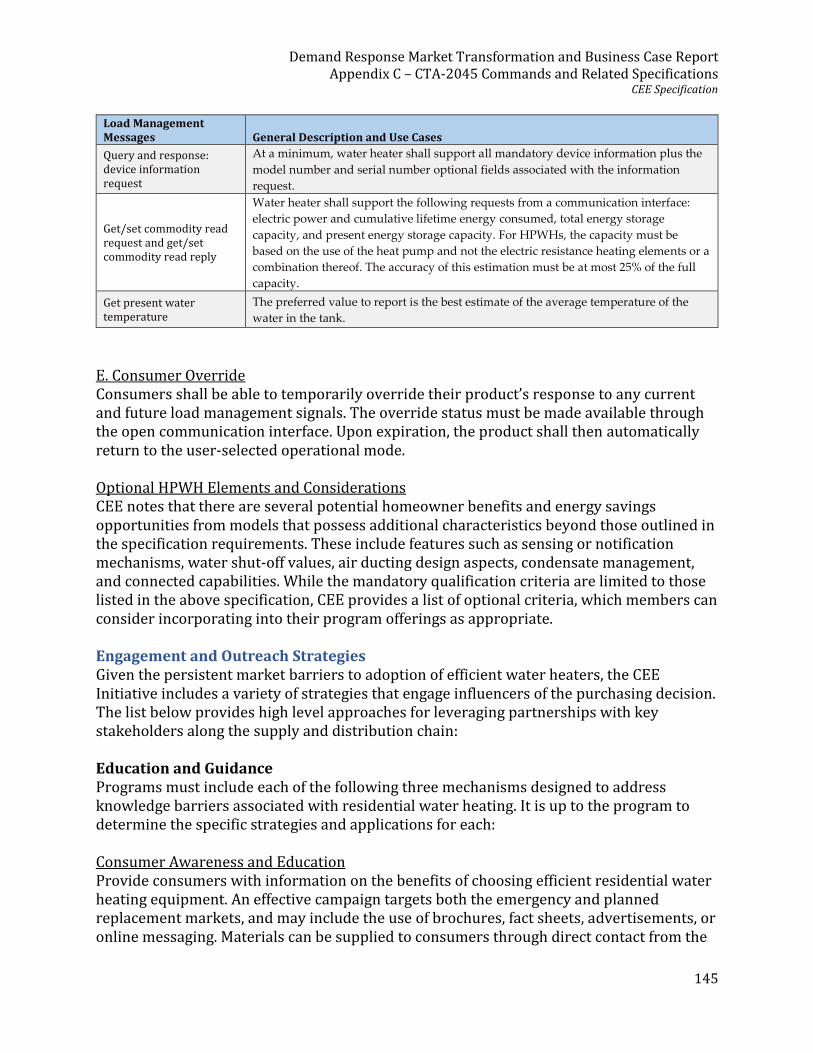
Demand Response Market Transformation and Business Case Report Appendix C – CTA-2045 Commands and Related Specifications
CEE Specification
145
Load Management Messages General Description and Use Cases
Query and response: device information request
At a minimum, water heater shall support all mandatory device information plus the
model number and serial number optional fields associated with the information
request.
Get/set commodity read request and get/set commodity read reply
Water heater shall support the following requests from a communication interface:
electric power and cumulative lifetime energy consumed, total energy storage
capacity, and present energy storage capacity. For HPWHs, the capacity must be
based on the use of the heat pump and not the electric resistance heating elements or a
combination thereof. The accuracy of this estimation must be at most 25% of the full
capacity.
Get present water temperature
The preferred value to report is the best estimate of the average temperature of the
water in the tank.
E. Consumer Override Consumers shall be able to temporarily override their product’s response to any current and future load management signals. The override status must be made available through the open communication interface. Upon expiration, the product shall then automatically return to the user-selected operational mode. Optional HPWH Elements and Considerations CEE notes that there are several potential homeowner benefits and energy savings opportunities from models that possess additional characteristics beyond those outlined in the specification requirements. These include features such as sensing or notification mechanisms, water shut-off values, air ducting design aspects, condensate management, and connected capabilities. While the mandatory qualification criteria are limited to those listed in the above specification, CEE provides a list of optional criteria, which members can consider incorporating into their program offerings as appropriate. Engagement and Outreach Strategies Given the persistent market barriers to adoption of efficient water heaters, the CEE Initiative includes a variety of strategies that engage influencers of the purchasing decision. The list below provides high level approaches for leveraging partnerships with key stakeholders along the supply and distribution chain: Education and Guidance Programs must include each of the following three mechanisms designed to address knowledge barriers associated with residential water heating. It is up to the program to determine the specific strategies and applications for each: Consumer Awareness and Education Provide consumers with information on the benefits of choosing efficient residential water heating equipment. An effective campaign targets both the emergency and planned replacement markets, and may include the use of brochures, fact sheets, advertisements, or online messaging. Materials can be supplied to consumers through direct contact from the

Demand Response Market Transformation and Business Case Report Appendix C – CTA-2045 Commands and Related Specifications
CEE Specification
146
program, or through the equipment distribution channel, including both direct retail and through contractors and installers. Contractor Awareness and Education Supply plumbers with information on the consumer benefits of choosing efficient residential water heating equipment. An effective campaign targets both the replacement as well as new construction markets, and may include the use of brochures, in-person education and training sessions, fact sheets, advertisements, or online messaging. Materials can be supplied to contractors and installers through the equipment distribution channel, including through manufacturers, market representatives, wholesalers, and retailers. Contractor Training, Support, and Installation Guidance Provide plumbers with opportunities that focus on promoting efficient equipment and the principles of installing and selling these systems. Education offerings should refer plumbing contractors to manufacturers for additional guidance on advanced venting and condensate drains required for condensing and heat pump equipment. Programs may either develop their own materials, or use resources that already exist, such as training programs provided by manufacturers, distributors or plumbing organizations. Various stakeholders throughout the supply chain may be available to offer additional support for these efforts. Program Strategies Aimed at Midstream Opportunities Programs must include at least one of the following types: Efforts to Drive Local Stocking of Efficient Equipment Create mechanisms to help encourage retailers, distributors, or wholesalers to stock and sell high performing equipment. By designing programs that directly address stocking practices, members will help ensure that efficient models are readily available in the market and accessible for both planned as well as emergency replacement purchases. Midstream Program Design Models Provide program offerings or incentives directly to parties in the distribution chain, where many of the purchasing decisions are influenced. This could include any variety of strategies that encourage trade allies to buy and sell high performing products instead of inefficient models. CEE has not engaged in or reviewed any particular implementation or fulfillment strategy, and thus takes no position regarding any specific midstream platform or approach.

Demand Response Market Transformation and Business Case Report Appendix C – CTA-2045 Commands and Related Specifications
CEC Title 24 Draft Specification
147
C-5. CEC Title 24 Draft Specification
Draft Proposal for Communication Protocol for Water Heaters in California in Relationship to CTA-2045 Command Details
The following proposed specifications for communications using CTA-2045 are derived from a draft manuscript authored by the Natural Resources Defense Council (NRDC) for the California Energy Commission (CEC) regarding 2019 Title 24 Building Energy Efficiency Standards (NRDC 2018). 1. Purpose and Scope The specification below provides the requirements for an electric water heating system to qualify for the water heating load management credit(s) available in the compliance option set forth in the Alternative Compliance Method (ACM) Reference Manual. This specification applies to electric water heating systems using either resistance or heat pump technologies. The primary function of the electric water heating system with load management is daily load shifting for customer bill reductions, maximized solar self-utilization, and grid harmonization. 2. Definitions: Local and Remote Load Management This specification defines the minimum set of functions that shall be embedded into water heaters themselves to support grid services, such as demand response, that are common across the service territories of California. Local Load Management The water heater uses on-premise time-of-use (TOU) management technology to manage water heater operation based on a TOU rate schedule. This provides automated cost management benefits to the user, and potentially also some benefit to the grid depending on how well the TOU schedule reflects grid marginal costs. TOU rates provide a financial incentive for ongoing user participation, and the control user interface can be designed to maximize persistence. It is assumed that fully automated load management exists, which does not depend on daily user actions. TOU load management is intended to operate in a “set and forget” manner: configured by the installer, and implemented to remain enabled unless temporarily overridden by the user. Local load management does not require a remote load management dispatch service. TOU load management will still entail some grid connectivity for periodic updates of the TOU price schedule stored in the control module, for time synchronization, and for reporting purposes.
Example Local Load Management Use Case: The water heater is installed in a service territory with a specific defined TOU rate schedule. The building owner or consumer
Demand Response Market Transformation and Business Case Report Appendix C – CTA-2045 Commands and Related Specifications
CEC Title 24 Draft Specification
148
connects a technology that can automatically utilize load management functions embedded into water heaters to maximize performance against the building’s TOU rate schedule. Enabling water heaters to provide this flexibility can provide significant benefits to the user and to the grid. Since rate structures may exclude weekends and holidays, and can change from season to season, the communication architecture must allow for the technologies connected to the water heater to receive periodic updates of the applicable rate structure(s), for time synchronization, and perhaps for reporting purposes. Note: With all California IOU customers presently scheduled to move to default time of use rates in 2019, the electric water heater system would provide automated cost management functionality for the California ratepayers.
Remote Load Management “Remote” load management use cases are designed to support dynamic grid conditions and could be used for economic or reliability purposes. Remote load management provides maximum flexibility and grid/societal energy cost savings potential. However, it also has significant infrastructure requirements, from reliable connectivity to grouping, scheduling, and managing dispatchable assets. Example Remote Load Management Use Case: A water heater automatically responds to a signal from a utility or aggregator that includes instructions to either moderately or aggressively decrease/increase demand or to stop using power altogether. For the water heaters to automatically respond in a predictable manner, the instructions sent in the dispatch signal must be mapped to specific load management functions embedded into water heaters. This specification calls for local load management to be implemented and verified, and for the capability, but not necessarily the implementation of, remote load management. This is because remote load management depends on the availability of remote load management programs, on the customer enrolling in one, and on the availability of on-premise communications infrastructure. This approach provides a reasonable likelihood that load management benefits will be realized over the life of the water heater, justifying the attribution of a load management credit in the building code. 3. Qualification Requirements To qualify as an electric water heating system with load management for compliance with applicable performance compliance credits, the electric water heating system and the on-premise water heater TOU management technology shall be certified to the Energy Commission according to the following requirements:
Demand Response Market Transformation and Business Case Report Appendix C – CTA-2045 Commands and Related Specifications
CEC Title 24 Draft Specification
149
3.1. Hardware Requirements The electric water heater with load management shall:
a) Comply with all federal, state and local safety codes b) Have a nominal storage capacity of 30 gallons or more c) Be capable of increasing internal water temperature to 140° F d) Have a tempering valve to maintain customer desired temperature
3.2. Water Heater Communication Requirements The following requirements do not restrict the water heater manufacturer from using the same or secondary communication interface of their choice to provide additional functionality not defined herein to the building, consumers, or to any third party:
a) The load management functionality as defined in Section 3.3.1 must be
accessible to any third party through a communication interface, physically located on the electric water heater system.
b) The communication interface must support an Open Standard communication protocol, such as OpenADR, IEEE 2030.5, CTA-2045-A (non-cloud-based communication protocols) or equivalent, that is:
i. Included in the Smart Grid Interoperability Panel (SGIP) Catalog of Standards, and/or
ii. Included in the National Institute of Standards and Technology (NIST) Smart Grid Framework Tables 4.1 and 4.2.3, and/or
iii. Adopted by the American National Standards Institute (ANSI) or another well-established international standards organization such as the International Organization for Standardization (ISO), or International Electrotechnical Commission (IEC)
c) All load management functionality and feedback as specified in Section 3.3.1 and Section 3.3.2 must be mapped to the application layer messages of the Open Standard.
d) The mapping document as defined in Section 3.2(c) must be publicly available. e) All systems that use the same Open Standard must use the same map as defined
in Section 3.2(c). f) The water heater system manufacturer shall provide instructions to configure,
connect, or disconnect technologies provided by third parties.
3.3. Water Heater System Requirements
3.3.1. Control Requirements This section specifies functions that would enable the equipment owner to use their water heater system to either provide services to the electric grid or to use locally to optimize performance against time-of-use (TOU) schedules. These functions must be enabled through the water heater’s communication interface at time of purchase.

Demand Response Market Transformation and Business Case Report Appendix C – CTA-2045 Commands and Related Specifications
CEC Title 24 Draft Specification
150
• The consumer must be provided the means to override any or all control functions, either prior to or during the execution of load management. The override must:
o Be temporary; o Have a maximum duration of 72 hours; o Remain in its normal operating mode for the duration of the override; and o Have its state made available through the communication interface.
• The water heating system shall always be in full control of its processes directed by the customer’s desires for the needed hot water requirements.
o It may either delay or reject a control request if responding would compromise safety or result in equipment damage as determined by the manufacturer.
• The load management functions in the table on the next page shall be supported:
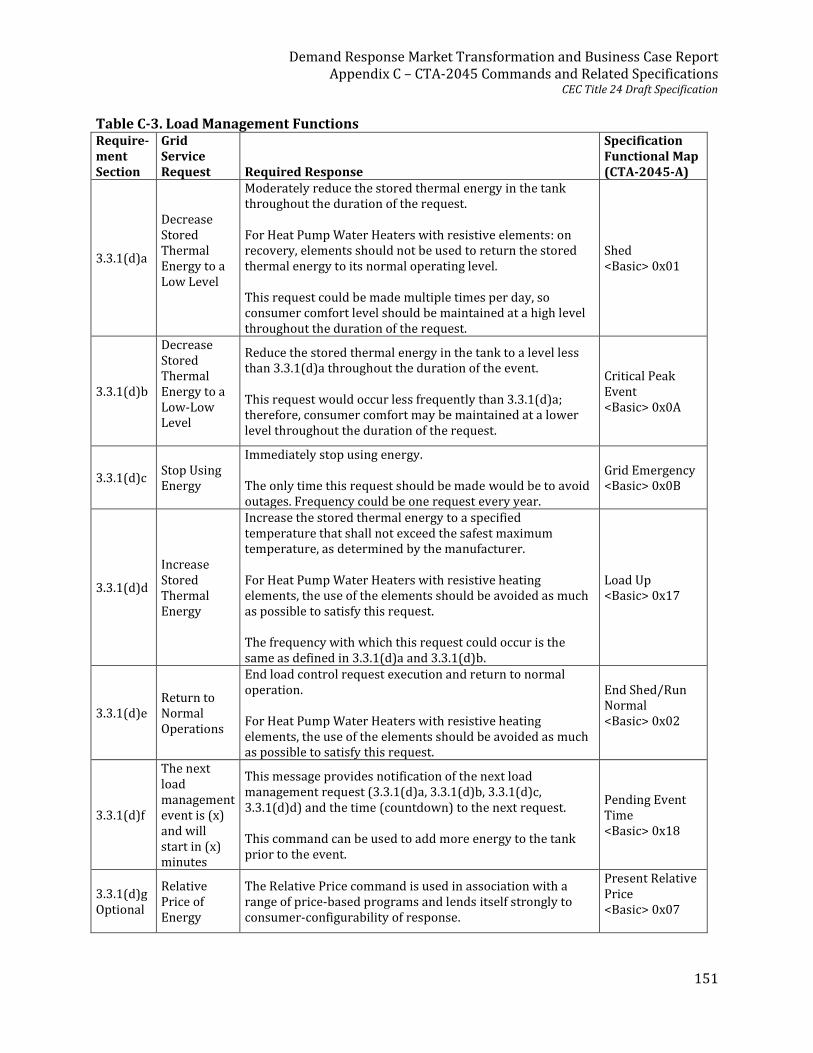
Demand Response Market Transformation and Business Case Report Appendix C – CTA-2045 Commands and Related Specifications
CEC Title 24 Draft Specification
151
Table C-3. Load Management Functions Require-ment Section
Grid Service Request Required Response
Specification Functional Map (CTA-2045-A)
3.3.1(d)a
Decrease Stored Thermal Energy to a Low Level
Moderately reduce the stored thermal energy in the tank throughout the duration of the request. For Heat Pump Water Heaters with resistive elements: on recovery, elements should not be used to return the stored thermal energy to its normal operating level. This request could be made multiple times per day, so consumer comfort level should be maintained at a high level throughout the duration of the request.
Shed <Basic> 0x01
3.3.1(d)b
Decrease Stored Thermal Energy to a Low-Low Level
Reduce the stored thermal energy in the tank to a level less than 3.3.1(d)a throughout the duration of the event. This request would occur less frequently than 3.3.1(d)a; therefore, consumer comfort may be maintained at a lower level throughout the duration of the request.
Critical Peak Event <Basic> 0x0A
3.3.1(d)c Stop Using Energy
Immediately stop using energy. The only time this request should be made would be to avoid outages. Frequency could be one request every year.
Grid Emergency <Basic> 0x0B
3.3.1(d)d
Increase Stored Thermal Energy
Increase the stored thermal energy to a specified temperature that shall not exceed the safest maximum temperature, as determined by the manufacturer. For Heat Pump Water Heaters with resistive heating elements, the use of the elements should be avoided as much as possible to satisfy this request. The frequency with which this request could occur is the same as defined in 3.3.1(d)a and 3.3.1(d)b.
Load Up <Basic> 0x17
3.3.1(d)e Return to Normal Operations
End load control request execution and return to normal operation. For Heat Pump Water Heaters with resistive heating elements, the use of the elements should be avoided as much as possible to satisfy this request.
End Shed/Run Normal <Basic> 0x02
3.3.1(d)f
The next load management event is (x) and will start in (x) minutes
This message provides notification of the next load management request (3.3.1(d)a, 3.3.1(d)b, 3.3.1(d)c, 3.3.1(d)d) and the time (countdown) to the next request. This command can be used to add more energy to the tank prior to the event.
Pending Event Time <Basic> 0x18
3.3.1(d)g Optional
Relative Price of Energy
The Relative Price command is used in association with a range of price-based programs and lends itself strongly to consumer-configurability of response.
Present Relative Price <Basic> 0x07

Demand Response Market Transformation and Business Case Report Appendix C – CTA-2045 Commands and Related Specifications
CEC Title 24 Draft Specification
152
• If local communication across the port is lost for more than 15 minutes, e.g., if the
module is unplugged, the water heater shall return to normal operations. • If the water heater is under remote load management, and remote communication is
lost for more than 12 hours, the water heater shall revert to local independent load management until remote communication is reestablished.
3.3.2. Feedback Requirements
This section specifies the information (data) required to perform closed loop control or to verify system performance.
• The data made available to technologies connected to the communication interface shall not be older than 60 seconds.
The data in the following table must be made available through the communication interface:
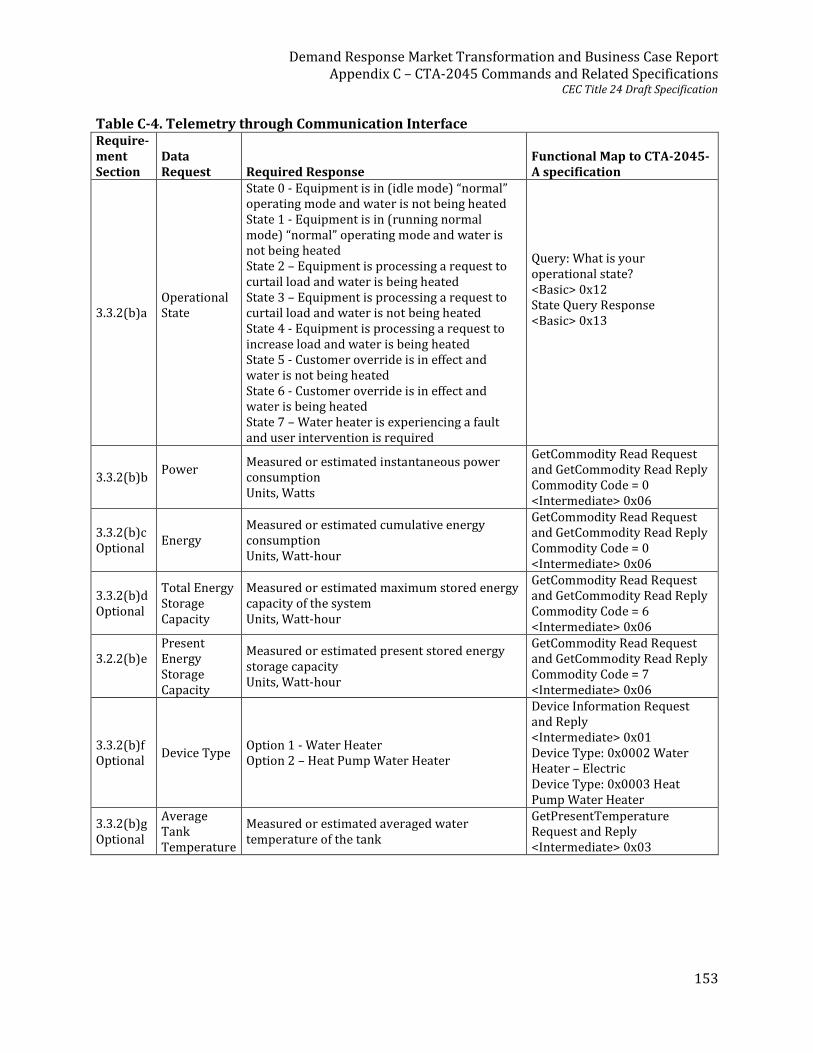
Demand Response Market Transformation and Business Case Report Appendix C – CTA-2045 Commands and Related Specifications
CEC Title 24 Draft Specification
153
Table C-4. Telemetry through Communication Interface Require-ment Section
Data Request Required Response
Functional Map to CTA-2045-A specification
3.3.2(b)a Operational State
State 0 - Equipment is in (idle mode) “normal” operating mode and water is not being heated State 1 - Equipment is in (running normal mode) “normal” operating mode and water is not being heated State 2 – Equipment is processing a request to curtail load and water is being heated State 3 – Equipment is processing a request to curtail load and water is not being heated State 4 - Equipment is processing a request to increase load and water is being heated State 5 - Customer override is in effect and water is not being heated State 6 - Customer override is in effect and water is being heated State 7 – Water heater is experiencing a fault and user intervention is required
Query: What is your operational state? <Basic> 0x12 State Query Response <Basic> 0x13
3.3.2(b)b Power
Measured or estimated instantaneous power consumption Units, Watts
GetCommodity Read Request and GetCommodity Read Reply Commodity Code = 0 <Intermediate> 0x06
3.3.2(b)c Optional
Energy Measured or estimated cumulative energy consumption Units, Watt-hour
GetCommodity Read Request and GetCommodity Read Reply Commodity Code = 0 <Intermediate> 0x06
3.3.2(b)d Optional
Total Energy Storage Capacity
Measured or estimated maximum stored energy capacity of the system Units, Watt-hour
GetCommodity Read Request and GetCommodity Read Reply Commodity Code = 6 <Intermediate> 0x06
3.2.2(b)e
Present Energy Storage Capacity
Measured or estimated present stored energy storage capacity Units, Watt-hour
GetCommodity Read Request and GetCommodity Read Reply Commodity Code = 7 <Intermediate> 0x06
3.3.2(b)f Optional
Device Type Option 1 - Water Heater Option 2 – Heat Pump Water Heater
Device Information Request and Reply <Intermediate> 0x01 Device Type: 0x0002 Water Heater – Electric Device Type: 0x0003 Heat Pump Water Heater
3.3.2(b)g Optional
Average Tank Temperature
Measured or estimated averaged water temperature of the tank
GetPresentTemperature Request and Reply <Intermediate> 0x03
Demand Response Market Transformation and Business Case Report Appendix C – CTA-2045 Commands and Related Specifications
CEC Title 24 Draft Specification
154
3.4. On-Premise Water Heater TOU Management Technology The load management functions defined in Section 3.3 must be usable by an external, on-premise control technology to optimize performance against TOU rate schedules. The on-premise TOU management technology is hardware, either external or internal to the water heater, designed to manage the water heater control functions (as defined in Section 3.3) to optimize operations under different TOU rate schedules. The technology should be designed to enable the installer or customer to influence load management capabilities of the water heater system. This technology could provide additional building management services, but must:
a) Have at least two communication interfaces: 1) One shall be compliant with the same Open Standard embedded into the
water heater system (see Section 3.2); and support the application layer messages mapped to the requirements in Section 3.3.1 and Section 3.3.2.
2) The second must be capable of retrieving or receiving TOU rate schedules that, at a minimum,
i. Support four seasonal tables of 168-hour tables, beginning for the hour ending 0100 Sunday, of any number of tiers or price values; and
ii. Have a separate start date for each season b) Have program settings implemented in non-volatile memory to be resilient to
loss of power c) System clock shall have a battery backup d) Have an internal clock that can maintain accurate time by listening to WWV or
GPS, with automatic DST support, and at least 20 years e) If price forecasts are available, the technology should optimize load management
based on the forecast f) Automatically determine, execute, and monitor the most appropriate load
control strategy to use to provide the most value to the customer using their TOU rate schedule 1) If price forecasts are available, the technology must determine, execute, and
monitor the most appropriate load control strategy to use to provide the most value to the customer using the forecast schedule
g) Include user interfaces with at least the following capabilities: 1) LED to indicate the following information
i. Communication between the technology and water heater is healthy ii. Time sync has been lost
iii. TOU table has been updated 2) Manually set up and modify TOU rate schedules 3) Upload TOU rate schedules through an Open Standard, such as
i. CTA-2045 standard plug ii. USB port that could enable TOU tables to be uploaded
iii. IEEE 802.11 that can be accessed locally through a phone application that could be used to upload schedules.

Demand Response Market Transformation and Business Case Report Appendix C – CTA-2045 Commands and Related Specifications
CEC Title 24 Draft Specification
155
4) Provide a visualization tool to allow a building inspector or HERS rater to verify:
i. That TOU rate schedules have been entered correctly; and ii. The technology is successfully communicating with the water heater
system; and iii. That all water heater control functions can be managed.
3.5. Installation Requirements
The electric water heating system with load management shall be installed with a thermostatic mixing valve complying with all federal, state, and local safety codes, and that closes in a position that only allows cold water to flow on failure. The thermostatic mixing valve shall be either built into the water heater or installed separately. The electric water heating system with load management shall be installed and set up either for local load management, or for remote load management with local load management as a fallback. 4. Field Verification The electric water heater and on-premise water heater TOU management technology shall be verified as model(s) certified to the Energy Commission as qualified for credit as an electric water heating system with load management (see the following table). Opcode 0x12 requests the operational state of the SGD and Opcode 0x13 provides the response. The Opcode 0x13 response includes a single byte Opcode2 that describes the state of the device. The following may be extended in future versions of CTA‐2045. Up to 255 states may be defined.
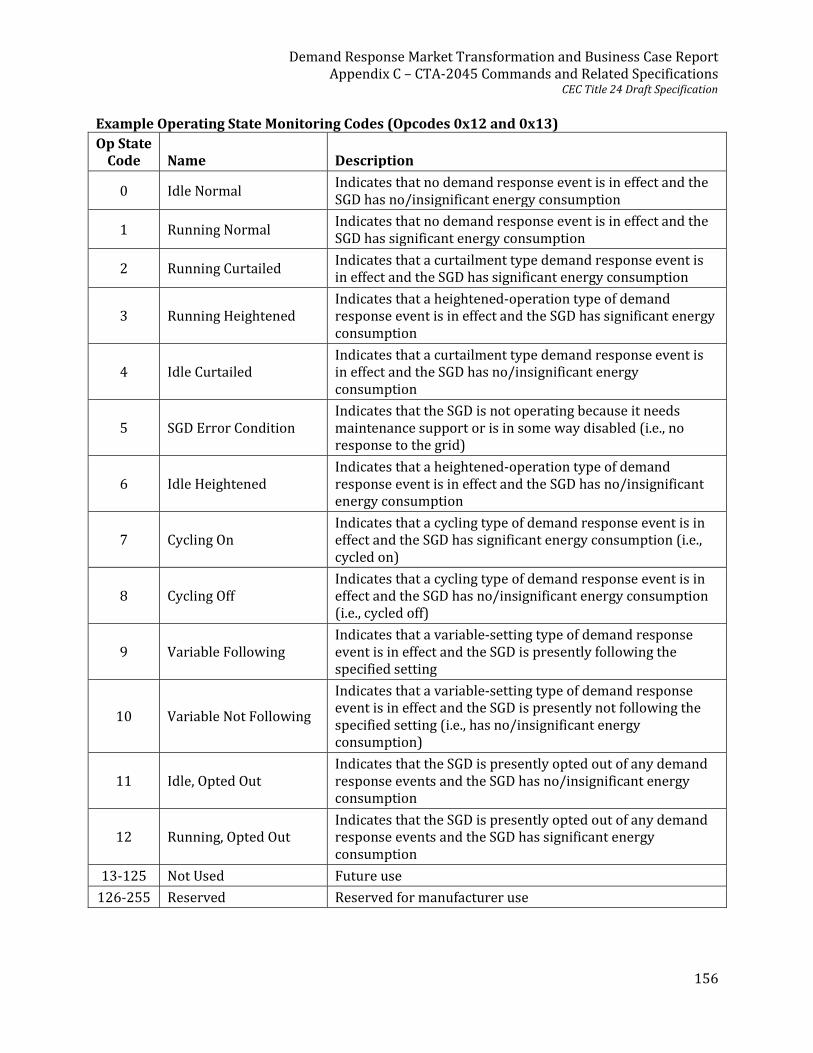
Demand Response Market Transformation and Business Case Report Appendix C – CTA-2045 Commands and Related Specifications
CEC Title 24 Draft Specification
156
Example Operating State Monitoring Codes (Opcodes 0x12 and 0x13) Op State
Code Name Description
0 Idle Normal Indicates that no demand response event is in effect and the SGD has no/insignificant energy consumption
1 Running Normal Indicates that no demand response event is in effect and the SGD has significant energy consumption
2 Running Curtailed Indicates that a curtailment type demand response event is in effect and the SGD has significant energy consumption
3 Running Heightened Indicates that a heightened‐operation type of demand response event is in effect and the SGD has significant energy consumption
4 Idle Curtailed Indicates that a curtailment type demand response event is in effect and the SGD has no/insignificant energy consumption
5 SGD Error Condition Indicates that the SGD is not operating because it needs maintenance support or is in some way disabled (i.e., no response to the grid)
6 Idle Heightened Indicates that a heightened‐operation type of demand response event is in effect and the SGD has no/insignificant energy consumption
7 Cycling On Indicates that a cycling type of demand response event is in effect and the SGD has significant energy consumption (i.e., cycled on)
8 Cycling Off Indicates that a cycling type of demand response event is in effect and the SGD has no/insignificant energy consumption (i.e., cycled off)
9 Variable Following Indicates that a variable‐setting type of demand response event is in effect and the SGD is presently following the specified setting
10 Variable Not Following
Indicates that a variable‐setting type of demand response event is in effect and the SGD is presently not following the specified setting (i.e., has no/insignificant energy consumption)
11 Idle, Opted Out Indicates that the SGD is presently opted out of any demand response events and the SGD has no/insignificant energy consumption
12 Running, Opted Out Indicates that the SGD is presently opted out of any demand response events and the SGD has significant energy consumption
13-125 Not Used Future use
126-255 Reserved Reserved for manufacturer use
Demand Response Market Transformation and Business Case Report
Appendix D – Study Method
157
Appendix D – Study Method: BPA Water Heater Demand Response (CTA-2045) Evaluation, Measurement, & Verification Plan This evaluation plan describes the evaluation, measurement, and verification (EM&V) activities that will take place as part of the Bonneville Power Administration (BPA)-funded water heater demand response (DR) pilot using CTA-2045 communication technology. This plan summarizes all the planned activities from pilot planning all the way to the final evaluation report.
Project Research Goals I. Determine a statistically valid kW reduction (on-peak) from "smart" resistance and
heat pump water heaters by hour (i.e., how it changes over the duration of an event). This will be done for different commands including shed and grid emergencies.
Specific peak hours are to be agreed upon by the participating utilities. In shoulder and winter months (October – April), utility peak loads tend to occur between 6:00a.m. and 10:00a.m., or between 5:00p.m. and 9:00p.m., depending on weather pattern and geographic area in the Northwest. In the summer, utility peak load usually occurs between 4:00p.m. and 8:00p.m. Since the Western Electricity Coordinating Council (WECC) serves a summer-peaking region, there are market opportunities for control even if a specific utility is a winter-peaking utility. This objective determines the level of kW reduction available from smart resistance water heaters. This number is unknown for heat pump water heaters.
II. Demonstrate a 24x7 control paradigm for shifting load and renewables integration,
i.e.,
A. Quantify, via late afternoon/evening curtailment, kWh that can be shaped to load at night
B. Quantify, via morning curtailment, the kWh that can be shifted to mid-day C. Understand how to shift energy on a regular basis D. Determine the energy that can be shifted to off-peak hours
These data form the basis of determining how much system “DEC” (load increase) can be created from simple “on/off” control without the need to overheat the water (above 140° F) and require a hard-piped mixing valve for human safety. Taking away some hot water capacity from the tank – that is, allowing the lower portion of the tank to cool down below the set point – creates a dispatchable energy sink resource that can be deployed at any time of the day, making it very attractive as a DEC resource to serve wind integration needs. The challenge is to ensure the consumer’s hot water needs are always met (see Goal III).
Demand Response Market Transformation and Business Case Report
Appendix D – Study Method
158
III. Evaluate customer acceptance/impact of 24x7 DR operation of their water heaters.
This is the test to determine whether frequent water heater control, in combination with “smart” water heater control logic, is a sustainable process. It is anticipated that lessons learned from this small-scale deployment will assist in future programs. Specific questions include:
A. Can add-on communication be done by the average tech-savvy homeowner,
with minimal utility support? This is expected to be a fairly simple process (plug in module, log in to website, etc.).
B. Is communication robust? C. Does control model succeed from a consumer perspective, i.e., sufficient
satisfaction, despite frequent control events, to the degree that customers want to continue program participation? (Comfort, ease of participation, minimal intrusiveness)
IV. Analyze data reported from universal communication modules (UCMs).
A. Learn about customer use of overrides – frequency, seasonality B. Problems – Wi-Fi, customers quitting, hardware? C. Seasonality – water temperature is different, usage patterns are different.
Can less energy be shifted in the summer than the winter (current hypothesis)?
D. Segment results on tank type and size, and number of occupants in the home
V. Do smart water heaters work?
A smart device is a load-consuming device that uses a microprocessor-based control system. The control algorithm is designed to benefit both the grid and the customer.
A. Does the interaction between CTA-2045 control commands and the water
heater control logic work as intended? (i.e., without undesirable effects) B. Is device-reported data accurate? (submetered data vs. reported via UCM) C. Can managed DECs work? Capacity depends on preceding load and control
strategy. This will be done for different control strategies (levels, duration, combinations, and timing of load reduction commands, namely: shed and grid emergencies)
VI. Identify and answer other research questions that come up from reported data.
Demand Response Market Transformation and Business Case Report
Appendix D – Study Method
159
Measurement and Verification Plan Measurement and verification (M&V) activities for this pilot were ongoing throughout the life of the pilot. They are meant to get both a near-real-time estimate of the energy impacts of demand response events as well as a longer-term post-event evaluation of program impacts. Pacific Northwest National Laboratory (PNNL) agreed to conduct the M&V and evaluation activities for the demand response pilot. The M&V analysis provided an estimate of the energy impacts of each event to BPA to inform further event scheduling as well as to inform BPA of data quality issues. Baselines and Impact Reporting Metrics Three baselines were developed for each event: Baseline 1 - Randomized Control Trial A randomized control trial was developed that puts the sample of participants into four mutually exclusive groups. The groups were rotated into treatment and comparison groups. BPA assigned about 50% of the participant households from each device type/utility combination to a “Group A” and about 50% to a “Group B.” Whenever Group A has an event, Group B does not. This will allow Group A to serve as Group B’s baseline in the impact analysis, and vice versa.
1. Resistance Water Heaters – Group A. 2. Resistance Water Heaters – Group B. 3. Heat Pump Water Heaters – Group A. 4. Heat Pump Water Heaters – Group B.
Initial data captured during a “learning phase” of the pilot informed the formation of the sample groups. The groups should be distributed in a manner that makes them essentially identical to one another based on known information from survey results and observed data. A k-means clustering analysis was conducted on the data collected from water heaters to inform the sample design. The cluster model finds patterns in the data elements that the model is given to create homogeneous clusters in the sample of water heaters. The final sample for heat pump water heaters was built from a six-cluster model using five variables. The five variables used are:
• Average weekly total consumption in kWh. • Average weekly number of minutes that the water heater used over 1000 watts (a
proxy for being in resistance mode). • Average weekly high morning peak energy (5a.m.-9a.m.). • Average weekly high evening peak energy (5p.m.-9p.m.). • GE or AO Smith brand.
The initial sample design for heat pump water heaters appeared to produce nearly identical groups based on a six-cluster model.
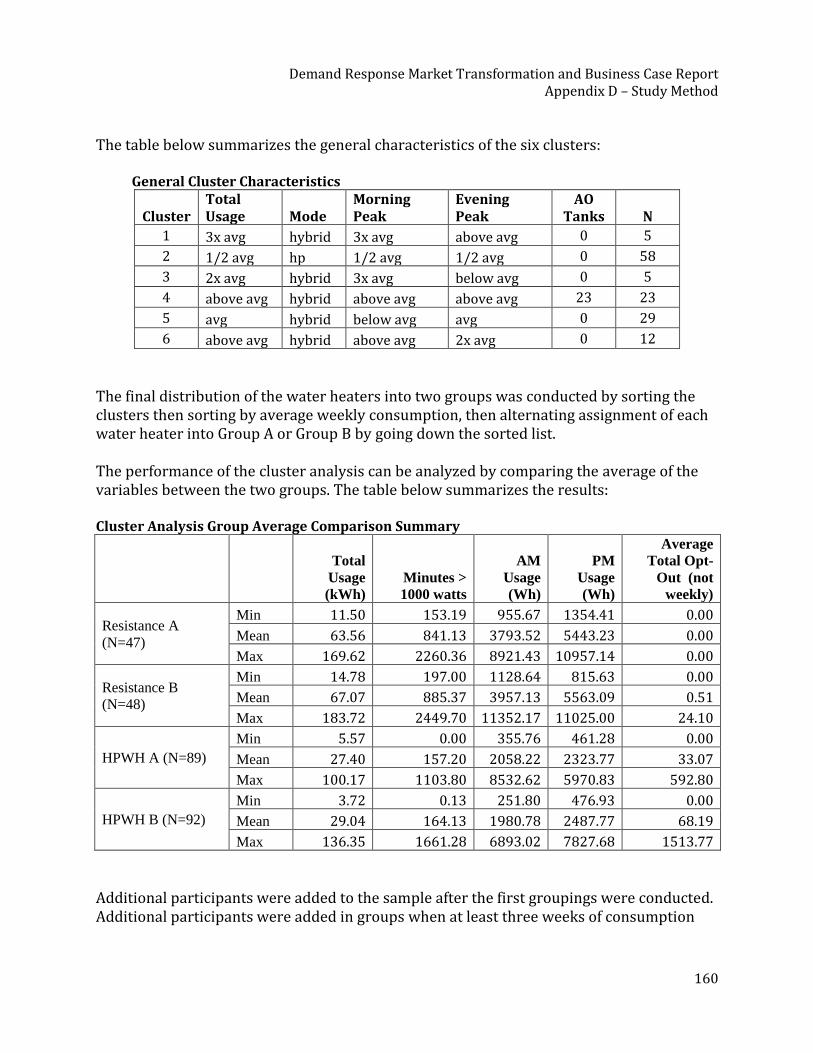
Demand Response Market Transformation and Business Case Report
Appendix D – Study Method
160
The table below summarizes the general characteristics of the six clusters:
General Cluster Characteristics
Cluster Total Usage Mode
Morning Peak
Evening Peak
AO Tanks N
1 3x avg hybrid 3x avg above avg 0 5
2 1/2 avg hp 1/2 avg 1/2 avg 0 58
3 2x avg hybrid 3x avg below avg 0 5
4 above avg hybrid above avg above avg 23 23
5 avg hybrid below avg avg 0 29
6 above avg hybrid above avg 2x avg 0 12
The final distribution of the water heaters into two groups was conducted by sorting the clusters then sorting by average weekly consumption, then alternating assignment of each water heater into Group A or Group B by going down the sorted list. The performance of the cluster analysis can be analyzed by comparing the average of the variables between the two groups. The table below summarizes the results: Cluster Analysis Group Average Comparison Summary
Total
Usage
(kWh)
Minutes >
1000 watts
AM
Usage
(Wh)
PM
Usage
(Wh)
Average
Total Opt-
Out (not
weekly)
Resistance A
(N=47)
Min 11.50 153.19 955.67 1354.41 0.00
Mean 63.56 841.13 3793.52 5443.23 0.00
Max 169.62 2260.36 8921.43 10957.14 0.00
Resistance B
(N=48)
Min 14.78 197.00 1128.64 815.63 0.00
Mean 67.07 885.37 3957.13 5563.09 0.51
Max 183.72 2449.70 11352.17 11025.00 24.10
HPWH A (N=89)
Min 5.57 0.00 355.76 461.28 0.00
Mean 27.40 157.20 2058.22 2323.77 33.07
Max 100.17 1103.80 8532.62 5970.83 592.80
HPWH B (N=92)
Min 3.72 0.13 251.80 476.93 0.00
Mean 29.04 164.13 1980.78 2487.77 68.19
Max 136.35 1661.28 6893.02 7827.68 1513.77
Additional participants were added to the sample after the first groupings were conducted. Additional participants were added in groups when at least three weeks of consumption

Demand Response Market Transformation and Business Case Report
Appendix D – Study Method
161
data had been captured; a cluster analysis was performed on the additional participants to properly place them into groups that would result in a balanced sample. Baseline 2 – Prior Week Baseline 2 consists of the participant’s average power in watts in the same hour of the previous week by weekday average and weekend average. For example, if an event is called at 10a.m. on a Tuesday of an event week, the baseline is the average power from 10-11a.m. on the previous Monday – Friday. Similarly, if an event is called at 10a.m. on a Saturday of an event week, the baseline is the average power from 10-11a.m. on the previous Saturday and Sunday. Baseline 3 – All Previous Weeks The all-previous-week baseline will consist of the participant households’ power for all weekdays and time periods in all of the previous non-event baseline weeks. In this case, if an event were called on a Tuesday, the baseline would be the average power in that hour of all of the previous weekdays with no events, i.e., the average of all points at 10-11a.m. on weekdays. Weekends are treated separately, so the baseline for an event at 10-11a.m. on a Saturday is the consumption from 10-11a.m. on all previous non-event weeks on Saturdays and Sundays. During the “winter” and “spring” analysis periods, we compared the impact results from using each of the three baseline approaches. The first two evaluation approaches yield similar results for most times of day. Baseline 3 often created similar results, but as noted in Appendix E – Impact Analysis, required substantially more work to implement, and results were frequently not available (see Table 2 in Appendix E, page ). Ultimately, to ensure we had sufficient man-hours to complete the event analysis, we stopped computing results using Baseline 3. As noted in Chapter 3 of the main report, we based the economic analysis on the average results obtained from using Baseline 1 and Baseline 2 for each event type. Calculations Power by Hour Power resource planners typically forecast for capacity in hourly increments; therefore, capacity reduction should be calculated in hourly increments. The equation below indicates how the change in capacity “delta kW” should be calculated and reported. Watts are captured in one-minute increments and shall be summed to 60-minute time periods and then divided by 60 to get the average watts in the hour. Finally, the results are divided by 1000 to convert into kW. This calculation is done for every hour in the baseline period and then subtracted by the average kW in the same hour in the event period. Delta kW = [(∑(minutes 1-60)Watts /60)/1000](baseline hour) – [(∑(minutes 1-60) Watts/60)/1000](event hour)
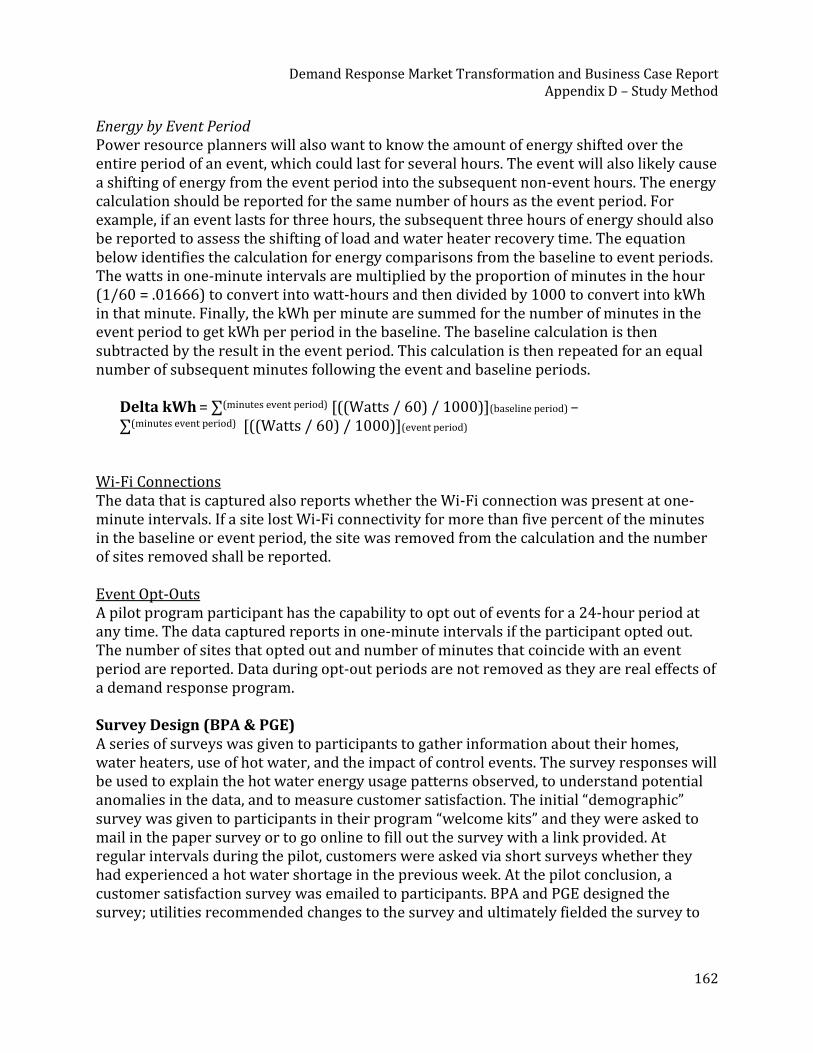
Demand Response Market Transformation and Business Case Report
Appendix D – Study Method
162
Energy by Event Period Power resource planners will also want to know the amount of energy shifted over the entire period of an event, which could last for several hours. The event will also likely cause a shifting of energy from the event period into the subsequent non-event hours. The energy calculation should be reported for the same number of hours as the event period. For example, if an event lasts for three hours, the subsequent three hours of energy should also be reported to assess the shifting of load and water heater recovery time. The equation below identifies the calculation for energy comparisons from the baseline to event periods. The watts in one-minute intervals are multiplied by the proportion of minutes in the hour (1/60 = .01666) to convert into watt-hours and then divided by 1000 to convert into kWh in that minute. Finally, the kWh per minute are summed for the number of minutes in the event period to get kWh per period in the baseline. The baseline calculation is then subtracted by the result in the event period. This calculation is then repeated for an equal number of subsequent minutes following the event and baseline periods.
Delta kWh = ∑(minutes event period) [((Watts / 60) / 1000)](baseline period) – ∑(minutes event period) [((Watts / 60) / 1000)](event period)
Wi-Fi Connections The data that is captured also reports whether the Wi-Fi connection was present at one-minute intervals. If a site lost Wi-Fi connectivity for more than five percent of the minutes in the baseline or event period, the site was removed from the calculation and the number of sites removed shall be reported. Event Opt-Outs A pilot program participant has the capability to opt out of events for a 24-hour period at any time. The data captured reports in one-minute intervals if the participant opted out. The number of sites that opted out and number of minutes that coincide with an event period are reported. Data during opt-out periods are not removed as they are real effects of a demand response program. Survey Design (BPA & PGE) A series of surveys was given to participants to gather information about their homes, water heaters, use of hot water, and the impact of control events. The survey responses will be used to explain the hot water energy usage patterns observed, to understand potential anomalies in the data, and to measure customer satisfaction. The initial “demographic” survey was given to participants in their program “welcome kits” and they were asked to mail in the paper survey or to go online to fill out the survey with a link provided. At regular intervals during the pilot, customers were asked via short surveys whether they had experienced a hot water shortage in the previous week. At the pilot conclusion, a customer satisfaction survey was emailed to participants. BPA and PGE designed the survey; utilities recommended changes to the survey and ultimately fielded the survey to

Demand Response Market Transformation and Business Case Report
Appendix D – Study Method
163
their customers. Findings from the surveys can be found in Appendix G – Customer Interactions. Analysis of Initial Survey Results (BPA) BPA will analyze the initial survey results to learn about the characteristics of participant households. BPA used the data to form the different sample groups. Event Scheduling Plan There are two schedules for demand response events: “Regular,” the routine events, and “Special” events based on extreme weather events. During most of the year, including shoulder months (March-May and October-November) when potential system peak days may not be weather-related, events will occur on a week on/week off basis. Any number of events could occur within an event week. The following table displays the high-level event strategy over the course of the pilot program. The events in the early phases of the pilot were shorter in duration and included fewer events per day and per week. The goal of the early phase was to test peak demand impacts and simple energy shifting. As the pilot program progressed, the events got longer in duration and included up to two events per day to test multiple peak issues and more complex shifts of energy. High-Level Event Strategy Phase 1 Phase 2 Phase 3 Phase 4 Phase 5 Aug-mid
Sep 2017 Mid Sep-Oct
2017 Nov 2017-Feb 2018
Mar-May 2018
Jun-Aug 2018
Objective Peak demand, simple energy
shifts
More advanced
energy shifts
Peak demand, simple energy
shifts
Complex energy shift
events
Peak demand, simple energy
shifts
Average length of event 2 hrs 3 hrs < 4 hrs < 6 hrs < 4 hrs # events per day 1 1 2 2 2 If two events in a day, minimum time between events
6 hrs 6 hrs 6 hrs
Events per two weeks < 4 < 7 < 7 < 7 < 7
“Special” extreme weather events may occur during winter and summer months (June-September and December-February). Events continued to be called on a week on/week off basis; however, there was an opportunity to call a special event to coincide with an actual extreme weather event, which tends to coincide with a power system peak. Extreme weather events, either extreme cold or extreme hot, may happen at any time without regard to our week-on week-off schedule, so the flexibility to call an event during a baseline week was possible. Extreme weather events have the real possibility of shifting the water draw patterns in participant households. Because extreme weather events are rare, there may be only one opportunity within one week to get a baseline and event period that coincides with extreme weather. In such cases, the baseline was re-adjusted after the event
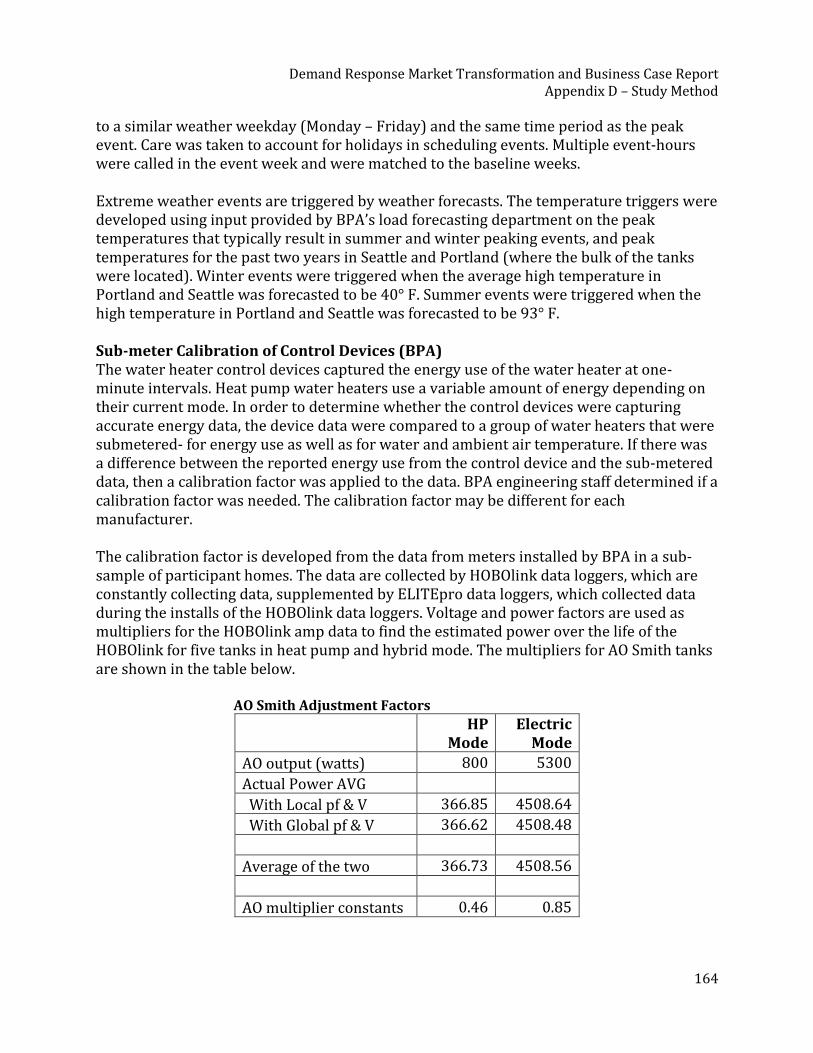
Demand Response Market Transformation and Business Case Report
Appendix D – Study Method
164
to a similar weather weekday (Monday – Friday) and the same time period as the peak event. Care was taken to account for holidays in scheduling events. Multiple event-hours were called in the event week and were matched to the baseline weeks. Extreme weather events are triggered by weather forecasts. The temperature triggers were developed using input provided by BPA’s load forecasting department on the peak temperatures that typically result in summer and winter peaking events, and peak temperatures for the past two years in Seattle and Portland (where the bulk of the tanks were located). Winter events were triggered when the average high temperature in Portland and Seattle was forecasted to be 40° F. Summer events were triggered when the high temperature in Portland and Seattle was forecasted to be 93° F. Sub-meter Calibration of Control Devices (BPA) The water heater control devices captured the energy use of the water heater at one-minute intervals. Heat pump water heaters use a variable amount of energy depending on their current mode. In order to determine whether the control devices were capturing accurate energy data, the device data were compared to a group of water heaters that were submetered- for energy use as well as for water and ambient air temperature. If there was a difference between the reported energy use from the control device and the sub-metered data, then a calibration factor was applied to the data. BPA engineering staff determined if a calibration factor was needed. The calibration factor may be different for each manufacturer. The calibration factor is developed from the data from meters installed by BPA in a sub-sample of participant homes. The data are collected by HOBOlink data loggers, which are constantly collecting data, supplemented by ELITEpro data loggers, which collected data during the installs of the HOBOlink data loggers. Voltage and power factors are used as multipliers for the HOBOlink amp data to find the estimated power over the life of the HOBOlink for five tanks in heat pump and hybrid mode. The multipliers for AO Smith tanks are shown in the table below.
AO Smith Adjustment Factors
HP
Mode Electric
Mode
AO output (watts) 800 5300
Actual Power AVG
With Local pf & V 366.85 4508.64
With Global pf & V 366.62 4508.48
Average of the two 366.73 4508.56
AO multiplier constants 0.46 0.85
Demand Response Market Transformation and Business Case Report
Appendix D – Study Method
165
Analysis of HOBOlink data compared to e-Radio data for GE tanks suggests that an adjustment factor is not necessary. The e-Radio data tend to slightly over-report the energy from GE tanks, but the difference is small. The absolute percent error was found to be 4.9% and the mean percent error is 1.5%. Additional Research Tasks and Questions There are a number of additional tasks that can be conducted to further study the impacts of the pilot and specific research questions that could be answered. Create a Panel Data Set Numerous research tasks can be completed by creating a panel data set from the pilot data. Panel data is a cross section – time series data set in which observations across a sample are allowed to vary as well as observations over time. It is recommended that such a data set should come from a sample of pilot data or be separated into months, since the full pilot data set at one-minute intervals can be quite large. Estimate a Regression Model A regression model can be formulated to further assess the event impacts on energy. An additional measure of kW impacts of events could be estimated by a regression model. Home characteristics and survey data could also be included to model how these elements affect event impacts.
The suggested analysis approach is a variant on difference-in-differences using panel regression on hourly energy use data. A sample regression specification would be:
• kWhit = i + h + *Treati*Eventh + it where:
• i is a fixed effect for customer i capturing the typical energy use for that home. • h is a fixed effect capturing hourly schedule differences in energy use associated with
hour h. • Treati is an indicator (0/1) variable which is 1 if the customer is in the treatment group at
the time of the event, 0 otherwise. • Eventh is an indicator (0/1) variable which is 1 if an event is occurring, 0 otherwise. • h indicates the average impact of a load control event in hour t. • ih is an error term for customer i in hour t representing unobservable effects on
energy use.
Potential additional effects to test robustness of the regression to inclusion might include:
• Separate indicators for each event. • Indicator variables for months as a proxy for seasonal variation in air and incoming
water temperature. • Utility-specific weather variables. • Variables for load-up and recovery hours.
Demand Response Market Transformation and Business Case Report
Appendix D – Study Method
166
How many tanks observe an event, and for how long? Do all tanks observe grid emergency events? The majority of events that are being called in this pilot are simple load-up, shed, and duty cycle commands as opposed to grid emergencies. This means that the water heater tank will respond to the event depending on the condition of the water heater. If a tank’s temperature is already fully heated, the tank will not turn on to load up. If a tank is heating up after a large water pull, the tank may not observe a shed command or duty cycle. While the kW impacts in the core evaluation will reflect the diversity of how tanks observe events, the details are lacking. We will want to know for an average event by time of day:
• How many tanks observed a load-up command? • How many tanks observed a shed command, and for how long? • How many tanks observed a duty cycle command? • How many tanks observed a grid emergency command?
Do events cause heat pump water heaters to use more energy? Heat pump water heaters that are set in “hybrid” mode use the compressor first to heat water, and can also rely on the tank’s resistance element to heat water faster if needed and called for by the manufacturer’s control strategies. After a shed event, a heat pump water heater will often turn on to recover temperature lost during an event. Do events cause heat pump water heaters to use more resistance heat? If so, does the duration of an event cause an increase in resistance heat utilization? How does hot water demand before, during or after an event influence resistance heat utilization? Are there differences in kW impact by home or tank characteristics? The kW impacts of demand response events are likely to vary depending on the local conditions of the tank and how hot water is used in homes. Differences in kW impacts of events shall be analyzed by the following characteristics:
• The location of the water heater (conditioned, unconditioned, or semi-conditioned space).
• HPWH brand (GE or AO Smith). • HPWH mode (heat pump, resistance, hybrid). • Number of occupants in home. • Outdoor air temperature. • Number of water heaters in home.
More load-up with longer load-up periods? In the spring of 2018, the load-up periods for heat pump water heaters and resistance tanks were lengthened after observing very small load impacts during load-up periods. HPWHs’ load-up times were increased from 60 minutes to 120 minutes, and resistance tanks were increased from 15 minutes to 45 minutes. The thought was that doing so allowed a larger window for tanks to lose heat and then to turn on during the load-up

Demand Response Market Transformation and Business Case Report
Appendix D – Study Method
167
period prior to an event period. If more tanks were loading up, then it’s possible that more tanks would be able to stay off during a whole event period, thus increasing the average event impact. Average recovery period by length of events, time of day & demand on system The recovery period for heat pump water heaters is of interest in this pilot. Is the length of the recovery or energy used during the recovery period related to the length of events, day of week or time of day? Grid system operators will want to know the effect on the system after a demand response event. Are duty cycles working? After demand response events, water heaters were often put on duty cycles so they would run, for instance, only 30% of an hour to create a slow and steady ramp-up on the grid. We observed that some AO Smith tanks appeared to always observe the duty cycle while some GE tanks did not observe duty cycles. What is happening in the sample population during duty cycle events?

Demand Response Market Transformation and Business Case Report
Appendix E – Impact Analysis
168
Appendix E – Impact Analysis The report that begins on the next page was produced by the Pacific Northwest National Laboratory (PNNL) in partnership with the Bonneville Power Administration (BPA), Portland General Electric (PGE), and the Northwest Energy Efficiency Alliance (NEEA). It describes the results of studies of the demand response capability of heat pump water heaters compared with electric resistance water heaters in the Pacific Northwest.
Demand Response Market Transformation and Business Case Report
Appendix E – Impact Analysis
169
Load Shifting Using Storage Water Heaters in the Pacific Northwest
Cheryn Metzger, Travis Ashley, Sadie Bender, and Scott Morris, Pacific Northwest National Laboratory
Conrad Eustis, Portland General Electric Phillip Kelsven, Eva Urbatsch and Nathan Kelly, Bonneville Power Administration
ABSTRACT
The Pacific Northwest National Laboratory, in partnership with the Bonneville Power Administration, Portland General Electric, and the Northwest Energy Efficiency Alliance, studied the demand response capability of heat pump water heaters compared with electric resistance water heaters in the Northwest region. The primary goals of this study were to:
• Demonstrate a 24x7 control paradigm for shifting load to align with renewable generation (e.g., evening load shifting toward later in the night when wind energy would be more prevalent);
• Determine the peak load (W) reduction between connected electric resistance (ERWHs) and heat pump water heaters (HPWHs);
• Evaluate customer acceptance/impact of 24x7 demand response operation of their water heater; and
• Compare data reported from the universal communication modules to sub-metered data to determine accuracy.
HPWHs save an average of 63%54 of total energy compared to ERWHs. Results from this study showed that HPWHs offer about 62% of the energy shifting capability compared to ERWHs during a morning peak period (about 400 Wh for HPWHs compared to about 650 Wh for ERWHs) during the winter season. The peak load reduction during a winter grid emergency offers an average of 300 W for HPWHs, which is about 33% more load reduction potential compared to typical winter shed events. With a better understanding of the hot water use profiles from the winter season and slightly warmer weather, the team was comfortable conducting longer shed events during the spring season. For morning peak events in the spring, HPWHs shifted about 450 Wh per home (with an average of 3.6 hour events), while ERWHs shifted about 1290 Wh per home (with an average of 4 hour events). Grid emergency events in the spring had the
54 Based on the U.S. DOE Test Procedure (10 CFR 430.32(d)) and comparing the Energy Factor (EF) of an ERWH (EF = 0.90 to a HPWH (EF = 2.4).
Demand Response Market Transformation and Business Case Report
Appendix E – Impact Analysis
170
most demand reduction during the evening peak, which HPWHs reducing about 525 W per home and ERWHs reducing about 500 W per home. The average energy shifted during the afternoon peak55 period in the summer season was about 340 Wh (average of 4 hour events) per home for HPWHs, and about 1310 Wh per home for ERWHs (average of 4 hour events). Grid emergency events in the summer had the most demand reduction during the morning peak, with about 120 W reduction for HPWHs and about 390 W reduction for ERWHs. In addition to the energy shifting potential of this strategy, there are major peak-day load reduction savings potential due to simply switching from an ERWH to a connected HPWH. For peak days in both the summer and winter months, connected HPWHs used about 87% less energy during the morning peak period and at least 90% less energy during the evening peak period. In addition, customer acceptance of a 24x7 control paradigm was extremely high. Study participants opted-out of winter events only 4% of the time.
Background
The first modular communication interface for energy management standards was introduced by the Consumer Technology Association in January of 2013 (CTA 2013). This protocol specified mechanical parameters, electrical parameters, and communication protocols for energy-related communication of residential devices. Currently, the standard is referred to as CTA-2045-A (CTA 2018). This standard enables otherwise disconnected devices to be connected while meeting the following goals:
• The original manufacturer needs to provide only the standard CTA-2045 port (not the
additional hardware).
• Any number of stakeholders (e.g., utilities) can pay for the additional “connected”
hardware required to turn an unconnected, CTA-2045 ready appliance into a connected
appliance;
• The modular interface supports every type of communication method at the physical layer
(e.g. Wi-Fi, 4G LTE, etc.) and at the command layer (e.g. SEP, OpenADR, etc.); and
• A third party can manufacture the connected hardware.
In this project, the CTA-2045 standard was used with the water heater. This is the first study that
uses such a large number of “smart” heat pump water heaters (HPWHs) and electric resistance
water heaters (ERWHs) from multiple manufacturers. This is significant because HPWH
55 The afternoon peak in the summer is more important to utilities due to the spike in air conditioner use around 5 p.m. when people come home from work.
Demand Response Market Transformation and Business Case Report
Appendix E – Impact Analysis
171
algorithms are inherently more complicated than those for ERWHs since HPWHs can use the
heat pump, electric-resistance elements, or both to heat water. The amount of power that is
drawn from these devices varies greatly depending on what mode they are in. Their reaction to
various demand response signals is also more complex than simply turning on and off. The way
homeowners interact with these water heaters is also less predictable. This study will help
answer some of the questions surrounding the interactions between homeowners, smart water
heaters, and the grid.
This is the first study to implement so many regular load shifting events on a continual basis over
the course of a year. In a previous study (Gurlaskie 2016), the load shifting events focused on
peak energy days and provided a handful of load shifting events over the course of a year. This
study attempts to demonstrate how electric resistance and heat pump water heaters can be used to
help shift daily peak loads at least twice per day.
Project Scope
The data collection portion of this project was funded by a Technology Innovation Project
award, (TIP 336), provided by the Bonneville Power Administration (BPA 2015). The data
analysis portion of this project was funded by the U.S. Department of Energy and conducted by
the Pacific Northwest National Laboratory (PNNL). Many utilities across the Northwest were
involved in this project by recruiting homeowners and managing the installation of the connected
water heaters. Portland General Electric (PGE) provided an advisory role to this study and also
initiated all of the demand response events across all utility territories. The Northwest Energy
Efficiency Alliance (NEEA) was responsible for a larger-scale market analysis that considered
using heat pump water heaters for frequent load flattening.
The project included the analysis of 145 heat pump water heaters and 86 electric resistance water
heaters. Demand response events started in August of 2017 and water heaters were brought
online as they were installed in homes throughout the subsequent six months.
Data Collection
The CTA-2045 port (Figure E-1) provided the following data at one-minute intervals:
• Operating state (running, idle, running in a cycle mode)
• Curtail type (none, shed, grid emergency, start autonomous cycling, request power
level, load up, CTA-2045 error, customer override, end shed, terminate autonomous
cycling)
• Curtailment message (% of time the system was on during the curtailment event)
• Instantaneous watts (W)
• Total Watt-hours (Wh) (since the water heater came online)
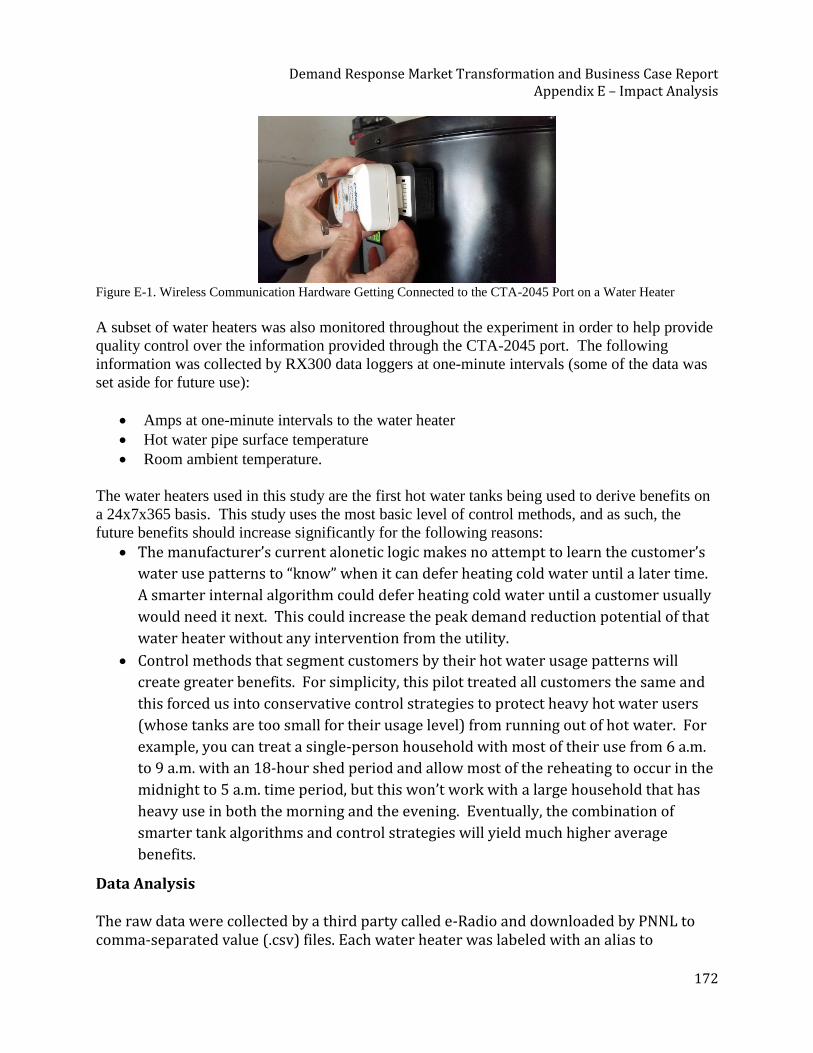
Demand Response Market Transformation and Business Case Report
Appendix E – Impact Analysis
172
Figure E-1. Wireless Communication Hardware Getting Connected to the CTA-2045 Port on a Water Heater
A subset of water heaters was also monitored throughout the experiment in order to help provide
quality control over the information provided through the CTA-2045 port. The following
information was collected by RX300 data loggers at one-minute intervals (some of the data was
set aside for future use):
• Amps at one-minute intervals to the water heater
• Hot water pipe surface temperature
• Room ambient temperature.
The water heaters used in this study are the first hot water tanks being used to derive benefits on
a 24x7x365 basis. This study uses the most basic level of control methods, and as such, the
future benefits should increase significantly for the following reasons:
• The manufacturer’s current alonetic logic makes no attempt to learn the customer’s
water use patterns to “know” when it can defer heating cold water until a later time.
A smarter internal algorithm could defer heating cold water until a customer usually
would need it next. This could increase the peak demand reduction potential of that
water heater without any intervention from the utility.
• Control methods that segment customers by their hot water usage patterns will
create greater benefits. For simplicity, this pilot treated all customers the same and
this forced us into conservative control strategies to protect heavy hot water users
(whose tanks are too small for their usage level) from running out of hot water. For
example, you can treat a single-person household with most of their use from 6 a.m.
to 9 a.m. with an 18-hour shed period and allow most of the reheating to occur in the
midnight to 5 a.m. time period, but this won’t work with a large household that has
heavy use in both the morning and the evening. Eventually, the combination of
smarter tank algorithms and control strategies will yield much higher average
benefits.
Data Analysis The raw data were collected by a third party called e-Radio and downloaded by PNNL to comma-separated value (.csv) files. Each water heater was labeled with an alias to
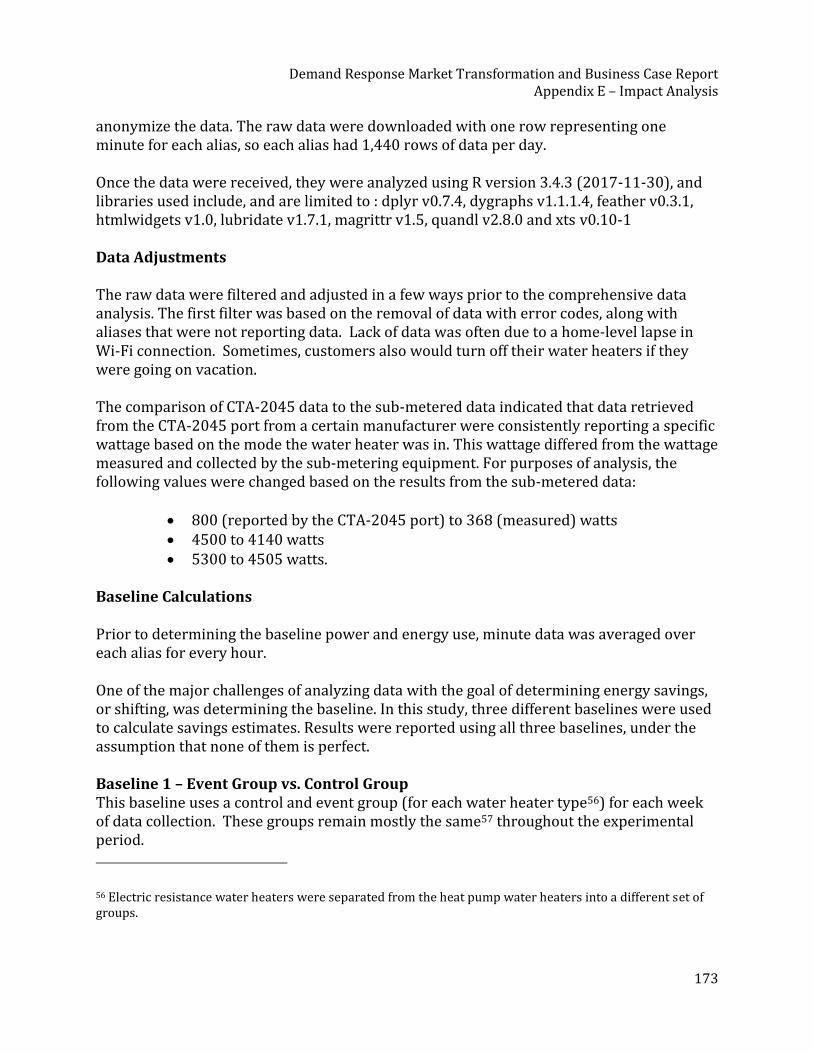
Demand Response Market Transformation and Business Case Report
Appendix E – Impact Analysis
173
anonymize the data. The raw data were downloaded with one row representing one minute for each alias, so each alias had 1,440 rows of data per day. Once the data were received, they were analyzed using R version 3.4.3 (2017-11-30), and libraries used include, and are limited to : dplyr v0.7.4, dygraphs v1.1.1.4, feather v0.3.1, htmlwidgets v1.0, lubridate v1.7.1, magrittr v1.5, quandl v2.8.0 and xts v0.10-1 Data Adjustments The raw data were filtered and adjusted in a few ways prior to the comprehensive data analysis. The first filter was based on the removal of data with error codes, along with aliases that were not reporting data. Lack of data was often due to a home-level lapse in Wi-Fi connection. Sometimes, customers also would turn off their water heaters if they were going on vacation. The comparison of CTA-2045 data to the sub-metered data indicated that data retrieved from the CTA-2045 port from a certain manufacturer were consistently reporting a specific wattage based on the mode the water heater was in. This wattage differed from the wattage measured and collected by the sub-metering equipment. For purposes of analysis, the following values were changed based on the results from the sub-metered data:
• 800 (reported by the CTA-2045 port) to 368 (measured) watts • 4500 to 4140 watts • 5300 to 4505 watts.
Baseline Calculations Prior to determining the baseline power and energy use, minute data was averaged over each alias for every hour. One of the major challenges of analyzing data with the goal of determining energy savings, or shifting, was determining the baseline. In this study, three different baselines were used to calculate savings estimates. Results were reported using all three baselines, under the assumption that none of them is perfect. Baseline 1 – Event Group vs. Control Group This baseline uses a control and event group (for each water heater type56) for each week of data collection. These groups remain mostly the same57 throughout the experimental period.
56 Electric resistance water heaters were separated from the heat pump water heaters into a different set of groups.
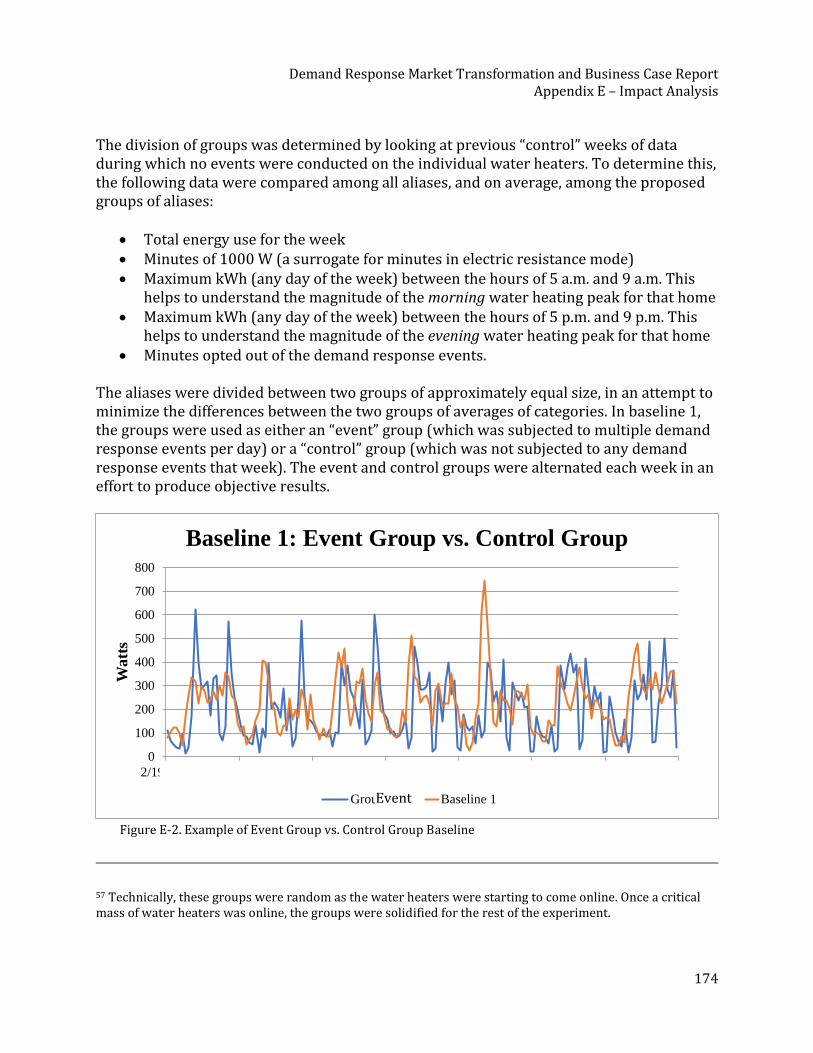
Demand Response Market Transformation and Business Case Report
Appendix E – Impact Analysis
174
The division of groups was determined by looking at previous “control” weeks of data during which no events were conducted on the individual water heaters. To determine this, the following data were compared among all aliases, and on average, among the proposed groups of aliases:
• Total energy use for the week • Minutes of 1000 W (a surrogate for minutes in electric resistance mode) • Maximum kWh (any day of the week) between the hours of 5 a.m. and 9 a.m. This
helps to understand the magnitude of the morning water heating peak for that home • Maximum kWh (any day of the week) between the hours of 5 p.m. and 9 p.m. This
helps to understand the magnitude of the evening water heating peak for that home • Minutes opted out of the demand response events.
The aliases were divided between two groups of approximately equal size, in an attempt to minimize the differences between the two groups of averages of categories. In baseline 1, the groups were used as either an “event” group (which was subjected to multiple demand response events per day) or a “control” group (which was not subjected to any demand response events that week). The event and control groups were alternated each week in an effort to produce objective results.
Figure E-2. Example of Event Group vs. Control Group Baseline
57 Technically, these groups were random as the water heaters were starting to come online. Once a critical mass of water heaters was online, the groups were solidified for the rest of the experiment.
0
100
200
300
400
500
600
700
800
2/19/2018 2/20/2018 2/21/2018 2/22/2018 2/23/2018 2/24/2018 2/25/2018
Watt
s
Baseline 1: Event Group vs. Control Group
Group14 Baseline 1Event
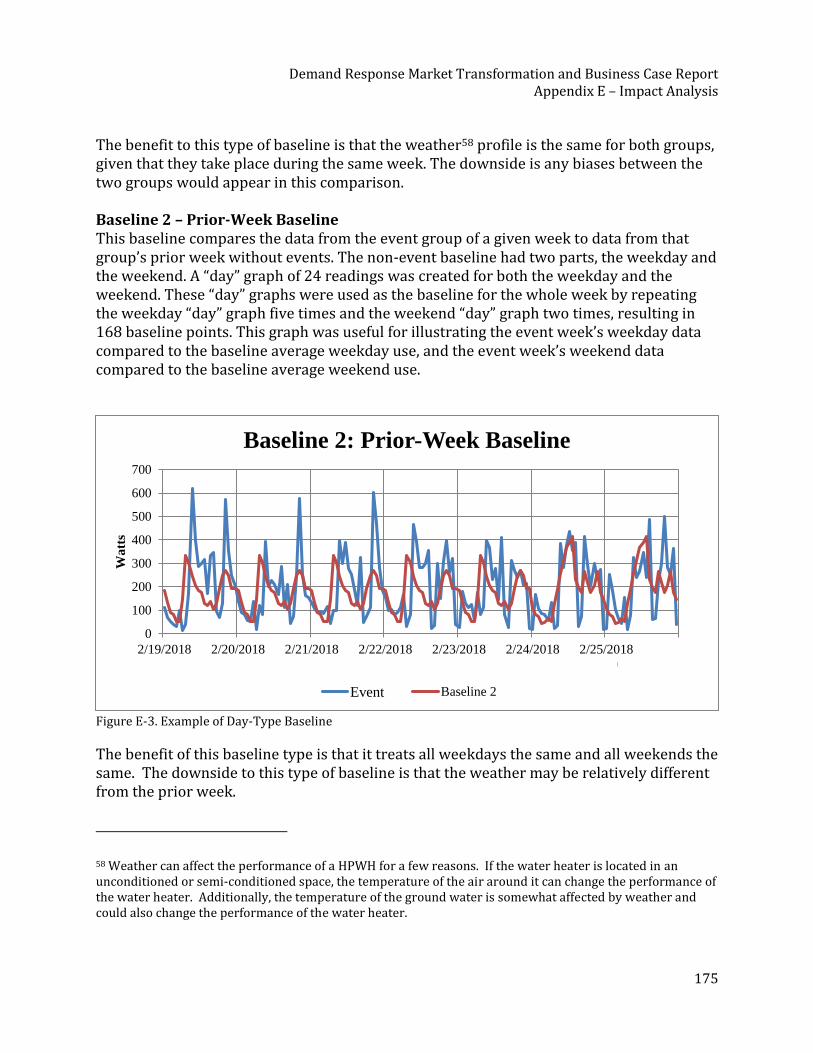
Demand Response Market Transformation and Business Case Report
Appendix E – Impact Analysis
175
The benefit to this type of baseline is that the weather58 profile is the same for both groups, given that they take place during the same week. The downside is any biases between the two groups would appear in this comparison. Baseline 2 – Prior-Week Baseline This baseline compares the data from the event group of a given week to data from that group’s prior week without events. The non-event baseline had two parts, the weekday and the weekend. A “day” graph of 24 readings was created for both the weekday and the weekend. These “day” graphs were used as the baseline for the whole week by repeating the weekday “day” graph five times and the weekend “day” graph two times, resulting in 168 baseline points. This graph was useful for illustrating the event week’s weekday data compared to the baseline average weekday use, and the event week’s weekend data compared to the baseline average weekend use.
Figure E-3. Example of Day-Type Baseline
The benefit of this baseline type is that it treats all weekdays the same and all weekends the same. The downside to this type of baseline is that the weather may be relatively different from the prior week. 58 Weather can affect the performance of a HPWH for a few reasons. If the water heater is located in an unconditioned or semi-conditioned space, the temperature of the air around it can change the performance of the water heater. Additionally, the temperature of the ground water is somewhat affected by weather and could also change the performance of the water heater.
0
100
200
300
400
500
600
700
2/19/2018
0:00
2/20/2018
0:00
2/21/2018
0:00
2/22/2018
0:00
2/23/2018
0:00
2/24/2018
0:00
2/25/2018
0:00
Wa
tts
Baseline 2: Prior-Week Baseline
Group14 Baseline 2Event
Demand Response Market Transformation and Business Case Report
Appendix E – Impact Analysis
176
Baseline 3 – Full Season Baseline This baseline compares the event group to the average of all previous non-event weeks of that group. For a given hour of the week, this baseline compares the event group to all previous non-event hours from that season. For a season of about 10 weeks (the length of time of this study), there would be 5 weeks when a given group acts as a control group. For a given hour of the event week, say 10-11 a.m., the baseline would average that hour of data across all of the 5 prior weeks when it was a control group. This baseline was more challenging to implement because the file size for the data collected in this study was so large that each week of data required up to four spreadsheets files. As a result, data from many files needed to be extracted and combined to do this analysis.
Figure E-4. Example of Hour-Matching Baseline
The benefit of the full-season baseline is that a group was used for its own baseline and the baseline was a bit smoother due to the averaging over many weeks. The downside to this baseline was that the weather patterns of the baseline were not necessarily representative of the event week.
Event Types and Event Schedules Two different types of demand response events were analyzed. The first is a load up event. This type of event forces the water heater to “charge” the water tank to its set point temperature. This strategy helps to make sure that the next energy shaving type of event will have as little effect as possible on the occupant. The shed event is the second type of event. This event tells the water heater to turn off depending on the status of the water heater. During this type of event, manufacturers program their tanks to remain on if the customer would likely be negatively affected by the command. This is why the energy use
0
100
200
300
400
500
600
700
2/19/2018
0:00
2/20/2018
0:00
2/21/2018
0:00
2/22/2018
0:00
2/23/2018
0:00
2/24/2018
0:00
2/25/2018
0:00
Wa
tts
Baseline 3: Full Season Baseline
Group14 Baseline 3Event
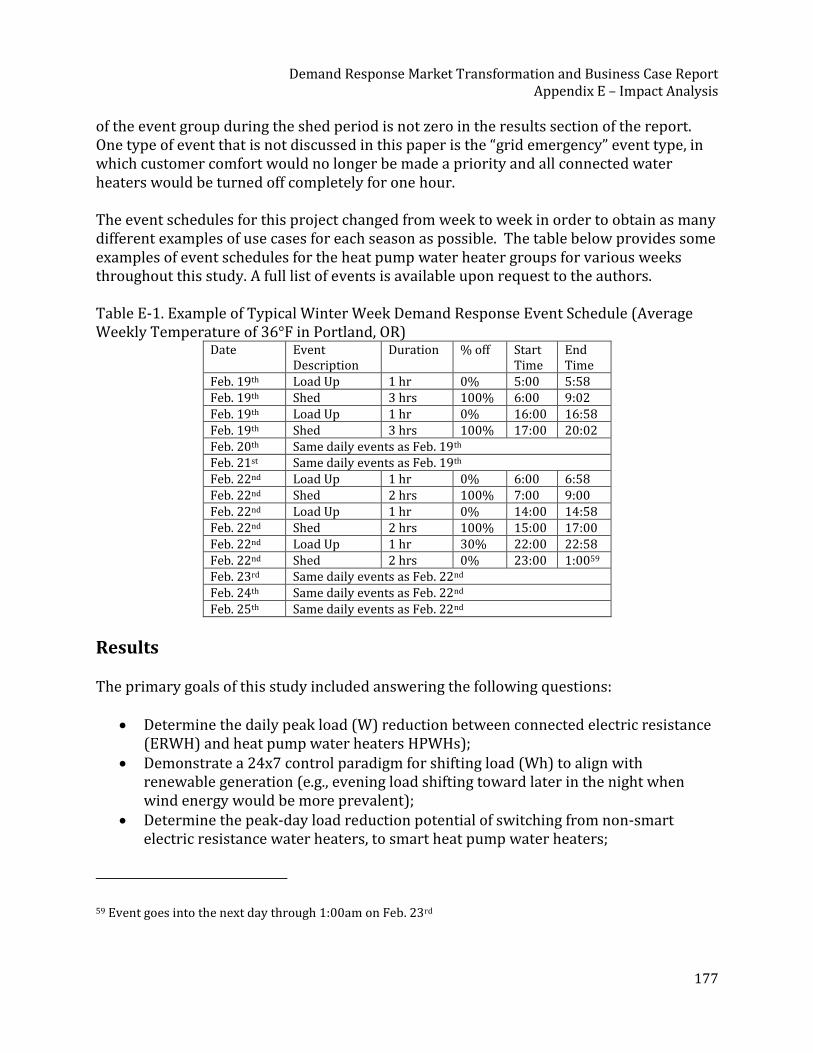
Demand Response Market Transformation and Business Case Report
Appendix E – Impact Analysis
177
of the event group during the shed period is not zero in the results section of the report. One type of event that is not discussed in this paper is the “grid emergency” event type, in which customer comfort would no longer be made a priority and all connected water heaters would be turned off completely for one hour. The event schedules for this project changed from week to week in order to obtain as many different examples of use cases for each season as possible. The table below provides some examples of event schedules for the heat pump water heater groups for various weeks throughout this study. A full list of events is available upon request to the authors. Table E-1. Example of Typical Winter Week Demand Response Event Schedule (Average Weekly Temperature of 36°F in Portland, OR)
Date Event Description
Duration % off Start Time
End Time
Feb. 19th Load Up 1 hr 0% 5:00 5:58 Feb. 19th Shed 3 hrs 100% 6:00 9:02 Feb. 19th Load Up 1 hr 0% 16:00 16:58 Feb. 19th Shed 3 hrs 100% 17:00 20:02 Feb. 20th Same daily events as Feb. 19th Feb. 21st Same daily events as Feb. 19th Feb. 22nd Load Up 1 hr 0% 6:00 6:58 Feb. 22nd Shed 2 hrs 100% 7:00 9:00 Feb. 22nd Load Up 1 hr 0% 14:00 14:58 Feb. 22nd Shed 2 hrs 100% 15:00 17:00 Feb. 22nd Load Up 1 hr 30% 22:00 22:58 Feb. 22nd Shed 2 hrs 0% 23:00 1:0059 Feb. 23rd Same daily events as Feb. 22nd Feb. 24th Same daily events as Feb. 22nd Feb. 25th Same daily events as Feb. 22nd
Results The primary goals of this study included answering the following questions:
• Determine the daily peak load (W) reduction between connected electric resistance (ERWH) and heat pump water heaters HPWHs);
• Demonstrate a 24x7 control paradigm for shifting load (Wh) to align with renewable generation (e.g., evening load shifting toward later in the night when wind energy would be more prevalent);
• Determine the peak-day load reduction potential of switching from non-smart electric resistance water heaters, to smart heat pump water heaters;
59 Event goes into the next day through 1:00am on Feb. 23rd
Demand Response Market Transformation and Business Case Report
Appendix E – Impact Analysis
178
• Evaluate customer acceptance/impact of 24x7 demand response operation of their water heater; and
• Compare data reported from the universal communication modules to sub-metered data to determine accuracy.
Shed Impacts by Time of Day – Winter One of the main goals of this project was to determine the reduction potential (on-peak) of a “smart” heat pump water heater compared to an electric resistance water heater in watts. Table E-2 provides a summary of the average watts saved-per-hour during demand response events between January 22nd, 2018, and April 1st, 2018. This date range was chosen based on a critical mass of water heaters online, unwavering distribution of the four groups, and consistent event periods throughout the day. The standard deviation provides information about the variation in energy savings potential between the 10 weeks studied during this period. Baseline 3 represents a running average over a long period of time, so the results from that Baseline are only calculated during the week of March 26th.
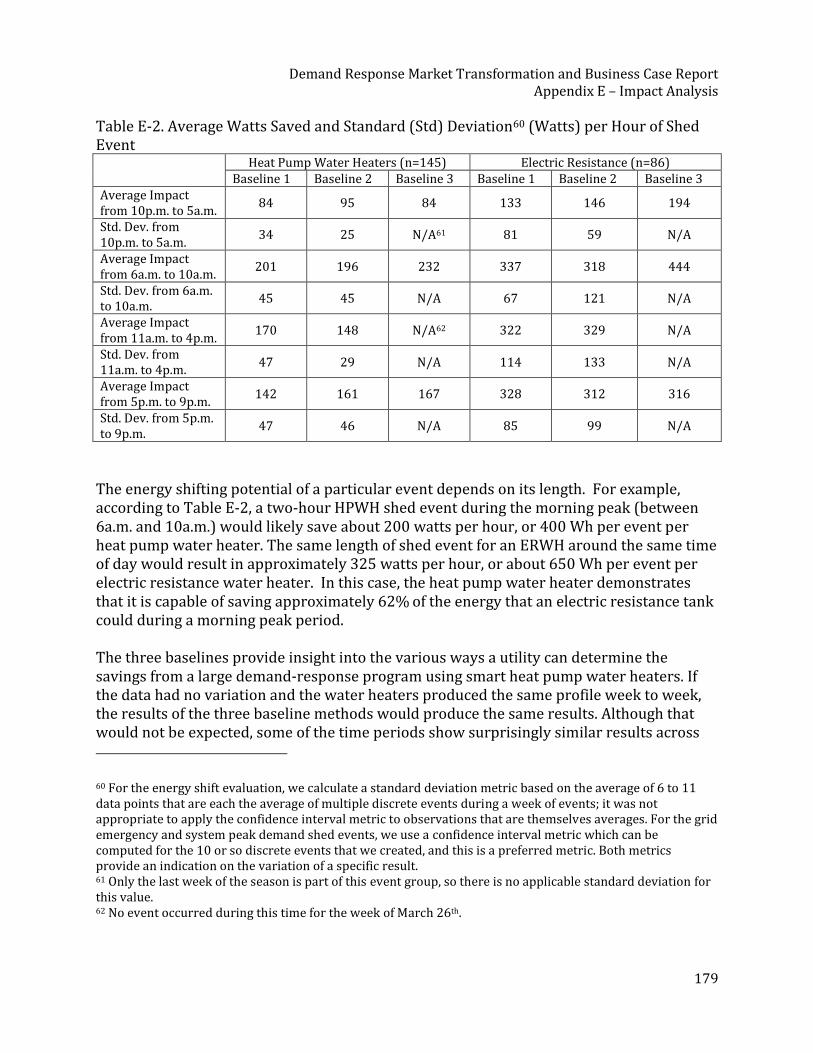
Demand Response Market Transformation and Business Case Report
Appendix E – Impact Analysis
179
Table E-2. Average Watts Saved and Standard (Std) Deviation60 (Watts) per Hour of Shed Event Heat Pump Water Heaters (n=145) Electric Resistance (n=86)
Baseline 1 Baseline 2 Baseline 3 Baseline 1 Baseline 2 Baseline 3 Average Impact from 10p.m. to 5a.m.
84 95 84 133 146 194
Std. Dev. from 10p.m. to 5a.m.
34 25 N/A61 81 59 N/A
Average Impact from 6a.m. to 10a.m.
201 196 232 337 318 444
Std. Dev. from 6a.m. to 10a.m.
45 45 N/A 67 121 N/A
Average Impact from 11a.m. to 4p.m.
170 148 N/A62 322 329 N/A
Std. Dev. from 11a.m. to 4p.m.
47 29 N/A 114 133 N/A
Average Impact from 5p.m. to 9p.m.
142 161 167 328 312 316
Std. Dev. from 5p.m. to 9p.m.
47 46 N/A 85 99 N/A
The energy shifting potential of a particular event depends on its length. For example, according to Table E-2, a two-hour HPWH shed event during the morning peak (between 6a.m. and 10a.m.) would likely save about 200 watts per hour, or 400 Wh per event per heat pump water heater. The same length of shed event for an ERWH around the same time of day would result in approximately 325 watts per hour, or about 650 Wh per event per electric resistance water heater. In this case, the heat pump water heater demonstrates that it is capable of saving approximately 62% of the energy that an electric resistance tank could during a morning peak period. The three baselines provide insight into the various ways a utility can determine the savings from a large demand-response program using smart heat pump water heaters. If the data had no variation and the water heaters produced the same profile week to week, the results of the three baseline methods would produce the same results. Although that would not be expected, some of the time periods show surprisingly similar results across 60 For the energy shift evaluation, we calculate a standard deviation metric based on the average of 6 to 11 data points that are each the average of multiple discrete events during a week of events; it was not appropriate to apply the confidence interval metric to observations that are themselves averages. For the grid emergency and system peak demand shed events, we use a confidence interval metric which can be computed for the 10 or so discrete events that we created, and this is a preferred metric. Both metrics provide an indication on the variation of a specific result. 61 Only the last week of the season is part of this event group, so there is no applicable standard deviation for this value. 62 No event occurred during this time for the week of March 26th.
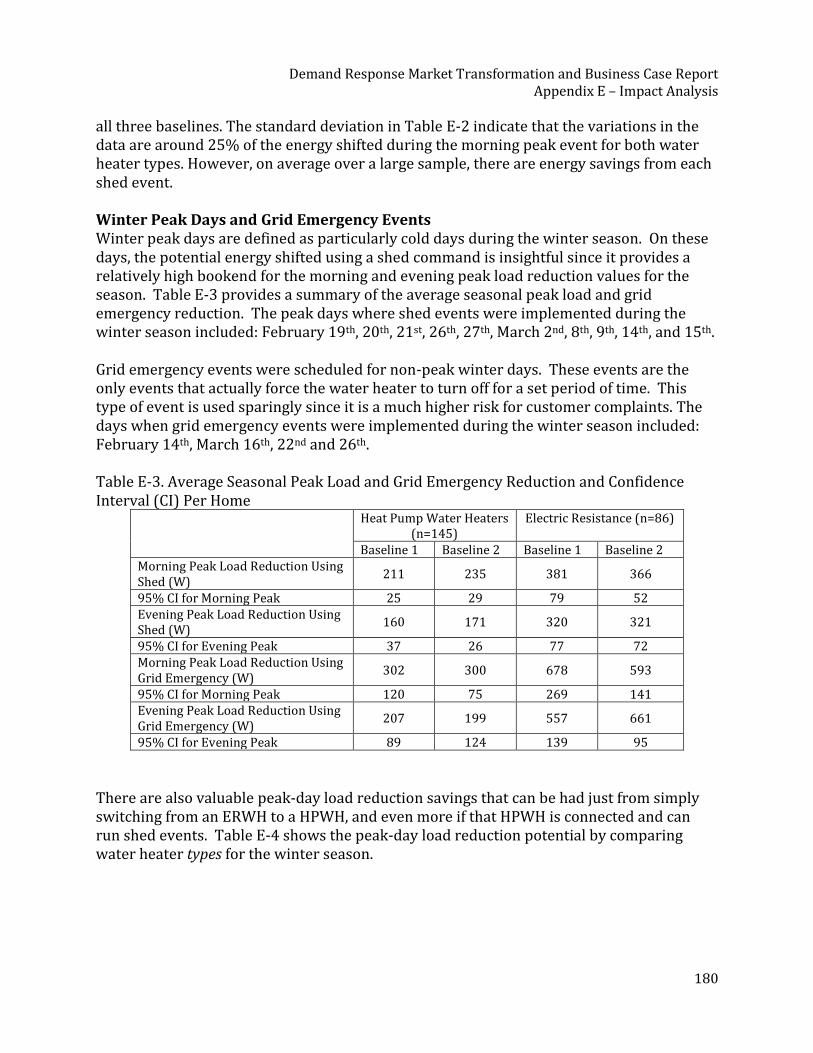
Demand Response Market Transformation and Business Case Report
Appendix E – Impact Analysis
180
all three baselines. The standard deviation in Table E-2 indicate that the variations in the data are around 25% of the energy shifted during the morning peak event for both water heater types. However, on average over a large sample, there are energy savings from each shed event. Winter Peak Days and Grid Emergency Events Winter peak days are defined as particularly cold days during the winter season. On these days, the potential energy shifted using a shed command is insightful since it provides a relatively high bookend for the morning and evening peak load reduction values for the season. Table E-3 provides a summary of the average seasonal peak load and grid emergency reduction. The peak days where shed events were implemented during the winter season included: February 19th, 20th, 21st, 26th, 27th, March 2nd, 8th, 9th, 14th, and 15th. Grid emergency events were scheduled for non-peak winter days. These events are the only events that actually force the water heater to turn off for a set period of time. This type of event is used sparingly since it is a much higher risk for customer complaints. The days when grid emergency events were implemented during the winter season included: February 14th, March 16th, 22nd and 26th. Table E-3. Average Seasonal Peak Load and Grid Emergency Reduction and Confidence Interval (CI) Per Home
Heat Pump Water Heaters (n=145)
Electric Resistance (n=86)
Baseline 1 Baseline 2 Baseline 1 Baseline 2 Morning Peak Load Reduction Using Shed (W)
211 235 381 366
95% CI for Morning Peak 25 29 79 52 Evening Peak Load Reduction Using Shed (W)
160 171 320 321
95% CI for Evening Peak 37 26 77 72 Morning Peak Load Reduction Using Grid Emergency (W)
302 300 678 593
95% CI for Morning Peak 120 75 269 141 Evening Peak Load Reduction Using Grid Emergency (W)
207 199 557 661
95% CI for Evening Peak 89 124 139 95
There are also valuable peak-day load reduction savings that can be had just from simply switching from an ERWH to a HPWH, and even more if that HPWH is connected and can run shed events. Table E-4 shows the peak-day load reduction potential by comparing water heater types for the winter season.
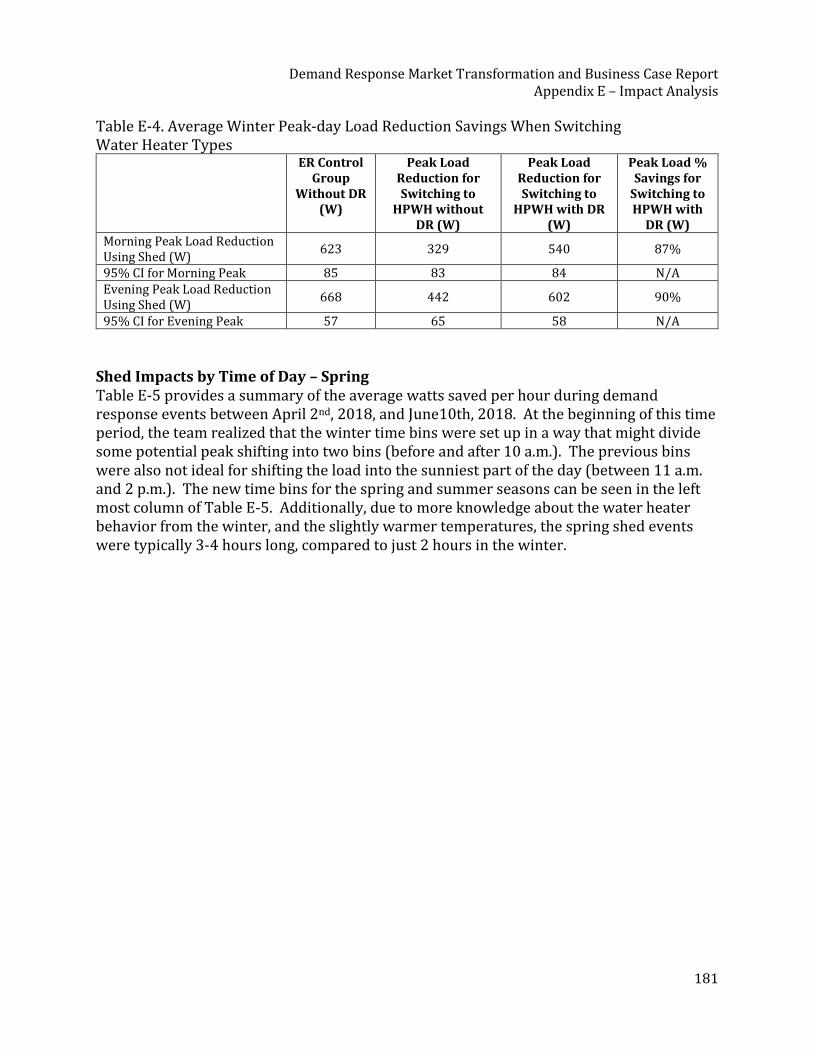
Demand Response Market Transformation and Business Case Report
Appendix E – Impact Analysis
181
Table E-4. Average Winter Peak-day Load Reduction Savings When Switching Water Heater Types
ER Control Group
Without DR (W)
Peak Load Reduction for Switching to
HPWH without DR (W)
Peak Load Reduction for Switching to
HPWH with DR (W)
Peak Load % Savings for
Switching to HPWH with
DR (W) Morning Peak Load Reduction Using Shed (W)
623 329 540 87%
95% CI for Morning Peak 85 83 84 N/A Evening Peak Load Reduction Using Shed (W)
668 442 602 90%
95% CI for Evening Peak 57 65 58 N/A
Shed Impacts by Time of Day – Spring Table E-5 provides a summary of the average watts saved per hour during demand response events between April 2nd, 2018, and June10th, 2018. At the beginning of this time period, the team realized that the winter time bins were set up in a way that might divide some potential peak shifting into two bins (before and after 10 a.m.). The previous bins were also not ideal for shifting the load into the sunniest part of the day (between 11 a.m. and 2 p.m.). The new time bins for the spring and summer seasons can be seen in the left most column of Table E-5. Additionally, due to more knowledge about the water heater behavior from the winter, and the slightly warmer temperatures, the spring shed events were typically 3-4 hours long, compared to just 2 hours in the winter.
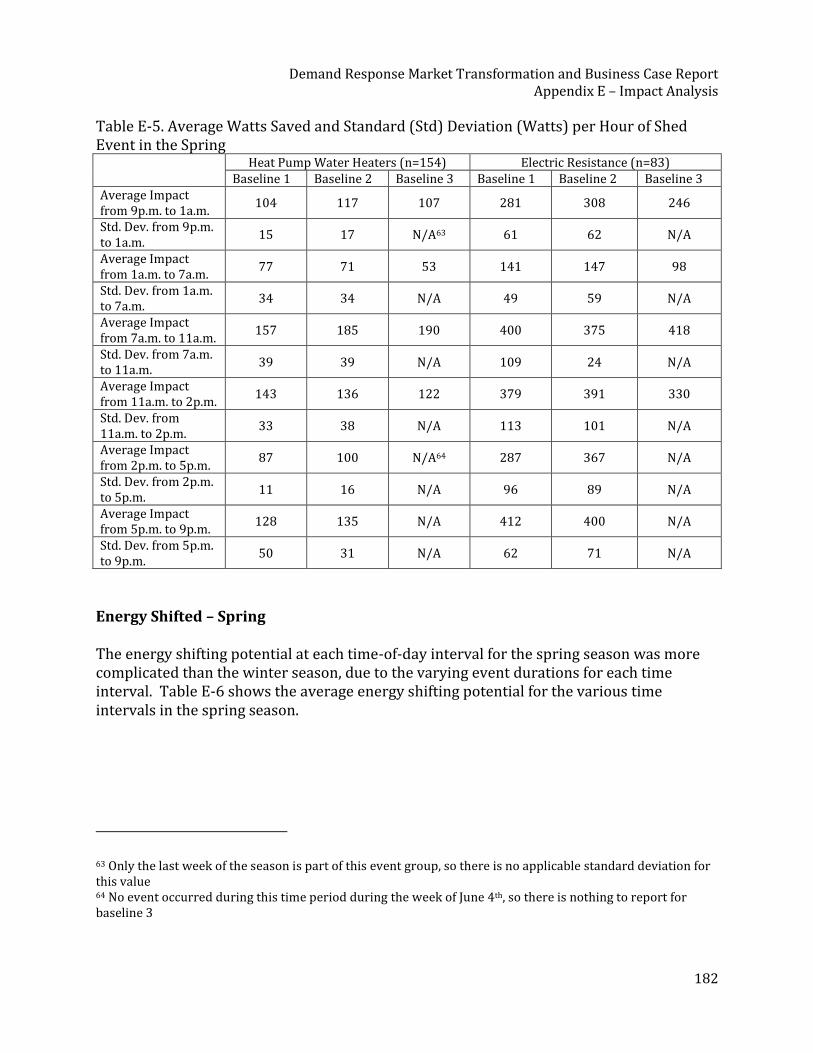
Demand Response Market Transformation and Business Case Report
Appendix E – Impact Analysis
182
Table E-5. Average Watts Saved and Standard (Std) Deviation (Watts) per Hour of Shed Event in the Spring Heat Pump Water Heaters (n=154) Electric Resistance (n=83)
Baseline 1 Baseline 2 Baseline 3 Baseline 1 Baseline 2 Baseline 3 Average Impact from 9p.m. to 1a.m.
104 117 107 281 308 246
Std. Dev. from 9p.m. to 1a.m.
15 17 N/A63 61 62 N/A
Average Impact from 1a.m. to 7a.m.
77 71 53 141 147 98
Std. Dev. from 1a.m. to 7a.m.
34 34 N/A 49 59 N/A
Average Impact from 7a.m. to 11a.m.
157 185 190 400 375 418
Std. Dev. from 7a.m. to 11a.m.
39 39 N/A 109 24 N/A
Average Impact from 11a.m. to 2p.m.
143 136 122 379 391 330
Std. Dev. from 11a.m. to 2p.m.
33 38 N/A 113 101 N/A
Average Impact from 2p.m. to 5p.m.
87 100 N/A64 287 367 N/A
Std. Dev. from 2p.m. to 5p.m.
11 16 N/A 96 89 N/A
Average Impact from 5p.m. to 9p.m.
128 135 N/A 412 400 N/A
Std. Dev. from 5p.m. to 9p.m.
50 31 N/A 62 71 N/A
Energy Shifted – Spring The energy shifting potential at each time-of-day interval for the spring season was more complicated than the winter season, due to the varying event durations for each time interval. Table E-6 shows the average energy shifting potential for the various time intervals in the spring season.
63 Only the last week of the season is part of this event group, so there is no applicable standard deviation for this value 64 No event occurred during this time period during the week of June 4th, so there is nothing to report for baseline 3
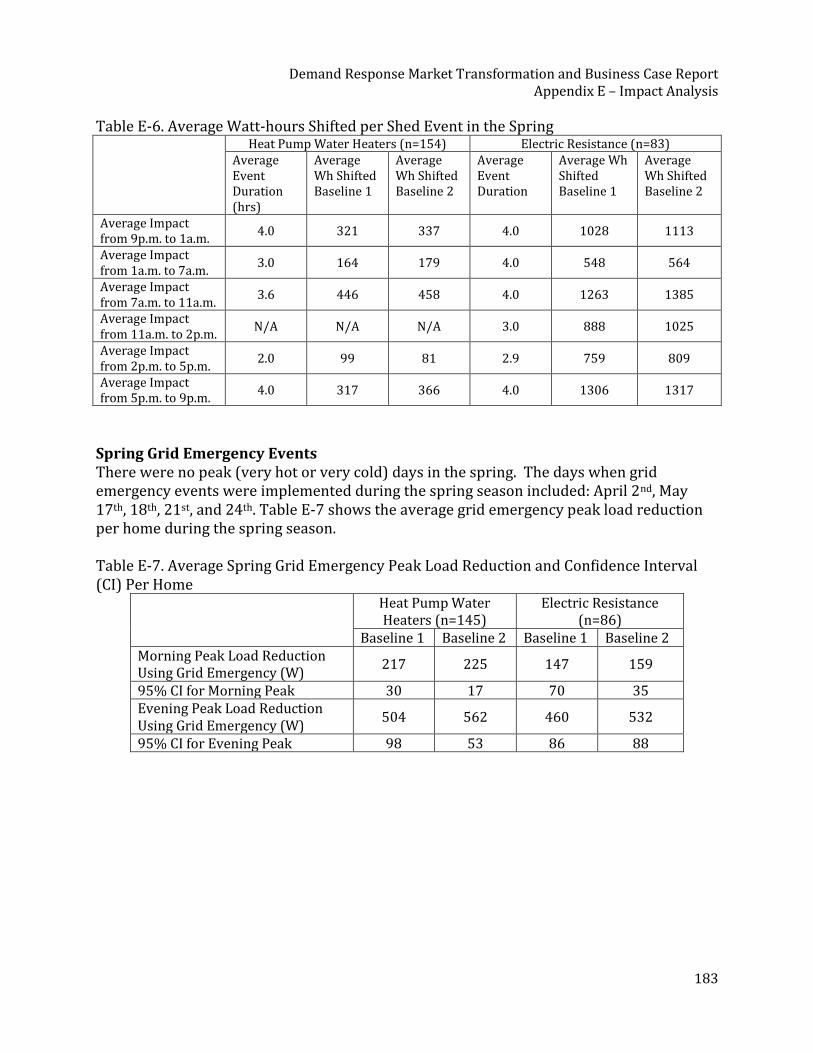
Demand Response Market Transformation and Business Case Report
Appendix E – Impact Analysis
183
Table E-6. Average Watt-hours Shifted per Shed Event in the Spring Heat Pump Water Heaters (n=154) Electric Resistance (n=83)
Average Event Duration (hrs)
Average Wh Shifted Baseline 1
Average Wh Shifted Baseline 2
Average Event Duration
Average Wh Shifted Baseline 1
Average Wh Shifted Baseline 2
Average Impact from 9p.m. to 1a.m.
4.0 321 337 4.0 1028 1113
Average Impact from 1a.m. to 7a.m.
3.0 164 179 4.0 548 564
Average Impact from 7a.m. to 11a.m.
3.6 446 458 4.0 1263 1385
Average Impact from 11a.m. to 2p.m.
N/A N/A N/A 3.0 888 1025
Average Impact from 2p.m. to 5p.m.
2.0 99 81 2.9 759 809
Average Impact from 5p.m. to 9p.m.
4.0 317 366 4.0 1306 1317
Spring Grid Emergency Events There were no peak (very hot or very cold) days in the spring. The days when grid emergency events were implemented during the spring season included: April 2nd, May 17th, 18th, 21st, and 24th. Table E-7 shows the average grid emergency peak load reduction per home during the spring season. Table E-7. Average Spring Grid Emergency Peak Load Reduction and Confidence Interval (CI) Per Home
Heat Pump Water Heaters (n=145)
Electric Resistance (n=86)
Baseline 1 Baseline 2 Baseline 1 Baseline 2 Morning Peak Load Reduction Using Grid Emergency (W)
217 225 147 159
95% CI for Morning Peak 30 17 70 35 Evening Peak Load Reduction Using Grid Emergency (W)
504 562 460 532
95% CI for Evening Peak 98 53 86 88
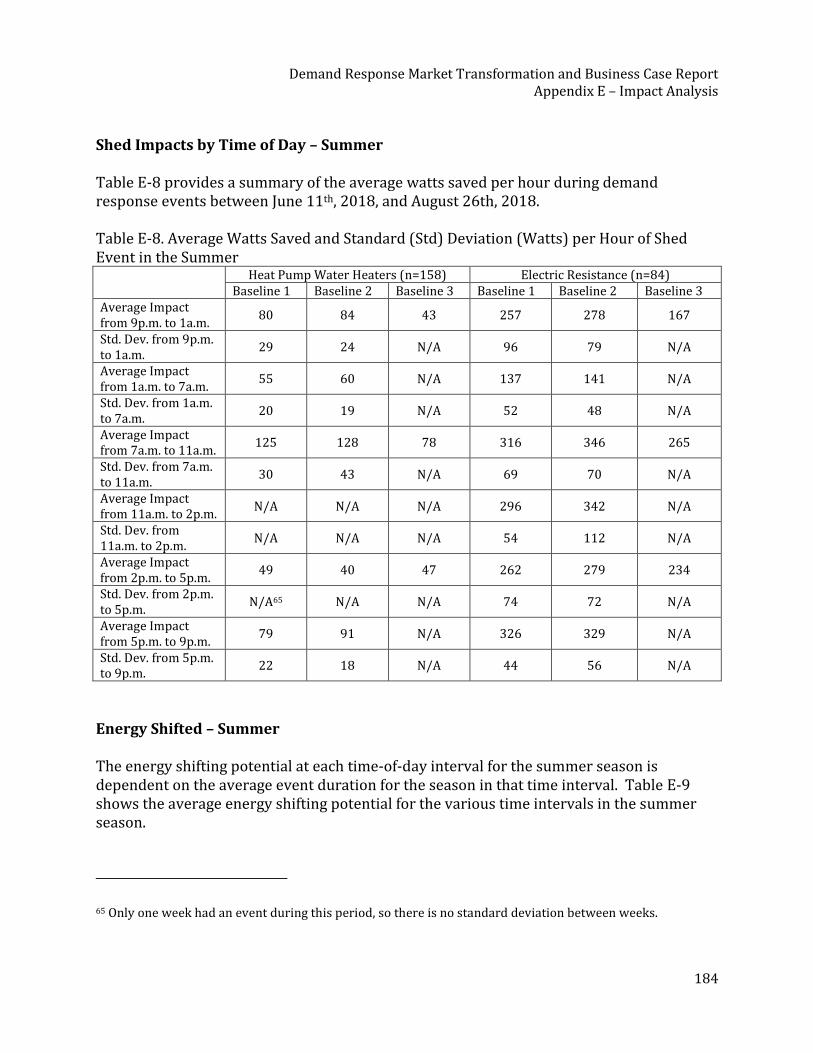
Demand Response Market Transformation and Business Case Report
Appendix E – Impact Analysis
184
Shed Impacts by Time of Day – Summer Table E-8 provides a summary of the average watts saved per hour during demand response events between June 11th, 2018, and August 26th, 2018. Table E-8. Average Watts Saved and Standard (Std) Deviation (Watts) per Hour of Shed Event in the Summer Heat Pump Water Heaters (n=158) Electric Resistance (n=84)
Baseline 1 Baseline 2 Baseline 3 Baseline 1 Baseline 2 Baseline 3 Average Impact from 9p.m. to 1a.m.
80 84 43 257 278 167
Std. Dev. from 9p.m. to 1a.m.
29 24 N/A 96 79 N/A
Average Impact from 1a.m. to 7a.m.
55 60 N/A 137 141 N/A
Std. Dev. from 1a.m. to 7a.m.
20 19 N/A 52 48 N/A
Average Impact from 7a.m. to 11a.m.
125 128 78 316 346 265
Std. Dev. from 7a.m. to 11a.m.
30 43 N/A 69 70 N/A
Average Impact from 11a.m. to 2p.m.
N/A N/A N/A 296 342 N/A
Std. Dev. from 11a.m. to 2p.m.
N/A N/A N/A 54 112 N/A
Average Impact from 2p.m. to 5p.m.
49 40 47 262 279 234
Std. Dev. from 2p.m. to 5p.m.
N/A65 N/A N/A 74 72 N/A
Average Impact from 5p.m. to 9p.m.
79 91 N/A 326 329 N/A
Std. Dev. from 5p.m. to 9p.m.
22 18 N/A 44 56 N/A
Energy Shifted – Summer The energy shifting potential at each time-of-day interval for the summer season is dependent on the average event duration for the season in that time interval. Table E-9 shows the average energy shifting potential for the various time intervals in the summer season.
65 Only one week had an event during this period, so there is no standard deviation between weeks.
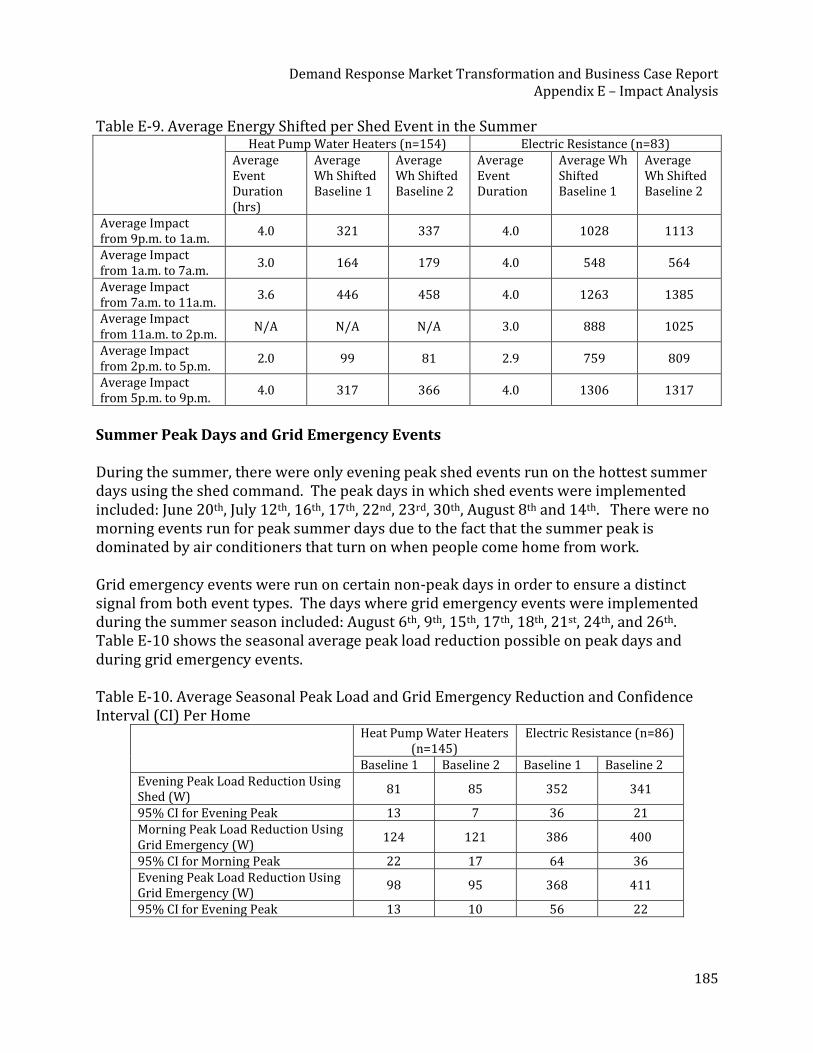
Demand Response Market Transformation and Business Case Report
Appendix E – Impact Analysis
185
Table E-9. Average Energy Shifted per Shed Event in the Summer Heat Pump Water Heaters (n=154) Electric Resistance (n=83)
Average Event Duration (hrs)
Average Wh Shifted Baseline 1
Average Wh Shifted Baseline 2
Average Event Duration
Average Wh Shifted Baseline 1
Average Wh Shifted Baseline 2
Average Impact from 9p.m. to 1a.m.
4.0 321 337 4.0 1028 1113
Average Impact from 1a.m. to 7a.m.
3.0 164 179 4.0 548 564
Average Impact from 7a.m. to 11a.m.
3.6 446 458 4.0 1263 1385
Average Impact from 11a.m. to 2p.m.
N/A N/A N/A 3.0 888 1025
Average Impact from 2p.m. to 5p.m.
2.0 99 81 2.9 759 809
Average Impact from 5p.m. to 9p.m.
4.0 317 366 4.0 1306 1317
Summer Peak Days and Grid Emergency Events During the summer, there were only evening peak shed events run on the hottest summer days using the shed command. The peak days in which shed events were implemented included: June 20th, July 12th, 16th, 17th, 22nd, 23rd, 30th, August 8th and 14th. There were no morning events run for peak summer days due to the fact that the summer peak is dominated by air conditioners that turn on when people come home from work. Grid emergency events were run on certain non-peak days in order to ensure a distinct signal from both event types. The days where grid emergency events were implemented during the summer season included: August 6th, 9th, 15th, 17th, 18th, 21st, 24th, and 26th. Table E-10 shows the seasonal average peak load reduction possible on peak days and during grid emergency events. Table E-10. Average Seasonal Peak Load and Grid Emergency Reduction and Confidence Interval (CI) Per Home
Heat Pump Water Heaters (n=145)
Electric Resistance (n=86)
Baseline 1 Baseline 2 Baseline 1 Baseline 2 Evening Peak Load Reduction Using Shed (W)
81 85 352 341
95% CI for Evening Peak 13 7 36 21 Morning Peak Load Reduction Using Grid Emergency (W)
124 121 386 400
95% CI for Morning Peak 22 17 64 36 Evening Peak Load Reduction Using Grid Emergency (W)
98 95 368 411
95% CI for Evening Peak 13 10 56 22
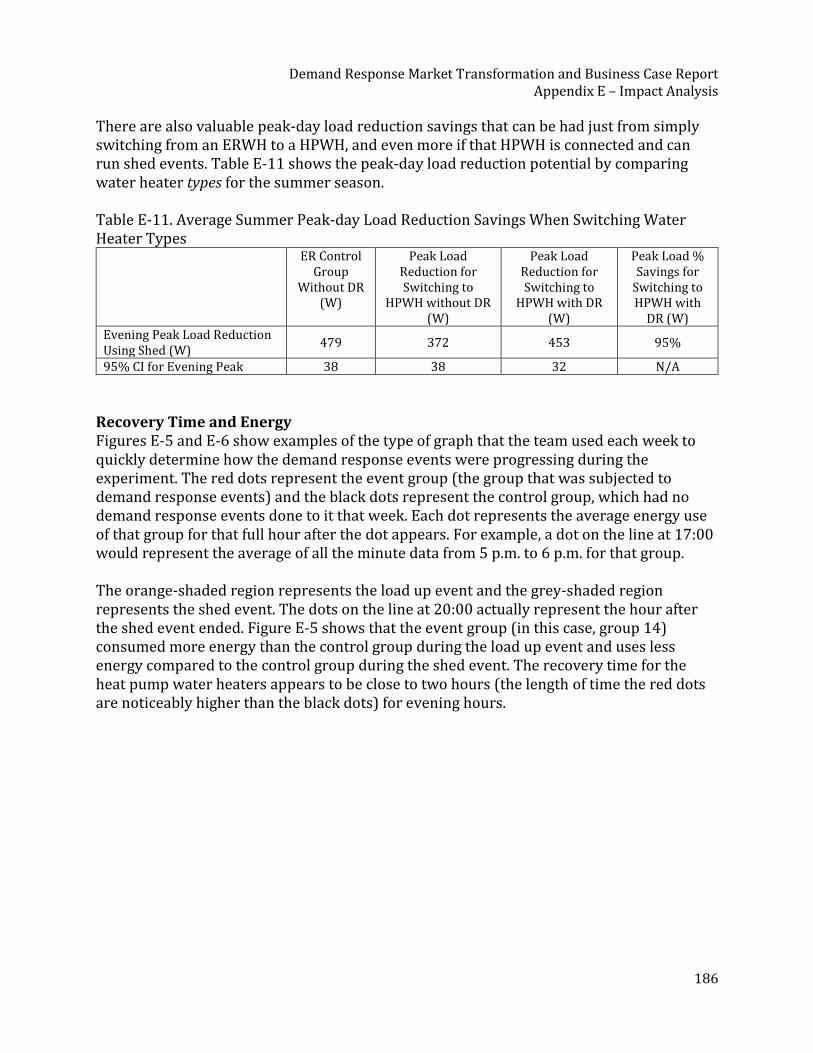
Demand Response Market Transformation and Business Case Report
Appendix E – Impact Analysis
186
There are also valuable peak-day load reduction savings that can be had just from simply switching from an ERWH to a HPWH, and even more if that HPWH is connected and can run shed events. Table E-11 shows the peak-day load reduction potential by comparing water heater types for the summer season. Table E-11. Average Summer Peak-day Load Reduction Savings When Switching Water Heater Types
ER Control Group
Without DR (W)
Peak Load Reduction for Switching to
HPWH without DR (W)
Peak Load Reduction for Switching to
HPWH with DR (W)
Peak Load % Savings for
Switching to HPWH with
DR (W) Evening Peak Load Reduction Using Shed (W)
479 372 453 95%
95% CI for Evening Peak 38 38 32 N/A
Recovery Time and Energy Figures E-5 and E-6 show examples of the type of graph that the team used each week to quickly determine how the demand response events were progressing during the experiment. The red dots represent the event group (the group that was subjected to demand response events) and the black dots represent the control group, which had no demand response events done to it that week. Each dot represents the average energy use of that group for that full hour after the dot appears. For example, a dot on the line at 17:00 would represent the average of all the minute data from 5 p.m. to 6 p.m. for that group. The orange-shaded region represents the load up event and the grey-shaded region represents the shed event. The dots on the line at 20:00 actually represent the hour after the shed event ended. Figure E-5 shows that the event group (in this case, group 14) consumed more energy than the control group during the load up event and uses less energy compared to the control group during the shed event. The recovery time for the heat pump water heaters appears to be close to two hours (the length of time the red dots are noticeably higher than the black dots) for evening hours.
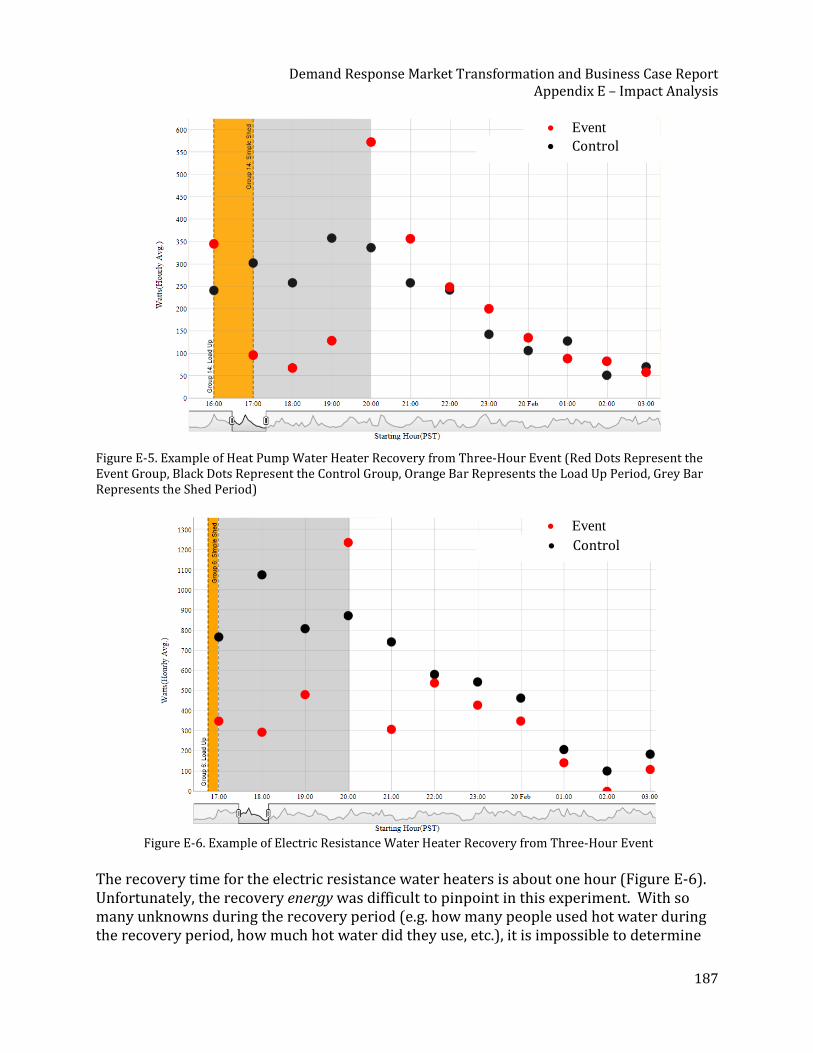
Demand Response Market Transformation and Business Case Report
Appendix E – Impact Analysis
187
Figure E-5. Example of Heat Pump Water Heater Recovery from Three-Hour Event (Red Dots Represent the Event Group, Black Dots Represent the Control Group, Orange Bar Represents the Load Up Period, Grey Bar Represents the Shed Period)
Figure E-6. Example of Electric Resistance Water Heater Recovery from Three-Hour Event
The recovery time for the electric resistance water heaters is about one hour (Figure E-6). Unfortunately, the recovery energy was difficult to pinpoint in this experiment. With so many unknowns during the recovery period (e.g. how many people used hot water during the recovery period, how much hot water did they use, etc.), it is impossible to determine
• Event
• Control
• Event
• Control
Demand Response Market Transformation and Business Case Report
Appendix E – Impact Analysis
188
how much of the energy used after the shed event was used to recover the tank back to its set temperature and how much energy was used to provide hot water to the occupants at that time. Therefore, while heat pump water heaters could be used to help shift grid energy later into the night, the data indicate that it would help shift it by a few hours. A longer shed period, or a duty cycle recovery period might help shift that energy even more into the prime wind energy hours of the day. Customer Acceptance Many studies have shown that ERWHs can be used for demand response. This study was the first of its kind to have such a large scale of HPWHs. For the HPWH portion of this study, during the winter season, there were only 1634 opt-out hours. With about 145 customers, and about 28 event hours that could be opted-out of per week, there are about 40,000 opportunities where an opt-out could have occurred. That results in customers only opting-out about 4% of the time they had the opportunity to. This relatively low number of opt-outs leads to the assumption that most customers were largely unaffected by the demand response program.
Conclusion HPWHs save an average of 63%66 of total energy compared to ERWHs. Results from this study showed that HPWHs offer about 62% of the energy shifting capability compared to ERWHs during a morning peak period (about 400 Wh for HPWHs compared to about 650 Wh for ERWHs) during the winter season. The peak load reduction during a winter grid emergency offers an average of 300 W for HPWHs, which is about 33% more load reduction potential compared to typical winter shed events. With a better understanding of the hot water use profiles from the winter season and slightly warmer weather, the team was comfortable conducting longer shed events during the spring season. For morning peak events in the spring, HPWHs shifted about 450 Wh per home (with an average of 3.6 hour events), while ERWHs shifted about 1290 Wh per home (with an average of 4 hour events). Grid emergency events in the spring had the most demand reduction during the evening peak, which HPWHs reducing about 525 W per home and ERWHs reducing about 500 W per home.
66 Based on the U.S. DOE Test Procedure (10 CFR 430.32(d)) and comparing the Energy Factor (EF) of an ERWH (EF = 0.90 to a HPWH (EF = 2.4).
Demand Response Market Transformation and Business Case Report
Appendix E – Impact Analysis
189
The average energy shifted during the afternoon peak67 period in the summer season was about 340 Wh (average of 4 hour events) per home for HPWHs, and about 1310 Wh per home for ERWHs (average of 4 hour events). Grid emergency events in the summer had the most demand reduction during the morning peak, with about 120 W reduction for HPWHs and about 390 W reduction for ERWHs. In addition to the energy shifting potential of this strategy, there is major peak-day load reduction savings potential due to simply switching from an ERWH to a connected HPWH. For peak days in both the summer and winter months, connected HPWHs used about 87% less energy during the morning peak period and at least 90% less energy during the evening peak period. Heat pump water heaters are a valuable addition to any energy efficiency or demand response program. They significantly lower the overall energy use of the water heater load profile and still provide a substantial amount of the demand response potential.
References
BPA (Bonneville Power Administration). 2015. TIP 336: Scaled Deployment and Demonstration
of Demand Response using Water Heaters with CTA 2045 Technology.
https://www.bpa.gov/Doing%20Business/TechnologyInnovation/TIPProjectBriefs/2018-DR-
TIP%20336-final.pdf
CTA (Consumer Technology Association). 2018. CTA-2045-A: Modular Communication
Interface for Energy Management Standard. https://www.cta.tech/Research-
Standards/Standards-Listing/Modular-Communication-Interface-for-Energy-Ma.aspx/%3Ca
CTA (Consumer Technology Association). 2013. ANSI/CTA-2045-A: Modular Communication
Interface for Energy Management Standard. https://www.cta.tech/getattachment/21ada038-
961a-4ea0-ba5d-7d610cedcb90/attachment.aspx
Gurlaskie, G. 2016. Heat Pump Water Heaters for Demand Response. ACEEE (American
Council for an Energy Efficient Economy.
https://aceee.org/sites/default/files/pdf/conferences/hwf/2017/Gurlaskie_Session7A_HWF17
_2.28.17.pdf
67 The afternoon peak in the summer is more important to utilities due to the spike in air conditioner use around 5 p.m. when people come home from work.
Demand Response Market Transformation and Business Case Report Appendix F – Lessons Learned
190
Appendix F – Lessons Learned Research of this nature uncovers lots of great learnings. The learnings from this pilot are listed below and should prove valuable as the technology matures and is deployed. As demand response gets rolled out and scaled up, it is imperative that we leverage these learnings and continue to improve. The listing below provides insights to different aspects of the roll-out of a large-scale deployment, including learnings about communication methods and challenges, recruiting, enrollment and retention of customers, trade ally engagement, water heater performance control characteristics, response latency, and savings calculations. These lessons fall into four broad categories: Recruitment, Project Participation Problems, Customer Complaints, and Technological Immaturity. Recruitment Geographic limitations due to utility participation, radio messaging choices—The choice of radio messaging for controlling the tanks created geographic limitations to where participants could live. Furthermore, participants had to have their electricity served by a participating utility. While efforts were made to concentrate utilities in a geographic area (and once the tower locations were selected, to recruit other utilities in that area), utility participation was a factor in limiting the possible participants. Despite the best efforts of project leaders, only some utilities opted to participate. More effort in crafting outreach strategies to utilities would have widened the participant pool. Under-recruitment of HPWH customers—Heat pump water heater (HPWH) customers were generally recruited by the utilities from the pool of customers who had received an incentive for installing a heat pump water heater. While this route proved somewhat fruitful, heat pump customer recruitment did not live up to the initial project goals. (190 were enrolled out of a goal of 300. Because GE water heaters were more widely existent in the Northwest before the start of the project, the final assignments were heavily skewed toward GE water heaters rather than AO Smith brands – 150 vs 40.) The conclusion here is that the recruitment and deployment must be as simple as possible. Customers should be able to engage with utility DR programs as easily, or more so, as signing up for electronic billing and payment. Failure of the recruitment plan for resistance water heater customers—During the project design phase, it was believed that a major pathway for recruitment of resistance water heater customers would be via emergency replacements. In the model, plumbers would have high-end, project-compatible water heaters on their trucks, and during an emergency call would install these tanks for the same price as the cheapest model. The project paid to buy down the cost of a supply of resistance water heaters, covering the cost differential, and offered cash incentives to plumbers who recruited customers. Despite outreach to several prominent area plumbers, recruitment via this pathway was effectively zero. While the barrier was unclear, it is believed that the paperwork and salesmanship
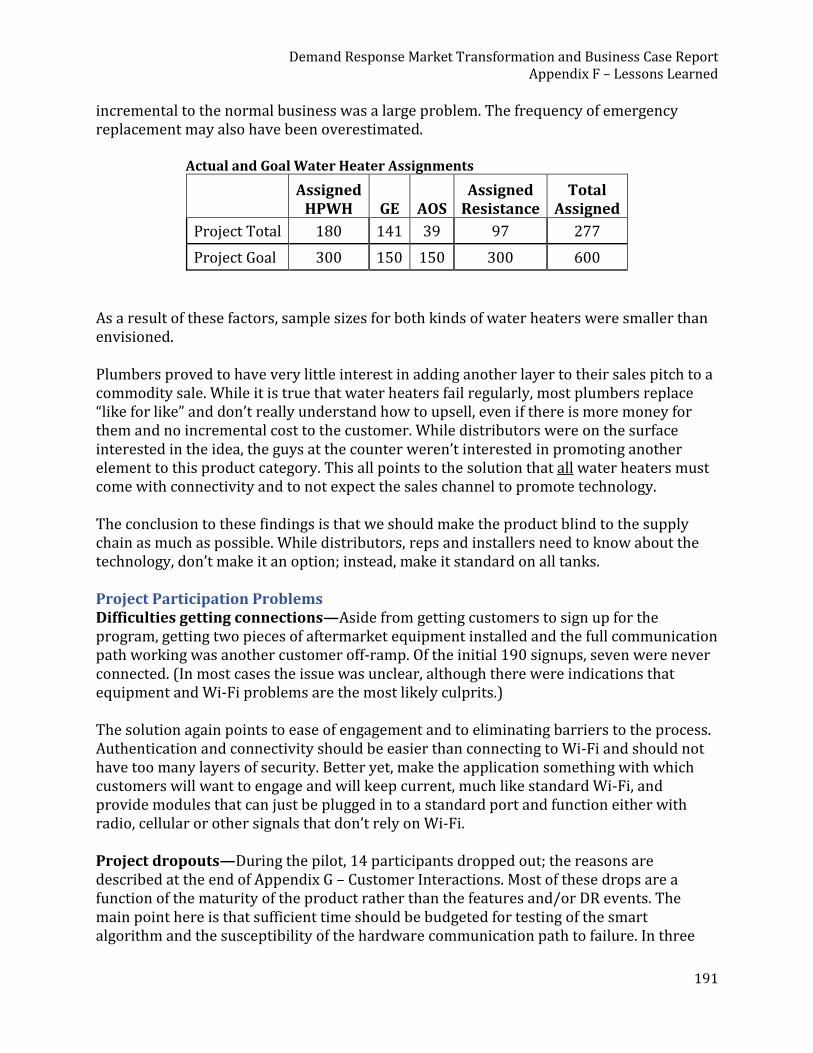
Demand Response Market Transformation and Business Case Report Appendix F – Lessons Learned
191
incremental to the normal business was a large problem. The frequency of emergency replacement may also have been overestimated.
Actual and Goal Water Heater Assignments
Assigned HPWH GE AOS
Assigned Resistance
Total Assigned
Project Total 180 141 39 97 277
Project Goal 300 150 150 300 600
As a result of these factors, sample sizes for both kinds of water heaters were smaller than envisioned. Plumbers proved to have very little interest in adding another layer to their sales pitch to a commodity sale. While it is true that water heaters fail regularly, most plumbers replace “like for like” and don’t really understand how to upsell, even if there is more money for them and no incremental cost to the customer. While distributors were on the surface interested in the idea, the guys at the counter weren’t interested in promoting another element to this product category. This all points to the solution that all water heaters must come with connectivity and to not expect the sales channel to promote technology. The conclusion to these findings is that we should make the product blind to the supply chain as much as possible. While distributors, reps and installers need to know about the technology, don’t make it an option; instead, make it standard on all tanks. Project Participation Problems Difficulties getting connections—Aside from getting customers to sign up for the program, getting two pieces of aftermarket equipment installed and the full communication path working was another customer off-ramp. Of the initial 190 signups, seven were never connected. (In most cases the issue was unclear, although there were indications that equipment and Wi-Fi problems are the most likely culprits.) The solution again points to ease of engagement and to eliminating barriers to the process. Authentication and connectivity should be easier than connecting to Wi-Fi and should not have too many layers of security. Better yet, make the application something with which customers will want to engage and will keep current, much like standard Wi-Fi, and provide modules that can just be plugged in to a standard port and function either with radio, cellular or other signals that don’t rely on Wi-Fi. Project dropouts—During the pilot, 14 participants dropped out; the reasons are described at the end of Appendix G – Customer Interactions. Most of these drops are a function of the maturity of the product rather than the features and/or DR events. The main point here is that sufficient time should be budgeted for testing of the smart algorithm and the susceptibility of the hardware communication path to failure. In three

Demand Response Market Transformation and Business Case Report Appendix F – Lessons Learned
192
cases there was a failure of hardware within the water heater to support any external communications. Transients during power outages were suspected as the cause. Customer Wi-Fi connectivity issues—Customer Wi-Fi connectivity presented a challenge. This began with hooking the modules up to customer Wi-Fi; in some cases the household Wi-Fi did not reach the area where the tank was located (generally in garages or basements, where humans might not notice poor Wi-Fi connectivity). The project provided Wi-Fi extenders to water heaters for participants who requested them to help customers overcome this limitation. Despite this, and despite the valiant attempts by utility personnel to ensure that connections were kept functional, Wi-Fi connectivity continued to be a problem, with as many as 15 persistently troublesome connections among the 280 pilot participants. During the period (December 10, 2017- February 15, 2018) when the FM radio signal was unavailable, the project leveraged Wi-Fi in and out; however, the process was cumbersome and not nearly as easy as the FM broadcast system for sending commands. Customer Complaints Limited complaints related to software bugs, HPWH customer misunderstandings—Customers were provided a route to submit comments about their experiences during the pilot. A copy went to the serving utility and to the project team. This strategy yielded few complaints, only six over the course of the project. Some complaints revealed real problems, such as a software issue (see the Technological Immaturity section on the next page). A more interesting finding is that many reports of cold water turned out, upon further research, to be caused by large hot water draws on heat pumps and electric resistance alike. Further customer education is still needed on heat pump water heaters, as even households with this technology do not understand the slower reheat time inherent in the technology. Considering the number of DR events executed, the number of complaints were minor. Additionally, the firmware loaded in one model of the HPWHs requires a “bug” fix. The manufacturer is aware of this and they will correct it on the next version of the software. Mis-attribution of cause of some issues—Naturally, all water heater issues that occurred during the run of this project were attributed to the project, whether or not that was the actual cause. Two customers had water heater control board issues, seemingly unrelated, that were nevertheless recorded as part of the project. Understanding how smart waters work—Manufacturers and utilities need to make sure their products and services meet the end users’ needs for hot water. OEMs need to make sure that the DR-enabled water heaters protect the customer from the demands of a DR program, and utilities must know the capabilities and limitations of the customers’ water heater technology. The customer journey must be clearly understood and respected. One of the OEMs’ logic favored the grid needs over those of the customer, and the other favored the customer over the grid; a balance must be struck.
Demand Response Market Transformation and Business Case Report Appendix F – Lessons Learned
193
Inconvenient override process—One customer with a heat pump water heater quit the pilot because the process to set overrides was too burdensome. In this case, the household doubled in size, to about nine, over the Christmas holiday as extended family from 8,000 miles away came to visit for four weeks. The customer proactively set the override but found that repeating this process (or perhaps the consequence of forgetting) every 24 hours was too burdensome. This defect can easily be corrected with improved tools in the customer web portal or an app, but a long-term opt-out option was not available in this pilot. Technological Immaturity Several small issues uncovered—As this technology is not yet mature, many lessons were learned that will be useful for future generations of hardware and firmware development. Small issues, such as the DC Universal Communication Module (UCM) tending to fall out of its socket unless inserted upside down, were discovered. Firmware glitches—In terms of firmware glitches, this project discovered a problem when tank temperature, or mode setting, is adjusted by the customer on one of the manufacturers’ tanks during a shed event. In this case, the water heater does not adjust the temperature to the new setpoint or change to the desired mode setting. One of the manufacturers’ control algorithms had a “feature” that when a shed event (115° F) was in process and a power outage or power disconnect happened, that the water heater then used the shed (setpoint) temperature as the new customer setpoint and would never produce water over the shed setpoint temperature (115° F). The same water heater manufacturer had broad temperature dead bands for acceptable water temperature. These dead bands appear to go lower after a shed event, or at least the average temperature of the entire tank is not interpreted accurately during a shed event. With some customers we had complaints that a hot water draw after a shed would deliver a lukewarm shower. We interpreted this to mean that after a shed event ended, a significant amount of water exists in the tank at 105° F or cooler. This means that at a default setpoint of 120° F, the dead band is at least 15° F. The conclusion is that to improve the customer experience, the design of smart algorithms would benefit from more testing around the precision of temperature sensing, the dead band design, and the actual conditions following a shed event. Duty cycle command—limited testing and utility The two OEMs approached their understanding of the “duty cycle” command in different ways. The intention of the command was to request the smart water heater to cycle “on” and “off” to take advantage of wind and solar events over a period of time to recover from a large draw or high-use period. This command proved to be less valuable in practicality, and it was easier to just use the “shed” and “run” commands. If this duty cycle command is to be used by utilities, customers will need to be broken into types of users (morning, afternoon or evening) allowing the utility and the water heater to better recover. To take advantage of this application in the
Demand Response Market Transformation and Business Case Report Appendix F – Lessons Learned
194
future, operators will need to know more about the customer’s draw patterns and will need a larger population over which to spread the events. A test procedure will need to validate performance and a sophisticated modeling approach will need to deploy to more accurately characterize the type of user to better tailor the commands. Customer ability to set up communication devices—PGE sent all of its 90 participating customers the CTA-2045 communication device by mail with professionally-developed graphic instructions of how to install and set up the communication device. The installation had three unique aspects: a) the physical attachment, b) the connection of the device to the customer’s Wi-Fi network, and c) adjustment of the FM antenna if needed. No one needed help with the physical install since only a screwdriver was needed for the AC-powered module. The GE adapter has a stiff cord that forced the socket for the communication device to be upside down. In about 3% of cases we lost the Wi-Fi connection later because the comm. module had shifted (and come loose) enough (due to gravity and vibration) that the comm. module lost its mechanical connection with the adapter; it needs either more friction or a better fastener. Out of the 90 PGE customers, only four site visits were required because the customer lacked sufficient ability to even make the attempt. Ten customers required extensive phone support to establish the Wi-Fi connection. Five of these were due to inadequate Wi-Fi signal between the router and the water heater; in these cases, a Wi-Fi network extender device had to be sent, or delivered in person, to establish the connection. Lack of basic Wi-Fi networking skills is the main reason customers needed support. If a program can avoid using the customer’s Wi-Fi, most of the problems – both the initial problems and subsequent one when the customers changed their Wi-Fi configuration – will go away. Unreliable current wattage reports—The main reason for having the Wi-Fi link back to the project was to receive minute-by-minute status reports from the tank. Tanks report their status on 19 separate dimensions every minute. One of the reported items is the current wattage at which the tank is running. The AO Smith tanks have a flat wattage reported for each mode (800 ([watts] when the heat pump is running, 4,500 [estimated watts] when the resistance is running, and 5,300 when both are running). This value is not reliable; actual heat pump numbers vary but are closer to between 350-450 watts in both models tested. It is hoped that these lessons can be applied to future projects to improve learning and effectiveness.

Demand Response Market Transformation and Business Case Report Appendix F – Lessons Learned
195
Some areas of potential risks and future learnings not discovered or resolved from this study are as follows:
• Aggregators and market actors need to understand utilities’ concerns and needs to maintain and strengthen the relationship between the utility and the customer.
• Utilities have strong ownership of their customers and want their customers’ experiences to be great ones.
• The need exists to create messaging and awareness campaigns that draw from the “do the right thing for the earth” concept.
• The solution needs to be profitable for supply chain market actors. • Not all water tank manufacturers have the same control methods, and their nuances
need to be understood. • Test methods and validation of performance need to be developed.
Demand Response Market Transformation and Business Case Report Appendix G – Customer Interactions
196
Appendix G – Customer Interactions This appendix summarizes the results of customer interactions with the demand response pilot study, including survey responses and examples of utility marketing materials related to demand response.
Context for Surveys The first utility began recruiting customers in July of 2017; the bulk of enrollments and the subsequent communication connection of the tank to the control system took place between August and December 2017. This took longer that we had hoped, but a lot of new processes had to be established during this period. One of these processes was how to schedule events to facilitate a strong impact evaluation for the findings reported in Chapter 3 of this report. For example, we learned that the use of the duty cycle command to spread out the reheating of cold water over several hours would only be effective in a larger program with market segmentation, so we stopped using the command. Another major discovery was the need to balance the two heat pump groups and the two resistance groups to reduce uncertainty in the impact findings. The re-balancing continued into January 2018. As a result, it wasn’t until January 22 that we became confident in our evaluation methods and we established the three seasons of analysis described in Section 2.4. So, when we talk about running over 600 events over in three seasons (220 days), it is important to understand that most customers experienced several hundred more events before January 22. This number of control events is about 100 times greater than implemented in a traditional DR program. We set up the surveys described below to aid both the current and future analysis work.
Survey Results Summary This project had a total enrollment of 277 participating customers, including 87 customers with resistance tanks in Tacoma. These customers lived in a multi-family complex and did not participate in the surveys since they were set up with opt-out participation by the Tacoma Housing Authority. Most, but not all, of the 277 customers remained until the end of the control period on August 26, 2018. We conducted three types of surveys: 1) an initial demographic survey that covered household composition and participant preferences; 2) a bi-monthly feedback survey that asked the sole question: “Did you experience a hot water shortage last week?” that ran from November 2017 and was sent out every two months until July 2018; and 3) the final survey that was sent out at the close of the pilot and requested feedback on experience and satisfaction with the overall project.
Initial Demographic Survey Results The initial demographic survey had 182 respondents out of the 190 non-Tacoma participants. It was completed to gather information about household composition and water use that might impact hot water usage and affect energy shifting, peak shaving, or customer impacts.
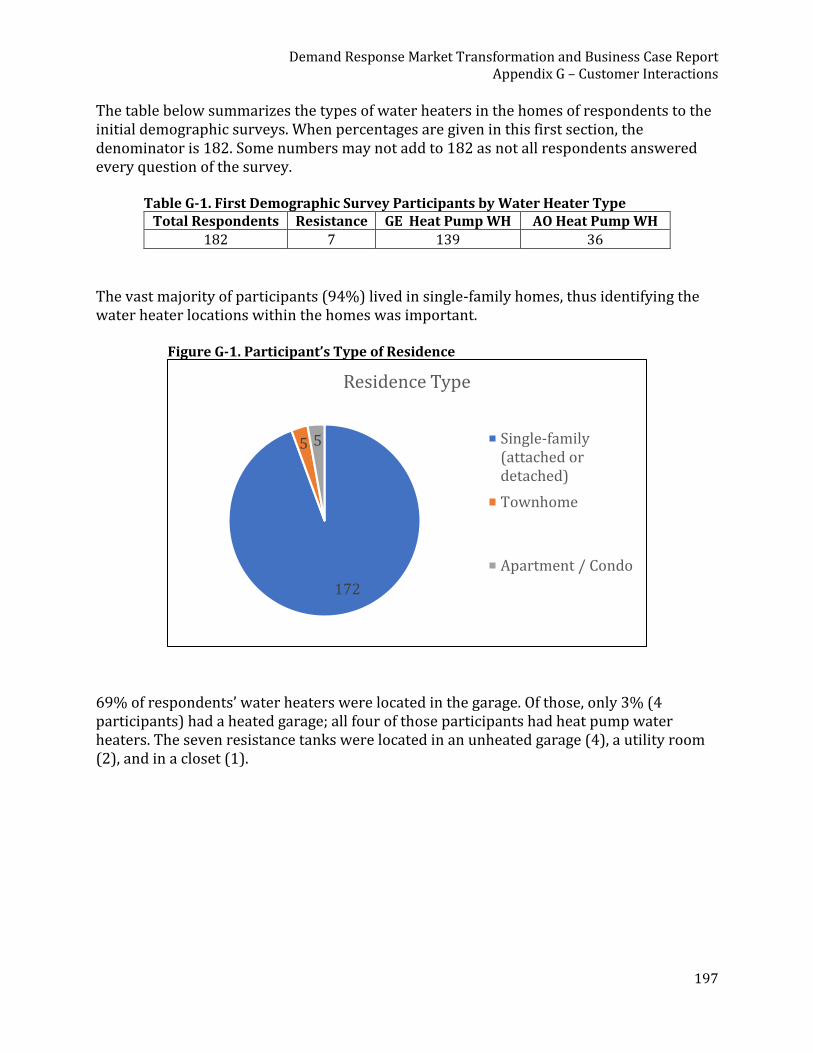
Demand Response Market Transformation and Business Case Report Appendix G – Customer Interactions
197
The table below summarizes the types of water heaters in the homes of respondents to the initial demographic surveys. When percentages are given in this first section, the denominator is 182. Some numbers may not add to 182 as not all respondents answered every question of the survey.
Table G-1. First Demographic Survey Participants by Water Heater Type Total Respondents Resistance GE Heat Pump WH AO Heat Pump WH
182 7 139 36
The vast majority of participants (94%) lived in single-family homes, thus identifying the water heater locations within the homes was important.
Figure G-1. Participant’s Type of Residence
69% of respondents’ water heaters were located in the garage. Of those, only 3% (4 participants) had a heated garage; all four of those participants had heat pump water heaters. The seven resistance tanks were located in an unheated garage (4), a utility room (2), and in a closet (1).
172
5 5
Residence Type
Single-family(attached ordetached)
Townhome
Apartment / Condo
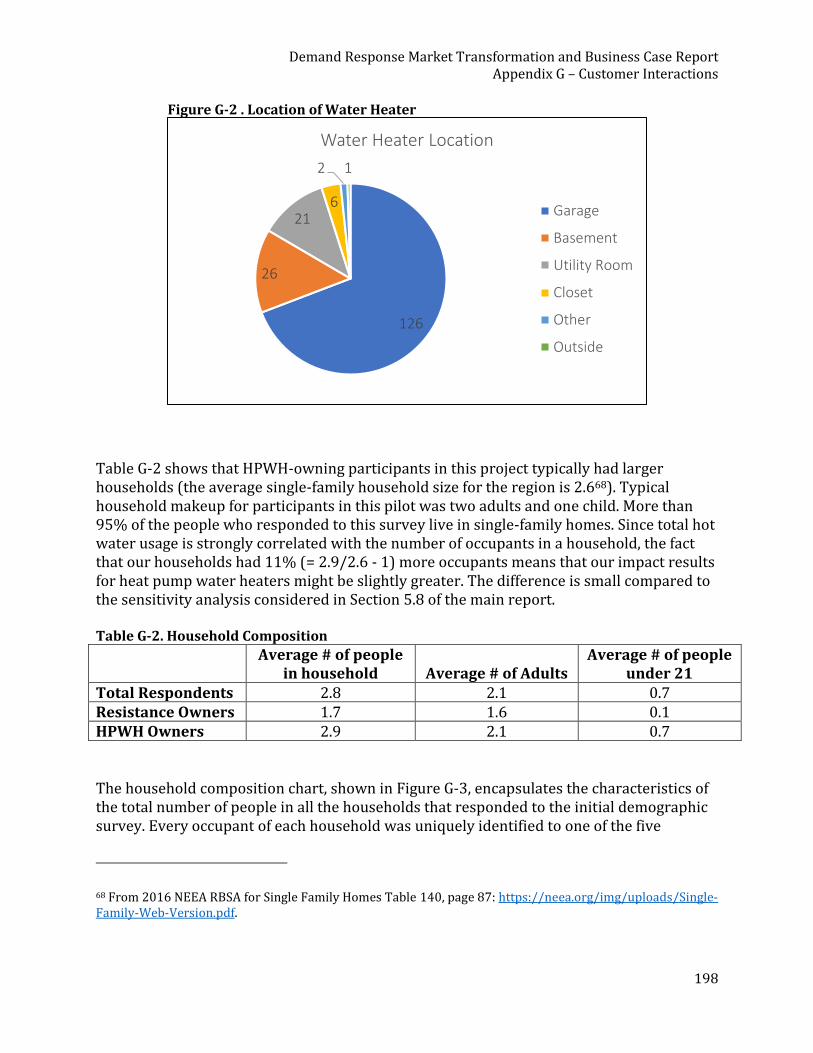
Demand Response Market Transformation and Business Case Report Appendix G – Customer Interactions
198
Figure G-2 . Location of Water Heater
Table G-2 shows that HPWH-owning participants in this project typically had larger households (the average single-family household size for the region is 2.668). Typical household makeup for participants in this pilot was two adults and one child. More than 95% of the people who responded to this survey live in single-family homes. Since total hot water usage is strongly correlated with the number of occupants in a household, the fact that our households had 11% (= 2.9/2.6 - 1) more occupants means that our impact results for heat pump water heaters might be slightly greater. The difference is small compared to the sensitivity analysis considered in Section 5.8 of the main report. Table G-2. Household Composition
Average # of people in household Average # of Adults
Average # of people under 21
Total Respondents 2.8 2.1 0.7 Resistance Owners 1.7 1.6 0.1 HPWH Owners 2.9 2.1 0.7
The household composition chart, shown in Figure G-3, encapsulates the characteristics of the total number of people in all the households that responded to the initial demographic survey. Every occupant of each household was uniquely identified to one of the five
68 From 2016 NEEA RBSA for Single Family Homes Table 140, page 87: https://neea.org/img/uploads/Single-Family-Web-Version.pdf.
126
26
216
2 1
Water Heater Location
Garage
Basement
Utility Room
Closet
Other
Outside
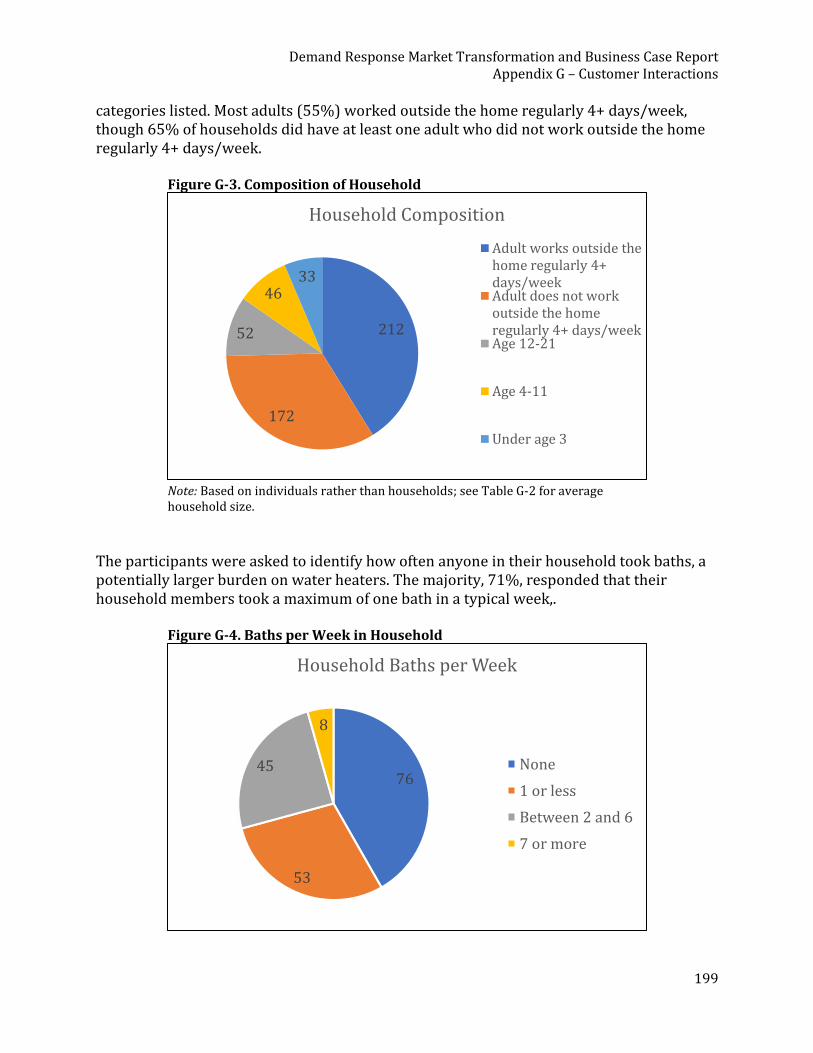
Demand Response Market Transformation and Business Case Report Appendix G – Customer Interactions
199
categories listed. Most adults (55%) worked outside the home regularly 4+ days/week, though 65% of households did have at least one adult who did not work outside the home regularly 4+ days/week.
Figure G-3. Composition of Household
Note: Based on individuals rather than households; see Table G-2 for average household size.
The participants were asked to identify how often anyone in their household took baths, a potentially larger burden on water heaters. The majority, 71%, responded that their household members took a maximum of one bath in a typical week,.
Figure G-4. Baths per Week in Household
212
172
52
4633
Household Composition
Adult works outside thehome regularly 4+days/weekAdult does not workoutside the homeregularly 4+ days/weekAge 12-21
Age 4-11
Under age 3
76
53
45
8
Household Baths per Week
None
1 or less
Between 2 and 6
7 or more
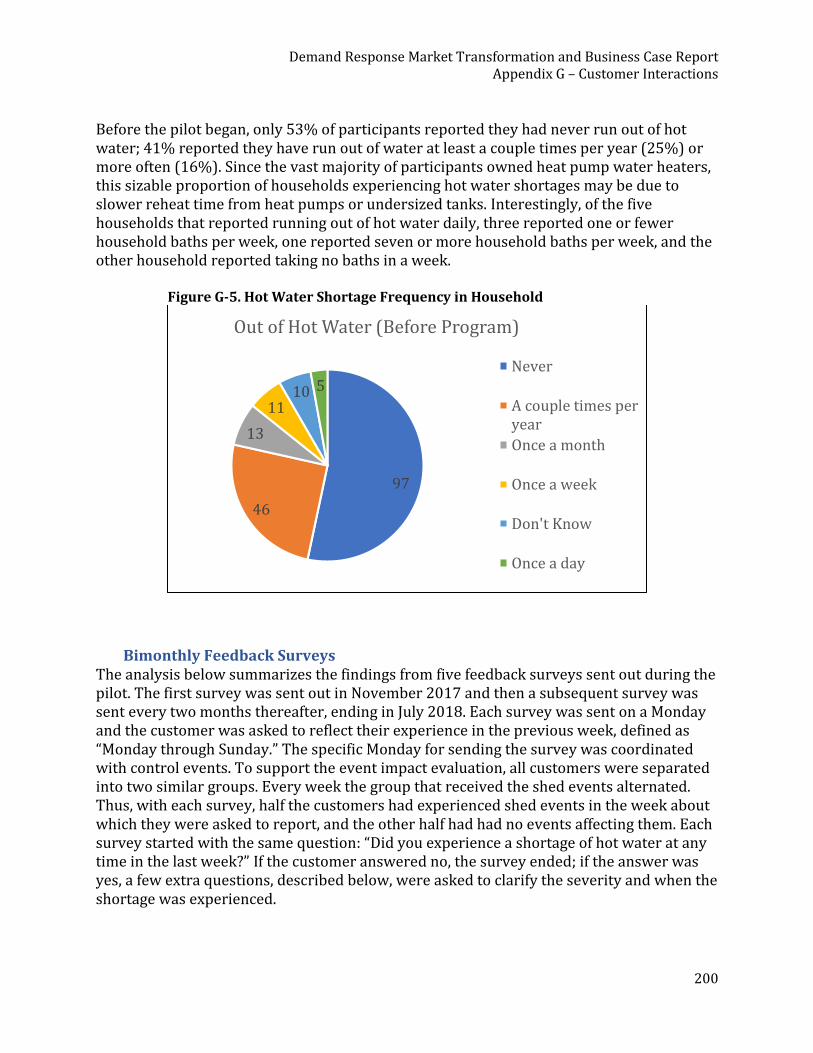
Demand Response Market Transformation and Business Case Report Appendix G – Customer Interactions
200
Before the pilot began, only 53% of participants reported they had never run out of hot water; 41% reported they have run out of water at least a couple times per year (25%) or more often (16%). Since the vast majority of participants owned heat pump water heaters, this sizable proportion of households experiencing hot water shortages may be due to slower reheat time from heat pumps or undersized tanks. Interestingly, of the five households that reported running out of hot water daily, three reported one or fewer household baths per week, one reported seven or more household baths per week, and the other household reported taking no baths in a week.
Figure G-5. Hot Water Shortage Frequency in Household
Bimonthly Feedback Surveys The analysis below summarizes the findings from five feedback surveys sent out during the pilot. The first survey was sent out in November 2017 and then a subsequent survey was sent every two months thereafter, ending in July 2018. Each survey was sent on a Monday and the customer was asked to reflect their experience in the previous week, defined as “Monday through Sunday.” The specific Monday for sending the survey was coordinated with control events. To support the event impact evaluation, all customers were separated into two similar groups. Every week the group that received the shed events alternated. Thus, with each survey, half the customers had experienced shed events in the week about which they were asked to report, and the other half had had no events affecting them. Each survey started with the same question: “Did you experience a shortage of hot water at any time in the last week?” If the customer answered no, the survey ended; if the answer was yes, a few extra questions, described below, were asked to clarify the severity and when the shortage was experienced.
97
46
13
1110 5
Out of Hot Water (Before Program)
Never
A couple times peryear
Once a month
Once a week
Don't Know
Once a day
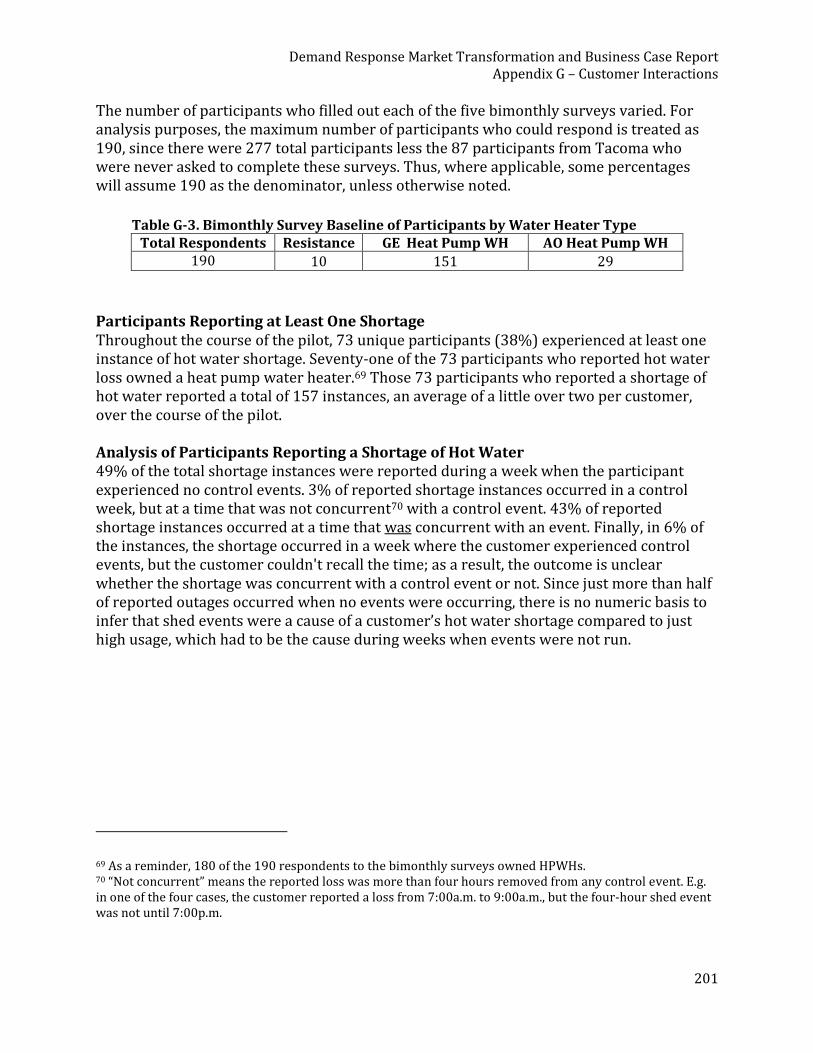
Demand Response Market Transformation and Business Case Report Appendix G – Customer Interactions
201
The number of participants who filled out each of the five bimonthly surveys varied. For analysis purposes, the maximum number of participants who could respond is treated as 190, since there were 277 total participants less the 87 participants from Tacoma who were never asked to complete these surveys. Thus, where applicable, some percentages will assume 190 as the denominator, unless otherwise noted.
Table G-3. Bimonthly Survey Baseline of Participants by Water Heater Type
Total Respondents Resistance GE Heat Pump WH AO Heat Pump WH 190 10 151 29
Participants Reporting at Least One Shortage Throughout the course of the pilot, 73 unique participants (38%) experienced at least one instance of hot water shortage. Seventy-one of the 73 participants who reported hot water loss owned a heat pump water heater.69 Those 73 participants who reported a shortage of hot water reported a total of 157 instances, an average of a little over two per customer, over the course of the pilot. Analysis of Participants Reporting a Shortage of Hot Water 49% of the total shortage instances were reported during a week when the participant experienced no control events. 3% of reported shortage instances occurred in a control week, but at a time that was not concurrent70 with a control event. 43% of reported shortage instances occurred at a time that was concurrent with an event. Finally, in 6% of the instances, the shortage occurred in a week where the customer experienced control events, but the customer couldn't recall the time; as a result, the outcome is unclear whether the shortage was concurrent with a control event or not. Since just more than half of reported outages occurred when no events were occurring, there is no numeric basis to infer that shed events were a cause of a customer’s hot water shortage compared to just high usage, which had to be the cause during weeks when events were not run.
69 As a reminder, 180 of the 190 respondents to the bimonthly surveys owned HPWHs. 70 “Not concurrent” means the reported loss was more than four hours removed from any control event. E.g. in one of the four cases, the customer reported a loss from 7:00a.m. to 9:00a.m., but the four-hour shed event was not until 7:00p.m.
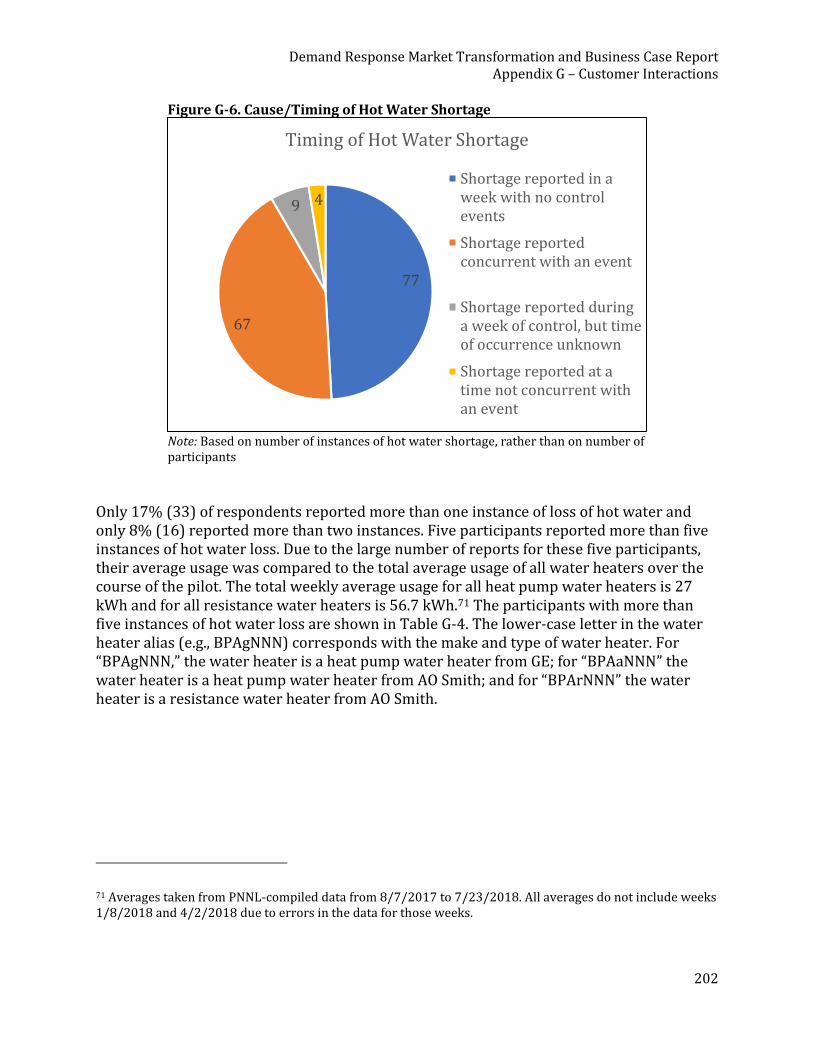
Demand Response Market Transformation and Business Case Report Appendix G – Customer Interactions
202
Figure G-6. Cause/Timing of Hot Water Shortage
Note: Based on number of instances of hot water shortage, rather than on number of participants
Only 17% (33) of respondents reported more than one instance of loss of hot water and only 8% (16) reported more than two instances. Five participants reported more than five instances of hot water loss. Due to the large number of reports for these five participants, their average usage was compared to the total average usage of all water heaters over the course of the pilot. The total weekly average usage for all heat pump water heaters is 27 kWh and for all resistance water heaters is 56.7 kWh.71 The participants with more than five instances of hot water loss are shown in Table G-4. The lower-case letter in the water heater alias (e.g., BPAgNNN) corresponds with the make and type of water heater. For “BPAgNNN,” the water heater is a heat pump water heater from GE; for “BPAaNNN” the water heater is a heat pump water heater from AO Smith; and for “BPArNNN” the water heater is a resistance water heater from AO Smith.
71 Averages taken from PNNL-compiled data from 8/7/2017 to 7/23/2018. All averages do not include weeks 1/8/2018 and 4/2/2018 due to errors in the data for those weeks.
77
67
9 4
Timing of Hot Water Shortage
Shortage reported in aweek with no controlevents
Shortage reportedconcurrent with an event
Shortage reported duringa week of control, but timeof occurrence unknown
Shortage reported at atime not concurrent withan event

Demand Response Market Transformation and Business Case Report Appendix G – Customer Interactions
203
Table G-4. Participants with More than Five Instances of Hot Water Loss
Water Heater Alias # Reports of Loss
of Hot Water Avg. Weekly Usage (kWh)
Percent above Total Average
BPAg610 16 28.9 7.0% BPAr801 12 98.2 73.2% BPAg909 7 32.6 20.7% BPAg520 6 45.6 68.9% BPAg532 6 35.3 30.7%
As is expected, those who experienced and reported multiple instances of hot water loss had higher than average usage. These participants may have a heavy-use household or an improperly-sized water heater as BPAr801, BPAg909 and BPAg532 responded in the initial demographic survey that they lose hot water once a day; BPAg520 and BPAg610 responded that they lose hot water once a week. That 3% (5 out of 190) of customers reported a frequent shortage of hot water should be considered in the design of a future program. As part of the recruitment effort, attention should be paid to how often a customer experiences a hot water shortage. Frequent occurrences are a contrary indicator to enrollment. Also, a three-month check-in with a new customer should ask the same question to ensure a positive customer experience can be created for the future. The colder months typically showed higher reports of loss of hot water, as illustrated in Figure G-7. The primary factor is that all water heaters use more energy in winter because the inlet cold water temperature is much colder. In the PNW, given that most water supplies are created from snow melt, the cold water temperature stays cold through March. Another factor could be due to the garage location of a majority of water heaters; given that heat pump water heaters must run longer in cold air to heat the tank, there may be a connection between colder weather and hot water shortages. Further analysis is needed, though, to justify that correlation. In addition, the events that we ran prior to the January survey were very different from the events run prior to the March survey.
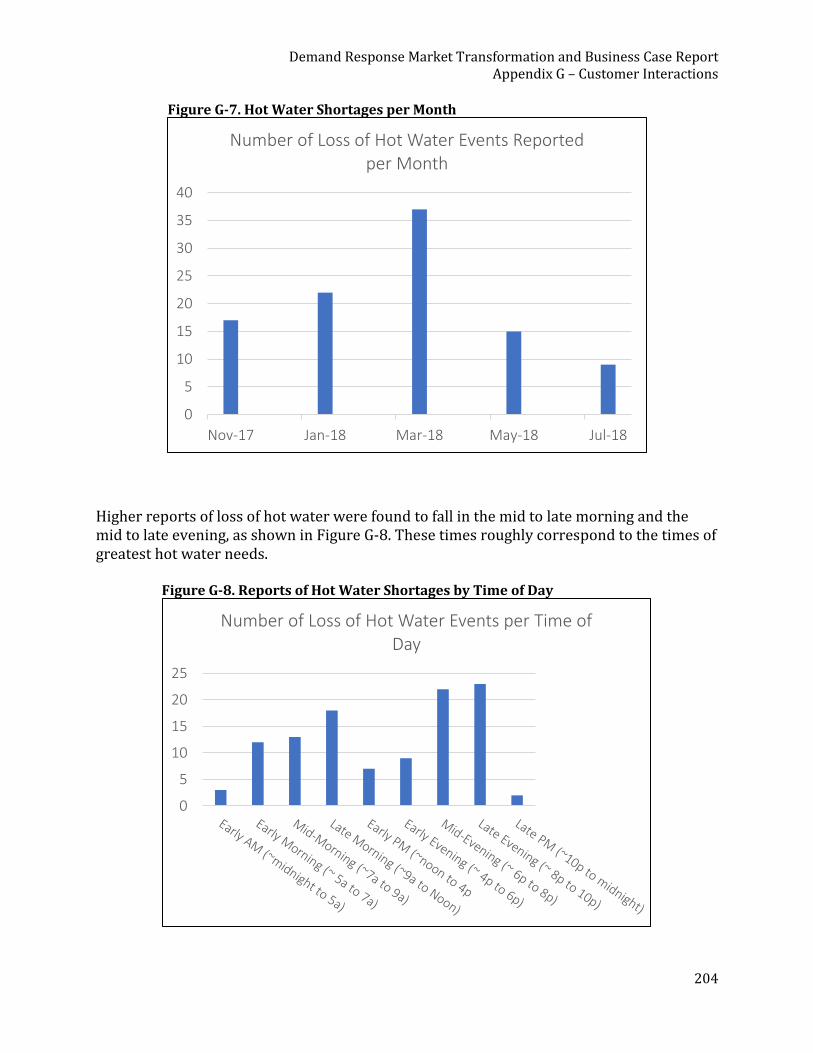
Demand Response Market Transformation and Business Case Report Appendix G – Customer Interactions
204
Figure G-7. Hot Water Shortages per Month
Higher reports of loss of hot water were found to fall in the mid to late morning and the mid to late evening, as shown in Figure G-8. These times roughly correspond to the times of greatest hot water needs.
Figure G-8. Reports of Hot Water Shortages by Time of Day
0
5
10
15
20
25
30
35
40
Nov-17 Jan-18 Mar-18 May-18 Jul-18
Number of Loss of Hot Water Events Reported per Month
0
5
10
15
20
25
Number of Loss of Hot Water Events per Time of Day
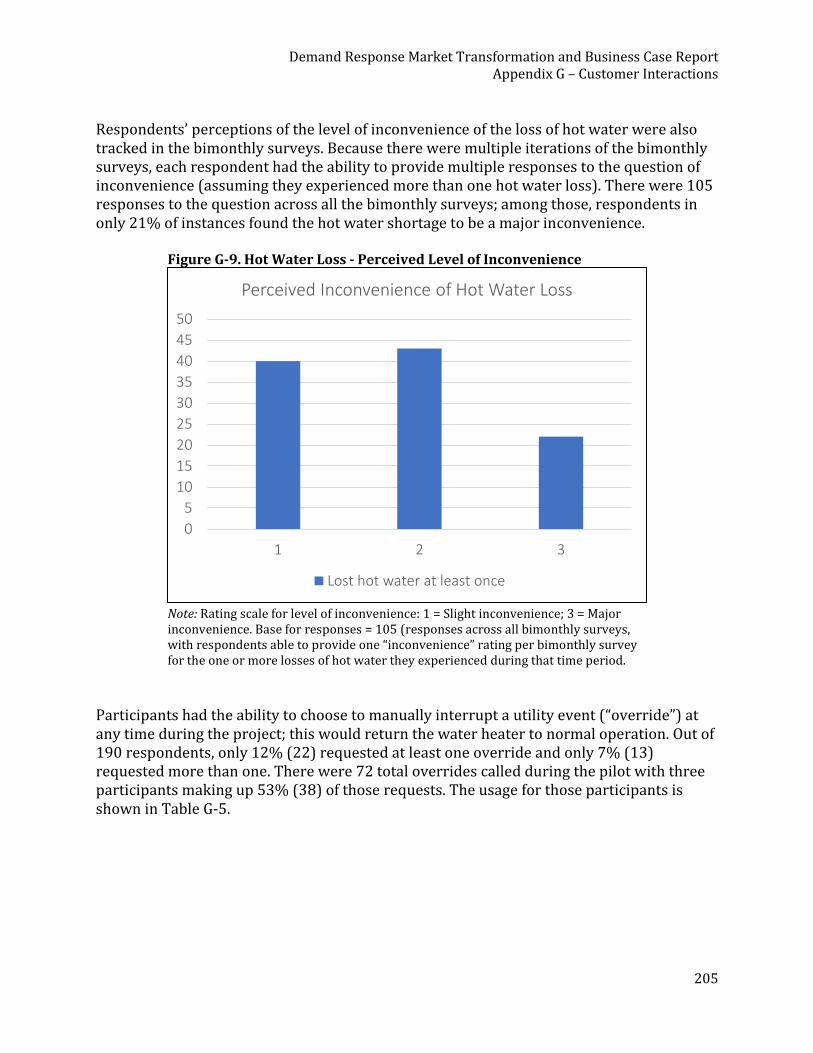
Demand Response Market Transformation and Business Case Report Appendix G – Customer Interactions
205
Respondents’ perceptions of the level of inconvenience of the loss of hot water were also tracked in the bimonthly surveys. Because there were multiple iterations of the bimonthly surveys, each respondent had the ability to provide multiple responses to the question of inconvenience (assuming they experienced more than one hot water loss). There were 105 responses to the question across all the bimonthly surveys; among those, respondents in only 21% of instances found the hot water shortage to be a major inconvenience.
Figure G-9. Hot Water Loss - Perceived Level of Inconvenience
Note: Rating scale for level of inconvenience: 1 = Slight inconvenience; 3 = Major inconvenience. Base for responses = 105 (responses across all bimonthly surveys, with respondents able to provide one “inconvenience” rating per bimonthly survey for the one or more losses of hot water they experienced during that time period.
Participants had the ability to choose to manually interrupt a utility event (“override”) at any time during the project; this would return the water heater to normal operation. Out of 190 respondents, only 12% (22) requested at least one override and only 7% (13) requested more than one. There were 72 total overrides called during the pilot with three participants making up 53% (38) of those requests. The usage for those participants is shown in Table G-5.
0
5
10
15
20
25
30
35
40
45
50
1 2 3
Perceived Inconvenience of Hot Water Loss
Lost hot water at least once
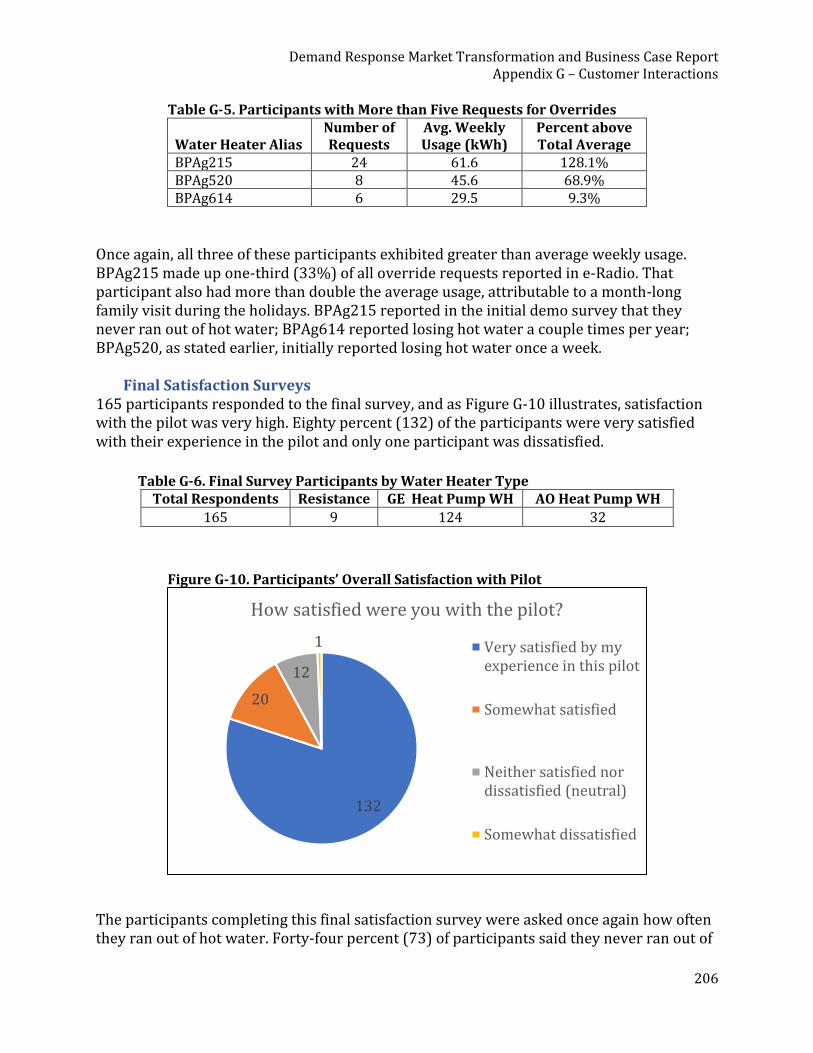
Demand Response Market Transformation and Business Case Report Appendix G – Customer Interactions
206
Table G-5. Participants with More than Five Requests for Overrides
Water Heater Alias Number of Requests
Avg. Weekly Usage (kWh)
Percent above Total Average
BPAg215 24 61.6 128.1% BPAg520 8 45.6 68.9% BPAg614 6 29.5 9.3%
Once again, all three of these participants exhibited greater than average weekly usage. BPAg215 made up one-third (33%) of all override requests reported in e-Radio. That participant also had more than double the average usage, attributable to a month-long family visit during the holidays. BPAg215 reported in the initial demo survey that they never ran out of hot water; BPAg614 reported losing hot water a couple times per year; BPAg520, as stated earlier, initially reported losing hot water once a week.
Final Satisfaction Surveys 165 participants responded to the final survey, and as Figure G-10 illustrates, satisfaction with the pilot was very high. Eighty percent (132) of the participants were very satisfied with their experience in the pilot and only one participant was dissatisfied.
Table G-6. Final Survey Participants by Water Heater Type
Total Respondents Resistance GE Heat Pump WH AO Heat Pump WH
165 9 124 32
Figure G-10. Participants’ Overall Satisfaction with Pilot
The participants completing this final satisfaction survey were asked once again how often they ran out of hot water. Forty-four percent (73) of participants said they never ran out of
132
20
12
1
How satisfied were you with the pilot?
Very satisfied by myexperience in this pilot
Somewhat satisfied
Neither satisfied nordissatisfied (neutral)
Somewhat dissatisfied
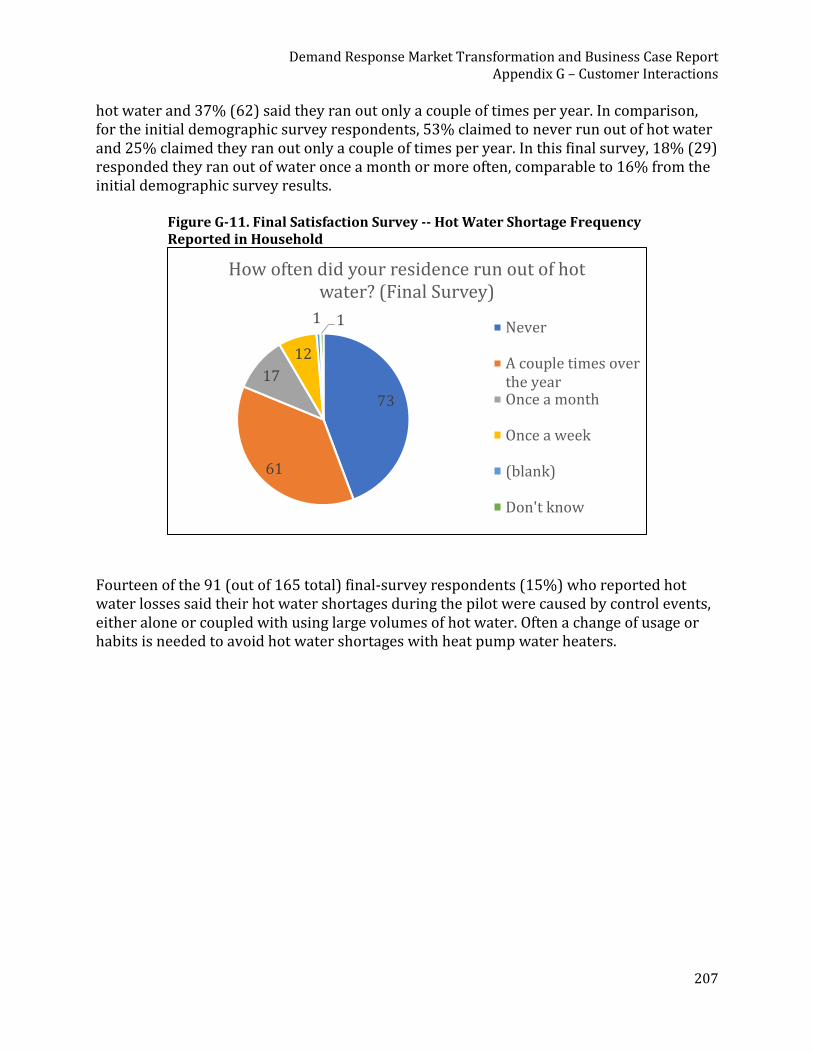
Demand Response Market Transformation and Business Case Report Appendix G – Customer Interactions
207
hot water and 37% (62) said they ran out only a couple of times per year. In comparison, for the initial demographic survey respondents, 53% claimed to never run out of hot water and 25% claimed they ran out only a couple of times per year. In this final survey, 18% (29) responded they ran out of water once a month or more often, comparable to 16% from the initial demographic survey results.
Figure G-11. Final Satisfaction Survey -- Hot Water Shortage Frequency Reported in Household
Fourteen of the 91 (out of 165 total) final-survey respondents (15%) who reported hot water losses said their hot water shortages during the pilot were caused by control events, either alone or coupled with using large volumes of hot water. Often a change of usage or habits is needed to avoid hot water shortages with heat pump water heaters.
73
61
17
12
1 1
How often did your residence run out of hot water? (Final Survey)
Never
A couple times overthe yearOnce a month
Once a week
(blank)
Don't know
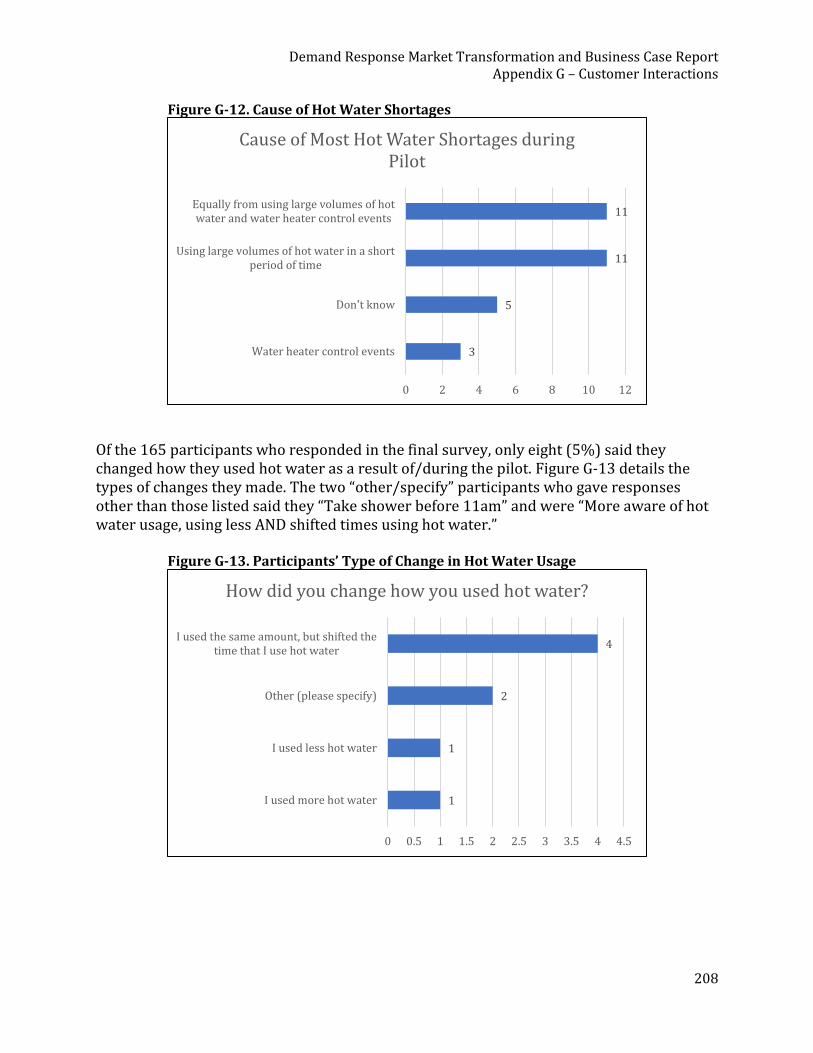
Demand Response Market Transformation and Business Case Report Appendix G – Customer Interactions
208
Figure G-12. Cause of Hot Water Shortages
Of the 165 participants who responded in the final survey, only eight (5%) said they changed how they used hot water as a result of/during the pilot. Figure G-13 details the types of changes they made. The two “other/specify” participants who gave responses other than those listed said they “Take shower before 11am” and were “More aware of hot water usage, using less AND shifted times using hot water.”
Figure G-13. Participants’ Type of Change in Hot Water Usage
3
5
11
11
0 2 4 6 8 10 12
Water heater control events
Don't know
Using large volumes of hot water in a shortperiod of time
Equally from using large volumes of hotwater and water heater control events
Cause of Most Hot Water Shortages during Pilot
1
1
2
4
0 0.5 1 1.5 2 2.5 3 3.5 4 4.5
I used more hot water
I used less hot water
Other (please specify)
I used the same amount, but shifted thetime that I use hot water
How did you change how you used hot water?
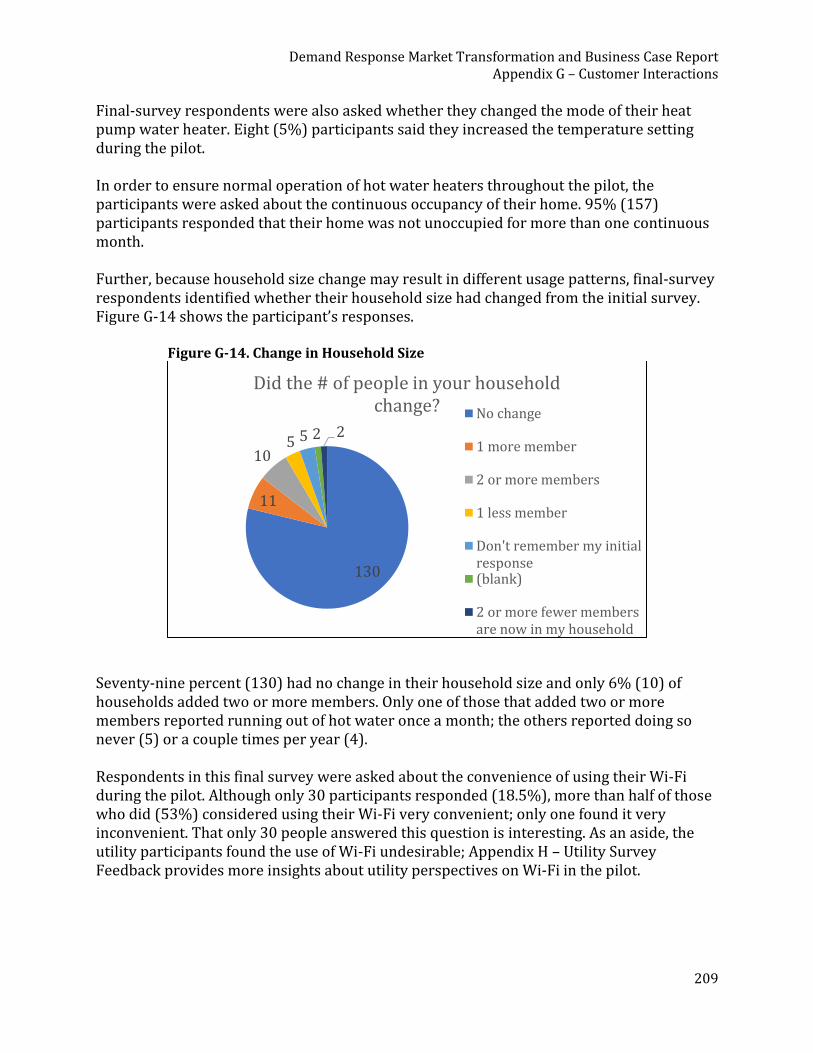
Demand Response Market Transformation and Business Case Report Appendix G – Customer Interactions
209
Final-survey respondents were also asked whether they changed the mode of their heat pump water heater. Eight (5%) participants said they increased the temperature setting during the pilot. In order to ensure normal operation of hot water heaters throughout the pilot, the participants were asked about the continuous occupancy of their home. 95% (157) participants responded that their home was not unoccupied for more than one continuous month. Further, because household size change may result in different usage patterns, final-survey respondents identified whether their household size had changed from the initial survey. Figure G-14 shows the participant’s responses.
Figure G-14. Change in Household Size
Seventy-nine percent (130) had no change in their household size and only 6% (10) of households added two or more members. Only one of those that added two or more members reported running out of hot water once a month; the others reported doing so never (5) or a couple times per year (4). Respondents in this final survey were asked about the convenience of using their Wi-Fi during the pilot. Although only 30 participants responded (18.5%), more than half of those who did (53%) considered using their Wi-Fi very convenient; only one found it very inconvenient. That only 30 people answered this question is interesting. As an aside, the utility participants found the use of Wi-Fi undesirable; Appendix H – Utility Survey Feedback provides more insights about utility perspectives on Wi-Fi in the pilot.
130
11
105 5 2 2
Did the # of people in your household change? No change
1 more member
2 or more members
1 less member
Don't remember my initialresponse(blank)
2 or more fewer membersare now in my household
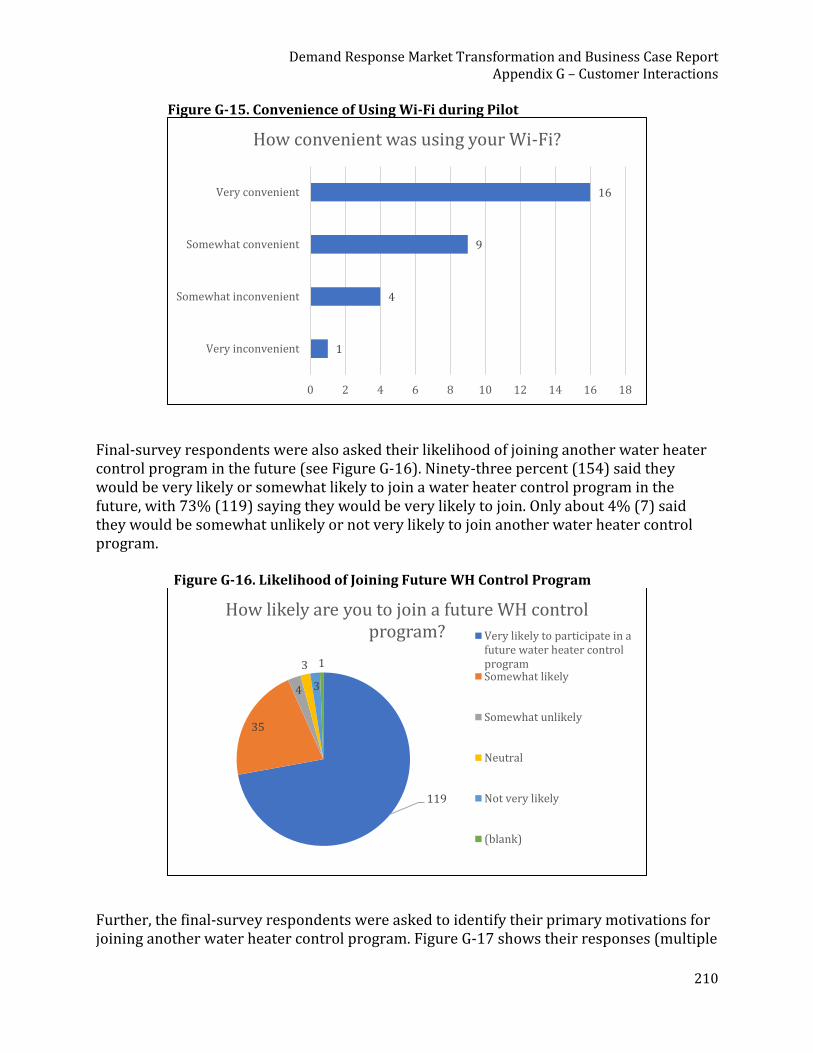
Demand Response Market Transformation and Business Case Report Appendix G – Customer Interactions
210
Figure G-15. Convenience of Using Wi-Fi during Pilot
Final-survey respondents were also asked their likelihood of joining another water heater control program in the future (see Figure G-16). Ninety-three percent (154) said they would be very likely or somewhat likely to join a water heater control program in the future, with 73% (119) saying they would be very likely to join. Only about 4% (7) said they would be somewhat unlikely or not very likely to join another water heater control program.
Figure G-16. Likelihood of Joining Future WH Control Program
Further, the final-survey respondents were asked to identify their primary motivations for joining another water heater control program. Figure G-17 shows their responses (multiple
1
4
9
16
0 2 4 6 8 10 12 14 16 18
Very inconvenient
Somewhat inconvenient
Somewhat convenient
Very convenient
How convenient was using your Wi-Fi?
119
35
4
3
3
1
How likely are you to join a future WH control program? Very likely to participate in a
future water heater controlprogramSomewhat likely
Somewhat unlikely
Neutral
Not very likely
(blank)
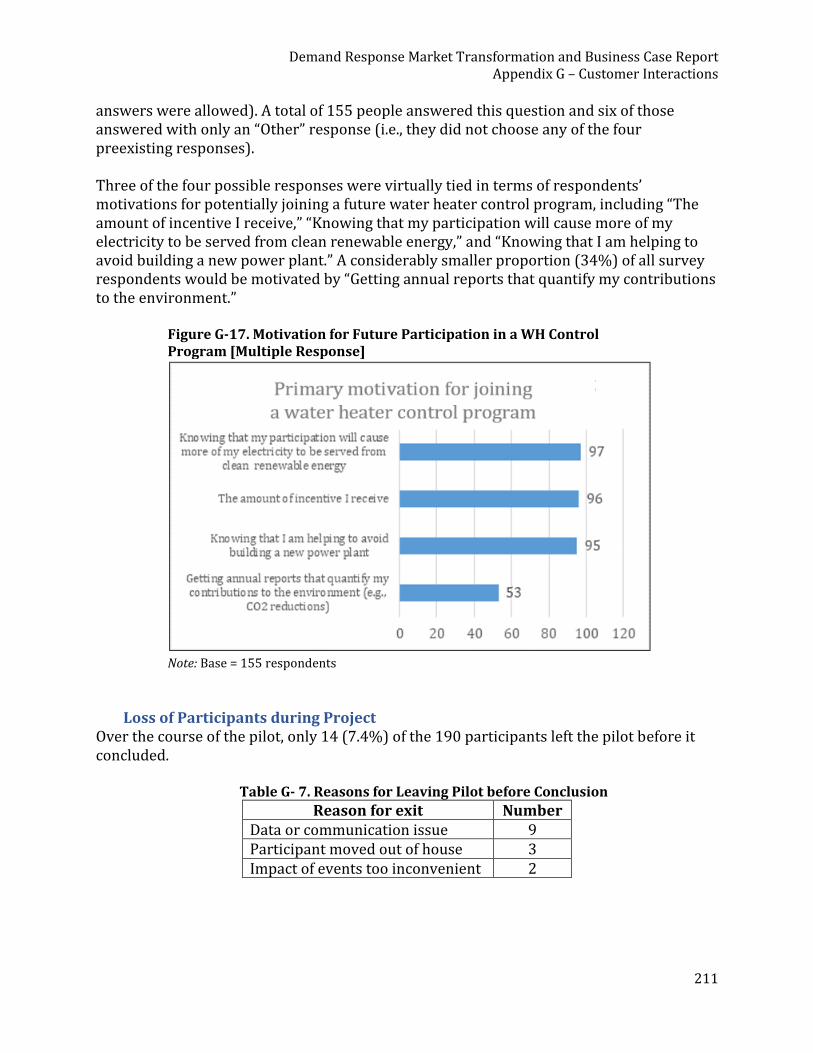
Demand Response Market Transformation and Business Case Report Appendix G – Customer Interactions
211
answers were allowed). A total of 155 people answered this question and six of those answered with only an “Other” response (i.e., they did not choose any of the four preexisting responses). Three of the four possible responses were virtually tied in terms of respondents’ motivations for potentially joining a future water heater control program, including “The amount of incentive I receive,” “Knowing that my participation will cause more of my electricity to be served from clean renewable energy,” and “Knowing that I am helping to avoid building a new power plant.” A considerably smaller proportion (34%) of all survey respondents would be motivated by “Getting annual reports that quantify my contributions to the environment.”
Figure G-17. Motivation for Future Participation in a WH Control Program [Multiple Response]
Note: Base = 155 respondents
Loss of Participants during Project Over the course of the pilot, only 14 (7.4%) of the 190 participants left the pilot before it concluded.
Table G- 7. Reasons for Leaving Pilot before Conclusion
Reason for exit Number Data or communication issue 9 Participant moved out of house 3 Impact of events too inconvenient 2

Demand Response Market Transformation and Business Case Report Appendix G – Customer Interactions
212
Nine of those 14 left due to communication issues. Those who experienced communication or issues had problems such as inadequate Wi-Fi, no FM signal, and/or failed communication hardware. Three participants moved out of their residences before the pilot was over. Only two participants unenrolled due to experiencing frequent loss of sufficient hot water. The two who unenrolled due to loss of hot water were BPAg215 and BPAg510. BPAg215 had a month-long family visit that caused much higher than average usage patterns and the participants opted to un-enroll rather than to attempt to constantly override events. BPAg510 had high usage (41.9% above total average) and mentioned that “they kept experiencing lukewarm water issues.”72 This home also had a hot water re-circulator, which often means an increase in heat loss due to the constant moving of hot water. This may have also contributed to their higher-than-average usage. BPAg510 did not complete an initial demographic survey and neither was asked to complete the final satisfaction survey. A loss of two out of 190 customers due to the impact of the program is a very low dropout rate for a pilot such as this.
Examples of Marketing Materials for Customers The images on the following three pages represent some of the marketing materials sent to PGE customers. The first is an example of a tri-fold (front and back) provided to customers by a plumber who was onsite to replace a failed tank. The second example is a recruitment letter mailed to customers who had an existing heat pump that would be compatible with communication adapters purchased for the pilot.
72 Email quote from utility pilot manager on 9/13/2018.

Demand Response Market Transformation and Business Case Report Appendix G – Customer Interactions
213
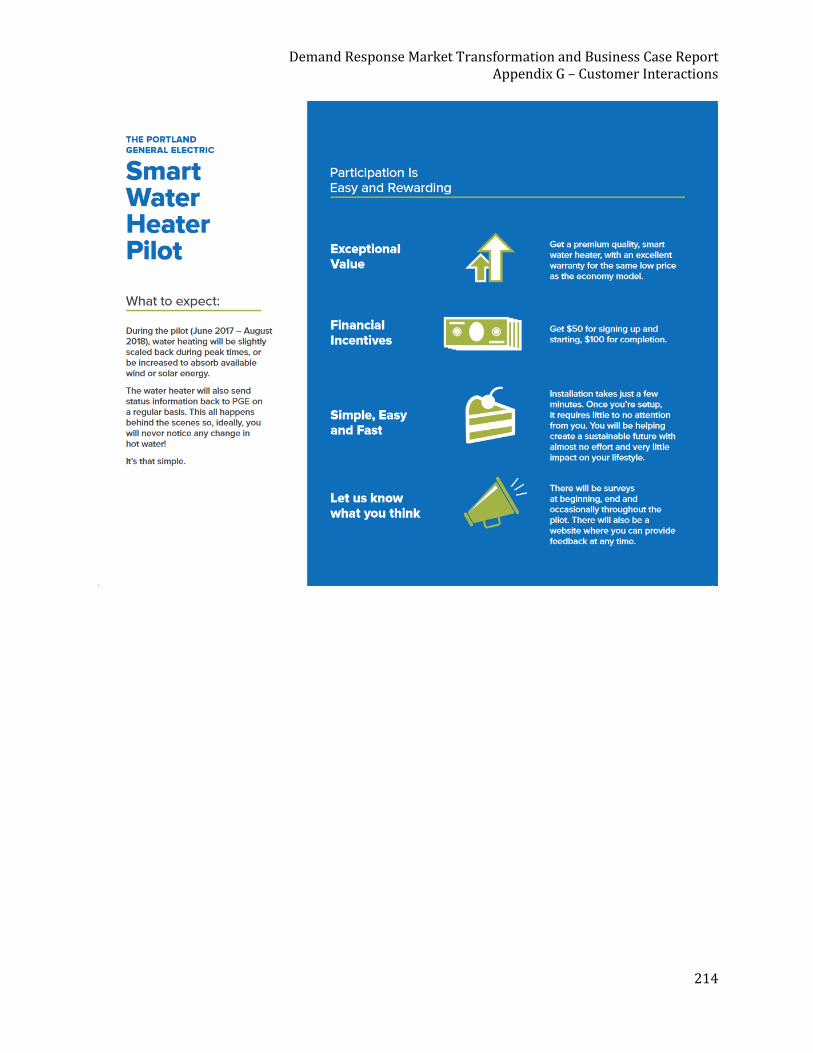
Demand Response Market Transformation and Business Case Report Appendix G – Customer Interactions
214

Demand Response Market Transformation and Business Case Report Appendix G – Customer Interactions
215

Demand Response Market Transformation and Business Case Report Appendix H – Utility Survey Feedback
216
Appendix H – Utility Survey Feedback This appendix summarizes the post-pilot-study survey responses of the utilities that participated in this pilot study. The eight participating utilities were the following: Clark PUD, Emerald PUD, Franklin PUD, PGE, Puget Sound Energy, Snohomish County PUD, Springfield Utility Board and Tacoma Power. Overall, based on their responses, the utilities felt that the pilot was a success. The implementation team met regularly with the utilities throughout the pilot. By and large, the operational questions and comments during those meetings (in person and over the phone) seemed positive and constructive. The final debrief questionnaire, summarized below, revealed some challenges with very frank comments so as to maximize learnings. Most of the utility respondents replied to a number of open-ended questions (below) and then answered several quantitative questions related to future demand response programs, summarized in the table. Suggested Feedback Topics [Note: Three utilities did not answer any of these open-ended questions] What worked well?
• Minimal participant hot water impact. • Well prepared concise messages for common customer questions and issues. • The support staff was fantastic through the setup process. BPA and PGE staff were
always available to help when issues came up. • I feel like the radio signal was pretty consistent. • Conrad and Tony were also pretty consistent. • The DR signals seemed to go smoothly. • Ease of communication throughout the project – conference calls, email responses,
in person meetings.
What didn’t?
• Using a participant’s home Wi-Fi signal presented so many issues. o The equipment had issues re-connecting after a lost connection. o Changing out modem/routers. o Changing Wi-Fi passwords. o Power Outages – Internet Outages. o Faulty GE control boards (PS, I still need replacements for 2 participants). o Participant complaints about slowed internet speed (justified or not).
• I feel that not having a WH or HPWH program working in our utility prior to beginning the pilot greatly hindered our success of customer recruitment. We did not have a base to recruit from unlike many of the other utilities.
Demand Response Market Transformation and Business Case Report Appendix H – Utility Survey Feedback
217
• Previous programs have suffered from service issues when relying on customer network infrastructure and this has been no different. Future programs should limit the reliance on customer assets for program operations or data acquisition.
• Troubleshooting was a real time sink. • The Wi-Fi technology and interface was problematic from the beginning in a
multifamily setting. Relying on a single router to make sure there was adequate signal strength at the water heater (which was located in various spaces in a unit, depending on floorplan) was difficult; however, in a multifamily situation where the landlord gives the directive of participation in a demand response program as terms of the lease, it’s unavoidable. You’d have to have some sort of network set up so you don’t rely on tenant internet accounts.
• The interface was clunky and it wasn’t always apparent if we’d connected a unit to the e-Radio system. There was a lot of trial and error, circling back and reconnecting.
• Recruitment of customers thru plumbers didn’t work. Customer recruitment
• Most of the people joined the pilot because they care about saving money or saving the planet.
• This process went fairly well, though the amount of effort to enroll one customer was pretty high. Our outreach and enrollment efforts struggled to maintain momentum to more participants over time. The effort really requires a full-court press at all times to stay in front to continue to grow the program.
• This was challenging because nobody wants big brother controlling their hot water supply.
• I DO believe the participant funds/payments were necessary to gain participation • The ones that joined ONLY for the money seemed to complain the most (80% of the
time it was no fault of the pilot program). • As I stated above, this did not go well. SUB only uses BPA funding for our energy
efficiency programs. We had to rely solely on our one plumbing company that was chosen by NEEA and this one company is also the most expensive plumber in the Willamette Valley. I believe that price point also came into play because of the plumbing companies pricing, even of this pilot program.
• I think that the utilities should have a say or be able to offer suggestions as to which companies may be a good fit for a pilot as they know their own area better than someone that lives out of the area.
• Customer recruitment was relatively easy in that we were dealing with a single entity rather than dealing with 90 individual customers.
Customer experience
• Unless we were dealing with internet connectivity issues, the overall customer experience was low-impact as it should be.
• Seeing how the customers were basically test subjects, I believe the customer experience was nothing to write home about. I would like to see improvements to the customer experience for future pilot programs.
Demand Response Market Transformation and Business Case Report Appendix H – Utility Survey Feedback
218
o What improvements do I recommend: Hot line number for participants that are experiencing issues. Immediately connecting our participants directly to a diagnostic professional would be amazing!
o Provide simplified information about how HPWH’s work. Maybe an educational short video? (I found that at least half of the participants don’t understand how HPWH’s work).
• The one customer that we have in the pilot was very happy with everything once we got going on it. He works over at one of the local grocery stores and remembered me from when I was out at his home setting up the equipment and he commented on the ease of the program and loves his water heater.
• For HPWH customers with heavy hot water use, need way to identify WHEN the heavy use periods are so control events don’t interfere.
Amount of work
• It’s tough to judge a pilot program on the amount of work required. Since we were all figuring out the technology and the rollout stuff together, I think the amount of work required was suitable. That being said, the more we can minimize the enrollment and setup time for utilities and customers the more effective the program can be overall.
• I had no idea how much work this pilot program would involve. A significant amount of up front work was required. The work load decreased near the middle point of the pilot program.
o Before this point, I answered so many participant questions that it made my head hurt.
• In addition, great technical and communication skills were needed to help customers connect and re-connect their utility provided equipment. Those skills seems to be very important so that information could be relayed to participants in a competent/understandable manner.
• Being that [utility’s] conservation department consists of three people, initially I was a little surprised at what the utility had to get to together (customizing the marketing tools, customer packets, working with the plumbing company, setting up Wi-Fi). But, after that was done it was just a matter of tracking and checking in at the meetings.
• The amount of utility involvement in this project was significantly more than anticipated. Since we elected to coordinate with a single customer with several units, this may have been a different experience than other utilities.
Using customer's Wi-Fi
• Doable but high maintenance for the utility and the participant – Not ideal. • An automatic email response to customers who have lost Wi-Fi for at least 3 days
would be a great addition to the program. • This worked well if the customer was an informed internet Wi-Fi user, but if that
person was not even sure what their internet password was, then the task of getting them up and going was much more difficult. I also noticed that the demographic of the customer came into play. Whereas the younger internet user was much more
Demand Response Market Transformation and Business Case Report Appendix H – Utility Survey Feedback
219
adapt to know what to do by following the hook-up instruction, the older customer not so much.
• Did not use customer Wi-Fi - there was no guarantee that each tenant had access to Wi-Fi and we elected to provide the service for the purpose of this study at our cost. Providing Wi-Fi to each customer proved problematic in terms of monthly payment to maintain service at all test locations.
• Maintaining Wi-Fi is hassle for utilities and probably also customers. Maturity of the hardware
• I feel like the equipment is not proven. Unexplainable things have happened that were only fixed by replacing the hardware. Faulty units were sent back to BPA for testing. I have not heard an update. Please look into the equipment that I returned for a true assessment of the hardware. I confident that we had some hardware issues!
• Having a radio station go offline mid-way through the project and issues with Wi-Fi connectivity throughout the duration, was a cause for concern about the long term viability of this communication method.
• It would be nice to have a 4G LTE option. Anything else that you would like to mention for future programs?
• Let’s do more of them. Renewable energy needs a champion and this program has been just that. It has been an honor to work on this program. A true honor.
• Delays in obtaining the test hardware (water heaters) negatively impacted the timing of this project. Making sure that all hardware is readily available before the study launches would make the study run smoother.
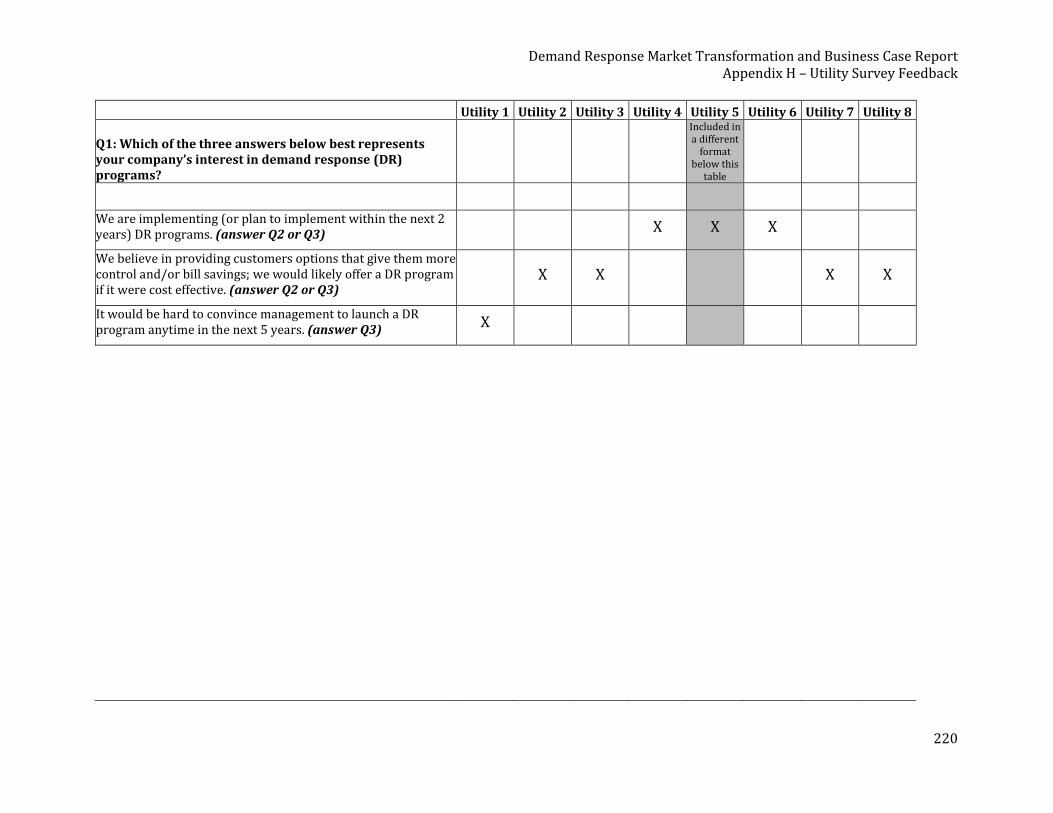
Demand Response Market Transformation and Business Case Report Appendix H – Utility Survey Feedback
220
Utility 1 Utility 2 Utility 3 Utility 4 Utility 5 Utility 6 Utility 7 Utility 8
Q1: Which of the three answers below best represents your company’s interest in demand response (DR) programs?
Included in a different
format below this
table
We are implementing (or plan to implement within the next 2 years) DR programs. (answer Q2 or Q3)
X X X
We believe in providing customers options that give them more control and/or bill savings; we would likely offer a DR program if it were cost effective. (answer Q2 or Q3)
X X X X
It would be hard to convince management to launch a DR program anytime in the next 5 years. (answer Q3)
X
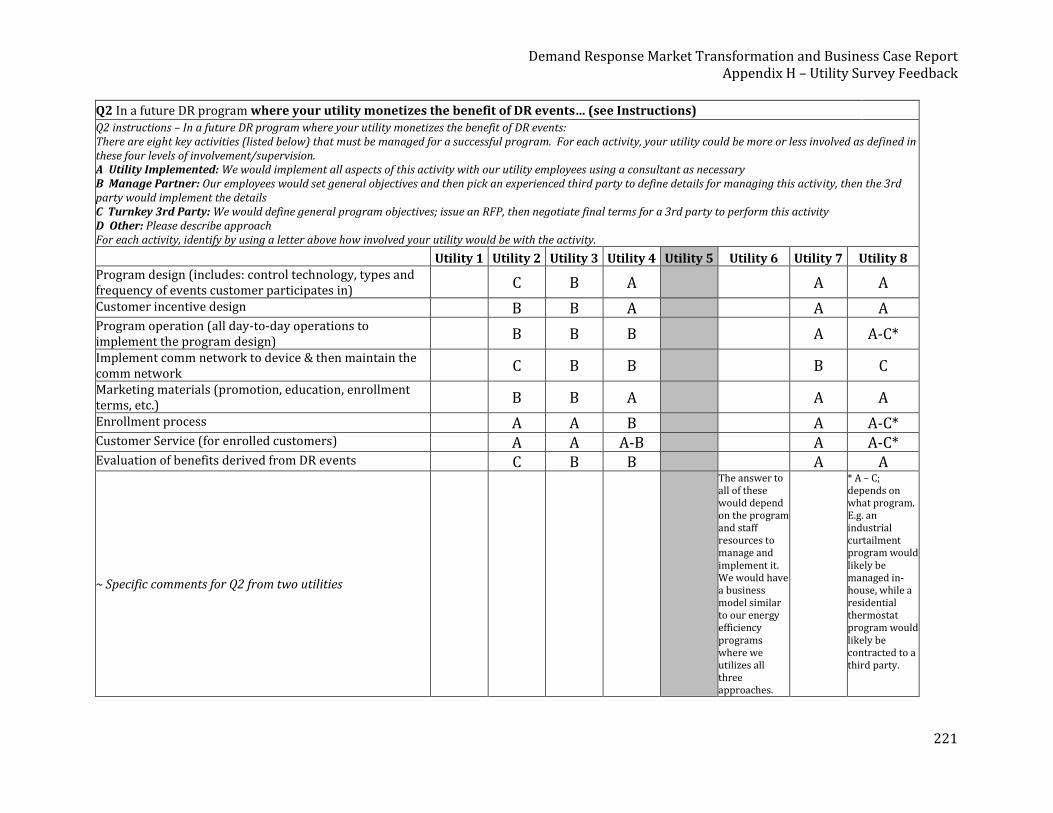
Demand Response Market Transformation and Business Case Report Appendix H – Utility Survey Feedback
221
Q2 In a future DR program where your utility monetizes the benefit of DR events… (see Instructions) Q2 instructions – In a future DR program where your utility monetizes the benefit of DR events: There are eight key activities (listed below) that must be managed for a successful program. For each activity, your utility could be more or less involved as defined in these four levels of involvement/supervision. A Utility Implemented: We would implement all aspects of this activity with our utility employees using a consultant as necessary B Manage Partner: Our employees would set general objectives and then pick an experienced third party to define details for managing this activity, then the 3rd party would implement the details C Turnkey 3rd Party: We would define general program objectives; issue an RFP, then negotiate final terms for a 3rd party to perform this activity D Other: Please describe approach For each activity, identify by using a letter above how involved your utility would be with the activity.
Utility 1 Utility 2 Utility 3 Utility 4 Utility 5 Utility 6 Utility 7 Utility 8 Program design (includes: control technology, types and frequency of events customer participates in)
C B A A A
Customer incentive design B B A A A Program operation (all day-to-day operations to implement the program design)
B B B A A-C*
Implement comm network to device & then maintain the comm network
C B B B C
Marketing materials (promotion, education, enrollment terms, etc.)
B B A A A
Enrollment process A A B A A-C* Customer Service (for enrolled customers) A A A-B A A-C* Evaluation of benefits derived from DR events C B B A A
~ Specific comments for Q2 from two utilities
The answer to all of these would depend on the program and staff resources to manage and implement it. We would have a business model similar to our energy efficiency programs where we utilizes all three approaches.
* A – C; depends on what program. E.g. an industrial curtailment program would likely be managed in-house, while a residential thermostat program would likely be contracted to a third party.
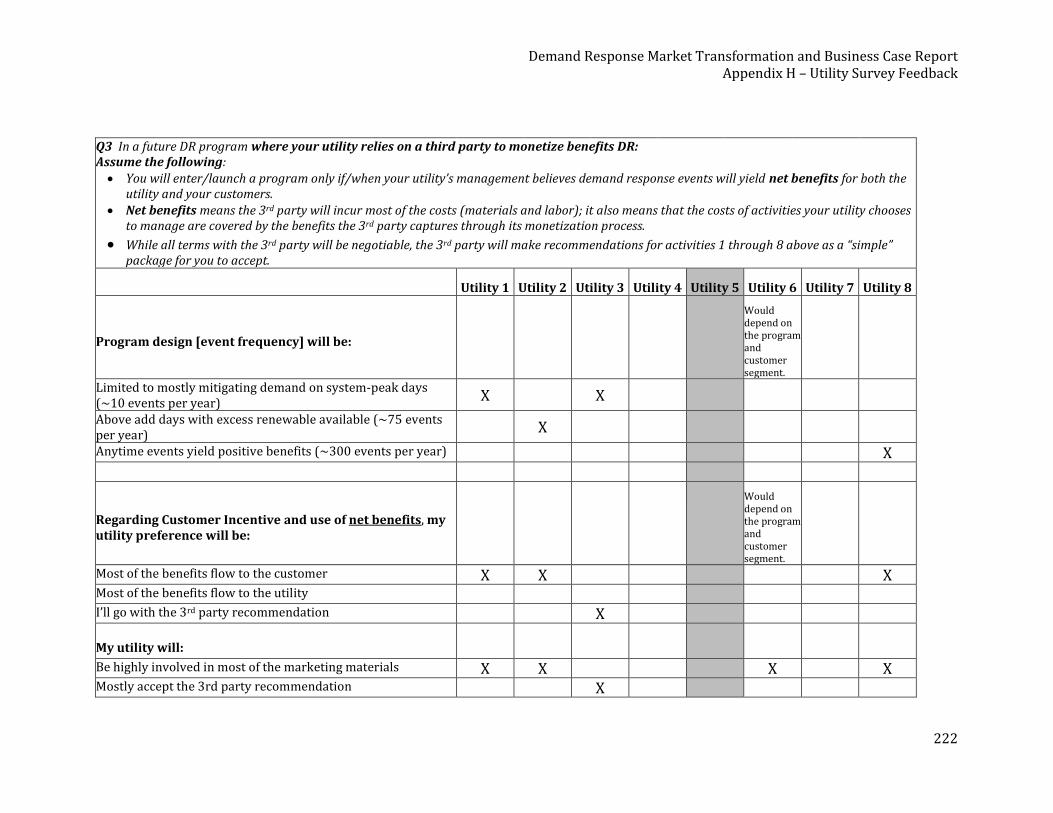
Demand Response Market Transformation and Business Case Report Appendix H – Utility Survey Feedback
222
Q3 In a future DR program where your utility relies on a third party to monetize benefits DR: Assume the following: • You will enter/launch a program only if/when your utility’s management believes demand response events will yield net benefits for both the
utility and your customers. • Net benefits means the 3rd party will incur most of the costs (materials and labor); it also means that the costs of activities your utility chooses
to manage are covered by the benefits the 3rd party captures through its monetization process.
• While all terms with the 3rd party will be negotiable, the 3rd party will make recommendations for activities 1 through 8 above as a “simple” package for you to accept.
Utility 1 Utility 2 Utility 3 Utility 4 Utility 5 Utility 6 Utility 7 Utility 8
Program design [event frequency] will be:
Would depend on the program and customer segment.
Limited to mostly mitigating demand on system-peak days (~10 events per year)
X X
Above add days with excess renewable available (~75 events per year)
X
Anytime events yield positive benefits (~300 events per year) X
Regarding Customer Incentive and use of net benefits, my utility preference will be:
Would depend on the program and customer segment.
Most of the benefits flow to the customer X X X Most of the benefits flow to the utility I’ll go with the 3rd party recommendation X
My utility will: Be highly involved in most of the marketing materials X X X X Mostly accept the 3rd party recommendation X
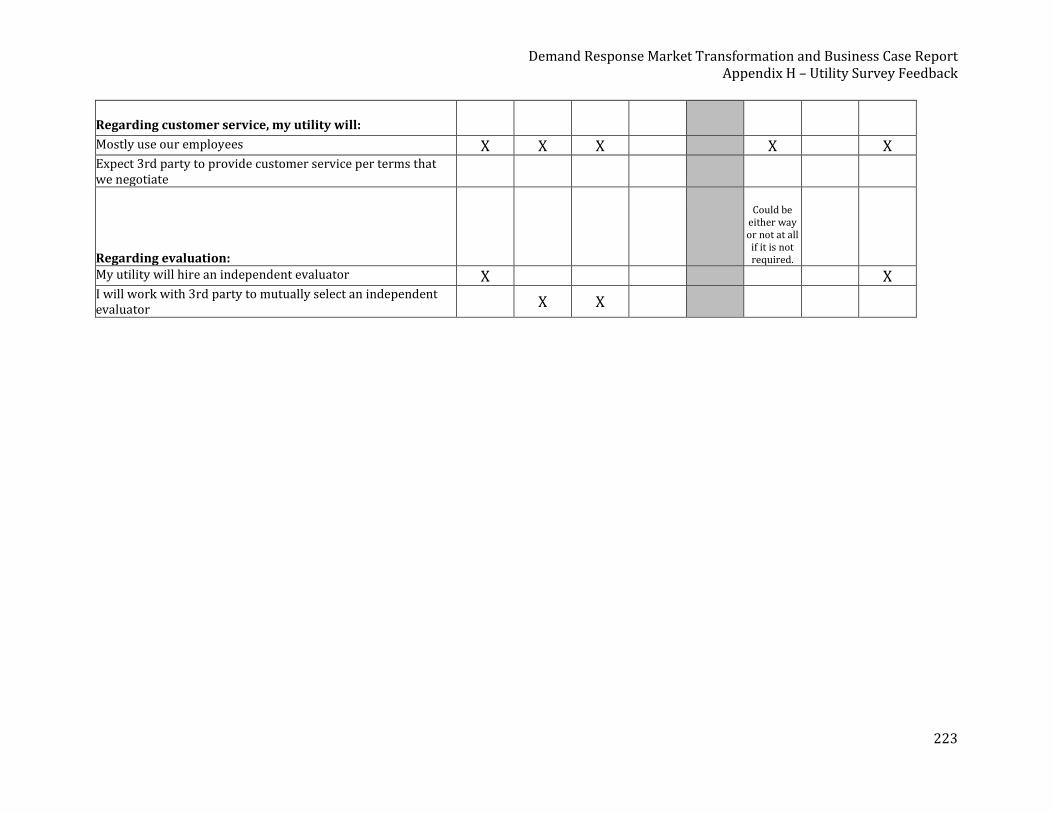
Demand Response Market Transformation and Business Case Report Appendix H – Utility Survey Feedback
223
Regarding customer service, my utility will: Mostly use our employees X X X X X Expect 3rd party to provide customer service per terms that we negotiate
Regarding evaluation:
Could be either way or not at all
if it is not required.
My utility will hire an independent evaluator X X I will work with 3rd party to mutually select an independent evaluator
X X
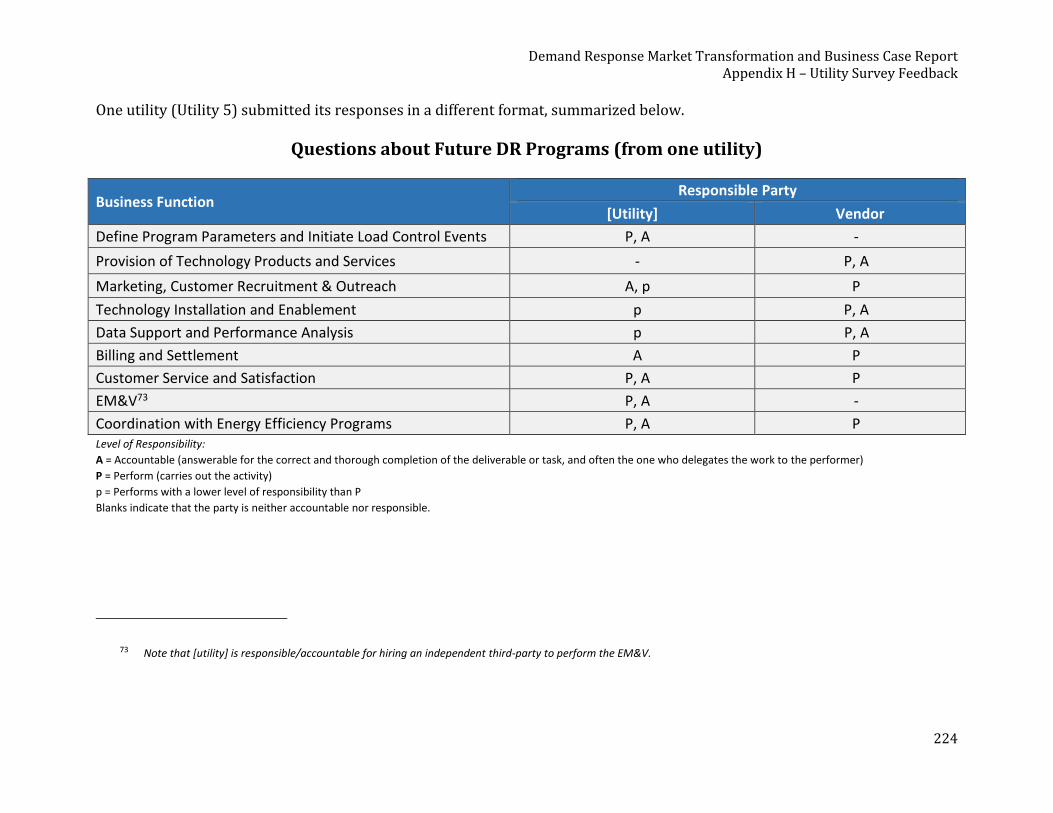
Demand Response Market Transformation and Business Case Report Appendix H – Utility Survey Feedback
224
One utility (Utility 5) submitted its responses in a different format, summarized below.
Questions about Future DR Programs (from one utility)
Business Function Responsible Party
[Utility] Vendor
Define Program Parameters and Initiate Load Control Events P, A -
Provision of Technology Products and Services - P, A
Marketing, Customer Recruitment & Outreach A, p P
Technology Installation and Enablement p P, A
Data Support and Performance Analysis p P, A
Billing and Settlement A P
Customer Service and Satisfaction P, A P
EM&V73 P, A -
Coordination with Energy Efficiency Programs P, A P Level of Responsibility:
A = Accountable (answerable for the correct and thorough completion of the deliverable or task, and often the one who delegates the work to the performer)
P = Perform (carries out the activity)
p = Performs with a lower level of responsibility than P
Blanks indicate that the party is neither accountable nor responsible.
73 Note that [utility] is responsible/accountable for hiring an independent third-party to perform the EM&V.
Demand Response Market Transformation and Business Case Report Appendix I – Market Transformation Plan
225
Appendix I – Market Transformation Plan This appendix is a combination of three separate documents that make up the key elements of a Market Transformation Plan. The three parts are: 1) the market transformation plan, 2) the logic model, and 3) the results of the baseline study that informed some of the market transformation plan. The first section (Section I-1) lays out the theory of market transformation with a vision, barriers, opportunities, interventions, indicators, and market implementation. The second section (Section I-2) is the logic model that graphically shows the process in the interlinking of the different elements. The final section (Section I-3) is a summary of the DR baseline study as well as the complete memo crafted by Cadeo Group and Research into Action in the summer of 2017. Market transformation describes both a policy objective and a program strategy[1] to promote the value and self-sustaining presence of energy-efficient technologies in the marketplace. It is a strategic process of market intervention that aims to alter market behavior by removing identified barriers and leveraging opportunities to further the internalization of cost-effective energy efficiency as a matter of standard practice. Market transformation has rapidly become the objective of many privately and publicly supported energy efficiency programs in the United States and other countries. For this report and appendix, we substitute the term demand response (DR) for energy efficiency. The process is very much the same; the stark difference is in where the value exchange occurs under current DR practices. In energy efficiency, the key beneficiary is the end customer; the supply chain leverages this feature to promote the solution, and the utility pays (incents) the customer to have the energy-saving solution installed. With DR, the key beneficiary is the utility and the system operator. The end state of this market transformation is: All electric water heaters (electric and heat pump) 40 gallons and greater shipped to the Pacific Northwest have an open-source communication interface (CTA-2045); the interface is a socket much like a USB port, but designed to accommodate demand response functionality. The plan includes both traditional electric resistance (ER) and heat pump (HPWH) water heaters. All three major water heater manufacturers (AO Smith, Bradford White, Rheem) agree to an open-source (CTA-2045 communication port and supporting technologies) standard with a minimum set of DR functionality enabled in the water heater. All utilities support and promote an open-source, standard demand response (DR) protocol; if not the ANSI/CTA-2045 application layer, then another open-source protocol that supports the same minimum functionality. To enable widespread adoption, there will be regionally-qualified, third-party DR operators that can provide turnkey services to make adoption easy for regional utilities. Stakeholders will coordinate to maximize the value of messages that promote the benefits of connected flexible load communications. ENERGY STAR and the DOE recognize and promote ANSI/CTA-2045 communication ports on key products, specifically water heaters. In five to 10 years, code officials will require communication ports on all electric water heaters 40 gallons and greater.
Demand Response Market Transformation and Business Case Report Appendix I – Market Transformation Plan
226
I-1. The Market Transformation Plan – How We Plan to Do It Over-Arching Problem Statement As pointed out in the Smart Grid Interoperability Panel’s white paper entitled “Barriers to Responsive Appliances at Scale” [SGIP 2014], the grid-responsive water heater presents a traditional “chicken-and-egg” challenge. Demand response for water heaters touches all aspects of the water heating market from customers, the supply chain, OEMs, utilities, and aggregators to regulators (See for definitions of these entities). As noted earlier, aggregated at the regional level, grid-responsive water heaters represent a capacity value of 301 MW based on our base case assumptions. If grid-interactive controls are included at the time of manufacture and are simple to enable with minimal customer interaction, then the cost per kW of this flexible resource could be quite low, potentially within the realm of becoming an embedded cost for the standard product offering. On the other hand, there is currently no compelling business case for manufacturers to include this capability in their standard product. Without the cost reduction from full-scale manufacturing, the per-unit costs for retrofitting controls exceeds the calculable benefits to Northwest regional utilities. This brings us to the key problem statement: “How can utilities influence manufacturers of water heating equipment to integrate grid-interactive controls as a standard component of manufacture that enables cost reductions from mass production that will produce sufficient demand response benefits that exceed the costs of production and customer engagement?” Market Opportunities A number of opportunities within the current water heater markets would facilitate or drive inclusion of grid-responsive features as standard features.
1. Codes and standards. Far and away the highest leverage tools for transforming the market for water heaters are building codes and manufacturing standards. These tools are on regular cycles for revision and therefore create periodic opportunities for engagement and change. Current federal manufacturing standards cover minimum efficiency requirements for water heaters and are preemptive of state-level efficiency standards. State-level standards for other features such as demand response controls are still possible, as are building code requirements where efficiency is not a requirement.
2. Digital controls in premium products. Manufacturers looking for differentiation are increasingly adding digital controls and associated components in their premium models. Historically, this has provided the funding platform to pay for product development of advanced technology and the identification of cost-reduction opportunities that would allow for inclusion in a broader range of products. This is especially true for digital controls where there are known cost reductions at specific levels of production volumes. This creates visibility for manufacturers to see a path
Demand Response Market Transformation and Business Case Report Appendix I – Market Transformation Plan
227
to a relatively low-cost implementation of the grid-enabled controls as a standard product component.
3. Increasing consumer interest in “smart” appliances. There has been significant
proliferation of “smart” enabled equipment and the various “hubs” that engage them. Nest’s “learning” thermostat is an example of a smart device that is also serving as a hub for control of other devices. Alexa and Google Home are other devices that are looking to add functionality and control of many other home appliances, including water heaters. These platforms offer an attractive entry point for a “smart” water heater that can automatically engage with the grid to minimize costs and environmental impacts without sacrificing comfort or convenience.
4. Insurance requirements/rewards for leak detection and notification. While not
directly an energy issue, insurance requirements/rewards for leak detection and notification provide additional benefits for some of the components of grid enablement – most notably the communication capability and intelligent controls that could also be used for grid interaction.
Market Barriers Despite these opportunities, there remain some very significant barriers to large-scale market adoption. These include: 1. Lack of grid-to-manufacturer value exchange model. Currently, no business model has emerged that would allow for the direct transfer of grid benefits to appliance manufacturers to fund the costs of manufacturing connected devices at scale, or to incent the customer to be willing to pay the incremental cost for the feature. 2. Lack of end-customer value proposition. The majority of Northwest consumers do not have the option to participate in a demand response program that would provide the rationale for purchasing a “grid-enabled” water heater. Nationally, the situation is not much better. While there are large areas with organized wholesale electric capacity markets (California, the Midwest, the Mid-Atlantic, and New England), the ability for an end consumer to “opt-in” and receive economic benefit is dependent on a third-party aggregator that is “bidding into” the capacity market for a limited period usually much shorter (1-3 years) than the lifetime of the water heater. 3. Variability of demand-side capacity value to the Northwest grid. In any given year, the Northwest hydroelectric system provides a very large capacity resource that has the potential to meet almost all the peak demand of the bulk power system. However, constraints on water flows to support fish and wildlife, flood control, and marine transportation along with hydrological availability from snow and rainfall across the region create high levels of uncertainty in the actual capacity available in any given year. This uncertainty makes it difficult to quantify the actual value of a grid-enabled water heater. At the distribution system level, there can be significant benefits for components that are approaching maximum capacity; however, these tend to be very
Demand Response Market Transformation and Business Case Report Appendix I – Market Transformation Plan
228
localized and difficult to translate to a market that manufactures water heaters on a national scale. This variability in capacity value has largely inhibited traditional water heating demand response programs in the Northwest. 4. Competing communication standards. As noted in Section 1.2 of this report, USB is the only communication standard that competes with CTA-2045 in terms of functionality. A socket-based communication interface accommodates all standards commonly discussed with regard to command languages or wireless/wired interfaces. 5. Consumers do not think about water heaters until time of replacement. Unlike other appliances or equipment, consumers generally do not interact with or even think about their water heater until it fails or is otherwise affecting water heating performance. Further, because water heaters generally last for 15 years before replacement, generalized marketing and awareness to consumers will be largely meaningless to all but a small segment of the population faced with a replacement decision. 6. Consumer concerns about privacy, security, and performance. Privacy, security, and performance are standard concerns for any consumer facing a demand response program. However, water heaters provide some additional challenges since they are largely invisible to the end-consumer. A lack of hot water availability resulting from a grid event creates the potential for additional anxiety compared to grid management of a thermostat where there is a high degree of pre-existing engagement with the customer. 7. Grid Security from foreign hackers. When demand response and distributed energy resources scale over time, most stakeholders rightfully raise issues about protecting distributed assets from cyber-attacks. The CTA-2045 socket approach is the robust solution to security since if the communication module that gets “plugged in” cannot be upgraded over its communication link outside the home to address attack vectors, then the UCM can simply be replaced with one that does. By comparison, embedding Wi-Fi in an appliance increases the exposure because the firmware inside the appliance may be difficult to upgrade.
The Need for Intervention Given the significance of the barriers described above, market opportunities alone are unlikely to drive the water heating market to add “grid-enabled controls” to products without external intervention. Solving “grid efficiency” appears to be outside the motivation of any single market actor (customer, manufacturer, utility, regulator, or federal agency). In contrast to energy efficiency, the customer, at the time of product purchase, derives no inherent benefit from a demand response-enabled product. Manufacturers have little interest in adding features and subsequent costs to products for which the customer will not pay.
Demand Response Market Transformation and Business Case Report Appendix I – Market Transformation Plan
229
While a purely market-based solution may be preferable, a number of different market mechanisms have been tried since the passage of the Energy Independence and Security Act in 2007; however, no such solution has yet proven effective. Direct intervention that provides financial incentives to consumers, utilities, and/or appliance manufacturers will likely be necessary in order to overcome the large barriers described above until the opportunities identified can become enough of a driving force that subsidies are no longer necessary. In addition to subsidies, garnering industry and regulatory consensus around common grid-response command structures and communications protocols will be needed to reduce implementation costs. However, although many such protocols exist, manufacturers will pick a lower-cost proprietary method only in the absence of a single protocol desired by all stakeholders. Regulators don’t like to select one protocol among many, utilities are usually reluctant to speak with one voice, and customers are not asking manufacturers for anything. Lastly, consumers’ perceived costs, which include loss of convenience and flexibility in addition to economic costs, must be minimized. Responsive appliances should:
• Require very little or no consumer interaction once installed. • Inform consumers, while preserving privacy. • Enable consumer override capability at any time. • Provide ease of implementation and consistency in operation and coverage.
This effort will need to touch on motivations and drivers other than simple return on investment. Solving this problem is a long-term play for utilities, consumers, manufacturers, and the supply chain actors. Benefits will not be seen right away; however, if utility planners are looking for a cost-effective solution at scale in 10 to 20 years, then water heaters will be very cost-effective as thermal batteries and a peak load resource. Vision of End State of Transformed Electric Water Heater Market In order to develop an effective market transformation plan, we need to first establish a clear vision of the endpoint of the proposed interventions. Program Vision All electric water heaters 40 gallons and over shipped to the Pacific Northwest have an open-source communication interface (CTA-2045); the interface is a socket much like a USB port, but designed to accommodate demand response functionality. The plan includes both traditional electric resistance (ER) and heat pump (HPWH) water heaters. All three major water heater manufacturers (AO Smith, Bradford White, Rheem) agree to an open-source (CTA-2045 communication port and supporting technologies) standard with a minimum set of DR functionality enabled in the water heater. All utilities support and promote an open-source, standard demand response (DR) protocol; if not the ANSI/CTA-2045 application layer, then another open-source protocol that supports the
Demand Response Market Transformation and Business Case Report Appendix I – Market Transformation Plan
230
same minimum functionality. To enable widespread adoption, there will be regionally-qualified, third-party DR operators that can provide turnkey services to make adoption easy for regional utilities. Stakeholders will coordinate to maximize the value of messages that promote the benefits of connected flexible load communications. ENERGY STAR and the DOE recognize and promote ANSI/CTA-2045 communication ports on key products, specifically water heaters. In five to 10 years, code officials will require communication ports on all electric water heaters of 40 gallons and greater. Scope of this Market Transformation Plan The Northwest Energy Efficiency Alliance (NEEA) proposes that the scope of this market transformation plan be defined as leveraging the capabilities of the customer’s electric water heating controlled via a CTA-2045 communication interface, managed by either utilities or aggregators (acting as agents for the utility, or independently) to meet capacity needs of the Northwest Power & Conservation Council’s (NPCC’s) Seventh Power Plan [NPCC 2016] (and subsequent Power Plans) and in advanced applications to use the thermal storage attributes of tanks to improve the integration of renewables to create overall grid efficiencies, while still delivering a positive customer water heater experience (cost and performance). Development of the Market Transformation Plan NEEA, in collaboration with BPA and utility stakeholders, developed the plan in this report through its established analysis method. NEEA is a nonprofit organization working to accelerate energy efficiency in the Pacific Northwest through the acceleration and adoption of energy-efficient products, services, and practices through a process called market transformation. NEEA is supported by and works in partnership with more than 140 Northwest utilities. The term market transformation is the strategic process of intervening in a market to create lasting change in market behavior by removing identified barriers or exploiting opportunities to accelerate the adoption of all cost solutions as a matter of standard practice. The process of market transformation identifies barriers, challenges, opportunities, interventions, outcomes, and impacts that end in a transformed market. In summary, this analysis examines the market challenges and barriers in view of the program vision stated above. It also examines market assets and general opportunities that support the transformation effort. This analysis leads to a systematic plan of activities and metrics to reach the defined vision (detailed later in this appendix). The results of this analysis suggest multiple strategies, and we detail the most likely approach in the body of this report. Logic Model The following image provides a graphical view of the barriers, opportunities, interventions and outcomes to show how they relate. This logic model is a living document and needs to be updated as the Market Transformation plan is rolled out.
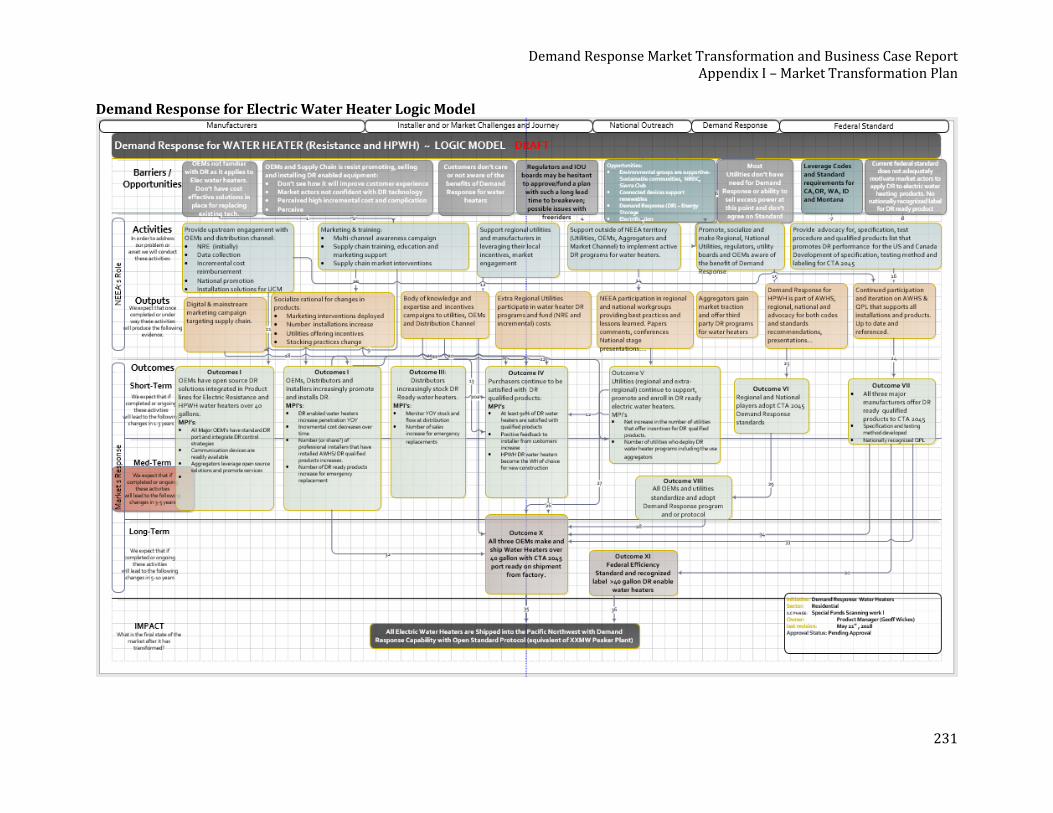
Demand Response Market Transformation and Business Case Report Appendix I – Market Transformation Plan
231
Demand Response for Electric Water Heater Logic Model
Demand Response Market Transformation and Business Case Report Appendix I – Market Transformation Plan
232
Market Transformation Strategies There are three primary strategies to overcome barriers and leverage the opportunities described above. The key elements for the first two are to work closely with the three OEMs to overcome the non-recurring engineering (NRE) costs (Strategy #1), offset the incremental costs (Strategy #2), and finally, to work with code officials to change the code to encourage a path to compliance via Strategy #3). Strategy #1: Non-Recurring Manufacturing Costs NEEA has had positive initial conversations with all three of the major water heater manufacturers (US market shares are: AO Smith [44%], Rheem [34%], and Bradford White [15%]). In addition, GE has continued to work with the test team to improve the adapter code as the field tests were rolled out. NEEA has identified this as a two-step process that will require a great deal of coordination with all the regional and national consortia of utilities to fund and implement this phase. Listed below are the steps and the estimated costs for the NRE and the incremental costs. The business model reflects this approach and costs. There are two elements to the cost for the manufacturers: first, the non-recurring engineering costs (NRE) (engineering and testing of new design) and second, the incremental costs (costs for added parts, features, or benefits). We use calendar years (for out years) to designate completion dates for specific activities and milestones in the implementation plan and the model. No definitive schedule has yet been set. Manufacturer Technology Assistance Phase 1 This phase would involve funding of the non-recurring engineering (NRE) for all three of the major OEMs (AO Smith, Rheem, and Bradford White). Grants would be negotiated independently with each of the three manufacturers, with the general principle that the grants would be higher for the first mover to delivery of embedded CTA-2045 into products, such that the only element needed to communicate with the “smart” electric water heater would be a plug-in communication module. The current estimated total amount for the NRE would be $950K spread among the three major OEMs, with the larger portion going to the first mover(s). The elements for inclusion in this phase are:
1) CTA-2045 plug native on tank (physical layer) on all electric and HPWH water tanks 40 gallons and larger.
2) Inclusion of communication protocol per CTA-2045 3) Inclusion of the full set of standard CTA-2045 commands as of the time of
agreements 4) Temperature regulation and reporting accuracy to be +/- 2 degrees F and 1 degree C 5) Response time to enable CTA-2045 commands within five seconds 6) Ability to have 1,000 or more DR events per year for the life of the product

Demand Response Market Transformation and Business Case Report Appendix I – Market Transformation Plan
233
This phase could start as early as the end of Q4 2018 and run through Q4 2019, depending on when the utility coalition is formed and funded. Products would start to show up in market test areas as early as 2019 or one year after the formation of the coalition and be at full capacity by 2022 or two years after the start of the funding process. The first and second OEMs would come to market with an interim adapter solution by offering universal communication modules (UCMs) that could be plugged in. Sufficient inventory of UCMs would need to be procured so that the CTA-2045 water heaters wouldn’t become stranded assets in the future. Adapter phase – This adapter would convert the existing proprietary OEM plug into a universal standard CTA-2045 plug in both AC and DC form factors. The adapter also creates a platform to test the “smart” algorithm without the need to recertify the UL listing with each change. The estimated cost per adapter would be $60, based on 2018 pricing at sufficient volume. Strategy #2: Offsetting the per-Unit Incremental Cost The incremental costs per tank for early phase non-recurring engineering to move from proprietary to native CTA-2045 would be approximately $20 per tank for electric resistance and $2 for HPWH. The universal communication module (UCM) is the element that allows the utility to select the preferred communication module (FM, cellular, Wi-Fi or others); it plugs into a standard CTA-2045 port. This would be a one-time fee per tank. Prices are based on hundreds to thousands of units. Cost per tank: initially $100 to $75 dropping to $25 over 10 years as volume increases. The final end state of Strategies #1 and #2 would be to have the CTA-2045 plug native per tank: During this phase, the OEM would have CTA-2045 native on the tank, thus not requiring an adapter, which allows the UCM to be plugged directly into the water heater by the customer. Early numbers estimate this would cost between $2 and $30 per tank; the incremental cost depends on total volume of an OEM’s product portfolio on a national basis. Recurring costs for communication to each water heater have different pricing models. The table below outlines the pricing models depending upon what best suits the utility.
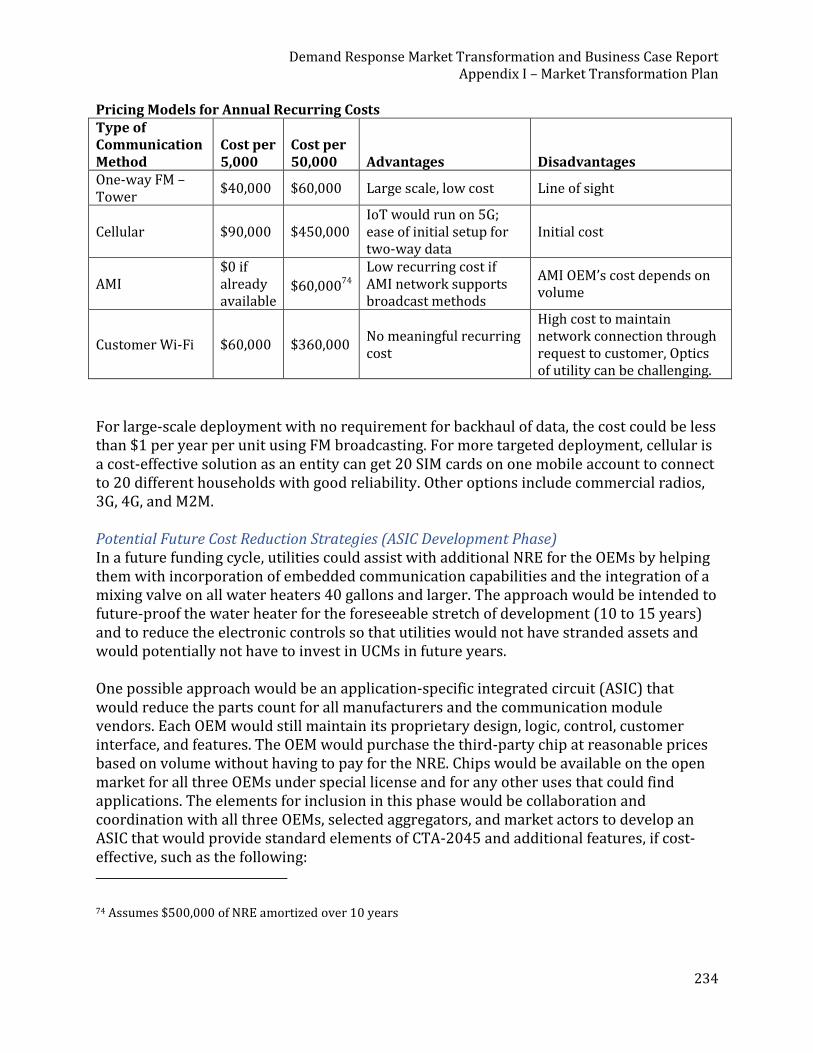
Demand Response Market Transformation and Business Case Report Appendix I – Market Transformation Plan
234
Pricing Models for Annual Recurring Costs Type of Communication Method
Cost per 5,000
Cost per 50,000 Advantages Disadvantages
One-way FM – Tower
$40,000 $60,000 Large scale, low cost Line of sight
Cellular $90,000 $450,000 IoT would run on 5G; ease of initial setup for two-way data
Initial cost
AMI $0 if already available
$60,00074
Low recurring cost if AMI network supports broadcast methods
AMI OEM’s cost depends on volume
Customer Wi-Fi $60,000 $360,000 No meaningful recurring cost
High cost to maintain network connection through request to customer, Optics of utility can be challenging.
For large-scale deployment with no requirement for backhaul of data, the cost could be less than $1 per year per unit using FM broadcasting. For more targeted deployment, cellular is a cost-effective solution as an entity can get 20 SIM cards on one mobile account to connect to 20 different households with good reliability. Other options include commercial radios, 3G, 4G, and M2M. Potential Future Cost Reduction Strategies (ASIC Development Phase) In a future funding cycle, utilities could assist with additional NRE for the OEMs by helping them with incorporation of embedded communication capabilities and the integration of a mixing valve on all water heaters 40 gallons and larger. The approach would be intended to future-proof the water heater for the foreseeable stretch of development (10 to 15 years) and to reduce the electronic controls so that utilities would not have stranded assets and would potentially not have to invest in UCMs in future years. One possible approach would be an application-specific integrated circuit (ASIC) that would reduce the parts count for all manufacturers and the communication module vendors. Each OEM would still maintain its proprietary design, logic, control, customer interface, and features. The OEM would purchase the third-party chip at reasonable prices based on volume without having to pay for the NRE. Chips would be available on the open market for all three OEMs under special license and for any other uses that could find applications. The elements for inclusion in this phase would be collaboration and coordination with all three OEMs, selected aggregators, and market actors to develop an ASIC that would provide standard elements of CTA-2045 and additional features, if cost-effective, such as the following: 74 Assumes $500,000 of NRE amortized over 10 years
Demand Response Market Transformation and Business Case Report Appendix I – Market Transformation Plan
235
• Proprietary command storage location (electrically erasable programmable read-
only memory (EEPROM)) for each OEM’s specific code. • FM subcarrier receiver. • Interface for mobile chip. • 4G or better cellular transceiver. • GPS locating logic and technology. • Wi-Fi. • Bluetooth. • Zigbee. • HomePlug. • Z-Wave. • At least eight analog-to-digital converter (ADC) channels. • Temperature regulation and reporting accuracy of +/- 2 degrees F and 1 degree C. • Response time to enable CTA-2045 commands within five seconds. • Ability to have 500 DR events per year.
This phase would start at least five years after the initial OEM non-recurring engineering (NRE) phase and would complete after 36 months. OEMs would start integrating the technology into product lines as they roll out and improve product platforms. Cost savings to OEMs should be significant so that uptake would be as rapid as economically feasible. The addition of the mixing valve would increase the capabilities and capacity of both ER and HPWHs. Strategy #3: Integration in Codes and Standards The code cycle for each state is different. Washington would be the first to move, followed by Oregon; states that use the International Energy Conservation Code (IECC), Montana and Idaho, would phase in later. In the ideal world, communication protocols would be added earlier rather than later. The model uses 2028 as the year that code is expected to be in place for Washington and Oregon, and a couple years later for the remaining states. Code changes often occur after voluntary standards are adopted such as the Advanced Water Heating Specification (AWHS), which calls out specific requirements (See Appendix C – CTA-2045 Commands and Related Specifications) and/or programs that are implemented across the US, often driven by the CEE specification and program description (See Appendix C – CTA-2045 Commands and Related Specifications) that specifically call out the inclusion of CTA-2045 as a requirement of different tier levels. Implementation Approaches NEEA has identified potential funding mechanisms to the implementation of DR on all electric water heaters (ER and HP). The rest of this section details the option on which we will focus; while the steps involved are potentially transferable to other options, they will generally be out of the region’s control.
Demand Response Market Transformation and Business Case Report Appendix I – Market Transformation Plan
236
A consortium of utilities (regional and/or national) would work with OEMs to reduce the NRE and the incremental costs to implement their product lines to all move to CTA-2045. This could be regional and or national in scale and is the most logical and probable option (Section 4.5.1 of this report). The Pacific Northwest would lead the coalition of early-adopter utilities. This group’s activities are described in more detail in Section 6.2 of this report. Basically, it would provide the seed funding that would lead to a unified voice of the utilities both in the PNW and outside the region to fund the strategies listed above (NRE, incremental costs, and continued improvements). This coalition would create a method to pool resources, create agreements with OEMs, and make commitments on which markets would move first. Aggregator or Market Actor Funds All the NRE and the Incremental Costs to Bring CTA-2045 to the Market for One or More of the Key OEMs. NEEA has recently heard there might be market actors with the vision and deep pockets to fund all the NRE listed in Section 4.5.1 as well as the incremental cost to have CTA-2045 installed on all electric water heaters (ER and HPWH) of 40 gallons and greater. While this could be considered a great intervention, it does introduce other variables and reduces control of the market transition to a DR-enabled flexible load. While there are numerous risks with this approach, it could lead to significant cost reductions and even some risk reductions for the utilities. Non-Utility Market Actor Invests in One or More Water Heater Manufacturers and Funds All the NRE and the Incremental Costs. NEEA has also heard of a couple of large non-utility or philanthropic organizations that have an interest in making significant impacts in energy efficiency and assisting the grid to shift to more renewables by leveraging the water heater market and thus reducing CO2 emissions. One organization estimated that with a $5-$20 million targeted investment, it could shift the market here on the West Coast. Here again, while this could be an ideal solution, the devil is in the details and many of these organizations may not have the expertise in-house to properly execute; this could create challenges for the utilities individually or collectively. This option then introduces challenges on control and ownership of the resources and who would capture the carbon value of DR. Proposed Market Engagement (Utilities, Customers, and Manufacturers) Cohort Group Implementation / CTA-2045 Roll-out Penetration of CTA-2045-equipped tanks would be a three-phase approach with an offset by 12 months for each OEM starting in 2020. For reference purposes, we use calendar years (for out years) to designate when specific activities and milestones would be completed in the implementation plan and the model. That said, if the planning process or coalition building takes a little longer, the project would just start out a year or two after the completion of the report. The overarching efforts are to:
Demand Response Market Transformation and Business Case Report Appendix I – Market Transformation Plan
237
• Educate and learn what utilities need to launch a DR program with their customers • Work with the OEM and its supply chain to determine how it can phase in its
product line to have CTA-2045 native on popular and less-popular products • Work with utilities, the Bonneville Power Administration (BPA), and others to
create a value proposition to create programs for aggregators to engage with Northwest utilities
• Gain understanding of how the public would embrace a demand response for water heaters program across markets (retrofit, new construction, emergency replacement, and proactive replacement)
NEEA would engage with the three OEMs to determine the best way to roll out the CTA-2045 strategy. If OEMs want a moderate ramp, then NEEA would propose a three-phase market implementation; this is the base case detailed below and used in the economic model. If the OEMs would rather go for a full Pacific Northwest approach, NEEA would aggregate all the utilities and gain commitment for funding and commitments to fund the incremental costs for all electric water heaters 40 gallons and larger shipping into the four-state region. If the approach is a phased market test, then NEEA would convene all utilities involved in the target markets and provide an economic structure, aggregation, and management of all funds to implement the program (incremental costs, outreach and communication, awareness campaigns, coordination with regional and extra-regional utilities, aggregators, and suppliers). Working with the three-phase market test would enable the market transformation team to deploy agile development strategies (continuously learning and correcting). Additionally, each utility test group would have different markets and approaches, so the intervention would need to be tailored to different utilities and different markets. The market test would also allow the utility to gain deep knowledge and experience to better understand the capabilities of and challenges with demand response in the residential market. Participating utilities would oversee direct communication with customers regarding participation in their respective demand response programs. NEEA would develop three typical outreach or business model campaigns for utilities to choose from that could be further customized. Assumptions:
• Existing distribution channel would maintain brand loyalty. • Existing water heater sales channels would provide technical and channel product
training. • Additional testing and validation would be required before going fully native. • OEMs would determine which products would have adapters for CTA-2045 and
which would be native during the specific phases of the roll-out.
Demand Response Market Transformation and Business Case Report Appendix I – Market Transformation Plan
238
• In the first two years of the implementation phase for each cohort, using tanks that require CTA-2045 adapters, the market transformation team will, if needed, implement control commands under the utilities’ direction.
• The market transformation team would offer a universal communication module (UCM) platform as an option until utilities have the sophistication to make the appropriate technology decisions.
• For the first five years, utilities would focus on peak demand events and learning about energy shifting and regional critical-need events.
NEEA would provide tracking and reporting of sales and administer the incremental cost incentives directly to the OEMs and channel partners. Cohort One Campaign (begins 2020) This cohort would cover the PGE and Clark County PUD territory75 (Portland/Vancouver market) (~3,800 units years 1 & 2). The purpose of this phase is to educate utilities on how to engage with third-party aggregators to deliver CTA-2045 demand response capability. This cohort is selected because it has one contiguous marketplace, one demand response-experienced utility (PGE), and a utility (Clark Public Utilities) that is new to demand response in residential water heaters. Steps involved are as follows:
1) Work with the first OEM to stock the market with CTA-2045-ready products. Start with 50-gallon electric resistance and HPWHs; then bring in all smaller tanks of 40 gallons or more opportunistically over a two-year period. This first phase of Cohort One would use adapters for the first two years and then migrate to an onboard CTA-2045 port in Year 3 as stock allows and as the OEM rolls out technology.
2) Provide upstream incremental costs to offset additional costs so that distributors and installers are not adversely impacted.
3) Partner with key distribution houses (e.g., Ferguson) and retailers (e.g., Lowe’s) to maintain price parity with other market actors.
4) Implement incentives in the adapter phase to get customer names and engagement. 5) Educate high-volume plumbers about the change and teach them how to embrace
the value of the enhanced feature set product. 6) Start the public awareness campaign in Year 3 (see Section 4.8 of this report). Work
with existing market channels to promote brand loyalty and awareness of demand response available water heaters.
7) Once second and third manufacturers come online, repeat the above steps. 8) Evaluate performance and lessons learned (technical aspects and market effect).
75 Consider all utilities named in this appendix as proxies for the utilities yet to be determined. We use named utilities only so we can estimate the ramp-up period quantity and costs.
Demand Response Market Transformation and Business Case Report Appendix I – Market Transformation Plan
239
Cohort One would start Q1 2020 and run through 2025. The active and investigative portion of the test would be in 2020 and 2021. Beginning in 2022, OEM #1 would ship only CTA-2045-equipped tanks to the entire metro Portland market: 11,400 tanks in 2022 to 17,000 tanks by 2024. Utilities would explore enrollment strategies and provide insights and feedback. Cohort Two Campaign (begins 2021) This cohort would cover the Puget Sound area – Snohomish County PUD, Seattle City Light, Puget Sound Energy, and Tacoma Power (4,100 units years 1 & 2). This phase is a bigger market with a mixture of utilities experienced and non-experienced in demand response. Education and familiarization with DR aggregators is key:
1) Work with first and the second OEMs to fill distribution channels in the market with CTA-2045 products for major product categories first (50-gallon electric resistance and HPWH) Then bring in all smaller electric tanks of 40 gallons and more opportunistically. The first two years of the market test would use adapters if the second OEM hadn’t started to install CTA-2045 as native. Ensure a sufficient number of adapters for late adopters of the CTA-2045 first-generation tanks for future demand response programs.
2) Provide upstream incremental costs offset so that distributors and installers are not adversely impacted.
3) Partner with key distribution houses and retailers to maintain price parity. 4) Educate high-volume plumbers about the change and teach them how to promote
the enhanced feature set product. 5) Expand the general awareness campaign into the Puget Sound market in Year 3 of
Cohort One (see Section 4.8 of this report). Work with existing market channels to promote brand loyalty and awareness.
6) Once second and third manufacturers come online, repeat the above steps. 7) Evaluate performance and lessons learned (technical aspects and market effect).
Cohort Two would start at the end of Q4 2020 and would run through 2024. The active and investigative portion of the test would be in 2021 and 2022. Beginning in 2023 both OEMs #1 and #2 are shipping tanks equipped with CTA-2045 to the Seattle metro area: about 28,000 tanks growing to 45,000 by 2024. OEM #2 is also shipping nearly 14,000 tanks in the Portland metro area. Cohort Three Campaign (begins 2022) The third cohort campaign would begin with one or more utilities, yet to be identified, but outside the Portland and Seattle metro areas. We expect the third OEM to enter this market with 5,800 tanks that require an adapter in 2022 and 2023. After two years, with the third OEM qualified 17,200 native CTA-2045 tanks would arrive in 2024 throughout Oregon and Washington, together with about 69,000 tanks from OEMs #1 & 2. At the end of 2024, all the major water heater manufacturers would be shipping CTA-2045 product throughout Oregon and Washington, and the market transformation “ramp-up” period is complete.
Demand Response Market Transformation and Business Case Report Appendix I – Market Transformation Plan
240
1) Work with all three manufacturers to flood the market with CTA-2045 products for
major movers first (50-gallon electric resistance and HPWH) then move to greater than 50 gallons up to 80 gallons. Next, bring in all smaller tanks of 40 gallons or more opportunistically.
2) Provide upstream incremental costs offset so that distribution and installers are not adversely impacted.
3) Partner with key distribution houses and retailers to maintain price parity. 4) Educate high-volume plumbers about the change and teach them how to promote
the enhanced feature set product. 5) Start the general awareness campaign (see Section 4.8 of this report) in Year 3 of
Cohort One. Work with existing market channels to promote brand loyalty and awareness.
6) Once the second and third manufacturers come online, repeat the above steps. 7) Evaluate performance and lessons learned (technical aspects and market effect).
Cohort Three would start the end of Q4 2021 and run through 2024. The active and investigative portion of the test would be 2022 and 2023.
Awareness and Outreach Plan with Customers Demand response is a new concept to most customers in the Pacific Northwest, and using loads to accommodate excess wind and solar generation is a new concept to nearly every US citizen. To aid in customer adoption, the Pacific Northwest region would fund an awareness campaign across the region as a cost-efficient effort to complement specific utility marketing efforts. Creating a regional brand name that customers would recognize should be considered (such as was done very successfully with Super Good Cents for new home efficiency in the 1980s and 1990s). NEEA has developed and deployed awareness and outreach plans for many of the market transformation interventions in the past. Water heater demand response programs would have some similarities and some differences for these markets. The main difference would be the awareness and education of utilities of DR as an option (this is not currently in NEEA’s charter and would require authorization) for power management. Awareness campaigns require clear understanding of market actors, phase of adoption, and key leverage points. The marketing function at NEEA accelerates market transformation by providing a clear understanding of the upstream, midstream, and downstream as well utility target audiences and the best ways to influence them. Marketing directly addresses key market barriers prevalent across the portfolio including lack of awareness, differentiation of energy-efficient and demand response products, understanding of product benefits, and supply chain support and investment. NEEA’s marketing strategies and activities are created and executed in close collaboration with Northwest utilities, extra-regional efficiency organizations, and national partners. To
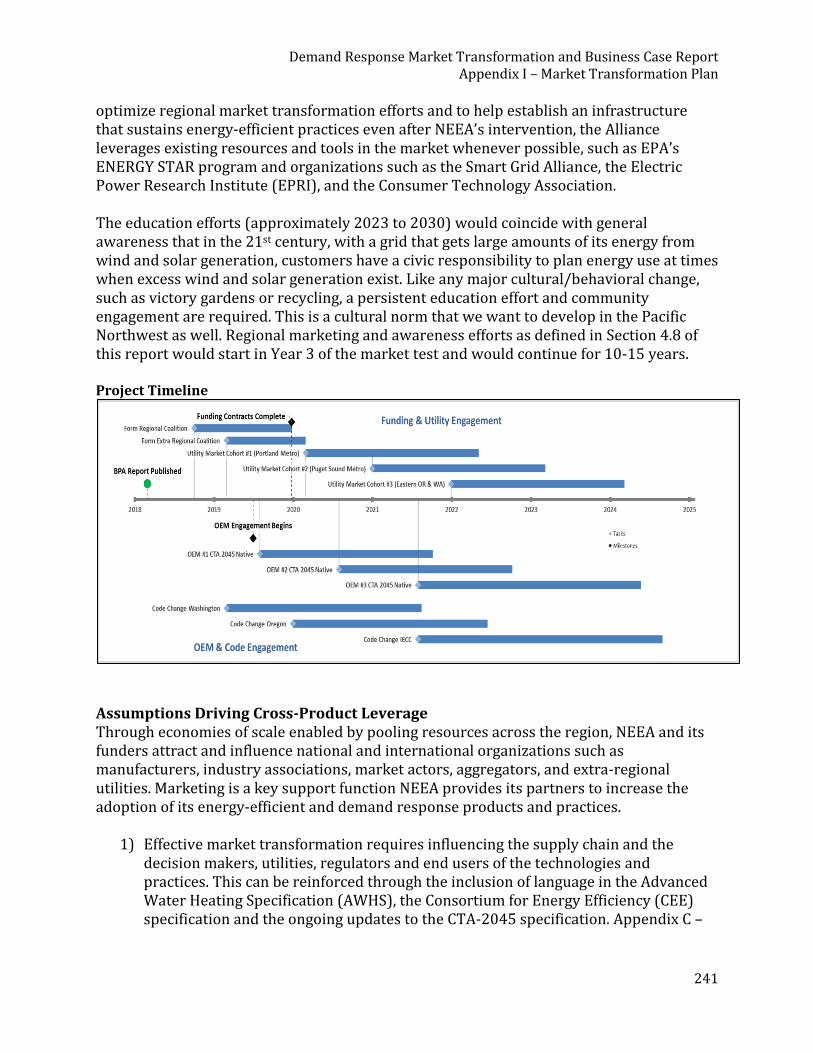
Demand Response Market Transformation and Business Case Report Appendix I – Market Transformation Plan
241
optimize regional market transformation efforts and to help establish an infrastructure that sustains energy-efficient practices even after NEEA’s intervention, the Alliance leverages existing resources and tools in the market whenever possible, such as EPA’s ENERGY STAR program and organizations such as the Smart Grid Alliance, the Electric Power Research Institute (EPRI), and the Consumer Technology Association. The education efforts (approximately 2023 to 2030) would coincide with general awareness that in the 21st century, with a grid that gets large amounts of its energy from wind and solar generation, customers have a civic responsibility to plan energy use at times when excess wind and solar generation exist. Like any major cultural/behavioral change, such as victory gardens or recycling, a persistent education effort and community engagement are required. This is a cultural norm that we want to develop in the Pacific Northwest as well. Regional marketing and awareness efforts as defined in Section 4.8 of this report would start in Year 3 of the market test and would continue for 10-15 years. Project Timeline
Assumptions Driving Cross-Product Leverage Through economies of scale enabled by pooling resources across the region, NEEA and its funders attract and influence national and international organizations such as manufacturers, industry associations, market actors, aggregators, and extra-regional utilities. Marketing is a key support function NEEA provides its partners to increase the adoption of its energy-efficient and demand response products and practices.
1) Effective market transformation requires influencing the supply chain and the decision makers, utilities, regulators and end users of the technologies and practices. This can be reinforced through the inclusion of language in the Advanced Water Heating Specification (AWHS), the Consortium for Energy Efficiency (CEE) specification and the ongoing updates to the CTA-2045 specification. Appendix C –
Demand Response Market Transformation and Business Case Report Appendix I – Market Transformation Plan
242
CTA-2045 Commands and Related Specifications provides more details on existing specifications and test procedures.
2) Marketing efforts, when implemented in concert with manufacturers, distributors, funders, utilities, and others to drive quicker adoption of products in the market, are a primary value and influence point of the Alliance with the supply chain and with national and regional organizations.
3) Marketing strategies and tactics are more efficient when developed and deployed at scale.
4) Websites and other digital communications are a vital part of market transformation efforts. The proliferation of mobile devices and an established reliance on web searches for information across all markets provide an opportunity to educate and inform target audiences through websites and other digital media. Digital channels have become so ingrained in day-to-day business practices and consumer behavior that the absence of a digital strategy limits the impact of transformation efforts.
5) Websites provide an easy repository of resources for upstream and midstream actors, including fact sheets, video tutorials, and infographics, which utilities can tailor and share with their customers.
Goals
1) Support partnerships with manufacturers, national and regional organizations, and other entities by providing uniform messaging and promotion to the entire Northwest region.
2) Drive the adoption of the practices and technologies that NEEA supports through awareness-building and education of the benefits.
Penetration of CTA-2045-Equipped Water Heaters in Oregon and Washington The cohort implementations described above, and in Section 4.7 of this report, represent the expected approach to ramp up the availability of CTA-2045-equipped water heaters into the Pacific Northwest. The first three years of this plan call for manufacturers to create product concurrent with testing of the pre-commercial product in test environments. Year 3 begins filling distribution channels in metro Portland with product from the first manufacturer; Year 4 fills the Portland and Seattle markets with product from the first two OEMs. Finally in Year 5 all three OEMs are filling all distribution channels in Oregon and Washington with native CTA-2045 product. This amounts to nearly 190,000 tanks per year being installed in homes. This level of penetration, together with the education efforts described in Section 4.8 of this report, means that marketing to enroll customers can begin in earnest. The ramp-up period ends in 2024 with about 9% of homes equipped with a CTA-2045-equipped tank. In 2025 there may still be some ramping up of CTA-2045 tanks both in terms of geographic distribution channels of some OEMs as well as the availability of low-volume models with CTA-2045 functionality. However, with the ramp-up phase complete, an average of 193,000 CTA-2045 tanks per year would enter homes over the next 15 years: 2025 to 2039.

Demand Response Market Transformation and Business Case Report Appendix I – Market Transformation Plan
243
The following table summarizes the expected availability of CTA-2045 tanks in the Pacific Northwest. CTA-2045-Equipped Water Heaters as Percent of All Electric Water Heaters
Year Total 1000s
Total as % Year
Total 1000s
Total as % Year
Total 1000s
Total as % Year
Total 1000s
Total as %
2020 4 0.1% 2025 472 16% 2030 1,424 45% 2035 2,399 72%
2021 12 0.4% 2026 660 22% 2031 1,619 50% 2036 2,594 77%
2022 33 1.1% 2027 848 27% 2032 1,814 56% 2037 2,789 82%
2023 102 3.4% 2028 1038 33% 2033 2,009 61% 2038 2,984 87%
2024 283 9% 2029 1230 39% 2034 2,204 67% 2039 3,174 91%
Demand Response Market Transformation and Business Case Report Appendix I – Market Transformation Plan
244
I-2. Logic Model – Assets, Barriers, Opportunities, Activities, Outputs, Outcomes, and Impacts
Overview of Market Challenges Residential domestic water heaters offer tremendous potential for energy savings and flexible demand, but they are not typically front-of-mind for homeowners and renters until they fail. Eighty percent of water heaters are replaced as part of an emergency failure; very little time is spent on the buying decisions. As a consequence, the opportunity to impact this market requires an upstream engagement with manufacturers, distributors, aggregators, and utilities in order to change the types of water heaters available for sale. Manufacturers are reluctant to regionalize their products because it adds cost, limits inventory flexibility, and may open them to competitors trying to gain market share in niche markets. Distributors are reluctant to carry extra versions of the same basic models because it takes space and adds tracking costs. Installers may be reluctant to promote the CTA-2045-equipped tanks because they worry the added complexity will increase field failures and complaints. Aggregators need to have sufficient incentives and/or revenue stream to make it worth their while to overcome the incremental costs. Utilities need to have a benefit-to-cost value sufficient to make it worth the investment. The economics need to be justifiable to their management, members, shareholders, and their public commissions and boards. Customers may not see the value of participation in demand response programs. Most customers don’t like to have outside control of assets inside their homes. Logic Model A logic model (also known as a logical framework, theory of change, or program matrix) is a tool used by funders, managers and evaluators of programs to evaluate the effectiveness of a program. They can also be used during planning and implementation. Logic models provide a structured way for an organization and stakeholders to define a clear path to an end state. NEEA has a well-developed logic model for the Heat Pump Water Heater (HPWH) program. The market barriers for the demand response program are expected to be similar, although the communication requirement will introduce new barriers.
Demand Response Market Transformation and Business Case Report Appendix I – Market Transformation Plan
245
The Demand Response for Electric Water Heater logic model, illustrated earlier in the Logic Model diagram in Section I-1 of this appendix, includes the following key elements:
• Assets. • Opportunities. • Market barriers. • Activities and outputs. • Outcomes. • Impacts.
NEEA has cross-pollinated the logic models of HPWHs and demand response electric water heating. It is imperative that agreement exists between the two. In an effort to avoid having the current HPWH market initiative be at cross-purposes, NEEA integrated the current NEEA HPWH logic model for reference to inform development and refinement of the demand response electric water heater logic model. Assets that Enable the Acceleration and Adoption of Demand Response
1) The water heater market is changing with the advent of the HPWH. This technology has onboard electronic logic and all manufacturers offer some form of communication port.
2) The Advanced Water Heater Specification and the Consortium for Energy Efficiency (CEE) water heater specification specifically call out connected requirements for HPWHs.
3) OEMs make high-end electric water heaters that have communication ports for customers and aggregators to remotely manage water heaters.
4) Customers are familiar with and getting more comfortable with remote control of appliances and home management.
5) An open-source standard, ANSI/CTA-2045, has been developed that defines the levels of communication required to create a low-cost, interoperable solution.
6) The Pacific Northwest has strong trusting relationships with all three manufacturers (AO Smith, Rheem, and Bradford White), specifically for demand response and HPWHs.
7) California is driving hard to electrify its grid and sees strong benefits of connected water heaters to tame the “duck curve.”
8) Connectivity aggregators are ready and able to engage with water heaters and have robust and reliable communication devices ready to scale.
9) The CTA-2045 standard provides for a flexible and persistent digital control. Opportunities
1) In Oregon and Washington, approximately 215,000 new electric water heaters are installed each year.
2) Demand response-enabled water heaters are a low-cost solution for utilities to build flexible demand response programs.
Demand Response Market Transformation and Business Case Report Appendix I – Market Transformation Plan
246
3) Marginal generation resources are mostly wind and solar resources with unpredictable output; “smart” water heaters create a flexible load that can be controlled to use electricity when these resources are available.
4) State, regional, and local governments are demanding integration of more renewables.
5) Water heaters have a finite life span and get replaced on average every 15 years. 6) The effort for a flexible load management solution with water heaters is supported
by senators (Cantwell, Porter, and Wyden) and organizations such as NRDC, Sierra Club, Environmental Defense Fund (EDF), the National Rural Electric Cooperative Association (NRECA), and the World Resources Institute (WRI), as well as numerous sustainable community advocates.
Market Barriers
1) Non-recurring engineering (NRE) costs to implement CTA-2045 by OEMs are high compared to return on investment (ROI).
2) The incremental cost of components to equip the standard electric resistance tank with CTA-2045 is about 5% to 10% of the wholesale cost of the tank.
3) All three OEMs have different approaches to connectivity and all of them are currently proprietary.
4) In 2018, most PNW utilities are not short on capacity, and so have little need for traditional demand response or aren’t familiar with the integration of this kind of DR to balance their grid.
5) Utilities may not be willing to invest in the incremental cost to upgrade water heaters due to lack of rate recovery.
6) Utilities don’t agree on the DR protocol on which to standardize. 7) No governing body exists to manage specifications, test procedures, validate
performance, and manage and issue a recognizable brand of CTA-2045-connected devices.
8) Customers (the buyers of water heaters) are generally not aware of and/or are not seeking the benefits of water heaters with communication connectivity.
9) Regulators and investor-owned utility (IOU) boards may be hesitant to approve/fund a plan with such a long lead time to break even; and with possible issues with free riders.
10) Security is a concern for utilities, aggregators, OEMs, and customers. The nature of smart appliances means they can be connected to the internet. Sufficient security must be implemented to safeguard against an attack.
Activities and Outputs
1) Marketing and training to the supply chain. Work with existing market actors and communication channels to promote the integration of CTA-2045 equipment. Provide message testing and validation for market actors to target the supply chain and end customers.
2) Manufacturer engagement. Work with the three key water heater manufacturers to include CTA-2045 as the new standard for all water heater tanks of 40 gallons and more. This will include non-recurring engineering (NRE) for initial product
Demand Response Market Transformation and Business Case Report Appendix I – Market Transformation Plan
247
availability as well as long-term solutions with the integration of application-specific integrated circuit (ASIC) solutions (reducing part count and bill of materials (BOM) cost). Provide incremental cost reimbursement for the first cohorts in the Pacific Northwest. Provide national convening of progressive early adopter utilities with the OEMs.
3) Support regional utilities and aggregators to work through implementation barriers. Develop best practices in the integration of demand response for utilities. Provide coordination and collaboration for utilities in the development of specifications, practices, RFPs for aggregators, and share lessons learned to accelerate the adoption by utilities of demand response programs for residential loads.
4) Support extra-regional utilities. The effort to accelerate the adoption of CTA-2045 will require more utilities outside of the region to promote and engage with manufacturers, the supply chain, and aggregators. NEEA will need to work at a national level to promote this effort to build a sufficiently-sized coalition.
5) Promote, socialize, and enable national utilities, regulators, utility boards, and aggregators to be aware of the benefits of demand response programs for water heaters. By working with early adopter utilities, commissions, and utility boards, NEEA will break down the barriers that some utility commissions and utility management teams might have. This will be done by strategic national promotion of the inclusion of CTA-2045 in filings and rulemaking.
6) Provide advocacy and support of the CTA-2045 standard. NEEA will work with other Codes and Standards organizations to embed and reinforce the support of CTA-2045. NEEA has identified key organizations that need to be targeted to get support (the Air-Conditioning, Heating, and Refrigeration Institute [AHRI], ENERGY STAR, Advanced Water Heater Specification [AWHS], Department of Energy [DOE], State of California, building code officials, and others) of the CTA-2045 standard for water heaters.
Specification, Testing and Qualified Products List CTA-2045 is a solid specification that can be leveraged for OEMs, aggregators, utilities, and communication module providers. The Electric Power Research Institute (EPRI) has worked with the Consumer Technology Association in partnership with progressive utilities to develop a specification in detail. EPRI has also developed testing methods and protocols as well as fixtures for OEMs and aggregators to properly test products. While the CTA-2045 standard covers numerous products, NEEA proposes to develop a specific test to validate the functionality as it applies to water heaters, both electric resistance and heat pump. Testing methods will be incorporated in the Advanced Water Heater Specification (AWHS) 7.0 to verify that products listed on the Qualified Products List (QPL) can operate to ANSI/CTA-2045 protocols and signals. OEMs will need to provide a certificate certifying compliance to the standard. NEEA will take an active role on future generations and/or versions of the specifications to ensure that energy and grid efficiency is kept in clear focus.
Demand Response Market Transformation and Business Case Report Appendix I – Market Transformation Plan
248
NEEA will develop a dedicated qualified product list (QPL) for CTA-2045 water heater-compliant products that aggregators, utilities, and other market actors can reference. NEEA will find a final resting place for the testing and QPL of DR water heaters to be determined as this market space evolves. Key Activities to Provide Value to the Region Section 4.8 of this report includes a full list of marketing activities NEEA implements as part of its Market Transformation programs.
1) Accelerate energy efficiency and demand response in the Northwest by effectively influencing the supply chain, market actors, and target audiences to seek more information about, promote, and adopt energy-efficient technologies and practices.
2) Plan and implement marketing plans to promote the products, practices, or services NEEA supports with the supply- and demand-side target audiences. The plans may include creative development, media buys, digital tool creation, public service announcements, and public relations.
3) Supplement or amplify supply chain and partner marketing activities and facilitate opportunities for cooperative marketing activities that highlight funder branding where possible. NEEA does this by providing templates, case studies, and other promotional support to strengthen engagement with the supply chain and other partners and to ensure that regional and partner investment in demand creation is maximized.
4) Leverage websites to educate and inform end customers, and provide them with easy access to utility program sites, OEMs, distributors, and qualified installers near them. Websites such as Hot Water Solutions are particularly effective at providing information and education on a variety of products and practices, as they are built deliberately for limited, well-defined target audiences within residential sectors.
Development and Roll-out of Best Practices for Utilities and Aggregators in Demand Response Programs Part of the five-year utility cohort market campaign will be to develop the best practices for utilities to engage with DR aggregators and the internal skills development for managing a demand response management system (DRMS). Utilities have options when deploying DR programs; they can either do it in-house or outsource that service to one of numerous DRMS providers. DRMS solutions range from very hands-on to very hands-off. The key to this work is to develop the best practices for each type of utility as it relates to water heaters and other distributed loads.

Demand Response Market Transformation and Business Case Report Appendix I – Market Transformation Plan
249
Some Companies Currently Supporting Players in the Residential DR Space
ABB Comverge Eaton Corporation Plc Ecobee EnergyHub, Inc. EnerNOC, Inc. eRadio General Electric Honeywell International Inc.
Johnson Controls Lockheed Martin Nest Labs, Inc. Oracle Opower Schneider Electric Siemens AG Skycentrics ThinkEco Inc.
DRMS systems can be fully automated or targeted by time, location, generation, and/or unique system constraints and congestion. Qualifications of needs will be based on the attributes of each utility. Numerous firms are operating in this space that offer many options. The deliverable in this phase would be to provide guidance to utilities that are not familiar with this space and to make sure they are getting the value for the effort. From an enterprise systems point of view, the DRMS falls into the category of an information management system much like the meter data management system, and connects the flow of information to the DR devices to/from the utility, leveraging the smart grid advanced metering infrastructure (AMI) network if that exists. As the critical linkage between the DR resources and the utility back office, key functional elements must be supported:
• All Customer Classes: Utilities investing in DR are doing so across all customer classes. The DRMS solution for most utilities needs to be a complete solution for all customer classes and cases. Additionally, it should represent the state of the art in a portfolio management toolset for these resources.
• Utility Operations: The DRMS becomes the link from utility systems such as the Customer Information System and the Distribution Management System.
• Device Agnostic: In the not-too-distant future, the market will be flooded with devices for DR and customer interaction. DRMS platforms must embrace the use of these devices in an agnostic manner, breaking the mold of proprietary systems controlled by third-party devices.
• System of Record (SoR) for the Home Area Network (HAN): All utilities talk about the system of record for billing systems. The new system will require a complete SoR for home area network (HAN) devices as well.
• Platform Approach: The DRMS platform is not a single solution but rather a platform for the next generation of systems, i.e., an expandable system as new opportunities emerge.
• Multi-Devices, Multi-Protocol, Multi-Network: Migrating from legacy technologies will require time, patience, and a strategy that encompasses the ability to manage
Demand Response Market Transformation and Business Case Report Appendix I – Market Transformation Plan
250
legacy systems as well as new systems. Although the feature sets may be different, the DRMS must manage this transition.
• Link to Customer Portals and Information Systems: The DRMS must maintain active records of customer devices and manage them on behalf of the utility. Critical to the success of the DRMS concept is the ability to integrate with customer-facing systems. These portals provide customers with valuable decision-making information.
Some of the key issues and concerns are as follows:
• Security: Utilities, aggregators, and utility commissions are concerned with security of the controlled device, the home, the neighborhood, the utility feeder, and the grid as a whole. As such, the communication protocol must have a robust security protocol. While the internet and Wi-Fi can provide reasonably good security, there exist four main types of cyber-attacks with:
1. DoS — Denial of Service. 2. LoC — Loss of control via malicious access. 3. P&R — Record of valid messages and replay. 4. Pirate commands or unauthorized broadcasts on valid frequencies or
communication channels. • Reliability: Aggregators and utilities must have reliable resources that can be bid
into markets so that the grid is balanced and managed properly. Having a Demand Response Management System (DRMS) that can provide grid services with five to six nines reliability is essential for aggregators and utilities to be comfortable.
• Scalability: Aggregators and utilities need significant kW to make it worth their while to manage and control. While the individual savings is small, every household and small business has a water heater and a good portion of them in the Pacific Northwest are electric. As this program is implemented, the scalability would become sufficient to get aggregators and utilities interested (every year more than 220K electric water heaters are replaced in the PNW).
Development of Market Progress Indicators Market progress indicators (MPIs) provide insights into how interventions perform. The table on the next page provides a description of the MPIs, how they will be measured, and the data sources that will be utilized.
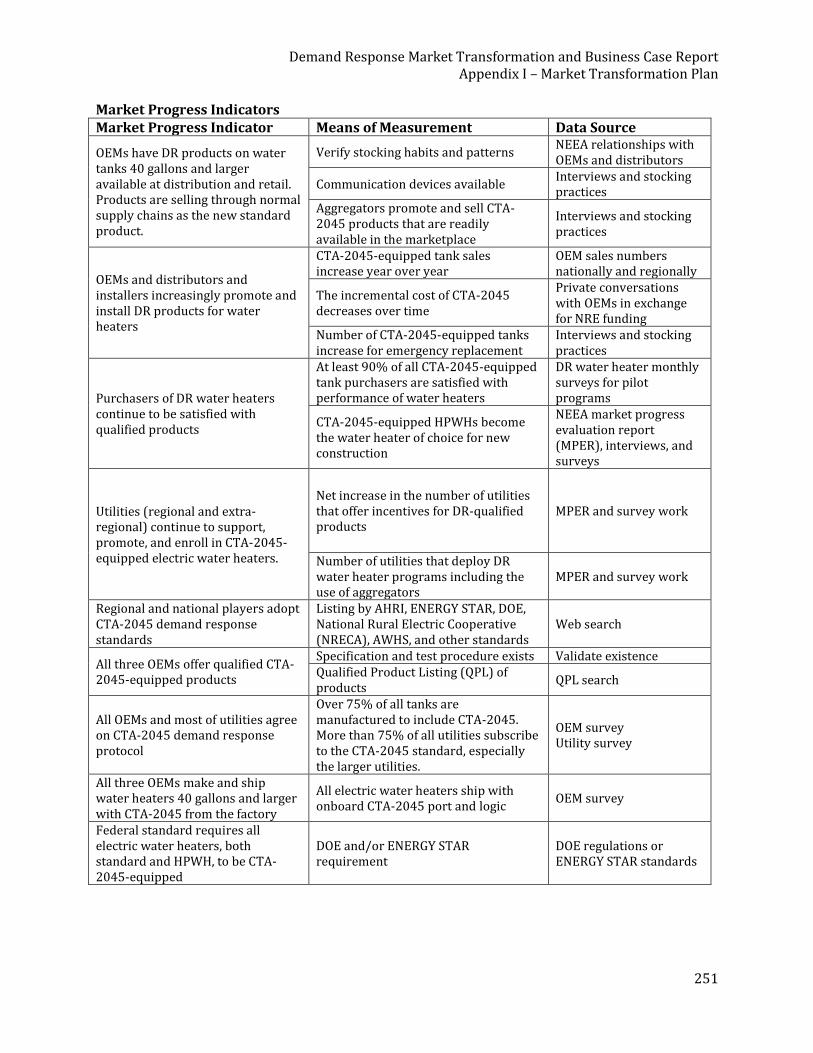
Demand Response Market Transformation and Business Case Report Appendix I – Market Transformation Plan
251
Market Progress Indicators Market Progress Indicator Means of Measurement Data Source
OEMs have DR products on water tanks 40 gallons and larger available at distribution and retail. Products are selling through normal supply chains as the new standard product.
Verify stocking habits and patterns NEEA relationships with OEMs and distributors
Communication devices available Interviews and stocking practices
Aggregators promote and sell CTA-2045 products that are readily available in the marketplace
Interviews and stocking practices
OEMs and distributors and installers increasingly promote and install DR products for water heaters
CTA-2045-equipped tank sales increase year over year
OEM sales numbers nationally and regionally
The incremental cost of CTA-2045 decreases over time
Private conversations with OEMs in exchange for NRE funding
Number of CTA-2045-equipped tanks increase for emergency replacement
Interviews and stocking practices
Purchasers of DR water heaters continue to be satisfied with qualified products
At least 90% of all CTA-2045-equipped tank purchasers are satisfied with performance of water heaters
DR water heater monthly surveys for pilot programs
CTA-2045-equipped HPWHs become the water heater of choice for new construction
NEEA market progress evaluation report (MPER), interviews, and surveys
Utilities (regional and extra-regional) continue to support, promote, and enroll in CTA-2045-equipped electric water heaters.
Net increase in the number of utilities that offer incentives for DR-qualified products
MPER and survey work
Number of utilities that deploy DR water heater programs including the use of aggregators
MPER and survey work
Regional and national players adopt CTA-2045 demand response standards
Listing by AHRI, ENERGY STAR, DOE, National Rural Electric Cooperative (NRECA), AWHS, and other standards
Web search
All three OEMs offer qualified CTA-2045-equipped products
Specification and test procedure exists Validate existence Qualified Product Listing (QPL) of products
QPL search
All OEMs and most of utilities agree on CTA-2045 demand response protocol
Over 75% of all tanks are manufactured to include CTA-2045. More than 75% of all utilities subscribe to the CTA-2045 standard, especially the larger utilities.
OEM survey Utility survey
All three OEMs make and ship water heaters 40 gallons and larger with CTA-2045 from the factory
All electric water heaters ship with onboard CTA-2045 port and logic
OEM survey
Federal standard requires all electric water heaters, both standard and HPWH, to be CTA-2045-equipped
DOE and/or ENERGY STAR requirement
DOE regulations or ENERGY STAR standards
Demand Response Market Transformation and Business Case Report Appendix I – Market Transformation Plan
Market Baseline Study of Demand Response
252
I-3. Market Baseline Study of Demand Response To better understand the current environment, NEEA commissioned market research activities in early 2017 from the Cadeo Group, LLC and Research Into Action to establish baseline levels of awareness and understanding of demand response (DR) for water heaters among several supply chain actors (manufacturers, distributors, aggregators, utilities, installers, and end users). While not exhaustive, it should prove helpful to measure the shift, impact, and change over time. This study, coupled with the final utility survey results, provide great insights into utilities’ interest in participating in a DR program. These research findings were collected through three primary activities:
1. In-depth interviews with manufacturers, manufacturer representatives and distributors, aggregators, and utilities (n=21).
2. Survey of installers to gauge their awareness of and familiarity with DR-enabled water heaters (n=76).
3. Survey of general population (end user) respondents across Idaho, Montana, Oregon, and Washington, again to determine their awareness of and familiarity with DR-enabled water heaters (n=298).
Key findings are summarized below. Detailed results from these research activities follow these key findings, in the July 28, 2017 memo from Cadeo Group, LLC and Research Into Action to NEEA. Key Findings
• Low awareness of demand response-enabled water heaters is a critical barrier to regional uptake.
o All three installers specifically interviewed about DR-enabled water heaters had confused “demand response” water heaters with “on demand” water heaters.
o While 14% of general population respondents claimed awareness of devices that may be controlled by the utility during peak periods for demand response programs, this figure may likewise be overstated due to a misunderstanding of the brief DR description read to them.
o Interviewed market actors also posited low levels of awareness for end users, and noted that customers currently aware of DR are typically more energy-savvy in general.
• DR-related activity among Northwest utilities is gradually increasing. All
interviewed utilities are either planning or currently engaged in a DR pilot or program. Many attributed this interest to the inclusion of DR as a resource in the Northwest Power & Conservation Council’s Seventh Power Plan [NPPC 2016].
• Which should come first: CTA-2045 integration into appliances, or adoption by
communication vendors?
Demand Response Market Transformation and Business Case Report Appendix I – Market Transformation Plan
Market Baseline Study of Demand Response
253
o Several market actors cited a causality dilemma (“chicken or egg”) in determining whether appliance integration or adoption by communication vendors should come first to drive acceptance of CTA-2045 as the standard.
o Many market actors claimed that utilities should wield substantial influence in adoption of CTA-2045 to encourage manufacturers to adopt the standard.
• Manufacturer representatives lack agreement on CTA-2045 adoption.
o One large manufacturer wants to let each utility decide how to communicate with water heaters and is enabling its WHs with Wi-Fi connectivity.
o Another large manufacturer uses only CTA-2045 for its DR-capable products. ▪ “Reduces complexity.” ▪ “Would be simpler if all utilities decided on one method.”
o A third claimed that while it is shifting its water heater lines (especially heat pump water heaters (HPWHs)) to be fully DR-enabled, it has not made decisions about specific communication standards.
• Utilities feel that control over DR-related messages and customer communication is
key. They want to ensure a positive experience in this new avenue for customer engagement.
o Utilities and aggregators also noted the importance of emphasizing easy customer opt-out from a DR program as an inducement to initial program participation.
o More than half of the general population survey respondents who claimed to be aware of demand response cited utilities as a source of their awareness.
• Utilities and aggregators employ targeted strategies to recruit customers for
pilot programs. These include marketing to property management companies rather than individual tenants and partnering with plumbers and contractors to offer DR-enabled replacement water heaters, with a customer incentive for program enrollment, in emergency replacement situations.
• Utilities choose a “green” focus rather than a money-saving focus in marketing
DR programs to customers. They want to steer clear of overpromising bill savings and at the same time would appreciate assistance in developing marketing materials to help explain the benefits of DR to customers.
• HPWHs are considered less appealing for demand response than are standard
electric resistance water heaters (ERWHs). o The greater efficiency of a HPWH limits the amount of demand that a utility
can control. o Some respondents expressed concern that the HPWH’s slower recharge
might increase the likelihood of a HPWH user, more so than an ERWH user, having no hot water during a DR event.
Demand Response Market Transformation and Business Case Report Appendix I – Market Transformation Plan
Market Baseline Study of Demand Response
254
• Lack of DR familiarity inhibits discussion down the supply chain. o The technology’s early stage in the adoption cycle gives many market actors
little incentive to become educated on a topic that is so far only minimally relevant.
o Distributors are reticent to talk about DR with their builder and plumber customers.
o Builders and plumbers in turn shy away from discussing DR with their end user customers – Education and awareness are keys to the success of a program.
• Utilities favor commercial and industrial DR programs over residential
programs. o They feel they can count on the former to shave off peak load by the required
amount when they get the signal. o Residential customers’ ability to override an event decreases utilities’
confidence in their ability to predict reduction amounts in residential programs – an imprecision that could lead to fines if actual load reduction is less than expected.
• Most surveyed customers expressed strong interest in DR programs; many would
require a financial benefit. o Nearly one-third expressed strong interest with no financial incentives. o Nearly one-half would be very interested at incentive amounts averaging $244
per year. o Among reasons for those less interested in DR programs, homeowners cited lack
of understanding and information; renters most commonly cited the need for buy-in from the owner of their building.
The research memo from which these key findings were summarized begins on the next page.
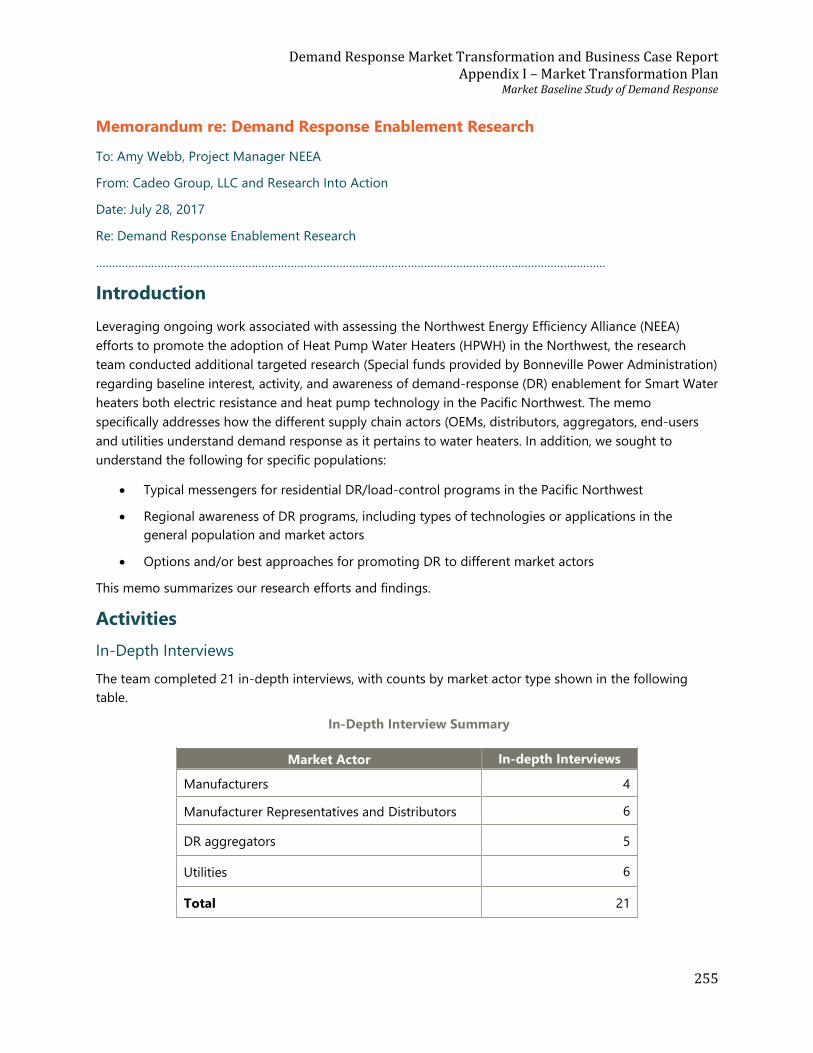
Demand Response Market Transformation and Business Case Report Appendix I – Market Transformation Plan
Market Baseline Study of Demand Response
255
Memorandum re: Demand Response Enablement Research
To: Amy Webb, Project Manager NEEA
From: Cadeo Group, LLC and Research Into Action
Date: July 28, 2017
Re: Demand Response Enablement Research
………………………………………………………………………………………………………………………………………….
Introduction
Leveraging ongoing work associated with assessing the Northwest Energy Efficiency Alliance (NEEA)
efforts to promote the adoption of Heat Pump Water Heaters (HPWH) in the Northwest, the research
team conducted additional targeted research (Special funds provided by Bonneville Power Administration)
regarding baseline interest, activity, and awareness of demand-response (DR) enablement for Smart Water
heaters both electric resistance and heat pump technology in the Pacific Northwest. The memo
specifically addresses how the different supply chain actors (OEMs, distributors, aggregators, end-users
and utilities understand demand response as it pertains to water heaters. In addition, we sought to
understand the following for specific populations:
• Typical messengers for residential DR/load-control programs in the Pacific Northwest
• Regional awareness of DR programs, including types of technologies or applications in the
general population and market actors
• Options and/or best approaches for promoting DR to different market actors
This memo summarizes our research efforts and findings.
Activities
In-Depth Interviews
The team completed 21 in-depth interviews, with counts by market actor type shown in the following
table.
In-Depth Interview Summary
Market Actor In-depth Interviews
Manufacturers 4
Manufacturer Representatives and Distributors 6
DR aggregators 5
Utilities 6
Total 21
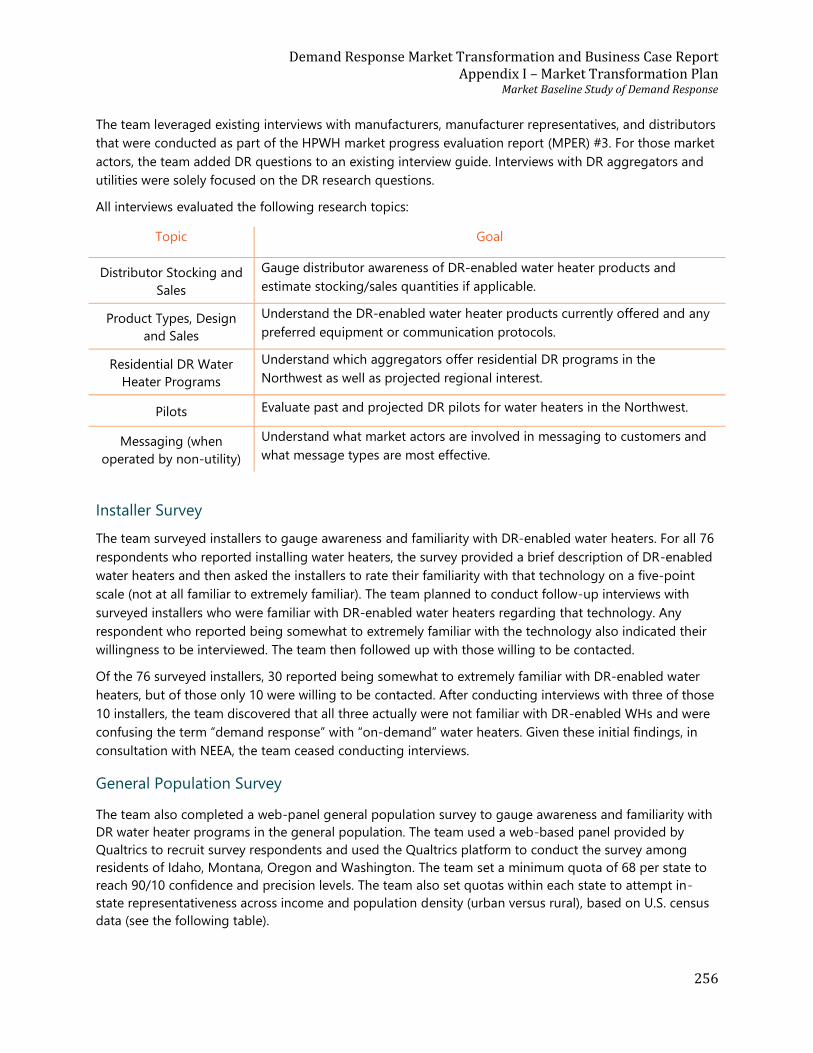
Demand Response Market Transformation and Business Case Report Appendix I – Market Transformation Plan
Market Baseline Study of Demand Response
256
The team leveraged existing interviews with manufacturers, manufacturer representatives, and distributors
that were conducted as part of the HPWH market progress evaluation report (MPER) #3. For those market
actors, the team added DR questions to an existing interview guide. Interviews with DR aggregators and
utilities were solely focused on the DR research questions.
All interviews evaluated the following research topics:
Topic Goal
Distributor Stocking and
Sales
Gauge distributor awareness of DR-enabled water heater products and
estimate stocking/sales quantities if applicable.
Product Types, Design
and Sales
Understand the DR-enabled water heater products currently offered and any
preferred equipment or communication protocols.
Residential DR Water
Heater Programs
Understand which aggregators offer residential DR programs in the
Northwest as well as projected regional interest.
Pilots Evaluate past and projected DR pilots for water heaters in the Northwest.
Messaging (when
operated by non-utility)
Understand what market actors are involved in messaging to customers and
what message types are most effective.
Installer Survey
The team surveyed installers to gauge awareness and familiarity with DR-enabled water heaters. For all 76
respondents who reported installing water heaters, the survey provided a brief description of DR-enabled
water heaters and then asked the installers to rate their familiarity with that technology on a five-point
scale (not at all familiar to extremely familiar). The team planned to conduct follow-up interviews with
surveyed installers who were familiar with DR-enabled water heaters regarding that technology. Any
respondent who reported being somewhat to extremely familiar with the technology also indicated their
willingness to be interviewed. The team then followed up with those willing to be contacted.
Of the 76 surveyed installers, 30 reported being somewhat to extremely familiar with DR-enabled water
heaters, but of those only 10 were willing to be contacted. After conducting interviews with three of those
10 installers, the team discovered that all three actually were not familiar with DR-enabled WHs and were
confusing the term “demand response” with “on-demand” water heaters. Given these initial findings, in
consultation with NEEA, the team ceased conducting interviews.
General Population Survey
The team also completed a web-panel general population survey to gauge awareness and familiarity with
DR water heater programs in the general population. The team used a web-based panel provided by
Qualtrics to recruit survey respondents and used the Qualtrics platform to conduct the survey among
residents of Idaho, Montana, Oregon and Washington. The team set a minimum quota of 68 per state to
reach 90/10 confidence and precision levels. The team also set quotas within each state to attempt in-
state representativeness across income and population density (urban versus rural), based on U.S. census
data (see the following table).
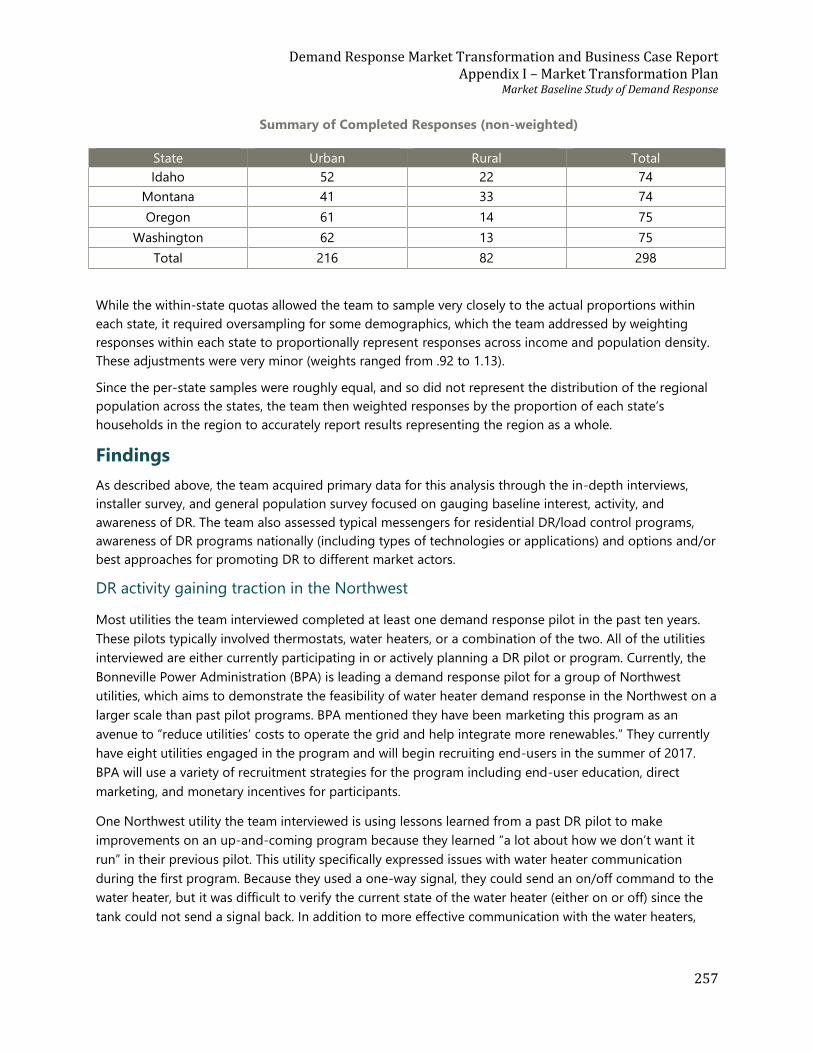
Demand Response Market Transformation and Business Case Report Appendix I – Market Transformation Plan
Market Baseline Study of Demand Response
257
Summary of Completed Responses (non-weighted)
State Urban Rural Total
Idaho 52 22 74
Montana 41 33 74
Oregon 61 14 75
Washington 62 13 75
Total 216 82 298
While the within-state quotas allowed the team to sample very closely to the actual proportions within
each state, it required oversampling for some demographics, which the team addressed by weighting
responses within each state to proportionally represent responses across income and population density.
These adjustments were very minor (weights ranged from .92 to 1.13).
Since the per-state samples were roughly equal, and so did not represent the distribution of the regional
population across the states, the team then weighted responses by the proportion of each state’s
households in the region to accurately report results representing the region as a whole.
Findings
As described above, the team acquired primary data for this analysis through the in-depth interviews,
installer survey, and general population survey focused on gauging baseline interest, activity, and
awareness of DR. The team also assessed typical messengers for residential DR/load control programs,
awareness of DR programs nationally (including types of technologies or applications) and options and/or
best approaches for promoting DR to different market actors.
DR activity gaining traction in the Northwest
Most utilities the team interviewed completed at least one demand response pilot in the past ten years.
These pilots typically involved thermostats, water heaters, or a combination of the two. All of the utilities
interviewed are either currently participating in or actively planning a DR pilot or program. Currently, the
Bonneville Power Administration (BPA) is leading a demand response pilot for a group of Northwest
utilities, which aims to demonstrate the feasibility of water heater demand response in the Northwest on a
larger scale than past pilot programs. BPA mentioned they have been marketing this program as an
avenue to “reduce utilities’ costs to operate the grid and help integrate more renewables.” They currently
have eight utilities engaged in the program and will begin recruiting end-users in the summer of 2017.
BPA will use a variety of recruitment strategies for the program including end-user education, direct
marketing, and monetary incentives for participants.
One Northwest utility the team interviewed is using lessons learned from a past DR pilot to make
improvements on an up-and-coming program because they learned “a lot about how we don’t want it
run” in their previous pilot. This utility specifically expressed issues with water heater communication
during the first program. Because they used a one-way signal, they could send an on/off command to the
water heater, but it was difficult to verify the current state of the water heater (either on or off) since the
tank could not send a signal back. In addition to more effective communication with the water heaters,
Demand Response Market Transformation and Business Case Report Appendix I – Market Transformation Plan
Market Baseline Study of Demand Response
258
the utility plans to leverage customer energy assessments for more effective recruitment, as well as other
new marketing strategies to boost awareness and participation in their upcoming pilot.
The general consensus among interviewed utilities is that consumer awareness of demand response is
generally low in the Northwest, but utilities have developed valuable educational tools that are bridging
the knowledge gap. Many of those interviewed noted that the inclusion of DR as a resource in the
Northwest Power & Conservation Council’s (the Council) Seventh Power Plan (Seventh Plan) has
contributed to the recent push of greater numbers of DR pilots in the Northwest.
Adoption of CTA 2045 standard is viewed as a “chicken-versus-egg” scenario
Manufacturers, communication vendors, and aggregators agreed that a push is necessary to get CTA 2045
to be the standard. Many of those interviewed described this as a chicken-versus-egg scenario where
communication vendors and manufacturers are unsure of which should come first: appliance integration
or communication-vendor adoption. One communication vendor explained how they “don’t see the port
in the appliances, so why should I build for it?” A common response communication vendors hear from
manufacturers is they “don’t see communication [vendors] using this standard.”
While communication vendors and appliance manufacturers seem less willing to take the plunge in
adopting the standard, they indicated that utilities could, and should, provide the necessary push for CTA
2045 adoption. Aggregators explained how ultimately utilities will make the decision because
communication methods are about cost and complexity for them and their customers. One aggregator
explained that “to get everyone to go to CTA, a Duke Energy or BPA type utility needs to do it.” This
interviewee further explained that many utilities are doing pilots, but manufacturers need a larger push to
adopt the standard.
Water heater manufacturers have differing opinions on CTA 2045 adoption
One of the largest water heater manufacturers interviewed does not utilize CTA 2045 because they see it
as easier to let the utility decide how to communicate with the water heaters. This manufacturer noted
they are enabling their water heaters with Wi-Fi connectivity in order to "give utilities options," without
limiting potential partnerships. Their HPWH models and most efficient line of electric resistance water
heaters come ready for Wi-Fi connection, allowing the utility or the homeowner to control the product as
necessary with their own devices.
In contrast, a different large water heater manufacturer the team interviewed uses only CTA 2045 for their
DR capable products. They explained CTA 2045 is “great for manufacturers because it reduces
complexity… [you] don’t have to build a bunch of varieties for different standards or different capabilities
for different communication methods.” This manufacturer further explained it “would be simpler if all of
the utilities decided to use just one method.” All of this manufacturer’s HPWH and premium standard
electric resistance water heaters are CTA 2045 ready.
Another water heater manufacturer interviewed indicated their water heater lines, especially HPWH, are
moving in the direction of being completely DR capable, but decisions about the specific communication
standards have not been made.
Demand Response Market Transformation and Business Case Report Appendix I – Market Transformation Plan
Market Baseline Study of Demand Response
259
Regardless of DR methods, utilities like to be in control of customer communication
All utilities agreed that being in control of the communication and messaging to their customers is of
utmost importance. Most of the time, the customer is aware of their utility only when they pay their bill or
if there is a power outage. Relaying DR messages and communication presents a new avenue for utilities
to engage with customers and utilities want to ensure the experience is positive.
Utilities and aggregators agreed it is imperative that customers can easily opt out of DR programs any
time following enrollment. Aggregators specifically highlighted that contracts should be zero-risk so the
customer can unenroll from the program at any time. This approach is also a selling point for utilities:
customers are more likely to participate in a program if they have the option to easily opt out if/when
they become dissatisfied.
Utilities and aggregators strategically recruit customers through a variety of methods
Utilities and aggregators employ different strategies for recruitment targets. One aggregator, who works
primarily in the fast-response demand response market, described initially going door to door
educating/recruiting homeowners, but quickly realized that was not scalable. Once they began targeting
property management companies, instead of individual tenants, their program and recruitment scaled
rapidly.
Northwest pilot programs frequently feature partnerships between utilities and local plumbers/
contractors to leverage emergency replacement calls in recruiting homeowners. In these instances, the
homeowner has a tank installed with the DR technology for no extra charge and receives an incentive for
enrolling.
Regardless of the recruitment method, all utilities cited being cautious of how they market DR programs
to their customers. Since energy prices are relatively low in the Northwest compared to the rest of the
U.S., they want to avoid overselling bill savings and upsetting customers when only a few dollars (or less)
are shaved off their monthly bills. Instead, they market DR as a way to be “green” for the electric grid and
do the right thing for the region. One utility mentioned they would like marketing collateral that provides
customers with a way of understanding how DR saves money and energy in the long run; this utility noted
it is challenging to explain the benefits of DR to customers who are not already familiar with it.
HPWH are less appealing for load control than standard electric resistance
Multiple interviewees noted that DR with HPWH is less effective than DR with standard electric resistance
water heaters (ERWH). Although, greater efficiency is one of the main selling points of a HPWH for a
homeowner, it limits the amount of energy/demand that a utility can control. Because electric resistance
water heaters use more energy, and pull more frequently from the grid, turning them on or off shifts the
energy load by a larger margin compared to a HPWH. From a utility perspective, a ERWH allows a greater
level of control over the system.
In addition to the grid effects, multiple interviewees expressed some concern over utilizing HPWH for DR
because HPWH take longer to recharge hot water than a standard electric resistance tank. They are
concerned customers with a HPWH would be more likely to be without hot water during a DR event and,
as a result, express dissatisfaction with the program or their HPWH.
Demand Response Market Transformation and Business Case Report Appendix I – Market Transformation Plan
Market Baseline Study of Demand Response
260
Distributors are apprehensive about discussing DR with customers
The majority of distributors interviewed did not consider themselves knowledgeable enough to discuss
DR-enabled water heaters with their builder and plumber customers. One distributor in particular
mentioned how when he talks to builders about DR it is as a jovial side note, saying “hey you can control
your people’s hot water” then moving to the next topic for discussion. Similarly, builders and plumbers do
not feel comfortable discussing DR with their customers. Distributors agreed there is a lack of information
or real push for the technology; therefore, they do not see the need to understand the technology at this
point and, consequently, are uncomfortable discussing it with customers.
With one exception, distributors reported minimal to no sales of DR-enabled water heaters. Some of the
distributors stock the DR-enabled water heaters or control modules, but they are not big movers.
Utilities are hesitant to rely on residential programs
Some utilities expressed concern over relying too heavily on residential DR programs to reduce load. They
explained how they have full confidence in their commercial or industrial customers to shave off peak
load by the required amount when they get the signal. In contrast, it can be difficult to predict the exact
reduction for a residential program because residential customers can override an event and the
programs. This can lead to fines if the load is not reduced by the correct amount.
Low customer awareness of DR is a critical barrier to regional uptake
Interviewees agreed that customer awareness of DR technology is low across the Northwest, constituting
a key barrier. Most customers simply do not know what DR is; those homeowners who are aware or
interested in DR are typically the same customers who are interested in smart thermostats or are more
energy savvy than the average customer.
Other common barriers cited during interviews were the potential to impact customer comfort (i.e.,
running out of hot water) and unfamiliarity with controls technology (e.g., not comfortable with
programming or troubleshooting a control module). To combat these potential barriers and engage
customers, some aggregators and utilities market DR to homeowners by emphasizing the usefulness of
the technology for applications other than DR, such as water leak detection.
The general population survey76 found that a minority of customers are aware of DR (29% overall 14%
aware of DR for water heaters). Despite this low awareness, the majority were interested in participating in
a DR water heater program (79%), but most would require a financial incentive to participate.
76 Details of this survey are provided in the Appendix.
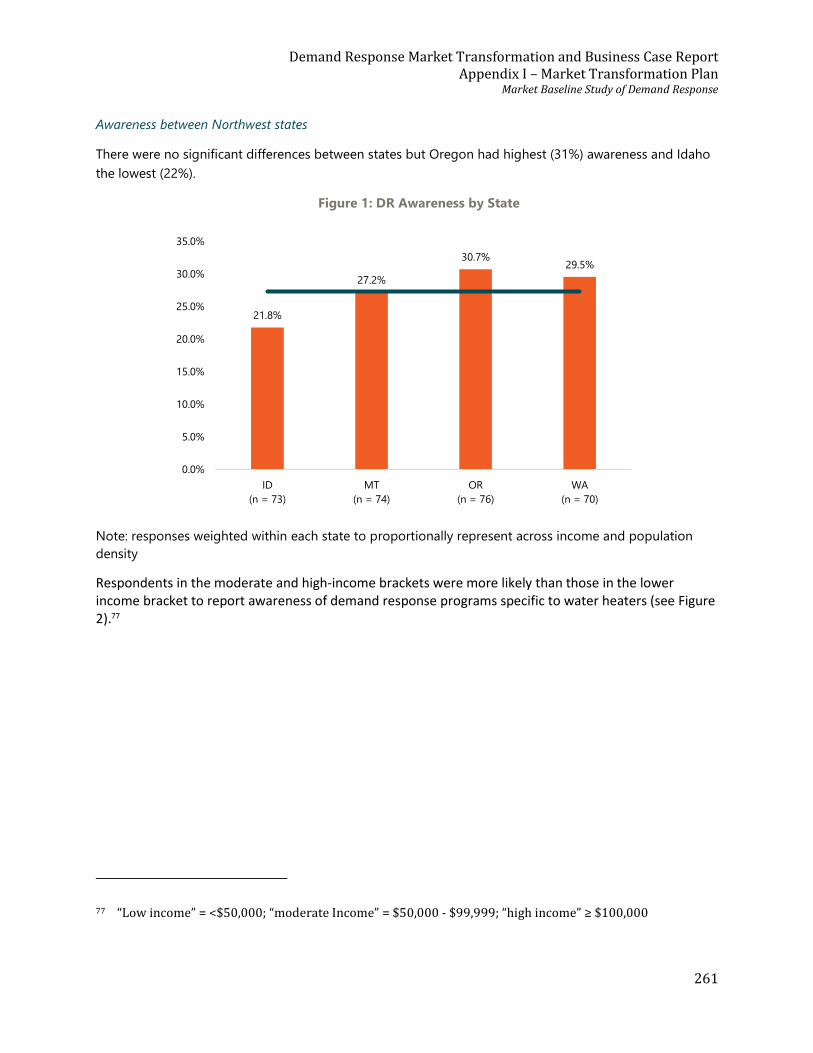
Demand Response Market Transformation and Business Case Report Appendix I – Market Transformation Plan
Market Baseline Study of Demand Response
261
Awareness between Northwest states
There were no significant differences between states but Oregon had highest (31%) awareness and Idaho
the lowest (22%).
Figure 1: DR Awareness by State
Note: responses weighted within each state to proportionally represent across income and population
density
Respondents in the moderate and high-income brackets were more likely than those in the lower income bracket to report awareness of demand response programs specific to water heaters (see Figure 2).77
77 “Low income” = <$50,000; “moderate Income” = $50,000 - $99,999; “high income” ≥ $100,000
21.8%
27.2%
30.7%29.5%
0.0%
5.0%
10.0%
15.0%
20.0%
25.0%
30.0%
35.0%
ID
(n = 73)
MT
(n = 74)
OR
(n = 76)
WA
(n = 70)
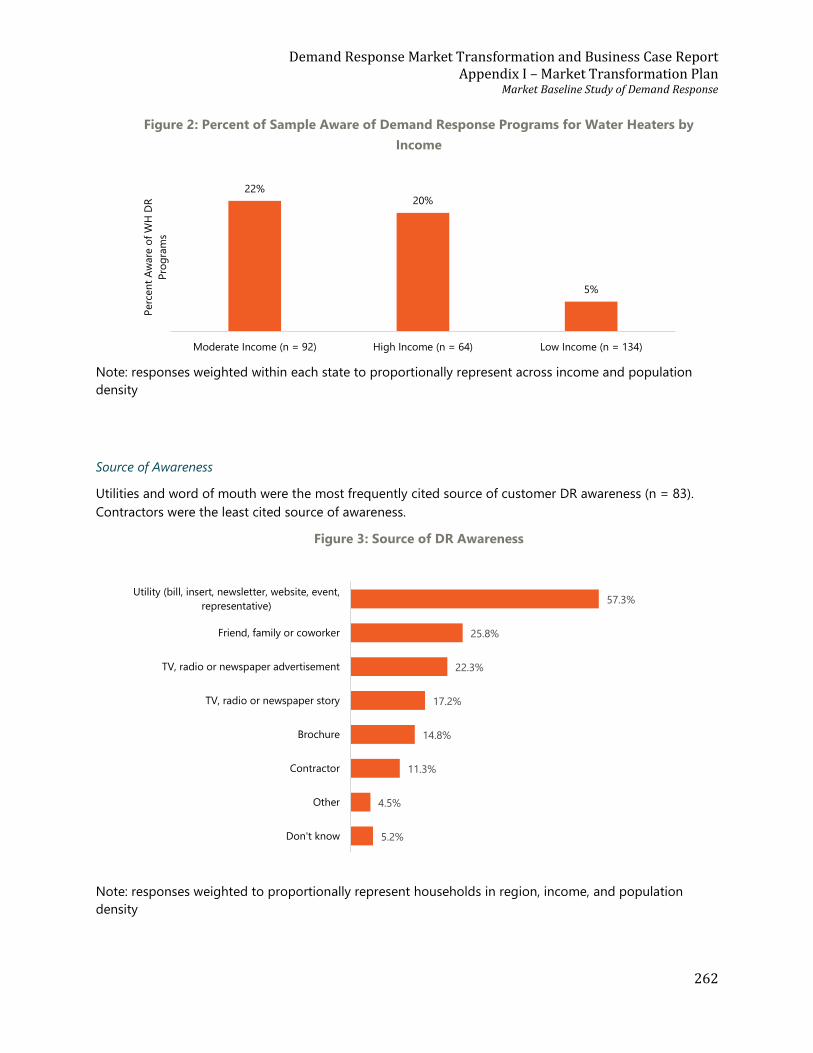
Demand Response Market Transformation and Business Case Report Appendix I – Market Transformation Plan
Market Baseline Study of Demand Response
262
Figure 2: Percent of Sample Aware of Demand Response Programs for Water Heaters by
Income
Note: responses weighted within each state to proportionally represent across income and population
density
Source of Awareness
Utilities and word of mouth were the most frequently cited source of customer DR awareness (n = 83).
Contractors were the least cited source of awareness.
Figure 3: Source of DR Awareness
Note: responses weighted to proportionally represent households in region, income, and population
density
22%20%
5%
Moderate Income (n = 92) High Income (n = 64) Low Income (n = 134)
Perc
en
t A
ware
of
WH
DR
Pro
gra
ms
5.2%
4.5%
11.3%
14.8%
17.2%
22.3%
25.8%
57.3%
Don't know
Other
Contractor
Brochure
TV, radio or newspaper story
TV, radio or newspaper advertisement
Friend, family or coworker
Utility (bill, insert, newsletter, website, event,
representative)
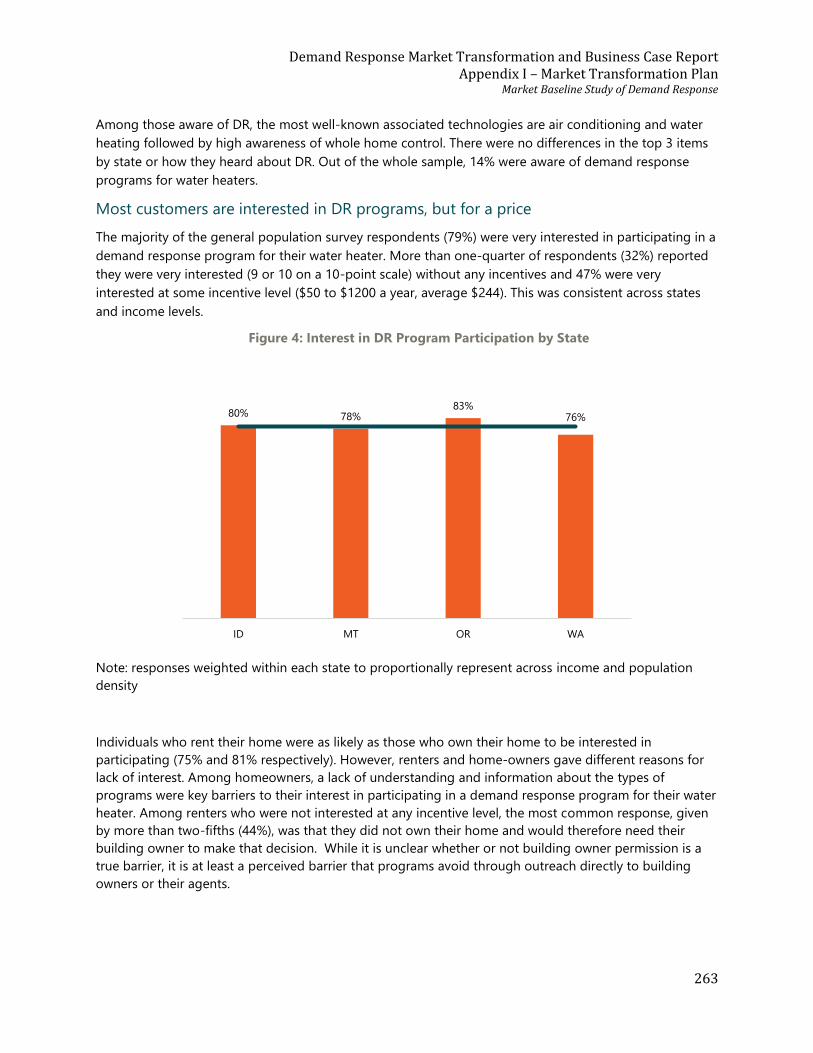
Demand Response Market Transformation and Business Case Report Appendix I – Market Transformation Plan
Market Baseline Study of Demand Response
263
Among those aware of DR, the most well-known associated technologies are air conditioning and water
heating followed by high awareness of whole home control. There were no differences in the top 3 items
by state or how they heard about DR. Out of the whole sample, 14% were aware of demand response
programs for water heaters.
Most customers are interested in DR programs, but for a price
The majority of the general population survey respondents (79%) were very interested in participating in a
demand response program for their water heater. More than one-quarter of respondents (32%) reported
they were very interested (9 or 10 on a 10-point scale) without any incentives and 47% were very
interested at some incentive level ($50 to $1200 a year, average $244). This was consistent across states
and income levels.
Figure 4: Interest in DR Program Participation by State
Note: responses weighted within each state to proportionally represent across income and population
density
Individuals who rent their home were as likely as those who own their home to be interested in
participating (75% and 81% respectively). However, renters and home-owners gave different reasons for
lack of interest. Among homeowners, a lack of understanding and information about the types of
programs were key barriers to their interest in participating in a demand response program for their water
heater. Among renters who were not interested at any incentive level, the most common response, given
by more than two-fifths (44%), was that they did not own their home and would therefore need their
building owner to make that decision. While it is unclear whether or not building owner permission is a
true barrier, it is at least a perceived barrier that programs avoid through outreach directly to building
owners or their agents.
80% 78%83%
76%
ID MT OR WA
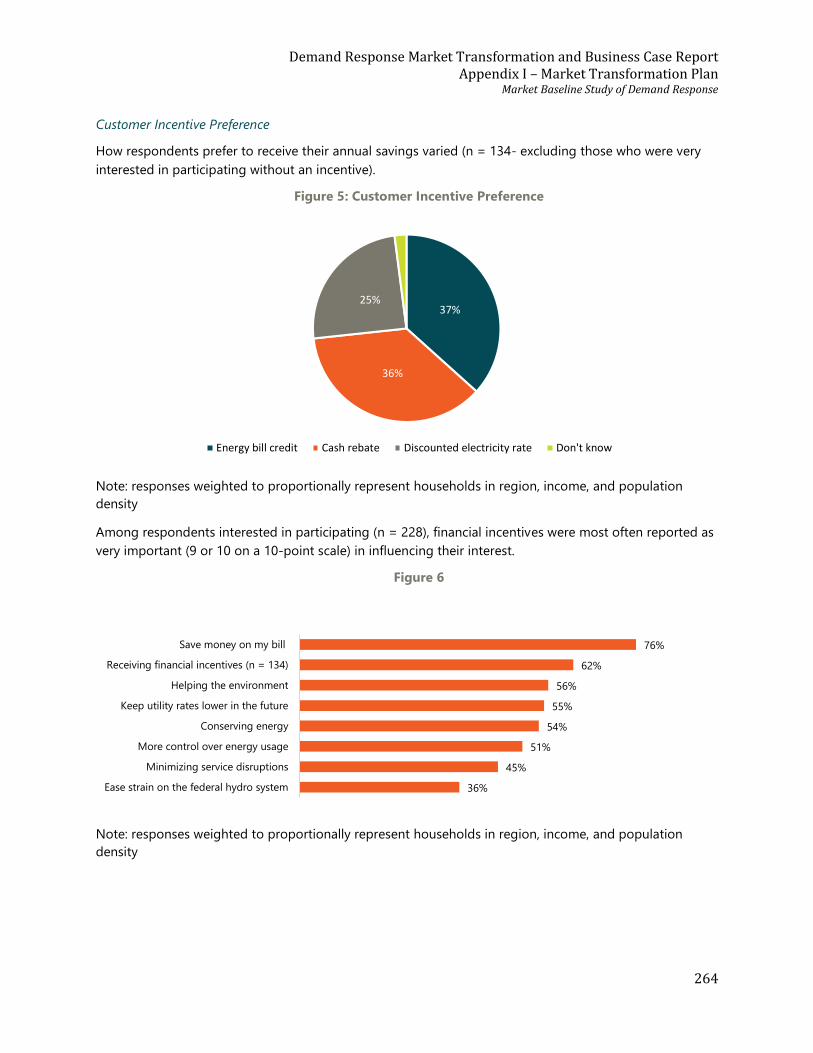
Demand Response Market Transformation and Business Case Report Appendix I – Market Transformation Plan
Market Baseline Study of Demand Response
264
Customer Incentive Preference
How respondents prefer to receive their annual savings varied (n = 134- excluding those who were very
interested in participating without an incentive).
Figure 5: Customer Incentive Preference
Note: responses weighted to proportionally represent households in region, income, and population
density
Among respondents interested in participating (n = 228), financial incentives were most often reported as
very important (9 or 10 on a 10-point scale) in influencing their interest.
Figure 6
Note: responses weighted to proportionally represent households in region, income, and population
density
37%
36%
25%
Energy bill credit Cash rebate Discounted electricity rate Don't know
36%
45%
51%
54%
55%
56%
62%
76%
Ease strain on the federal hydro system
Minimizing service disruptions
More control over energy usage
Conserving energy
Keep utility rates lower in the future
Helping the environment
Receiving financial incentives (n = 134)
Save money on my bill
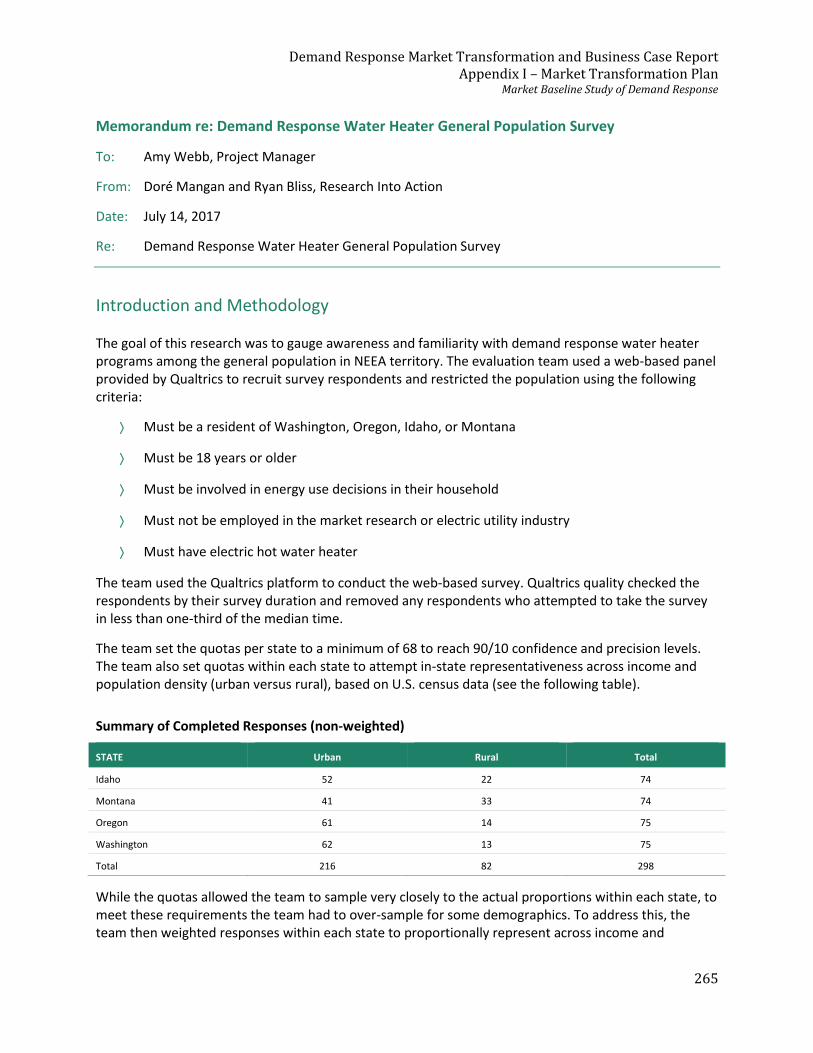
Demand Response Market Transformation and Business Case Report Appendix I – Market Transformation Plan
Market Baseline Study of Demand Response
265
Memorandum re: Demand Response Water Heater General Population Survey
To: Amy Webb, Project Manager
From: Doré Mangan and Ryan Bliss, Research Into Action
Date: July 14, 2017
Re: Demand Response Water Heater General Population Survey
Introduction and Methodology The goal of this research was to gauge awareness and familiarity with demand response water heater programs among the general population in NEEA territory. The evaluation team used a web-based panel provided by Qualtrics to recruit survey respondents and restricted the population using the following criteria:
Must be a resident of Washington, Oregon, Idaho, or Montana
Must be 18 years or older
Must be involved in energy use decisions in their household
Must not be employed in the market research or electric utility industry
Must have electric hot water heater
The team used the Qualtrics platform to conduct the web-based survey. Qualtrics quality checked the respondents by their survey duration and removed any respondents who attempted to take the survey in less than one-third of the median time.
The team set the quotas per state to a minimum of 68 to reach 90/10 confidence and precision levels. The team also set quotas within each state to attempt in-state representativeness across income and population density (urban versus rural), based on U.S. census data (see the following table).
Summary of Completed Responses (non-weighted)
STATE Urban Rural Total
Idaho 52 22 74
Montana 41 33 74
Oregon 61 14 75
Washington 62 13 75
Total 216 82 298
While the quotas allowed the team to sample very closely to the actual proportions within each state, to meet these requirements the team had to over-sample for some demographics. To address this, the team then weighted responses within each state to proportionally represent across income and
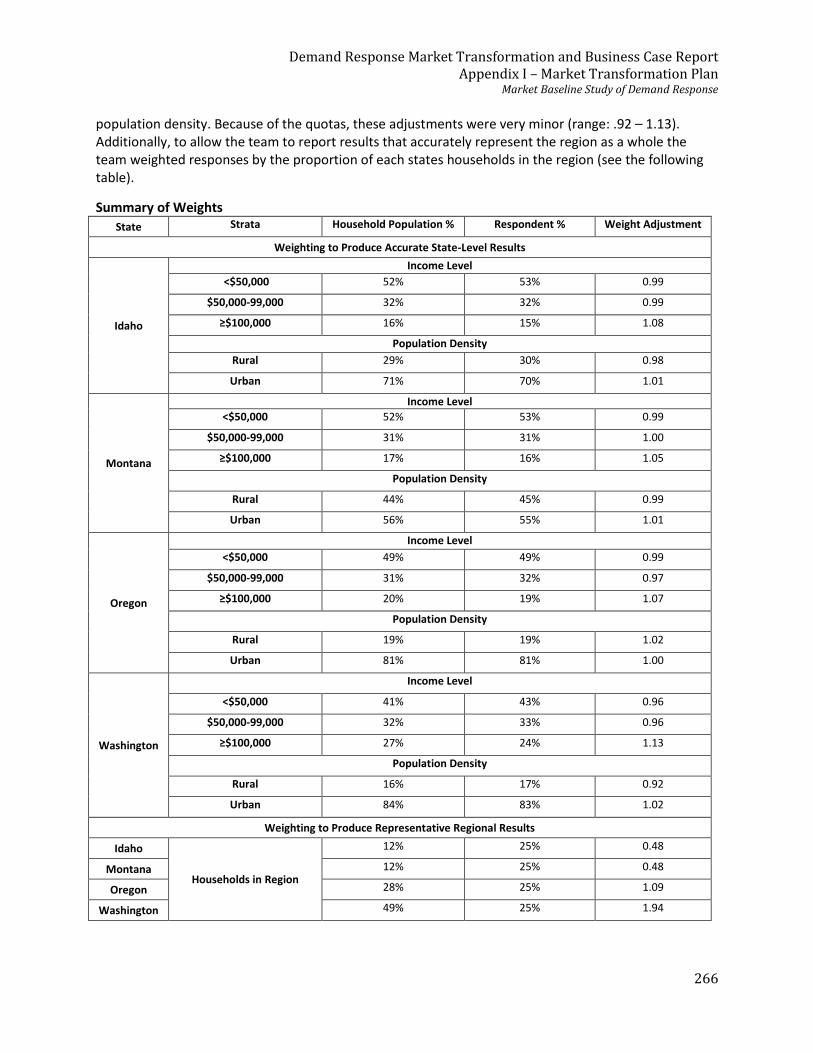
Demand Response Market Transformation and Business Case Report Appendix I – Market Transformation Plan
Market Baseline Study of Demand Response
266
population density. Because of the quotas, these adjustments were very minor (range: .92 – 1.13). Additionally, to allow the team to report results that accurately represent the region as a whole the team weighted responses by the proportion of each states households in the region (see the following table).
Summary of Weights
State Strata Household Population % Respondent % Weight Adjustment
Weighting to Produce Accurate State-Level Results
Idaho
Income Level
<$50,000 52% 53% 0.99
$50,000-99,000 32% 32% 0.99
≥$100,000 16% 15% 1.08
Population Density
Rural 29% 30% 0.98
Urban 71% 70% 1.01
Montana
Income Level
<$50,000 52% 53% 0.99
$50,000-99,000 31% 31% 1.00
≥$100,000 17% 16% 1.05
Population Density
Rural 44% 45% 0.99
Urban 56% 55% 1.01
Oregon
Income Level
<$50,000 49% 49% 0.99
$50,000-99,000 31% 32% 0.97
≥$100,000 20% 19% 1.07
Population Density
Rural 19% 19% 1.02
Urban 81% 81% 1.00
Washington
Income Level
<$50,000 41% 43% 0.96
$50,000-99,000 32% 33% 0.96
≥$100,000 27% 24% 1.13
Population Density
Rural 16% 17% 0.92
Urban 84% 83% 1.02
Weighting to Produce Representative Regional Results
Idaho
Households in Region
12% 25% 0.48
Montana 12% 25% 0.48
Oregon 28% 25% 1.09
Washington 49% 25% 1.94
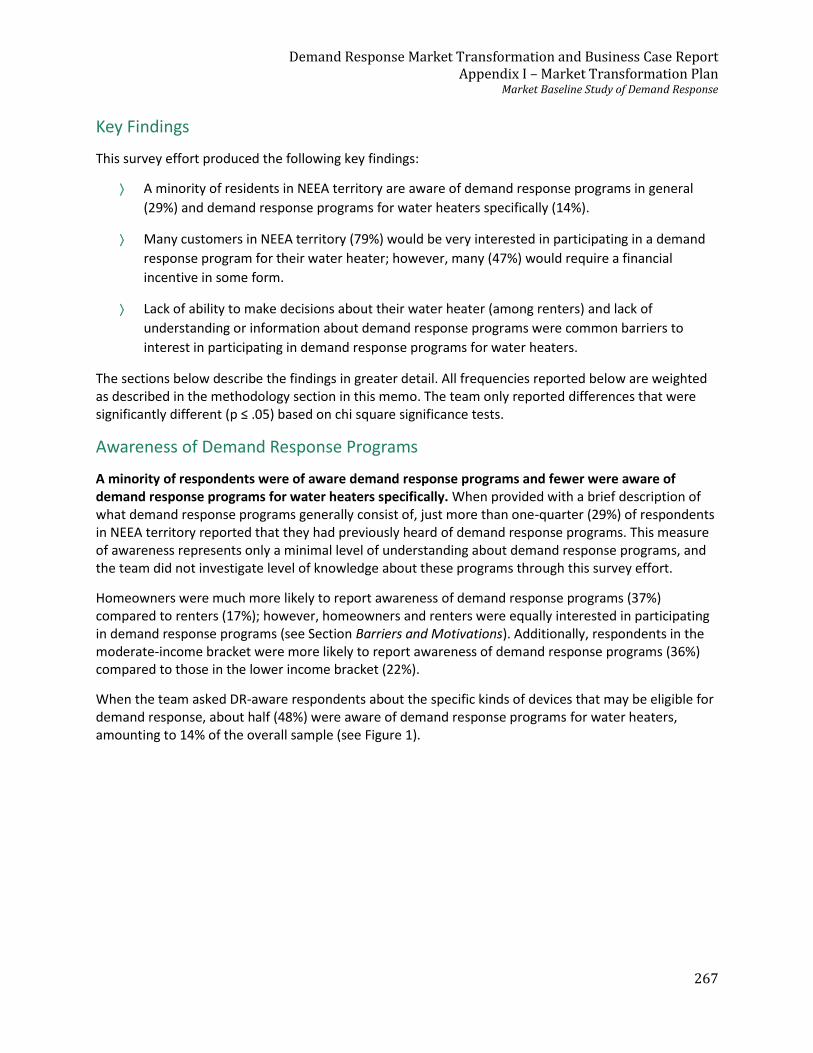
Demand Response Market Transformation and Business Case Report Appendix I – Market Transformation Plan
Market Baseline Study of Demand Response
267
Key Findings
This survey effort produced the following key findings:
A minority of residents in NEEA territory are aware of demand response programs in general
(29%) and demand response programs for water heaters specifically (14%).
Many customers in NEEA territory (79%) would be very interested in participating in a demand
response program for their water heater; however, many (47%) would require a financial
incentive in some form.
Lack of ability to make decisions about their water heater (among renters) and lack of
understanding or information about demand response programs were common barriers to
interest in participating in demand response programs for water heaters.
The sections below describe the findings in greater detail. All frequencies reported below are weighted as described in the methodology section in this memo. The team only reported differences that were significantly different (p ≤ .05) based on chi square significance tests.
Awareness of Demand Response Programs
A minority of respondents were of aware demand response programs and fewer were aware of demand response programs for water heaters specifically. When provided with a brief description of what demand response programs generally consist of, just more than one-quarter (29%) of respondents in NEEA territory reported that they had previously heard of demand response programs. This measure of awareness represents only a minimal level of understanding about demand response programs, and the team did not investigate level of knowledge about these programs through this survey effort.
Homeowners were much more likely to report awareness of demand response programs (37%) compared to renters (17%); however, homeowners and renters were equally interested in participating in demand response programs (see Section Barriers and Motivations). Additionally, respondents in the moderate-income bracket were more likely to report awareness of demand response programs (36%) compared to those in the lower income bracket (22%).
When the team asked DR-aware respondents about the specific kinds of devices that may be eligible for demand response, about half (48%) were aware of demand response programs for water heaters, amounting to 14% of the overall sample (see Figure 1).
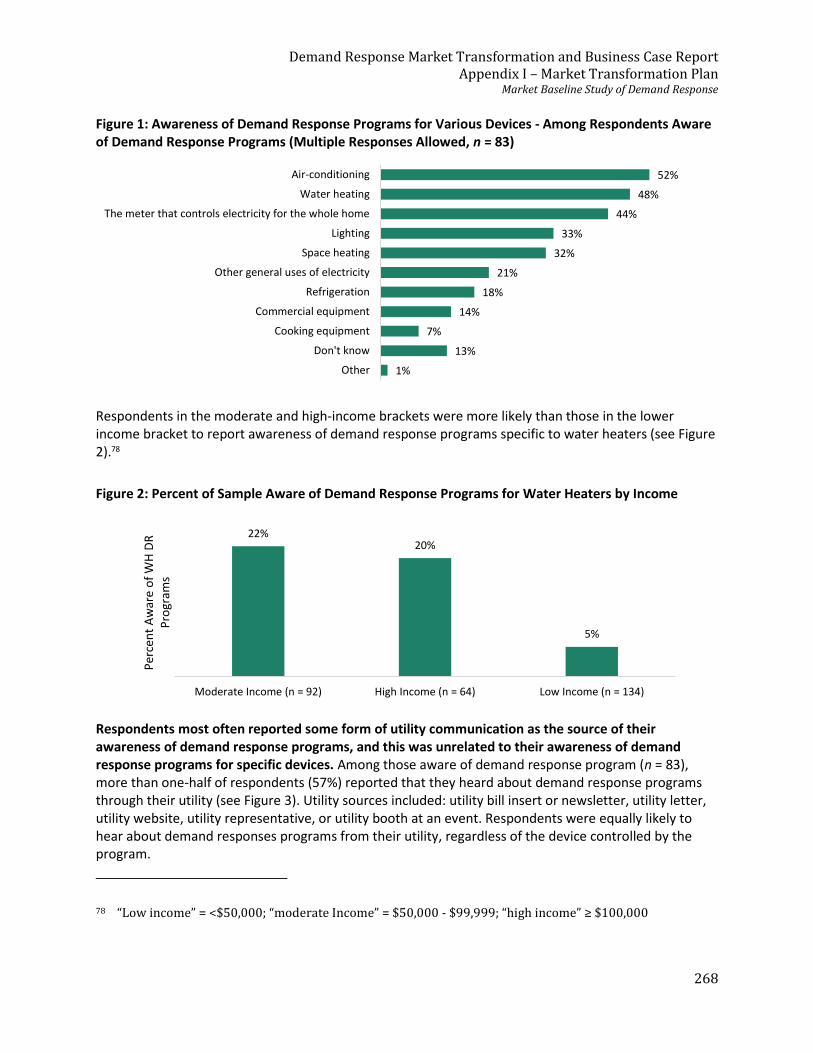
Demand Response Market Transformation and Business Case Report Appendix I – Market Transformation Plan
Market Baseline Study of Demand Response
268
Figure 1: Awareness of Demand Response Programs for Various Devices - Among Respondents Aware of Demand Response Programs (Multiple Responses Allowed, n = 83)
Respondents in the moderate and high-income brackets were more likely than those in the lower income bracket to report awareness of demand response programs specific to water heaters (see Figure 2).78
Figure 2: Percent of Sample Aware of Demand Response Programs for Water Heaters by Income
Respondents most often reported some form of utility communication as the source of their awareness of demand response programs, and this was unrelated to their awareness of demand response programs for specific devices. Among those aware of demand response program (n = 83), more than one-half of respondents (57%) reported that they heard about demand response programs through their utility (see Figure 3). Utility sources included: utility bill insert or newsletter, utility letter, utility website, utility representative, or utility booth at an event. Respondents were equally likely to hear about demand responses programs from their utility, regardless of the device controlled by the program.
78 “Low income” = <$50,000; “moderate Income” = $50,000 - $99,999; “high income” ≥ $100,000
1%
13%
7%
14%
18%
21%
32%
33%
44%
48%
52%
Other
Don't know
Cooking equipment
Commercial equipment
Refrigeration
Other general uses of electricity
Space heating
Lighting
The meter that controls electricity for the whole home
Water heating
Air-conditioning
22%20%
5%
Moderate Income (n = 92) High Income (n = 64) Low Income (n = 134)
Per
cen
t A
war
e o
f W
H D
R
Pro
gram
s
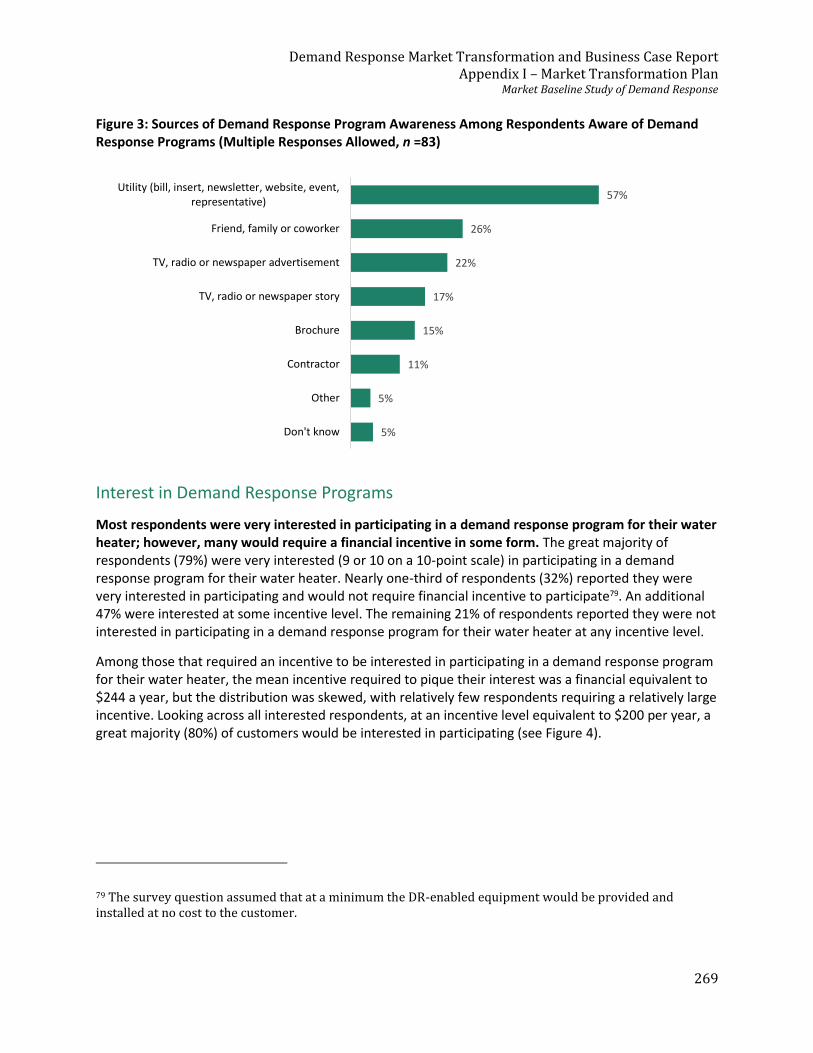
Demand Response Market Transformation and Business Case Report Appendix I – Market Transformation Plan
Market Baseline Study of Demand Response
269
Figure 3: Sources of Demand Response Program Awareness Among Respondents Aware of Demand Response Programs (Multiple Responses Allowed, n =83)
Interest in Demand Response Programs
Most respondents were very interested in participating in a demand response program for their water heater; however, many would require a financial incentive in some form. The great majority of respondents (79%) were very interested (9 or 10 on a 10-point scale) in participating in a demand response program for their water heater. Nearly one-third of respondents (32%) reported they were very interested in participating and would not require financial incentive to participate79. An additional 47% were interested at some incentive level. The remaining 21% of respondents reported they were not interested in participating in a demand response program for their water heater at any incentive level.
Among those that required an incentive to be interested in participating in a demand response program for their water heater, the mean incentive required to pique their interest was a financial equivalent to $244 a year, but the distribution was skewed, with relatively few respondents requiring a relatively large incentive. Looking across all interested respondents, at an incentive level equivalent to $200 per year, a great majority (80%) of customers would be interested in participating (see Figure 4).
79 The survey question assumed that at a minimum the DR-enabled equipment would be provided and installed at no cost to the customer.
5%
5%
11%
15%
17%
22%
26%
57%
Don't know
Other
Contractor
Brochure
TV, radio or newspaper story
TV, radio or newspaper advertisement
Friend, family or coworker
Utility (bill, insert, newsletter, website, event,representative)
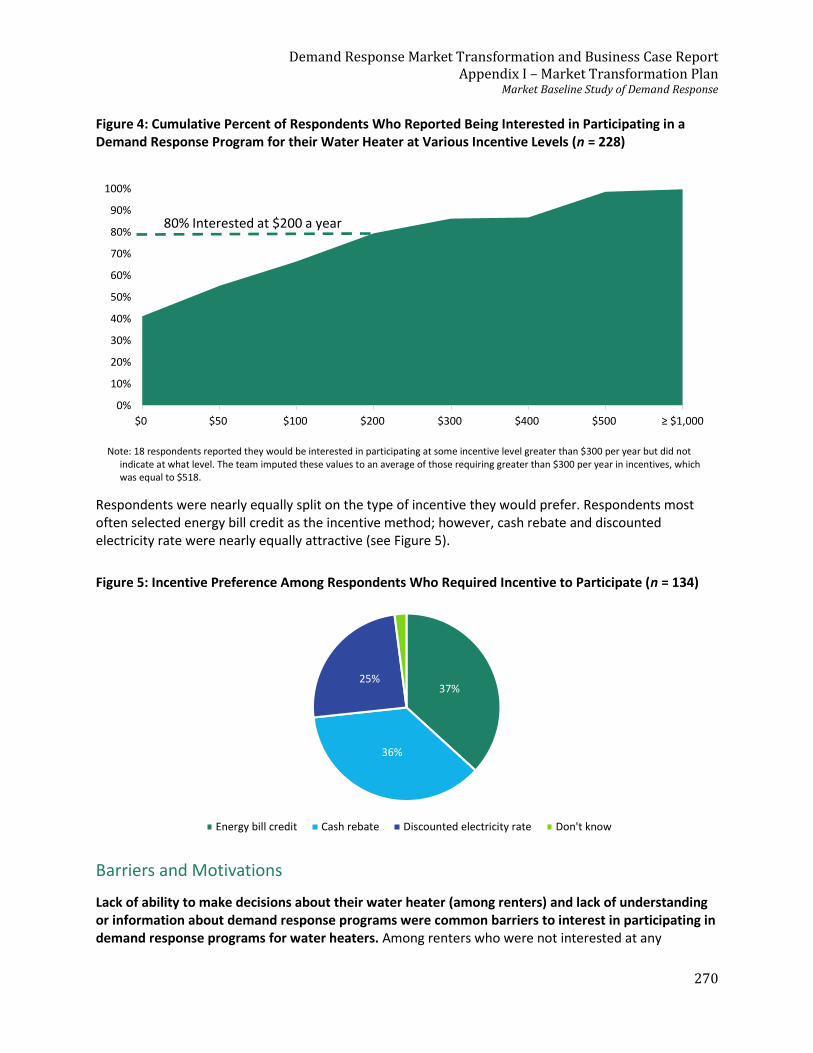
Demand Response Market Transformation and Business Case Report Appendix I – Market Transformation Plan
Market Baseline Study of Demand Response
270
Figure 4: Cumulative Percent of Respondents Who Reported Being Interested in Participating in a Demand Response Program for their Water Heater at Various Incentive Levels (n = 228)
Note: 18 respondents reported they would be interested in participating at some incentive level greater than $300 per year but did not
indicate at what level. The team imputed these values to an average of those requiring greater than $300 per year in incentives, which was equal to $518.
Respondents were nearly equally split on the type of incentive they would prefer. Respondents most often selected energy bill credit as the incentive method; however, cash rebate and discounted electricity rate were nearly equally attractive (see Figure 5).
Figure 5: Incentive Preference Among Respondents Who Required Incentive to Participate (n = 134)
Barriers and Motivations
Lack of ability to make decisions about their water heater (among renters) and lack of understanding or information about demand response programs were common barriers to interest in participating in demand response programs for water heaters. Among renters who were not interested at any
0%
10%
20%
30%
40%
50%
60%
70%
80%
90%
100%
$0 $50 $100 $200 $300 $400 $500 ≥ $1,000
80% Interested at $200 a year
37%
36%
25%
Energy bill credit Cash rebate Discounted electricity rate Don't know
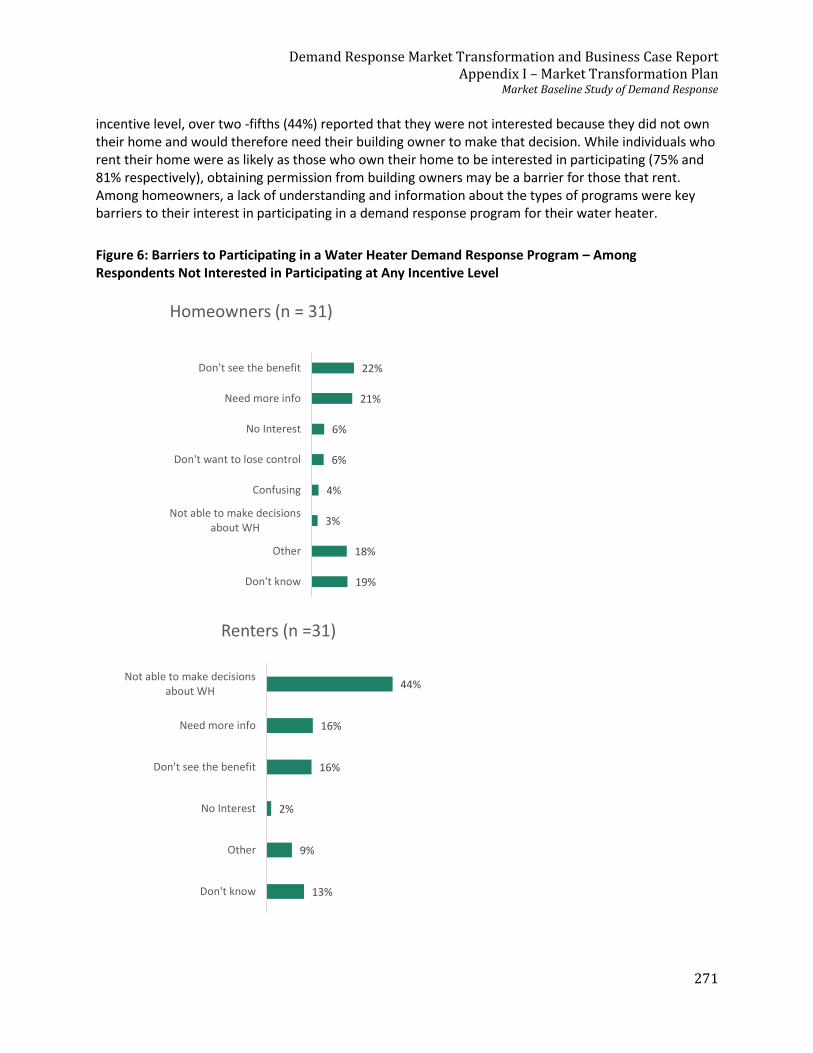
Demand Response Market Transformation and Business Case Report Appendix I – Market Transformation Plan
Market Baseline Study of Demand Response
271
incentive level, over two -fifths (44%) reported that they were not interested because they did not own their home and would therefore need their building owner to make that decision. While individuals who rent their home were as likely as those who own their home to be interested in participating (75% and 81% respectively), obtaining permission from building owners may be a barrier for those that rent. Among homeowners, a lack of understanding and information about the types of programs were key barriers to their interest in participating in a demand response program for their water heater.
Figure 6: Barriers to Participating in a Water Heater Demand Response Program – Among Respondents Not Interested in Participating at Any Incentive Level
19%
18%
3%
4%
6%
6%
21%
22%
Don't know
Other
Not able to make decisionsabout WH
Confusing
Don't want to lose control
No Interest
Need more info
Don't see the benefit
Homeowners (n = 31)
13%
9%
2%
16%
16%
44%
Don't know
Other
No Interest
Don't see the benefit
Need more info
Not able to make decisionsabout WH
Renters (n =31)
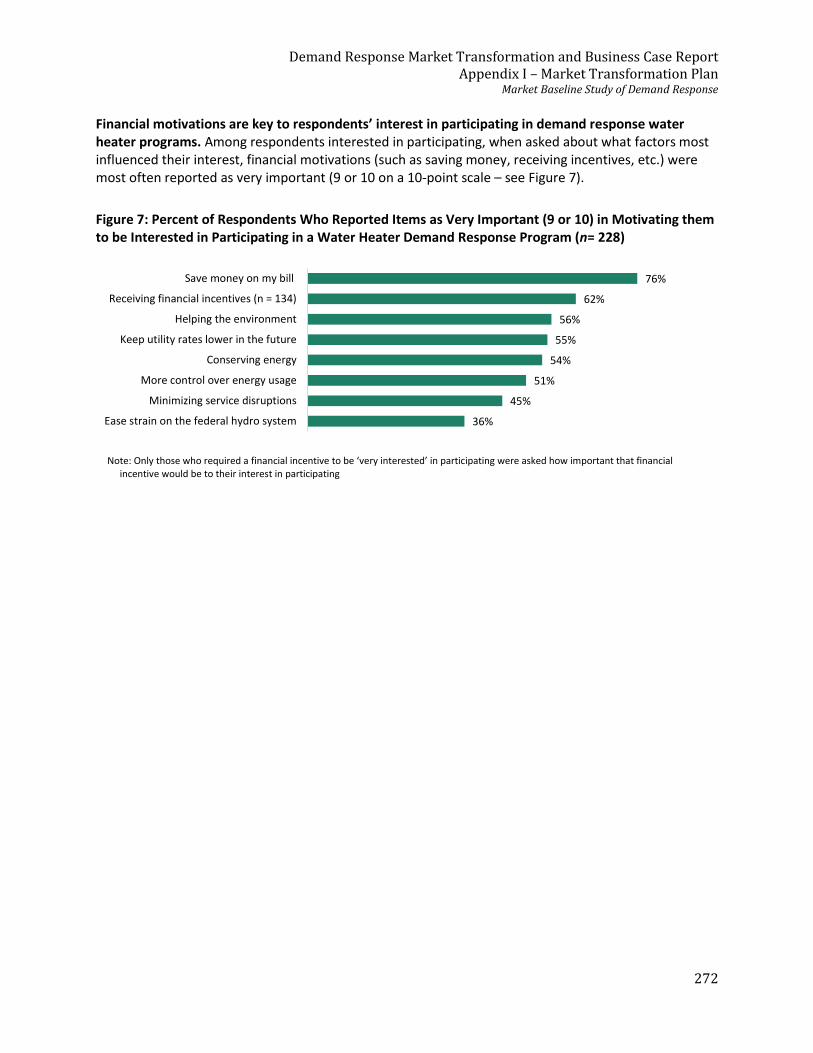
Demand Response Market Transformation and Business Case Report Appendix I – Market Transformation Plan
Market Baseline Study of Demand Response
272
Financial motivations are key to respondents’ interest in participating in demand response water heater programs. Among respondents interested in participating, when asked about what factors most influenced their interest, financial motivations (such as saving money, receiving incentives, etc.) were most often reported as very important (9 or 10 on a 10-point scale – see Figure 7).
Figure 7: Percent of Respondents Who Reported Items as Very Important (9 or 10) in Motivating them to be Interested in Participating in a Water Heater Demand Response Program (n= 228)
Note: Only those who required a financial incentive to be ‘very interested’ in participating were asked how important that financial
incentive would be to their interest in participating
36%
45%
51%
54%
55%
56%
62%
76%
Ease strain on the federal hydro system
Minimizing service disruptions
More control over energy usage
Conserving energy
Keep utility rates lower in the future
Helping the environment
Receiving financial incentives (n = 134)
Save money on my bill


![Classic XL V2- Type 90Front view Side view Top view Model size S SL XS M ML L LL XL XXL H [mm] [inch] 1385 54.53 1385 54.53 1385 54.53 2045 80.51 2045 80.51 2045 80.51 2045 80.51 2045](https://static.cupdf.com/doc/110x72/5ffc896ed78d2176ac478c13/classic-xl-v2-type-90-front-view-side-view-top-view-model-size-s-sl-xs-m-ml-l-ll.jpg)