3

Welcome message from author
This document is posted to help you gain knowledge. Please leave a comment to let me know what you think about it! Share it to your friends and learn new things together.
Transcript
3
2045
LONG RANGE TRANSPORTATION PLAN Pueblo Area Council of Governments
1.0 Overview 1
1.1 Introduction 1
1.2 FAST Act Guidelines 2
1.2.1 FAST Act Federal Guidelines 2 1.2.2 FAST Act & the PACOG MPO 4 1.2.3 PACOG’s Role in the Regional Transportation Plan Process 5
1.3 PACOG 2045 Regional Transportation Plan Goals 6
1.3.1 Planning Category 1: Safety 11 1.3.3 Planning Category 3: Congestion Relief 14 1.3.4 Planning Category 4: Freight Movement & Economic Vitality 16 1.3.5 Planning Category 5: System Reliability 16 1.3.6 Planning Category 6: Environmental Sustainability 17 1.3.7 Planning Category 7: Reduce Project Delivery Delays 18 1.3.8 Planning Category 8: Support Multimodal Transportation 19 1.4 Organization of This Document 20
2.0 Existing Transportation System 21
2.1 Roadway Element 21
2.1.1. Use of Roadways 21 2.1.2 Functional Classifications of Roadways 24 2.1.3 Scenic Byways 26 2.1.4 Commercial Vehicle Routes 28 2.1.5 Hazardous Materials Routes 28 2.1.6 Nuclear Materials Route 28 2.1.7 Pavement & Bridge Condition 31
2.2 Transit Element 34
2.2.1 City of Pueblo Bus System 34 2.2.2 Citi‐Lift Program 38 2.2.3 Amtrak Service 38 2.2.4 North‐South Intercity Rail Service Opportunities 39 2.2.5 Rocky Mountain Rail Authority & High‐Speed Rail Corridor 40 2.2.6 Light Rail / Trolley 40
2.3 Non‐Motorized Element 41
2.3.1 Introduction 41 2.3.2 Walk Mode 43 2.3.3 Bicycle Mode 43 2.3.4 Pueblo Bicycle Survey 47 2.3.5 Non‐Motorized Outreach 47
2.4 Aviation 49
2.5 Summary 50
3.0 Socioeconomic Profile 51
3.1 Regional Profile 51
3.1.1 Population 51 3.1.2 Housing 53 3.1.3 Income 54 3.1.4 Employment 56 3.1.5 The Communities of Pueblo County 58 3.1.6 Density of Population & Employment 60
3.2 Environmental Justice 62
3.2.1 Low‐ & Moderate‐Income Populations 63 3.2.2 Minority Status 64 3.2.3 Disabled Population & Households with No Vehicle 65 3.2.4 Environmental Justice Populations Summary 67
4.0 Environmental Profile 68
4.1 Introduction 68
4.2 Regulatory Framework for Environmental Considerations 68
4.2.1 The National Historic Preservation Act (1966) 68 4.2.2 The National Environmental Policy Act (NEPA, 1969) 69 4.2.3 The Clean Air Act (1970) 69 4.2.4 The Clean Water Act (1972) 70 4.2.5 The Endangered Species Act (1973) 70 4.2.6 Presidential Executive Order 11990 (1977) 71 4.2.7 Environmental Evaluation for Non‐Federal Projects 71 4.2.8 Natural Resource Management Plans 72
4.3 Approach to Environmental Planning 72
4.3.1 Regional Overview 72 4.3.2 The PACOG Corridor Vision Strategy 76
4.4 Transportation and Land Use Planning 78
4.4.1 Transportation /Land Use Planning Objectives 78 4.4.2 Framework for Land Use/Transportation Planning 79 4.4.3 Roadmap for the Future 80
4.5 Summary 82
5.0 Transportation Safety & Security 83
5.1 Introduction 83
5.2 Transportation System Safety 83
5.2.1 Federal Guidance 84 5.2.2 Colorado Transportation Safety Statistics 85 5.2.3 Safety Statistics in the Pueblo Region 86 5.2.4 Summary 90
5.3 Security 90
5.3.1 Security Goals – National 91 5.3.2 Security Goals – State of Colorado 91 5.3.3 PACOG’s Role in Security and Emergency Management 94 5.3.4 PACOG’s Policy Goals for Security 95 5.3.5 Key PACOG Transportation Assets 95 5.3.6 Freight & Aviation Security 96 5.3.7 Recommended Future Activities for PACOG 97
6.0 Mobility & Alternatives Analysis 99
6.1 Forecasting Methodologies 99
6.2 Roadway Analysis Approach 99
6.2.1 Roadway Capacity 100
6.3 Existing Roadway Congestion 102
6.4 Future Roadway Congestion 102
6.4.1 Future No Build Roadway Congestion 102 6.4.2 Future 2045 Fiscally Constrained Roadway Congestion 103 6.4.3. Future Congestion Summary of Findings 104
6.5 Addressing Roadway Congestion 105
6.6 Roadway Alternatives 105
7.0 Planning for Emerging Technologies 109
7.1 Introduction 109
7.2 Connected & Autonomous Vehicles 109
7.2.2 Connected & Autonomous Vehicles Defined 110
7.3 Federal & State Roles 112
7.3.1 Federal Action 112 7.3.2 State of Colorado Action 115 7.3.3 Consequences of CAVs 116
7.4 Transportation Network Companies 118
7.5 Electrification of Vehicles 119
7.6 Conclusion 120
8.0 Vision Plan 121
8.1 Introduction 121
8.2 Vision Plan Roadway Projects 121
8.2.1 The 10‐Year CIP and Transportation Improvement Program (TIP) 121 8.2.2 State & Federally Funded Projects 121 8.2.3 Locally Funded Projects 121 8.2.4 Developer Driven Projects 122
8.3 Vision Plan Transit Projects 125
8.4 Bikeway & Trail Improvements 126
8.4.1 Bikeway & Trails Planning 126 8.4.2 Bikeway & Trails Funding 128
9.0 Fiscally Constrained Plan 135
9.1 Funding Processes 135
9.1.1 Funding State & Federal Highway Projects & Programs 135 9.1.2 STIP 4P Funding Process 135
9.2 Funding Priorities 138
9.2.1 2021–2025 TIP Funding Priorities 138
9.2.2 10‐Year CIP Funding Priorities 141 9.2.3 Funding Priorities Beyond 2030 142
9.3 2045 Fiscally Constrained Highway Projects 143
9.4 Transit Funding Priorities 144
10.0 Congestion Management Process 145
10.1 Introduction 145
10.2 Background on Congestion Management 145
10.2.1 Definition 145 10.2.2 Interface with NEPA, the LRTP, & the TIP 145 10.2.3 Objectives for Operations 146 10.2.4 Congestion Management Process 146
10.3 Definition of Congestion 147
10.3.1 Levels of Service (Road Capacity) 147 10.3.2 Levels of Service (Intersection) 148
10.4 CMP Goals and Strategies 151
10.4.1 CMP Data Collection 151 10.4.2 Strategies & Solutions 152
10.5 PACOG Congestion Management Program 154
10.5.1 CMP Data Collection 156 10.5.2 CMP Corridor Plan 159
10.6 Summary 163
11.0 Freight & Commodity Flows 165
11.1 Freight in the Context of the Long Range Plan 165
11.1.1 Federal Guidance 165 11.1.2 Colorado Department of Transportation Goals for Freight Planning 166 11.1.3 PACOG Goals for Freight Planning 166
11.2 Freight Modal Profile 167
11.2.1 Colorado State Profile 167 11.2.2 Existing Conditions – Truck Freight in Pueblo County 168 11.2.3 Pueblo County – Rail Freight Existing Conditions 172 11.2.4 Pueblo County – Air Freight Existing Conditions 176
11.3 Commodity Flows by Freight Mode 176
11.3.1 Data Sources 176 11.3.2 National Freight Commodity Flows 177 11.3.3 State of Colorado Freight Commodity Flows 178 11.3.4 Pueblo County Trends 185
11.4 Freight Needs 187
11.4.1 Freight Needs – Truck 187 11.4.2 Freight Needs – Rail 187 11.4.3 Rail Corridor Preservation 187
11.5 Summary 188
12.0 Financial Plan 181
12.1 Introduction 181
12.2 Critical Funding Challenges 181
12.3 Federal Requirements for a Financial Plan 190
12.4 Plan Development 191
12.5 Funding Sources 191
12.7 Near‐Term Transportation Funding—the PACOG TIP 195
12.8 Transportation Revenue Forecasts through 2045 196
12.9 Future Transit Funding 197
12.10 Potential Future Revenue Sources 197
Appendices
Appendix A: Public Involvement
Appendix B: Demographic Forecasts
Appendix C: Coordinated Human Services Transportation Plan
Appendix D: Public Transportation Plan
Appendix E: Youth Transportation Plan
List of Figures
Figure 1.1: PACOG 3C Planning Area
Figure 1.2: PACOG Regional Transportation Planning Process
Figure 2.1: Mode Share by Year (2014–2018)
Figure 2.2: Pueblo County Commuter Flows
Figure 2.3: Roadways by Functional Classification
Figure 2.4: Frontier Pathways National Scenic and Historic Byway
Figure 2.5: Hazardous Materials Routes in Pueblo County
Figure 2.6: Nuclear Waste Routes in Pueblo County
Figure 2.7: Pueblo State Highways by Primary Drivability Life Class
Figure 2.8: Pueblo Transit System Route Map
Figure 2.9: Amtrak Passenger Rail Service near Pueblo in 2015
Figure 2.10: Pueblo Bicycle and Trails Map – Pueblo West
Figure 2.11: Pueblo Bicycle and Trails Map – City of Pueblo
Figure 3.1: Pueblo County Age Distribution
Figure 3.2: Pueblo County Housing Unit Growth Trends
Figure 3.3: Pueblo County Home Ownership
Figure 3.4: Pueblo County Median Home Value
Figure 3.5: Median Household Income of Select Colorado Metro Areas
Figure 3.6: Families with Incomes below Poverty Level (2015)
Figure 3.7 Job Growth (Percent Increase Over Prior Year)
Figure 3.8: Comparative Unemployment Rate Trends
Figure 3.9: Pueblo County Communities Summary Demographics
Figure 3.10: Communities in Pueblo County
Figure 3.11: Population Densities per Acre (2020)
Figure 3.12: Population Densities per Acre (2045)
Figure 3.13: Employment Densities per Acre (2020)
Figure 3.14: Employment Densities per Acre (2045)
Figure 3.15: Low‐ and Moderate‐Income Block Groups
Figure 3.16: Minority Population Block Groups
Figure 3.17: Percent of People with Disabilities Aged 16–64 Years by Block Groups
Figure 3.18: Percent of Households with No Vehicle Available by Block Groups
Figure 3.19 Census Block Groups Meeting Environmental Justice Criteria
Figure 4.1: Ecoregions and Major Drainages in Pueblo County
Figure 4.2: Biodiversity Significance of Pueblo County Potential Conservation Areas
Figure 4.3: Pueblo County Transportation Corridors
Figure 5.1: Fatalities by Travel Mode in Colorado (2014–2018)
Figure 5.2: Crash by Severity in Pueblo County (2014–2018)
Figure 5.3: Time of Day of Crashes in Pueblo County (2014–2018)
Figure 5.4: Pueblo County within the Homeland Security Region System
Figure 6.1: 2020 Base Year Scenario – PM Peak Volume to Capacity Ratio
Figure 6.2: 2045 No Build Scenario – PM Peak Volume to Capacity Ratio
Figure 6.3: 2045 Fiscally Constrained Scenario – PM Peak Volume to Capacity Ratio
Figure 6.4: 2040 Fiscally Constrained Plan – PM Peak Volume to Capacity Modeled Results
Figure 8.1: 2045 LRTP Vision Plan Pueblo Area Trails
Figure 8.2: 2045 LRTP Vision Plan – City of Pueblo and Pueblo West Bicycle Lanes and Routes
Figure 8.3: 2045 LRTP Vision Plan – City of Pueblo and Pueblo West Trails
Figure 8.4: 2045 LRTP Vision Plan – Pueblo County Trails
Figure 9.1: STIP Planning and Programming Process
Figure 9.2: How a Safety Issue Becomes a Project
Figure 9.3: Transportation Improvement Program Project Locations (2021–2025)
Figure 9.4: 2045 Planning Horizon Project Locations
Figure 10.1: Highway Capacity Manual Level of Service (LOS)
Figure 10.2: PACOG CMP Corridors
Figure 10.3: AM Peak Hour Congestion Level on CMP Corridors (2045)
Figure 10.4: PM Peak Hour Congestion Level on CMP Corridors (2045)
Figure 11.1: CDOT Freight Vision and Goals
Figure 11.2: Primary Freight Network in Colorado
Figure 11.3: Rail Line Ownership in Colorado
Figure 11.4: Primary Freight Routes in Pueblo County
Figure 11.5: Interstate 25 Truck Traffic in Pueblo County (2018 Volumes)
Figure 11.6: U.S. Highway 50 Truck Traffic in Pueblo County (2018 Volumes)
Figure 11.7: Rail Lines and Facilities in Pueblo County
Figure 11.8: Transportation Technology Center Trackage
Figure 11.9: National Freight Mode Share by Weight and Value (2020)
Figure 11.10: Colorado Freight Mode Share by Weight and Value (2020)
Figure 11.11: Mode Share for Freight Originating in Colorado by Weight (2020)
Figure 11.12: Mode Share for Freight Destined for Colorado by Weight (2020)
Figure 11.13: Mode Share for Colorado Intrastate Freight by Weight
Figure 11.14: Top 10 Commodities Shipped Into, Out Of, and Within Colorado by Weight (2020)
Figure 11.15: Top 10 Commodities Shipped Into, Out Of, and Within Colorado by Value (2020)
Figure 12.1: Representative Regional Transportation Funding Flows
List of Tables
Table 1.1: PACOG Goals Outline
Table 1.2: PACOG Performance Measures – Final Targets
Table 2.1: 5‐Year Commute Mode Share
Table 2.2: Commute Patterns in Pueblo County (2017)
Table 2.3: State Highway Centerline Miles and Conditions in Pueblo County
Table 2.4: Bridge Conditions for CDOT Facilities in Pueblo County
Table 2.5: Bridge Conditions in Pueblo County
Table 2.6: Pueblo Transit System Route Profiles
Table 2.7: Pueblo Transit System 2017 Average Ridership
Table 2.8: Pueblo Transit Fixed‐Route Vehicle Inventory (2017)
Table 2.9: Pueblo Transit System Fares (2020)
Table 3.1: Pueblo County Population Trends (1980–2045)
Table 3.2: Pueblo County Population by Race and Hispanic Origin
Table 3.3: Place of Work for Pueblo Residents (2000, 2010, and 2010)
Table 4.1: Land Use Categories
Table 4.2: Transportation Policy and Program Land Use Impacts
Table 4.3 Proposed Future Land Use Intensities
Table 5.1 Fatalities by Travel Mode in Colorado (2014–2018)
Table 5.2 Fatality Percentages by Travel Mode in Colorado (2014–2018)
Table 5.3 Crash by Severity in Pueblo County (2014–2018)
Table 5.4: Alcohol/Drugs Involved in Fatal Crashes in Pueblo County (2014–2018)
Table 5.5: Crashes by Type of Roadway and Severity (2014–2018)
Table 5.6: Crash Percentages by Type of Roadway and Severity (2014–2018)
Table 5.7: Crash Percentages by Type of Location and Severity (2014–2018)
Table 5.8 Time of Day of Crashes (2014–2018)
Table 6.1: PACOG Link Facility Type
Table 6.2: Model Link Capacity Look‐Up Table
Table 6.3: PM Peak Hour V/C Ratio Level of Service Equivalencies
Table 6.4: Comparison of 2020, 2045 No Build, and 2045 Fiscally Constrained Congestion VMT
Table 7.1: SAE Levels of Automation
Table 7.2: Topics in Automated Driving Systems: A Vision for Safety 2.0
Table 8.1: 2045 Vision Plan Roadway Improvements
Table 8.2: Non‐Motorized Facilities Plan
Table 8.3: 2045 Vision Plan Trail System Improvement Priorities
Table 9.1: Cycle for STIP Changes
Table 9.2: PACOG TIP Funding by Source (2021–2025)
Table 9.3: PACOG TIP Funding by Corridor (2021–2025)
Table 9.4: PACOG TIP Projects by Funding Year (2021–2025)
Table 9.5: 2045 Fiscally Constrained LRTP 10‐Year CIP Projects 2025–2030
Table 9.6: Additional 2045 Planning Horizon State/Federally Funded Projects Beyond 2030
Table 9.7: Transit Funding (2021–2027)
Table 10.1: Typical Roadway Speed, Flow, and Density Relationships
Table 10.2: Typical Daily Intersection Capacity Values
Table 10.3: PACOG Strategic Corridors
Table 10.4: 2040 Projected VMT on Strategic Corridors
Table 10.5: Congestion Management Plan Tools
Table 10.6: Interstate 25 Congestion Management Plan
Table 10.7: U.S. Highway 50 Congestion Management Plan
Table 11.1: Interstate 25 Truck Traffic in Pueblo County (2018 Volumes)
Table 11.2: U.S. Highway 50 Truck Traffic in Pueblo County (2018 Volumes)
Table 11.3: National Freight Mode Share by Weight and Value (2020)
Table 11.4: Colorado Shipments by Weight and Value (2020 and 2045)
Table 11.5: Mode Share for Freight Originating in Colorado by Weight (2020)
Table 11.6: Mode Share for Freight Destined for Colorado by Weight (2020)
Table 11.7: Mode Share for Colorado Intrastate Freight by Weight
Table 11.8: Top 10 Commodities Shipped Into, Out Of, and Within Colorado by Weight (2020)
Table 11.9: Top 10 Commodities Shipped To, From, and Within Colorado, Based on Value (2020)
Table 11.10: Pueblo County Shipments by Mode by Weight (2020 and 2045)
Table 11.11: Top Commodities from Pueblo County by Weight (2020 and 2045)
Table 11.12: Top Commodities to Pueblo County by Weight (2020 and 2045)
Table 12.1: PACOG TIP Funding SFY 2021–2024
Table 12.2: Estimate of Revenues by Major Program Area
Table 12.3: 2007 Funding Source Recommendations
List of Acronyms
4P Project Priority Programming Process
AADT Average Annual Daily Traffic
AAR Association of American Railroads
AASHTO American Association of State Highway and Transportation Officials
ACS American Community Survey
ADA Americans with Disabilities Act
AIP Airport Industrial Park
APC Automatic Passenger Counter
ASOS Automated Surface Observing Systems
BE Bridge Enterprise
BMP Best Management Practices
BNSF Burlington Northern Santa Fe
BOP Bustang Outrider Program
BRO Bridge Off System
BTS Bureau of Transportation Statistics
BUILD Better Utilizing Investments to Leverage Development
CAAA Clean Air Act Amendments
CAC Citizens Advisory Committee
C&W Colorado & Wyoming Railroad Company
CAT Connected and Autonomous Technology
CAV Connected and Autonomous Vehicle
CBD Central Business District
CDBG Community Development Block Grant
CDC Centers for Disease Control and Prevention
CDEM Colorado Division of Emergency Management
CDOT Colorado Department of Transportation
CDPHE Colorado Department of Public Health and Environment
CFR Code of Federal Regulations
CIAC Colorado Information Analysis Center
CIP Capital Improvements Program
CLG Certified Local Government
CMAQ Congestion Mitigation Air Quality
CMP Congestion Management Process
CMS Congestion Management System
CNG Compressed Natural Gas
CNHP Colorado Natural Heritage Program
COG Council of Government
COVID-19 Corona Virus Disease 2019
CPW Colorado Parks and Wildlife
CRISI Consolidated Rail Infrastructure and Safety Improvements
C.R.S. Colorado Revised Statutes
CY Calendar Year
DOD Department of Defense
DOLA Department of Local Affairs
DOT Department of Transportation
DSRC Dedicated Short-Range Communication
DTR Division of Transit & Rail
EDC Every Day Counts
EIS Environmental Impact Statement
EJ Environmental Justice
ER Emergency Relief
ESA Endangered Species Act
ESF Emergency Support Function
EV Electric Vehicle
FAA Federal Aviation Administration
FAF Freight Analysis Framework
FAF4 FAF Version 4
FAR Floor Area Ratio
FAST Fixing America’s Surface Transportation
FASTER Funding Advancement for Surface Transportation and Economic Recovery
FBO Fixed-Base Operator
FEIS Final Environmental Impact Statement
FFY Federal Fiscal Year
FHWA Federal Highway Administration
FMVSS Federal Motor Vehicle Safety Standards
FRA Federal Railroad Administration
FREX Front Range Express
FRPR Front Range High Speed Passenger Rail
FSM FASTER Safety Mitigation
FTA Federal Transit Administration
FY Fiscal Year
GDP Gross Domestic Product
GHG Greenhouse Gas
GIS Geographic Information System
GPS Global Positioning System
HARP Historic Arkansas River Project
HCM Highway Capacity Manual
HHTS Household Travel Survey
HPTE High-Performance Transportation Enterprise
HSIP Highway Safety Improvement Program
HUD Housing and Urban Development
HUTF Highway Users Tax Fund
I-25 Interstate 25
I2V Infrastructure-to-Vehicle
ILS Instrumental Landing System
IoR Internet of Roads
ISTEA Intermodal Surface Transportation Efficiency Act
ITS Intelligent Transportation Systems
LEDPA Least Environmentally Damaging Practicable Alternative
LEHD Longitudinal Employer-Household Dynamics
LNG Liquefied Natural Gas
LODES LEHD Origin-Destination Employment Statistics
LOS Level of Service
LPHA Local Public Health Agency
LRP Long Range Plan
LRTP Long Range Transportation Plan
MACC Multi-Agency Coordination Center
MAP-21 Moving Ahead for Progress in the 21st Century Act
MERS Middle East Respiratory Syndrome
MMOF Multimodal Options Fund
MOC Miles of Centerline
MPL Metropolitan Planning
MPO Metropolitan Planning Organization
MS4 Municipal Separate Storm Sewer System
NAAQS National Ambient Air Quality Standards
NAFTA North American Free Trade Agreement
NDB Non-Directional Beacon
NEPA National Environmental Policy Act
NEXRAD Next-Generation Radar
NGV Natural Gas Vehicle
NHFP National Highway Freight Program
NHPA National Historic Preservation Act
NHPP National Highway Performance Program
NHS National Highway System
NIMS National Incident Management System
NPDES National Pollutant Discharge Elimination System
NRHP National Register of Historic Places
OTIS Online Traffic Information System
PACE Pueblo Active Community Environments
PACOG Pueblo Area Council of Governments
PD Policy Directive
PDLC Primary Drivability Life Class
PDPHE Pueblo Department of Public Health and Environment
PDO Property Damage Only
PEDCO Pueblo Economic Development Corporation
PEL Planning and Environmental Linkages
PL Planning
PSA Public Service Announcement
PUB Pueblo Memorial Airport
RMRA Rocky Mountain Rail Authority
ROW Right-of-Way
RPC Regional Planning Commission
RRX Railroad Crossing
RTP Regional Transportation Plan
RUC Road User Charge
SAE Society of Automotive Engineers
SAFETEA-LU Safe, Accountable, Flexible, Efficient Transportation Equity Act
SARS Severe Acute Respiratory Syndrome
SB Senate Bill
SCTG Standard Category of Transported Goods
SEC/VEH Seconds/Vehicle
SEOP State Emergency Operations Plan
SFY State Fiscal Year
SH State Highway
SIP State Implementation Plan
SOV Single Occupancy Vehicle
SPR State Planning and Research
SRDA Senior Resource Development Agency
STBG Surface Transportation Block Group
STIP Statewide Transportation Improvement Program
STP Surface Transportation Program
STRACNET Strategic Rail Corridor Network
STRAHNET Strategic Highway Network
SWP Statewide Transportation Plan
TAC Transportation Advisory Committee
TAP Transportation Alternatives Program
TAZ Traffic Analysis Zone
TDM Travel Demand Management
TEA-21 Transportation Equity Act for the 21st Century
TIGER Transportation Investment Generating Economic Recovery
TIP Transportation Improvement Program; Transportation Improvement Plan
TNC Transportation Network Company
TOC Transportation Operations Center
TOD Transit Oriented Development
TPR Transportation Planning Region
TRACAB Terminal Radar Approach Control in Tower Cab
TSA Transportation Security Administration
TSM Transportation System Management
TTC Transportation Technical Committee
TTCI Transportation Technology Center, Inc.
UP Union Pacific
USACE U.S. Army Corps of Engineers
USDOT United States Department of Transportation
USFWS U.S. Fish and Wildlife Service
UTPD Urban Transportation Planning Division
UZA Urbanized Area
V2I Vehicle-to-Infrastructure
V2X Vehicle to Everything
V&S Victoria & Southern
V/C Volume-to-Capacity
VMT Vehicle Miles Traveled
VOR Very High-Frequency Omni-Directional Range
VPD Vehicles Per Day
PACOG Moves the Region 2045 LRTP April 2021 | 1
1.0 Overview
1.1 Introduction
The regulatory purpose of the Pueblo Area Council of Governments (PACOG) 2045 Long Range Transportation Plan (LRTP) is to update the previous 2040 LRTP using guidance from the recently released federal legislation Fixing America’s Surface Transportation (FAST) Act. The FAST Act authorized $305 billion over fiscal years 2016 through 2020 for highway; highway and motor vehicle safety; public transportation; motor carrier safety; hazardous materials safety; rail; and research, technology, and statistics programs. The FAST Act maintains federal focus on safety, keeps intact the structure of the various highway-related programs, continues efforts to streamline project delivery, and, for the first time, provides a dedicated source of federal dollars for freight projects.1
The following brief history of recent federal transportation acts highlights the evolution of these important pieces of legislation.
The Intermodal Surface Transportation Efficiency Act (ISTEA) of 1991 posed a major change to transportation planning and policy by presenting an intermodal approach to highway and transit funding with collaborative planning requirements, giving significant additional powers to metropolitan planning organizations. It expired in 1997.
The Transportation Equity Act for the 21st Century (TEA-21) followed in 1998.
The Safe, Accountable, Flexible, Efficient Transportation Equity Act: A Legacy for Users (SAFETEA-LU), the next iteration of transportation funding, passed in 2005.
Moving Ahead for Progress in the 21st Century (MAP-21) passed in 2012. MAP-21 is the first U.S. transportation legislation to ask states and Metropolitan Planning Organizations (MPOs) to develop specific performance-based planning measures
··················· 1 “Fixing America's Surface Transportation Act,” Federal
Highway Administration, US Department of
for use with their regional goals and objectives.
The FAST Act (2015) continues the use of performance-based planning measures for use with regional goals and objectives.
To begin the process of long range planning, a transportation vision for the region is developed, addressing a set of goals framed by FAST Act legislation and enhanced and localized by the MPO. A long range plan (LRP) is the only comprehensive effort by the MPO that addresses a 20- to 25-year extent, a fact that makes it valuable as a roadmap for the region. Much of this value comes from leveraging the knowledge of residents and decision makers in the region regarding mobility needs. Residents are well aware that as federal requirements evolve, the region must evolve with them; hence care is taken to address the new requirements set by the FAST Act.
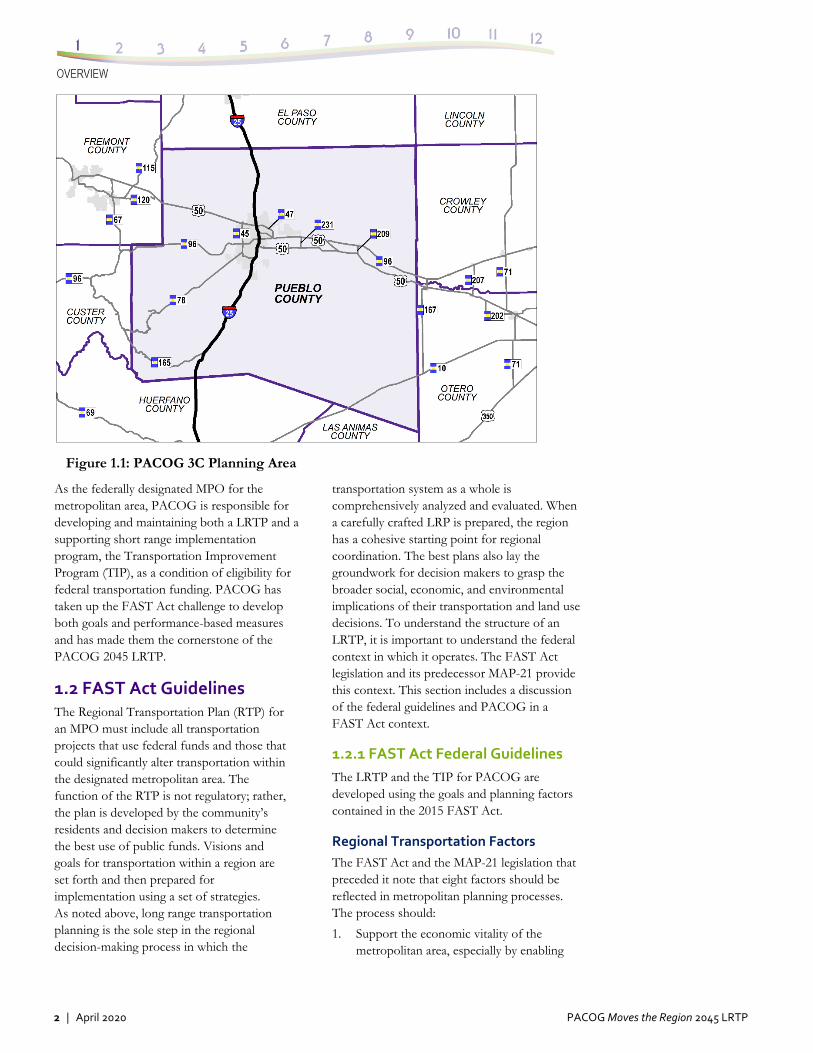
The PACOG region encompasses all of Pueblo County as shown in Figure 1.1. The planning area contains the population centers of Pueblo, Pueblo West, Colorado City, Beulah Valley, Avondale, Boone, and other municipalities and unincorporated areas. The City of Pueblo dominates the MPO with a population totaling over 160,000 people. Located at the confluence of the Arkansas River and Fountain Creek, it has been an important crossroads for transportation and trading for more than 150 years, making it the economic hub of southeastern Colorado. Pueblo is also an important city in Colorado’s Front Range Urban Corridor. The Historic Arkansas River Project (HARP) is a notable river walk in the Union Avenue Historic Commercial District of Pueblo. Over the last 20 years, the region’s population has increased, and its economy has become more diverse. Interstate-25 (I-25) and U.S. Highway 50 are the key connections to other Colorado cities and to the nation.
Transportation, last modified December 5, 2019, https://www.fhwa.dot.gov/fastact/.
2 | April 2020 PACOG Moves the Region 2045 LRTP
Figure 1.1: PACOG 3C Planning Area
As the federally designated MPO for the metropolitan area, PACOG is responsible for developing and maintaining both a LRTP and a supporting short range implementation program, the Transportation Improvement Program (TIP), as a condition of eligibility for federal transportation funding. PACOG has taken up the FAST Act challenge to develop both goals and performance-based measures and has made them the cornerstone of the PACOG 2045 LRTP.
1.2 FAST Act Guidelines The Regional Transportation Plan (RTP) for an MPO must include all transportation projects that use federal funds and those that could significantly alter transportation within the designated metropolitan area. The function of the RTP is not regulatory; rather, the plan is developed by the community’s residents and decision makers to determine the best use of public funds. Visions and goals for transportation within a region are set forth and then prepared for implementation using a set of strategies. As noted above, long range transportation planning is the sole step in the regional decision-making process in which the
transportation system as a whole is comprehensively analyzed and evaluated. When a carefully crafted LRP is prepared, the region has a cohesive starting point for regional coordination. The best plans also lay the groundwork for decision makers to grasp the broader social, economic, and environmental implications of their transportation and land use decisions. To understand the structure of an LRTP, it is important to understand the federal context in which it operates. The FAST Act legislation and its predecessor MAP-21 provide this context. This section includes a discussion of the federal guidelines and PACOG in a FAST Act context.
1.2.1 FAST Act Federal Guidelines
The LRTP and the TIP for PACOG are developed using the goals and planning factors contained in the 2015 FAST Act.
Regional Transportation Factors
The FAST Act and the MAP-21 legislation that preceded it note that eight factors should be reflected in metropolitan planning processes. The process should:
1. Support the economic vitality of the metropolitan area, especially by enabling
PACOG Moves the Region 2045 LRTP April 2021 | 3
global competitiveness, productivity, and efficiency.
2. Increase the safety of the transportation system for motorized and non-motorized users.
3. Increase the security of the transportation system for motorized and non-motorized users.
4. Increase the accessibility and mobility of people and freight.
5. Protect and enhance the environment, promote energy conservation, improve the quality of life, and promote consistency between transportation improvements and state and local planned growth and economic development patterns.
6. Enhance the integration and connectivity of the transportation system, across and between modes for people and freight.
7. Promote efficient system management and operation.
8. Emphasize the preservation of the existing transportation system.
The FAST Act is also linked to the Clean Air Act Amendments (CAAA) of 1990. The CAAA recast the planning function to confirm that transportation planning will help, not hinder, the region in meeting federal air quality standards. It encourages reduced auto emissions and fewer trips by single-occupant vehicles, and it promotes the use of alternative transportation modes, including transit, bicycling, and walking, as a viable part of the transportation system. Making receipt of all federal funding dependent on a region’s ability to meet air quality standards reinforces the linkage between transportation planning and federal air quality standards.
Requirements within the FAST Act similarly are linked to other federal legislation, namely the 1964 Civil Rights Act. Title VI of the 1964 Civil Rights Act (42 U.S.C. 2000d-1) states, “No person in the United States shall, on the ground of race, color, or national origin, be excluded from participation in, be denied the benefits of, or be subjected to discrimination under any program or activity receiving Federal financial assistance.” Title VI bars intentional discrimination as well as disparate impact discrimination (i.e., a neutral policy or practice
that has a disparate impact on protected groups). In order to address Title VI for federally funded projects, including transportation infrastructure improvements, presidential Executive Order 12898 (1994) directs each federal agency to make Environmental Justice (EJ) part of its mission. To implement this executive order, the United States Department of Transportation (USDOT) directs its funding recipients to address the following fundamental EJ principles:
Avoid, minimize, or mitigate disproportionately high and adverse human health and environmental effects, including social and economic effects, on minority populations and low-income populations.
Ensure the full and fair participation by all potentially affected communities in the transportation decision-making process.
Prevent the denial of, reduction in, or significant delay in the receipt of benefits by minority and low-income populations.
One important addition to the LRTP process is the launch by MAP-21 and the continuation under the FAST Act of a performance-based approach to transportation planning. In this round of the long-range planning cycle the development of goals includes setting concrete improvement targets for each area of planning. In the future, regional investments in the TIP will be tied to state and regional performance targets in key areas of safety, condition, mobility, congestion, freight, and asset management. The process of performance management is evolving as performance data becomes available and guidance on federal regulations is issued. The LRTP process is a continuing cycle of update activities that accommodate changes in federal and state performance measures and targets. In the long run, performance-based planning leads to more transparent decision-making and more efficient investments and will help move toward the region’s vision for the future.
Notably, the FAST Act applies performance-based measurement solely at the programmatic level rather than at the project level and does not generally link performance measures and targets to funding decisions. The law's emphasis on transparency and accountability is commendable,
4 | April 2020 PACOG Moves the Region 2045 LRTP
and it should be viewed as a first step toward a larger performance-based funding system.
PACOG has begun the performance management process by:
Setting metrics for performance of the LRTP transportation goals, where applicable.
Establishing a baseline year, 2020, upon which comparative metrics from future years will be measured.
Regional Transportation Plan Goals
There are eight planning categories for goal setting, seven consistent with the FAST Act and previous legislation plus an eighth category, multimodal transportation, added by PACOG staff. Each category and its supporting goal are described as follows:
1. Safety: To achieve a significant reduction in traffic fatalities and serious injuries on all public roads.
2. Infrastructure Condition: To maintain the highway infrastructure asset system in a state of good repair.
3. Congestion Reduction: To achieve a significant reduction in congestion on the National Highway System (NHS).
4. System Reliability: To improve the efficiency of the surface transportation system.
5. Freight Movement and Economic Vitality: To improve the national freight network, strengthen the ability of rural communities to access national and international trade markets, and support regional economic development.
6. Environmental Sustainability: To enhance the performance of the transportation system while protecting and enhancing the natural environment.
7. Reduced Project Delivery Delays: To reduce project costs, promote jobs and the economy, and expedite the movement of people and goods by accelerating project completion through eliminating delays in the project development and delivery process,
including reducing regulatory burdens and improving agencies’ work practices.
8. Multimodal Transportation: To invest in a wide range of non-motorized travel options and connectivity, with an emphasis on public health.
Using these eight categories, PACOG developed concrete goals and performance measures consistent with a focus on metrics and localized to the region. These goals are detailed below in Section 1.3 of the report. They also form the framework of the 2045 LRTP.
Regional Transportation Plan Emphasis Areas
The FAST Act builds on the program structure and reforms of MAP-21, including a continued focus on accelerating project delivery and the addition of three new planning emphasis areas. The FAST Act:
1. Adds a new freight formula and expands the national freight network.
2. Adds a new discretionary program for nationally significant freight and highway projects.
3. Provides a new tribal self-governance option.
In the following sections of this chapter, this guidance from the FAST Act for MPOs will be referenced and expanded. The guidance has provided a framework for the PACOG planning process and has served as an outline for the generation of PACOG-specific LRTP goals.
1.2.2 FAST Act & the PACOG MPO
PACOG is the MPO, a federal designation under Title 23 United States Code, Section 134 [23 U.S.C. 134], and Transportation Planning Region (TPR), a state designation under Colorado Revised Statutes Title 43, Article 1, Part 11 (C.R.S. 43-1-1101–1105), for the Pueblo County region. Overall transportation policy, plan adoption, and program approval are the responsibility of the elected officials of the PACOG Board of Directors. They are also responsible for implementing the metropolitan transportation planning process.
PACOG Moves the Region 2045 LRTP April 2021 | 5
Under the terms of an annual delegation agreement with the City of Pueblo and PACOG, employees assigned to the Urban Transportation Planning Division (UTPD) function as the professional staff for the regional transportation planning functions of the PACOG MPO/TPR. The cost of the UTPD operation is supported entirely by a Consolidated Planning Grant consisting of 82.79 percent federal funds and 17.21 percent local matching funds. Funding is provided by the Federal Highway Administration (FHWA) and Federal Transit Administration (FTA) to the Colorado Department of Transportation (CDOT), which distributes the funds to the MPO. Through a collaborative process, distribution has been established that is fair and equitable to all MPOs through Colorado based on population shares from the most recent U.S. Census.
The requirement for metropolitan planning is established under the requirements of 23 U.S.C. 134. To carry out the transportation planning process required by this section, an MPO shall be designated for each urbanized area with a population of more than 50,000 individuals by agreement between the governor and units of general-purpose local government that together represent at least 75 percent of the affected population (including the central city or cities as defined by the Bureau of the Census).
Transportation planning is a process that is used to balance the interrelated areas of mobility, accessibility, land use, socioeconomics, and ecological conditions to improve the quality of life for the residing area citizens. In order to anticipate and respond to the ever-changing transportation needs of people and goods moving throughout the region, the process is a coordinated effort between federal, state, and local governments, as well as private transportation providers.
The Pueblo area transportation system plays an important role in the local economy and community. It provides citizens with access to basic services, allows individuals to travel into and out of the region, and serves as a means to boost the local economy. Without continued investment in transportation, the Pueblo area would no longer be able to sustain its residents
and workers. This 2045 plan looks at all of these transportation issues and continues the development of a safe and efficient multimodal transportation system for all who travel within the region.
1.2.3 PACOG’s Role in the Regional Transportation Plan Process
Introduction to the Regional Transportation Plan at PACOG
The federally mandated metropolitan transportation plan refers to the official multimodal transportation plan addressing a no less than 20-year planning horizon that is developed, adopted, and updated by the MPO through the metropolitan transportation planning process. This document serves as the official transportation plan for both the State of Colorado and for the federal government.
The Pueblo Area Regional Transportation Plan is a 25-year plan for the development of transportation programs and projects within the Pueblo Area. It identifies the existing conditions for each of the transportation modes and identifies the need for and location of future facilities. The Preferred Plan sets out a strategy to meet the transportation goals of the region between 2020 and 2045, and the Fiscally Constrained Plan applies financial constraints to that same strategy. The LRTP also includes the Coordinated Public Transit – Human Services Transportation Plan, prepared as a locally developed, coordinated public transit–human services transportation plan to assure Pueblo’s eligibility for projects funded through three programs introduced initially as part of the MAP-21: Urbanized Area Formula (Section 5307), Enhanced Mobility of Seniors and Individuals with Disabilities (Section 5310), and Rural Area Formula Grants (Section 5311).
The LRTP is developed by PACOG in cooperation with the jurisdictions and agencies responsible for development and maintenance of the transportation system. These jurisdictions and agencies include:
The City of Pueblo Pueblo County Pueblo West Metropolitan District The Pueblo Memorial Airport CDOT Region 2
6 | April 2020 PACOG Moves the Region 2045 LRTP
CDOT Division of Transportation Development
CDOT Office of Financial Management and Budget
The plan process, scope, initial results, and assumptions are developed in collaboration with City and County staff and are reviewed by the PACOG Transportation Advisory Committee (TAC), which comprises the Transportation Technical Committee (TTC) and the Citizens Advisory Committee (CAC).
Regional Transportation Plan Process
The LRP process is cyclical in nature and occurs every five years. At each five-year juncture, a revised future scenario year is established and an updated vision and set of goals are sought for the region. This visioning involves citizens, public agency staff, decision makers, private industry leaders and others. The many viewpoints ensure that the transportation needs of the broad spectrum of residents of a region are considered.
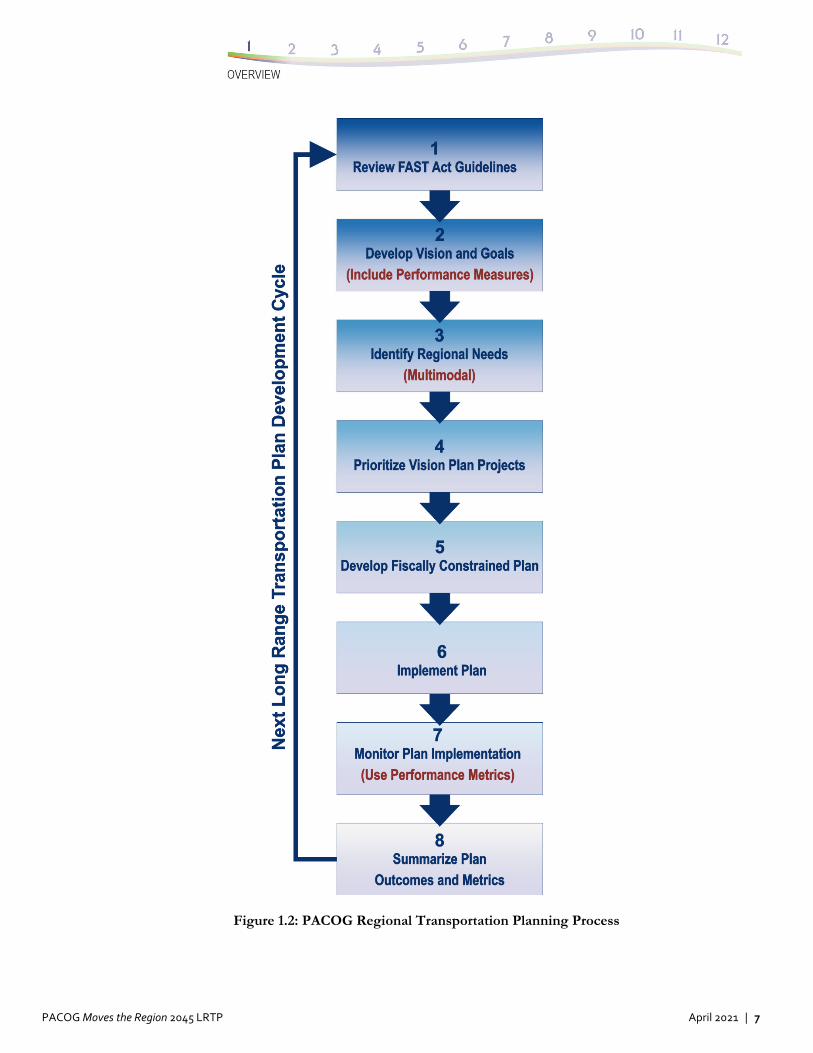
The LRP process must logically look first to the most recent federal legislation related to MPO RTPs. The vision elements are framed by the current federal guidelines and use the planning factors and goals provided by the federal legislation. Figure 1.2 shows the general process flow of the PACOG 2045 LRTP. This sequence also generally forms the outline of this LRTP document. The steps shown in Figure 1.2 can also be shown as a sequence of activities, with a feedback loop, that occurs during each 5-year LRP cycle.
1. Review federal guidelines in the form of FAST Act requirements.
2. Establish the PACOG regional vision and goals in the 2045 RTP goal-setting
task. Include here, for the first time, performance measures for each goal.
3. Identify the regional needs and priorities for all transportation modes.
4. Prioritize projects referencing the PACOG TIP using the vision plan and goals.
5. Produce the fiscally constrained version of the plan.
6. Devise the means of plan implementation.
7. Continuously monitor the results of the improvements in Step 6 using all the relevant performance measures.
8. Summarize the plan costs, outcomes, and performance metrics, and start the cycle again.
The next section discusses work done by PACOG to expand upon the eight LRTP planning goals, establish the performance measures attached to each, and set the targeted years for attainment of each metric.
1.3 PACOG 2045 Regional Transportation Plan Goals
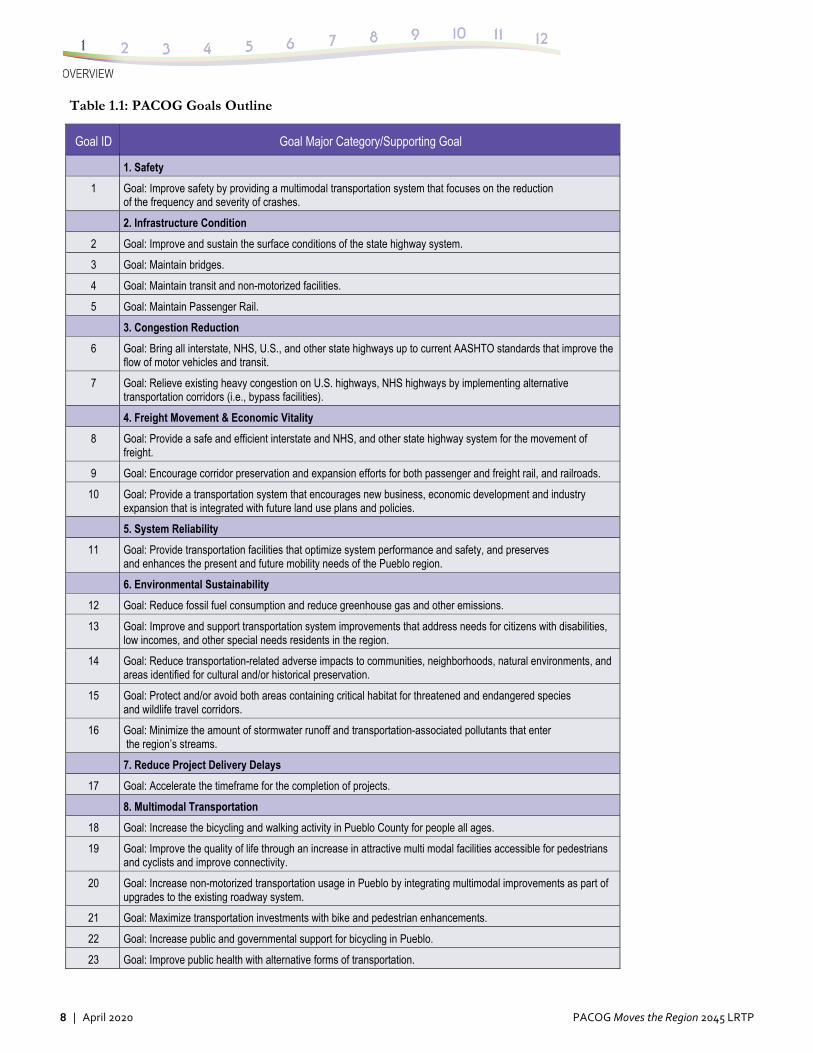
The eight 2045 RTP goals are detailed in this section. They also are summarized in Table 1.1. The outline form of this section of the report corresponds to Table 1.1, providing consistency for the reader between the two ways of looking at these planning categories, addressing both goals and metrics. Table 1.2 expands upon Table 1.1 by presenting the concrete targets associated with each goal.
PACOG Moves the Region 2045 LRTP April 2021 | 7
Figure 1.2: PACOG Regional Transportation Planning Process
8 | April 2020 PACOG Moves the Region 2045 LRTP
Table 1.1: PACOG Goals Outline
Goal ID Goal Major Category/Supporting Goal
1. Safety
1 Goal: Improve safety by providing a multimodal transportation system that focuses on the reduction of the frequency and severity of crashes.
2. Infrastructure Condition
2 Goal: Improve and sustain the surface conditions of the state highway system.
3 Goal: Maintain bridges.
4 Goal: Maintain transit and non-motorized facilities.
5 Goal: Maintain Passenger Rail.
3. Congestion Reduction
6 Goal: Bring all interstate, NHS, U.S., and other state highways up to current AASHTO standards that improve the flow of motor vehicles and transit.
7 Goal: Relieve existing heavy congestion on U.S. highways, NHS highways by implementing alternative transportation corridors (i.e., bypass facilities).
4. Freight Movement & Economic Vitality
8 Goal: Provide a safe and efficient interstate and NHS, and other state highway system for the movement of freight.
9 Goal: Encourage corridor preservation and expansion efforts for both passenger and freight rail, and railroads.
10 Goal: Provide a transportation system that encourages new business, economic development and industry expansion that is integrated with future land use plans and policies.
5. System Reliability
11 Goal: Provide transportation facilities that optimize system performance and safety, and preserves and enhances the present and future mobility needs of the Pueblo region.
6. Environmental Sustainability
12 Goal: Reduce fossil fuel consumption and reduce greenhouse gas and other emissions.
13 Goal: Improve and support transportation system improvements that address needs for citizens with disabilities, low incomes, and other special needs residents in the region.
14 Goal: Reduce transportation-related adverse impacts to communities, neighborhoods, natural environments, and areas identified for cultural and/or historical preservation.
15 Goal: Protect and/or avoid both areas containing critical habitat for threatened and endangered species and wildlife travel corridors.
16 Goal: Minimize the amount of stormwater runoff and transportation-associated pollutants that enter the region’s streams.
7. Reduce Project Delivery Delays
17 Goal: Accelerate the timeframe for the completion of projects.
8. Multimodal Transportation
18 Goal: Increase the bicycling and walking activity in Pueblo County for people all ages.
19 Goal: Improve the quality of life through an increase in attractive multi modal facilities accessible for pedestrians and cyclists and improve connectivity.
20 Goal: Increase non-motorized transportation usage in Pueblo by integrating multimodal improvements as part of upgrades to the existing roadway system.
21 Goal: Maximize transportation investments with bike and pedestrian enhancements.
22 Goal: Increase public and governmental support for bicycling in Pueblo.
23 Goal: Improve public health with alternative forms of transportation.

PACOG Moves the Region 2045 LRTP April 2021 | 9
Table 1.2: PACOG Performance Measures – Final Targets
PACOG Planning Goal Target by Year
1. SAFETY
1A -- 2020: Establish the 2020 baseline fatal crash rate, 2025: Decrease the baseline by 50%, 2030: Decrease the baseline to zero, 2045: Maintain the baseline at zero.
1B -- 2020: Establish the 2020 baseline serious injury rate. 2025: Decrease the baseline by 50%. 2030: Decrease the baseline to zero. 2045: Maintain the baseline at zero.
1C -- 2020: Establish the 2020 baseline injury rate. 2025: Decrease the baseline by 6%. 2030: Decrease the injury rate by 13%. 2045: Decrease the baseline by 25%.
1D -- 2020: Establish the 2020 baseline PDO rate of crashes. 2025: Decrease the baseline by 6%. 2030: Decrease the baseline by 13%. 2045: Decrease the baseline by 25%.
1E -- 2020: Establish the 2020 baseline number of public transit crashes. 2025. Decrease the baseline by 3%. 2030: Decrease the baseline by 5%. 2045: Decrease the baseline by 10%.
1F -- 2020: Establish the 2020 baseline for pedestrian-related accidents. 2025: Decrease the baseline by 19%. 2030: Decrease the baseline by 38%. 2045: Decrease the baseline by 75%.
1G -- 2020: Establish the baseline for railroad crossing–related crashes. 2025: Decrease the baseline by 19%. 2030: Decrease the baseline by 38%. 2045: Decrease the baseline by 75%.
2. INFRASTRUCTURE
Highways
2A --2020: Establish the 2020 baseline percentage for High/Moderate Drivability Life on Interstates. 2025: Achieve 20%. 2030: Achieve 40%. 2045: Achieve 80%.
2B -- 2020: Establish the 2020 baseline percentage for High/Moderate Drivability Life on NHS. 2025: Achieve 20%. 2030: Achieve 40%. 2045: Achieve 80%.
2C -- 2020: Document the 2020 percentage for High/Moderate Drivability Life on state highways. 2025: Achieve 20%. 2030: Achieve 40%. 2045: Achieve 80%.
Bridges
2D -- 2020: Establish the 2020 baseline number of interstate, NHS, and U.S. highway sufficient bridges in the region. 2025: Increase by 25%. 2030: Increase by 50%. 2045: Increase to 100%.
2E -- 2020: Establish the 2020 baseline number of all other state highway sufficient bridges. 2025: Increase by 25%. 2030: Increase by 50%. 2045: Increase to 100%.
2F -- 2020: Establish the 2020 baseline number of bridge structures at grade or grade-separated interchanges, ramps, and acceleration and deceleration lanes that meet AASHTO standards. 2025: Increase by 12%. 2030: Increase by 65%. 2045: Increase to 100%.
Transit and Non-Motorized
2G -- Focus on Fleet: 2020: Establish the 2020 baseline percentage of vehicles in the transit fleet in fair, good, or excellent conditions (FTA definitions). 2025: Increase the baseline to no less than 65%. 2030: Maintain the baseline at no less than 65%. 2045: Increase the baseline to no less than 70%.
2H -- Focus on Trail Usage: 2020: Establish the 2020 Baseline for trail use. 2025: Increase the baseline by an average of 1.5% annually over a 5-year period beginning in 2020. 2030: Increase the baseline by an average of 1.5% annually over a 10-year period beginning in 2025. 2045: Increase the baseline by an average of 1.5% annually over a 15-year period beginning in 2030.
Passenger Rail 2I -- Focus on Partnership: 2020 and forward: Establish and/or continue participation in statewide, regional, and private rail passenger advocacy groups. Maintain a log of events and outcomes from these meetings.
Aviation 2J -- Focus on Continued Investment: 2020 and forward: Establish and/or continue investment to attract and retain aviation connectivity in Pueblo County using Pueblo Memorial Airport.
10 | April 2020 PACOG Moves the Region 2045 LRTP
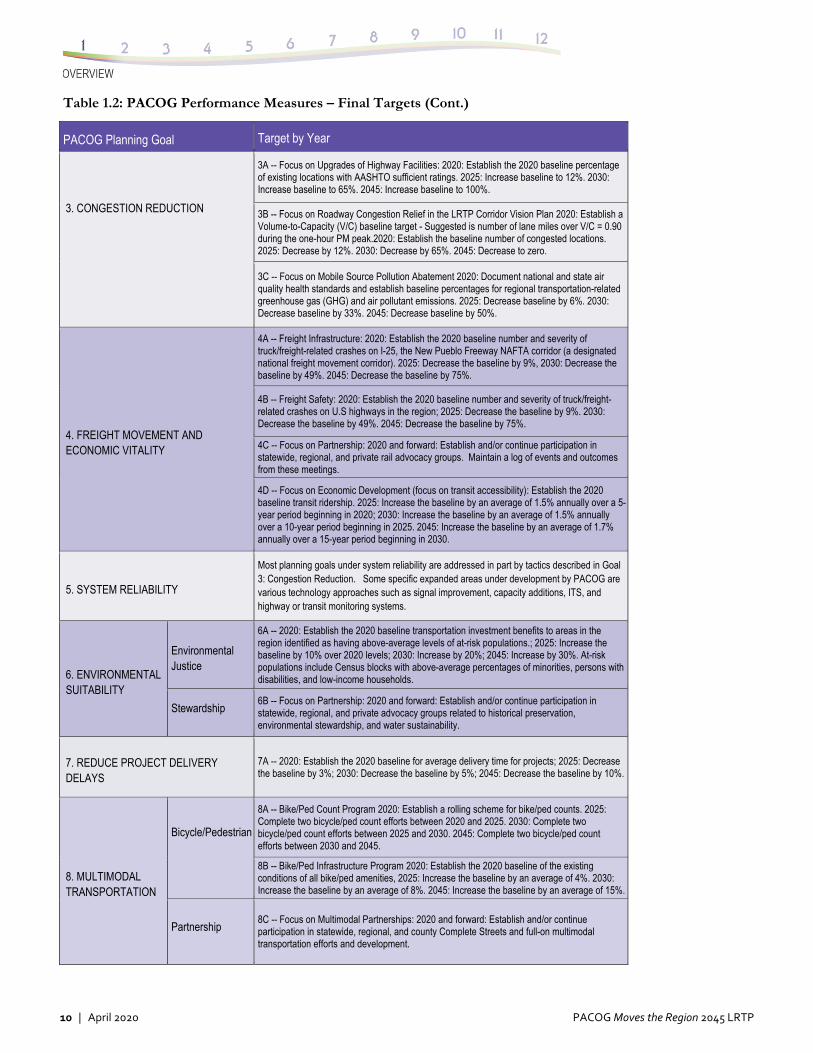
Table 1.2: PACOG Performance Measures – Final Targets (Cont.)
PACOG Planning Goal Target by Year
3. CONGESTION REDUCTION
3A -- Focus on Upgrades of Highway Facilities: 2020: Establish the 2020 baseline percentage of existing locations with AASHTO sufficient ratings. 2025: Increase baseline to 12%. 2030: Increase baseline to 65%. 2045: Increase baseline to 100%.
3B -- Focus on Roadway Congestion Relief in the LRTP Corridor Vision Plan 2020: Establish a Volume-to-Capacity (V/C) baseline target - Suggested is number of lane miles over V/C = 0.90 during the one-hour PM peak.2020: Establish the baseline number of congested locations. 2025: Decrease by 12%. 2030: Decrease by 65%. 2045: Decrease to zero.
3C -- Focus on Mobile Source Pollution Abatement 2020: Document national and state air quality health standards and establish baseline percentages for regional transportation-related greenhouse gas (GHG) and air pollutant emissions. 2025: Decrease baseline by 6%. 2030: Decrease baseline by 33%. 2045: Decrease baseline by 50%.
4. FREIGHT MOVEMENT AND ECONOMIC VITALITY
4A -- Freight Infrastructure: 2020: Establish the 2020 baseline number and severity of truck/freight-related crashes on I-25, the New Pueblo Freeway NAFTA corridor (a designated national freight movement corridor). 2025: Decrease the baseline by 9%, 2030: Decrease the baseline by 49%. 2045: Decrease the baseline by 75%.
4B -- Freight Safety: 2020: Establish the 2020 baseline number and severity of truck/freight-related crashes on U.S highways in the region; 2025: Decrease the baseline by 9%. 2030: Decrease the baseline by 49%. 2045: Decrease the baseline by 75%.
4C -- Focus on Partnership: 2020 and forward: Establish and/or continue participation in statewide, regional, and private rail advocacy groups. Maintain a log of events and outcomes from these meetings.
4D -- Focus on Economic Development (focus on transit accessibility): Establish the 2020 baseline transit ridership. 2025: Increase the baseline by an average of 1.5% annually over a 5-year period beginning in 2020; 2030: Increase the baseline by an average of 1.5% annually over a 10-year period beginning in 2025. 2045: Increase the baseline by an average of 1.7% annually over a 15-year period beginning in 2030.
5. SYSTEM RELIABILITY
Most planning goals under system reliability are addressed in part by tactics described in Goal 3: Congestion Reduction. Some specific expanded areas under development by PACOG are various technology approaches such as signal improvement, capacity additions, ITS, and highway or transit monitoring systems.
6. ENVIRONMENTAL SUITABILITY
Environmental Justice
6A -- 2020: Establish the 2020 baseline transportation investment benefits to areas in the region identified as having above-average levels of at-risk populations.; 2025: Increase the baseline by 10% over 2020 levels; 2030: Increase by 20%; 2045: Increase by 30%. At-risk populations include Census blocks with above-average percentages of minorities, persons with disabilities, and low-income households.
Stewardship 6B -- Focus on Partnership: 2020 and forward: Establish and/or continue participation in statewide, regional, and private advocacy groups related to historical preservation, environmental stewardship, and water sustainability.
7. REDUCE PROJECT DELIVERY DELAYS
7A -- 2020: Establish the 2020 baseline for average delivery time for projects; 2025: Decrease the baseline by 3%; 2030: Decrease the baseline by 5%; 2045: Decrease the baseline by 10%.
8. MULTIMODAL TRANSPORTATION
Bicycle/Pedestrian
8A -- Bike/Ped Count Program 2020: Establish a rolling scheme for bike/ped counts. 2025: Complete two bicycle/ped count efforts between 2020 and 2025. 2030: Complete two bicycle/ped count efforts between 2025 and 2030. 2045: Complete two bicycle/ped count efforts between 2030 and 2045.
8B -- Bike/Ped Infrastructure Program 2020: Establish the 2020 baseline of the existing conditions of all bike/ped amenities, 2025: Increase the baseline by an average of 4%. 2030: Increase the baseline by an average of 8%. 2045: Increase the baseline by an average of 15%.
Partnership 8C -- Focus on Multimodal Partnerships: 2020 and forward: Establish and/or continue participation in statewide, regional, and county Complete Streets and full-on multimodal transportation efforts and development.
PACOG Moves the Region 2045 LRTP April 2021 | 11
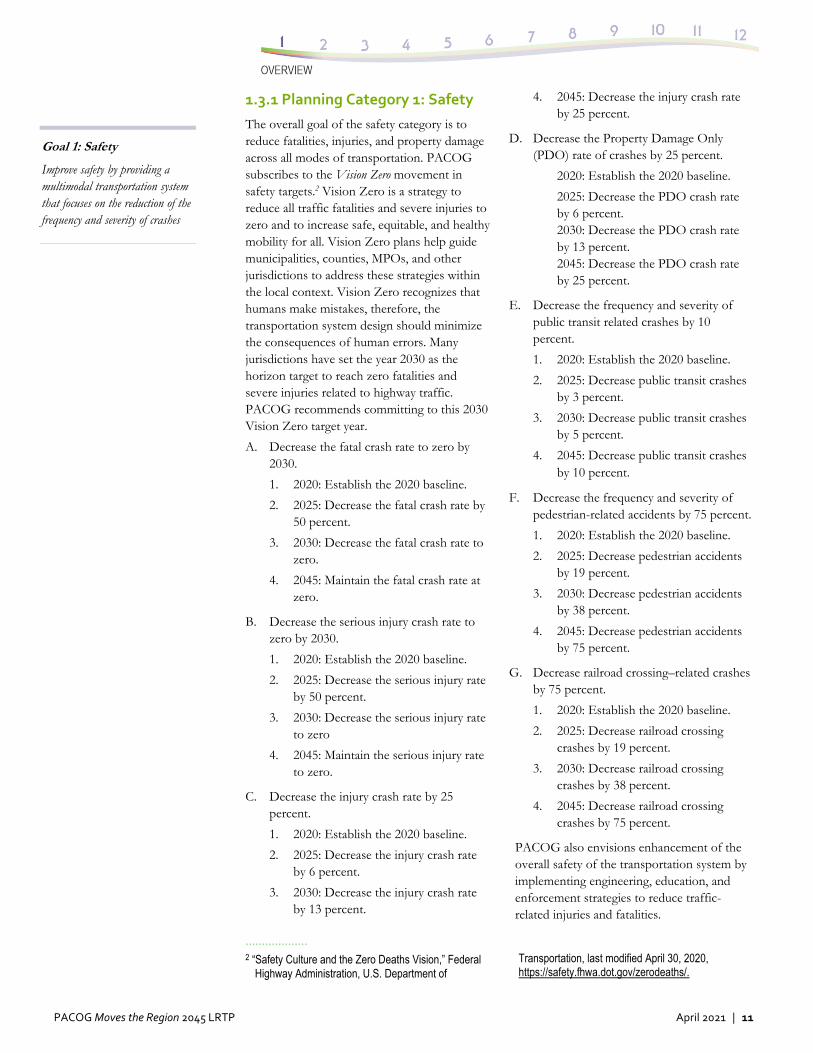
1.3.1 Planning Category 1: Safety
The overall goal of the safety category is to reduce fatalities, injuries, and property damage across all modes of transportation. PACOG subscribes to the Vision Zero movement in safety targets.2 Vision Zero is a strategy to reduce all traffic fatalities and severe injuries to zero and to increase safe, equitable, and healthy mobility for all. Vision Zero plans help guide municipalities, counties, MPOs, and other jurisdictions to address these strategies within the local context. Vision Zero recognizes that humans make mistakes, therefore, the transportation system design should minimize the consequences of human errors. Many jurisdictions have set the year 2030 as the horizon target to reach zero fatalities and severe injuries related to highway traffic. PACOG recommends committing to this 2030 Vision Zero target year.
A. Decrease the fatal crash rate to zero by 2030.
1. 2020: Establish the 2020 baseline.
2. 2025: Decrease the fatal crash rate by 50 percent.
3. 2030: Decrease the fatal crash rate to zero.
4. 2045: Maintain the fatal crash rate at zero.
B. Decrease the serious injury crash rate to zero by 2030.
1. 2020: Establish the 2020 baseline.
2. 2025: Decrease the serious injury rate by 50 percent.
3. 2030: Decrease the serious injury rate to zero
4. 2045: Maintain the serious injury rate to zero.
C. Decrease the injury crash rate by 25 percent.
1. 2020: Establish the 2020 baseline.
2. 2025: Decrease the injury crash rate by 6 percent.
3. 2030: Decrease the injury crash rate by 13 percent.
··················· 2 “Safety Culture and the Zero Deaths Vision,” Federal
Highway Administration, U.S. Department of
4. 2045: Decrease the injury crash rate by 25 percent.
D. Decrease the Property Damage Only (PDO) rate of crashes by 25 percent.
1. 2020: Establish the 2020 baseline.
2. 2025: Decrease the PDO crash rate by 6 percent.
3. 2030: Decrease the PDO crash rate by 13 percent.
4. 2045: Decrease the PDO crash rate by 25 percent.
E. Decrease the frequency and severity of public transit related crashes by 10 percent.
1. 2020: Establish the 2020 baseline.
2. 2025: Decrease public transit crashes by 3 percent.
3. 2030: Decrease public transit crashes by 5 percent.
4. 2045: Decrease public transit crashes by 10 percent.
F. Decrease the frequency and severity of pedestrian-related accidents by 75 percent.
1. 2020: Establish the 2020 baseline.
2. 2025: Decrease pedestrian accidents by 19 percent.
3. 2030: Decrease pedestrian accidents by 38 percent.
4. 2045: Decrease pedestrian accidents by 75 percent.
G. Decrease railroad crossing–related crashes by 75 percent.
1. 2020: Establish the 2020 baseline.
2. 2025: Decrease railroad crossing crashes by 19 percent.
3. 2030: Decrease railroad crossing crashes by 38 percent.
4. 2045: Decrease railroad crossing crashes by 75 percent.
PACOG also envisions enhancement of the overall safety of the transportation system by implementing engineering, education, and enforcement strategies to reduce traffic-related injuries and fatalities.
Transportation, last modified April 30, 2020, https://safety.fhwa.dot.gov/zerodeaths/.
Goal 1: Safety
Improve safety by providing a multimodal transportation system that focuses on the reduction of the frequency and severity of crashes
12 | April 2020 PACOG Moves the Region 2045 LRTP
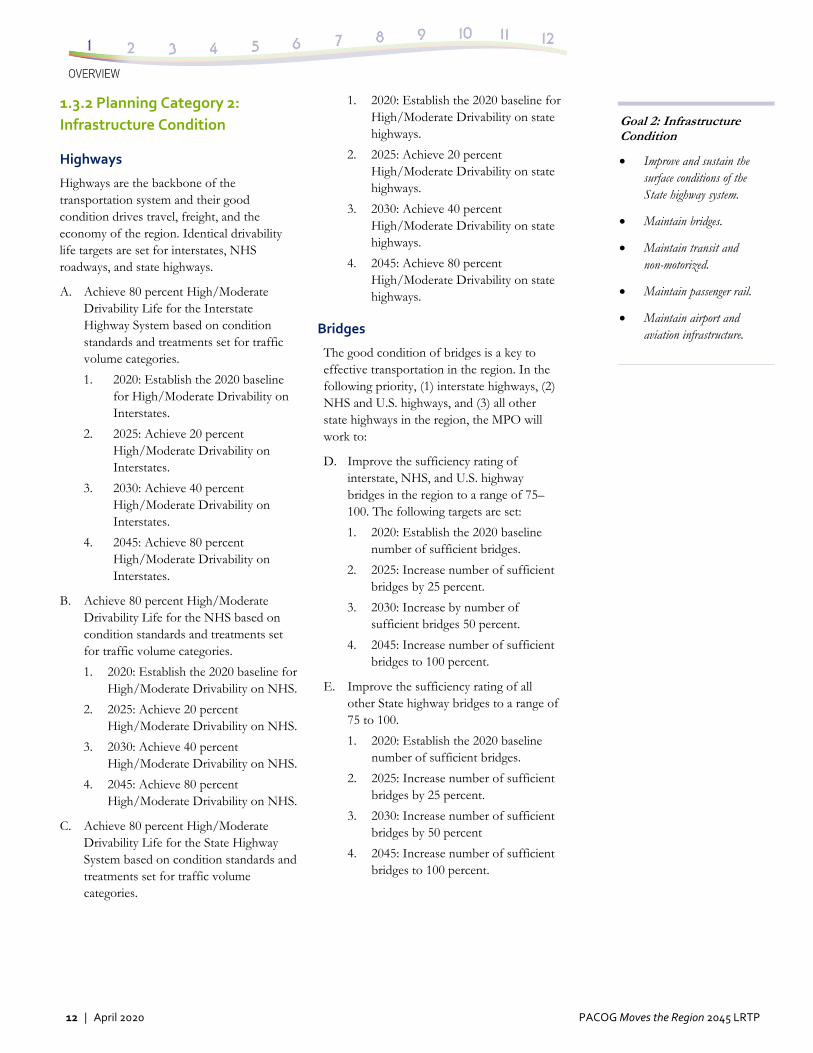
1.3.2 Planning Category 2:
Infrastructure Condition
Highways
Highways are the backbone of the transportation system and their good condition drives travel, freight, and the economy of the region. Identical drivability life targets are set for interstates, NHS roadways, and state highways.
A. Achieve 80 percent High/Moderate Drivability Life for the Interstate Highway System based on condition standards and treatments set for traffic volume categories.
1. 2020: Establish the 2020 baseline for High/Moderate Drivability on Interstates.
2. 2025: Achieve 20 percent High/Moderate Drivability on Interstates.
3. 2030: Achieve 40 percent High/Moderate Drivability on Interstates.
4. 2045: Achieve 80 percent High/Moderate Drivability on Interstates.
B. Achieve 80 percent High/Moderate Drivability Life for the NHS based on condition standards and treatments set for traffic volume categories.
1. 2020: Establish the 2020 baseline for High/Moderate Drivability on NHS.
2. 2025: Achieve 20 percent High/Moderate Drivability on NHS.
3. 2030: Achieve 40 percent High/Moderate Drivability on NHS.
4. 2045: Achieve 80 percent High/Moderate Drivability on NHS.
C. Achieve 80 percent High/Moderate Drivability Life for the State Highway System based on condition standards and treatments set for traffic volume categories.
1. 2020: Establish the 2020 baseline for High/Moderate Drivability on state highways.
2. 2025: Achieve 20 percent High/Moderate Drivability on state highways.
3. 2030: Achieve 40 percent High/Moderate Drivability on state highways.
4. 2045: Achieve 80 percent High/Moderate Drivability on state highways.
Bridges
The good condition of bridges is a key to effective transportation in the region. In the following priority, (1) interstate highways, (2) NHS and U.S. highways, and (3) all other state highways in the region, the MPO will work to:
D. Improve the sufficiency rating of interstate, NHS, and U.S. highway bridges in the region to a range of 75–100. The following targets are set:
1. 2020: Establish the 2020 baseline number of sufficient bridges.
2. 2025: Increase number of sufficient bridges by 25 percent.
3. 2030: Increase by number of sufficient bridges 50 percent.
4. 2045: Increase number of sufficient bridges to 100 percent.
E. Improve the sufficiency rating of all other State highway bridges to a range of 75 to 100.
1. 2020: Establish the 2020 baseline number of sufficient bridges.
2. 2025: Increase number of sufficient bridges by 25 percent.
3. 2030: Increase number of sufficient bridges by 50 percent
4. 2045: Increase number of sufficient bridges to 100 percent.
Goal 2: Infrastructure Condition
Improve and sustain the surface conditions of the State highway system.
Maintain bridges.
Maintain transit and non-motorized.
Maintain passenger rail.
Maintain airport and aviation infrastructure.
PACOG Moves the Region 2045 LRTP April 2021 | 13
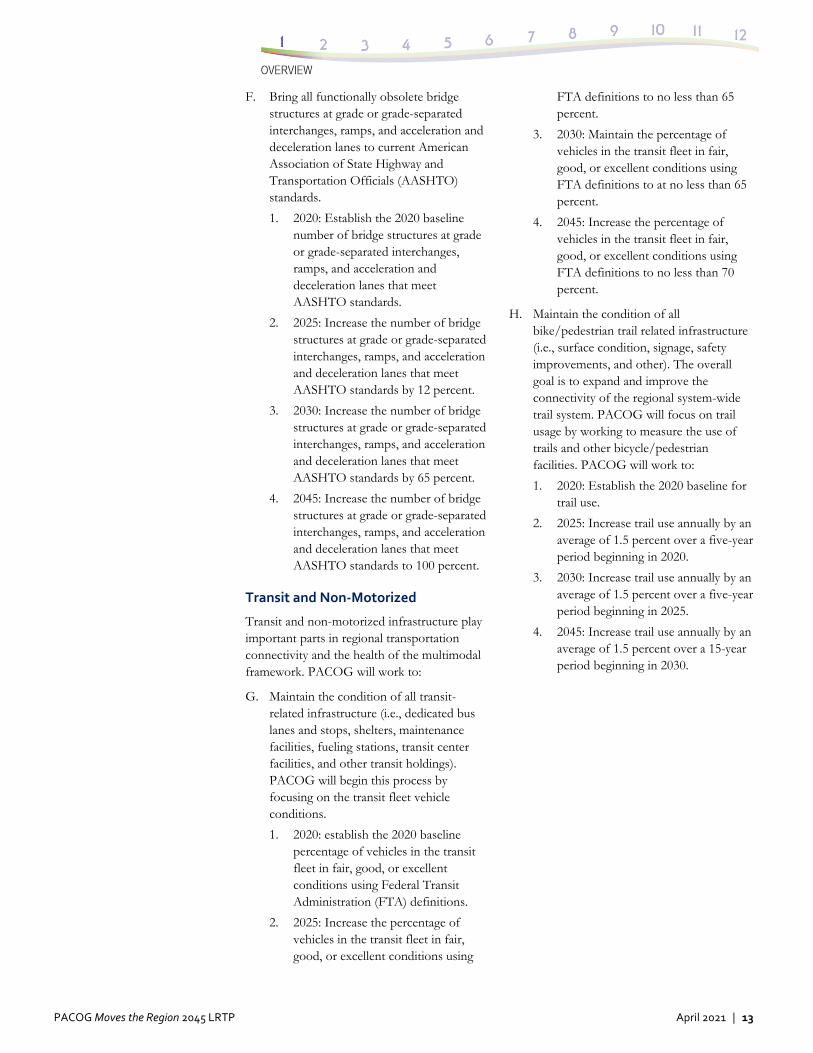
F. Bring all functionally obsolete bridge structures at grade or grade-separated interchanges, ramps, and acceleration and deceleration lanes to current American Association of State Highway and Transportation Officials (AASHTO) standards.
1. 2020: Establish the 2020 baseline number of bridge structures at grade or grade-separated interchanges, ramps, and acceleration and deceleration lanes that meet AASHTO standards.
2. 2025: Increase the number of bridge structures at grade or grade-separated interchanges, ramps, and acceleration and deceleration lanes that meet AASHTO standards by 12 percent.
3. 2030: Increase the number of bridge structures at grade or grade-separated interchanges, ramps, and acceleration and deceleration lanes that meet AASHTO standards by 65 percent.
4. 2045: Increase the number of bridge structures at grade or grade-separated interchanges, ramps, and acceleration and deceleration lanes that meet AASHTO standards to 100 percent.
Transit and Non‐Motorized
Transit and non-motorized infrastructure play important parts in regional transportation connectivity and the health of the multimodal framework. PACOG will work to:
G. Maintain the condition of all transit-related infrastructure (i.e., dedicated bus lanes and stops, shelters, maintenance facilities, fueling stations, transit center facilities, and other transit holdings). PACOG will begin this process by focusing on the transit fleet vehicle conditions.
1. 2020: establish the 2020 baseline percentage of vehicles in the transit fleet in fair, good, or excellent conditions using Federal Transit Administration (FTA) definitions.
2. 2025: Increase the percentage of vehicles in the transit fleet in fair, good, or excellent conditions using
FTA definitions to no less than 65 percent.
3. 2030: Maintain the percentage of vehicles in the transit fleet in fair, good, or excellent conditions using FTA definitions to at no less than 65 percent.
4. 2045: Increase the percentage of vehicles in the transit fleet in fair, good, or excellent conditions using FTA definitions to no less than 70 percent.
H. Maintain the condition of all bike/pedestrian trail related infrastructure (i.e., surface condition, signage, safety improvements, and other). The overall goal is to expand and improve the connectivity of the regional system-wide trail system. PACOG will focus on trail usage by working to measure the use of trails and other bicycle/pedestrian facilities. PACOG will work to:
1. 2020: Establish the 2020 baseline for trail use.
2. 2025: Increase trail use annually by an average of 1.5 percent over a five-year period beginning in 2020.
3. 2030: Increase trail use annually by an average of 1.5 percent over a five-year period beginning in 2025.
4. 2045: Increase trail use annually by an average of 1.5 percent over a 15-year period beginning in 2030.
14 | April 2020 PACOG Moves the Region 2045 LRTP
Passenger Rail
The region has made a significant commitment to passenger rail service. PACOG will:
I. Continue to work with CDOT Division of Transit & Rail (DTR) and policy office to sustain passenger rail service to southeastern Colorado, including a potential passenger rail stop in Pueblo. PACOG will continue to seek other sources of funding to improve and maintain the existing Burlington Northern Santa Fe (BNSF) rail lines throughout southeastern Colorado. This goal is to be met using a focus on partnership.
2020 and forward: PACOG will establish and/or continue participation in statewide, regional and private rail passenger advocacy groups. Wherever possible, PACOG staff will maintain a log of events and outcomes from these meetings.
Airport and Aviation Infrastructure
The region has made a significant commitment to Pueblo Memorial Airport. PACOG will:
J. Continue to work with the Federal Aviation Administration (FAA) to sustain air passenger service to Pueblo Memorial Airport. The City of Pueblo and PACOG will continue to seek sources of funding to improve and maintain the existing airport and related facilities. This goal is to be met using a focus on partnership.
1.3.3 Planning Category 3:
Congestion Relief The overall goal of the congestion relief category is to improve traffic flow on roadways in the PACOG region. The following specific metrics will serve as targets of success.
Achieve AASHO Infrastructure Standards
A. Upgrade all functionally obsolete interchanges, acceleration/deceleration lanes, inadequate ramp lengths, inadequate shoulders, and other. Focus on highway facilities by working to:
1. Establish the 2020 baseline percentage of locations with AASHTO sufficient ratings.
2. 2025: Increase the percentage of locations with AASHTO sufficient ratings to 12 percent.
3. 2030: Increase the percentage of locations with AASHTO sufficient ratings to 65 percent.
4. 2045: Increase the percentage of locations with AASHTO sufficient ratings to 100 percent.
Address Congestion
B. Focus on roadway congestion by establishing a Volume-to-Capacity (V/C) baseline target for the PM peak. Suggested is number of lane miles over V/C = 0.90 during the one-hour PM peak.
1. 2020: Establish the baseline number of congested locations.
2. 2025: Decrease the number of congested locations by 12 percent.
3. 2030: Decrease the number of congested locations by 65 percent.
4. 2045: Decrease the number of congested locations to zero.
The congestion mitigation task has these suggested targets:
Build or expand alternate bypass state highway facilities to LOS C with through traffic at LOS D on at grade and grade-separated interchanges to reduce congestion on existing heavily congested corridors.
Reduce travel time on existing heavily congested corridors by 25 percent.
Goal 3: Congestion Relief
Bring all interstate, NHS, U.S., and other state highways up to current AASHTO standards that improve the flow of motor vehicles and transit.
Relieve existing heavy congestion on U.S. highways, NHS highways by implementing alternative transportation corridors (i.e. bypass facilities).
PACOG Moves the Region 2045 LRTP April 2021 | 15
As identified in the U.S. Highway 50W Planning and Environmental Linkages (PEL) Study, build grade-separated interchanges and add when corridor levels of service reach LOS D.
As identified in studies related to I-25/Pueblo Freeway, build grade-separated interchanges and add additional travel lanes when corridor levels of service reach LOS D.
Bring all New Pueblo Freeway functionally obsolete bridge structures at grade or grade-separated interchanges, ramps, and acceleration and deceleration lanes to current AASHTO standards.
Pollution Abatement
C. Focus on Mobile Source Pollution Abatement where applicable with the following goals: 1. 2020: Document national air quality
health standards and establish baseline percentages for regional transportation-related greenhouse gas (GHG) and air pollutant emissions.
2. 2025: Retain national air quality health standards and reduce regional transportation-related greenhouse gas (GHG) and air pollutant emissions by 6 percent compared with 2020 levels.
3. 2030: Retain national air quality health standards and reduce regional transportation-related greenhouse gas (GHG) and air pollutant emissions by 33 percent compared with 2020 levels.
4. 2045: Retain national air quality health standards and reduce regional transportation-related greenhouse gas (GHG) and air pollutant emissions by 50 percent compared with 2020 levels.
These targets may be achieved by initiating steps to reduce on-road mobile source emissions per capita by various means including: Facilitating the creation of Compressed
Natural Gas (CNG) fueling stations and private and public use of Natural Gas Vehicles (NGVs) and electric vehicles.
As feasible, converting public transit buses and shuttles to alternative fuel vehicles (e.g., CNG, Liquefied Natural Gas (LNG), electric, and other future emission reduction fuels).
Building strategically located park and ride facilities to reduce Pueblo to out-of-town commuter trips to work by single occupancy vehicles (SOVs).
Continuing to encourage the use of public transit as an alternate to SOV trips by using public education and reducing public transit travel times and transfers.
Implementing Transportation System Management (TSM) measures, such as intersection improvements and ramp metering, among others, to improve the flow of motor vehicles and transit.
Deploying additional Intelligent Transportation Systems (ITS) measures to improve public awareness (accident and construction delays, major event parking and transit alternatives, weather and other safety messages) and alert motorists to traffic conditions to improve the flow of motor vehicles and transit.
Expanding and improving the regional on- and off-system bicycle routes to facilitate an increase of 3 percent of work, school, and other trip purpose connectivity in a safe and efficient manner.
Encouraging public- and private-sector incentives for public transit, carpooling, telecommuting, bicycling, walk to work/school, and park and ride utilization.
Continuing support of the statewide efforts of the Interregional Connectivity System for Front Range transit and high-speed passenger rail service. Identifying the gaps and connections (convenient and accessible transfer points). Preserving existing passenger rail service in Southern Colorado through Pueblo County.
16 | April 2020 PACOG Moves the Region 2045 LRTP
1.3.4 Planning Category 4: Freight Movement & Economic Vitality
The overall goal of the freight movement and vitality category is to ensure safe and effective movement of freight commodities into, out of and through the PACOG region. The following specific metrics and targets are established.
Freight Infrastructure
A. Reduce the number and severity of truck/freight related crashes by 75% on the New Pueblo Freeway North American Free Trade Act (NAFTA) corridor, a designated national freight movement corridor.
1. 2020: Establish the 2020 baseline number and severity of truck/freight related crashes on the New Pueblo Freeway NAFTA corridor.
2. 2025: Decrease the number and severity of truck/freight related crashes on the New Pueblo Freeway NAFTA corridor by 9 percent.
3. 2030: Decrease number and severity of truck/freight related crashes on the New Pueblo Freeway NAFTA corridor by 49 percent.
4. 2045: Decrease the number and severity of truck/freight related crashes on the New Pueblo Freeway NAFTA corridor by 75 percent.
B. Reduce the number and severity of truck/freight-related crashes by 75% on U.S. highways in the region.
1. 2020: Establish the 2020 baseline number and severity of truck/freight-related crashes on U.S highways in the region.
2. 2025: Decrease the number and severity of truck/freight-related crashes on U.S highways in the region by 9 percent.
3. 2030: Decrease the number and severity of truck/freight-related crashes on U.S highways in the region by 49 percent.
4. 2045: decrease the number and severity of truck/freight-related crashes on U.S highways in the region by 75 percent.
Partnership
C. Continue efforts with CDOT, USDOT, FTA and Congress to integrate regional passenger and freight rail service into the statewide passenger rail service plans and vision. Focus on partnership: 2020 and forward: Establish and/or continue participation in statewide, regional, and private rail advocacy groups. Maintain a log of events and outcomes from these meetings.
Economic Development
D. Improve the integration, accessibility, and connectivity of the regional transportation system across and between modes for the movement of people and freight, with a focus on transit investment. The transportation system should be planned, maintained, and constructed in a manner that supports access to jobs for workers; access to shopping and services; and the safe and efficient movement of goods to, from, and within the region. It should support retail, medical, education, manufacturing, energy industry, recreation, and other important economic sectors.
1.3.5 Planning Category 5: System Reliability
The overall goal of the system reliability category is to optimize the roadway system and minimize congestion. The specific metrics and targets for system reliability are tied back into those cited in Goal 3 – Congestion Relief.
Goal 4: Freight Movement and Economic Vitality
Provide a safe and efficient interstate and NHS, and other state highway system for the movement of freight.
Encourage corridor preservation and expansion efforts for both passenger and freight rail, and railroads.
Provide a transportation system that encourages new business, economic development and industry expansion that is integrated with future land use plans and policies.
Goal 5: System Reliability
Provide transportation facilities that optimize system performance and safety and preserve and enhance the present and future mobility needs of the Pueblo region.
PACOG Moves the Region 2045 LRTP April 2021 | 17
Maintain/Improve Reliability
Reduce minutes of delay on congested corridor segments on interstate, NHS and other state highways by working to:
1. A. Maintain and expand the Pueblo region’s transit system.
B. Reduce traffic congestion by implement- ing TSM measures to improve passenger carrying capacity in the region.
C. Increase capacity on congested segments (provide additional lanes) on interstate; NHS; and state highways in the region.
D. Increase intersection capacity through the addition of turn lanes, queuing storage lengths, signal improvements, and grade- separated interchanges as identified in the U.S. Highway 50 PEL and at failing intersections.
E. Reduce the projected SOV trips between 2020 and 2045 by 5 percent through implementing strategically located park and ride facilities and encouraging the increased use of transit and carpooling.
F. Deploy ITS, such as vehicle flow treat- ments, national real-time system informa- tion programs, and a transit monitoring system to improve the effectiveness and efficiency of the transportation system.
G. Implement transportation projects such as acceleration/deceleration lanes, inter- section improvements, and ramp meter- ing, to improve the flow of motor vehicles and transit.
H. Develop alternate routes that expand system capacity and redundancy for the I-25 and U.S. Highway 50 corridors.
I. Increase the number of wayfinding signs to assist motorists, bicyclists and pedestrians.
J. Improve non-motorized system accessi- bility and connectivity within Pueblo and regionally within Pueblo West.
K. Identify additional crossing locations of the Arkansas River and Fountain Creek to improve mobility for all transportation modes.
1.3.6 Planning Category 6: Environmental Sustainability
The overall goal of the environmental sustainability category in the PACOG RTP is to address a wide range of specific topics related to the environment. The topics in this section cover reducing fossil fuel use, addressing special needs travelers, enhancing historical preservation, protecting endangered species, and encouraging water sustainability.
Emissions
The focus of this category is to reduce fossil fuel use in the region with the goal of a stepwise 50 percent reduction between 2020 and 2045. The specifics of this goal are addressed under “Mobile Source Pollution Abatement” in Section 1.3.3, Item C.
Special Needs Travelers
All citizens of the region have a right to access transportation infrastructure. PACOG will work to:
A. Incorporate social concerns into the planning, design, construction, maintenance, and operation of the Pueblo regional multimodal transportation system; identify the pros and cons of EJ issues of projects; and elicit participation from low-income and minority populations that documents the effect of projects on the mobility of these populations. At-risk populations include Census blocks with above-average percentages of minorities, persons with disabilities, and low-income households. The goals by year are stated below:
1. 2020: Establish the 2020 transportation investment benefits to areas in the region identified as having above-average levels of at-risk populations.
2. 2025: Increase transportation investment benefits to areas identified as having above-average levels of at-risk populations by 10 percent over 2020 levels.
Goal 6: Environmental Sustainability
Reduce fossil fuel consumption and reduce greenhouse gas and other emissions.
Improve and support transportation system improvements that address needs for citizens with disabilities, low incomes, and other special needs residents in the region.
Reduce transportation-related adverse impacts to communities, neighborhoods, natural environments, and areas identified for cultural and/or historical preservation.
Protect and/or avoid areas containing critical habitat for threatened and endangered species, and wildlife travel corridors.
Minimize the amount of stormwater runoff and transportation-associated pollutants that enter the region’s streams.
18 | April 2020 PACOG Moves the Region 2045 LRTP
3. 2030: increase investment benefits to areas identified as having above-average levels of at-risk populations by 20 percent over 2020 levels.
4. 2045: increase investment benefits to areas identified as having above-average levels of at-risk populations by 30 percent over 2020 levels.
B. Focus on partnerships to promote stewardship. In 2020 and forward PACOG will establish and/or continue participation in statewide, regional, and private advocacy groups related to historical preservation, environmental stewardship, and water sustainability. The MPO will work to maintain a log of events and outcomes from these meetings.
Historical Preservation
Within the transportation realm, full effort will be made to incorporate historic preservation needs in the MPO area. PACOG will complete plans and designs that minimize or eliminate impacts to culturally and/or historically significant sites; when feasible, PACOG will incorporate methods that celebrate and educate the public value of culturally and/or historically significant areas that are preserved and protected in project areas. PACOG will implement context sensitive design solutions that incorporate the community’s heritage and architectural legacy.
Environmental Stewardship
With regard to endangered species, PACOG will develop design alternatives that prioritize natural, cultural, and historical resources impacts by following the CDOT Environmental Stewardship Guide; design projects to avoid significant areas and sites, but, if unavoidable, minimize impacts to significant areas and sites; and provide equal value of litigation for unavoidable impacts to significant areas and sites.
Water Sustainability
The area of water sustainability has never been more important in the region and the state than it is today. PACOG will design
future projects to meet the stormwater standards and Best Management Practices (BMPs) in effect at the time of project construction.
1.3.7 Planning Category 7: Reduce Project Delivery Delays
The overall goal of this category is to add value by working to accelerate the timeframe of project delivery in the region. Three strategies will be implemented:
1. Improve timing to streamline approval processes, including reviews, contracts, and general clearances.
2. When possible, do not require separate design and construction funding and/or consultants for design/construction.
3. Utilize Design-Build and Every Day Counts (EDC) concepts to identify and deploy innovation aimed at shortening project delivery, enhancing safety, and protecting the environment. EDC is a state-based model sponsored by the FHWA. Proven innovations promoted through EDC facilitate greater efficiency at the state and local levels, saving time, money, and resources that can be used to deliver more projects. These concepts include shortened project delivery, flexibility and coordination in Right-of-Way (ROW), and the accommodation and relocation of utilities.
Using these strategies, PACOG will work to:
A. Reduce project delivery delays in the region. Incremental targets are:
1. 2020: Establish the 2020 baseline for average delivery time for projects.
2. 2025: Decrease average delivery time for projects by 3 percent.
3. 2030: Decrease average delivery time for projects by 5 percent.
4. 2045: Decrease average delivery time for projects by 10 percent.
Goal 7: Reduce Project Delivery Delays
Accelerate the timeframe for the completion of projects.
PACOG Moves the Region 2045 LRTP April 2021 | 19
1.3.8 Planning Category 8: Support Multimodal Transportation
The overall goal of this category, which was identified and developed by a local decision-making process, is to enhance all aspects of multimodal travel and partnerships in the region. One key addition to the LRTP is the focus on collecting observed use of bicycle and pedestrian (hiking/walking) facilities in the region.
Bicycle and Pedestrian Trips
A. Improve multimodal corridor bicycling and pedestrian conditions. Create and expand permanent data collection and counting procedures to monitor usage. Complete bicycle counts at a minimum of two times every five years. Establish a pilot program for a school in Pueblo to increase the number of students walking or bicycling to school. Increase the number of participants within Pueblo County in the National Bicycle Challenge and Bike to Work events.
1. Bicycle/Pedestrian Count Program 2020: Establish a rolling scheme for bicycle/pedestrian (bike/ped) counts.
2. 2025: Complete two bicycle/ped count efforts between 2020 and 2025.
3. 2030: Complete two bicycle/ped count efforts between 2025 and 2030.
4. 2045: Complete two bicycle/ped count efforts between 2030 and 2045.
Infrastructure
B. Provide improved bicycle and pedestrian friendly connections to existing multimodal facilities and destinations. Measure progress by counting the following facilities being built and compare annually: (1) blocks of new or repaired sidewalks; (2) miles of new multimodal trails; (3) miles of striped bicycle lanes on the street, or “sharrows” (shared lane bicycle markings); (4) number of pedestrian countdown signals and crosswalks improved or added; and (5) number of new access points to existing or new facilities.
The Bicycle/Pedestrian Infrastructure Program goals by year follow:
1. 2020: Establish the 2020 baseline of the existing conditions of all bicycle/pedestrian amenities
2. 2025: Increase all bicycle/pedestrian amenities by an average of 4 percent over 2020 levels.
3. 2030: Increase all bicycle/pedestrian amenities by an average of 8 percent over 2020 levels.
4. 2045: Increase all bicycle/pedestrian amenities by an average of 15 percent over 2020 levels.
Focus on Multimodal Partnerships
C. Develop and enhance partnership in the region to include:
1. Integration: This goal will be achieved by working to incorporate Complete Streets concepts on city and county transportation projects.
2. Maximization: Maximization of the transportation infrastructure and systems will be an ongoing focus of PACOG with the goal of connecting systems during specific projects, reducing motor vehicle traffic by incorporating safe alternative methods of travel into all projects, and enhancing multimodal efficiency and transit options where feasible.
3. Support: PACOG will work to enhance membership in national organizations that promote bicycling and to continue to submit and improve ranking for Pueblo as a designated “Bicycle Friendly City.” The MPO will also promote bicycling for both residents and tourists through local bicycling events and proclamations and resolutions from PACOG and other entities.
4. Public Health: Public health goals, such as reducing obesity within the overall population by providing more bicycle and pedestrian opportunities, will continue. PACOG will endeavor to partner with public health agencies on initiatives to promote walking and bicycling.
Goal 8: Support Multimodal Transportation
Increase the bicycling and walking activity in Pueblo County for people all ages.
Improve the quality of life through an increase in attractive multi modal facilities accessible for pedestrians and cyclists and improve connectivity.
Increase non-motorized transportation usage in Pueblo by integrating multimodal improvements as part of upgrades to the existing roadway system.
Maximize transportation investments with bike and pedestrian enhancements.
Increase public & governmental support for bicycling in Pueblo.
Improve public health with alternative forms of transportation.
20 | April 2020 PACOG Moves the Region 2045 LRTP
1.4 Organization of This Document
There are 12 chapters and five appendices in the PACOG RTP report.
Chapter 1 – Overview
Chapter 2 – Existing Transportation System
Chapter 3 – Socioeconomic Profile
Chapter 4 – Environmental Profile
Chapter 5 – Transportation Safety & Security
Chapter 6 – Mobility & Alternatives Analysis
Chapter 7 – Planning for Emerging Technology
Chapter 8 – Vision Plan
Chapter 9 – Fiscally Constrained Plan
Chapter 10 – Congestion Management Process
Chapter 11 – Freight & Commodity Flows
Chapter 12 – Financial Plan
Appendix A – Public Involvement
Appendix B – Demographic Forecasts
Appendix C – Coordinated Human Services Transportation Plan
Appendix D – Public Transportation Plan
Appendix E – Youth Transportation Plan
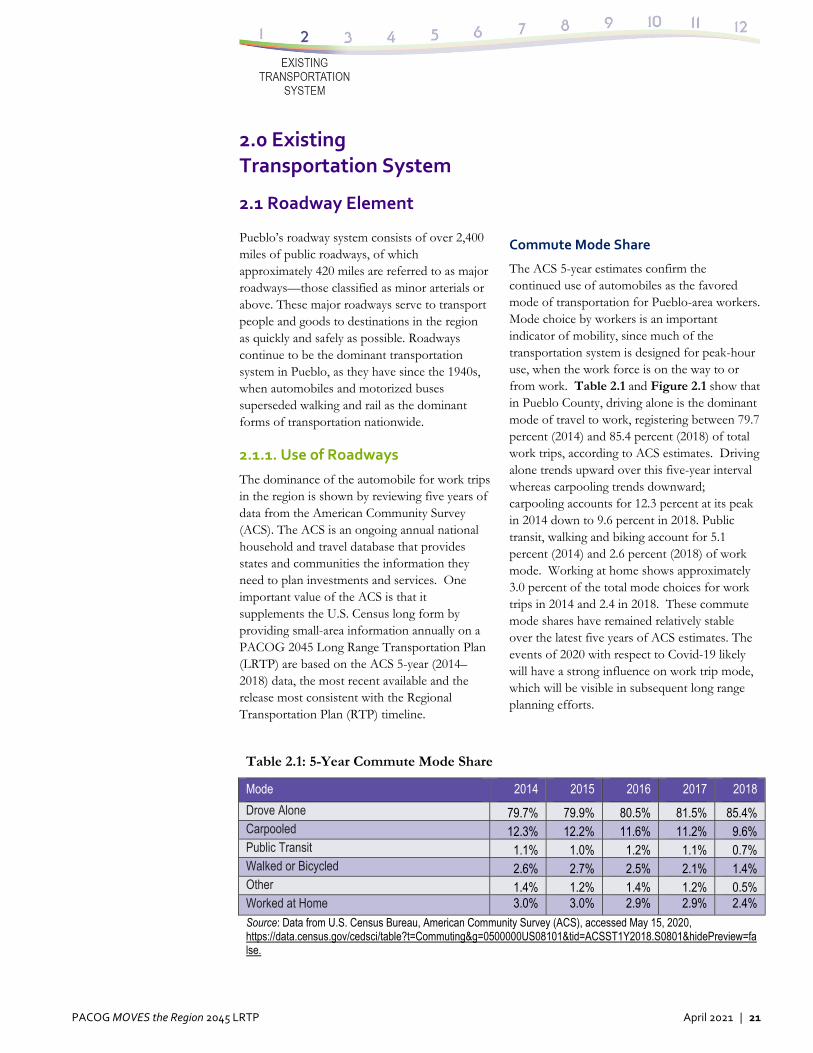
PACOG MOVES the Region 2045 LRTP April 2021 | 21
2.0 Existing Transportation System
2.1 Roadway Element
Pueblo’s roadway system consists of over 2,400 miles of public roadways, of which approximately 420 miles are referred to as major roadways—those classified as minor arterials or above. These major roadways serve to transport people and goods to destinations in the region as quickly and safely as possible. Roadways continue to be the dominant transportation system in Pueblo, as they have since the 1940s, when automobiles and motorized buses superseded walking and rail as the dominant forms of transportation nationwide.
2.1.1. Use of Roadways
The dominance of the automobile for work trips in the region is shown by reviewing five years of data from the American Community Survey (ACS). The ACS is an ongoing annual national household and travel database that provides states and communities the information they need to plan investments and services. One important value of the ACS is that it supplements the U.S. Census long form by providing small-area information annually on a PACOG 2045 Long Range Transportation Plan (LRTP) are based on the ACS 5-year (2014–2018) data, the most recent available and the release most consistent with the Regional Transportation Plan (RTP) timeline.
Commute Mode Share
The ACS 5-year estimates confirm the continued use of automobiles as the favored mode of transportation for Pueblo-area workers. Mode choice by workers is an important indicator of mobility, since much of the transportation system is designed for peak-hour use, when the work force is on the way to or from work. Table 2.1 and Figure 2.1 show that in Pueblo County, driving alone is the dominant mode of travel to work, registering between 79.7 percent (2014) and 85.4 percent (2018) of total work trips, according to ACS estimates. Driving alone trends upward over this five-year interval whereas carpooling trends downward; carpooling accounts for 12.3 percent at its peak in 2014 down to 9.6 percent in 2018. Public transit, walking and biking account for 5.1 percent (2014) and 2.6 percent (2018) of work mode. Working at home shows approximately 3.0 percent of the total mode choices for work trips in 2014 and 2.4 in 2018. These commute mode shares have remained relatively stable over the latest five years of ACS estimates. The events of 2020 with respect to Covid-19 likely will have a strong influence on work trip mode, which will be visible in subsequent long range planning efforts.
Table 2.1: 5-Year Commute Mode Share
Mode 2014 2015 2016 2017 2018
Drove Alone 79.7% 79.9% 80.5% 81.5% 85.4% Carpooled 12.3% 12.2% 11.6% 11.2% 9.6% Public Transit 1.1% 1.0% 1.2% 1.1% 0.7% Walked or Bicycled 2.6% 2.7% 2.5% 2.1% 1.4% Other 1.4% 1.2% 1.4% 1.2% 0.5% Worked at Home 3.0% 3.0% 2.9% 2.9% 2.4% Source: Data from U.S. Census Bureau, American Community Survey (ACS), accessed May 15, 2020, https://data.census.gov/cedsci/table?t=Commuting&g=0500000US08101&tid=ACSST1Y2018.S0801&hidePreview=false.
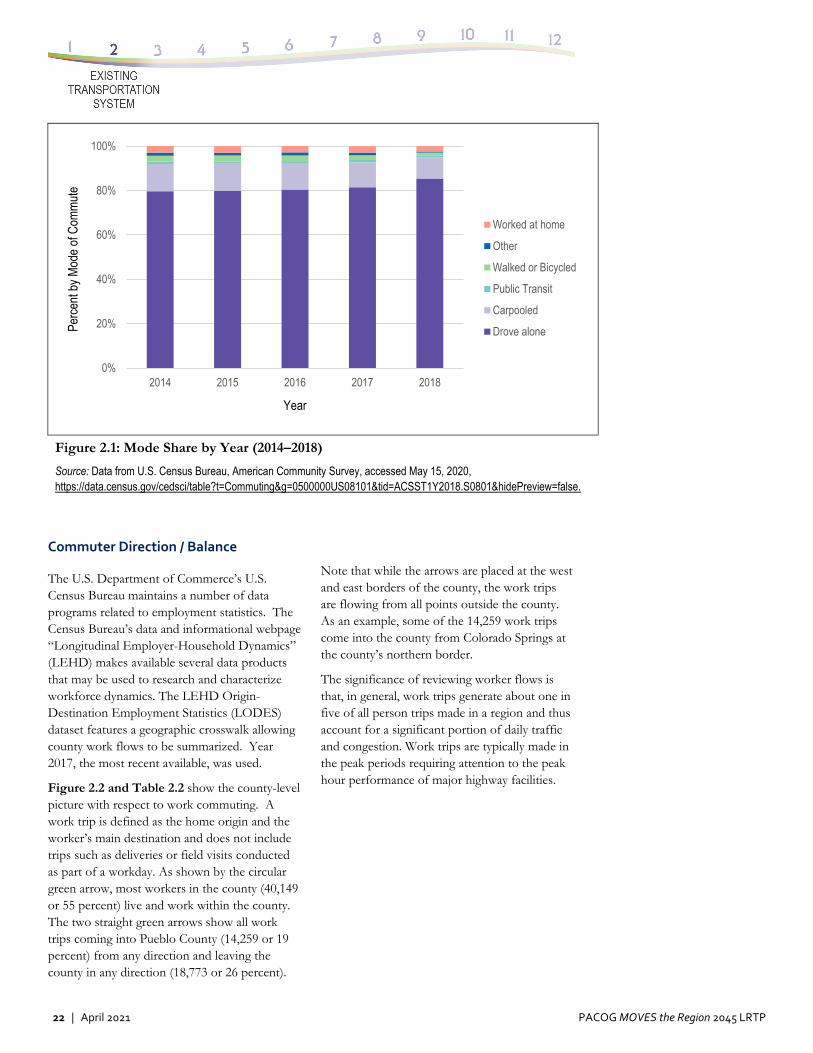
22 | April 2021 PACOG MOVES the Region 2045 LRTP
Figure 2.1: Mode Share by Year (2014–2018)
Source: Data from U.S. Census Bureau, American Community Survey, accessed May 15, 2020, https://data.census.gov/cedsci/table?t=Commuting&g=0500000US08101&tid=ACSST1Y2018.S0801&hidePreview=false.
Commuter Direction / Balance
The U.S. Department of Commerce’s U.S. Census Bureau maintains a number of data programs related to employment statistics. The Census Bureau’s data and informational webpage “Longitudinal Employer-Household Dynamics” (LEHD) makes available several data products that may be used to research and characterize workforce dynamics. The LEHD Origin-Destination Employment Statistics (LODES) dataset features a geographic crosswalk allowing county work flows to be summarized. Year 2017, the most recent available, was used.
Figure 2.2 and Table 2.2 show the county-level picture with respect to work commuting. A work trip is defined as the home origin and the worker’s main destination and does not include trips such as deliveries or field visits conducted as part of a workday. As shown by the circular green arrow, most workers in the county (40,149 or 55 percent) live and work within the county. The two straight green arrows show all work trips coming into Pueblo County (14,259 or 19 percent) from any direction and leaving the county in any direction (18,773 or 26 percent).
Note that while the arrows are placed at the west and east borders of the county, the work trips are flowing from all points outside the county. As an example, some of the 14,259 work trips come into the county from Colorado Springs at the county’s northern border.
The significance of reviewing worker flows is that, in general, work trips generate about one in five of all person trips made in a region and thus account for a significant portion of daily traffic and congestion. Work trips are typically made in the peak periods requiring attention to the peak hour performance of major highway facilities.
0%
20%
40%
60%
80%
100%
2014 2015 2016 2017 2018
Perc
ent b
y M
ode
of C
omm
ute
Year
Worked at home
Other
Walked or Bicycled
Public Transit
Carpooled
Drove alone
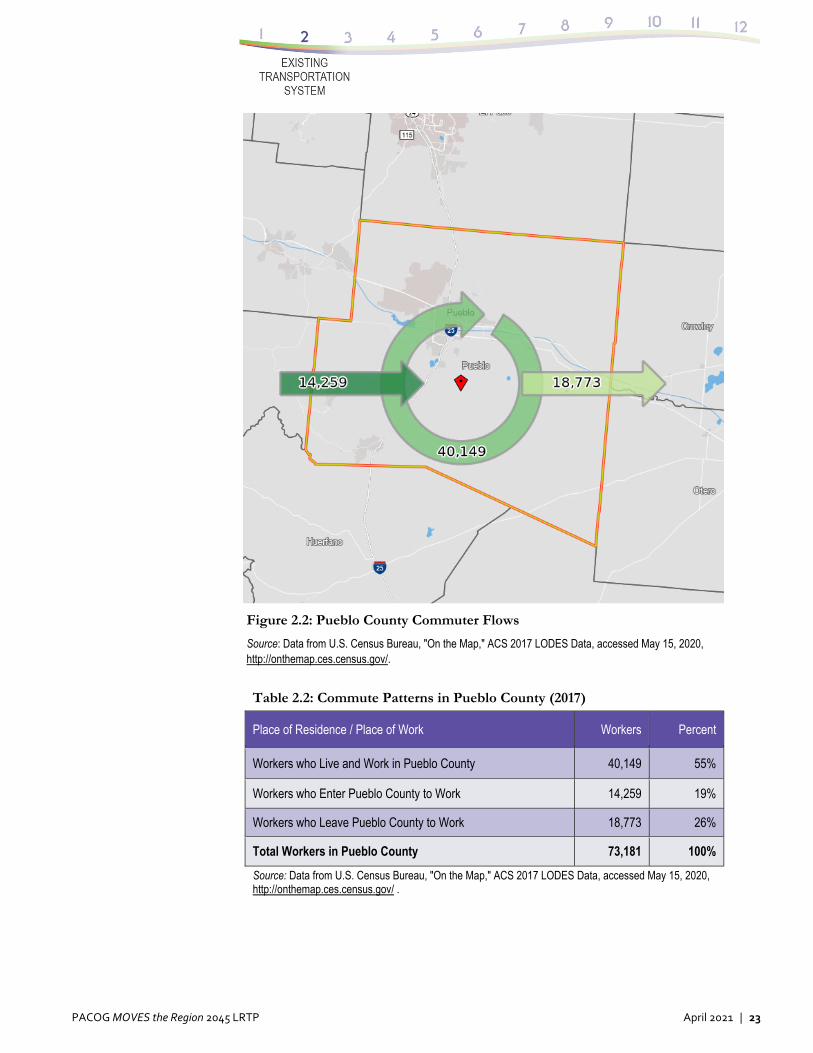
PACOG MOVES the Region 2045 LRTP April 2021 | 23
Figure 2.2: Pueblo County Commuter Flows
Source: Data from U.S. Census Bureau, "On the Map," ACS 2017 LODES Data, accessed May 15, 2020, http://onthemap.ces.census.gov/.
Table 2.2: Commute Patterns in Pueblo County (2017)
Place of Residence / Place of Work Workers Percent
Workers who Live and Work in Pueblo County 40,149 55%
Workers who Enter Pueblo County to Work 14,259 19%
Workers who Leave Pueblo County to Work 18,773 26%
Total Workers in Pueblo County 73,181 100%
Source: Data from U.S. Census Bureau, "On the Map," ACS 2017 LODES Data, accessed May 15, 2020, http://onthemap.ces.census.gov/ .
24 | April 2021 PACOG MOVES the Region 2045 LRTP
2.1.2 Functional Classifications of Roadways
Roadways are organized around the Federal Highway Administration (FHWA) functional classification scheme with five key categories:
1. Freeways: Freeways are high-capacity roadways that accommodate high-speed, long-distance travel through the metro area. Access is strictly controlled and limited to Major Arterials connected by grade-separated interchanges at a minimum spacing set by the Colorado Department of Transportation (CDOT) and the FHWA.
2. Expressways: Expressways accommodate high-speed, long-distance travel to/from and through the surrounding area. Access to adjacent land uses is limited. Full movement intersections are at-grade and signalized or grade-separated interchanges.
3. Principal Arterials: Principal arterials provide a high level of mobility and favor that mobility over access to adjacent land uses. They provide access between lower classification streets (minor arterials and collectors) and higher classification streets (expressways and freeways).
4. Minor Arterials: Minor arterial streets balance mobility of through traffic with access to adjacent land uses. Travel speeds and capacity are lower than for principal arterials. Separate turn lanes, especially continuous left turn lanes, may be used to permit access to land uses on both sides of the street.
5. Collectors: Collectors are roadways that collect traffic from nearby local streets.
Neighborhood collectors remain in the neighborhood and are residential in character. Mixed-use collectors form the edge of neighborhoods and have a wider right of way to allow for future turn lanes or additional width in the future. Residential homes are typically not allowed to face mixed-use collectors. Business collectors serve commercial development and may be in industrial areas, mixed use neighborhoods, or regional commercial shopping areas. Access to and from many businesses is provided and speeds are lower than on arterial roadways.
These five classifications serve as a means of understanding the existing highway system in the region and are also used as a framework in the PACOG travel demand model. They are shown in Figure 2.3.
The two major roadways that bisect Pueblo County, Interstate 25 (I-25) and U.S. Highway 50, carry almost all of the traffic that goes through Pueblo. These two roads form the framework of the state highway network through Pueblo that comprises 250 of the 420 miles of major roads. Other significant state highways that traverse the region include State Highway (SH) 96 and SH 78. Additionally, SH 45 runs the majority of the way through the urban section of Pueblo, carrying traffic from the south interchange with I-25 to U.S. Highway 50A. SH 10 also cuts through the southern portion of Pueblo County but is not generally utilized by Pueblo traffic; rather it is a connection between La Junta and Walsenburg.
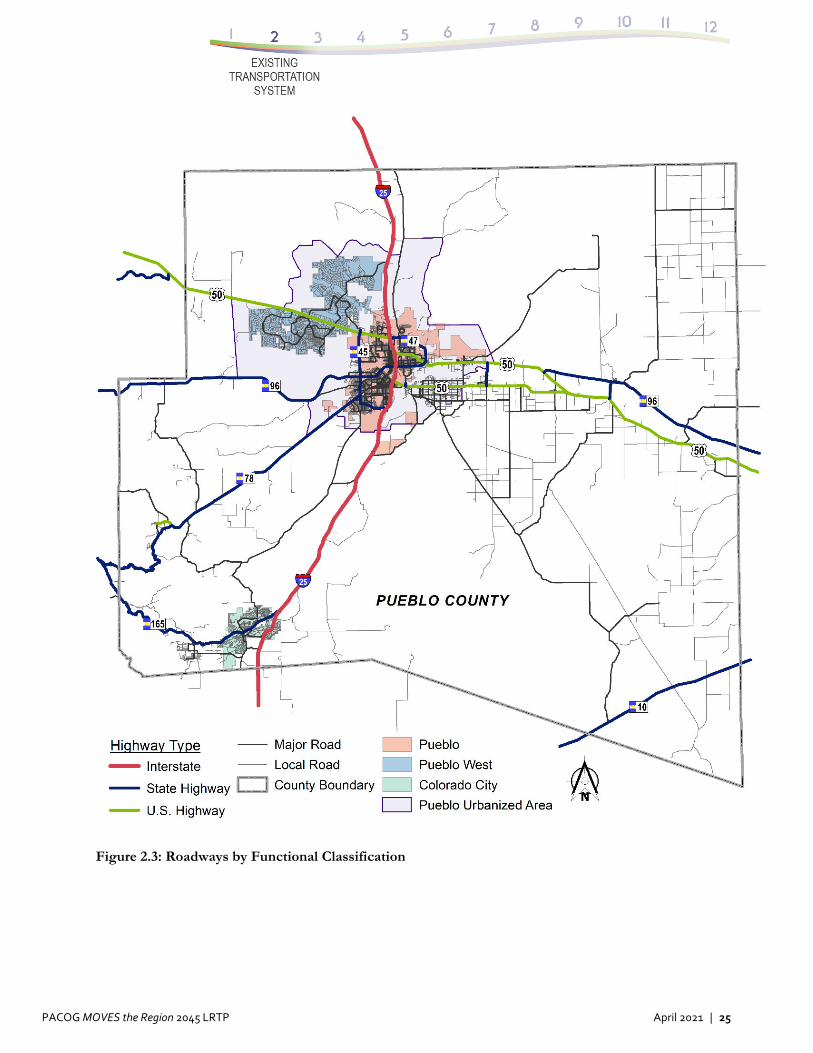
PACOG MOVES the Region 2045 LRTP April 2021 | 25
Figure 2.3: Roadways by Functional Classification
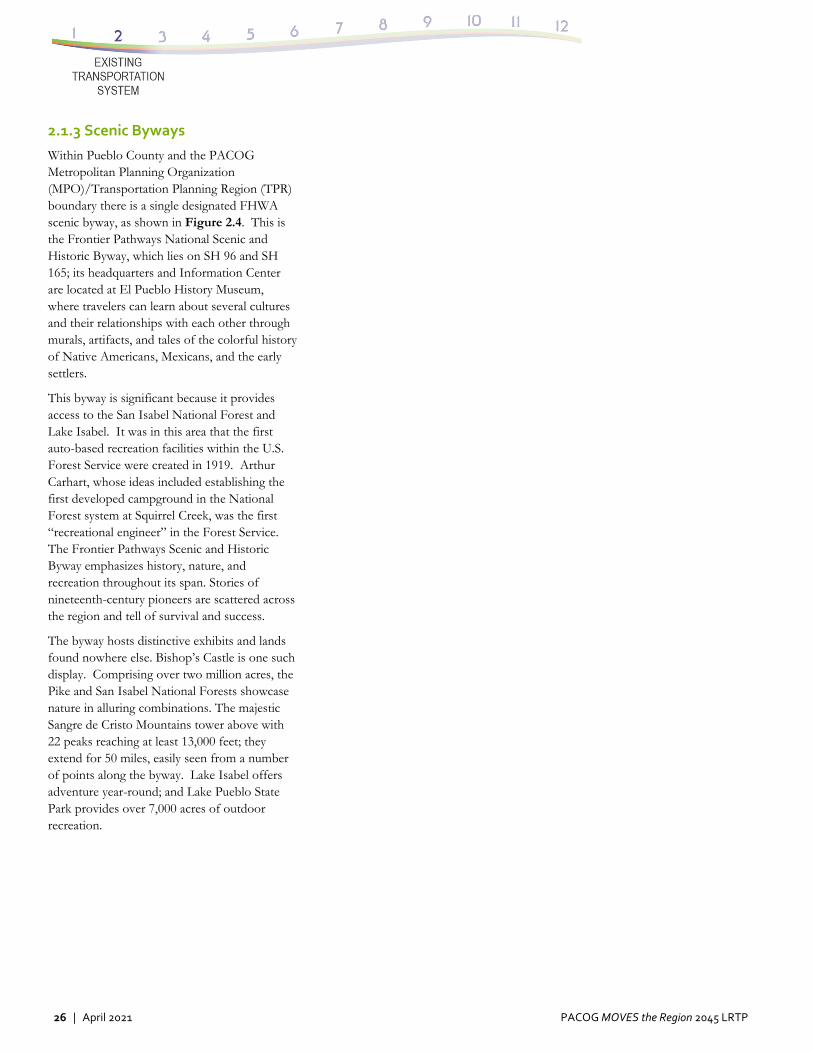
26 | April 2021 PACOG MOVES the Region 2045 LRTP
2.1.3 Scenic Byways
Within Pueblo County and the PACOG Metropolitan Planning Organization (MPO)/Transportation Planning Region (TPR) boundary there is a single designated FHWA scenic byway, as shown in Figure 2.4. This is the Frontier Pathways National Scenic and Historic Byway, which lies on SH 96 and SH 165; its headquarters and Information Center are located at El Pueblo History Museum, where travelers can learn about several cultures and their relationships with each other through murals, artifacts, and tales of the colorful history of Native Americans, Mexicans, and the early settlers.
This byway is significant because it provides access to the San Isabel National Forest and Lake Isabel. It was in this area that the first auto-based recreation facilities within the U.S. Forest Service were created in 1919. Arthur Carhart, whose ideas included establishing the first developed campground in the National Forest system at Squirrel Creek, was the first “recreational engineer” in the Forest Service. The Frontier Pathways Scenic and Historic Byway emphasizes history, nature, and recreation throughout its span. Stories of nineteenth-century pioneers are scattered across the region and tell of survival and success.
The byway hosts distinctive exhibits and lands found nowhere else. Bishop’s Castle is one such display. Comprising over two million acres, the Pike and San Isabel National Forests showcase nature in alluring combinations. The majestic Sangre de Cristo Mountains tower above with 22 peaks reaching at least 13,000 feet; they extend for 50 miles, easily seen from a number of points along the byway. Lake Isabel offers adventure year-round; and Lake Pueblo State Park provides over 7,000 acres of outdoor recreation.
PACOG MOVES the Region 2045 LRTP April 2021 | 27
Figure 2.4: Frontier Pathways National Scenic and Historic Byway
28 | April 2021 PACOG MOVES the Region 2045 LRTP
2.1.4 Commercial Vehicle Routes
The City and County of Pueblo do not designate truck routes as roadways specifically designed and designated for truck traffic. The routes that commercial vehicle use are primarily the state highways in and out of the Pueblo, coupled with the principal arterials in Pueblo West and those that encircle the city. In addition, parts of Overton Road; DOT Road, which leads to the Transportation Test Center; and 36th Lane south from U.S. Highway 50 serve as commercial corridors.
Primary locations served by commercial truck traffic include the Airport Industrial Park (AIP) and the Target Distribution facility, the largest activity node nearby. Additional truck traffic through the AIP services the Pueblo Chemical Agent-Destruction Pilot Plant in the northern portion of the Pueblo Chemical Depot, although in early 2015 the United States began destroying its largest remaining stockpile of chemical-laden artillery shells and neutralizing 2,600 tons of aging mustard gas agent. As of April 2020, 50 percent of the mustard gas agent had been destroyed, reaching a significant milestone for the facility.
Truck traffic also originates from the Evraz Rocky Mountain Steel Mill on the south side of the City of Pueblo, with traffic primarily loading directly onto I-25 at Indiana Avenue. Additional truck traffic is found serving the other industrial areas including those along Dillon Drive/Platteville Avenue in the northwest portion of the community, the industrial areas surrounding the rail yards in the central Pueblo area, and the industrial parks scattered around the city.
One significant issue that has been discussed in the last few years is the lack of redundant roadways to serve commercial traffic if an incident occurs on I-25. This condition exists throughout the MPO area.
2.1.5 Hazardous Materials Routes
The chief of the Colorado State Patrol is authorized by the Colorado Revised Statutes (C.R.S.) §42-20-108 (1) and (2) and §§42-20-403, 504, and 508 to promulgate rules and regulations for the permitting, routing, and safe transportation of hazardous and nuclear materials by motor vehicle within the state of Colorado, both in interstate and intrastate transportation. Pursuant to C.R.S. §42-20-108.5, the chief is authorized to adopt rules and regulations that exempt agricultural products from the hazardous materials rules. The locations of the hazardous materials routes in Pueblo County are shown in Figure 2.5.
The Department of Public Safety Division of State Patrol’s rules and regulations concerning the permitting, routing, and transportation of hazardous and nuclear materials and the intrastate transportation of agricultural products in Colorado can be found on the State Patrol website: https://www.colorado.gov/pacific/csp/hazardous-materials.
2.1.6 Nuclear Materials Route
The transportation of nuclear materials by motor vehicle must comply with the following Code of Federal Regulations (CFR) provisions established by federal law and regulations: 49 CFR Parts 107, 171, 172, 173, 177, 178, 180, 387, and 397. These are also enforced by the State Patrol pursuant to C.R.S. §42-20-108. The locations of the nuclear materials routes in Pueblo County are shown in Figure 2.6.
According to the 2018 C.R.S. § 42-20-402 (3)(b), nuclear materials do not include “wastes from mining, milling, smelting, or similar processing of ores and mineral-bearing material.”
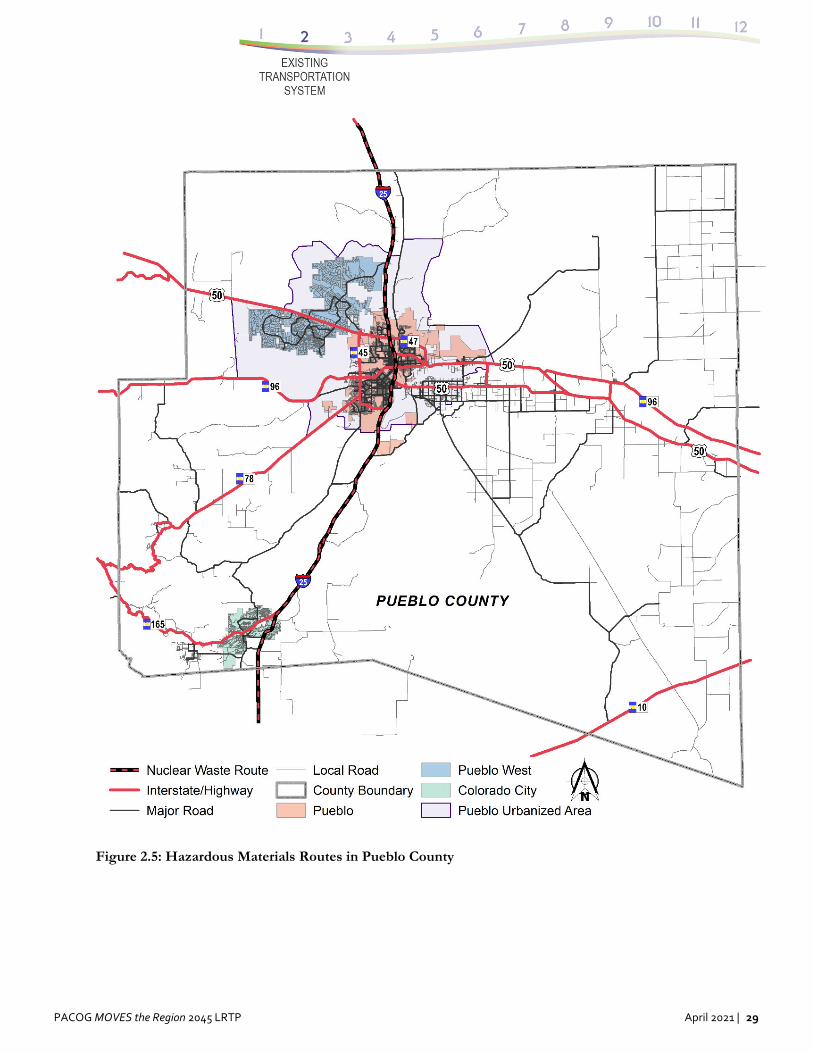
PACOG MOVES the Region 2045 LRTP April 2021 | 29
Figure 2.5: Hazardous Materials Routes in Pueblo County
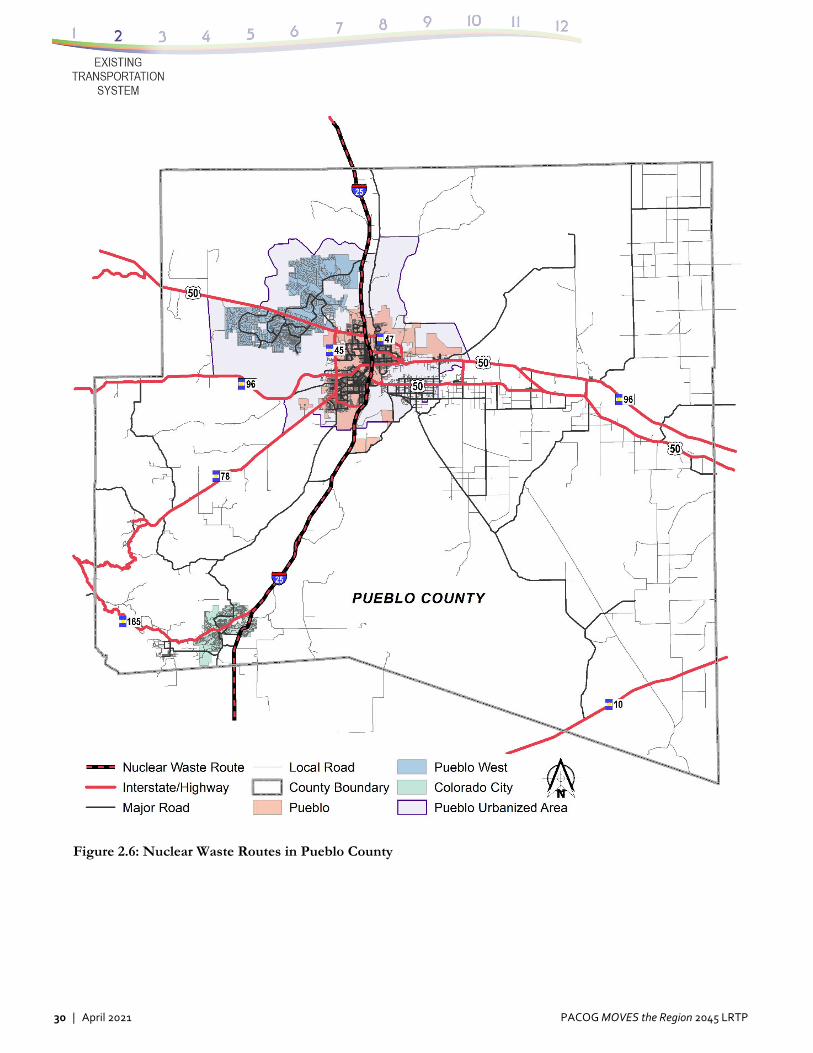
30 | April 2021 PACOG MOVES the Region 2045 LRTP
Figure 2.6: Nuclear Waste Routes in Pueblo County
PACOG MOVES the Region 2045 LRTP April 2021 | 31
2.1.7 Pavement & Bridge Condition
Pavement and bridge condition measurements and remediation are a logical starting point to serve the mobility goals set in the 2045 LRTP. The Pueblo region depends largely on the automobile mode and the truck freight mode for transportation. Establishing a set of baseline existing conditions for highways involves considering all eight of the 2045 LRTP goals presented in Section 1: (1) safety, (2) infrastructure condition, (3) congestion reduction, (4) system reliability, (5) freight movement and economic vitality, (6) environmental sustainability, (7) reduced project delivery delays, and (8) multimodal transportation. Of the eight LRTP planning categories cited in Chapter 1, four relate most directly to the highway network:
1. Safety
2. Infrastructure condition
3. System reliability
4. Freight movement and economic vitality
Focusing on the supply side of roadway transportation—the road network—is the most efficient way to reach the LRTP goals. If roads and bridges are in proper condition, safety, infrastructure condition, system reliability, and freight movement/vitality will be attainable goals. For this reason, two comprehensive reporting measures were applied to all CDOT and selected city and county infrastructure in Pueblo County: pavement condition and bridge condition.
CDOT Online Transportation Information System (OTIS)
CDOT provides comprehensive traffic and road condition data to PACOG via the Online Transportation Information System (OTIS) system. Information is provided on current and projected traffic volumes, state highway attributes, summary roadway statistics, and road and bridge conditions. Current year, historical, and trend data (forecasted traffic) are also provided. PACOG received the most current statistics, drawn from 2018 condition reports, from the OTIS database. Pueblo County provided city and county data, where available. In keeping with a focus on giving priority to
maintaining the higher functional classification roads, or facility roads (see Chapter 1, Table 2.1, PACOG Planning Goal 2: Infrastructure Condition), the CDOT on-system condition databases were the primary source of data for this condition report. An effort to collect pavement and bridge condition data at city and county locations is anticipated to be a continued goal of the MPO.
Table 2.3 summarizes the state highways within the Pueblo MPO along with their total centerline miles of pavement and pavement condition. Many of the roadways individually achieve an 80 percent or higher percentage of miles in the high plus moderate category of total miles. Those roadways with Primary Drivability Life Class (PDLC) values less than 80 percent represent segments that require investment. Note that Table 2.3 reflects a snapshot of conditions during 2018 and may not capture construction upgrades that were completed during late 2019 and 2020.
Figure 2.7 and Table 2.3 show that in Pueblo County, 12 percent of the centerline miles fall into the “High” PDLC category (compared with 36 percent five years ago); 49 percent fall into the “Moderate” category (compared with 40 percent five years ago); and 39 percent fall into the “Low” category (compared with 24 percent five years ago). The total percentage of “High + Moderate” PDLCs is thus 61 percent (compared with 76 percent five years ago). This 61 percent value falls short of the 80 percent value identified as a target by CDOT across the state, and furthermore it is degraded from the county average PDLC value of five years ago, showing the work that needs to be done to maintain and improve roads in Pueblo County.
Figure 2.7 shows the 15 state highways, some by CDOT segment, cited in Table 2.3 as well as the 80 percent target. For example, in Pueblo County, 63 percent of the I-25 miles rate in the high or moderate drivability class. Chief among those that rate below 80 percent in the drivability index are all of U.S. Highway 50 (CDOT segments A, B, and C). Six of the roads in the county are at or above the desired 80 percent threshold, having in fact a 100 percent PDLC value: (1) SH 45, (2) SH 47, (3) SH 78B, (4) SH 165, (5) SH 227, and (6) SH 231.
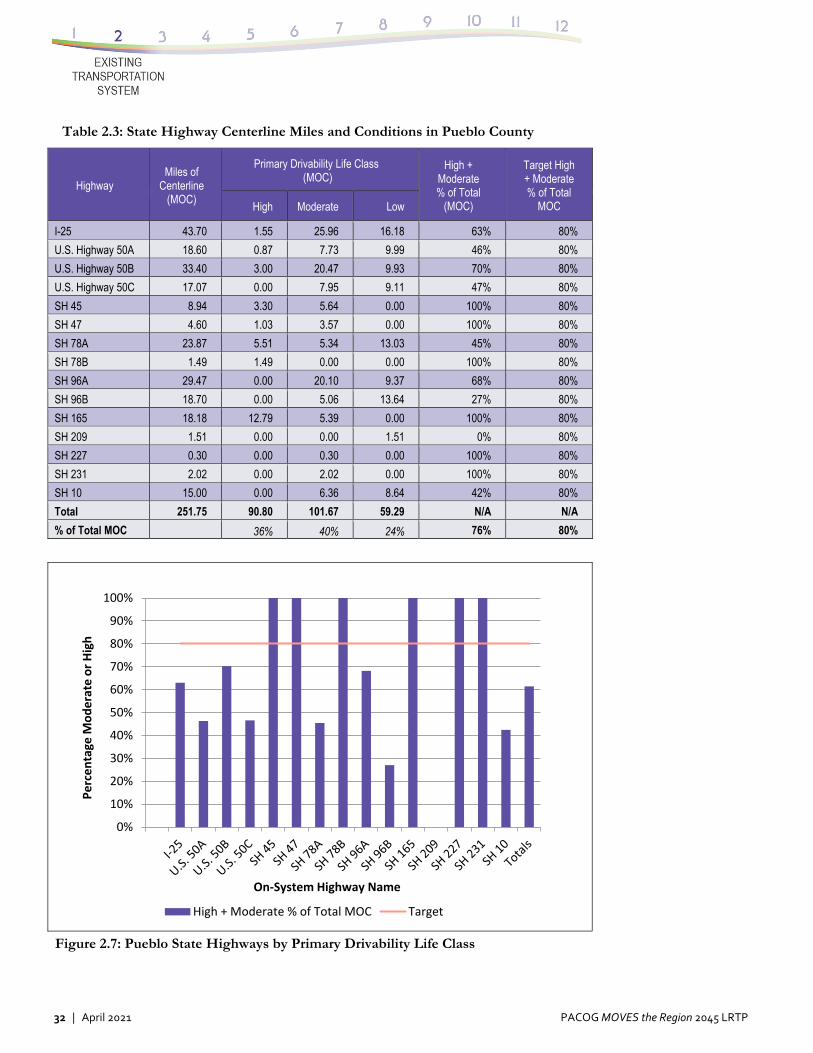
32 | April 2021 PACOG MOVES the Region 2045 LRTP
Table 2.3: State Highway Centerline Miles and Conditions in Pueblo County
Highway Miles of
Centerline (MOC)
Primary Drivability Life Class (MOC)
High + Moderate % of Total
(MOC)
Target High + Moderate % of Total
MOC High Moderate Low
I-25 43.70 1.55 25.96 16.18 63% 80%
U.S. Highway 50A 18.60 0.87 7.73 9.99 46% 80%
U.S. Highway 50B 33.40 3.00 20.47 9.93 70% 80%
U.S. Highway 50C 17.07 0.00 7.95 9.11 47% 80%
SH 45 8.94 3.30 5.64 0.00 100% 80%
SH 47 4.60 1.03 3.57 0.00 100% 80%
SH 78A 23.87 5.51 5.34 13.03 45% 80%
SH 78B 1.49 1.49 0.00 0.00 100% 80%
SH 96A 29.47 0.00 20.10 9.37 68% 80%
SH 96B 18.70 0.00 5.06 13.64 27% 80%
SH 165 18.18 12.79 5.39 0.00 100% 80%
SH 209 1.51 0.00 0.00 1.51 0% 80%
SH 227 0.30 0.00 0.30 0.00 100% 80%
SH 231 2.02 0.00 2.02 0.00 100% 80%
SH 10 15.00 0.00 6.36 8.64 42% 80%
Total 251.75 90.80 101.67 59.29 N/A N/A
% of Total MOC 36% 40% 24% 76% 80%
Figure 2.7: Pueblo State Highways by Primary Drivability Life Class
0%
10%
20%
30%
40%
50%
60%
70%
80%
90%
100%
Percentage
Moderate or High
On‐System Highway Name
High + Moderate % of Total MOC Target
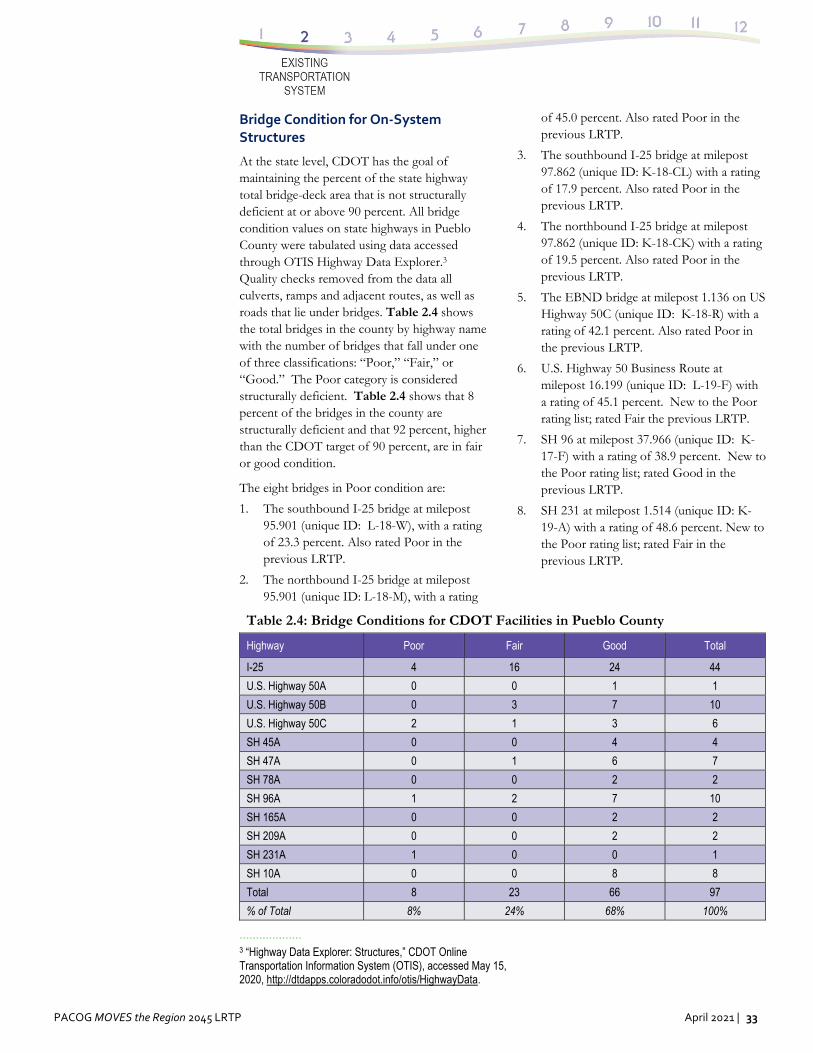
PACOG MOVES the Region 2045 LRTP April 2021 | 33
Bridge Condition for On‐System Structures
At the state level, CDOT has the goal of maintaining the percent of the state highway total bridge-deck area that is not structurally deficient at or above 90 percent. All bridge condition values on state highways in Pueblo County were tabulated using data accessed through OTIS Highway Data Explorer.3 Quality checks removed from the data all culverts, ramps and adjacent routes, as well as roads that lie under bridges. Table 2.4 shows the total bridges in the county by highway name with the number of bridges that fall under one of three classifications: “Poor,” “Fair,” or “Good.” The Poor category is considered structurally deficient. Table 2.4 shows that 8 percent of the bridges in the county are structurally deficient and that 92 percent, higher than the CDOT target of 90 percent, are in fair or good condition.
The eight bridges in Poor condition are:
1. The southbound I-25 bridge at milepost 95.901 (unique ID: L-18-W), with a rating of 23.3 percent. Also rated Poor in the previous LRTP.
2. The northbound I-25 bridge at milepost 95.901 (unique ID: L-18-M), with a rating
of 45.0 percent. Also rated Poor in the previous LRTP.
3. The southbound I-25 bridge at milepost 97.862 (unique ID: K-18-CL) with a rating of 17.9 percent. Also rated Poor in the previous LRTP.
4. The northbound I-25 bridge at milepost 97.862 (unique ID: K-18-CK) with a rating of 19.5 percent. Also rated Poor in the previous LRTP.
5. The EBND bridge at milepost 1.136 on US Highway 50C (unique ID: K-18-R) with a rating of 42.1 percent. Also rated Poor in the previous LRTP.
6. U.S. Highway 50 Business Route at milepost 16.199 (unique ID: L-19-F) with a rating of 45.1 percent. New to the Poor rating list; rated Fair the previous LRTP.
7. SH 96 at milepost 37.966 (unique ID: K-17-F) with a rating of 38.9 percent. New to the Poor rating list; rated Good in the previous LRTP.
8. SH 231 at milepost 1.514 (unique ID: K-19-A) with a rating of 48.6 percent. New to the Poor rating list; rated Fair in the previous LRTP.
Table 2.4: Bridge Conditions for CDOT Facilities in Pueblo County
Highway Poor Fair Good Total
I-25 4 16 24 44
U.S. Highway 50A 0 0 1 1
U.S. Highway 50B 0 3 7 10
U.S. Highway 50C 2 1 3 6
SH 45A 0 0 4 4
SH 47A 0 1 6 7
SH 78A 0 0 2 2
SH 96A 1 2 7 10
SH 165A 0 0 2 2
SH 209A 0 0 2 2
SH 231A 1 0 0 1
SH 10A 0 0 8 8
Total 8 23 66 97
% of Total 8% 24% 68% 100%
··················· 3 “Highway Data Explorer: Structures,” CDOT Online Transportation Information System (OTIS), accessed May 15, 2020, http://dtdapps.coloradodot.info/otis/HighwayData.
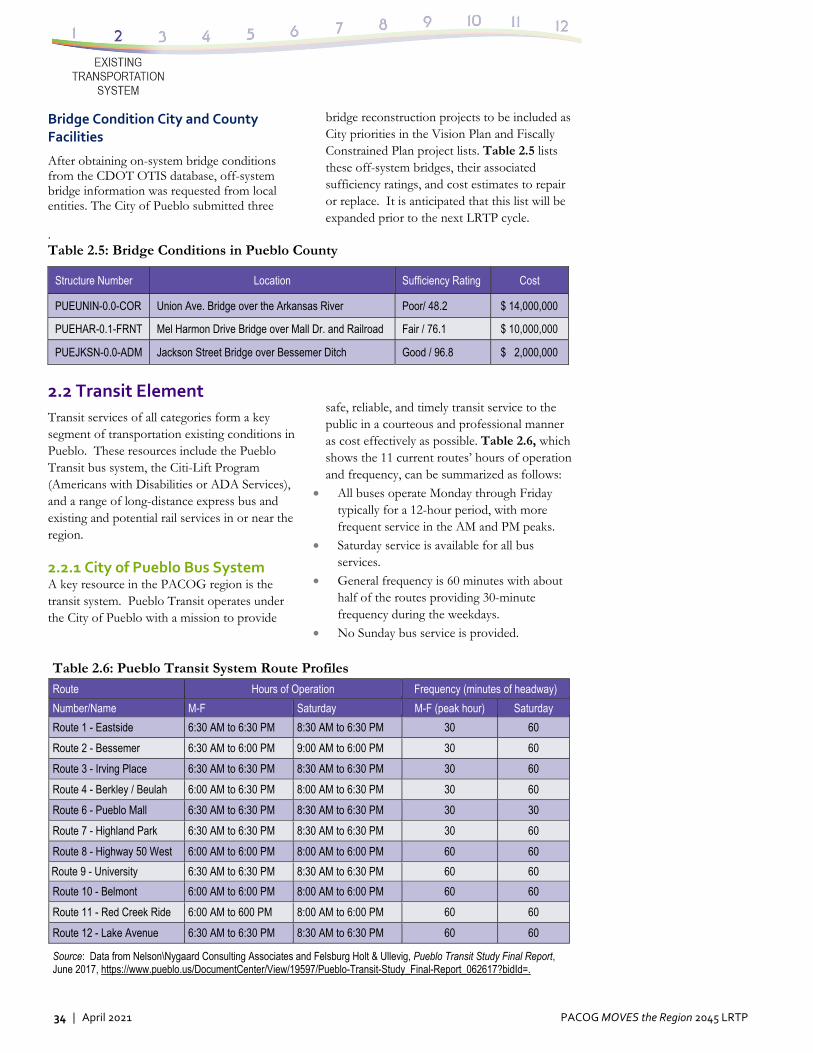
34 | April 2021 PACOG MOVES the Region 2045 LRTP
Bridge Condition City and County Facilities
After obtaining on-system bridge conditions from the CDOT OTIS database, off-system bridge information was requested from local entities. The City of Pueblo submitted three
bridge reconstruction projects to be included as City priorities in the Vision Plan and Fiscally Constrained Plan project lists. Table 2.5 lists these off-system bridges, their associated sufficiency ratings, and cost estimates to repair or replace. It is anticipated that this list will be expanded prior to the next LRTP cycle.
. Table 2.5: Bridge Conditions in Pueblo County
Structure Number Location Sufficiency Rating Cost
PUEUNIN-0.0-COR Union Ave. Bridge over the Arkansas River Poor/ 48.2 $ 14,000,000
PUEHAR-0.1-FRNT Mel Harmon Drive Bridge over Mall Dr. and Railroad Fair / 76.1 $ 10,000,000
PUEJKSN-0.0-ADM Jackson Street Bridge over Bessemer Ditch Good / 96.8 $ 2,000,000
2.2 Transit Element
Transit services of all categories form a key segment of transportation existing conditions in Pueblo. These resources include the Pueblo Transit bus system, the Citi-Lift Program (Americans with Disabilities or ADA Services), and a range of long-distance express bus and existing and potential rail services in or near the region.
2.2.1 City of Pueblo Bus System A key resource in the PACOG region is the transit system. Pueblo Transit operates under the City of Pueblo with a mission to provide
safe, reliable, and timely transit service to the public in a courteous and professional manner as cost effectively as possible. Table 2.6, which shows the 11 current routes’ hours of operation and frequency, can be summarized as follows:
All buses operate Monday through Friday typically for a 12-hour period, with more frequent service in the AM and PM peaks.
Saturday service is available for all bus services.
General frequency is 60 minutes with about half of the routes providing 30-minute frequency during the weekdays.
No Sunday bus service is provided.
Table 2.6: Pueblo Transit System Route Profiles
Route Hours of Operation Frequency (minutes of headway)
Number/Name M-F Saturday M-F (peak hour) Saturday
Route 1 - Eastside 6:30 AM to 6:30 PM 8:30 AM to 6:30 PM 30 60
Route 2 - Bessemer 6:30 AM to 6:00 PM 9:00 AM to 6:00 PM 30 60
Route 3 - Irving Place 6:30 AM to 6:30 PM 8:30 AM to 6:30 PM 30 60
Route 4 - Berkley / Beulah 6:00 AM to 6:30 PM 8:00 AM to 6:30 PM 30 60
Route 6 - Pueblo Mall 6:30 AM to 6:30 PM 8:30 AM to 6:30 PM 30 30
Route 7 - Highland Park 6:30 AM to 6:30 PM 8:30 AM to 6:30 PM 30 60
Route 8 - Highway 50 West 6:00 AM to 6:00 PM 8:00 AM to 6:00 PM 60 60
Route 9 - University 6:30 AM to 6:30 PM 8:30 AM to 6:30 PM 60 60
Route 10 - Belmont 6:00 AM to 6:00 PM 8:00 AM to 6:00 PM 60 60
Route 11 - Red Creek Ride 6:00 AM to 600 PM 8:00 AM to 6:00 PM 60 60
Route 12 - Lake Avenue 6:30 AM to 6:30 PM 8:30 AM to 6:30 PM 60 60
Source: Data from Nelson\Nygaard Consulting Associates and Felsburg Holt & Ullevig, Pueblo Transit Study Final Report, June 2017, https://www.pueblo.us/DocumentCenter/View/19597/Pueblo-Transit-Study_Final-Report_062617?bidId=.
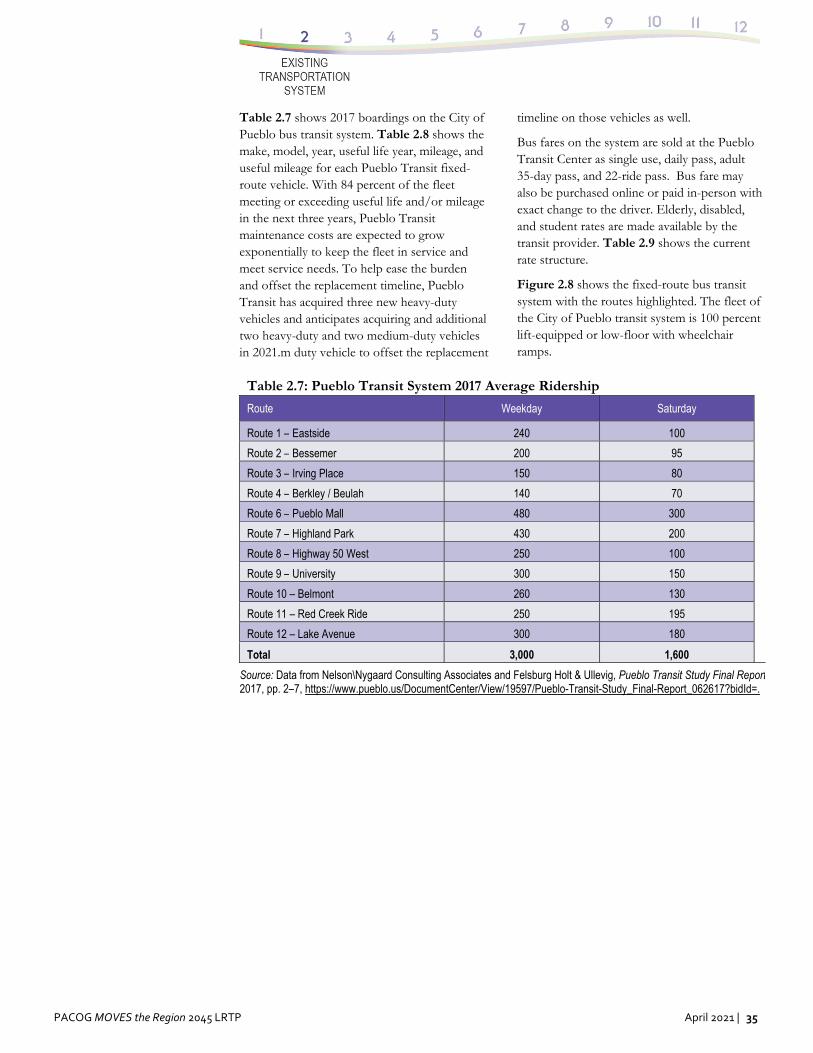
PACOG MOVES the Region 2045 LRTP April 2021 | 35
Table 2.7 shows 2017 boardings on the City of Pueblo bus transit system. Table 2.8 shows the make, model, year, useful life year, mileage, and useful mileage for each Pueblo Transit fixed-route vehicle. With 84 percent of the fleet meeting or exceeding useful life and/or mileage in the next three years, Pueblo Transit maintenance costs are expected to grow exponentially to keep the fleet in service and meet service needs. To help ease the burden and offset the replacement timeline, Pueblo Transit has acquired three new heavy-duty vehicles and anticipates acquiring and additional two heavy-duty and two medium-duty vehicles in 2021.m duty vehicle to offset the replacement
timeline on those vehicles as well.
Bus fares on the system are sold at the Pueblo Transit Center as single use, daily pass, adult 35-day pass, and 22-ride pass. Bus fare may also be purchased online or paid in-person with exact change to the driver. Elderly, disabled, and student rates are made available by the transit provider. Table 2.9 shows the current rate structure.
Figure 2.8 shows the fixed-route bus transit system with the routes highlighted. The fleet of the City of Pueblo transit system is 100 percent lift-equipped or low-floor with wheelchair ramps.
Table 2.7: Pueblo Transit System 2017 Average Ridership
Route Weekday Saturday
Route 1 – Eastside 240 100
Route 2 – Bessemer 200 95
Route 3 – Irving Place 150 80
Route 4 – Berkley / Beulah 140 70
Route 6 – Pueblo Mall 480 300
Route 7 – Highland Park 430 200
Route 8 – Highway 50 West 250 100
Route 9 – University 300 150
Route 10 – Belmont 260 130
Route 11 – Red Creek Ride 250 195
Route 12 – Lake Avenue 300 180
Total 3,000 1,600
Source: Data from Nelson\Nygaard Consulting Associates and Felsburg Holt & Ullevig, Pueblo Transit Study Final Report2017, pp. 2–7, https://www.pueblo.us/DocumentCenter/View/19597/Pueblo-Transit-Study_Final-Report_062617?bidId=.
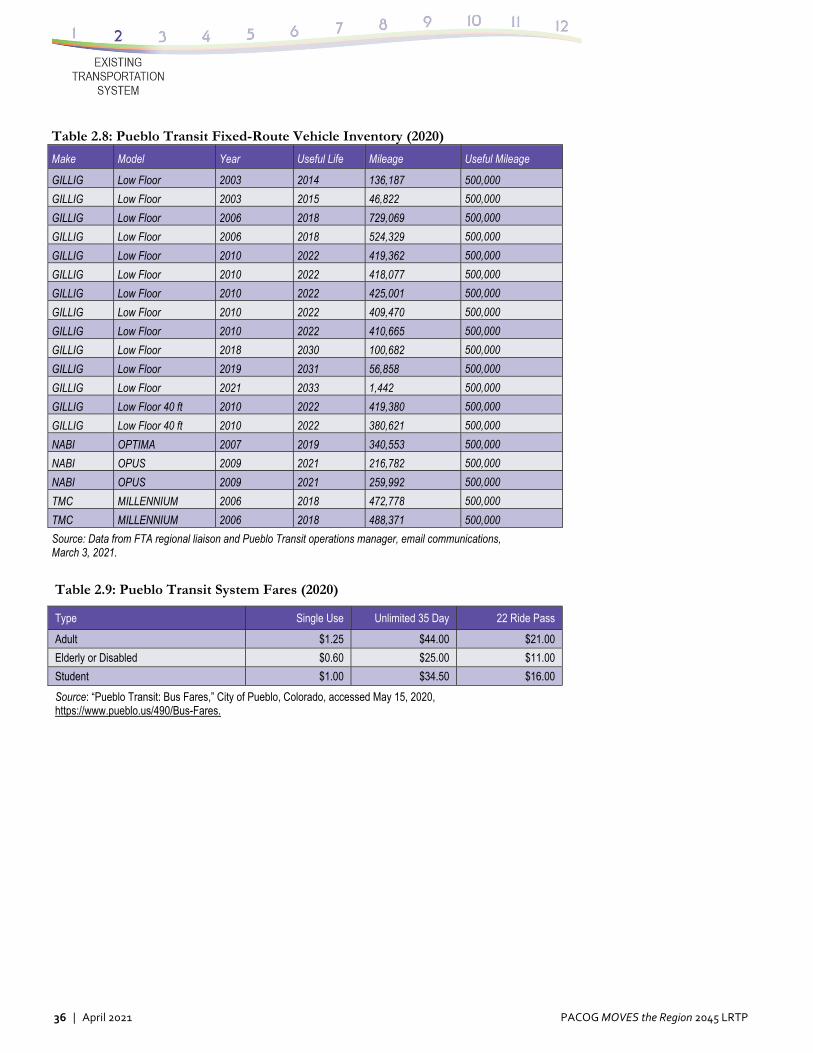
36 | April 2021 PACOG MOVES the Region 2045 LRTP
Table 2.8: Pueblo Transit Fixed-Route Vehicle Inventory (2020)
Make Model Year Useful Life Mileage Useful Mileage
GILLIG Low Floor 2003 2014 136,187 500,000
GILLIG Low Floor 2003 2015 46,822 500,000
GILLIG Low Floor 2006 2018 729,069 500,000
GILLIG Low Floor 2006 2018 524,329 500,000
GILLIG Low Floor 2010 2022 419,362 500,000
GILLIG Low Floor 2010 2022 418,077 500,000
GILLIG Low Floor 2010 2022 425,001 500,000
GILLIG Low Floor 2010 2022 409,470 500,000
GILLIG Low Floor 2010 2022 410,665 500,000
GILLIG Low Floor 2018 2030 100,682 500,000
GILLIG Low Floor 2019 2031 56,858 500,000
GILLIG Low Floor 2021 2033 1,442 500,000
GILLIG Low Floor 40 ft 2010 2022 419,380 500,000
GILLIG Low Floor 40 ft 2010 2022 380,621 500,000
NABI OPTIMA 2007 2019 340,553 500,000
NABI OPUS 2009 2021 216,782 500,000
NABI OPUS 2009 2021 259,992 500,000
TMC MILLENNIUM 2006 2018 472,778 500,000
TMC MILLENNIUM 2006 2018 488,371 500,000
Source: Data from FTA regional liaison and Pueblo Transit operations manager, email communications, March 3, 2021.
Table 2.9: Pueblo Transit System Fares (2020)
Type Single Use Unlimited 35 Day 22 Ride Pass
Adult $1.25 $44.00 $21.00
Elderly or Disabled $0.60 $25.00 $11.00
Student $1.00 $34.50 $16.00
Source: “Pueblo Transit: Bus Fares,” City of Pueblo, Colorado, accessed May 15, 2020, https://www.pueblo.us/490/Bus-Fares.
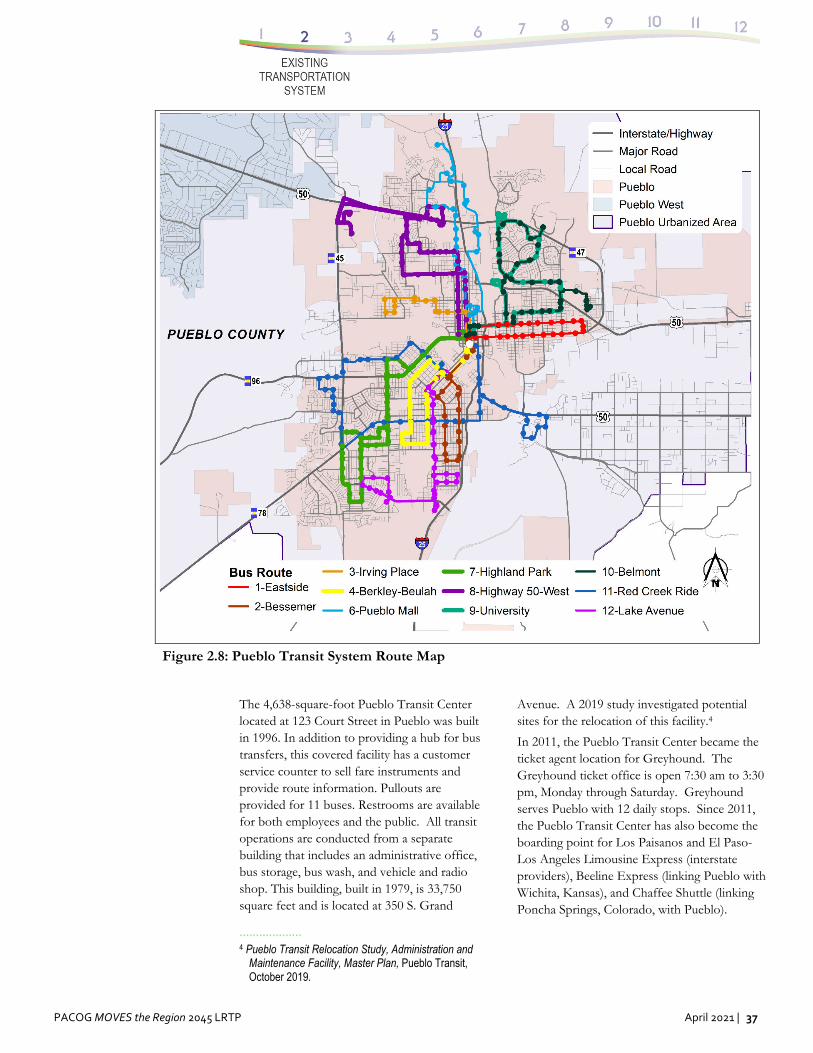
PACOG MOVES the Region 2045 LRTP April 2021 | 37
The 4,638-square-foot Pueblo Transit Center located at 123 Court Street in Pueblo was built in 1996. In addition to providing a hub for bus transfers, this covered facility has a customer service counter to sell fare instruments and provide route information. Pullouts are provided for 11 buses. Restrooms are available for both employees and the public. All transit operations are conducted from a separate building that includes an administrative office, bus storage, bus wash, and vehicle and radio shop. This building, built in 1979, is 33,750 square feet and is located at 350 S. Grand
··················· 4 Pueblo Transit Relocation Study, Administration and
Maintenance Facility, Master Plan, Pueblo Transit, October 2019.
Avenue. A 2019 study investigated potential sites for the relocation of this facility.4
In 2011, the Pueblo Transit Center became the ticket agent location for Greyhound. The Greyhound ticket office is open 7:30 am to 3:30 pm, Monday through Saturday. Greyhound serves Pueblo with 12 daily stops. Since 2011, the Pueblo Transit Center has also become the boarding point for Los Paisanos and El Paso-Los Angeles Limousine Express (interstate providers), Beeline Express (linking Pueblo with Wichita, Kansas), and Chaffee Shuttle (linking Poncha Springs, Colorado, with Pueblo).
Figure 2.8: Pueblo Transit System Route Map
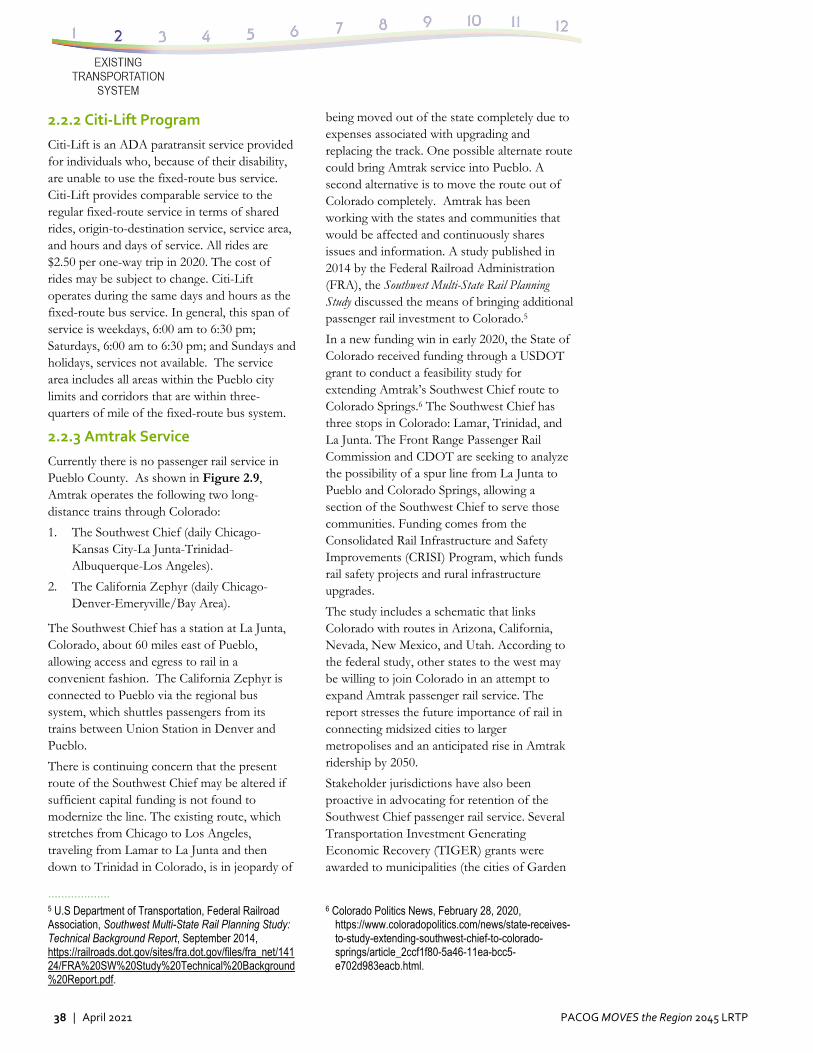
38 | April 2021 PACOG MOVES the Region 2045 LRTP
2.2.2 Citi‐Lift Program
Citi-Lift is an ADA paratransit service provided for individuals who, because of their disability, are unable to use the fixed-route bus service. Citi-Lift provides comparable service to the regular fixed-route service in terms of shared rides, origin-to-destination service, service area, and hours and days of service. All rides are $2.50 per one-way trip in 2020. The cost of rides may be subject to change. Citi-Lift operates during the same days and hours as the fixed-route bus service. In general, this span of service is weekdays, 6:00 am to 6:30 pm; Saturdays, 6:00 am to 6:30 pm; and Sundays and holidays, services not available. The service area includes all areas within the Pueblo city limits and corridors that are within three-quarters of mile of the fixed-route bus system.
2.2.3 Amtrak Service
Currently there is no passenger rail service in Pueblo County. As shown in Figure 2.9, Amtrak operates the following two long-distance trains through Colorado:
1. The Southwest Chief (daily Chicago-Kansas City-La Junta-Trinidad-Albuquerque-Los Angeles).
2. The California Zephyr (daily Chicago-Denver-Emeryville/Bay Area).
The Southwest Chief has a station at La Junta, Colorado, about 60 miles east of Pueblo, allowing access and egress to rail in a convenient fashion. The California Zephyr is connected to Pueblo via the regional bus system, which shuttles passengers from its trains between Union Station in Denver and Pueblo.
There is continuing concern that the present route of the Southwest Chief may be altered if sufficient capital funding is not found to modernize the line. The existing route, which stretches from Chicago to Los Angeles, traveling from Lamar to La Junta and then down to Trinidad in Colorado, is in jeopardy of
··················· 5 U.S Department of Transportation, Federal Railroad Association, Southwest Multi-State Rail Planning Study: Technical Background Report, September 2014, https://railroads.dot.gov/sites/fra.dot.gov/files/fra_net/14124/FRA%20SW%20Study%20Technical%20Background%20Report.pdf.
being moved out of the state completely due to expenses associated with upgrading and replacing the track. One possible alternate route could bring Amtrak service into Pueblo. A second alternative is to move the route out of Colorado completely. Amtrak has been working with the states and communities that would be affected and continuously shares issues and information. A study published in 2014 by the Federal Railroad Administration (FRA), the Southwest Multi-State Rail Planning Study discussed the means of bringing additional passenger rail investment to Colorado.5
In a new funding win in early 2020, the State of Colorado received funding through a USDOT grant to conduct a feasibility study for extending Amtrak’s Southwest Chief route to Colorado Springs.6 The Southwest Chief has three stops in Colorado: Lamar, Trinidad, and La Junta. The Front Range Passenger Rail Commission and CDOT are seeking to analyze the possibility of a spur line from La Junta to Pueblo and Colorado Springs, allowing a section of the Southwest Chief to serve those communities. Funding comes from the Consolidated Rail Infrastructure and Safety Improvements (CRISI) Program, which funds rail safety projects and rural infrastructure upgrades.
The study includes a schematic that links Colorado with routes in Arizona, California, Nevada, New Mexico, and Utah. According to the federal study, other states to the west may be willing to join Colorado in an attempt to expand Amtrak passenger rail service. The report stresses the future importance of rail in connecting midsized cities to larger metropolises and an anticipated rise in Amtrak ridership by 2050.
Stakeholder jurisdictions have also been proactive in advocating for retention of the Southwest Chief passenger rail service. Several Transportation Investment Generating Economic Recovery (TIGER) grants were awarded to municipalities (the cities of Garden
6 Colorado Politics News, February 28, 2020, https://www.coloradopolitics.com/news/state-receives-to-study-extending-southwest-chief-to-colorado-springs/article_2ccf1f80-5a46-11ea-bcc5-e702d983eacb.html.
PACOG MOVES the Region 2045 LRTP April 2021 | 39
City, Kansas, and La Junta, Colorado, both in 2014. These grants focus investment on the La Junta subdivision of the BNSF, which carries the Southwest Chief. Investment in the Southwest Chief rail corridor will make a substantial difference in the quality of passenger rail service in Kansas and eastern Colorado,
which has declined in speed and reliability over the last 15 years. Good passenger rail service contributes significantly to the health and vitality of many rural communities along the route, providing mobility and access to economic opportunity.
Figure 2.9: Amtrak Passenger Rail Service near Pueblo in 2015
2.2.4 North‐South Intercity Rail Service Opportunities
North-south passenger rail service is also desired to serve the major person travel movements in Colorado between Fort Collins and Pueblo. The development of this type of service through the Pueblo area is most likely to gain momentum through collaboration with Front Range partners.
Between 2004 and 2012, the Front Range Express (FREX) bus service served the area between Colorado Springs and the Denver metro area, demonstrating that a strong north-south transit market exists. Although discussed, FREX service was not extended south to Pueblo during that period. In July 2015, CDOT introduced Bustang Interregional Express Bus
service connecting commuters to and from Denver along the I-25 and I-70 corridors. North-south connections with service from Fort Collins to Colorado Springs as well as an east-west line linking West Glenwood with Denver were launched. In early 2018, service was added between Lamar and Pueblo along U.S. Highway 50. The new program, dubbed "Outrider," initially focused on rural Colorado. By May 2018, the Outrider program had expanded, adding a line between Pueblo and Alamosa.
In 2017, the Southwest Chief and Front Range Passenger Rail Commission was tasked with facilitating the implementation and operation of future passenger rail to support this growth and expand transportation options.
40 | April 2021 PACOG MOVES the Region 2045 LRTP
future passenger rail to support this gowth and expand transportation options. To support local planning in anticipation of these potential rail services, Pueblo County prepared a station area plan to evaluate the feasibility of possible station locations, identify trackage improvements, and recommend amenities and other improvements that will enhance the passenger experience. The study identified the Union Depot Station Area as the preferred station area for the Amtrak Southwest Chief and Front Range Passenger Rail Station.
2.2.5 Rocky Mountain Rail Authority & High‐Speed Rail Corridor
During 2008–2009, the Rocky Mountain Rail Authority (RMRA) was formed by intergovernmental agreements between Colorado cities, towns, counties, and transportation districts. Both the City of Pueblo and Pueblo County served as members and had seats on the RMRA Board of Directors. RMRA contracted with CDOT to analyze a high-speed corridor alternative as part of a larger passenger rail feasibility study. According to the RMRA fact sheet, the development of best candidate rail corridors and stations as well as a standing committee to provide follow-on support were recommended.7
The high-speed rail feasibility study was also coordinated with the CDOT Rail Relocation Implementation Study, which investigated moving interstate coal shipments and other goods using freight trains from the existing
tracks in the I-25 Corridor onto new tracks on the Eastern Plains.8 If implemented, the relocation would permit passenger service to operate on the existing tracks or the use of the right-of-way to construct separate tracks for passenger trains.
In 2018, CDOT released the Colorado Freight and Passenger Rail Plan.9 Pueblo leadership participated in the discussion and development of freight and passenger facilities in the state and in Pueblo County. The findings relevant to Pueblo included:
The yearly economic impact of a stop in Pueblo would be approximately $3.4 million.
A 2016 Amtrak study found that a Pueblo stop could attract 14,000 new riders annually and generate approximately $1.45 million in ticket revenues. However, significant track upgrades between La Junta and Pueblo and completion of Positive Train Control safety systems are needed to accommodate 79 mile per hour speeds. Cost estimates for needed investments to support this extension are not currently available.
The evolution of passenger rail and freight rail shows opportunities for investment in Pueblo County, at both the state and national levels.
2.2.6 Light Rail / Trolley
Public transit has existed in the City of Pueblo since 1878, when a horse-drawn streetcar
system connected downtown to the Union Depot area. According to the Colorado Cultural Resource Survey: Pueblo’s North Side Neighborhood, “In 1890, Frank Julian Sprague contracted with the Richmond, Virginia, Union Passenger Railway to design and build an electrically powered public transportation system
··················· 7 Transportation Economics & Management Systems, Quandel Consultants, and GBSM, High-Speed Rail Feasibility Study Executive Summary, Rocky Mountain Rail Authority, March 2010, http://rockymountainrail.org/documents/RMRAExecutiveSummary-FINAL.pdf. 8 Colorado Department of Transportation, Colorado Rail
Relocation Implementation Study: Final Report, January 2009, https://www.codot.gov/admin/library/studies/study-
serving the entire city. The result was the first successful electrified streetcar system in the United States.
According to the Colorado Cultural Resource Survey: Pueblo’s North Side Neighborhood, “In 1890, Frank Julian Sprague contracted with the Richmond, Virginia, Union Passenger Railway to design and
archives/railroadstudy/documents/finalreport-2009/r2c2_final_report-full020609.pdf.
9 CDOT, Colorado Freight and Passenger Rail Plan,
2018, https://www.codot.gov/about/transportation-commission/documents/2018-agendas-and-supporting-documents/july-2018/link-files/02-b1-sfprp-draft-final-july-2018-tc.pdf.
PACOG MOVES the Region 2045 LRTP April 2021 | 41
build an electrically powered public transportation system serving the entire city. The result was the first successful electrified streetcar system in the United States.
According to the Colorado Cultural Resource Survey: Pueblo’s North Side Neighborhood, “In 1890, Frank Julian Sprague contracted with the Richmond, Virginia, Union Passenger Railway to design and build an electrically powered public transportation system serving the entire city. The result was the first successful electrified streetcar system in the United States. Within a few years, cities across the country installed extensive electric streetcar systems,” transporting more passengers at higher speeds and with less pollution than horse-drawn or steam-powered conveyances.”10 The trolley system in Pueblo existed until 1947, and much of the City of Pueblo developed around these historic trolley line routes.
While the Pueblo area today is likely too small to support the development of a modern light rail system, continued changes in the cost of gasoline are stimulating public discussion of local transit needs in the Pueblo community. Corridor preservation for future transit development will become increasingly important as the Pueblo urbanized area continues to expand.
The City of Pueblo, in cooperation with Pueblo Transit, has been a consistent advocate of a rubber tire downtown trolley. A planning committee has developed options to potentially serve two key markets:
1. Tourists visiting Pueblo – A potential trolley route with 10- to 15-minute headways may serve the Historic Arkansas River Project (HARP), El Pueblo Museum, the convention center, and the commercial areas of downtown (Main Street / Union Avenue).
2. Residents and employers of Pueblo – A potential trolley route with 30-minute headways may link three existing neighborhoods and 10 of the 25 largest
··················· 10 Kenneth T. Jackson, Crabgrass Frontier:The
Suburbanization of the United States (Oxford: Oxford University Press, 1985), p.108 as quoted in Adam Thomas, Historitecture, LLC, Colorado Cultural Resource Survey: Pueblo’s North Side Neighborhood
employers in Pueblo. This route would also link these homes and employment sites to the commercial amenities in downtown Pueblo.
2.3 Non‐Motorized Element
2.3.1 Introduction
Non-motorized transportation, also known as active transportation, includes walking, bicycling, and variants such as small-wheeled transport (skates, skateboards, and scooters) and wheelchair travel. These modes provide both recreation (they are an end in themselves) and transportation (they provide access to goods and activities), although users may consider a particular trip serves both objectives. For example, some people choose to walk or bicycle rather than drive because they enjoy the activity, even though it takes longer. In the context of the PACOG LRTP, two non-motorized modes are presented: walking and bicycling.
The Pueblo area has a relatively mild climate and gentle topography, which makes travel by non-motorized modes an enjoyable experience for participants throughout most of the year. During the past 20 years, the City of Pueblo, Pueblo County, and other local and state agencies have continued to construct and improve sidewalks, trails, and a wide range of bicycle and walking facilities. Further enhancements to the non-motorized transportation system will play an ever-increasing role in accommodating the non-motorized travel needs of Pueblo residents and visitors.
In order for bicycling and walking to become comfortable and convenient transportation options, these modes must be fully integrated into everyday decisions, such as where new schools will be located, how residential communities will be designed, and how each roadway will be built, among others. It is far more cost effective to provide for bicycle and
Phase I, City of Pueblo Historic Preservation Commission, April 2007, p. 35, https://www.pueblo.us/DocumentCenter/View/645/North-Side-Survey-Report?bidId=.
42 | April 2021 PACOG MOVES the Region 2045 LRTP
pedestrian mobility from the start than it is to retrofit later.
A previous Pueblo Comprehensive Plan (2002), as well as the adopted 2035 Long Range Transportation Plan (2008) and the 2040 Long Range Transportation Plan (2015), clearly saw the need to identify key facilities to establish a framework for a citywide network of sidewalks, trails, and recreational amenities linking major activity centers, parks, and other features of Pueblo. Safe and convenient non-motorized travel provides many benefits, including reduced traffic congestion, user cost savings, road and parking facility savings, economic development, a better environment, and health benefits to the community by encouraging regular physical activity.
The ultimate goal of a transportation system is to provide access to goods, services, and activities. In general, the more transportation options available, the more attractive the lifestyle. In urban areas, walking and cycling are often the fastest and most efficient way to perform short trips. A built environment that is hostile to non-motorized transport reduces everybody’s travel choices and drives dependency on automobiles. The results of automobile dependency are increased traffic congestion, higher road and parking facility costs, increased consumer costs, and greater environmental degradation. Adequate pedestrian and cycling conditions are essential to guarantee everyone a minimal level of mobility (referred to as “basic mobility”).
Non-motorized travel can contribute to the local economy by supporting tourism. This can be accomplished by providing suitable pedestrian and cycling facilities to tourist attractions, by creating trail connections to specific tourist attractions, and by providing public transit access to tourist destinations. Pedestrian-friendly conditions also improve the commercial and cultural vibrancy of communities. Increased pedestrian traffic helps create a safer and more pleasant environment. Once visitors arrive in a community, they often explore it by walking or bicycling. Some trail networks are themselves destination tourist attractions, bringing hundreds
··················· 11 ETC Institute, 2020 City of Pueblo Community Survey:
Findings Report, City of Pueblo, March 2020,
of visitors and significant visitor dollars annually to the community.
Local interest in and support for public parks also contributes to pedestrian and bicycle activity in the MPO area. A community survey has been administered in the City of Pueblo every two years since 2010. The information gathered from these surveys helps the City establish budget priorities and refine policy decisions, with the survey questions evolving over time. In 2020, the community survey assessed citizen satisfaction with the quality of municipal services.11 Two survey questions and their results define issues that have relevance to the non-motorized component of the LRTP:
1. “Satisfaction with City services. Eighty-five percent (85%), who had an opinion, were satisfied (rating of 4 or 5 on a 5-point scale) with the quality of the city’s fire and EMS services; 59% were satisfied with the quality of City parks and recreation programs and facilities, and 58% were satisfied with the quality of police services.” (p. ii, boldface added)
2. “Parks and Recreation. Seventy-one percent (71%) of the residents surveyed, who had an opinion, were satisfied (rating of 4 or 5 on a 5-point scale) with the location of city parks; 69% were satisfied with the number of city parks, and 65% were satisfied with the maintenance of city parks.” (p. iii)
Additionally, City of Pueblo residents indicated the two areas within Parks and Recreation that should receive the most emphasis over the next two years were the maintenance of city parks and the city’s youth recreation programs. (p. 21)
A take-away from these community survey results is that residents of Pueblo rate the quality of their local parks highly and are satisfied with the number and location of parks.
https://www.pueblo.us/DocumentCenter/View/26250/2020-Pueblo-Survey-Report.
PACOG MOVES the Region 2045 LRTP April 2021 | 43
2.3.2 Walk Mode
The City of Pueblo builds, maintains, and improves pedestrian facilities to achieve full compliance with the ADA. The City’s sidewalk program is the central feature of the pedestrian effort. A key component of the sidewalk program is the curb-ramp installation program, which installs an average of 237 curb ramps a year to address the needs of people with disabilities and others. Funding for the program has come largely from Community Development Block Grant (CDBG) funds; requests for curb ramps are included in neighborhood requests for annual selection of CDBG projects. Between 2009 and 2013, over 280,000 linear feet of sidewalks were installed in the City of Pueblo. During that same time period, 1,180 ADA ramps were installed. The City of Pueblo has continued to invest in non-motorized infrastructure. In 2019–2020, the City repaired 125 ADA ramps on SH 45, SH 96, and U.S. Highway 50C. The City has plans to repair another 212 ramps during the summer of 2020. The work plan has more than 15 ramps on the list for repair in the calendar year (CY) 2022 overlay project (U.S. Highway 50B). By the end of CY 2022, all ADA ramps requiring repair will be fixed.
As awareness grows within the community on the value and pleasure of the walking mode of travel, further emphasis on pedestrian infrastructure and safety will grow. The 2045 LRTP reflects this interest and commitment with a concerted effort to support multimodal transportation (goal 8). This goal includes efforts to collect observed trail use, improve the school routes for students, and support infrastructure improvements related to the walk mode.
2.3.3 Bicycle Mode
The Pueblo region completed its first Bikeway System Plan in 1979. The plan was updated in 1990 and again in 1999 when supplemental efforts that included St. Charles Mesa, Pueblo West, and Pueblo County were incorporated. Since the 1999 update, the City of Pueblo has made a strong effort to expand and promote multiple forms of non-motorized transportation and to incorporate the planning efforts into the 2030, 2035, 2040, and currently the 2045 LRTPs.
In order to provide a bikeway system that attracts both resident and visitor bicyclists and enhances opportunities for bicycling in Pueblo, the City has pursued development of a comprehensive bikeway network that provides a high level of service and seamless travel for the bicyclist. Over the past several years there have been significant strides in expanding and improving this bicycle network.
Bike facilities, both on- and off-street, are defined as follows:
Bike Lane – a portion of the roadway designated for bicyclist use.
Bike Route – a specially designated shared roadway that is preferred for bicycle travel for certain recreational or transportation purposes.
Bikeway – a generic term for any road, street, path, or way that in some manner is specifically designated for bicycle travel, regardless of whether such facilities are designated for the exclusive use of bicycles or are to be shared with other transportation modes.
Multi-Use Trail (path) – a concrete or asphalt path physically separated from motor vehicle traffic, except at road crossings. It accommodates a variety of users (including bicyclists and pedestrians) for both recreation and transportation purposes.
Local Service Bikeway – a local circulation route for bicyclists, including any neighborhood street not classified as a primary route.
Primary Route – Generally an on-street route.
Each of these components plays a part in the overall regional planning for bicycling in Pueblo. Note also that many bicycle facilities are designed to serve both cyclists and pedestrians. The ideal development plan also references the general principles identified for continued development of the bikeway network, which include: Connecting bicyclists to desired
destinations, such as employment centers, commercial districts, transit stations and bus routes, institutions, and recreational destinations.
44 | April 2021 PACOG MOVES the Region 2045 LRTP
Providing the most direct and convenient routes possible.
Providing an alternative route for less experienced bicyclists.
Filling in existing gaps in the bikeway network.
Targeting locations with the potential for implementation in the next 10 years.
Leading a bicyclist to safe street crossings. Accommodating bicyclists and pedestrians
on any new or improved bridges.
The publication of the updated Pueblo Bicycle and Trails Maps in 2010, which is still current in 2020 and available both online and as a paper version, has encouraged community input into
the City’s bikeway system. The maps, shown in Figure 2.10 and Figure 2.11, categorize the bike routes using the same nomenclature as one would see associated with downhill skiing. Green was established as the color designating suitability for all riders, blue for intermediate riders, and black for experienced riders. The assignments were based on roadway character, adjacent land use, roadway width, traffic volume, and traffic speed. The maps also emphasize safety, providing bicyclists with information on riding in traffic, left-turn options, trail courtesy, hand signals, advice on riding in darkness, communication techniques, and theft prevention, as well as several other tips.
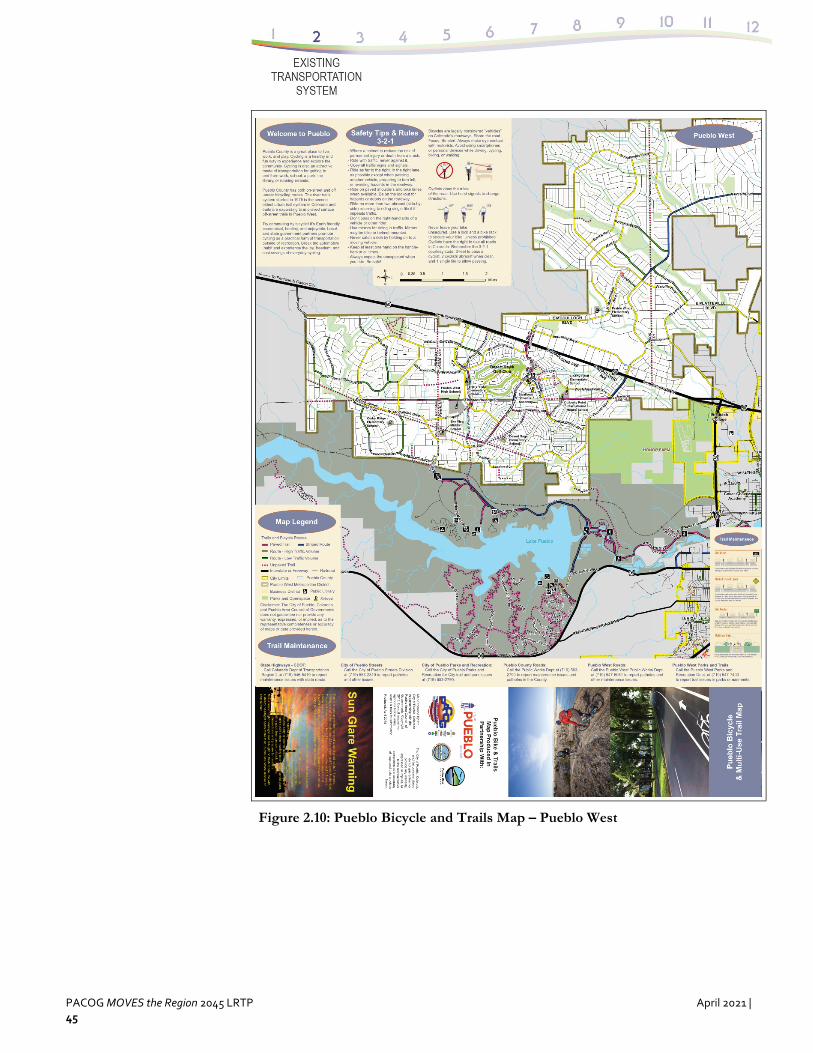
PACOG MOVES the Region 2045 LRTP April 2021 | 45
Figure 2.10: Pueblo Bicycle and Trails Map – Pueblo West
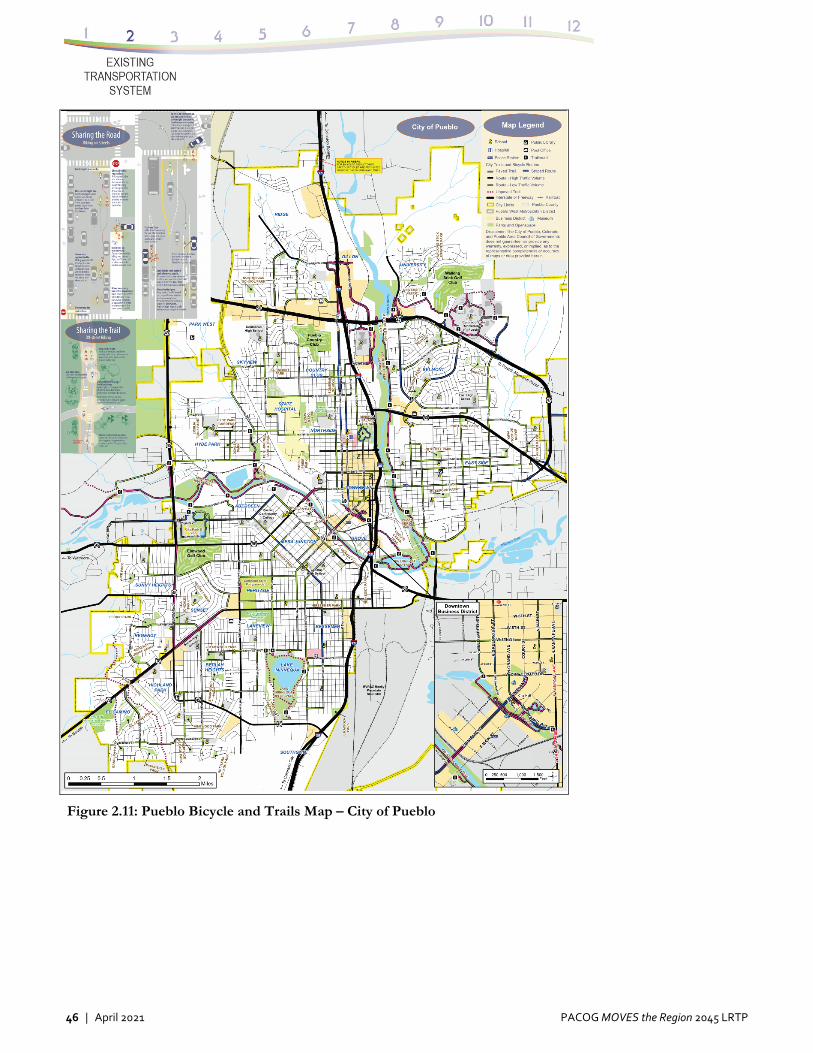
46 | April 2021 PACOG MOVES the Region 2045 LRTP
Figure 2.11: Pueblo Bicycle and Trails Map – City of Pueblo
PACOG MOVES the Region 2045 LRTP April 2021 | 47
2.3.4 Pueblo Bicycle Survey
The 2020 Pueblo Regional Bicycle & Pedestrian Master Plan contains an appendix dedicated to in-depth pedestrian and bicycle questions.12 The appendix noted the following:
A total of 233 respondents between 16 and 75 years of age with a balanced range of ages participated: 17 percent were age 25–34; 28% were age 35–44; 21 percent were age 45–54; 22 percent were age 55–64 and 9 percent were age 65–74.
Respondents were equally weighted between male and female. (p. 126)
The questions that were posed covered the gamut of non-motorized infrastructure, education and awareness, bicycle parking, and community events. Some of the key take-away from the survey is the very broad support for investment in bicycle infrastructure and programs, including backing for the following efforts:
Tourist & New Resident Package: Collaborate with United States Postal Service, local hotels, and tourism officials to include a pedestrian welcome package for new residents and tourists, which includes information about bikes, trails, transit and other active amenities offered in Pueblo (45% strongly support).
Education and Awareness Campaigns: An education/awareness campaign can be as large or small as necessary to fit the time and budget of the implementation staff. Campaigns can include everything from Public Service Announcements (PSAs) on local media outlets, billboards, and bus wraps to fliers around the community, interactive booths at farmers markets, and announcements or notices through the schools (51% strongly support).
City-Wide Wayfinding and Signage Program: Development of a comprehensive wayfinding signage program connecting bike routes between neighborhoods and destinations (44% strongly support).
··················· 12 PACOG, Pueblo Regional Bicycle & Pedestrian Master
Plan, “Appendix C: Bike & Pedestrian Master Plan: Survey,” December 16, 2020,
Bike Parking in Parking Lots: A policy to encourage increased parking spaces allocated for cyclists – (40% strongly support).
Commuter Incentive Program: Provide resources and incentives for residents and students to commute by bicycle or on foot. Create partnerships with local businesses to provide incentives, discounts, and services to participants. Run contests with prizes to engage people. Design a website to centralize information (45% strongly support).
Regular & Glow-In-the-Dark Paint: Use of regular and glow-in-the-dark paint to help delineate bike lanes (47% strongly support).
Decriminalization of skateboarding, the use of scooters and roller skates: Update codes to legitimize the use of skateboards, scooters, skates, and other forms of human powered transportation (36% strongly support).
Impounded Bike Program: Work with Pueblo Police Department to reintroduce impounded bikes into the community through a local non-profit (40% strongly support).
Establish Downtown Bike, Pedestrian, & Transit Mall: Create a pedestrian mall along Union Avenue and Main Street, past the city center (41% strongly support). (pp. 147–157)
In summary, strong support for bicycle investment is in place in the City of Pueblo.
2.3.5 Non‐Motorized Outreach
An important facet of encouraging non-motorized travel is advocacy. The City of Pueblo and PACOG, as well as other advocates of non-motorized travel in the region, have come together in a variety of ways to promote pedestrian and bicycle modes.
https://www.pueblo.us/DocumentCenter/View/27610/New-Bicycle-and-Pedestrian-Master-Plan.
48 | April 2021 PACOG MOVES the Region 2045 LRTP
Organizations and Group Action
The Pueblo Transportation, Planning, and Parks departments work together with citizen groups, such as Pueblo Active Community Environments (PACE) and the Pueblo Department of Public Health and Environment (PDPHE) to plan and develop bike improvements for the community. PACE is a grassroots community group that plays a significant role in regional bicycle planning. The group recognizes that bikeways provide benefits to both the cycling and non-cycling public. Bikeways attract more bicyclists, resulting in cleaner air, less noise pollution, and overall quality of life benefits. Bikeways also use public dollars efficiently by reducing road maintenance costs and enhancing economic development.
Social Media
PACE actively supports a Facebook account and a website (http://www.activepueblo.net) to promote events through a community calendar, to share ideas on where to bike, to provide electronic access to the bike maps, to promote Safe Routes to School programs, and to provide tips and videos on bicycle safety.
Special Events
Special events are an important means of encouraging bicycling and increasing ridership locally for youth and adults alike. Through participation in PACE, the City actively supports special events. These events are planned each year with the specific goal of attracting new bicyclists, celebrating the local infrastructure, and focusing on safe bicycling practices. A number of events have been initiated to promote various bicycling, walking and active living activities throughout the community for fun, fitness, and transportation, including:
Bike to Workdays
Downtown Bike Tour with police escort on Bike to Workdays
Bike Commuter Cup Challenge Bike/Walk to School Day National Trails Day Costume Cruiser Rides Arkansas Point Mountain Bike Race Angelo’s Criterion de Pueblo Bike Race
Dog Track Road Rides Red Gate Mountain Bike Rides Transportation Technology Center Road
Rides
Minnequa Lake Mountain Bike Rides
PACE volunteers also collaborate and work with officials and students at Colorado State University–Pueblo to help create a more bicycle-friendly and active campus and to create a more seamless non-motorized transportation system.
Bicycle Parking
Another factor that may encourage more cycling is improving the availability of adequate bicycle parking. While there are some downtown locations and employers that provide bike racks, overall bike parking is limited in Pueblo. In 2009, the City adopted an ordinance through the Pueblo Municipal Code requiring new construction or renovations that provide over 40 vehicle parking spaces to also provide bicycle parking. In 2009, several bike racks were installed throughout the downtown area by the Pueblo Downtown Association and more racks were added by the Urban Renewal Authority in 2011. PACE has produced a brochure on tips for selecting and installing bike racks for theft prevention and improved utilization. The PACE website encourages businesses to install bike racks and sponsor a bike rack elsewhere, and it lists local vendors that will build bike racks. A partnership has also been developed with the local community college welding students to build low-cost, high-quality bike racks for schools and local businesses.
Economic Benefits
Various communities in Colorado have captured the economic benefits of bicycling. Now more than ever, Pueblo is poised to reap the economic benefits of promoting bicycling within the community. Infrastructure, sporting events, recreational biking, bicycling facilities, and a desired way of life lead to a greater understanding of how bicycling can complement the City’s economic outlook. Pueblo has a unique opportunity to enhance the bicycle culture and appeal to its residents, future residents, employers, and visitors.
PACOG MOVES the Region 2045 LRTP April 2021 | 49
At the national long-distance bicycle level, Pueblo lies along three national bike routes with numerous long-distance cyclists passing through Pueblo on their coast-to-coast rides. Pueblo’s collaboration with the business community in fostering a more bicycle-friendly atmosphere for these visitors is a work in progress. The goal is to encourage bicyclists to spend an extra day in Pueblo, utilizing hotels, shopping, and dining, and to discover the rich historical, architectural and recreational aspects of the city. National programs offering discounts could be implemented by local businesses to display their support for cycling and welcome these visitors.
The Pueblo Economic Development Corporation (PEDCO) actively promotes Pueblo as a city in which to relocate or start a business.13 Many employers and their employees want to live and work in a place where a bicycling culture is prevalent, where it is possible to bike to work, the store, the library, and school. There is a growing population of Americans who want to live in a community where they have transportation alternatives with which to enjoy local amenities and services. Pueblo lends itself to this type of bicycle culture and promotes a vibrant lifestyle for both employers and employees. The City continues to embrace and support the local bicycle culture and use it as a tool to attract employers, business, and visitors. The bicycle friendly nature of Pueblo will complement other quality-of-life characteristics such as natural beauty, open space, and recreational opportunities.
Summary
The non-motorized modes of walking and bicycling are key components of the PACOG 2045 LRTP. Investment in facility expansion such as trails can readily serve both of these non-motorized modes. Continued investment in this important means of mobility is of great importance to the region. Recommendations to further develop interest in bicycle and non-motorized travel include: Disseminate current and appropriate
bicycling information to and from local enforcement agencies.
··················· 13Pueblo Economic Development Corps, accessed January 28, 2021, https://www.pedco.org/.
Evaluate bicycle-vehicle crashes for any infrastructure improvements or targeted community education campaigns needed.
Continue to work closely with local enforcement agencies to create innovative, pro-active education campaigns including enforcement that fosters the safety of bicyclists, pedestrians, and motorists.
Continue to encourage and coordinate official trainings for local enforcement agencies to ensure all City personnel are knowledgeable of current local, regional, and national bicycle policies and ordinances.
Review and potentially update enforcement techniques for handling special events such as critical masses and other protests to further bridge the communication gap between bicyclists and local enforcement agencies.
Promote a constructive process to determine what types of behavior require enforcement agency involvement.
Continue to support and encourage infrastructure development, bicycle sporting events, recreational biking, and bicycle facilities. This does not necessarily mean financial assistance, but is intended to encompass support through coordination efforts, promotion, and education.
2.4 Aviation
The Pueblo Memorial Airport (Airport Code: PUB) is 1 of 17 Commercial Service airports in Colorado and is the only airport in Pueblo County. It occupies 2,308 acres of land for aeronautical purposes. The airport is owned and operated by the City of Pueblo and offers aviation services through private companies that lease space from the airport. Some of these aviation services are flight training, commercial flights, hangar facilities, aircraft repair, fueling facilities, and a space for a potential restaurant or related facility. In addition to the airport property, the adjacent AIP consists of approximately 1,476 acres divided into 75 parcels. The City originally held the land for the industrial park and sells or leases parcels to
50 | April 2021 PACOG MOVES the Region 2045 LRTP
prospective businesses. The AIP is actively marketed by PEDCO.
The airport serves air carriers, air taxis, general aviation, and military aircraft. It is used for general aviation and by one airline, subsidized by the Essential Air Service program. Federal Aviation Administration (FAA) records say the airport had 4,345 passenger boardings (enplanements) in CY 2008, 5,192 in CY 2009 and 11,641 in CY 2010. The FAA’s National Plan of Integrated Airport Systems for 2011–2015 called it a non-primary commercial service airport based on enplanements in 2008 and 2009 (between 2,500 and 10,000 per year). In 2018, when Pueblo Memorial Airport surpassed 10,000 passenger boardings, it graduated into a new category.
The 2018 passenger trip total qualified the airport for a $1 million entitlement grant under the FAA Airport Improvement Program.14 The higher enplanement total in 2018 can be attributed to the airport’s airline partner, United/SkyWest Airlines, beginning service to and from Pueblo as well as a ramp-up in advertising. The funding can be used for infrastructure projects at the airport such as pavement, airfield upgrades, and safety-related initiatives. The funding will be made available in 2020. The Pueblo Airport now offers one-stop service to 440 destinations through Denver International Airport.
Pueblo Memorial Airport plays an important role in the community, both as a transportation hub and as a center of economic activity. The 2020 Colorado Aviation Economic Impact Study (CEIS) measured the economic impacts of Pueblo Memorial Airport and all airports in the state. Combining on-airport activity and visitor spending, PUB is responsible for 775 jobs; the total annual economic activity attributed to the airport, which includes direct, indirect, and induced impacts, totaled $38,660,000.15
··················· 14 Ryan Severance, “Pueblo Airport Eclipses 10,000
Passengers in 2018,” Pueblo Chieftain, January 11, 2018, https://www.chieftain.com/news/20190111/pueblo-airport-eclipses-10000-passengers-in-2018.
2.5 Summary
The Pueblo region contains all aspects of an excellent transportation system. The roadway element provides the key means of transportation with a full complement of interstate and state highways. This section provided an overview of Pueblo County roadways, scenic byways, commercial vehicle routes, hazardous materials routes, and nuclear materials routes and presented a tabulation of condition ratings for on-system and off-system road pavement and bridges in the region. On the transit side, the region supports a city bus system, the Citi-Lift program (ADA services), and long-distance bus service with links to nationwide Amtrak service. On the non-motorized side, the Pueblo region has invested heavily in all aspects of non-motorized infrastructure, including sidewalk repair and replacement, as well as construction of curb ramps designed to ADA standards. Trails and related facilities that serve both pedestrian and bicycle mode have also been the focus of continued non-motorized investment in the region. Social media and concerted public involvement are important and ongoing tools used to support non-motorized efforts in the region. The Pueblo Memorial Airport is the final transportation asset discussed in this section of the 2045 LRTP; this facility won a $1 million entitlement grant under the FAA Airport Improvement Program when it surpassed 10,000 enplanements in 2018, and its impacts on the community’s economic growth continue to expand.
15 CDOT, 2020 Airport Economic Impact Report, January 2020, https://www.codot.gov/programs/aeronautics/studies-plans-reports/2020ceis/2020ceisreports/pueblo-memorial-pub.pdf.
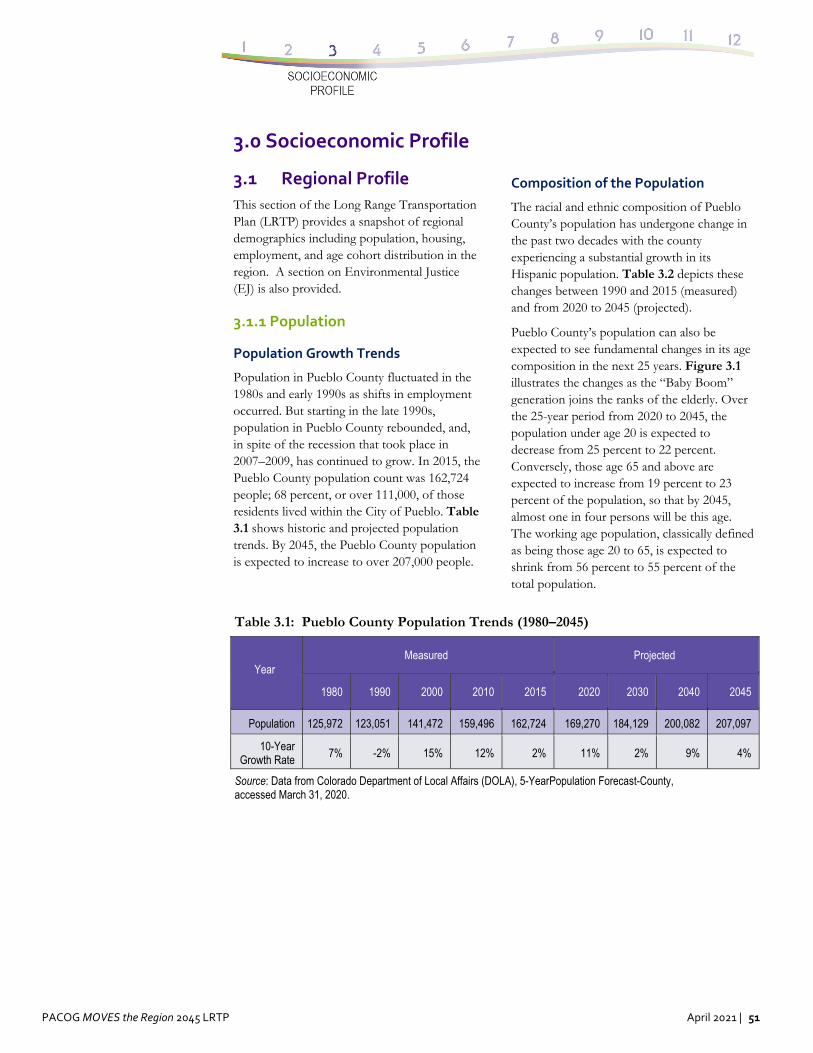
PACOG MOVES the Region 2045 LRTP April 2021 | 51
3.0 Socioeconomic Profile
3.1 Regional Profile
This section of the Long Range Transportation Plan (LRTP) provides a snapshot of regional demographics including population, housing, employment, and age cohort distribution in the region. A section on Environmental Justice (EJ) is also provided.
3.1.1 Population
Population Growth Trends
Population in Pueblo County fluctuated in the 1980s and early 1990s as shifts in employment occurred. But starting in the late 1990s, population in Pueblo County rebounded, and, in spite of the recession that took place in 2007–2009, has continued to grow. In 2015, the Pueblo County population count was 162,724 people; 68 percent, or over 111,000, of those residents lived within the City of Pueblo. Table 3.1 shows historic and projected population trends. By 2045, the Pueblo County population is expected to increase to over 207,000 people.
Composition of the Population
The racial and ethnic composition of Pueblo County’s population has undergone change in the past two decades with the county experiencing a substantial growth in its Hispanic population. Table 3.2 depicts these changes between 1990 and 2015 (measured) and from 2020 to 2045 (projected).
Pueblo County’s population can also be expected to see fundamental changes in its age composition in the next 25 years. Figure 3.1 illustrates the changes as the “Baby Boom” generation joins the ranks of the elderly. Over the 25-year period from 2020 to 2045, the population under age 20 is expected to decrease from 25 percent to 22 percent. Conversely, those age 65 and above are expected to increase from 19 percent to 23 percent of the population, so that by 2045, almost one in four persons will be this age. The working age population, classically defined as being those age 20 to 65, is expected to shrink from 56 percent to 55 percent of the total population.
Table 3.1: Pueblo County Population Trends (1980–2045)
Year Measured Projected
1980 1990 2000 2010 2015 2020 2030 2040 2045
Population 125,972 123,051 141,472 159,496 162,724 169,270 184,129 200,082 207,097
10-Year Growth Rate
7% -2% 15% 12% 2% 11% 2% 9% 4%
Source: Data from Colorado Department of Local Affairs (DOLA), 5-YearPopulation Forecast-County, accessed March 31, 2020.
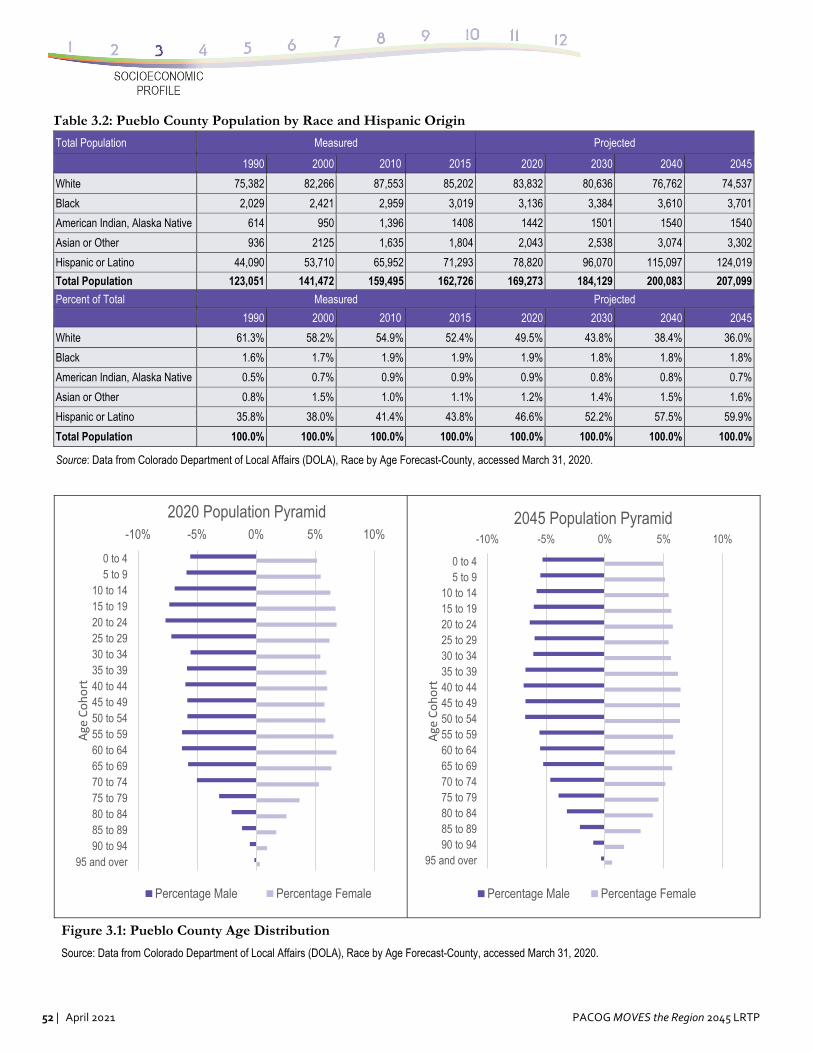
52 | April 2021 PACOG MOVES the Region 2045 LRTP
Figure 3.1: Pueblo County Age Distribution
Source: Data from Colorado Department of Local Affairs (DOLA), Race by Age Forecast-County, accessed March 31, 2020.
Table 3.2: Pueblo County Population by Race and Hispanic Origin
Total Population Measured Projected
1990 2000 2010 2015 2020 2030 2040 2045
White 75,382 82,266 87,553 85,202 83,832 80,636 76,762 74,537
Black 2,029 2,421 2,959 3,019 3,136 3,384 3,610 3,701
American Indian, Alaska Native 614 950 1,396 1408 1442 1501 1540 1540
Asian or Other 936 2125 1,635 1,804 2,043 2,538 3,074 3,302
Hispanic or Latino 44,090 53,710 65,952 71,293 78,820 96,070 115,097 124,019
Total Population 123,051 141,472 159,495 162,726 169,273 184,129 200,083 207,099
Percent of Total Measured Projected
1990 2000 2010 2015 2020 2030 2040 2045
White 61.3% 58.2% 54.9% 52.4% 49.5% 43.8% 38.4% 36.0%
Black 1.6% 1.7% 1.9% 1.9% 1.9% 1.8% 1.8% 1.8%
American Indian, Alaska Native 0.5% 0.7% 0.9% 0.9% 0.9% 0.8% 0.8% 0.7%
Asian or Other 0.8% 1.5% 1.0% 1.1% 1.2% 1.4% 1.5% 1.6%
Hispanic or Latino 35.8% 38.0% 41.4% 43.8% 46.6% 52.2% 57.5% 59.9%
Total Population 100.0% 100.0% 100.0% 100.0% 100.0% 100.0% 100.0% 100.0%
Source: Data from Colorado Department of Local Affairs (DOLA), Race by Age Forecast-County, accessed March 31, 2020.
-10% -5% 0% 5% 10%
0 to 45 to 9
10 to 1415 to 1920 to 2425 to 2930 to 3435 to 3940 to 4445 to 4950 to 5455 to 5960 to 6465 to 6970 to 7475 to 7980 to 8485 to 8990 to 94
95 and over
Age Cohort
2020 Population Pyramid
Percentage Male Percentage Female
-10% -5% 0% 5% 10%
0 to 45 to 9
10 to 1415 to 1920 to 2425 to 2930 to 3435 to 3940 to 4445 to 4950 to 5455 to 5960 to 6465 to 6970 to 7475 to 7980 to 8485 to 8990 to 94
95 and over
Age Cohort
2045 Population Pyramid
Percentage Male Percentage Female
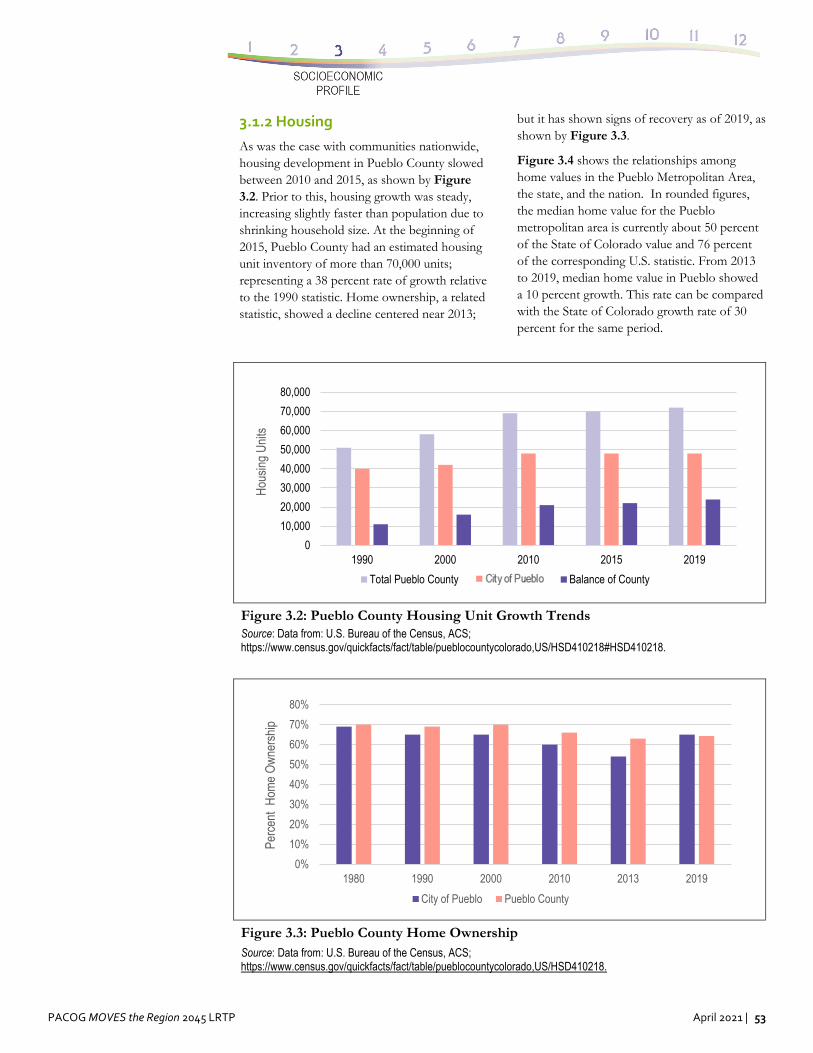
PACOG MOVES the Region 2045 LRTP April 2021 | 53
3.1.2 Housing
As was the case with communities nationwide, housing development in Pueblo County slowed between 2010 and 2015, as shown by Figure 3.2. Prior to this, housing growth was steady, increasing slightly faster than population due to shrinking household size. At the beginning of 2015, Pueblo County had an estimated housing unit inventory of more than 70,000 units; representing a 38 percent rate of growth relative to the 1990 statistic. Home ownership, a related statistic, showed a decline centered near 2013;
but it has shown signs of recovery as of 2019, as shown by Figure 3.3.
Figure 3.4 shows the relationships among home values in the Pueblo Metropolitan Area, the state, and the nation. In rounded figures, the median home value for the Pueblo metropolitan area is currently about 50 percent of the State of Colorado value and 76 percent of the corresponding U.S. statistic. From 2013 to 2019, median home value in Pueblo showed a 10 percent growth. This rate can be compared with the State of Colorado growth rate of 30 percent for the same period.
Figure 3.2: Pueblo County Housing Unit Growth Trends Source: Data from: U.S. Bureau of the Census, ACS; https://www.census.gov/quickfacts/fact/table/pueblocountycolorado,US/HSD410218#HSD410218.
Figure 3.3: Pueblo County Home Ownership Source: Data from: U.S. Bureau of the Census, ACS; https://www.census.gov/quickfacts/fact/table/pueblocountycolorado,US/HSD410218.
0%
10%
20%
30%
40%
50%
60%
70%
80%
1980 1990 2000 2010 2013 2019
Perc
ent
Hom
e O
wne
rshi
p
City of Pueblo Pueblo County
0
10,000
20,000
30,000
40,000
50,000
60,000
70,000
80,000
1990 2000 2010 2015 2019
Hou
sing
Uni
ts
Total Pueblo County Balance of County
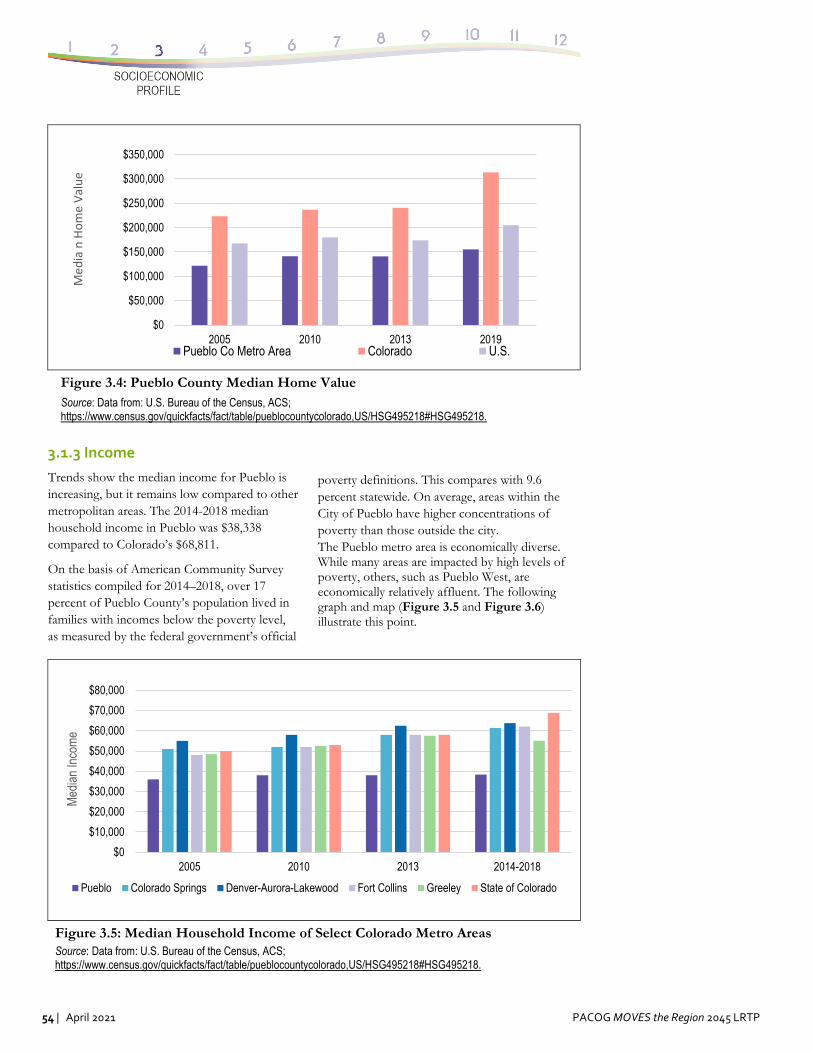
54 | April 2021 PACOG MOVES the Region 2045 LRTP
3.1.3 Income
Trends show the median income for Pueblo is increasing, but it remains low compared to other metropolitan areas. The 2014-2018 median household income in Pueblo was $38,338 compared to Colorado’s $68,811.
On the basis of American Community Survey statistics compiled for 2014–2018, over 17 percent of Pueblo County’s population lived in families with incomes below the poverty level, as measured by the federal government’s official
poverty definitions. This compares with 9.6 percent statewide. On average, areas within the City of Pueblo have higher concentrations of poverty than those outside the city. The Pueblo metro area is economically diverse. While many areas are impacted by high levels of poverty, others, such as Pueblo West, are economically relatively affluent. The following graph and map (Figure 3.5 and Figure 3.6) illustrate this point.
Figure 3.5: Median Household Income of Select Colorado Metro Areas Source: Data from: U.S. Bureau of the Census, ACS; https://www.census.gov/quickfacts/fact/table/pueblocountycolorado,US/HSG495218#HSG495218.
Figure 3.4: Pueblo County Median Home Value Source: Data from: U.S. Bureau of the Census, ACS; https://www.census.gov/quickfacts/fact/table/pueblocountycolorado,US/HSG495218#HSG495218.
$0
$50,000
$100,000
$150,000
$200,000
$250,000
$300,000
$350,000
2005 2010 2013 2019
Med
ia n Home Value
Pueblo Co Metro Area Colorado U.S.
$0
$10,000
$20,000
$30,000
$40,000
$50,000
$60,000
$70,000
$80,000
2005 2010 2013 2014-2018
Med
ian
Inco
me
Pueblo Colorado Springs Denver-Aurora-Lakewood Fort Collins Greeley State of Colorado
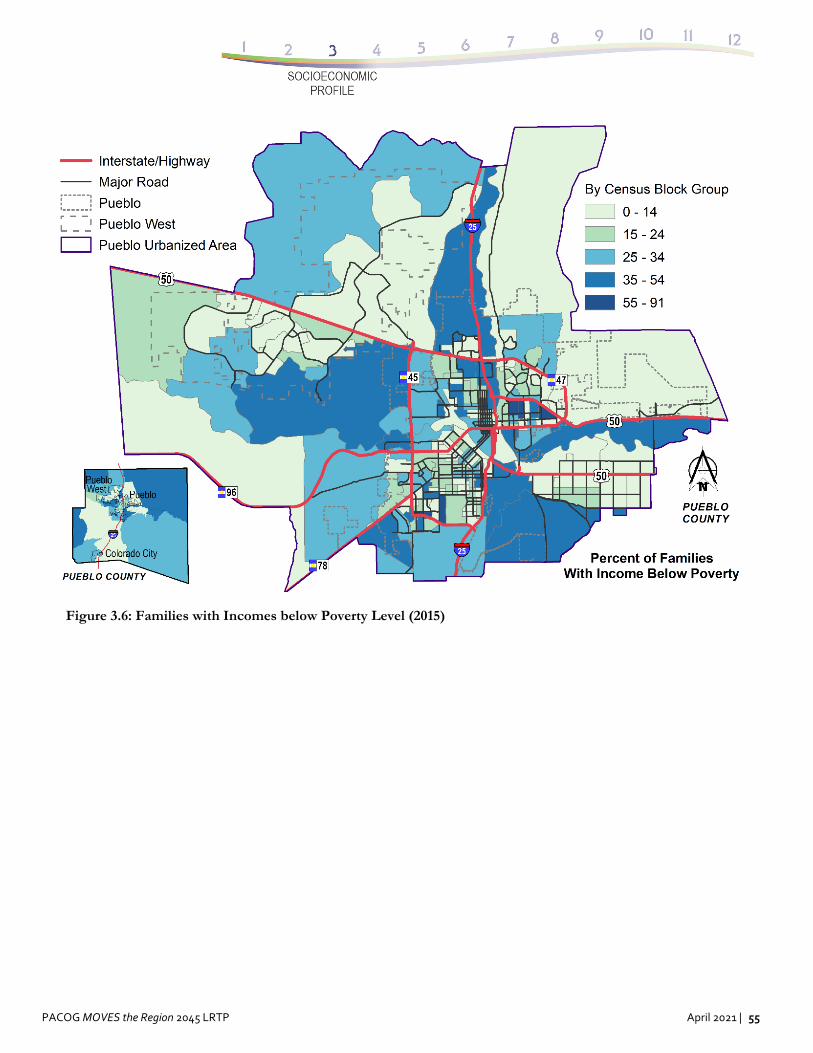
PACOG MOVES the Region 2045 LRTP April 2021 | 55
Figure 3.6: Families with Incomes below Poverty Level (2015)
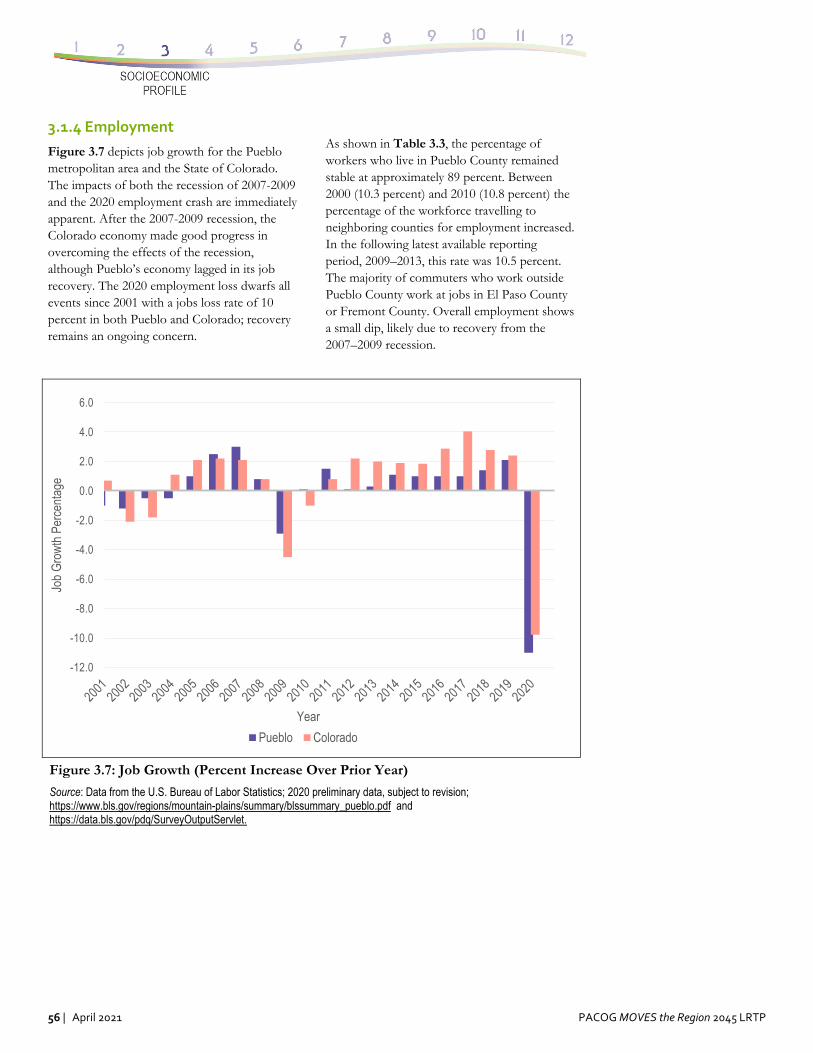
56 | April 2021 PACOG MOVES the Region 2045 LRTP
3.1.4 Employment
Figure 3.7 depicts job growth for the Pueblo metropolitan area and the State of Colorado. The impacts of both the recession of 2007-2009 and the 2020 employment crash are immediately apparent. After the 2007-2009 recession, the Colorado economy made good progress in overcoming the effects of the recession, although Pueblo’s economy lagged in its job recovery. The 2020 employment loss dwarfs all events since 2001 with a jobs loss rate of 10 percent in both Pueblo and Colorado; recovery remains an ongoing concern.
As shown in Table 3.3, the percentage of workers who live in Pueblo County remained stable at approximately 89 percent. Between 2000 (10.3 percent) and 2010 (10.8 percent) the percentage of the workforce travelling to neighboring counties for employment increased. In the following latest available reporting period, 2009–2013, this rate was 10.5 percent. The majority of commuters who work outside Pueblo County work at jobs in El Paso County or Fremont County. Overall employment shows a small dip, likely due to recovery from the 2007–2009 recession.
Figure 3.7: Job Growth (Percent Increase Over Prior Year)
Source: Data from the U.S. Bureau of Labor Statistics; 2020 preliminary data, subject to revision; https://www.bls.gov/regions/mountain-plains/summary/blssummary_pueblo.pdf and https://data.bls.gov/pdq/SurveyOutputServlet.
-12.0
-10.0
-8.0
-6.0
-4.0
-2.0
0.0
2.0
4.0
6.0
Job
Gro
wth
Per
cent
age
Year
Pueblo Colorado
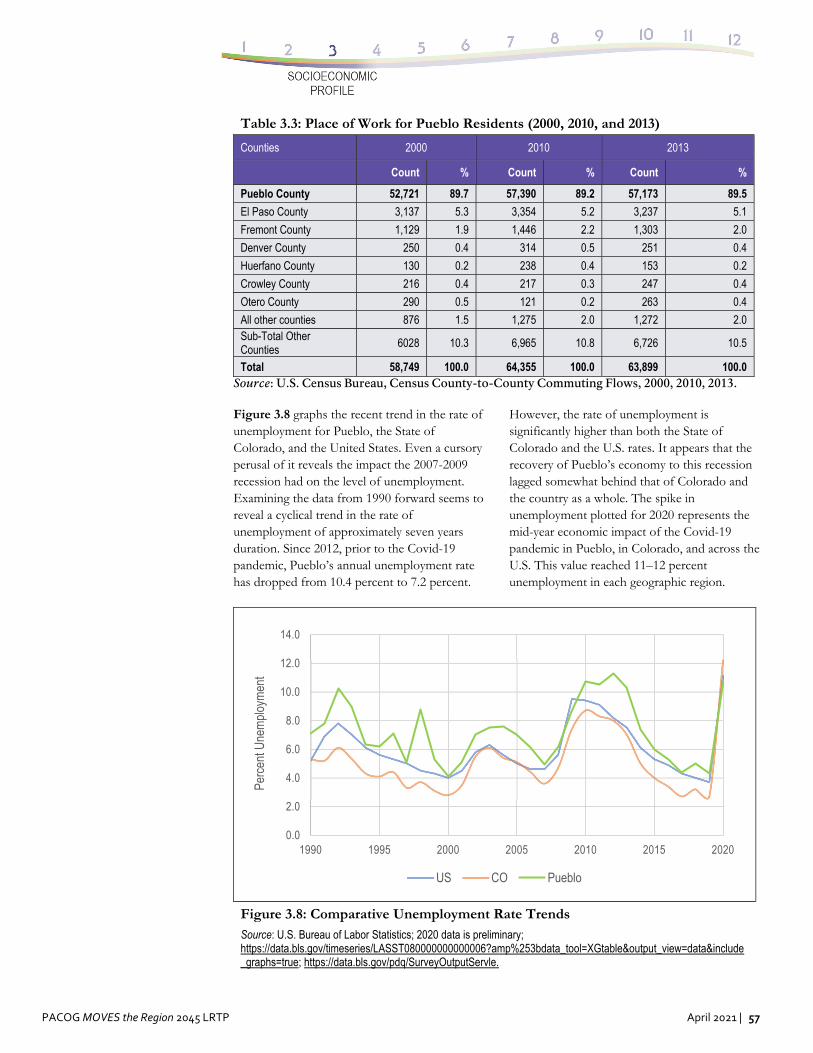
PACOG MOVES the Region 2045 LRTP April 2021 | 57
Table 3.3: Place of Work for Pueblo Residents (2000, 2010, and 2013)
Counties 2000 2010 2013
Count % Count % Count %
Pueblo County 52,721 89.7 57,390 89.2 57,173 89.5
El Paso County 3,137 5.3 3,354 5.2 3,237 5.1
Fremont County 1,129 1.9 1,446 2.2 1,303 2.0
Denver County 250 0.4 314 0.5 251 0.4
Huerfano County 130 0.2 238 0.4 153 0.2
Crowley County 216 0.4 217 0.3 247 0.4
Otero County 290 0.5 121 0.2 263 0.4
All other counties 876 1.5 1,275 2.0 1,272 2.0 Sub-Total Other Counties
6028 10.3 6,965 10.8 6,726 10.5
Total 58,749 100.0 64,355 100.0 63,899 100.0 Source: U.S. Census Bureau, Census County-to-County Commuting Flows, 2000, 2010, 2013.
Figure 3.8 graphs the recent trend in the rate of unemployment for Pueblo, the State of Colorado, and the United States. Even a cursory perusal of it reveals the impact the 2007-2009 recession had on the level of unemployment. Examining the data from 1990 forward seems to reveal a cyclical trend in the rate of unemployment of approximately seven years duration. Since 2012, prior to the Covid-19 pandemic, Pueblo’s annual unemployment rate has dropped from 10.4 percent to 7.2 percent.
However, the rate of unemployment is significantly higher than both the State of Colorado and the U.S. rates. It appears that the recovery of Pueblo’s economy to this recession lagged somewhat behind that of Colorado and the country as a whole. The spike in unemployment plotted for 2020 represents the mid-year economic impact of the Covid-19 pandemic in Pueblo, in Colorado, and across the U.S. This value reached 11–12 percent unemployment in each geographic region.
Figure 3.8: Comparative Unemployment Rate Trends
Source: U.S. Bureau of Labor Statistics; 2020 data is preliminary; https://data.bls.gov/timeseries/LASST080000000000006?amp%253bdata_tool=XGtable&output_view=data&include_graphs=true; https://data.bls.gov/pdq/SurveyOutputServle.
0.0
2.0
4.0
6.0
8.0
10.0
12.0
14.0
1990 1995 2000 2005 2010 2015 2020
Perc
ent U
nem
ploy
men
t
US CO Pueblo
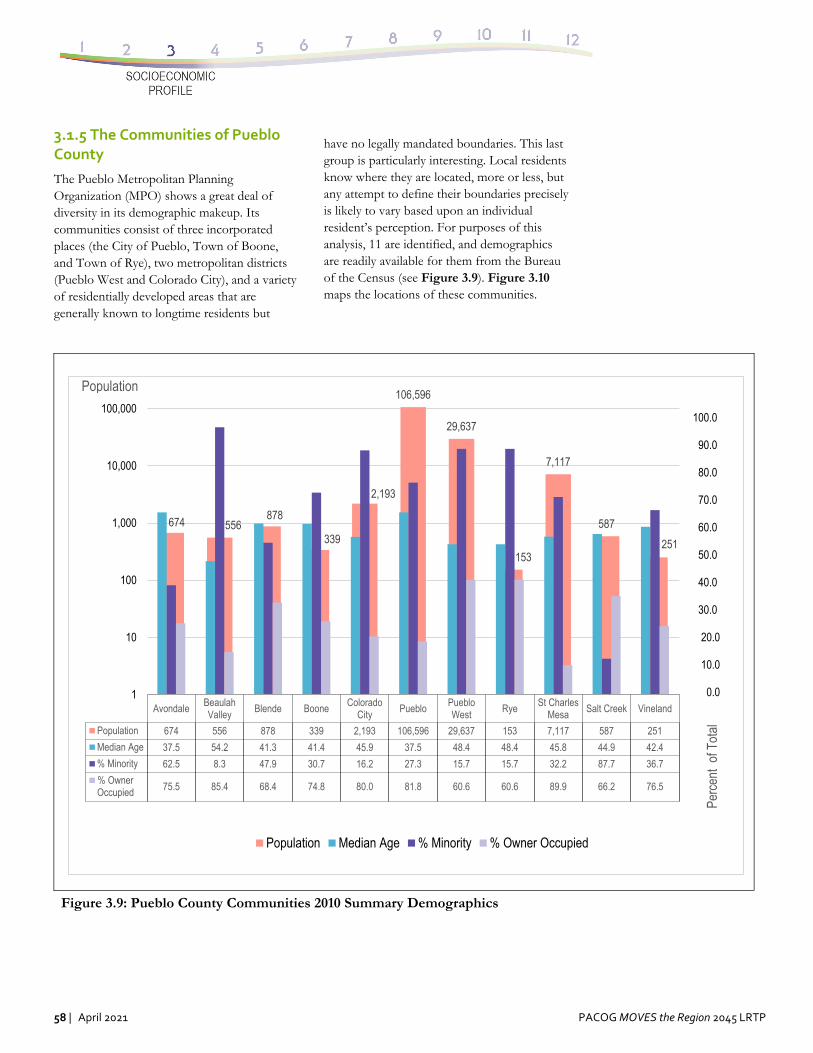
58 | April 2021 PACOG MOVES the Region 2045 LRTP
3.1.5 The Communities of Pueblo County
The Pueblo Metropolitan Planning Organization (MPO) shows a great deal of diversity in its demographic makeup. Its communities consist of three incorporated places (the City of Pueblo, Town of Boone, and Town of Rye), two metropolitan districts (Pueblo West and Colorado City), and a variety of residentially developed areas that are generally known to longtime residents but
have no legally mandated boundaries. This last group is particularly interesting. Local residents know where they are located, more or less, but any attempt to define their boundaries precisely is likely to vary based upon an individual resident’s perception. For purposes of this analysis, 11 are identified, and demographics are readily available for them from the Bureau of the Census (see Figure 3.9). Figure 3.10 maps the locations of these communities.
Figure 3.9: Pueblo County Communities 2010 Summary Demographics
Population
Avondale BeaulahValley
Blende Boone ColoradoCity
Pueblo PuebloWest
Rye St CharlesMesa
Salt Creek Vineland
Population 674 556 878 339 2,193 106,596 29,637 153 7,117 587 251
Median Age 37.5 54.2 41.3 41.4 45.9 37.5 48.4 48.4 45.8 44.9 42.4
% Minority 62.5 8.3 47.9 30.7 16.2 27.3 15.7 15.7 32.2 87.7 36.7
% OwnerOccupied 75.5 85.4 68.4 74.8 80.0 81.8 60.6 60.6 89.9 66.2 76.5
674 556878
339
2,193
106,596
29,637
153
7,117
587
251
0.0
10.0
20.0
30.0
40.0
50.0
60.0
70.0
80.0
90.0
100.01
10
100
1,000
10,000
100,000
Perc
ent
of T
otal
Population Median Age % Minority % Owner Occupied
100.0
90.0
80.0
70.0
60.0
50.0
40.0
30.0
20.0
10.0
0.0
Population
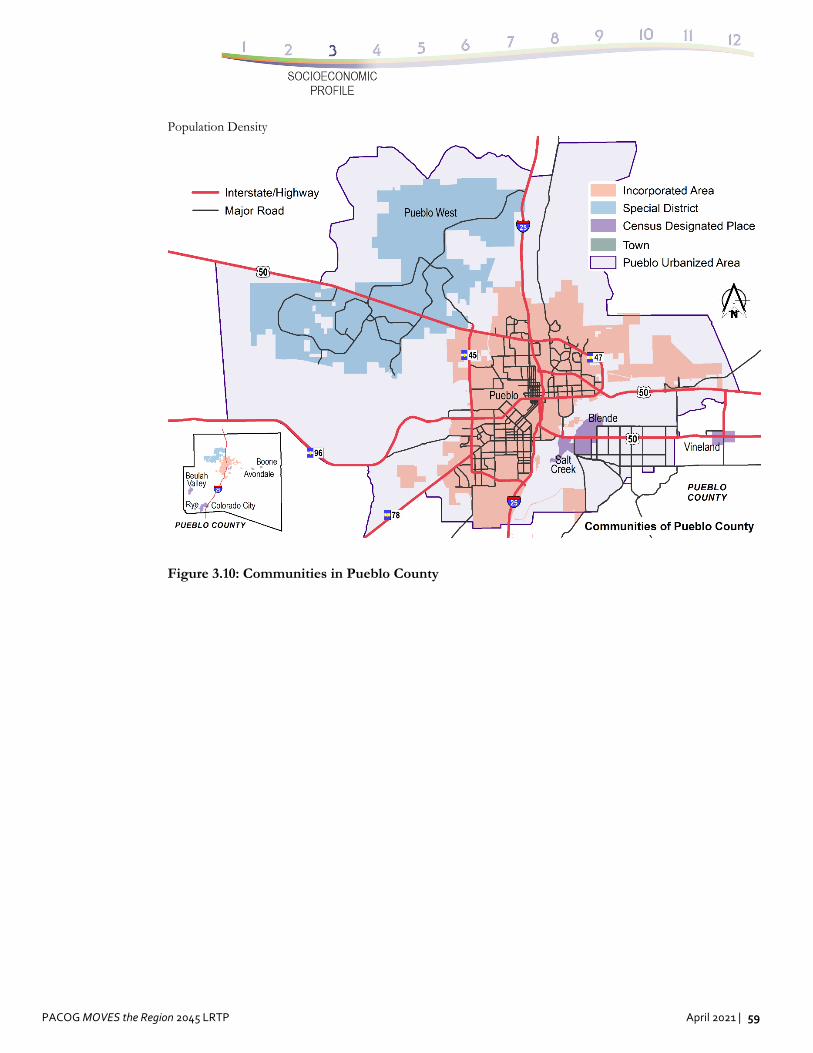
PACOG MOVES the Region 2045 LRTP April 2021 | 59
Population Density
Figure 3.10: Communities in Pueblo County
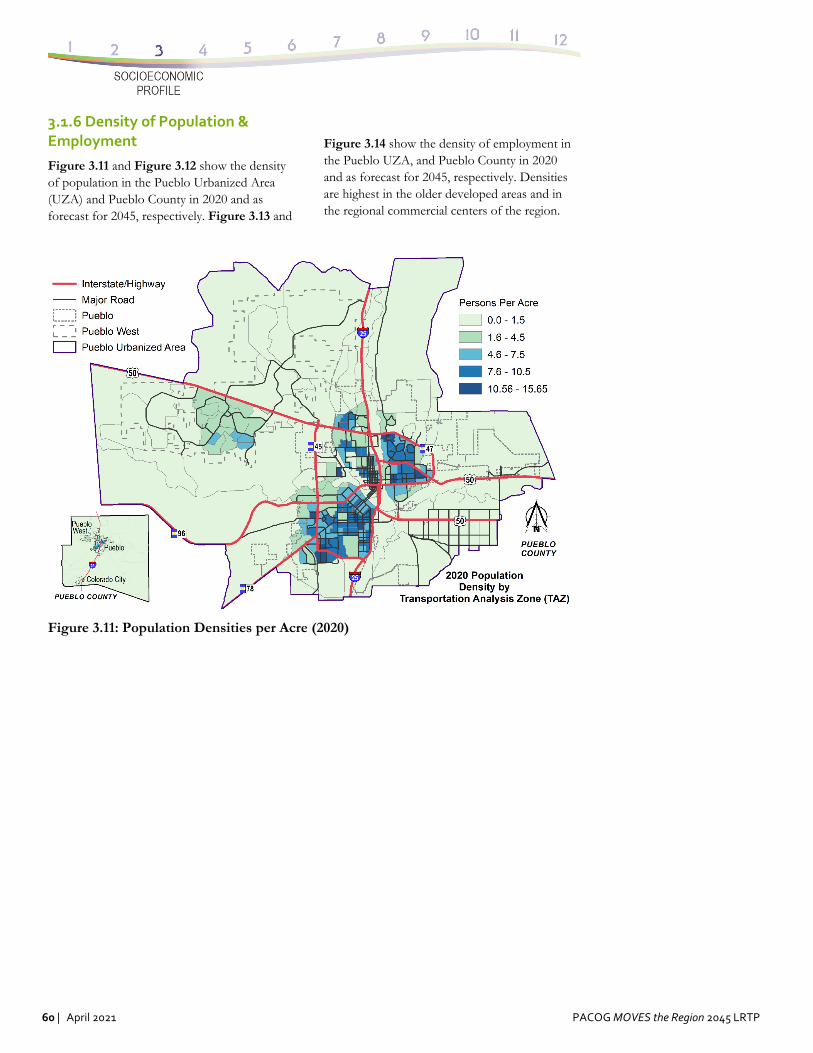
60 | April 2021 PACOG MOVES the Region 2045 LRTP
3.1.6 Density of Population & Employment
Figure 3.11 and Figure 3.12 show the density of population in the Pueblo Urbanized Area (UZA) and Pueblo County in 2020 and as forecast for 2045, respectively. Figure 3.13 and
Figure 3.14 show the density of employment in the Pueblo UZA, and Pueblo County in 2020 and as forecast for 2045, respectively. Densities are highest in the older developed areas and in the regional commercial centers of the region.
Figure 3.11: Population Densities per Acre (2020)
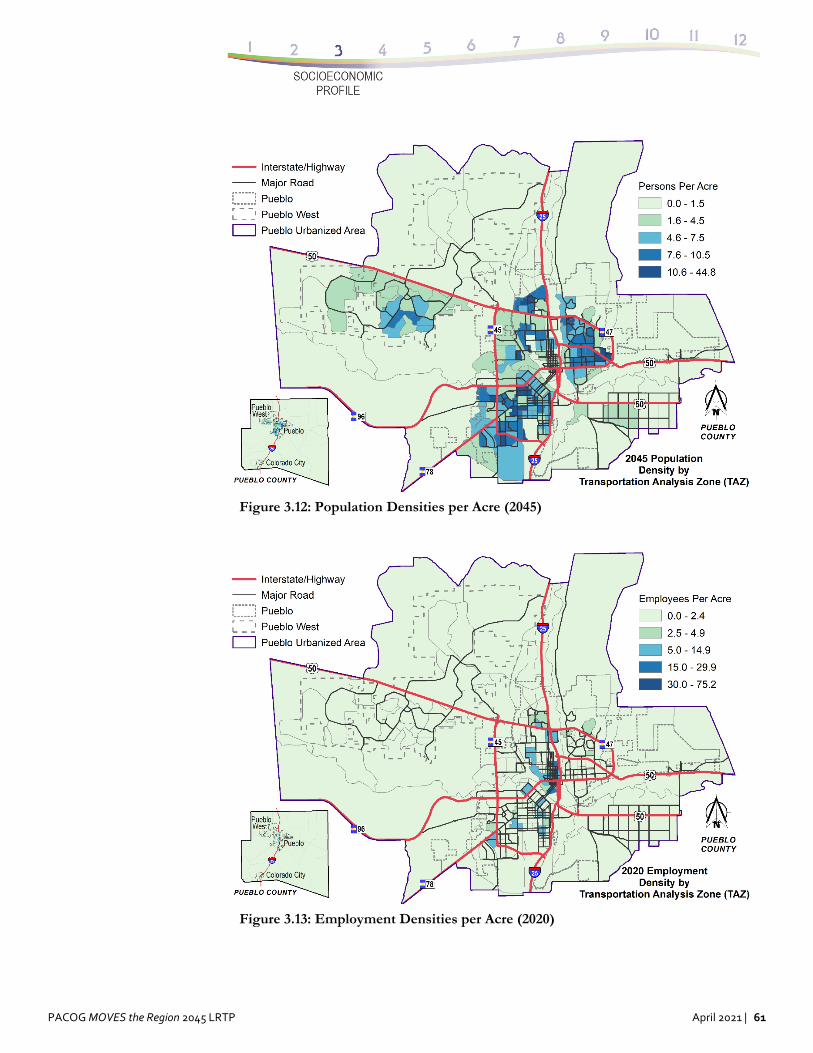
PACOG MOVES the Region 2045 LRTP April 2021 | 61
Figure 3.12: Population Densities per Acre (2045)
Figure 3.13: Employment Densities per Acre (2020)
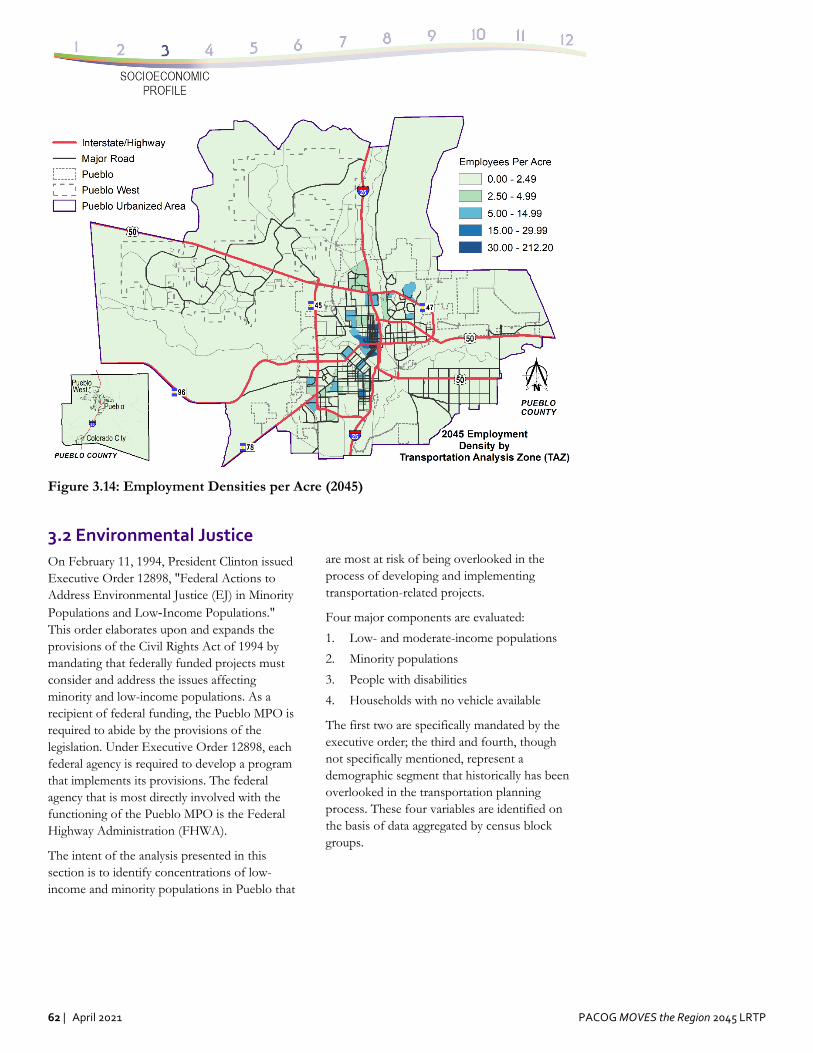
62 | April 2021 PACOG MOVES the Region 2045 LRTP
Figure 3.14: Employment Densities per Acre (2045)
3.2 Environmental Justice
On February 11, 1994, President Clinton issued Executive Order 12898, "Federal Actions to Address Environmental Justice (EJ) in Minority Populations and Low‐Income Populations." This order elaborates upon and expands the provisions of the Civil Rights Act of 1994 by mandating that federally funded projects must consider and address the issues affecting minority and low-income populations. As a recipient of federal funding, the Pueblo MPO is required to abide by the provisions of the legislation. Under Executive Order 12898, each federal agency is required to develop a program that implements its provisions. The federal agency that is most directly involved with the functioning of the Pueblo MPO is the Federal Highway Administration (FHWA).
The intent of the analysis presented in this section is to identify concentrations of low-income and minority populations in Pueblo that
are most at risk of being overlooked in the process of developing and implementing transportation-related projects.
Four major components are evaluated:
1. Low- and moderate-income populations
2. Minority populations
3. People with disabilities
4. Households with no vehicle available
The first two are specifically mandated by the executive order; the third and fourth, though not specifically mentioned, represent a demographic segment that historically has been overlooked in the transportation planning process. These four variables are identified on the basis of data aggregated by census block groups.
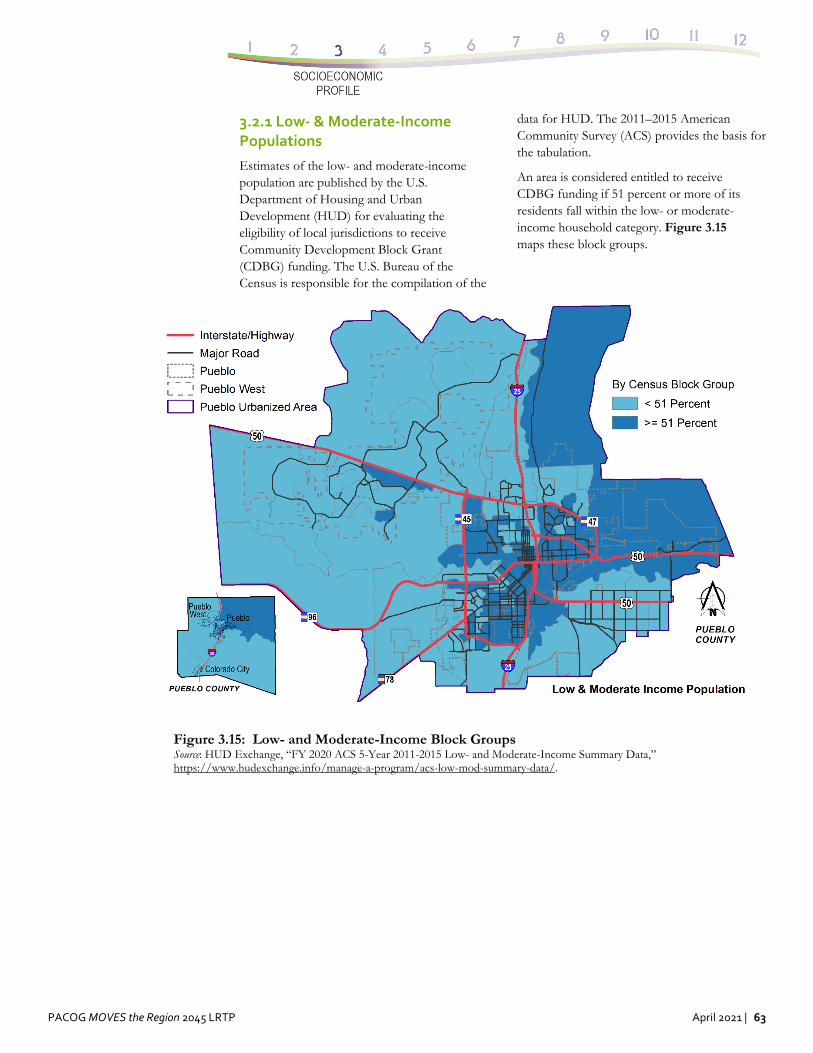
PACOG MOVES the Region 2045 LRTP April 2021 | 63
3.2.1 Low‐ & Moderate‐Income Populations
Estimates of the low- and moderate-income population are published by the U.S. Department of Housing and Urban Development (HUD) for evaluating the eligibility of local jurisdictions to receive Community Development Block Grant (CDBG) funding. The U.S. Bureau of the Census is responsible for the compilation of the
data for HUD. The 2011–2015 American Community Survey (ACS) provides the basis for the tabulation.
An area is considered entitled to receive CDBG funding if 51 percent or more of its residents fall within the low- or moderate-income household category. Figure 3.15 maps these block groups.
Figure 3.15: Low- and Moderate-Income Block GroupsSource: HUD Exchange, “FY 2020 ACS 5-Year 2011-2015 Low- and Moderate-Income Summary Data,” https://www.hudexchange.info/manage-a-program/acs-low-mod-summary-data/.
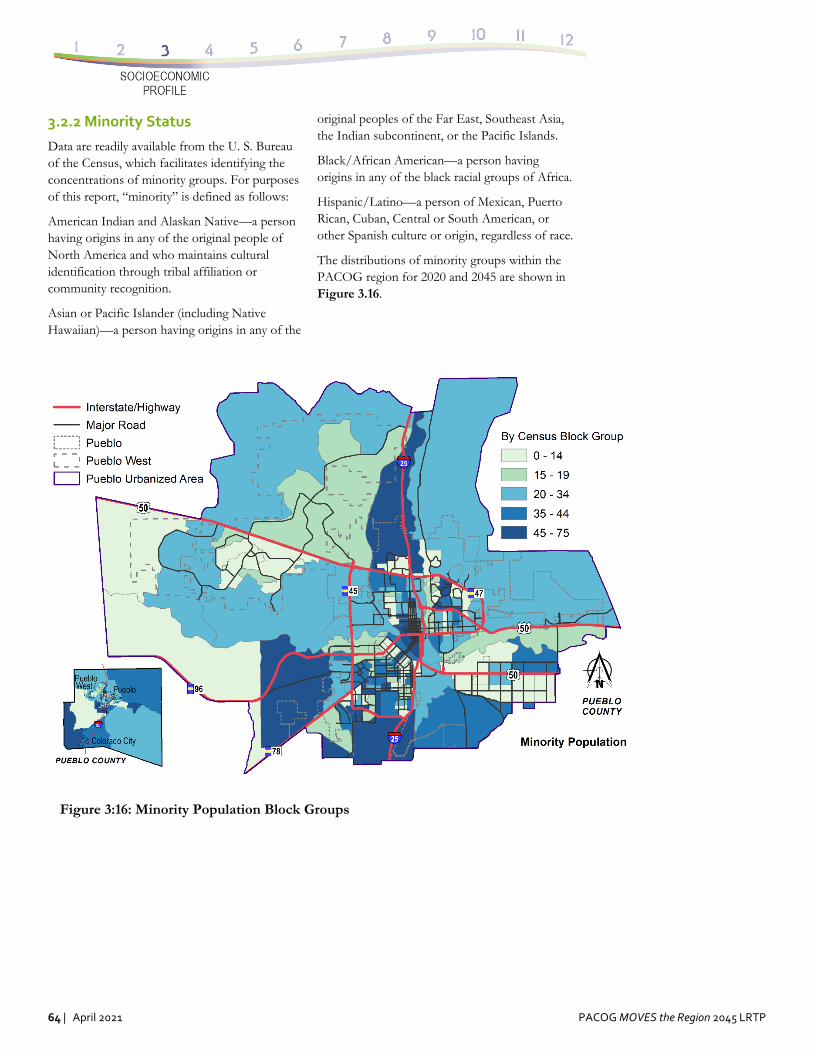
64 | April 2021 PACOG MOVES the Region 2045 LRTP
3.2.2 Minority Status
Data are readily available from the U. S. Bureau of the Census, which facilitates identifying the concentrations of minority groups. For purposes of this report, “minority” is defined as follows:
American Indian and Alaskan Native—a person having origins in any of the original people of North America and who maintains cultural identification through tribal affiliation or community recognition.
Asian or Pacific Islander (including Native Hawaiian)—a person having origins in any of the
original peoples of the Far East, Southeast Asia, the Indian subcontinent, or the Pacific Islands.
Black/African American—a person having origins in any of the black racial groups of Africa.
Hispanic/Latino—a person of Mexican, Puerto Rican, Cuban, Central or South American, or other Spanish culture or origin, regardless of race.
The distributions of minority groups within the PACOG region for 2020 and 2045 are shown in Figure 3.16.
Figure 3:16: Minority Population Block Groups
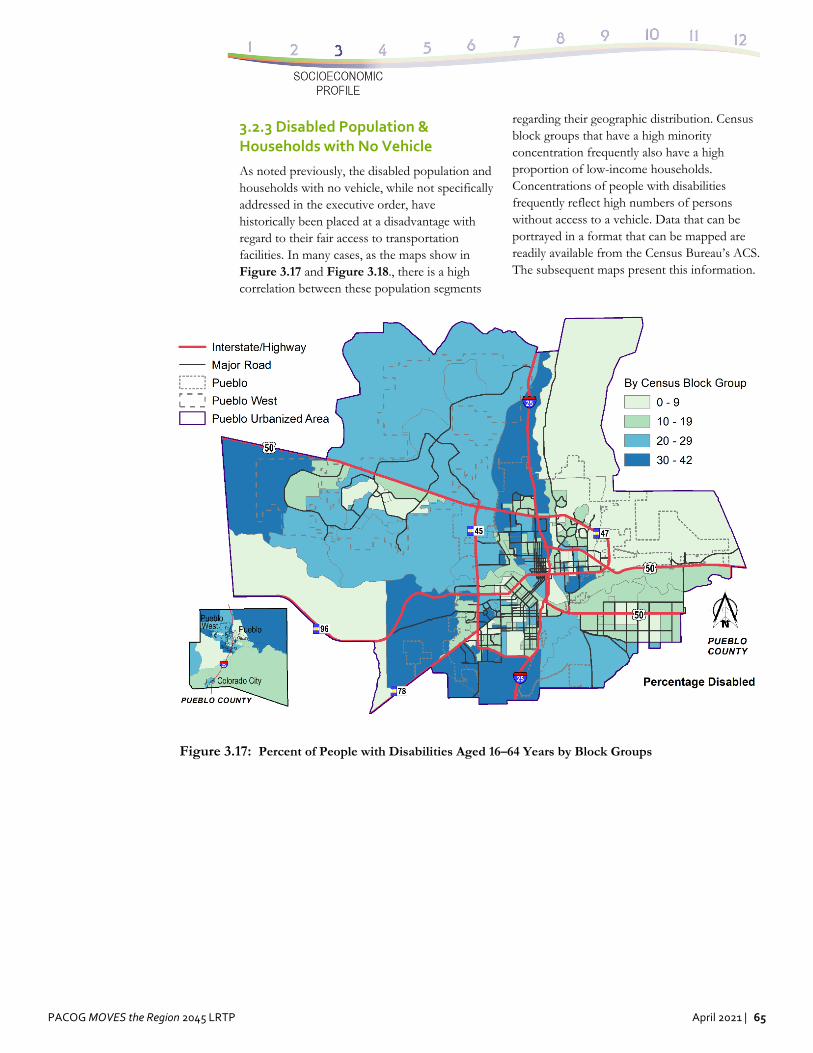
PACOG MOVES the Region 2045 LRTP April 2021 | 65
3.2.3 Disabled Population & Households with No Vehicle
As noted previously, the disabled population and households with no vehicle, while not specifically addressed in the executive order, have historically been placed at a disadvantage with regard to their fair access to transportation facilities. In many cases, as the maps show in Figure 3.17 and Figure 3.18., there is a high correlation between these population segments
regarding their geographic distribution. Census block groups that have a high minority concentration frequently also have a high proportion of low-income households. Concentrations of people with disabilities frequently reflect high numbers of persons without access to a vehicle. Data that can be portrayed in a format that can be mapped are readily available from the Census Bureau’s ACS. The subsequent maps present this information.
Figure 3.17: Percent of People with Disabilities Aged 16–64 Years by Block Groups
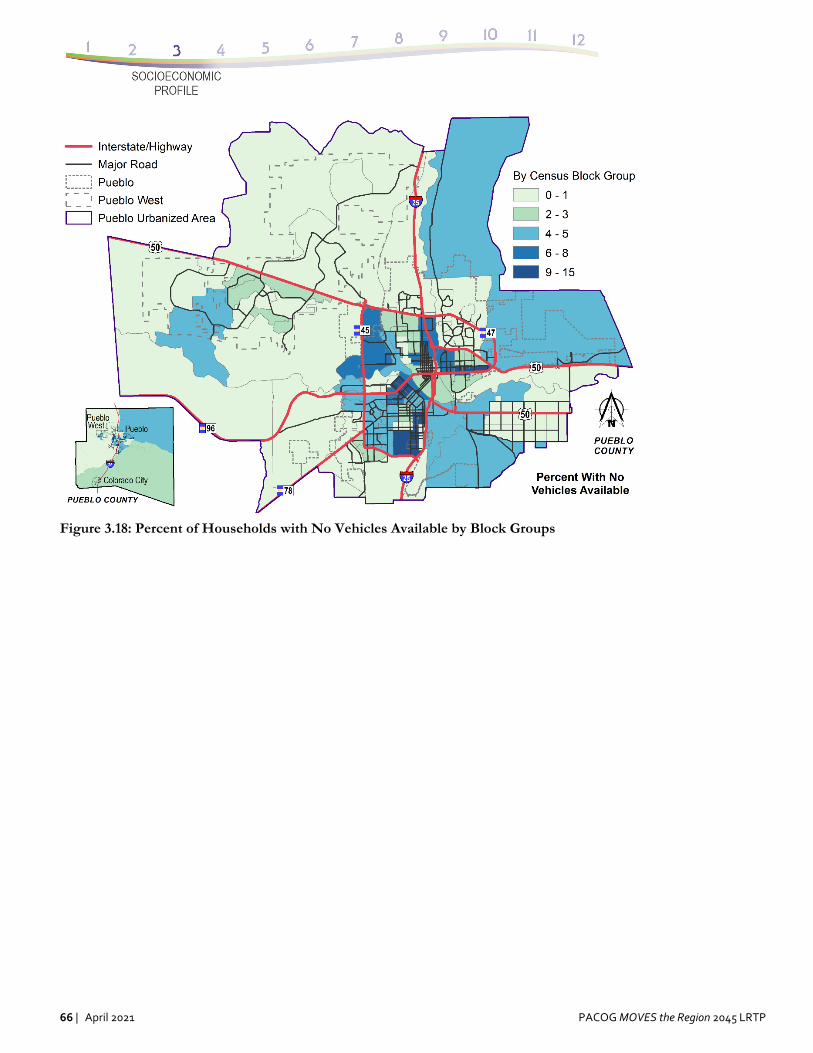
66 | April 2021 PACOG MOVES the Region 2045 LRTP
Figure 3.18: Percent of Households with No Vehicles Available by Block Groups
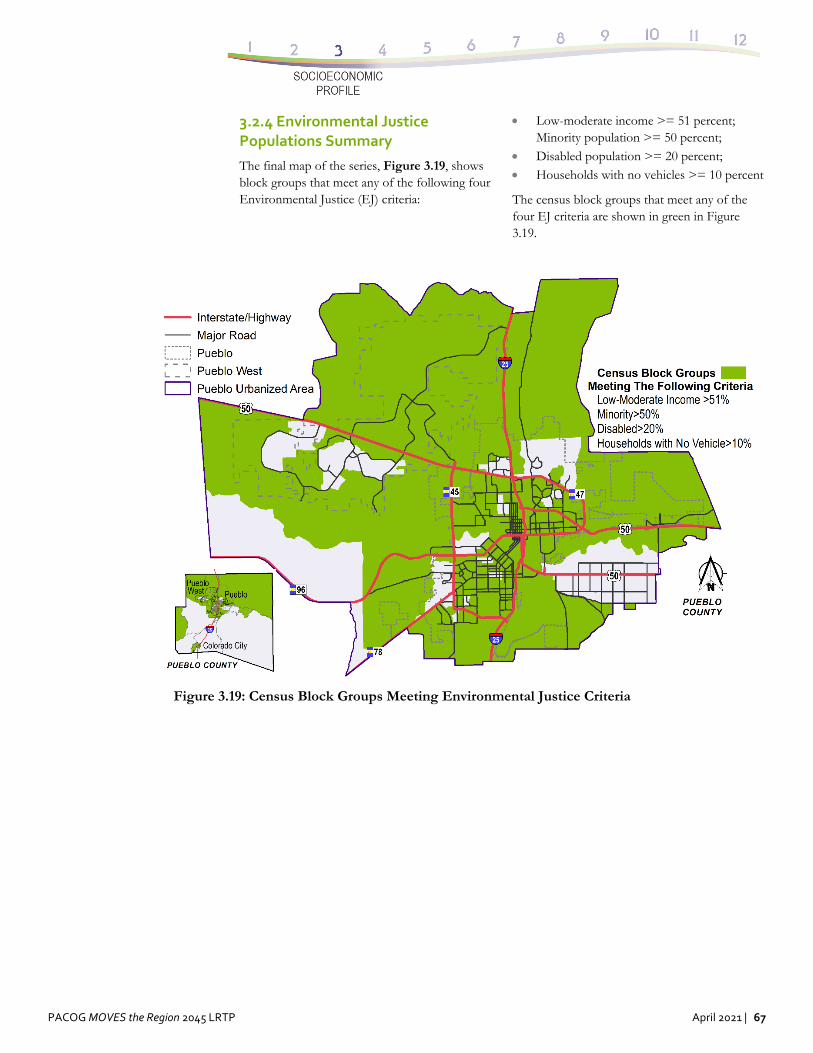
PACOG MOVES the Region 2045 LRTP April 2021 | 67
3.2.4 Environmental Justice Populations Summary
The final map of the series, Figure 3.19, shows block groups that meet any of the following four Environmental Justice (EJ) criteria:
Low-moderate income >= 51 percent; Minority population >= 50 percent;
Disabled population >= 20 percent; Households with no vehicles >= 10 percent
The census block groups that meet any of the four EJ criteria are shown in green in Figure 3.19.
Figure 3.19: Census Block Groups Meeting Environmental Justice Criteria
68 | April 2021 PACOG MOVES the Region 2045 LRTP
4.0 Environmental Profile
4.1 Introduction
Federal regulations require that adopted metropolitan transportation plans contain a discussion of potential area-wide (not project-specific) environmental mitigation activities. This is 1 of 12 specific transportation plan requirements listed in Title 23 of the Code of Federal Regulations in Section 450.324(f) (see text box).
This requirement is the result of a past surface transportation reauthorization bill. The current 2015 authorization, the Fixing America’s Surface Transportation (FAST) Act (discussed in Chapter 1), was due to expire on September 30, 2020 but was extended for one year on October 1, 2020. A new reauthorization bill, tentatively titled the Investing in a New Vision for the Environment and Surface Transportation in America (INVEST in America) Act, was introduced in early 2020. If passed, the new bill may or may not alter the current transportation planning requirements.
As seen from the requirement, this environmental mitigation approach is to be developed in consultation with federal, state, and tribal regulatory agencies responsible for land management, wildlife, and other environmental issues. This, in turn, depends on the specific environmental issues that are relevant to the metropolitan area in question.
Accordingly, this chapter describes the environmental regulatory framework from which the 2045 Long Range Transportation Plan (LRTP) was developed, the methodology used to acquire and analyze environmental data with relevance to transportation plans, and the overall approach to environmental mitigation taken by the plan.
Recall from Chapter 1 of this plan that one of the goals (number 6) of the PACOG metropolitan transportation planning process is Environmental Sustainability, which has five supporting goals: 1. Reduce fossil fuel consumption and reduce
greenhouse gas and other emissions. 2. Improve and support transportation system
improvements that address needs for
citizens with disabilities, low incomes, and other special needs in the region.
3. Reduce transportation-related adverse impacts to communities, neighborhoods, natural environments, and areas identified for cultural and/or historical preservation.
4. Protect and/or avoid both areas containing critical habitat for threatened and endangered species and wildlife travel corridors.
5. Minimize the amount of stormwater runoff and transportation-associated pollutants that enter the region’s streams.
Additionally, PACOG goal number 8, Multimodal Transportation, seeks to improve public health and quality of life by enhancing and integrating transportation alternatives to single-occupant driving, including the active non-motorized transportation alternatives of bicycling and walking.
4.2 Regulatory Framework for Environmental Considerations
There are a number of environmental laws and executive orders that transportation agencies are required to address when planning for transportation within their regions. Relevant federal legislation related to the environment is cited below with a short abstract of key environmental acts and the related agencies that support and enforce them. This list is presented largely in chronological order and does not imply any relative importance of the topics listed.
4.2.1 The National Historic Preservation Act (1966)
The National Historic Preservation Act (NHPA) affects transportation projects that are federally funded. This act requires government agencies to evaluate the impact to cultural resources of all federally funded construction projects through a process dictated by NHPA Section 106. Under the act, agencies conduct their own preservation reviews with consultation from local governments and Native American tribes, with monitoring from the National Council on Historic Preservation.
23 CFR Section 450.324.
Development and content of the metropolitan transportation plan. (f) The metropolitan transportation plan shall, at a minimum, include:
(10) A discussion of types of potential environmental mitigation activities and potential areas to carry out these activities, including activities that may have the greatest potential to restore and maintain the environmental functions affected by the metropolitan transportation plan. The discussion may focus on policies, programs, or strategies, rather than at the project level. The MPO shall develop the discussion in consultation with applicable Federal, State, and Tribal land management, wildlife, and regulatory agencies. The MPO may establish reasonable timeframes for performing this consultation.
PACOG MOVES the Region 2045 LRTP April 2021 | 69
NHPA mandates a three-part process: (1) the identification of potentially historically significant resources, (2) the assessment of potential adverse effects to these resources of the proposed project, and (3) the description of resolution strategies to mitigate the adverse effects. Potentially significant cultural resources are defined as resources evaluated as eligible for listing on the National Register of Historic Places (NRHP). Assessments are conducted by authorized architectural historians as part of specific Section 106 reviews, usually in conjunction with the satisfaction of the National Environmental Policy Act (NEPA) requirements.
Federal power was diffused to the states, which, in turn, were encouraged to further diffuse power to localities. Historic preservation in the United States was thus broadened to include places with local or state as well as national historic significance. The City of Pueblo Historic Preservation Commission is an example of a Certified Local Government (CLG) that is involved in the Section 106 consultation process, in cooperation with the State Historic Preservation Office (see the History Colorado website: https://www.historycolorado.org/state-historic-preservation-office).
The Pueblo area has a rich history and numerous cultural resources. The City of Pueblo was incorporated 150 years ago in 1870, and most communities in the PACOG area were settled in the nineteenth century, some of them as stops along the railroad. The region was formerly under Spanish control prior to the Louisiana Purchase in 1803. It had been occupied or used by indigenous Native American peoples and their ancestors for thousands of years.
Potentially impacted resources that are at least 50 years old (i.e., built in 1970 or earlier) can be evaluated to see if they meet eligibility criteria. In addition to properties that are formally listed on the NRHP, resources that appear to meet NRHP eligibility criteria based on evaluation by a qualified historian receive consideration for protection from impacts due to federal transportation projects. In other words, a resource can be treated as historic even though
it is not formally listed. For example, as part of the I-25 improvements project through Pueblo, 856 structures within the Area of Potential Effect were tentatively identified as National Register-eligible.
As of June 2020, History Colorado indicates that 73 resources within Pueblo County are officially listed on the NRHP, including one site newly listed in 2020. The most recent Pueblo Inventory of Cultural Resources, dated September 30, 2019, lists 260 of resources recognized at the local level, including those NRHP resources that are located within the city. It is important to check these sources for updates as resources may be added or removed.
4.2.2 The National Environmental Policy Act (NEPA, 1969)
The focus of NEPA is to ensure that federal agencies consider the social, economic, and environmental consequences of an action and reasonable alternative actions before undertaking or approving an action. Projects expected to have significant impacts require preparation of an Environmental Impact Statement (EIS). Actions with lesser impacts also undergo examination and documentation but in other documents such as an Environmental Assessment and a Categorical Exclusion.
NEPA requirements are addressed and documented at the project level and do not apply to the metropolitan transportation plan itself. For projects undergoing NEPA analysis by U.S. Department of Transportation agencies, the Colorado Department of Transportation (CDOT) typically is a signatory and administers preparation of much of the documentation. Providing meaningful opportunities for input by the public and by affected stakeholder entities and agencies is an important requirement of the NEPA process.
4.2.3 The Clean Air Act (1970)
The Clean Air Act Amendments (CAAA) of 1970 is a United States federal law that requires the Environmental Protection Agency (EPA) to develop and enforce regulations to protect the general public from exposure to airborne contaminants that are known to be hazardous
70 | April 2021 PACOG MOVES the Region 2045 LRTP
to human health. This law is an amendment to the Clean Air Act originally passed in 1963. The Clean Air Act has undergone substantial amendment, particularly in 1977 and again in 1990. Advancements in technology as well as medical and industrial sciences have spurred revisions to the National Ambient Air Quality Standards (NAAQS) over time.
As part of the Clean Air Act, the concept of “nonattainment areas” was developed. Nonattainment areas are those where generated emissions cause or contribute to violations of the NAAQS. States are required to prepare and submit to EPA air cleanup plans called State Implementation Plans (SIPs) to reduce emissions in nonattainment areas.
Pueblo County meets the national air quality standards and has never been designated as a nonattainment area by the EPA. Given the size of the PACOG communities and their industrial output, continued attainment is expected in the long-term future.
4.2.4 The Clean Water Act (1972)
The Clean Water Act of 1972, which amended the original Federal Water Pollution Control Act of 1948, is the primary federal law in the United States governing water pollution. The act established the goals of eliminating releases to water of high amounts of toxic substances, eliminating additional water pollution by 1985, and ensuring that surface waters would meet standards necessary for human sports and recreation by 1983.
Section 303 of the Clean Water Act authorizes the water quality standards and Total Maximum Daily Load (TMDL) programs. These are risk-based (also called hazard-based) programs that set site-specific pollutant standards for individual water bodies, such as rivers, lakes, streams, and wetlands.
The two main waterways in Pueblo County are the east-flowing Arkansas River and its south-flowing tributary, Fountain Creek. The Arkansas River is polluted with sulfur tetroxide, mercury (found in fish species), and naturally occurring selenium. The contaminant of concern for Fountain Creek is E. coli bacteria. These pollutants are not emitted by transportation systems.
Pursuant to Clean Water Act requirements, best management practices (BMPs) are used to control stormwater runoff from impervious surfaces, including roadways, introduced through development. CDOT, Pueblo County, and the City of Pueblo are subject to stormwater management requirements though their Municipal Separate Storm Sewer System (MS4) permits under the EPA National Pollutant Discharge Elimination System (NPDES), administered through the Colorado Department of Public Health and Environment (CDPHE). It is therefore important to consider that roadway improvement projects routinely include the cost of stormwater BMPs.
4.2.5 The Endangered Species Act (1973)
The Endangered Species Act (ESA) is the most wide-ranging of the many United States environmental laws passed in the 1970s. This act was designed to protect critically imperiled species from extinction due to the consequences of economic growth and development (i.e., loss of habitat) without adequate concern for conservation. Under the act, the U.S. Fish and Wildlife Service (USFWS) identifies and lists animal and plant species that warrant ESA protection. An endangered species is one that is in danger of extinction throughout all or a significant portion of its range. A threatened species is one that is likely to become endangered within the foreseeable future throughout all or a significant portion of its range. Species can be added or removed from the USFWS threatened and endangered lists over time if their populations decline or increase. The recovery and subsequent delisting of the bald eagle is a well-known ESA national success story.
PACOG MOVES the Region 2045 LRTP April 2021 | 71
As of mid-2020, the USFWS website called IPaC, Information for Planning and Consultation listed five endangered species and seven threatened species that may occur within Pueblo County. USFWS identified critical habitat in Pueblo County for only one threatened species, the Mexican Spotted Owl. This species inhabits canyon and montane forest habitats, according to USFWS. The critical habitat is located in extreme western and southwestern Pueblo County, in the San Isabel National Forest.
Colorado Parks and Wildlife (CPW) maintains its own list of species that are considered to be threatened or endangered in Colorado. Some species on this list are also federally listed, whereas others are not. Colorado also lists Species of State Special Concern (not a statutory category), which includes animals such as the black-tailed prairie dog.
With regard to the metropolitan transportation plan, planned new transportation corridors should avoid designated critical habitat for sensitive species.
4.2.6 Presidential Executive Order 11990 (1977)
In 1997, President Jimmy Carter issued Presidential Executive Order 11990, which required all federal agencies “to minimize the destruction, loss or degradation of wetlands, and to preserve and enhance the natural and beneficial values of wetlands” in the course of carrying out their respective agency functions. The U.S. Department of Transportation requires that wetland impacts be considered in the evaluation of proposed transportation system improvements and their alternatives. Wetlands impacts are to be considered, along with other factors (e.g., impacts to historic resources) when identifying the project’s Least Environmentally Damaging Practicable Alternative (LEDPA). Supplementing this direction from the federal government, CDOT’s policy mandates that its projects shall result in no net loss of wetlands.
··················· 16 Environmental Laboratory, U.S. Army Core of
Engineers, Corps of Engineers Wetlands Delineation Manual (Wetlands Research Program Technical Report Y-87-1, January 1987), A14,
Based on the definition used by U.S. Army Corps of Engineers (USACE) Wetlands Delineation Manual, the term “wetlands” is defined as: “those areas that are inundated or saturated by surface or groundwater at a frequency and duration sufficient to support, and that under normal circumstances do support, a prevalence of vegetation typically adapted for life in saturated soil conditions. Wetlands generally include swamps, marshes, bogs, and similar areas.”16 Within Pueblo County, wetland areas are commonly found along the Arkansas River and its tributaries such as Fountain Creek.
4.2.7 Environmental Evaluation for Non‐Federal Projects
NEPA mandated an environmental assessment for every federally funded project with the potential to impact the environment. If no federal funding is involved, state environmental review requirements or local ordinances and plans may apply with similar requirements for study of impact and assessment of alternatives.
In addition to transportation-related environmental review requirements, a variety of local, state, and federal permits that regulate wetlands, water quality, air quality, noise, and other environmental resources also may be required for projects. Identifying the extent of impacts and mitigation opportunities is a key consideration when planning projects. PACOG recognizes that efforts to avoid, minimize, and mitigate adverse environmental impacts are a standard consideration in the development of project-level plans for transportation projects. The time and money required to do so are accepted as part of the project development process. At the regional level, these same considerations of key environmental constraints apply.
https://www.lrh.usace.army.mil/Portals/38/docs/USACE%2087%20Wetland%20Delineation%20Manual.pdf.
72 | April 2021 PACOG MOVES the Region 2045 LRTP
4.2.8 Natural Resource Management Plans
Various federal agencies, such as the Bureau of Land management and the U.S. Forest Service, are required to develop and maintain plans for how they will manage their resources. These plans are a valuable resource for consideration by PACOG in its regional transportation planning efforts. Knowing the goals of these agencies as expressed through their management plans can help to ensure that future transportation plans are not at cross-purposes with the stated goals of federal agencies.
4.3 Approach to Environmental Planning
4.3.1 Regional Overview
Pueblo County’s snow-capped, ruggedly alpine Wet Mountains rise majestically out of the San Isabel National Forest and provide a western backdrop for one of the most spectacularly beautiful landscapes in Colorado. At their base, rolling, pine-covered foothills give way to juniper and piñon-speckled mesas that in turn break dramatically from their flat tops and fall into hidden canyon lands. These then blend into vast expanses of short-grass prairie and fragrant sand sage ecosystems. Tying all of this variety together is a laced network of braided wetlands, reservoirs, lakes, mountain streams and riparian corridors that together form the numerous tributaries of the greater Arkansas River system. This unique landscape that straddles the continental edge between the Great Plains and the Southern Rocky Mountains provides a setting for more than 250 individual species of birds and land animals. It shelters rare plants and animals that are found nowhere else in the world and provides critical habitat to a number of rare, threatened and endangered species.
The Colorado Natural Heritage Program (CNHP) based at Colorado State University in
··················· 17 Susan Spackman Panjabi, John Sovell, Georgia
Doyle, Denise Culver, and Lee Grunau, “Survey of Critical Biological Resources of Pueblo County, Colorado” (report prepared by Colorado Natural Heritage Program, Colorado State University for
Fort Collins has been conducting county-by-county surveys of critical biological resources in Colorado for decades and conducted one for Pueblo County in 2003. This was nearly two decades ago, when the County’s human population was about 102,000, but because the estimated population has grown by only about 10,000 since that time, most of the CNHP findings remain largely valid today. Key information from the survey follows.
Figure 4.1 depicts the ecoregions and principal drainages in Pueblo County. The principal mountainous features located within Pueblo County are the Wet Mountains. Foothills form the transition between the mountains and the plains. Pueblo County is located within the Central Shortgrass Prairie and Southern Rocky Mountains ecoregions as defined by The Nature Conservancy.
“The Central Shortgrass Prairie ecoregion is characterized by rolling plains and tablelands dissected by streams, canyons, badlands, and buttes, and is dominated by shortgrass, mixed-grass, and sandsage prairie.
The Southern Rocky Mountain ecoregion includes two major mountain systems and the intervening valleys and parks from southern Wyoming to northern New Mexico. The major ecological zones are alpine, subalpine, upper montane, lower montane, and foothill.
The principal drainage within the County is the Arkansas River. The principal tributaries to the Arkansas River include Fountain Creek, Chico Creek, Saint Charles River, and Huerfano River.”17
Pueblo County Planning Department, May 2003), 28–29, https://cnhp.colostate.edu/download/documents/2003/final_pueblo_report.pdf
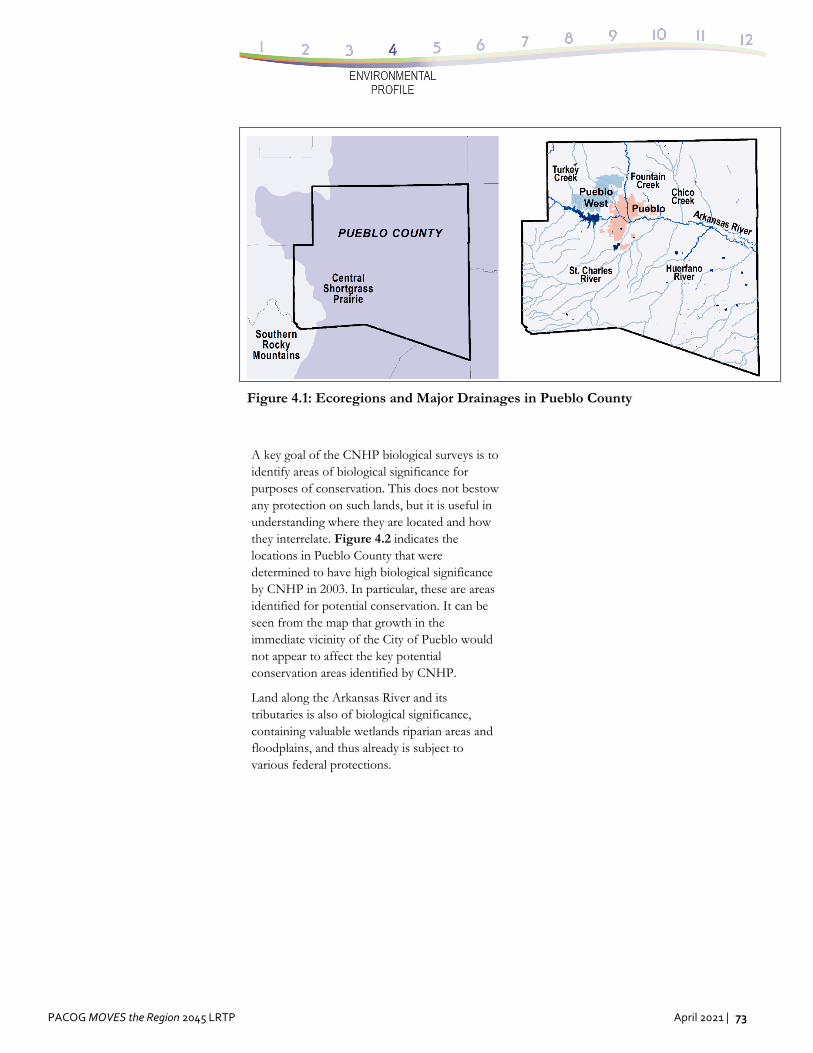
PACOG MOVES the Region 2045 LRTP April 2021 | 73
Figure 4.1: Ecoregions and Major Drainages in Pueblo County
A key goal of the CNHP biological surveys is to identify areas of biological significance for purposes of conservation. This does not bestow any protection on such lands, but it is useful in understanding where they are located and how they interrelate. Figure 4.2 indicates the locations in Pueblo County that were determined to have high biological significance by CNHP in 2003. In particular, these are areas identified for potential conservation. It can be seen from the map that growth in the immediate vicinity of the City of Pueblo would not appear to affect the key potential conservation areas identified by CNHP.
Land along the Arkansas River and its tributaries is also of biological significance, containing valuable wetlands riparian areas and floodplains, and thus already is subject to various federal protections.
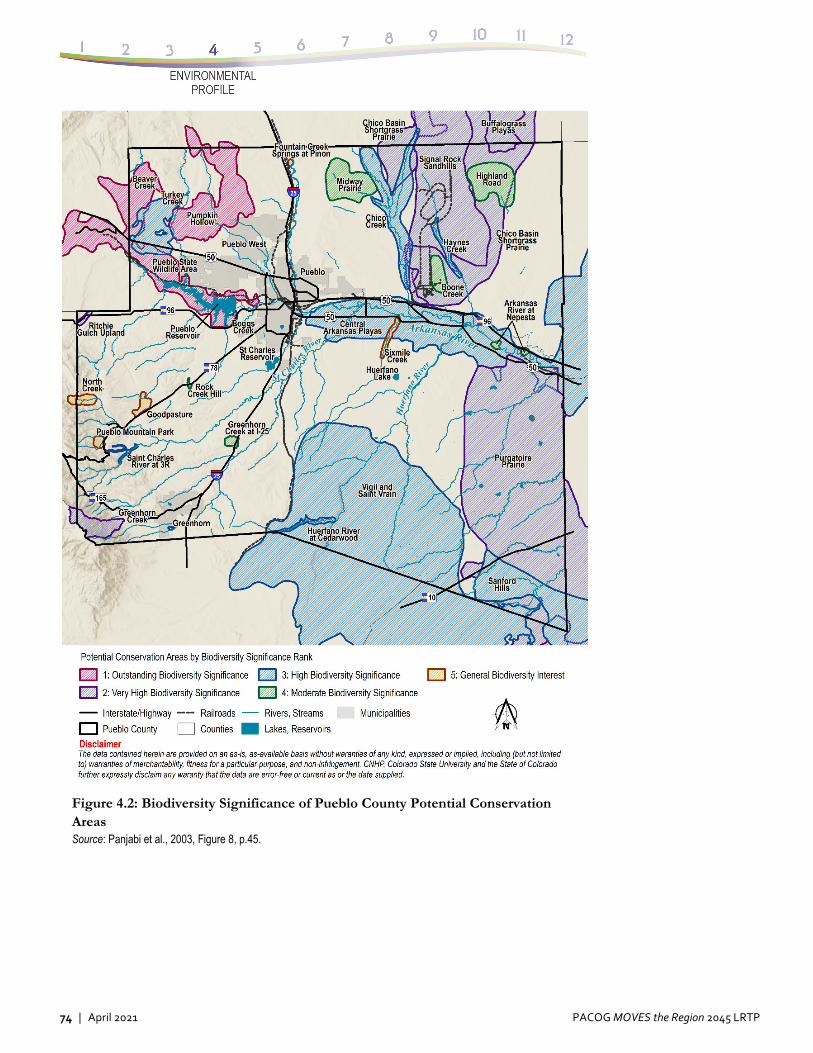
74 | April 2021 PACOG MOVES the Region 2045 LRTP
Figure 4.2: Biodiversity Significance of Pueblo County Potential Conservation Areas Source: Panjabi et al., 2003, Figure 8, p.45.
PACOG MOVES the Region 2045 LRTP April 2021 | 75
Fountain Creek Watershed
As the urbanized Front Range in Southern Colorado continues to grow, the portion of Pueblo County that lies north of the City of Pueblo and also between the State Land Board properties to the east and Fort Carson to the west has been identified by many planning professionals, developers, and investment groups as a likely area for future growth.
With its current mixture of working ranches, historic trails, wetlands, wildlife corridors, and unique vistas, this subsection of our study area is highly desirable for a number of future land uses. At its heart is the Fountain Creek watershed—a dynamic riparian zone that has been studied by a number of local groups with different goals and objectives. Historically, the Fountain Creek watershed has been the focus of concerted land use/transportation planning. That work has provided to the PACOG LRTP a set of comprehensive planning goals related directly to the plan:
Creating numerous new recreational opportunities such as camping, fishing, hunting, mountain biking, urban and wilderness hiking, horseback riding, and bicycle commuting.
Restoring natural ecosystems and wildlife habitat.
Keeping agricultural lands productive and vibrant.
Preserving a greenbelt of open space as a community separator and scenic corridor along Interstate 25 between Pueblo and Colorado Springs.
Finding an effective way to manage stormwater discharges, attenuate flooding, and reduce the dynamic changes of the Fountain Creek and other water features.
Finding effective ways to maintain or improve the wildlife habitat within the Fountain Creek riparian and upland zones.
Managing water quality and quantity in Fountain Creek and other water features as growth and urbanization in the watershed changes the natural hydrograph.
Limiting the impact of urbanization to the region.
Protecting valuable rare plant communities and critical wildlife migration corridors.
There are many challenges facing elected officials, community leaders, planners, interest groups, and the public. Prominent among them are integrating the numerous and sometimes disparate goals for the lands and accommodating future projected growth while protecting the rich ecological, cultural, and historic resources in the Pueblo area.
76 | April 2021 PACOG MOVES the Region 2045 LRTP
4.3.2 The PACOG Corridor Vision Strategy
Transportation planning often uses the concept of “corridor plans” to analyze future roadway systems and expansions in capacity to current systems. This makes rational sense from the standpoint that people have to move from point A to point B along some route roughly between the two points. Buffers are chosen to determine the width of a prospective corridor from the centerline of the proposed alignment (or the current facility) that is reasonable for study. The area, including the alignment and buffers, is delineated and as much information as can reasonably be gathered is traditionally combined into a very detailed analysis of the proposed project corridor.
The challenge with this approach is that it can miss the greater environmental context. Its surgical accuracy leaves it without a reference point. For example, is there a wildlife migration route? How important is this migration route? What does it connect on a landscape level? Is this the single connection between summer and winter habitats? If this migration route is limited by the proposed transportation project, are there other options for the wildlife? These can be difficult questions to answer with limited information about large geographical areas.
To provide a holistic and contextually rich approach, geographic information system (GIS) technology will be used to analyze entire landscapes at the corridor level. Data gathered for the PACOG region will be supplemented by data has been gathered at state and regional levels, making it possible to answer questions on a project-by-project basis from an ecosystem perspective. The fiscal constraints to transportation development in the Pueblo region provide the opportunity to focus on the larger picture as opposed to the project-driven constraints of areas of the state that are growing more rapidly. The stable growth of Southern Colorado calls for renewed examination of a range of transportation modes to accommodate future needs and conditions. Is it reasonable to believe that the single-occupant, petroleum-fueled vehicle will be the major mode of choice in 30 years? If not, what mode would we recommend as an alternative? How can we
begin to imagine a transition to that mode? What would be the relative environmental cost of the new mode?
PACOG will continue to identify corridors and report on them in the same format used in previous transportation plans. This approach allows the 2045 plan to be easily and seamlessly combined with the reports of the other transportation planning regions at the state level. However, the analysis behind the 2045 corridor visions is radically different from what has been done locally in the past.
Figure 4.3 illustrates the areas that would be identified if only the buffers (shown as lighter areas) three miles in each direction away from existing facilities were studied. However, such a traditional approach restricts our ability to understand the greater functionality of the landscape. The present approach, which examines a relatively large amount of landscape that is not included in these corridors, is consistent with the spirit and letter of the latest regulations for long-range transportation planning as delineated by both CDOT and the Federal Highway Administration (FHWA). PACOG understands the added benefit that this level of analysis provides when working with the local governments within its jurisdiction.
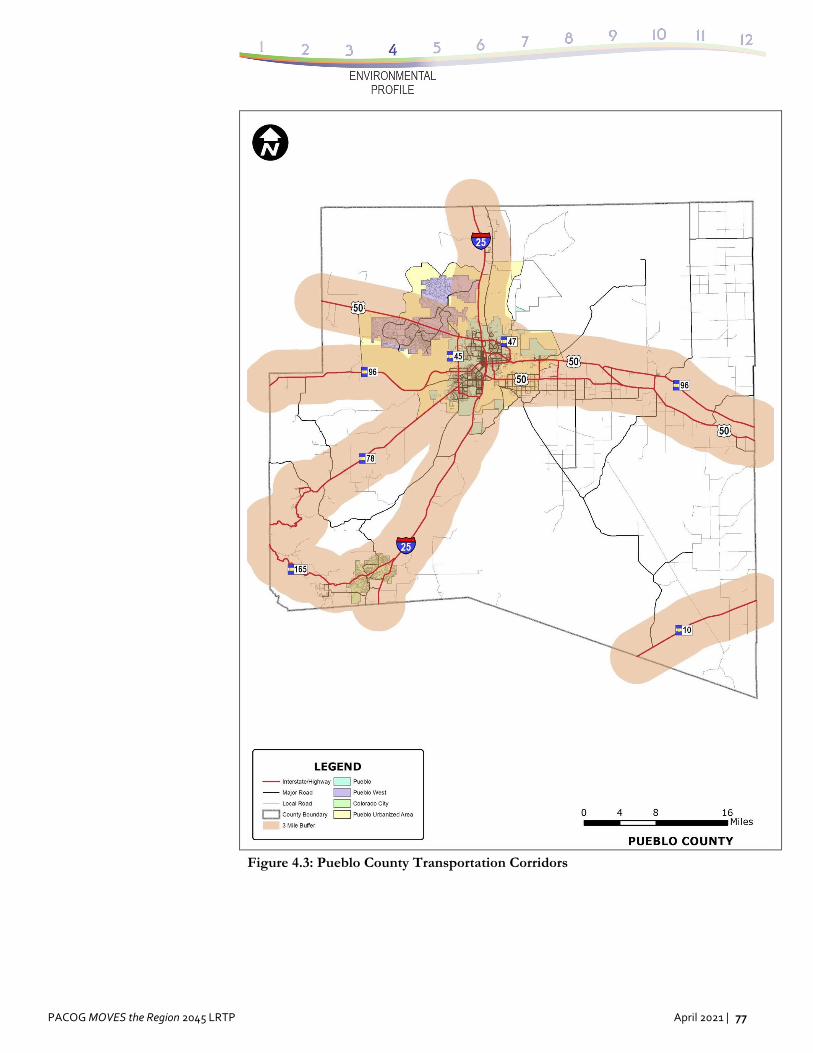
PACOG MOVES the Region 2045 LRTP April 2021 | 77
Figure 4.3: Pueblo County Transportation Corridors
78 | April 2021 PACOG MOVES the Region 2045 LRTP
4.4 Transportation and Land Use Planning
Under federal transportation planning regulations, metropolitan planning organizations (MPOs) are required to consider projects and strategies that will protect and enhance the environment, promote energy conservation, improve the quality of life, and promote consistency between transportation improvements and state and local planned growth and economic development patterns.
4.4.1 Transportation /Land Use Planning Objectives
The need to cooperatively plan transportation systems in conjunction with land uses is now widely recognized. There exists a recommended philosophy for integrating land use planning issues into LRTPs. The primary goals of this transportation planning philosophy include the following:
A desire to improve the connection between transportation and land use.
Recognition that land use decisions are made by many, often independent, actors and actions.
An interest in empowering local organizations through a bottom-up approach.
A readiness to work within the traditional planning process available to MPOs.
A willingness of the MPO to act as a leader during project conception but ultimately play the role of facilitator for local solutions and innovations.
Consistent with this philosophy, the FHWA recommends MPOs address the following issues, which implicitly require an examination of land use and transportation issues concurrently:
Corridor Planning: State departments of transportation (DOTs), MPOs, cities, and counties can develop transportation corridor plans considering land use as well as transportation issues. Some state agencies have developed handbooks for corridor planning to aid district staff and consultants when conducting planning studies.
Interchange Area Planning: Agencies at various levels have developed and/or implemented land use plans and zoning overlay ordinances to guide land development around freeway interchanges. Interchanges become magnets for development, but unplanned development and unmanaged access can quickly lead to a breakdown of traffic conditions in the vicinity of the interchange, affecting both safety and capacity. State agencies and nonprofits have sponsored the development and adoption of model codes and regulations for interchange areas, and regional agencies and local jurisdictions have sponsored the development of interchange area plans that address access, local circulation, land uses, site design, buffers, and landscaping. In Pueblo County, many of these areas are designated as “special development areas.”
Special Development Areas: These areas are lands with significant development, redevelopment and/or open space potential in strategic locations that suggest the need for careful, location-specific plans for infrastructure and private development. Master plans should be prepared prior to development or redevelopment occurring.
Linking Planning and NEPA: Transportation planning agencies are increasingly expanding the scope of their statewide, regional, and corridor planning efforts to address environmental issues, including land use impacts, at an early stage. Methods include collecting and using regional data on environmental conditions in the long-range transportation planning process; evaluating combined transportation and land use scenarios; involving federal and state resource agencies in long-range transportation planning; and recommending projects and policies in statewide and corridor plans that are designed to reduce environmental impacts.
Planning for Transit-Oriented Development: Transit agencies, MPOs, and local jurisdictions lead planning processes focusing on existing or planned transit station areas and/or corridors. These processes may involve education and outreach on transit oriented development (TOD) principles and concepts; station area conceptual planning; market assessment; detailed station area plans;
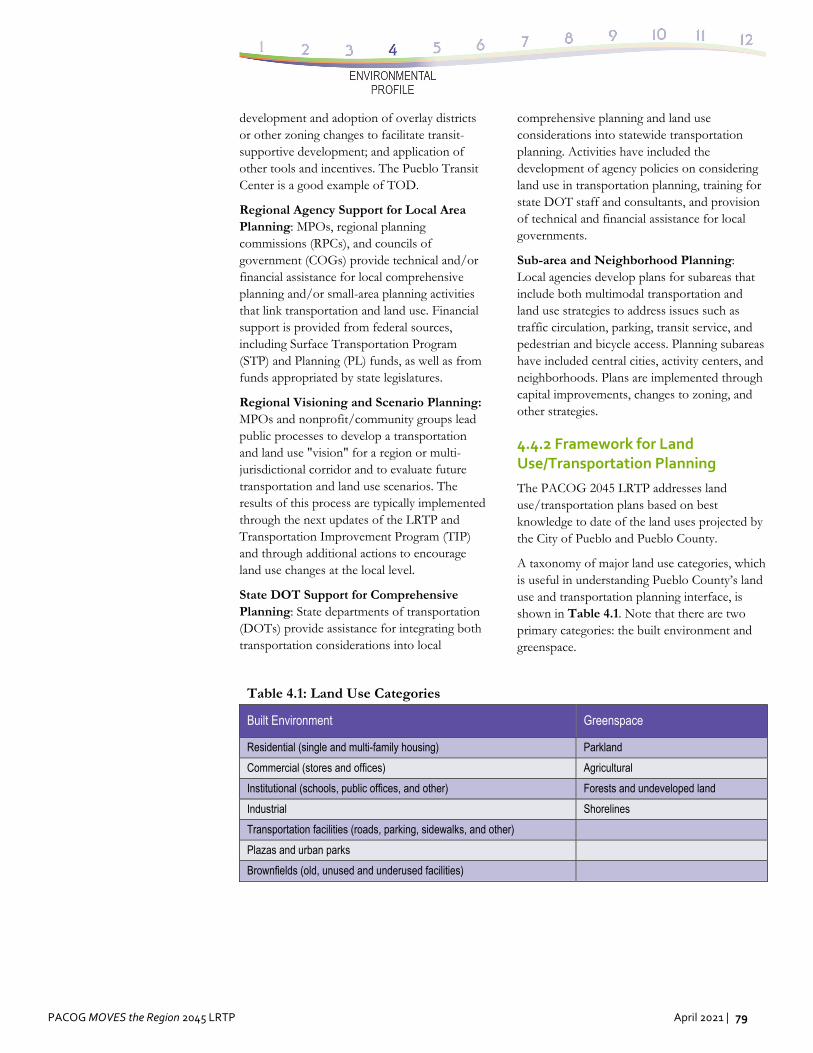
PACOG MOVES the Region 2045 LRTP April 2021 | 79
development and adoption of overlay districts or other zoning changes to facilitate transit-supportive development; and application of other tools and incentives. The Pueblo Transit Center is a good example of TOD.
Regional Agency Support for Local Area Planning: MPOs, regional planning commissions (RPCs), and councils of government (COGs) provide technical and/or financial assistance for local comprehensive planning and/or small-area planning activities that link transportation and land use. Financial support is provided from federal sources, including Surface Transportation Program (STP) and Planning (PL) funds, as well as from funds appropriated by state legislatures.
Regional Visioning and Scenario Planning: MPOs and nonprofit/community groups lead public processes to develop a transportation and land use "vision" for a region or multi-jurisdictional corridor and to evaluate future transportation and land use scenarios. The results of this process are typically implemented through the next updates of the LRTP and Transportation Improvement Program (TIP) and through additional actions to encourage land use changes at the local level.
State DOT Support for Comprehensive Planning: State departments of transportation (DOTs) provide assistance for integrating both transportation considerations into local
comprehensive planning and land use considerations into statewide transportation planning. Activities have included the development of agency policies on considering land use in transportation planning, training for state DOT staff and consultants, and provision of technical and financial assistance for local governments.
Sub-area and Neighborhood Planning: Local agencies develop plans for subareas that include both multimodal transportation and land use strategies to address issues such as traffic circulation, parking, transit service, and pedestrian and bicycle access. Planning subareas have included central cities, activity centers, and neighborhoods. Plans are implemented through capital improvements, changes to zoning, and other strategies.
4.4.2 Framework for Land Use/Transportation Planning
The PACOG 2045 LRTP addresses land use/transportation plans based on best knowledge to date of the land uses projected by the City of Pueblo and Pueblo County.
A taxonomy of major land use categories, which is useful in understanding Pueblo County’s land use and transportation planning interface, is shown in Table 4.1. Note that there are two primary categories: the built environment and greenspace.
Table 4.1: Land Use Categories
Built Environment Greenspace
Residential (single and multi-family housing) Parkland
Commercial (stores and offices) Agricultural
Institutional (schools, public offices, and other) Forests and undeveloped land
Industrial Shorelines
Transportation facilities (roads, parking, sidewalks, and other)
Plazas and urban parks
Brownfields (old, unused and underused facilities)
80 | April 2021 PACOG MOVES the Region 2045 LRTP
Land use patterns can be evaluated based on the following attributes: Density – number of people, jobs, or
housing units in an area. Mix – whether different land use types
(commercial, residential, etc.) are located together.
Clustering – whether related destinations are located together (e.g., commercial centers, urban villages, residential developments, etc.).
Connectivity – number of connections within street and path systems.
Impervious surface – land covered by buildings and pavement, also called footprint.
Greenspace – portion of land devoted to gardens, parks, farms, woodlands, and other.
Accessibility – ability to reach desired activities and destinations.
Non-motorized accessibility – quality of walking and cycling conditions.
Land use attributes can also be evaluated at various scales:
Site – an individual parcel, building, facility, or campus.
Street – the buildings and facilities along a particular street or stretch of roadway.
Neighborhood or center – a walkable area, typically less than one square mile.
Local – a small geographic area, often consisting of several neighborhoods.
Municipal – a town or city jurisdiction. Region – a geographic area where
residents share services and employment options. A metropolitan region typically consists of one or more cities and various suburbs, smaller commercial centers, and surrounding semi-rural areas.
Geographic areas are often categorized in the following ways:
Urban – relatively high density (5+ housing units per gross acre), mixed land use, with multimodal transport (typically including walking, cycling, public transit, automobiles, and taxi service).
Suburban – medium density (2--10 residents, 1–5 housing units per acre),
segregated land uses, and an automobile-dependent transportation system.
Town – Smaller urban centers (generally less than 20,000 residents).
Village – Small urban center (generally less than 1,000 residents).
Exurban – low density (less than 1 house per acre), mostly farms and undeveloped lands, located near enough to a city to commute and use services there.
Rural – low density (less than 1 house per acre), mostly farms and undeveloped lands, with a relatively independent identity and economy.
Greenspace (also called open space) – biologically active lands such as gardens, parks, farms, woodlands, and other.
Because sprawl (dispersed, low-density, automobile-dependent land use development patterns) imposes various economic, social, and environmental costs, from a public policy perspective Smart Growth development is preferable.
Transportation and land use decisions affect each other. Some types of land use patterns increase automobile travel, whereas others that support multimodal and public transportation reduce the amount of vehicle travel needed to access goods, services, and activities. Communities designed primarily for automobile transportation are called automobile dependent. Some types of transportation policies and programs also tend to encourage automobile dependency, whereas others tend to encourage multimodal distribution of demand, as summarized in Table 4.2.
4.4.3 Roadmap for the Future
In the PACOG region, the complex relationships among existing and proposed land uses and existing and proposed transportation facilities continually are being examined and modified where necessary until each of the components “best fits” with all of the others. Future land use changes will be incorporated into the transportation modeling and planning process and, reflexively, changes in plans are available to be incorporated into regional development planning, development standards, and zoning decisions.
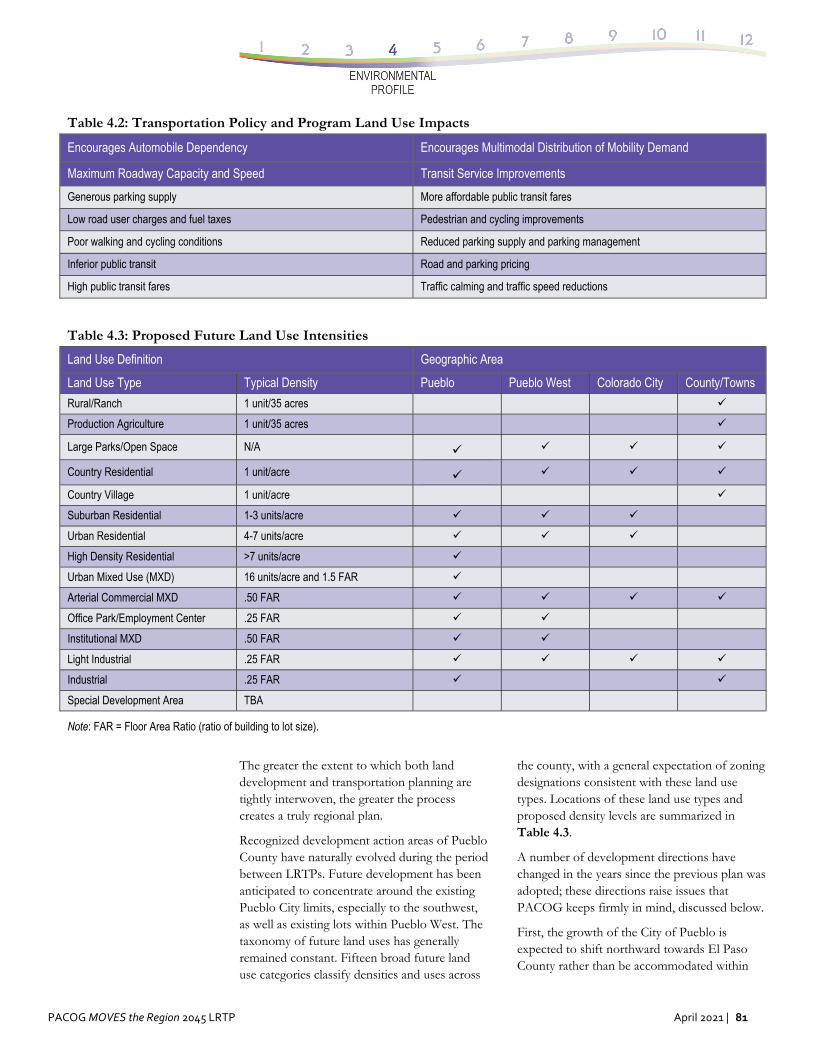
PACOG MOVES the Region 2045 LRTP April 2021 | 81
Table 4.2: Transportation Policy and Program Land Use Impacts
Encourages Automobile Dependency Encourages Multimodal Distribution of Mobility Demand
Maximum Roadway Capacity and Speed Transit Service Improvements
Generous parking supply More affordable public transit fares
Low road user charges and fuel taxes Pedestrian and cycling improvements
Poor walking and cycling conditions Reduced parking supply and parking management
Inferior public transit Road and parking pricing
High public transit fares Traffic calming and traffic speed reductions
Table 4.3: Proposed Future Land Use Intensities
Land Use Definition Geographic Area
Land Use Type Typical Density Pueblo Pueblo West Colorado City County/Towns
Rural/Ranch 1 unit/35 acres
Production Agriculture 1 unit/35 acres
Large Parks/Open Space N/A
Country Residential 1 unit/acre
Country Village 1 unit/acre
Suburban Residential 1-3 units/acre
Urban Residential 4-7 units/acre
High Density Residential >7 units/acre
Urban Mixed Use (MXD) 16 units/acre and 1.5 FAR
Arterial Commercial MXD .50 FAR
Office Park/Employment Center .25 FAR
Institutional MXD .50 FAR
Light Industrial .25 FAR
Industrial .25 FAR
Special Development Area TBA
Note: FAR = Floor Area Ratio (ratio of building to lot size).
The greater the extent to which both land development and transportation planning are tightly interwoven, the greater the process creates a truly regional plan.
Recognized development action areas of Pueblo County have naturally evolved during the period between LRTPs. Future development has been anticipated to concentrate around the existing Pueblo City limits, especially to the southwest, as well as existing lots within Pueblo West. The taxonomy of future land uses has generally remained constant. Fifteen broad future land use categories classify densities and uses across
the county, with a general expectation of zoning designations consistent with these land use types. Locations of these land use types and proposed density levels are summarized in Table 4.3.
A number of development directions have changed in the years since the previous plan was adopted; these directions raise issues that PACOG keeps firmly in mind, discussed below.
First, the growth of the City of Pueblo is expected to shift northward towards El Paso County rather than be accommodated within
82 | April 2021 PACOG MOVES the Region 2045 LRTP
and adjacent to the City of Pueblo. As new development occurs, additional connections between portions of the existing network should be made. If higher classifications of roads are not constructed by developers, then there needs to be either an additional mechanism to pay for the upgrades from local roads or a very conscious effort to disallow development that has limited access. If only a local roadway network is to be constructed, it will need the greatest amount of connectivity to reduce the need for minor and principal arterials.
Second, as Pueblo West has grown, traffic patterns have been anticipated to change to utilize routes other than U.S. Highway 50 West. Additional connections to the City of Pueblo will be called for, with additional funding mechanisms.
Third, the growing emphasis on non-motorized travel, including both walking and bicycling, is reflected on the infrastructure side by investing in paths and trails. It is further emphasized on the environmental side by the preservation of existing open lands.
Fourth, the regional role of Fort Carson, the largest employer in southern Colorado, is important to keep in mind because it affects Pueblo County.
4.5 Summary
PACOG is cognizant of the evolution of environmental legislation, much of which directly affects Pueblo. A land use density guidance for floor area ratio (FAR) provides a table of typical values useful for future planning. Regional goals relate closely to the natural resources of the area and include emphasizing recreational opportunities, preserving natural ecosystems and wildlife habitat, preserving a greenbelt of open space, managing stormwater discharges, and protecting critical wildlife migration corridors. The environmentally based tactics are interwoven with the human needs for recreation, for the enjoyment of beauty, and for pedestrian mobility and bicycling.
.
PACOG MOVES the Region 2045 LRTP April 2021 | 83
5.0 Transportation Safety & Security
5.1 Introduction
This chapter addresses two related topics: transportation safety and transportation security. A discussion of each topic is presented in a similar format: (1) in the context of Fixing America’s Surface Transportation Act (FAST Act), or the federal level; (2) in the context of the Colorado Department of Transportation (CDOT), or the state level; and (3) in the context of the Pueblo Area Council of Governments Long Range Transportation Plan (PACOG LRTP), or the regional level.
Safety can be defined as relative freedom from danger, risk, and threat of harm, injury, and loss to personnel and/or property, whether caused deliberately or by accident. In the context of highway transportation, it is typically assessed using crash data to tabulate where highway safety issues are likely to exist and structural condition reporting, which identifies infrastructure needs.
Security can be defined as the state of being free from danger and threat in a given geographic area such as a nation, state, county, region, or city. This definition can be expanded to include focused preparation for coordinated responses to potential threats and disasters, whether natural or caused by humans.
The maintenance and operation of a safe and secure transportation system is of the utmost importance to all regions, beginning with the primary focus of the protection of human life. As an example, there were 595 fatalities that occurred on Colorado roadways in 2019. Preventing these fatalities is a first priority in Colorado, as it is in every state. Investments that maintain or move the system closer to a “state of good repair,” as highlighted in Chapter 2, “Existing Transportation System,” in this LRTP, make the system safer for all users.
··················· 18 “Safety Culture and the Zero Deaths Vision,” Federal
Highway Administration, U.S. Department of
Available funds should be allocated first to maintaining the transportation system at a safe and adequate level before other projects involving modernization, enhancements, or major capital investments are considered. Similarly, increased attention to the wide range of transportation security issues in the Pueblo planning area is an important part of long range planning. Roads, bridges, rail, and airport facilities can profit from a “hardening” of the framework that protects them from harm.
5.2 Transportation System Safety
Highway safety is a critical element of transportation planning and policy. Reducing highway-related fatalities and injuries improves the overall quality of life for all Colorado residents, workers, and visitors. Deaths and injuries resulting from traffic crashes have serious public health, quality of life, and economic consequences. A safer transportation system reduces not only the tragic human costs from the loss of lives or life-altering injuries but also significant economic losses. The economic impacts of highway crashes include medical, insurance, emergency service, legal, lost wages, and personal property damage costs. Improving traffic safety not only is the right thing to do; it is also the smart thing to do.
In order to mitigate deaths and injuries from traffic crashes, PACOG subscribes to the Vision Zero movement in safety targets.18 The ultimate objective of the movement is to achieve zero deaths on the nation’s roadways. Vision Zero recognizes that individuals will make mistakes that could lead to severe injury or death. The philosophy of Vision Zero is that the transportation system should be designed in a way that helps diminish these mistakes, ultimately creating a safer system for all roadway users. This goal is achieved by bringing together the 4 Es of highway safety: engineering, education, enforcement, and emergency medical service.
Transportation, last modified April 30, 2020, https://safety.fhwa.dot.gov/zerodeaths/.
84 | April 2021 PACOG MOVES the Region 2045 LRTP
The objective of achieving zero deaths on roadways within PACOG will be accomplished by adhering to the philosophy put forth by the Vision Zero movement. Chapter 1, Section 1.3.1, “Planning Category 1: Safety,” in this LRTP sets specific targets to reach zero deaths. In order to reach this objective, PACOG has established the following goal and strategies.
Safety Goal
Improve safety by providing a multimodal transportation system that focuses on the reduction of the frequency and severity of crashes.
Safety Strategies
Preserve the existing transportation systems to ensure safe, convenient, and efficient transportation.
Maintain the performance of the Colorado state transportation system at a high level to ensure the safety of all users, including transportation operators, passengers, shippers, bicyclists, and pedestrians.
Continue to improve system safety by instituting and supporting safety programs to attain Vision Zero status with respect to fatalities and life-altering injuries.
Promote the identification of specific emphasis areas to improve transportation safety through a statewide evaluation of safety problems and multi-stakeholder input.
Continue to develop comprehensive, coordinated, and communicative safety strategies that focus on engineering, education, enforcement, and emergency medical services for all emphasis areas.
Promote the development of improved and new transportation system design, engineering, and operating technologies to increase system safety.
Promote safe and convenient travel facilities for at-risk users.
Provide a continuing program of public information and education to promote safety awareness and the implementation of safety practices.
Cooperate with other agencies to ensure prompt response to crashes on the
transportation system and timely resolution of threats to human and environmental health and safety, such as hazardous waste sites, encountered when improving transportation facilities.
5.2.1 Federal Guidance
The MAP-21 transportation bill was enacted in 2012. The safety related planning requirements were addressed largely to state departments of transportation. MAP-21 retained the Highway Safety Improvement Program (HSIP) as one of the core efforts intended to reduce injuries and fatalities on all public roads, pathways, and trails. MAP-21 provided a new emphasis on enhanced data collection and performance. The combination of the renewed HSIP and the deeper emphasis on data laid the framework for more effective spending of safety dollars on projects that make roads safer for all users. The FAST Act was enacted in 2015 and replaced Map-21. As with the MAP-21, the safety-related planning requirements were addressed largely to state departments of transportation. The FAST Act continues the focus on Metropolitan Planning Organizations (MPOs) developing regional goals and objectives. PACOG has met these federal requirements by developing the goals and objectives listed in this LRTP in Chapter 1, Section 1.3.1.
The work conducted by PACOG thus folds into safety investment and strategies at the state level led by CDOT, which in turn follows federal FAST Act guidance. The means by which the state supports national safety goals, such as maintaining road performance, improving system safety, and providing better education and outreach, are echoed by PACOG. For example, improving system safety on I-25 and U.S. Highway 50 along their entire extent is important to not only PACOG but also the state and the nation.
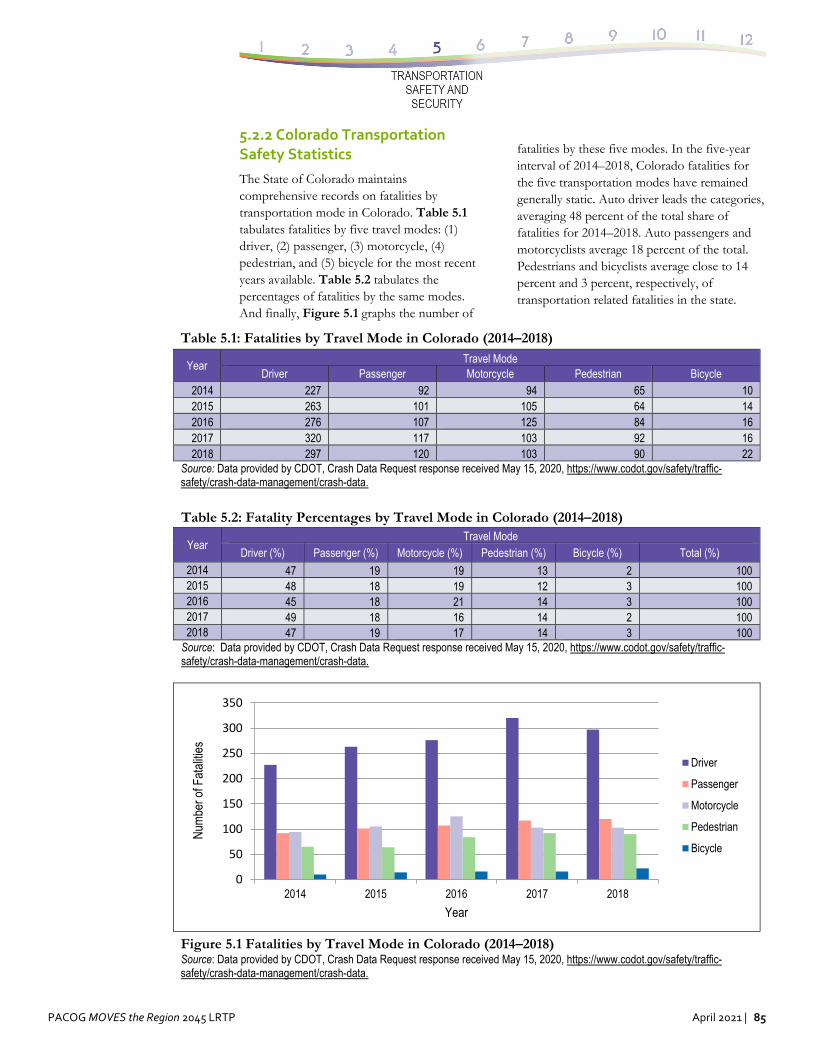
PACOG MOVES the Region 2045 LRTP April 2021 | 85
5.2.2 Colorado Transportation Safety Statistics
The State of Colorado maintains comprehensive records on fatalities by transportation mode in Colorado. Table 5.1 tabulates fatalities by five travel modes: (1) driver, (2) passenger, (3) motorcycle, (4) pedestrian, and (5) bicycle for the most recent years available. Table 5.2 tabulates the percentages of fatalities by the same modes. And finally, Figure 5.1 graphs the number of
fatalities by these five modes. In the five-year interval of 2014–2018, Colorado fatalities for the five transportation modes have remained generally static. Auto driver leads the categories, averaging 48 percent of the total share of fatalities for 2014–2018. Auto passengers and motorcyclists average 18 percent of the total. Pedestrians and bicyclists average close to 14 percent and 3 percent, respectively, of transportation related fatalities in the state.
Table 5.1: Fatalities by Travel Mode in Colorado (2014–2018)
Year Travel Mode
Driver Passenger Motorcycle Pedestrian Bicycle 2014 227 92 94 65 10 2015 263 101 105 64 14 2016 276 107 125 84 16 2017 320 117 103 92 16 2018 297 120 103 90 22
Source: Data provided by CDOT, Crash Data Request response received May 15, 2020, https://www.codot.gov/safety/traffic-safety/crash-data-management/crash-data.
Figure 5.1 Fatalities by Travel Mode in Colorado (2014–2018) Source: Data provided by CDOT, Crash Data Request response received May 15, 2020, https://www.codot.gov/safety/traffic-safety/crash-data-management/crash-data.
Table 5.2: Fatality Percentages by Travel Mode in Colorado (2014–2018)
Year Travel Mode
Driver (%) Passenger (%) Motorcycle (%) Pedestrian (%) Bicycle (%) Total (%)
2014 47 19 19 13 2 100 2015 48 18 19 12 3 100 2016 45 18 21 14 3 100 2017 49 18 16 14 2 100 2018 47 19 17 14 3 100
Source: Data provided by CDOT, Crash Data Request response received May 15, 2020, https://www.codot.gov/safety/traffic-safety/crash-data-management/crash-data.
0
50
100
150
200
250
300
350
2014 2015 2016 2017 2018
Num
ber o
f Fat
aliti
es
Year
Driver
Passenger
Motorcycle
Pedestrian
Bicycle
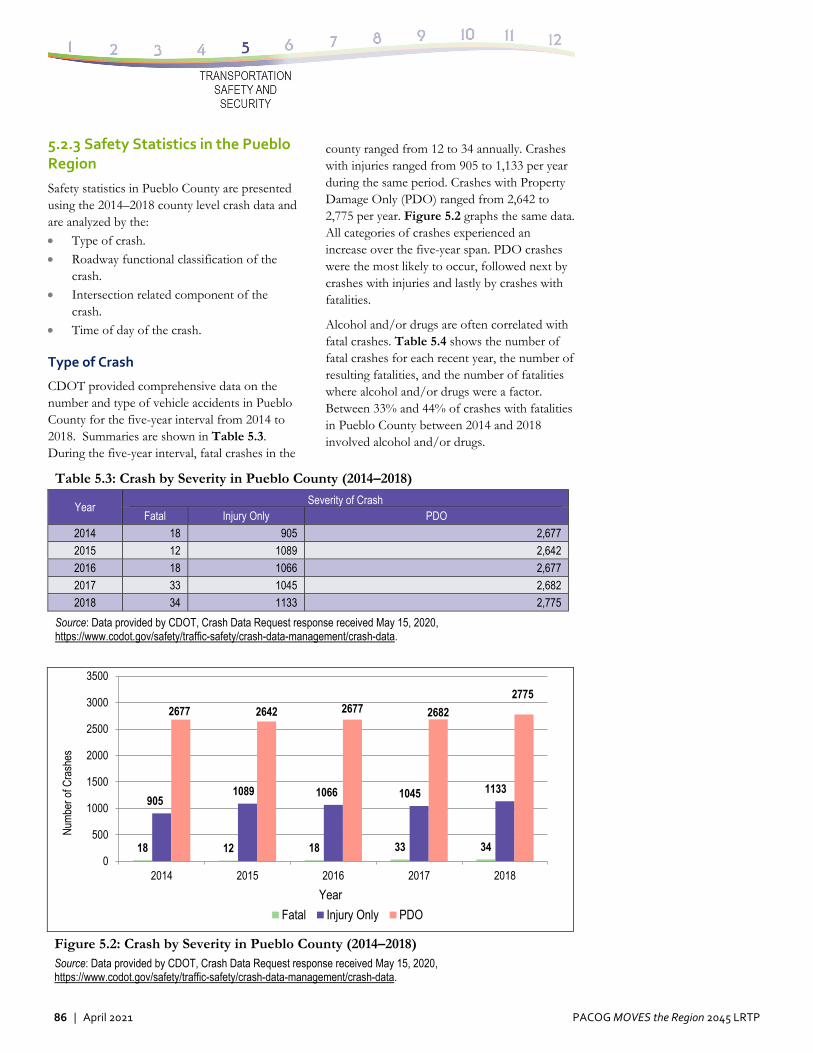
86 | April 2021 PACOG MOVES the Region 2045 LRTP
5.2.3 Safety Statistics in the Pueblo Region
Safety statistics in Pueblo County are presented using the 2014–2018 county level crash data and are analyzed by the:
Type of crash. Roadway functional classification of the
crash. Intersection related component of the
crash. Time of day of the crash.
Type of Crash
CDOT provided comprehensive data on the number and type of vehicle accidents in Pueblo County for the five-year interval from 2014 to 2018. Summaries are shown in Table 5.3. During the five-year interval, fatal crashes in the
county ranged from 12 to 34 annually. Crashes with injuries ranged from 905 to 1,133 per year during the same period. Crashes with Property Damage Only (PDO) ranged from 2,642 to 2,775 per year. Figure 5.2 graphs the same data. All categories of crashes experienced an increase over the five-year span. PDO crashes were the most likely to occur, followed next by crashes with injuries and lastly by crashes with fatalities.
Alcohol and/or drugs are often correlated with fatal crashes. Table 5.4 shows the number of fatal crashes for each recent year, the number of resulting fatalities, and the number of fatalities where alcohol and/or drugs were a factor. Between 33% and 44% of crashes with fatalities in Pueblo County between 2014 and 2018 involved alcohol and/or drugs.
Table 5.3: Crash by Severity in Pueblo County (2014–2018)
Year Severity of Crash
Fatal Injury Only PDO
2014 18 905 2,677
2015 12 1089 2,642
2016 18 1066 2,677
2017 33 1045 2,682
2018 34 1133 2,775
Source: Data provided by CDOT, Crash Data Request response received May 15, 2020, https://www.codot.gov/safety/traffic-safety/crash-data-management/crash-data.
Figure 5.2: Crash by Severity in Pueblo County (2014–2018) Source: Data provided by CDOT, Crash Data Request response received May 15, 2020, https://www.codot.gov/safety/traffic-safety/crash-data-management/crash-data.
18 12 18 33 34
9051089 1066 1045 1133
2677 2642 2677 2682
2775
0
500
1000
1500
2000
2500
3000
3500
2014 2015 2016 2017 2018
Num
ber o
f Cra
shes
Year
Fatal Injury Only PDO
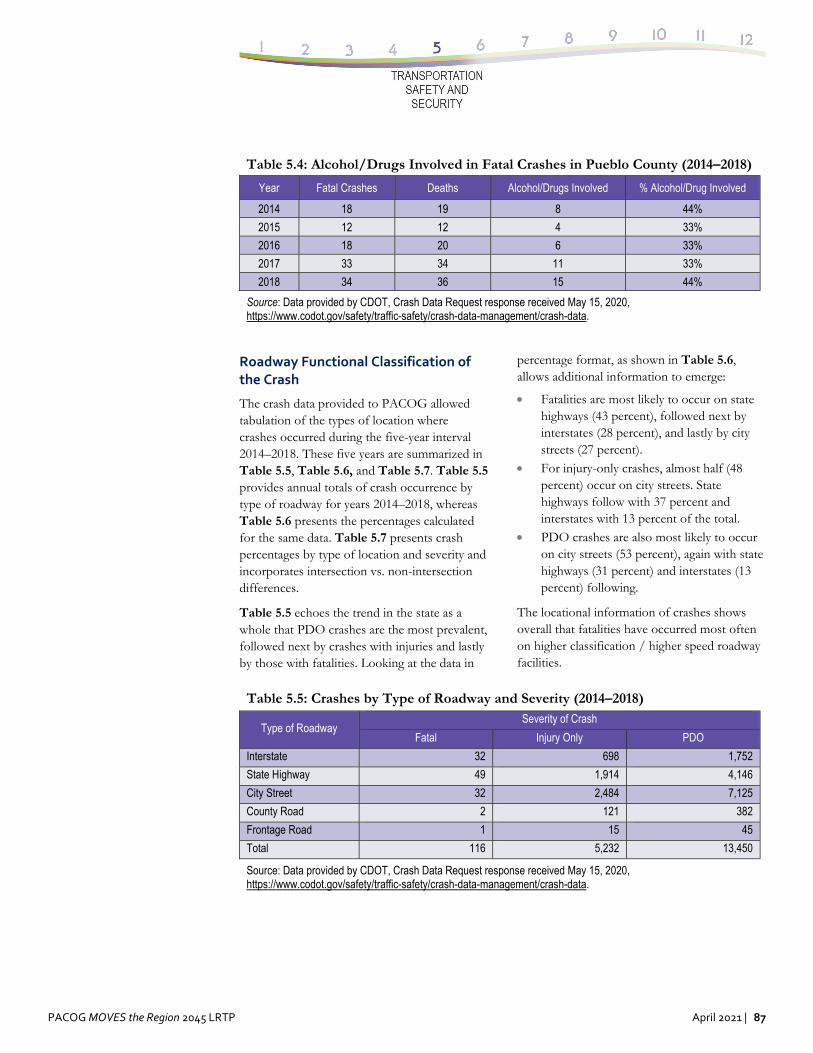
PACOG MOVES the Region 2045 LRTP April 2021 | 87
Table 5.4: Alcohol/Drugs Involved in Fatal Crashes in Pueblo County (2014–2018)
Year Fatal Crashes Deaths Alcohol/Drugs Involved % Alcohol/Drug Involved
2014 18 19 8 44%
2015 12 12 4 33%
2016 18 20 6 33%
2017 33 34 11 33%
2018 34 36 15 44%
Source: Data provided by CDOT, Crash Data Request response received May 15, 2020, https://www.codot.gov/safety/traffic-safety/crash-data-management/crash-data.
Roadway Functional Classification of the Crash
The crash data provided to PACOG allowed tabulation of the types of location where crashes occurred during the five-year interval 2014–2018. These five years are summarized in Table 5.5, Table 5.6, and Table 5.7. Table 5.5 provides annual totals of crash occurrence by type of roadway for years 2014–2018, whereas Table 5.6 presents the percentages calculated for the same data. Table 5.7 presents crash percentages by type of location and severity and incorporates intersection vs. non-intersection differences.
Table 5.5 echoes the trend in the state as a whole that PDO crashes are the most prevalent, followed next by crashes with injuries and lastly by those with fatalities. Looking at the data in
percentage format, as shown in Table 5.6, allows additional information to emerge:
Fatalities are most likely to occur on state highways (43 percent), followed next by interstates (28 percent), and lastly by city streets (27 percent).
For injury-only crashes, almost half (48 percent) occur on city streets. State highways follow with 37 percent and interstates with 13 percent of the total.
PDO crashes are also most likely to occur on city streets (53 percent), again with state highways (31 percent) and interstates (13 percent) following.
The locational information of crashes shows overall that fatalities have occurred most often on higher classification / higher speed roadway facilities.
Table 5.5: Crashes by Type of Roadway and Severity (2014–2018)
Type of Roadway Severity of Crash
Fatal Injury Only PDO
Interstate 32 698 1,752
State Highway 49 1,914 4,146
City Street 32 2,484 7,125
County Road 2 121 382
Frontage Road 1 15 45
Total 116 5,232 13,450
Source: Data provided by CDOT, Crash Data Request response received May 15, 2020, https://www.codot.gov/safety/traffic-safety/crash-data-management/crash-data.
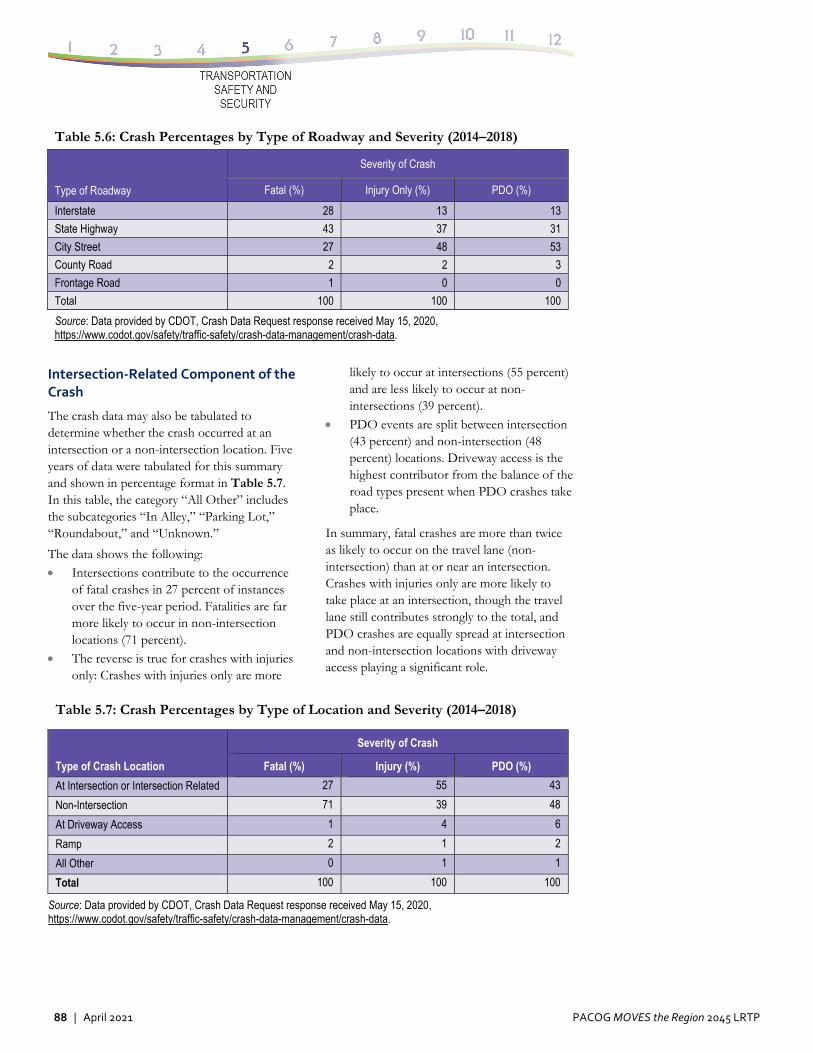
88 | April 2021 PACOG MOVES the Region 2045 LRTP
Table 5.6: Crash Percentages by Type of Roadway and Severity (2014–2018)
Type of Roadway
Severity of Crash
Fatal (%) Injury Only (%) PDO (%)
Interstate 28 13 13
State Highway 43 37 31
City Street 27 48 53
County Road 2 2 3
Frontage Road 1 0 0
Total 100 100 100
Source: Data provided by CDOT, Crash Data Request response received May 15, 2020, https://www.codot.gov/safety/traffic-safety/crash-data-management/crash-data.
Intersection‐Related Component of the Crash
The crash data may also be tabulated to determine whether the crash occurred at an intersection or a non-intersection location. Five years of data were tabulated for this summary and shown in percentage format in Table 5.7. In this table, the category “All Other” includes the subcategories “In Alley,” “Parking Lot,” “Roundabout,” and “Unknown.”
The data shows the following: Intersections contribute to the occurrence
of fatal crashes in 27 percent of instances over the five-year period. Fatalities are far more likely to occur in non-intersection locations (71 percent).
The reverse is true for crashes with injuries only: Crashes with injuries only are more
likely to occur at intersections (55 percent) and are less likely to occur at non-intersections (39 percent).
PDO events are split between intersection (43 percent) and non-intersection (48 percent) locations. Driveway access is the highest contributor from the balance of the road types present when PDO crashes take place.
In summary, fatal crashes are more than twice as likely to occur on the travel lane (non-intersection) than at or near an intersection. Crashes with injuries only are more likely to take place at an intersection, though the travel lane still contributes strongly to the total, and PDO crashes are equally spread at intersection and non-intersection locations with driveway access playing a significant role.
Table 5.7: Crash Percentages by Type of Location and Severity (2014–2018)
Type of Crash Location
Severity of Crash
Fatal (%) Injury (%) PDO (%)
At Intersection or Intersection Related 27 55 43
Non-Intersection 71 39 48
At Driveway Access 1 4 6
Ramp 2 1 2
All Other 0 1 1
Total 100 100 100
Source: Data provided by CDOT, Crash Data Request response received May 15, 2020, https://www.codot.gov/safety/traffic-safety/crash-data-management/crash-data.
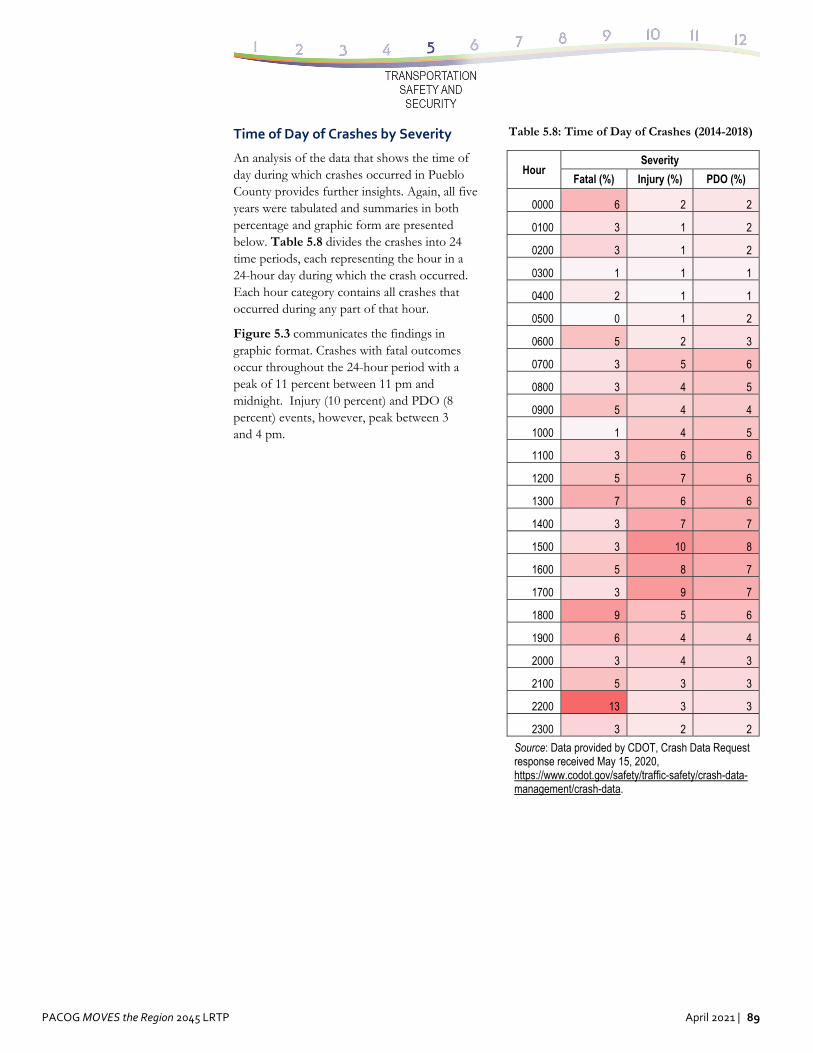
PACOG MOVES the Region 2045 LRTP April 2021 | 89
Time of Day of Crashes by Severity
An analysis of the data that shows the time of day during which crashes occurred in Pueblo County provides further insights. Again, all five years were tabulated and summaries in both percentage and graphic form are presented below. Table 5.8 divides the crashes into 24 time periods, each representing the hour in a 24-hour day during which the crash occurred. Each hour category contains all crashes that occurred during any part of that hour.
Figure 5.3 communicates the findings in graphic format. Crashes with fatal outcomes occur throughout the 24-hour period with a peak of 11 percent between 11 pm and midnight. Injury (10 percent) and PDO (8 percent) events, however, peak between 3 and 4 pm.
Table 5.8: Time of Day of Crashes (2014-2018)
Hour Severity
Fatal (%) Injury (%) PDO (%)
0000 6 2 2
0100 3 1 2
0200 3 1 2
0300 1 1 1
0400 2 1 1
0500 0 1 2
0600 5 2 3
0700 3 5 6
0800 3 4 5
0900 5 4 4
1000 1 4 5
1100 3 6 6
1200 5 7 6
1300 7 6 6
1400 3 7 7
1500 3 10 8
1600 5 8 7
1700 3 9 7
1800 9 5 6
1900 6 4 4
2000 3 4 3
2100 5 3 3
2200 13 3 3
2300 3 2 2
Source: Data provided by CDOT, Crash Data Request response received May 15, 2020, https://www.codot.gov/safety/traffic-safety/crash-data-management/crash-data.
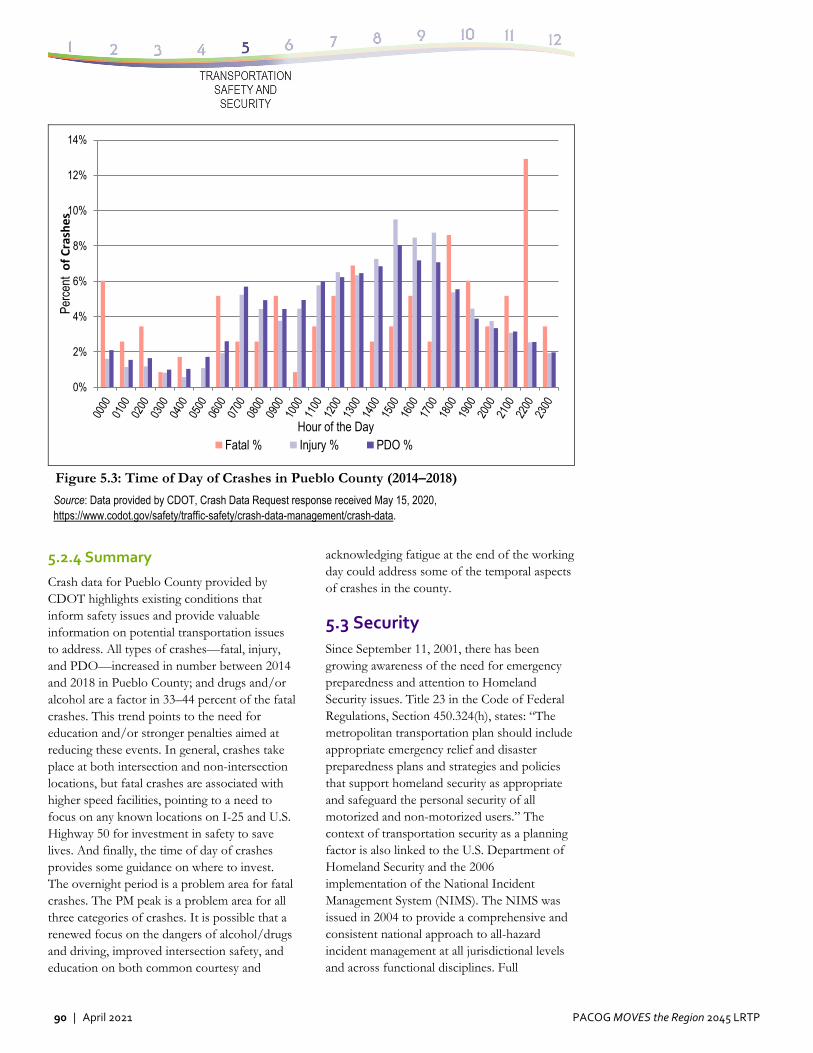
90 | April 2021 PACOG MOVES the Region 2045 LRTP
Figure 5.3: Time of Day of Crashes in Pueblo County (2014–2018)
Source: Data provided by CDOT, Crash Data Request response received May 15, 2020, https://www.codot.gov/safety/traffic-safety/crash-data-management/crash-data.
5.2.4 Summary
Crash data for Pueblo County provided by CDOT highlights existing conditions that inform safety issues and provide valuable information on potential transportation issues to address. All types of crashes—fatal, injury, and PDO—increased in number between 2014 and 2018 in Pueblo County; and drugs and/or alcohol are a factor in 33–44 percent of the fatal crashes. This trend points to the need for education and/or stronger penalties aimed at reducing these events. In general, crashes take place at both intersection and non-intersection locations, but fatal crashes are associated with higher speed facilities, pointing to a need to focus on any known locations on I-25 and U.S. Highway 50 for investment in safety to save lives. And finally, the time of day of crashes provides some guidance on where to invest. The overnight period is a problem area for fatal crashes. The PM peak is a problem area for all three categories of crashes. It is possible that a renewed focus on the dangers of alcohol/drugs and driving, improved intersection safety, and education on both common courtesy and
acknowledging fatigue at the end of the working day could address some of the temporal aspects of crashes in the county.
5.3 Security
Since September 11, 2001, there has been growing awareness of the need for emergency preparedness and attention to Homeland Security issues. Title 23 in the Code of Federal Regulations, Section 450.324(h), states: “The metropolitan transportation plan should include appropriate emergency relief and disaster preparedness plans and strategies and policies that support homeland security as appropriate and safeguard the personal security of all motorized and non-motorized users.” The context of transportation security as a planning factor is also linked to the U.S. Department of Homeland Security and the 2006 implementation of the National Incident Management System (NIMS). The NIMS was issued in 2004 to provide a comprehensive and consistent national approach to all-hazard incident management at all jurisdictional levels and across functional disciplines. Full
0%
2%
4%
6%
8%
10%
12%
14%
Perc
entof Crashes
Hour of the DayFatal % Injury % PDO %
PACOG MOVES the Region 2045 LRTP April 2021 | 91
compliance with the NIMS certification process was required by September 2006. Since 2007, NIMS compliance has been a condition for jurisdictions to receive federal preparedness funding assistance.
From a transportation planning perspective, security is an emerging area of concern, and each MPO will have different security priorities. The transportation plan should address safety in the following ways:
Define the role of the MPO and public transportation operators in promoting security, which may be, in part, defined elsewhere in state or local legislation related to emergency management responsibilities.
Identify critical facilities and transportation system elements and the risk to assets such as highways, transit systems, and freight rail lines critical to national defense and/or economic security and infrastructure intricately related to potential high-value security targets.
Identify appropriate security goals and strategies.
Identify projects and strategies that will increase the security of transportation system users in the LRTP and the Transportation Improvement Program (TIP).
PACOG understands that the focus of the multi-jurisdiction security planning efforts is to minimize the direct or indirect disruptions caused either by natural or human actions. These disruptions can occur in any season of the year and cover a limited or a wide-ranging area in the Pueblo MPO region. Examples of the types of events are:
Natural events: Tornado, blizzard, flood, wildfire, and pandemic.
Human-caused events: Hazardous material incident, power outage, act of terrorism, and civil disturbance.
The events that require a security response share common traits: they are often unexpected,
··················· 19 Colorado Division of Homeland Security & Emergency
Management (DHSEM) Planning Section, “State Emergency Operations Plan: 2019,” (Centennial, CO: 2019),
they jeopardize lives, and they place a strain on emergency personal who may not be available due to a high demand for their services.
5.3.1 Security Goals – National
The U.S. Department of Transportation (USDOT) maintains several objectives for national security:
Develop/obtain expert transportation sector intelligence.
Build preparedness for emergencies affecting the transportation sector.
Plan for effective response to emergencies affecting the transportation sector.
PACOG addresses security issues by cataloging available emergency management resources and documenting actions that the area has already undertaken, at both the state and local levels.
5.3.2 Security Goals – State of Colorado
State of Colorado Emergency Operations Plan
The purpose of the Colorado State Emergency Operations Plan (SEOP) is to identify the roles, responsibilities, and actions of state government in disasters.19 Emergency operation plans address the ability to direct, control, coordinate, and manage emergency operations. Each level of government should respond to an incident using its available resources, to include the use of mutual aid, and may request assistance from the next higher level of government, if required. When local government capabilities are overtaxed, state government has resources and expertise available to provide emergency or disaster assistance. The state will modify normal operations and redirect resources to assist and support local governments in saving lives, relieving human suffering, sustaining survivors, protecting property, and reestablishing essential services. Federal government resources and expertise can be mobilized to augment
https://drive.google.com/file/d/1JN8CAkwZcaG80ocHOdcx83-ALCIT8KCz/view.
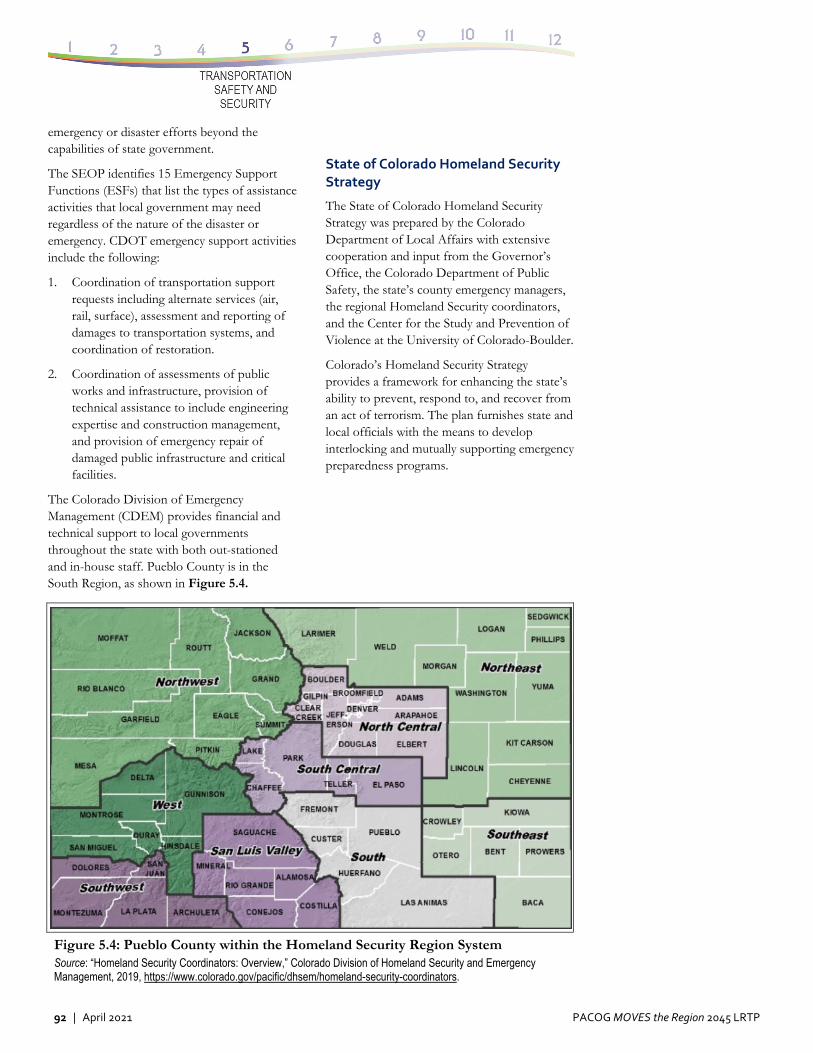
92 | April 2021 PACOG MOVES the Region 2045 LRTP
emergency or disaster efforts beyond the capabilities of state government.
The SEOP identifies 15 Emergency Support Functions (ESFs) that list the types of assistance activities that local government may need regardless of the nature of the disaster or emergency. CDOT emergency support activities include the following:
1. Coordination of transportation support requests including alternate services (air, rail, surface), assessment and reporting of damages to transportation systems, and coordination of restoration.
2. Coordination of assessments of public works and infrastructure, provision of technical assistance to include engineering expertise and construction management, and provision of emergency repair of damaged public infrastructure and critical facilities.
The Colorado Division of Emergency Management (CDEM) provides financial and technical support to local governments throughout the state with both out-stationed and in-house staff. Pueblo County is in the South Region, as shown in Figure 5.4.
State of Colorado Homeland Security Strategy
The State of Colorado Homeland Security Strategy was prepared by the Colorado Department of Local Affairs with extensive cooperation and input from the Governor’s Office, the Colorado Department of Public Safety, the state’s county emergency managers, the regional Homeland Security coordinators, and the Center for the Study and Prevention of Violence at the University of Colorado-Boulder.
Colorado’s Homeland Security Strategy provides a framework for enhancing the state’s ability to prevent, respond to, and recover from an act of terrorism. The plan furnishes state and local officials with the means to develop interlocking and mutually supporting emergency preparedness programs.
Figure 5.4: Pueblo County within the Homeland Security Region System Source: “Homeland Security Coordinators: Overview,” Colorado Division of Homeland Security and Emergency Management, 2019, https://www.colorado.gov/pacific/dhsem/homeland-security-coordinators.
PACOG MOVES the Region 2045 LRTP April 2021 | 93
The strategy plan focuses on preparedness for acts of terrorism and addresses disaster planning that is supplemented by local strategic and operations plans. This coordinated effort by federal, state, and local governments identifies needed resources, develops strategies, and creates partnerships throughout the public and private sector that serve as a foundation for homeland security efforts now and in the future.
State Homeland Security/Emergency Management
Colorado's Multi-Agency Coordination Center (MACC) offers the ability for state, federal, and local agencies to come together in a central location to coordinate the response to emergencies and disasters throughout the state. The MACC is a state-of-the-art center developed specifically to help Colorado respond to any type of disaster or emergency it may face. The center is housed with South Metro Fire and Rescue in Centennial, Colorado. The Colorado Information Analysis Center (CIAC) was added to the center with a disaster prevention focus and strong links to federal and local agencies.
The MACC is linked to CDOT's Transportation Operations Center (TOC), which provides highway surveillance camera displays to monitor state roadways and weather throughout Colorado. The center also provides general intelligence on all transportation systems, including railroads and airports. The TOC has command and control over all state road systems, bridges, and underpasses; provides avalanche analysis and control; and acts as the command and control center in the event of an emergency.
Colorado Department of Transportation
CDOT’s role in emergency management consists primarily of safeguarding and maintaining the state transportation system in the affected area and facilitating and coordinating evacuation routes that utilize the state transportation system. CDOT maintenance staff serve as the primary responders for addressing damage to CDOT
infrastructure and providing assistance to others.
Colorado Information Analysis Center
The CIAC is designed to be a cross-jurisdictional partnership between local, state, and federal agencies, including private sector participation when appropriate. This center centralizes the collection, analysis, and timely dissemination of terrorism-related information in Colorado. Information is distributed from the CIAC in the form of daily reports, special reports, and bulletins to numerous agencies representing a multitude of disciplines, including the Colorado State Patrol.
Colorado Department of Public Health and Environment
The Colorado Department of Public Health and Environment (CDPHE) works closely with the Centers for Disease Control and Prevention (CDC), state Local Public Health Agencies (LPHAs), and communities to provide updated information about health-related issues. The agency’s strategic plan for 2019–2023 addresses the priorities of air quality, healthy eating, immunizations, suicide prevention, emergency preparedness, and advancing operational excellence that consistently exceeds expectations. Added to this list of priorities is the 2019–2020 onset of the COVID-19 virus. Some background on the challenges of the COVID-19 pandemic is useful in the context of safety in the state and in Pueblo County.
COVID‐19
Coronaviruses are a large family of viruses; COVID-19 is a novel coronavirus identified in 2019, and in its name “CO” stands for “corona,” “VI” for “virus,” “D” for disease, and “19” for “2019.” A novel (or new) coronavirus is a strain of virus that has not been previously identified in humans. Rarely, animal coronaviruses can evolve and infect people and then spread between people, such as has been seen with Middle East Respiratory Syndrome (MERS) and Severe Acute Respiratory Syndrome (SARS). These viruses have caused outbreaks internationally and have been known
94 | April 2021 PACOG MOVES the Region 2045 LRTP
to cause severe illness. Scientists think this is what happened with COVID-19.
Beginning in early 2020, COVID-19 has been spreading from person to person in most countries and states, including Colorado.
At the state level, the CDPHE has set up a website to address questions and find solutions for citizens of the state. Among the many issues addressed are Frequently Asked Questions (FAQs), COVID-19 symptoms checklist and screening, the stay-at-home order, safe quarantining and related topics. The website links users to social media sites on Facebook, Twitter, and Instagram.20
PACOG has responded to the COVID-19 challenge by linking the PACOG website to that of the Pueblo Department of Public Health and Environment (PDPHE). The PDPHE is continuing in 2020 to closely monitor the COVID-19 outbreak and is in close and regular contact with CDPHE and Centers for Disease Control and Prevention (CDC). PDPHE has been planning for and practicing response for situations like this for over 10 years. The agency has plans, partnerships, and resources in place to support the community and is working in close coordination with regional public health partners, hospitals, and the health care community. Related guidance is provided on this website for the following:
- Stay-at-home orders
- Best practices for retail food, pick-up/delivery services
- Emergency child care
- Frequently Asked Questions (FAQs)
The PDPHE has also made an emergency preparedness film, which can be accessed their website. Produced by Reel Focus Productions, The Plan: Are You Prepared? is available in both English and Spanish.21
··················· 20 “Information on the Outbreak of COVID-19,” Colorado
Department of Public Health & Environment and Colorado State Emergency Operations Center, accessed April 16, 2020, https://covid19.colorado.gov/.
5.3.3 PACOG’s Role in Security and Emergency Management
MPOs such as PACOG also have a role in security and emergency management efforts. This role varies based upon the political and institutional context of the region. Clearly, emergency management, public safety, and transportation operating agencies have the primary responsibility for responding to disasters. However, outside of the immediate urgency of response, there are opportunities to support coordinated responses to potential incidents and to assist in developing strategies to handle demands on the transportation system, before or after an incident, in which the MPO can play an important role. As a facilitator of collaboration, the MPO can assist in multiple ways. The MPO can serve as a forum for cooperative decision making and as an advocate for funding of regional transportation strategies. At the technical level, the MPO can provide transportation network-based technical analyses to assess both the impacts of and needs related to security and emergency management efforts.
The Public Works Departments of the City of Pueblo and of Pueblo County are important partners in the PACOG security planning process. They are also the stewards, with CDOT, of the key portions of the existing roadway network as noted in Chapter 2, “Existing Transportation System.” Note that in this particular chapter of the LRTP, safety and security are blended in the way they deliver value to the residents of the PACOG region. Specific roles and responsibilities of the regional leadership include:
Inspection of bridges, roads, signs, lighting, airports, and sidewalks for damage.
Coordination and repair of damaged transportation structures, including roads, traffic control systems, and signage.
Maintaining rights-of-way for emergency vehicles.
Assisting in traffic management during incidents.
21 “COVID-19,” Pueblo Department of Public Health and Environment (PDPHE), accessed April 16, 2020, https://county.pueblo.org/public-health/covid-19.
PACOG MOVES the Region 2045 LRTP April 2021 | 95
Helping secure geographic areas with roadblocks or other physical measures.
Establishing short-term and long-term detours and signage.
Removing debris and cleaning streets and roadways.
Setting priorities for restoration of transportation systems.
5.3.4 PACOG’s Policy Goals for Security
The current 2045 PACOG LRTP formalizes the security goal of the MPO by citing it specifically:
To increase the security of the transportation system for motorized and non-motorized users by implementing transportation improvements and securing existing transportation facilities.
The intent of this goal is to move toward providing an enhanced transportation system and personal security for both residents of and visitors to the region. This goal includes securing high-value targets through measures such as access control, monitoring/surveillance, standoffs, and “hardened” construction. The measures utilized may vary based on the threats posed (e.g., earthquake, hurricane, wildfire, or terrorist attack). Personal security measures include emergency call phones, improved lighting, and surveillance. It is anticipated that performance measures would be identified in more detail as security goals nationwide are better defined. They may include the percentage of identified high-value targets secured, the percentage of identified redundant evacuation routes implemented, and the percentage of identified transportation facilities secured for the traveling public.
The first step in the security realm is the cataloging of PACOG transportation assets. It is anticipated that a baseline year can then be set in the near future and that all transportation assets will be subjected to a deadline for a full security audit.
··················· 22 Douglas B. Ham, Stephen Lockwood (Parsons
Brinckerhoff) and Science Applications International Corporation (SAIC) “Contractor’s Final Report: National Needs Assessment for Ensuring
5.3.5 Key PACOG Transportation Assets
Key transportation system assets in the PACOG Planning Area include the: Interstate Highway System. National Highway System (NHS) Routes. Strategic Highway Network (STRAHNET)
Routes –The STRAHNET is the road system deemed necessary for emergency mobilization and peacetime movement of heavy armor, fuel, ammunition, repair parts, food, and other commodities to support U.S. military operations in the region.
Transit System – The transit system is particularly important relative to its potential contribution to the evacuation of areas.
Pueblo Memorial Airport. The Burlington Northern Santa Fe (BNSF)
and Union Pacific (UP) Rail Line Corridors.
Most of these facilities are linear in nature, and although risks exist across these networks due to a potential incident, there is built-in redundancy from the supporting network of state, county, and city roadways that can serve, if necessary, as alternative routes for the movement of vehicles in the case of an incident. However, there are elements of these networks, such as key bridges, that, if damaged, would have a more significant effect on the operation of the system.
Using guidelines developed in a seminal report on transportation infrastructure security,22 an assessment to identify potentially important bridge facilities should be carried out. The key criteria for this analysis include the following:
Casualty risk Economic disruption Military support Emergency relief
Infrastructure Security (report requested by AASHTO Transportation Security Task Force, October 2002).
96 | April 2021 PACOG MOVES the Region 2045 LRTP
Agencies primarily responsible for major highway security in the Pueblo planning area include the Colorado State Patrol and local law enforcement. Effective coordination and communication between these agencies are crucial during emergency situations. Security is provided through routine road patrols, the traffic management/operations center, flight patrols, and crash and criminal investigations.
5.3.6 Freight & Aviation Security
Truck Freight Security
The Colorado State Patrol and the Pueblo County Sheriff’s Office are primarily responsible for providing security on the Pueblo region’s truck freight network, which generally implies the interstate and U.S. Highway system. Truck freight security initiatives include the following: Mandatory roadside freight checkpoints State permitting for haulers Commercial vehicle requirements Restricted travel times Specific restrictions for hazardous material
haulers Background checks
Carrier safety ratings and assessments Preferred hazardous material routing Safety audits and surveys A security training program
The Transportation Security Administration (TSA) has been working closely with a number of chemical shippers to develop a series of baseline security standards for both toxic inhalation hazard materials and hazardous chemicals of concern. Those standards will address specific areas such as vehicle tracking, vehicle attendance, vehicle alarm systems, truck cab access controls, locking fifth wheels on tank trailers, and security route and stop areas.
Rail Security
In the United States, a large percentage of hazardous material is transported using the rail mode. The rail lines through the Pueblo region are potential routes for the transport of many types of hazardous material from chemicals to radioactive waste.
Freight rail does not offer terrorists the high densities of passenger targets, but it does provide opportunities that passenger rail does not afford. Specifically, freight rail is used to transport hazardous materials and dangerous cargoes, which, if disrupted, can create substantial damage and panic. An estimated 40 percent of inter-city freight transport occurs by rail, including half of the nation’s hazardous materials.
In the aftermath of the September 11, 2001, terrorism events, the leadership of the freight rail industry generated more than 100 action items, a multistage alert system, and around-the-clock communications with homeland security and national defense officials. These action items were based on the results of a strategic review of the transportation of hazardous materials; the security of the industry’s information infrastructure, freight rail operations, and infrastructure; and military needs relating to the rail network. The critical action items included the need to: Integrate protective housings, valves, and
fittings into hazardous transport infrastructure to prevent tampering and facilitate emergency response.
Increase surveillance of freight equipment through training of staff on observation and installation of video surveillance equipment.
Improve operations by monitoring for signal tampering, requiring crews and dispatchers to verify communications for train movements and dispatches, and locking locomotive doors to prevent hijackings.
Secure the information infrastructure that terrorists could use to enhance attacks or cause systemic shutdowns.
Collaborate with the Department of Defense (DOD) to ensure the viability of the Strategic Rail Corridor Network (STRACNET), defined as designated rail lines that are capable of meeting unique DOD requirements, such as the ability to handle heavy, high, or wide loads.
PACOG MOVES the Region 2045 LRTP April 2021 | 97
It is not clear what level of resources should be spent on rail security relative to the security of other potential targets in Pueblo County. The rail corridor that travels through the Pueblo region is heavily used and suffers from a lack of alternative routes. Therefore, attacks on critical freight nodes or functions could create substantial bottlenecks and throughput pressures. The freight rail system is in the hands of the private sector; and the BNSF and UP have comprehensive security programs in place at this time. A collaborative effort between the railroads and PACOG may be valuable.
Aviation Security
The Pueblo Memorial Airport (PUB) is a public airport that is owned and operated by the City of Pueblo. It is used for general aviation and by one airline, subsidized by the Essential Air Service program. Federal Aviation Administration (FAA) records indicate the airport had 2,377 passenger boardings (enplanements) in calendar year 2016, 3,833 in 2017, and 10,459 in 2018. It is used for commercial passenger flights, charter, military, business, and passenger service by based and visiting aircraft, recreational and general aviation flight, and flight training. Security measures installed at the Pueblo Memorial Airport include monitored surveillance of airport property by airport security, video surveillance cameras, fenced grounds, and luggage and passenger screening by TSA personnel.
5.3.7 Recommended Future Activities for PACOG
PACOG has identified a small set of tasks to better integrate security into the LRTP. The MPO understands that much of the response framework is in place and that PACOG can offer the ability to coordinate activities and to prepare technical analysis to support resource allocation. It is anticipated that the efforts listed below will be addressed on an ongoing basis.
Maintain the process to identify state and local agency efforts and/or private sector efforts to enhance security planning for the PACOG transportation system.
Work to provide safe and secure facilities and transportation infrastructure for
residents, visitors, and commerce in the PACOG planning area through efforts to reduce injuries, fatalities, and property damage for all modes of transportation and to minimize security risks at airports, rest areas, and public transportation facilities and on roadways and bikeways.
Start the following processes: Complete a risk and vulnerability
assessment of transportation assets.
Assist in the identification of key evacuation routes from activity areas in Pueblo.
Prepare demographic profile information and a geographic inventory of transportation-disadvantaged populations who may need assistance to evacuate during a disaster.
PACOG MOVES the Region 2045 LRTP April 2021 | 99
6.0 Mobility & Alternatives Analysis Travel demand analysis provides a framework to identify transportation facilities and services that will be needed to serve future traffic demand in a region. Network-based analysis is used to identify locations where future demand is expected to approach or exceed the capacity of the existing transportation networks. This information provides a basis for developing alternative improvement projects that can be simulated and tested to determine effectiveness in meeting regional goals, including reduction of both congestion and vehicle miles traveled.
6.1 Forecasting Methodologies
Demand for transportation is forecast in one of two ways. The first is to examine past growth in traffic volumes along individual corridors and apply these historical growth factors to existing traffic along the same corridors. The second way is to build and utilize a network demand model. Network demand models have advantages, such as the capability to estimate the additional travel demand based on the amount and location of future growth in residential population and employment for each area within the region. Travel demand forecasting can be used to estimate traffic on complex highway networks whether statewide or within a Metropolitan Planning Organization (MPO) such as the Pueblo Area Council of Governments (PACOG) region. Each of the MPOs in the state of Colorado uses a travel demand model, which provides the most reliable forecasts for planning and project-level analysis.
PACOG completed a comprehensive update of its travel demand forecasting model in 2014. In 2020 the PACOG model was again updated to a base year of 2020 to support the identification and analysis of the impacts of land use changes and roadway improvements on regional traffic flow and to serve the 2045 Long Range Transportation Plan (LRTP). The model
··················· 23 HDR and Parsons Brinckerhoff, “Pueblo Planning
Model Methodology Report,” Pueblo Area Council of Governments, March 2015.
continues to depend on the 2010 Front Range Household Travel Survey (HHTS) for calibration targets. The inputs to the model are 2020 and 2045 socioeconomic data that has been disaggregated to the revised traffic analysis zone (TAZ) level, as well as updated network databases for the 2020 base year and 2045 planning horizon year. The 2045 planning horizon socioeconomic forecasts are consistent with county-level control totals prepared statewide by the Office of the Colorado State Demographer. Detailed information on the inputs, outputs, and the structure of the PACOG travel demand model can be found in the 2015 methodology report,23 and the 2020 Model Validation Memo,24 both of which are internal documents that can be requested from PACOG staff. Additional information can be found in “Appendix B: Demographic Forecasts” in this LTRP. The model results are validated using 2019 City and County of Pueblo traffic counts as well as Colorado Department of Transportation (CDOT) traffic data and growth forecasts. Two roadway networks were developed to support travel demand analysis for the 2045 LRTP. These are the 2020 model base year network and a 2045 Fiscally Constrained LRTP Network.
The goal of this chapter is to present the results of PACOG’s 2020 and 2045 mobility overview. This task will be achieved in this sequence:
1. Present the analysis framework.
2. Review existing and future congestion.
3. Introduce solutions for future congestion.
6.2 Roadway Analysis Approach
Roadway capacity is of critical importance when examining the growth of a region. As traffic volumes continue to increase, roadway congestion also increases, and vehicle flow deteriorates. For this reason, it is important to look at the size and configuration of the current roadways and determine if these roads need to be expanded or if a road addition is needed to accommodate future traffic needs.
24 Wilson and Company and WSP, “Final PACOG 2020 Validation Tech Memo,” Pueblo Area Council of Governments, August 13, 2020.
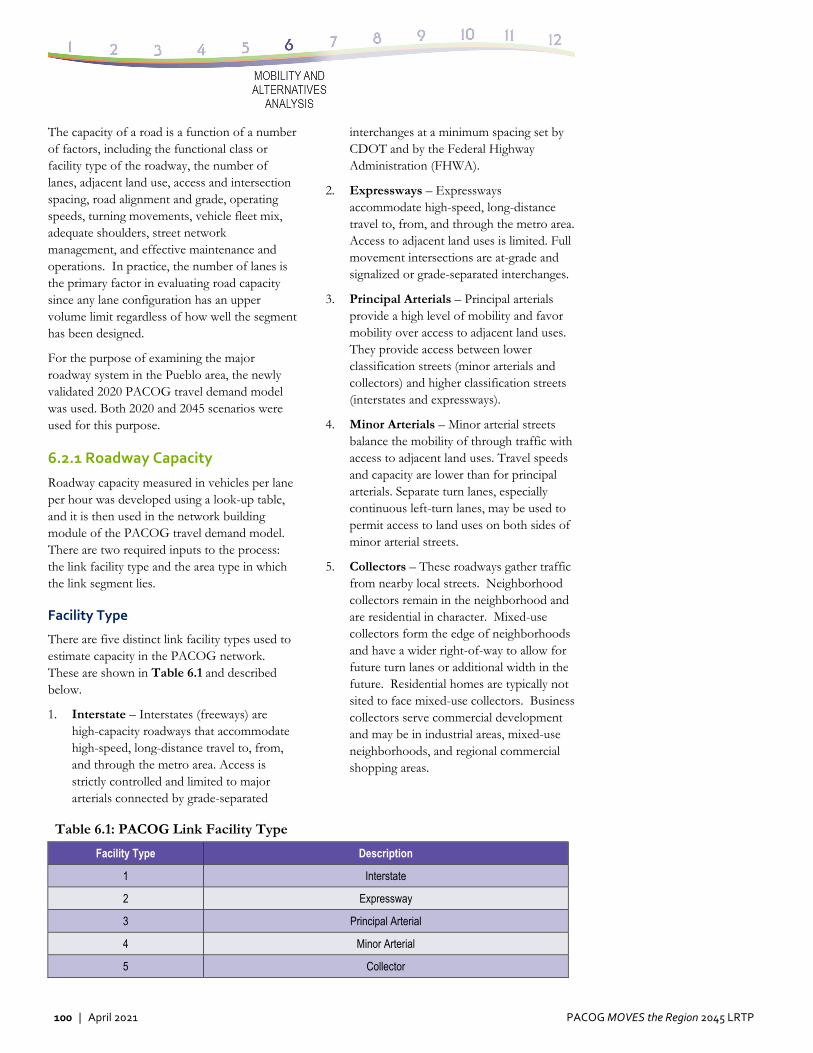
100 | April 2021 PACOG MOVES the Region 2045 LRTP
The capacity of a road is a function of a number of factors, including the functional class or facility type of the roadway, the number of lanes, adjacent land use, access and intersection spacing, road alignment and grade, operating speeds, turning movements, vehicle fleet mix, adequate shoulders, street network management, and effective maintenance and operations. In practice, the number of lanes is the primary factor in evaluating road capacity since any lane configuration has an upper volume limit regardless of how well the segment has been designed.
For the purpose of examining the major roadway system in the Pueblo area, the newly validated 2020 PACOG travel demand model was used. Both 2020 and 2045 scenarios were used for this purpose.
6.2.1 Roadway Capacity
Roadway capacity measured in vehicles per lane per hour was developed using a look-up table, and it is then used in the network building module of the PACOG travel demand model. There are two required inputs to the process: the link facility type and the area type in which the link segment lies.
Facility Type
There are five distinct link facility types used to estimate capacity in the PACOG network. These are shown in Table 6.1 and described below.
1. Interstate – Interstates (freeways) are high-capacity roadways that accommodate high-speed, long-distance travel to, from, and through the metro area. Access is strictly controlled and limited to major arterials connected by grade-separated
interchanges at a minimum spacing set by CDOT and by the Federal Highway Administration (FHWA).
2. Expressways – Expressways accommodate high-speed, long-distance travel to, from, and through the metro area. Access to adjacent land uses is limited. Full movement intersections are at-grade and signalized or grade-separated interchanges.
3. Principal Arterials – Principal arterials provide a high level of mobility and favor mobility over access to adjacent land uses. They provide access between lower classification streets (minor arterials and collectors) and higher classification streets (interstates and expressways).
4. Minor Arterials – Minor arterial streets balance the mobility of through traffic with access to adjacent land uses. Travel speeds and capacity are lower than for principal arterials. Separate turn lanes, especially continuous left-turn lanes, may be used to permit access to land uses on both sides of minor arterial streets.
5. Collectors – These roadways gather traffic from nearby local streets. Neighborhood collectors remain in the neighborhood and are residential in character. Mixed-use collectors form the edge of neighborhoods and have a wider right-of-way to allow for future turn lanes or additional width in the future. Residential homes are typically not sited to face mixed-use collectors. Business collectors serve commercial development and may be in industrial areas, mixed-use neighborhoods, and regional commercial shopping areas.
Table 6.1: PACOG Link Facility Type
Facility Type Description
1 Interstate
2 Expressway
3 Principal Arterial
4 Minor Arterial
5 Collector
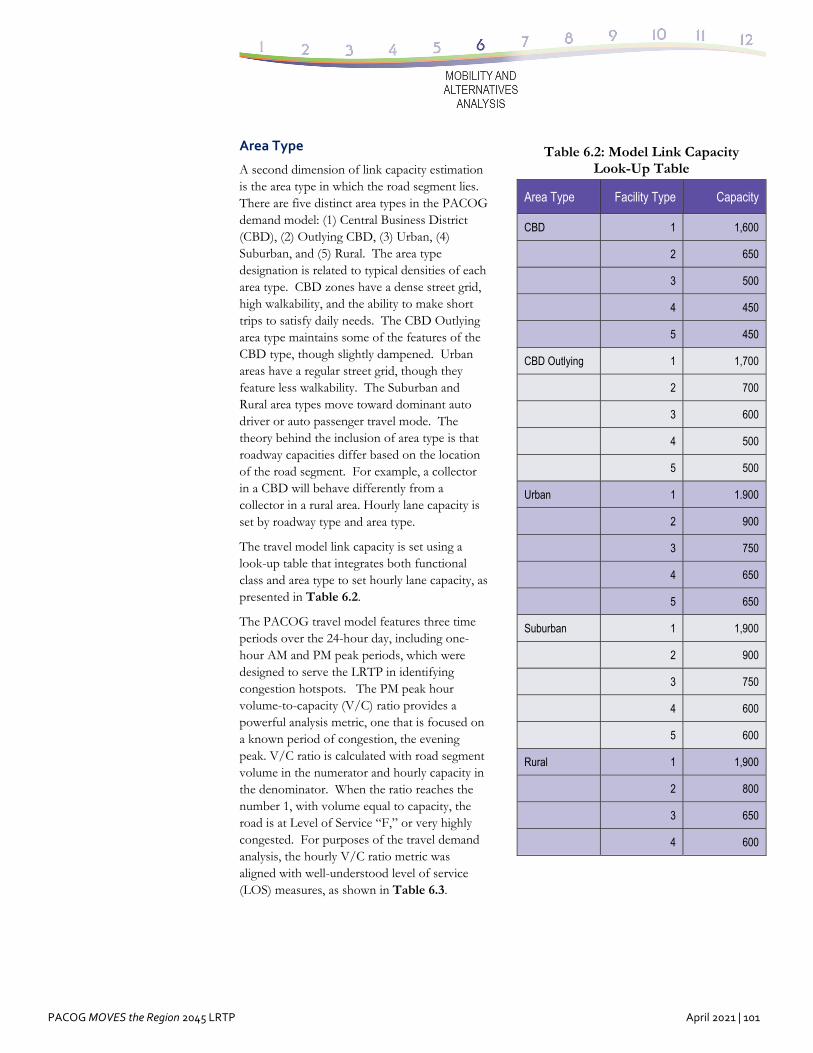
PACOG MOVES the Region 2045 LRTP April 2021 | 101
Area Type
A second dimension of link capacity estimation is the area type in which the road segment lies. There are five distinct area types in the PACOG demand model: (1) Central Business District (CBD), (2) Outlying CBD, (3) Urban, (4) Suburban, and (5) Rural. The area type designation is related to typical densities of each area type. CBD zones have a dense street grid, high walkability, and the ability to make short trips to satisfy daily needs. The CBD Outlying area type maintains some of the features of the CBD type, though slightly dampened. Urban areas have a regular street grid, though they feature less walkability. The Suburban and Rural area types move toward dominant auto driver or auto passenger travel mode. The theory behind the inclusion of area type is that roadway capacities differ based on the location of the road segment. For example, a collector in a CBD will behave differently from a collector in a rural area. Hourly lane capacity is set by roadway type and area type.
The travel model link capacity is set using a look-up table that integrates both functional class and area type to set hourly lane capacity, as presented in Table 6.2.
The PACOG travel model features three time periods over the 24-hour day, including one-hour AM and PM peak periods, which were designed to serve the LRTP in identifying congestion hotspots. The PM peak hour volume-to-capacity (V/C) ratio provides a powerful analysis metric, one that is focused on a known period of congestion, the evening peak. V/C ratio is calculated with road segment volume in the numerator and hourly capacity in the denominator. When the ratio reaches the number 1, with volume equal to capacity, the road is at Level of Service “F,” or very highly congested. For purposes of the travel demand analysis, the hourly V/C ratio metric was aligned with well-understood level of service (LOS) measures, as shown in Table 6.3.
Table 6.2: Model Link Capacity Look-Up Table
Area Type Facility Type Capacity
CBD 1 1,600
2 650
3 500
4 450
5 450
CBD Outlying 1 1,700
2 700
3 600
4 500
5 500
Urban 1 1.900
2 900
3 750
4 650
5 650
Suburban 1 1,900
2 900
3 750
4 600
5 600
Rural 1 1,900
2 800
3 650
4 600
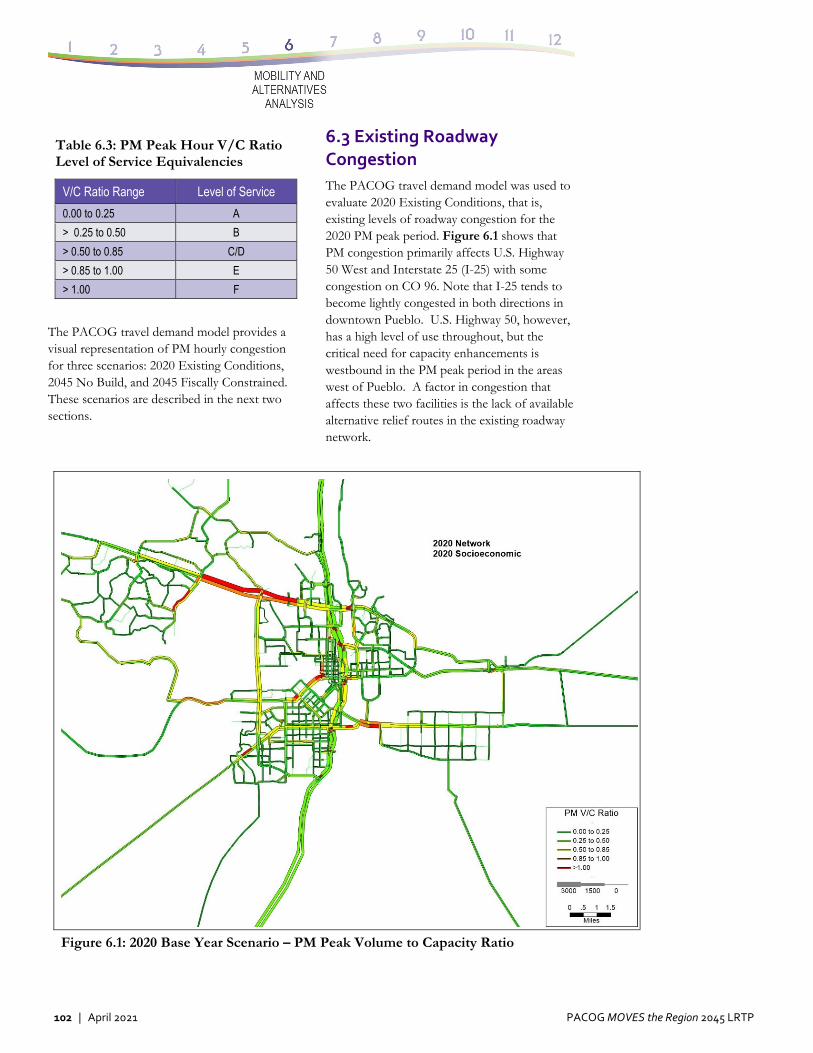
102 | April 2021 PACOG MOVES the Region 2045 LRTP
Table 6.3: PM Peak Hour V/C Ratio Level of Service Equivalencies
V/C Ratio Range Level of Service
0.00 to 0.25 A
> 0.25 to 0.50 B
> 0.50 to 0.85 C/D
> 0.85 to 1.00 E
> 1.00 F
The PACOG travel demand model provides a visual representation of PM hourly congestion for three scenarios: 2020 Existing Conditions, 2045 No Build, and 2045 Fiscally Constrained. These scenarios are described in the next two sections.
6.3 Existing Roadway Congestion
The PACOG travel demand model was used to evaluate 2020 Existing Conditions, that is, existing levels of roadway congestion for the 2020 PM peak period. Figure 6.1 shows that PM congestion primarily affects U.S. Highway 50 West and Interstate 25 (I-25) with some congestion on CO 96. Note that I-25 tends to become lightly congested in both directions in downtown Pueblo. U.S. Highway 50, however, has a high level of use throughout, but the critical need for capacity enhancements is westbound in the PM peak period in the areas west of Pueblo. A factor in congestion that affects these two facilities is the lack of available alternative relief routes in the existing roadway network.
Figure 6.1: 2020 Base Year Scenario – PM Peak Volume to Capacity Ratio
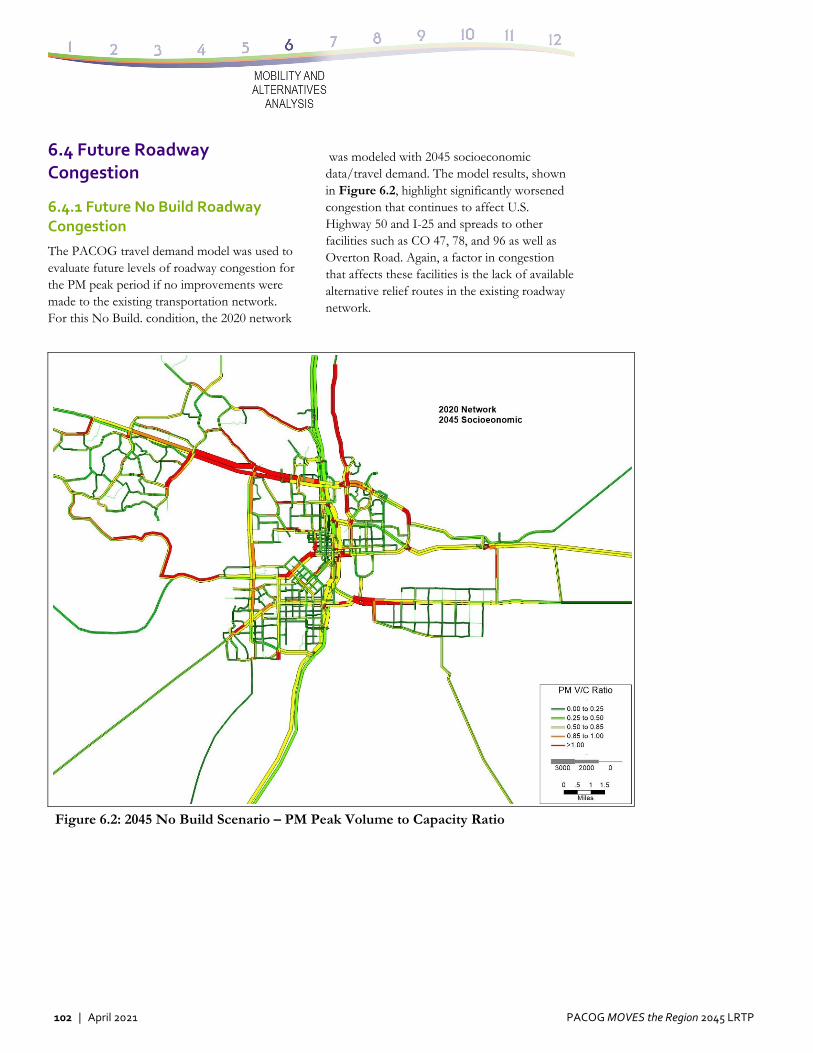
102 | April 2021 PACOG MOVES the Region 2045 LRTP
6.4 Future Roadway Congestion
6.4.1 Future No Build Roadway Congestion
The PACOG travel demand model was used to evaluate future levels of roadway congestion for the PM peak period if no improvements were made to the existing transportation network. For this No Build. condition, the 2020 network
was modeled with 2045 socioeconomic data/travel demand. The model results, shown in Figure 6.2, highlight significantly worsened congestion that continues to affect U.S. Highway 50 and I-25 and spreads to other facilities such as CO 47, 78, and 96 as well as Overton Road. Again, a factor in congestion that affects these facilities is the lack of available alternative relief routes in the existing roadway network.
Figure 6.2: 2045 No Build Scenario – PM Peak Volume to Capacity Ratio
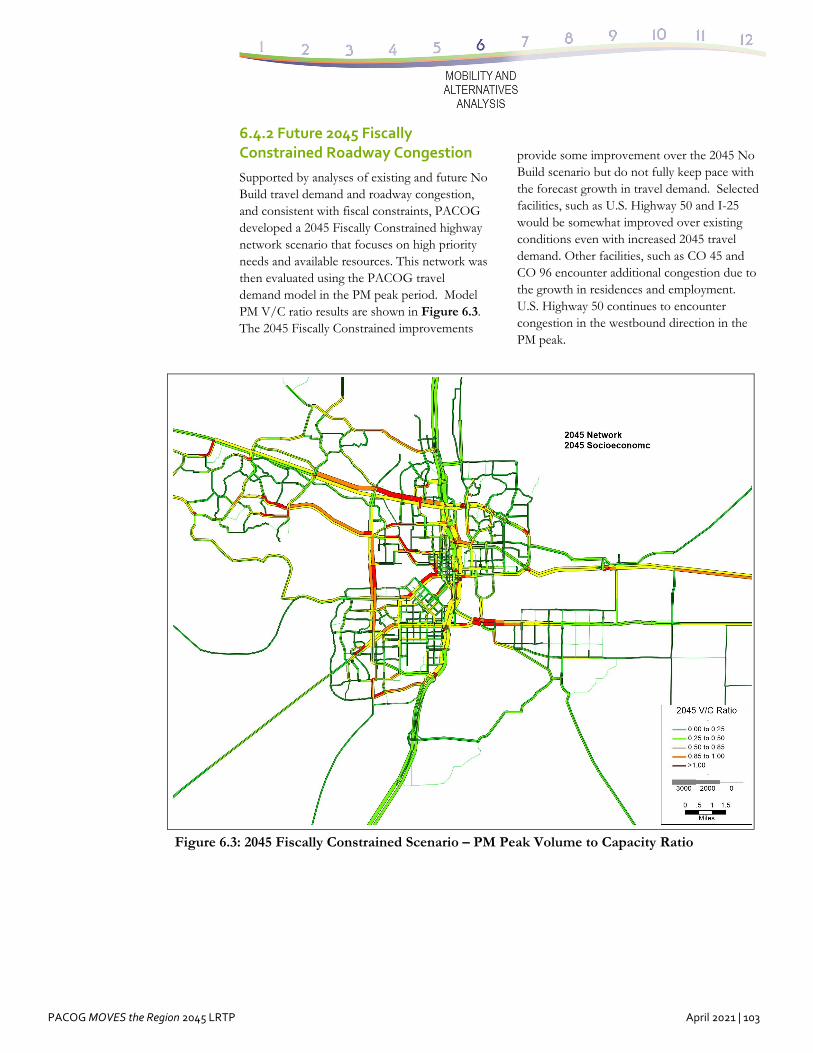
PACOG MOVES the Region 2045 LRTP April 2021 | 103
6.4.2 Future 2045 Fiscally Constrained Roadway Congestion
Supported by analyses of existing and future No Build travel demand and roadway congestion, and consistent with fiscal constraints, PACOG developed a 2045 Fiscally Constrained highway network scenario that focuses on high priority needs and available resources. This network was then evaluated using the PACOG travel demand model in the PM peak period. Model PM V/C ratio results are shown in Figure 6.3. The 2045 Fiscally Constrained improvements
provide some improvement over the 2045 No Build scenario but do not fully keep pace with the forecast growth in travel demand. Selected facilities, such as U.S. Highway 50 and I-25 would be somewhat improved over existing conditions even with increased 2045 travel demand. Other facilities, such as CO 45 and CO 96 encounter additional congestion due to the growth in residences and employment. U.S. Highway 50 continues to encounter congestion in the westbound direction in the PM peak.
Figure 6.3: 2045 Fiscally Constrained Scenario – PM Peak Volume to Capacity Ratio
104 | April 2021 PACOG MOVES the Region 2045 LRTP
6.4.3. Future Congestion Summary of Findings
The three PACOG travel demand model scenarios—2020 Existing Conditions, 2045 No Build, and 2045 Fiscally Constrained—behave in a consistent manner with respect to the socioeconomic inputs and the chosen networks. The existing 2020 scenario shows congestion in the locations and direction observed by local planners, engineers, and citizens. The two projected 2045 scenarios extend this logic by first showing a progression of congestion in the future if no action is taken (No Build) and then showing the impact of fiscally constrained highway build solutions. The following was noted:
In the 2020 PM peak, there is congestion on U.S. Highway 50 West in both eastbound and westbound directions. This pattern remains in place, at differing levels, in the 2045 No Build and the 2045 Fiscally Constrained scenarios. The U.S. Highway 50 West corridor is a key connector and warrants investment in capacity.
Congestion on I-25 in the PM peak is similar between the three scenarios; PM
traffic congestion is medium (V/C between .50 and .85) and bidirectional.
The interchanges that serve Pete Jimenez Parkway at both ends suffer some congestion in all scenarios.
While visual analysis is valuable, it is best supported by a metric that tabulates both congested and uncongested vehicle miles over the PACOG region. One useful metric is the PM vehicle miles traveled (VMT); this period is selected because it features the highest level of congested miles and thus operates as a “stress test.” Both VMT and congested VMT are tabulated from the PM traffic assignment. Congested VMT is defined as all road segments operating at V/C greater than .85 in the PM peak.
Summaries are shown in Table 6.4. In 2020, there are 332,784 VMT in the PM peak with 7.8% of these miles congested. In 2045, the No Build total is 515,240 VMT with 10.2% congested, signaling that the network is less able to handle the demand. With the improvements in the 2045 Fiscally Constrained scenario, the percent congested PM VMT drops to 8.2%, with more than 10,000 fewer congested miles when compared to the No Build scenario.
Table 6.4: Comparison of 2020, 2045 No Build, and 2045 Fiscally Constrained Congested VMT
Type of VMT 2020 Network
2045 No Build (2020 Network with 2045 SE)
2045 Fiscally Constrained LRTP Network
PM VMT % of Total PM VMT % of Total PM VMT % of Total
Congested VMT 26,088 7.8% 52,455 10.2% 42,030 8.2%
Uncongested VMT 306,696 92.2% 462,785 89.8% 468,549 91.8%
Total 332,784 100.0% 515,240 100.0% 510,578 100.0%
Centerline Miles 659 659 964
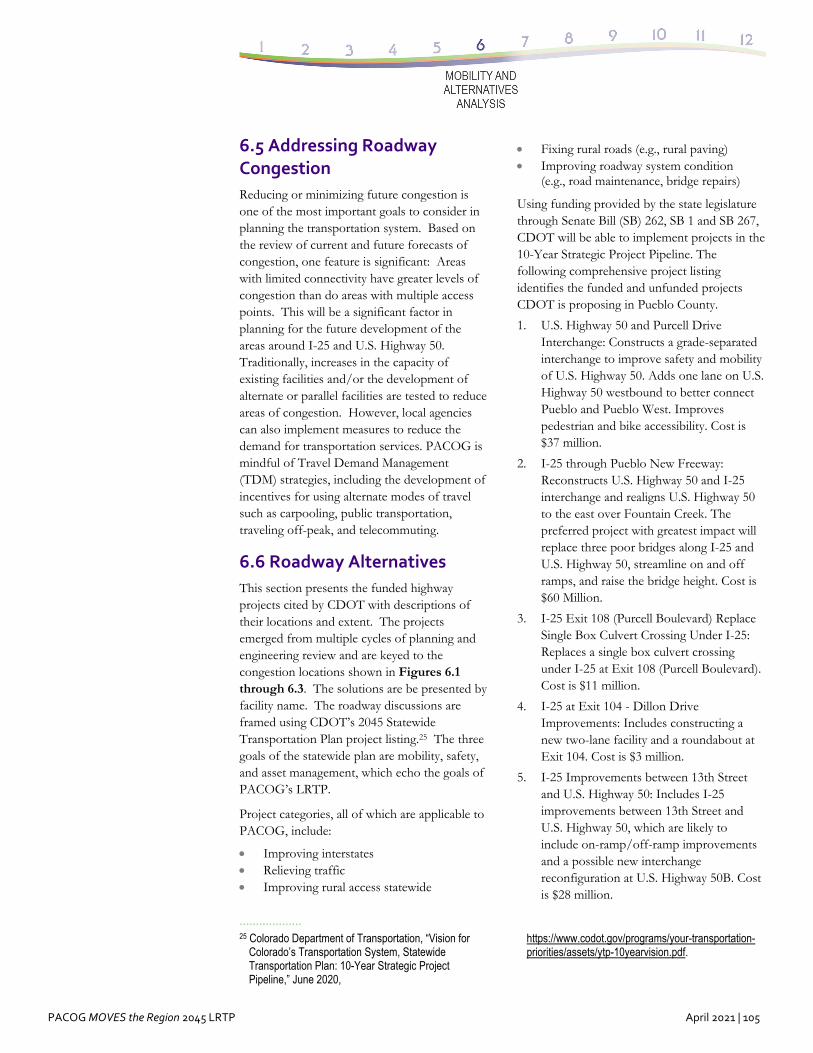
PACOG MOVES the Region 2045 LRTP April 2021 | 105
6.5 Addressing Roadway Congestion
Reducing or minimizing future congestion is one of the most important goals to consider in planning the transportation system. Based on the review of current and future forecasts of congestion, one feature is significant: Areas with limited connectivity have greater levels of congestion than do areas with multiple access points. This will be a significant factor in planning for the future development of the areas around I-25 and U.S. Highway 50. Traditionally, increases in the capacity of existing facilities and/or the development of alternate or parallel facilities are tested to reduce areas of congestion. However, local agencies can also implement measures to reduce the demand for transportation services. PACOG is mindful of Travel Demand Management (TDM) strategies, including the development of incentives for using alternate modes of travel such as carpooling, public transportation, traveling off-peak, and telecommuting.
6.6 Roadway Alternatives
This section presents the funded highway projects cited by CDOT with descriptions of their locations and extent. The projects emerged from multiple cycles of planning and engineering review and are keyed to the congestion locations shown in Figures 6.1 through 6.3. The solutions are be presented by facility name. The roadway discussions are framed using CDOT’s 2045 Statewide Transportation Plan project listing.25 The three goals of the statewide plan are mobility, safety, and asset management, which echo the goals of PACOG’s LRTP.
Project categories, all of which are applicable to PACOG, include:
Improving interstates Relieving traffic Improving rural access statewide
··················· 25 Colorado Department of Transportation, “Vision for
Colorado’s Transportation System, Statewide Transportation Plan: 10-Year Strategic Project Pipeline,” June 2020,
Fixing rural roads (e.g., rural paving) Improving roadway system condition
(e.g., road maintenance, bridge repairs)
Using funding provided by the state legislature through Senate Bill (SB) 262, SB 1 and SB 267, CDOT will be able to implement projects in the 10-Year Strategic Project Pipeline. The following comprehensive project listing identifies the funded and unfunded projects CDOT is proposing in Pueblo County.
1. U.S. Highway 50 and Purcell Drive Interchange: Constructs a grade-separated interchange to improve safety and mobility of U.S. Highway 50. Adds one lane on U.S. Highway 50 westbound to better connect Pueblo and Pueblo West. Improves pedestrian and bike accessibility. Cost is $37 million.
2. I-25 through Pueblo New Freeway: Reconstructs U.S. Highway 50 and I-25 interchange and realigns U.S. Highway 50 to the east over Fountain Creek. The preferred project with greatest impact will replace three poor bridges along I-25 and U.S. Highway 50, streamline on and off ramps, and raise the bridge height. Cost is $60 Million.
3. I-25 Exit 108 (Purcell Boulevard) Replace Single Box Culvert Crossing Under I-25: Replaces a single box culvert crossing under I-25 at Exit 108 (Purcell Boulevard). Cost is $11 million.
4. I-25 at Exit 104 - Dillon Drive Improvements: Includes constructing a new two-lane facility and a roundabout at Exit 104. Cost is $3 million.
5. I-25 Improvements between 13th Street and U.S. Highway 50: Includes I-25 improvements between 13th Street and U.S. Highway 50, which are likely to include on-ramp/off-ramp improvements and a possible new interchange reconfiguration at U.S. Highway 50B. Cost is $28 million.
https://www.codot.gov/programs/your-transportation-priorities/assets/ytp-10yearvision.pdf.
106 | April 2021 PACOG MOVES the Region 2045 LRTP
6. SH 96 West of Pueblo: Includes shoulder widening, bridge rail replacement, bike lanes, and other safety improvements on SH 96 west of Pueblo. Cost is $11.5 million.
7. Business U.S. Highway 50 Drainage Improvements at 36th Lane: Includes U.S. Highway 50 drainage improvements at 36th Lane. Cost is $5.5 million.
8. SH 47 Four-Lane Extension to U.S. Highway 50: Widens SH 47 to four lanes to U.S. Highway 50. Cost is $8 million.
These projects address the known Pueblo traffic corridors that will grow in congestion between 2020 and 2045.
Interstate‐25
The purpose of investment in I-25 is to improve safety for north-south travel and to improve local and regional mobility within and through the Pueblo County to meet existing and future travel demands. Much of I-25 through Pueblo was built between 1949 and 1959 as U.S. 85/87 before the creation of the Interstate Highway System in 1956. As a result of its age and outdated design standards, this segment of I-25 has contained structural and operational deficiencies. These deficiencies are historically linked to high accident rates, areas of reduced speed, traffic congestion, and poor traffic operations. Many needed improvements have been completed on I-25 in the last 25 years.
Recent projects on I-25 include the I-25 Corridor Access and Hazmat Study from Ilex Street to 29th Street; I-25 Intelligent Transportation System (ITS), which installed traffic cameras from MP 109 to MP 114.8; I-25 North from 13th Street to the U.S. Highway 50B Interchange; and I-25 Eastside Frontage Road from the Dillon Interchange to the Eden Interchange.
Ten-year CIP projects on I-25 as of 2020 from the comprehensive CDOT list above that are CDOT funded are:
1. I-25 through Pueblo New Freeway U.S. Highway 50 to the east over Fountain Creek.
2. I-25 Exit 108 (Purcell Boulevard).
3. I-25 at Exit 104 - Dillon Drive Improvements.
4. I-25 Improvements between 13th Street and U.S. Highway 50.
U.S. Highway 50
U.S. Highway 50 is the only existing route between I-25 and the major business and population centers in areas west of I-25. Investment in U.S. Highway 50 would enhance travel times and connectivity east-west by eliminating congestion in the AM and PM peaks.
Previously funded projects on U.S. Highway 50 include:
1. Eastbound U.S. Highway 50A West) from Wills Boulevard to McCulloch Boulevard: Add the third lane and trail facilities and improve pedestrian crossings at signalized intersections.
2. Westbound .S. Highway 50A West from Wills Boulevard to McCulloch Boulevard: Complete the EA from Wills Boulevard to McCulloch Boulevard, add the third lane from Wills Boulevard to the hill just west of Pueblo Boulevard, realign to be parallel to the eastbound alignment, construct a new bridge, rebuild the signal at U.S. Highway 50/Pueblo Boulevard to accommodate the new WB alignment and traffic flow, and improve pedestrian crossings at signalized intersections.
3. Several projects to enhance traffic flow include:
a. U.S. Highway 50C from 4th Street to Baxter Road from Aspen Road to 21st Lane (MP 0.0 to 7.4): overlay and drainage work.
b. U.S. Highway 50 from Bonforte Boulevard to Hudson Avenue: intersection upgrades.
c. U.S. Highway 50B (MP 332.1 and 333.9): Construct continuous left lane where U.S. Highway 50C and U.S. Highway 50B meet.
d. U.S. Highway 50 Access Management Plan from Interstate 25 to Fortino Boulevard.
PACOG MOVES the Region 2045 LRTP April 2021 | 107
Ten-year CIP projects on U.S. Highway 50 as of 2020 from the comprehensive CDOT list above that are CDOT funded are:
1. U.S. Highway 50 and Purcell Drive Interchange.
2. Business U.S. Highway 50 Drainage Improvements at 36th Lane.
State Highway 96
Traffic along SH 96 is expected to increase as population centers continue to grow west of SH 45 and south of the Arkansas River. This vital link to/from downtown Pueblo will require both safety and capacity improvements.
Previously funded projects on SH 96 include:
1. SH 96A at Abriendo Avenue: Intersection improvements (signal update, ADA ramps, and pedestrian crossing improvements).
2. SH 96A at Chester Avenue: Adds a left-turn lane and replace the signal.
3. SH 96 at Acero Avenue and at Bradford Avenue: Improvements.
4. SH 96A West of Pueblo: Widens shoulder, replaces bridge rail, and includes bike lane and other safety improvements.
A 10-year CIP project on SH 96 as of 2020 from the comprehensive CDOT list above that is CDOT funded is:
1. SH 96 West of Pueblo: This project will include shoulder widening, bridge rail replacement, bike lanes, and other safety improvements on SH 96 west of Pueblo.
State Highway 47
Traffic along SH47 is expected to increase as population centers continue to grow east and north of SH 47 and east of Fountain Creek. Colorado State University at Pueblo also lies adjacent to this facility. This vital link connects Pueblo West via U.S. Highway 50 to the Airport Industrial Park (AIP) via Pete Jimenez Parkway. If large-scale development is built in the northeast quadrant of Pueblo County, major freeway/expressway corridors, as well as supporting arterials and collectors, will be required to accommodate future traffic growth.
A previously CDOT funded project on SH 47 is:
1. SH 47 Junction at I-25/ U.S. Highway 50 to East of Troy (MP 0.035 to 0.29)
A 10-year CIP project as of 2020 from the comprehensive CDOT list above that is CDOT funded is:
1. SH 47 Four-Lane Extension to U.S. Highway 50
Additional Highway projects on a range of Pueblo area roads include work on SH 96 and SH 45.
Summary of Roadway Alternatives
Addressing existing and future congestion in the Pueblo Area has required a careful assessment of facility needs with available revenue, driven by the local planning and engineering knowledge gathered over decades in the region. Congestion on I-25 and U.S. Highway 50, both on the ground and as mirrored in the PACOG 2020 and 2045 travel demand model scenario results, has driven the projects screened and selected for this LRTP.
108 | December 2020 PACOG MOVES the Region 2045 LRTP
PACOG MOVES the Region 2045 LRTP April 2021 | 109
7.0 Planning for Emerging Technologies
7.1 Introduction Throughout history, humans have innovated and developed new means of improving the way they move people and goods throughout their societies. One of the first major technological innovations that dramatically changed the world was the creation of the wheel. This primitive invention was a major technological improvement that completely changed the world. Many millennia later, it was the advent of the automobile that once again dramatically changed the way people and goods move. Today, we are once again experiencing a technological revolution.
A number of emerging technologies are changing the way that vehicles operate and how they interact with the public. This chapter discusses these emerging technologies and how their implementation will affect our transportation system. Although there are many emerging technologies, this chapter specifically discusses connected and autonomous vehicles (CAVs), transportation network companies (TNCs), and electric vehicles (EVs) in the context of the Pueblo Area Council of Governments (PACOG) Long Range Transportation Plan (LRTP).
Connected and Autonomous Vehicle – A connected vehicle can be defined as one communicating with other vehicles and with the world around them. An autonomous vehicle can be defined as one that propels itself without need of a human operator.
Transportation Network Company – A transportation network company (TNC) refers to a rideshare business, such as Uber and Lyft. A ridesharing company matches passengers with vehicles via websites and mobile apps.
Electric Vehicle – An electric vehicle (EV) is an automobile or truck that is propelled
··················· 26 Mining Technology Magazine, “Haulage Goes
Autonomous,” July 27, 2011, https://www.mining-technology.com/features/feature125450/.
by one or more electric motors, using energy stored in rechargeable batteries.
The emerging technologies mentioned above are already in our communities. Although the pros and cons of these technologies can be debated at length, these technologies are here and are projected to increase, therefore it is vital that PACOG plan for them. Proper planning will ensure that the Pueblo Area reaps the full benefit of these technologies while mitigating the negative consequences that accompany them.
7.2 Connected & Autonomous Vehicles
CAVs will dramatically change the way people and goods are moved throughout U.S. communities. Though seemingly a new concept, they have been in production and even implemented in certain industries for decades. In the 1980s, Caterpillar Inc. began researching CAV technologies to cut costs, increase efficiency, and enhance safety in mining operations. By the mid-1990s, the CAV mining technology had been implemented.26 Although outfitting CAV technology in a controlled environment, such as a mine, was not an easy task, it was easier than implementing the same technology in the uncontrolled environment of public roads. Additionally, this technology was extremely expensive, making it impractical for the general public. However, in the decades that followed, technological advancements allowed for CAV technology to be integrated cost effectively into vehicles. Many CAV technologies, such as cruise control, blind spot detection, forward collision warning, lane departure warning, automatic emergency braking, adaptive cruise control, and self-parking features, are already in vehicles on the road today.
At the federal level, since the 1990s the United States Department of Transportation (USDOT) has been looking at ways CAV technology will affect the nation’s transportation network. Although there haven’t been any federal laws or regulations passed pertaining to CAV, USDOT
110 | April 2021 PACOG MOVES the Region 2045 LRTP
has issued several voluntary guidance documents to support the autonomous vehicle industry, states, and other stakeholders as they move forward in the testing and deployment of CAVs. Additionally, the State of Colorado has passed a law that sets common definitions and lays the groundwork to support the advancement and deployment of CAVs in Colorado.
When fully implemented, CAV technologies will fundamentally alter the way individuals interact with vehicles. CAV technology will increase safety on roadways, reducing the number of fatalities due to vehicle crashes. Chapter 5 of this plan documents that there were more than 600 fatalities on Colorado roadways in 2018, 36 of which were in Pueblo County; autonomous vehicles will have the potential to reduce vehicle crashes and fatalities. A negative consequence associated with CAV technology, however, is the loss of jobs that rely on human operators. This and other consequences, both positive and negative, will require government at all levels to plan for CAV technologies and put in place policies promoting the positive benefits while mitigating the negative consequences.
7.2.2 Connected & Autonomous Vehicles Defined
Connected vehicles and autonomous vehicles are often seen as synonymous. Though there are similarities between the two, there are also differences. The greatest difference is that a connected vehicle requires a human driver to operate it, whereas an autonomous vehicle does not. Additionally, the components that make a connected vehicle connected also are necessarily present in autonomous vehicles; however, the advanced components that make an autonomous vehicle self-driving are not necessarily present in connected vehicles. It is important to note that connected vehicles are available today for public purchase, whereas autonomous vehicles are still in the testing phase, as the industry continues to conduct research, development, and testing.
Connected vehicles, as previously mentioned, are already on the road today. What differentiates these vehicles from non-connected vehicles is that they utilize
technology to communicate with other devices to share important transportation information. Connected vehicles can communicate with other vehicles, roadways, other infrastructure, and mobile devices. The vehicles and other devices utilize dedicated short-range communication (DSRC) to transmit data. The data transmitted to the vehicle provides information to the human operator on upcoming roadway conditions, vehicle hazards, alternative routes, and travel times. Additionally, connected vehicles also may utilize cellular technology such as 5G to communicate roadway conditions to cloud-based platforms. The information allows the driver to make better-informed decisions while operating the vehicle. If the connected vehicle is equipped with advanced driver assistance technology (as defined in Table 7.1), then the vehicle, in the place of the driver, can take emergency action.
Autonomous Vehicles
Autonomous vehicles are vehicles that can operate on the roadway without the need for a human operator to intervene in the driving task. The vehicles utilize many of the components that connected vehicles use; however, they also utilize other technologies to perform the dynamic driving task. Autonomous vehicles utilize technologies such as radar, Global Positioning System (GPS), cameras, and light detection and ranging devices; data from these components is fed into a centralized computer, which processes the data and performs the driving task. Autonomous vehicles are still in development today; many automotive, technology, and data companies are investing billions of dollars into their research and development. Companies in the United States and around the world have logged millions of miles on autonomous test vehicles on public roads to refine the technology and ensure safety. Although these vehicles are not available for purchase today, the automotive and technology industries estimate that in the near future, perhaps as early as 2030, they will become available.
Terminology – It is important to note that the term “connected and autonomous vehicle (CAV)” is used to refer to autonomous vehicles in the remainder of this document because autonomous vehicles utilize both autonomous and connected technologies.
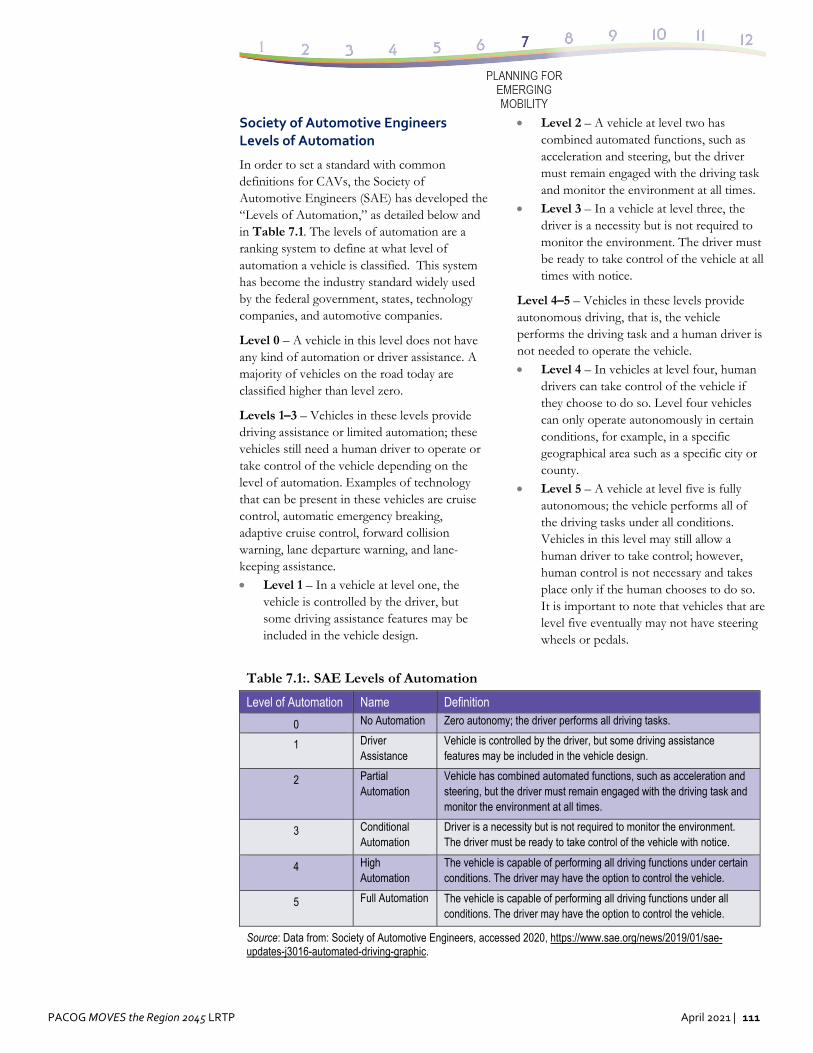
PACOG MOVES the Region 2045 LRTP April 2021 | 111
Society of Automotive Engineers Levels of Automation
In order to set a standard with common definitions for CAVs, the Society of Automotive Engineers (SAE) has developed the “Levels of Automation,” as detailed below and in Table 7.1. The levels of automation are a ranking system to define at what level of automation a vehicle is classified. This system has become the industry standard widely used by the federal government, states, technology companies, and automotive companies.
Level 0 – A vehicle in this level does not have any kind of automation or driver assistance. A majority of vehicles on the road today are classified higher than level zero.
Levels 1–3 – Vehicles in these levels provide driving assistance or limited automation; these vehicles still need a human driver to operate or take control of the vehicle depending on the level of automation. Examples of technology that can be present in these vehicles are cruise control, automatic emergency breaking, adaptive cruise control, forward collision warning, lane departure warning, and lane-keeping assistance. Level 1 – In a vehicle at level one, the
vehicle is controlled by the driver, but some driving assistance features may be included in the vehicle design.
Level 2 – A vehicle at level two has combined automated functions, such as acceleration and steering, but the driver must remain engaged with the driving task and monitor the environment at all times.
Level 3 – In a vehicle at level three, the driver is a necessity but is not required to monitor the environment. The driver must be ready to take control of the vehicle at all times with notice.
Level 4–5 – Vehicles in these levels provide autonomous driving, that is, the vehicle performs the driving task and a human driver is not needed to operate the vehicle. Level 4 – In vehicles at level four, human
drivers can take control of the vehicle if they choose to do so. Level four vehicles can only operate autonomously in certain conditions, for example, in a specific geographical area such as a specific city or county.
Level 5 – A vehicle at level five is fully autonomous; the vehicle performs all of the driving tasks under all conditions. Vehicles in this level may still allow a human driver to take control; however, human control is not necessary and takes place only if the human chooses to do so. It is important to note that vehicles that are level five eventually may not have steering wheels or pedals.
Table 7.1:. SAE Levels of Automation
Level of Automation Name Definition
0 No Automation Zero autonomy; the driver performs all driving tasks.
1 Driver Assistance
Vehicle is controlled by the driver, but some driving assistance features may be included in the vehicle design.
2 Partial Automation
Vehicle has combined automated functions, such as acceleration and steering, but the driver must remain engaged with the driving task and monitor the environment at all times.
3 Conditional Automation
Driver is a necessity but is not required to monitor the environment. The driver must be ready to take control of the vehicle with notice.
4 High Automation
The vehicle is capable of performing all driving functions under certain conditions. The driver may have the option to control the vehicle.
5 Full Automation The vehicle is capable of performing all driving functions under all conditions. The driver may have the option to control the vehicle.
Source: Data from: Society of Automotive Engineers, accessed 2020, https://www.sae.org/news/2019/01/sae-updates-j3016-automated-driving-graphic.
112 | April 2021 PACOG MOVES the Region 2045 LRTP
7.3 Federal & State Roles
When fully implemented, CAVs will change transportation fundamentally; however, as with all new technologies, there will be unforeseen consequences. Both federal and state governments have recognized that regulations will be required to safely implement CAVs. They also recognize that regulations may stifle innovation, especially at a time when the technology is still evolving.
One example is the CAV classification as a “vehicle”; even as an emerging technology, CAVs are still considered vehicles. Both the federal and state governments will regulate them as standard vehicles. The first federal CAV guidance document, discussed in detail in Section 7.3.1, highlights each government’s role in regulation.
Federal Role
The federal role is to: Set federal motor vehicle safety standards
(FMVSS) for new motor vehicles and motor vehicle equipment (to which manufacturers must certify compliance before they sell their vehicles).
Enforce compliance with the FMVSS.
Investigate and manage the recall and remedy of noncompliance and safety-related motor vehicle defects and recalls on a nationwide basis.
Communicate with and educate the public about motor vehicle safety issues.
Issue guidance for vehicle and equipment manufacturers to follow, such as vehicle performance guidance for CAVs.
State Role
The state role is to: License (human) drivers and register motor
vehicles in their jurisdictions.
Enact and enforce traffic laws and regulations.
··················· 27 USDOT, NHTSA, Federal Automated Vehicles Policy:
Accelerating the Next Revolution in Roadway Safety, September 2016, https://www.transportation.gov/sites/dot.gov/files/docs/AV%20policy%20guidance%20PDF.pdf.
Conduct safety inspections, where states
choose to do so.
Regulate motor vehicle insurance and liability.27
7.3.1 Federal Action
The federal government has been involved with CAVs for many years, working with industry, academia, state/local governments, and transportation stakeholders to support the safe development, testing, and integration of automated vehicle technologies. Although Congress has not enacted any laws regulating CAVs, USDOT has been actively involved in guiding the conversation. Since 2016, USDOT has published a series of voluntary guidance documents, which provide stakeholders direction and have been released by the National Highway Transportation Safety Administration (NHTSA), an administration under USDOT.
Federal Automated Vehicle Policy: Accelerating the Next Revolution in Roadway Safety
The report titled Federal Automated Vehicles Policy: Accelerating the Next Revolution in Roadway Safety, issued in 2016, was USDOT’s first comprehensive policy document. 28 It set in motion a series of policy updates that are discussed in this chapter. The document’s goal was to accelerate the development of CAVs while ensuring that the technology is implemented in a manner that provides safety benefits from the time of its release and into the future.
28 USDOT, NHTSA, Federal Automated Vehicles Policy: Accelerating the Next Revolution in Roadway Safety, September 2016, https://www.transportation.gov/sites/dot.gov/files/docs/AV%20policy%20guidance%20PDF.pdf.
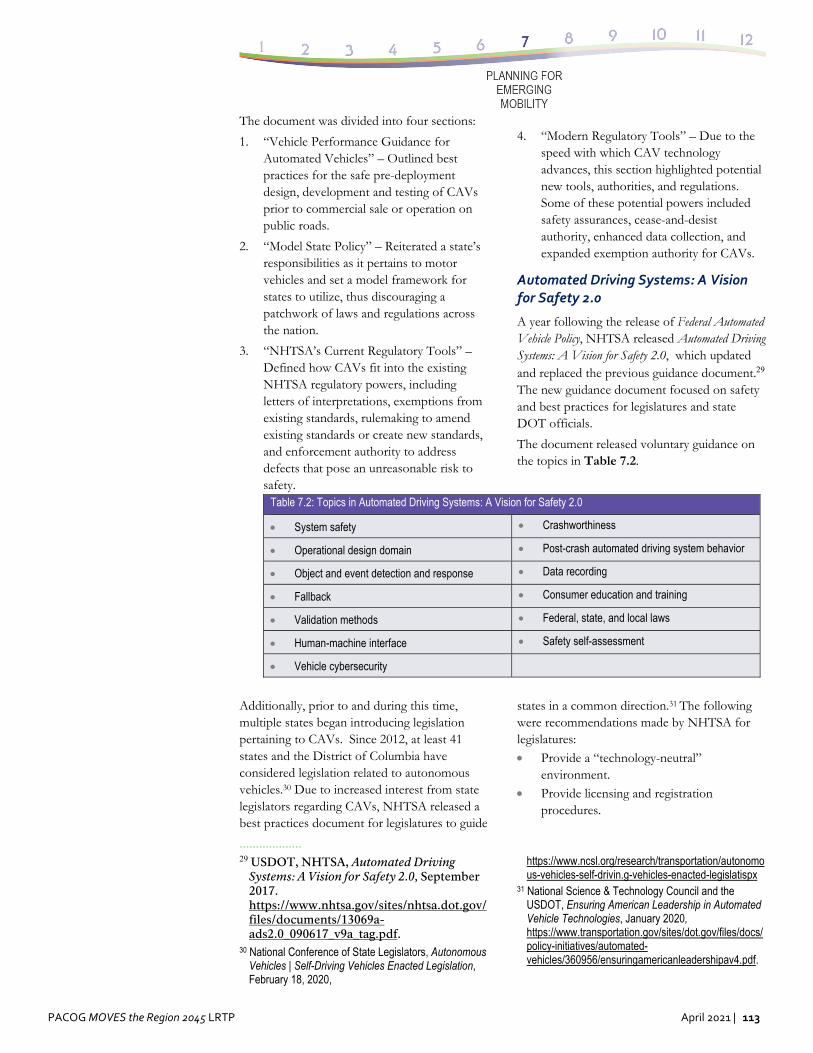
PACOG MOVES the Region 2045 LRTP April 2021 | 113
The document was divided into four sections:
1. “Vehicle Performance Guidance for Automated Vehicles” – Outlined best practices for the safe pre-deployment design, development and testing of CAVs prior to commercial sale or operation on public roads.
2. “Model State Policy” – Reiterated a state’s responsibilities as it pertains to motor vehicles and set a model framework for states to utilize, thus discouraging a patchwork of laws and regulations across the nation.
3. “NHTSA’s Current Regulatory Tools” – Defined how CAVs fit into the existing NHTSA regulatory powers, including letters of interpretations, exemptions from existing standards, rulemaking to amend existing standards or create new standards, and enforcement authority to address defects that pose an unreasonable risk to safety.
4. “Modern Regulatory Tools” – Due to the
speed with which CAV technology advances, this section highlighted potential new tools, authorities, and regulations. Some of these potential powers included safety assurances, cease-and-desist authority, enhanced data collection, and expanded exemption authority for CAVs.
Automated Driving Systems: A Vision for Safety 2.0
A year following the release of Federal Automated Vehicle Policy, NHTSA released Automated Driving Systems: A Vision for Safety 2.0, which updated and replaced the previous guidance document.29 The new guidance document focused on safety and best practices for legislatures and state DOT officials.
The document released voluntary guidance on the topics in Table 7.2.
Table 7.2: Topics in Automated Driving Systems: A Vision for Safety 2.0
System safety Crashworthiness
Operational design domain Post-crash automated driving system behavior
Object and event detection and response Data recording
Fallback Consumer education and training
Validation methods Federal, state, and local laws
Human-machine interface Safety self-assessment
Vehicle cybersecurity
Additionally, prior to and during this time, multiple states began introducing legislation pertaining to CAVs. Since 2012, at least 41 states and the District of Columbia have considered legislation related to autonomous vehicles.30 Due to increased interest from state legislators regarding CAVs, NHTSA released a best practices document for legislatures to guide
··················· 29 USDOT, NHTSA, Automated Driving
Systems: A Vision for Safety 2.0, September 2017. https://www.nhtsa.gov/sites/nhtsa.dot.gov/files/documents/13069a-ads2.0_090617_v9a_tag.pdf.
30 National Conference of State Legislators, Autonomous Vehicles | Self-Driving Vehicles Enacted Legislation, February 18, 2020,
states in a common direction.31 The following were recommendations made by NHTSA for legislatures:
Provide a “technology-neutral” environment.
Provide licensing and registration procedures.
https://www.ncsl.org/research/transportation/autonomous-vehicles-self-drivin.g-vehicles-enacted-legislatispx.
31 National Science & Technology Council and the USDOT, Ensuring American Leadership in Automated Vehicle Technologies, January 2020, https://www.transportation.gov/sites/dot.gov/files/docs/policy-initiatives/automated-vehicles/360956/ensuringamericanleadershipav4.pdf.
114 | April 2021 PACOG MOVES the Region 2045 LRTP
Provide reporting and communications methods for public safety officials.
Review traffic laws and regulations that may serve as barriers to operations of CAVs.
The last major portion of the guidance regarded best practices for state highway safety officials. It recognized that states generally have the responsibility to reduce traffic crashes within their jurisdictions. The document put forth best practices guidelines on the ways state officials should approach CAVs. The areas covered by these practices include: Administrative Application for entities to test CAVs on
public roadways Permissions for entities to test CAVs on
public roadways Specific considerations for CAV test
drivers and operators Considerations for registration and titling Working with public safety officials Liability and insurance
Preparing for the Future of Transportation: Automated Vehicles 3.0
In 2018, USDOT published Preparing for the Future of Transportation: Automated Vehicles 3.0.32 The document built upon but did not replace the previous Automated Driving Systems: A Vision for Safety 2.0 document. The updated document continued to expand guidance for CAVs and, for the first time, brought together many surface transportation operating administrations to publish a multimodal approach to CAVs. The policies put forth in the document were established based on following six new principles: 1. Prioritize safety 2. Remain technology neutral 3. Modernize regulations 4. Encourage a consistent regulatory and
operational environment 5. Prepare proactively for automation 6. Protect and enhance the freedoms enjoyed
by Americans
··················· 32 USDOT, NHTSA, Preparing for the Future of
Transportation: Automated Vehicles 3.0, September 2018, https://www.transportation.gov/sites/dot.gov/files/docs/
These principles guided USDOT in developing a multimodal approach to CAVs. Whereas previous guidance documents were developed with heavy input from NHTSA, USDOT approached Automated Vehicles 3.0 with input from many surface transportation administrations. This step was included to provide a comprehensive multimodal look at CAVs. The document included key policy issues for the following surface transportation authorities: National Highway Transportation Safety
Administration Federal Motor Carrier Safety
Administration Federal Highway Administration Federal Transit Administration
Ensuring American Leadership in Automated Vehicle Technologies: Automated Vehicles 4.0
In January 2020, USDOT in collaboration with the White House released Ensuring American Leadership in Automated Vehicle Technologies: Automated Vehicles 4.0. This document continues to build on the previous guidance documents. However, unlike previous reports, which were driven mainly by USDOT, this guidance document was created with the input from more than 38 federal departments, independent agencies, commissions, and entities within the Executive Office of the President. The document guidance puts forth polices and recommendations to set the United States as the leading nation in the world for CAV technology development and integration. The following three core areas of interest with supporting sub-areas are identified:
1. Protect Users and Communities
a. Prioritize safety
b. Emphasize security and cybersecurity
c. Ensure privacy and data security
d. Enhance mobility and accessibility
policy-initiatives/automated-vehicles/320711/preparing-future-transportation-automated-vehicle-30.pdf.
PACOG MOVES the Region 2045 LRTP April 2021 | 115
2. Promote Efficient Markets
a. Remain technology neutral
b. Protect American innovation and creativity
c. Modernize regulations
3. Facilitate Coordinated Efforts
a. Promote consistent standards and polices
b. Ensure a consistent federal approach c. Improve transportation system-level
approach33
7.3.2 State of Colorado Action
The State of Colorado has recognized that CAVs are an emerging technology that will change the way the citizens of the state interact with the state’s transportation system. For that reason, the State has taken measures to ensure that Colorado does not lag behind this rapid evolving technology. In the past four years, Colorado has passed laws regarding autonomous vehicles and has integrated CAV activities within CDOT. These actions aim to prepare Colorado for the time when CAVs are deployed on public roads.
Colorado CAV Law
In 2017, the Colorado Legislature passed Senate Bill 17-213 and then-Governor John Hickenlooper signed the bill into law. As Colorado’s first legislative action regarding CAVs, the law set in place a framework to support the CAV industry within the state. Included in the law are provisions that set definitions of CAVs as well as guidelines for CDOT and the Colorado State Patrol to follow for CAV deployment in the state. Major provisions of the law require or allow the following for CAVs: 1. Confirms that levels of automation 0–3, as
defined by SAE International, are legal under Colorado law with a human driver.
··················· 33 National Science and Technology Council and United
States Department of Transportation, Ensuring American Leadership in Automated Vehicle Technologies: Automated Vehicles 4.0, January 2020, https://www.transportation.gov/sites/dot.gov/files/2020-02/EnsuringAmericanLeadershipAVTech4.pdf.
2. Defines “Automated Driving System” (i.e., CAVs) as vehicles in levels 4–5 as defined by SAE International. These vehicles are authorized to operate within Colorado without a human driver, if they can meet all applicable state and federal laws.
3. Allows CAVs to operate in Colorado even if they do not meet all state and federal laws; however, approval of operation is required by CDOT and the Colorado State Patrol.
4. Prohibits any state agency or local jurisdiction to set policies or regulations for CAVs that are different from the standard set for human drivers. 34
CDOT’s Actions
CDOT developed the Connected and Autonomous Technology (CAT) Program to oversee CAV activities throughout the state. The purpose of the CAT program is “to accelerate the responsible use of connected and autonomous technologies in Colorado.” The program will assist in meeting CDOT’s overall CAV program mission to “improve the movement of goods and services throughout Colorado by leveraging the benefits of connected and autonomous mobility technologies while mitigating potential risks.” CDOT will meet this purpose and achieve the mission by following these objectives: 1. Integrate CAT into CDOT planning and
operations through consultation and education.
2. Provide strategy and direction for CAT planning, policy, and investment.
3. Facilitate development of statewide and inter-state CAT infrastructure network.
4. Partner with industry to accelerate CAT investment and deployment in Colorado.
5. Advocate for policy and regulation that aligns with program framework.
6. Build public support and enthusiasm for CAT technology through education and engagement.
34 “Programs: Autonomous Vehicles,” Colorado Department of Transportation, accessed July 27, 2020, https://www.codot.gov/programs/operations/intelligent-transportation-systems/innovation/autonomous-vehicles.

116 | April 2021 PACOG MOVES the Region 2045 LRTP
7. Partner with local, regional, and national stakeholders to align efforts.35
The CAT program is designed in a manner to assist in developing partnerships with local, regional, and national stakeholders so that Colorado can realize the benefits of CAVs as they are deployed in the state. The program will do so by acting on the listed objectives above; however, the state will also leverage the following existing transportation assets:
23,000 miles of highway across many unique environments including rural, suburban, urban, mountains, and plains.
1,400 miles of fiber optic cable throughout the state.
A large Internet of Roads (IoR) network, which provides connected vehicle infrastructure throughout Colorado. IoR is the country's first commercial-scale connected vehicle environment. It uses V2X (Vehicle to Everything) technology to communicate with connected vehicles to improve the safety and mobility of the transportation system. In Pueblo County, I-25 is slated to be a component of the IoR system.
Some detail on the IoR effort is of value in this LRTP report. According to a CDOT web announcement, “The IoR will bring nearly $44 million in public and private investment to Colorado to provide a 537-mile network in primarily rural environments that will provide real-time communication with connected vehicles. Supported by automotive and tech partners like Ford Motor Company, Qualcomm, and Panasonic that are already working with CDOT, the IoR will send safety and mobility-critical messages directly to drivers through infrastructure-to-vehicle (I2V) communication. It will also allow CDOT to 'listen' to the roadways through vehicle-to-infrastructure (V2I) communication, immediately notifying CDOT of crashes or hazards on the road to
··················· 35Colorado Department of Transportation, Division of
Mobility Operations, Connected and Autonomous Technology (CAT) Program, accessed July 27, 2020, https://transportationops.org/sites/transops/files/CDOT%20cat-program-framework_2018.pdf.
36 Connect2DOT, “CDOT ‘Internet of Roads’ Presents the Future of Colorado's Transportation System,”
expedite emergency services and hasten the clearance of a crash scene.”36
7.3.3 Consequences of CAVs
As is apparent from research, guidance, and laws that are being put forth at both the federal and state levels, CAVs will begin to be deployed on roadways in the near future. Although this emerging technology is still in its infancy, and predictions vary on when these vehicles will be fully deployed, it is apparent that CAVs will be the vehicles of the future.
CAVs are ushering in a transportation revolution that will make U.S. roads safer, provide mobility options to those who otherwise haven’t had them, reduce or increase congestion, make certain jobs obsolete and create new ones, alter government revenue streams, and change the way communities are built.
While it is impossible to predict exactly how these vehicles will impact society, change is inevitable. In order to ensure that citizens of the PACOG area reap the full benefits of CAVs and simultaneously mitigate the negative consequences associated with their deployment, PACOG must plan now. The decisions made today will shape the future. A review of some of the positive and negative consequences of the future deployment of CAVS follows.
Safety
Roadway safety is an area in which CAVs will dramatically bring about a positive change. As mentioned in Chapter 5 there were a total of 3,942 crashes in Pueblo County in 2018, of which 34 were fatal. Additionally, 44 percent of those 34 fatal crashes involved drugs or alcohol. Whether these crashes result in fatalities, injuries, or property damage, they put an enormous human and economic burden on our society. According to a NHTSA study, “motor vehicle crashes [nationally] in 2010 cost $242
August 15–September 6, 2018, http://www.connect2dot.org/announcements/cdot-internet-of-roads-presents-the-–future-of-colorados-transportation-system.
PACOG MOVES the Region 2045 LRTP April 2021 | 117
billion in economic activity, including $57.6 billion in lost workplace productivity, and $594 billion due to loss of life and decreased quality of life due to injuries.”37 CAVs will make our roadways safer by removing the human driver from the driving task.
It is no secret that humans make mistakes, especially when operating vehicles. USDOT’s Automated Driving Systems: A Vision for Safety 2.0 guidance document highlights that the major factor in 94 percent of all fatal crashes is human error.38
Mobility
CAVs will provide people with a new form of mobility that otherwise would not have been available to them. Mobility is a key factor in life choices; it can impact whether or not a person is employed, can access useful and pleasant activities, and can receive essential services. This is especially true for people with disabilities who are unable to drive. According to the findings of a study that looked at the impacts CAVs will have on people with disabilities, CAVs could provide 2 million employment opportunities for people with disabilities.39 Additionally, CAVs could dramatically benefit low-income individuals by providing additional transportation options in areas where mass transit is not a practical or a viable option.
Congestion
CAVs have the potential to either reduce or increase congestion on roadways. If the shared ownership model is deployed, CAVs can alter congestion levels by reducing the number of vehicles on the roadways. Currently, vehicles are parked for 95 percent of the time; if these vehicles were CAVs they could provide rides to other individuals when not in use by their owners.40 If the shared ownership model were
··················· 37 “Automated Vehicles for Safety,” USDOT, NHTSA,
accessed July 27, 2020, https://www.nhtsa.gov/technology-innovation/automated-vehicles-safety.
38 USDOT, NHTSA, Automated Driving Systems: A Vision for Safety 2.0, September 2017. https://www.nhtsa.gov/sites/nhtsa.dot.gov/files/documents/13069a-ads2.0_090617_v9a_tag.pdf.
39 Henry Claypool, Amitai Bin-Nun, Ph.D., and Jeffrey Gerlach, “The Ruderman White Paper: Self-Driving
implemented, there would not be the need for as many vehicles on our roadways. Additionally, TNCs are investing heavily in CAV technology to replace drivers with technology, reduce or remove personal vehicle ownership altogether, and move toward a subscription model to auto travel. Background on TNCs is presented in Section 7.4.
CAVs also have the potential to increase congestion on roadways. With a single ownership model in place, work commutes could change dramatically. For example, if an individual were to commute to work and then have their vehicle return home to park and return to pick them up for the return journey, daily person miles traveled would double. In a shared CAV ownership model, CAVs may be circling areas until they are needed, in a manner similar to TNCs today. Both CAV scenarios could dramatically increase vehicle mile traveled. While the jury is still out on which ownership model will become reality, the policies and planning that takes place today will influence how CAVs affect traffic congestion in the future.
Land Use
The way our cities and communities look could be dramatically different when CAVs are available to the public. For cities in particular, parking lots could become a thing of the past. Regardless of the ownership model that is put in place—shared, single owner, or subscription—there would not be the need for as many parking spaces as is the case currently. This shift will dramatically change the way cities look and feel. For example, due to the reduced need for parking spaces, a city could remove street parking and expand sidewalks or bike paths. Likewise, large parking lots could be developed or made into parks. For the emerging
Cars: The Impact on People with Disabilities” (Ruderman Family Foundation White Paper Series, January 2017), 16, https://rudermanfoundation.org/wp-content/uploads/2017/08/Self-Driving-Cars-The-Impact-on-People-with-Disabilities_FINAL.pdf.’
40 David Z. Morris, “Today’s Cars Are Parked 95% of the Time,” Tech–Transportation, Fortune, March 13, 2016, https://fortune.com/2016/03/13/cars-parked-95-percent-of-time/.
118 | April 2021 PACOG MOVES the Region 2045 LRTP
“knowledge worker,” whose product can be generated on a computer while working from home, work commute trips may trend down or disappear. Preparing for the many land use changes that are possible is a planning challenge for all communities.
CAVs could also exacerbate suburban sprawl since a major factor on where people decide to live is the distance they must travel to their place of employment. In 2018, the average commute time for Coloradans was 23.7 minutes with only 2.1 percent of the workforce commuting more than 90 minutes.41 CAVs will dramatically change the way people commute. Without the need for a human driver, an individual could conduct a variety of productive/leisure tasks in their vehicle such as working, watching movies or shows, or even sleeping. This freedom will make longer commutes more tolerable. Potentially, more individuals could live farther away from their employment/urban centers in communities with lower costs of housing and living.
Employment
While CAVs will open up new job opportunities to individuals who lack transportation options, they also have the potential to change the way some jobs are conducted or even remove the need for them. As an example, transportation workers will be affected greatly by CAVs; in Colorado, 6.5 percent of the Pueblo metropolitan statistical area workforce is directly employed by the transportation and material moving industry.42 Although it is too early to predict if these jobs will be completely eliminated, the need for human operators will likely be reduced. The tasks performed by the former operator will most likely be changed, or potentially removed completely. However, CAVs will bring about a rise to new industries and jobs, many of which are yet to be determined. It is important that the workforce
··················· 41 DataUSA: Colorado, Commute Time,” 2018 values,
https://datausa.io/profile/geo/colorado#housing. 42 US Bureau of Labor Statistics, “Occupational
Employment Statistics: May 2018 Metropolitan and Nonmetropolitan Area Occupational Employment and Wage Estimates, Pueblo, Colorado,” last modified March 29, 2019,
be prepared for the employment changes that are to come.
Revenue
State and local government revenue streams will also be altered by CAVs. A majority of CAVs in the future will be electric vehicles. The electrification of vehicles will make the motor fuel tax system trend toward obsolete. Likewise, if the shared and subscription ownership model for CAVs is implemented, then there will be fewer registered vehicles, resulting in a decline in revenues. As previously mentioned in the land use section, there will be less need for parking, thus revenues from parking will decline as well. Furthermore, CAVs will operate according to the letter of the law, resulting in a loss of revenues from traffic enforcement.
The way state and local governments are funded will need to be reexamined to ensure that budgets are not adversely affected by the changes underway. Whereas large jurisdictions have more diverse means to bring in revenues and will not be affected as much by CAVs, small jurisdictions may be adversely affected due to their reliance on traffic enforcement revenues for their budgets.43 CAVs will require governments to develop new and innovative means to collect revenues.
7.4 Transportation Network Companies
TNCs have been around for nearly a decade; they are also commonly referred to as rideshare companies and known by their company names such as Uber and Lyft. TNCs are a service that expand mobility options to many people and provide an alternative means of convenient transportation. In addition to providing mobility options, they also provide primary and supplemental employment to many individuals at a relatively easy barrier of entrance.
https://www.bls.gov/oes/2018/may/oes_39380.htm#53-0000.
43 Michael Maciag, “Special Report: How Autonomous Vehicles Could Constrain City Budgets,” Governing, July 2017, https://www.governing.com/gov-data/gov-how-autonomous-vehicles-could-effect-city-budgets.html#data.
PACOG MOVES the Region 2045 LRTP April 2021 | 119
How a TNC Works
When TNCs first launched, they were available only in large urban centers due to the constraints of economy of scale. However, in the last decade, TNCs have expanded to smaller cities and rural communities. These companies are, for the most part, not actual vehicle owners or operators. They are technology companies that created a platform linking drivers with riders. An individual can sign up to be a driver (independent contractor) by going through a relatively simple process to register on a web-based application. The barriers to entrance are owning a safe vehicle, passing a background check, and owning vehicle insurance. Once this process is complete the driver is able to pick up and drop off passengers by using an application on their cellular device. Passengers can order rides using the same application on their cellular devices by creating a user account and linking a credit card or prepaid card to the application.
Once drivers and passengers create their accounts, passengers can order rides using the application. The driver receives a notification of the location of the passenger and, once accepted, the two are linked and the driver will pick up and drop off the passenger as requested. The application completes the transaction and the driver is paid a portion of the predetermined fare with the remaining portion of the fare going to the TNC.
In addition to picking up one passenger, many TNCs have implemented a shared ride service. This feature allows multiple people to take the same ride if their end destinations are in similar locations. To incentivize this behavior, the TNC offers reduced fares for individuals who partake in the shared ride offering. The shared ride service opens the transportation service to additional low-income individuals and those wishing to conserve spending.
Link to CAV
Many TNC companies such as Uber and Lyft are investing billions of dollars in research and development on CAV technology. These
··················· 44 Congressional Research Service, Vehicle
Electrification: Federal and State Issues Affecting Deployment (R45747), prepared by Bill Canis, Corrie
companies are motivated by reducing their costs, and currently the biggest cost for TNCs is paying the driver. As previously mentioned, the TNC only receives a relatively small portion of the fare. The financial strategy of TNCs is to remove the driver from the equation completely and create a fleet of exclusively CAV vehicles. By having a fleet of CAVs, TNCs simultaneously would be both more profitable and able provide passengers with less costly rides than currently available. The shift in cost would make rideshare better for consumers and expand the service to lower-income individuals. As indicated in Section 7.3.3, many TNCs are exploring a subscription model in which, instead of owning a vehicle, an individual pays a monthly subscription for unlimited service or a certain number of rides per month. While it is too early to predict which kind of business model TNCs will use when they deploy their CAV fleets, it is important to monitor their technical and business development because they can dramatically change vehicle ownership and travel patterns.
7.5 Electrification of Vehicles
The future of vehicles is moving not only toward CAVs but also toward the electrification of vehicles. EVs, although still a small portion of vehicle sales in the United States, are on the rise due to a number of factors. The leading factor is their low carbon footprint as compared with traditional gasoline-powered internal combustion engine vehicles. In 2018 there were 42 different models of EVs for sale in the United States, and sales of plug-in hybrids and battery electric vehicles sales rose 80 percent from the year prior.44 Their popularity will continue to increase as their prices trend lower and their supporting infrastructure is developed.
What Is an EV?
EVs rely on electric power to propel them as opposed to traditional vehicles, which require combustion engines. EVs have a battery pack built into the chassis that powers four individual motors that power each wheel individually. This
E. Clark, and Molly F. Sherlock, June 2019, https://fas.org/sgp/crs/misc/R45747.pdf.
120 | April 2021 PACOG MOVES the Region 2045 LRTP
makes EVs more efficient than traditional combustion engine vehicles, which lose energy through the combustion of fuel. Whereas in the past EVs were criticized for their short range, today many EVs have ranges that exceed 300 miles on a single charge.
Benefits and Consequences of EVs
EVs will provide great benefits to society, although there are known consequences that will need to be addressed. Some of the benefits and consequences are listed below.
Benefits
Energy efficiency – EVs are more energy-efficient than traditional combustion engine vehicles. An EV converts over 77 percent of electrical energy to power at the wheels, whereas gasoline converts up to only 30 percent of stored energy in the gasoline to power at the wheels.
Environmentally friendly – EVs emit no pollution, and although the power plants that fuel them may do so, there are other environmentally friendly ways to generate electricity including by nuclear, hydro, solar, and wind powered plants.
Energy Independence – The electricity to power EVs is generated domestically, reducing the reliance on foreign oil.
Consequences
Revenue loss – Because EVs do not use gasoline to power them, EV owners do not pay motor fuel tax, which is the primary means to build and repair roads.
Infrastructure – Major infrastructure investments will be required to allow for greater saturation of EVs in the vehicle market. EVs requir charging, which is more time consuming than fueling up a traditional combustion engine. Charging station infrastructure and placement at residential, shopping, and work locations will require thoughtful planning and investment.45
7.6 Conclusion
Emerging technologies have shaped and will continue to shape our society. Alexander Graham Bell’s telephone replaced the telegraph, and Henry Ford’s assembly line made the horse and buggy obsolete. No one at that time could predict how the future would look for communication and transportation, but society changed and adapted. Today, the connected and autonomous vehicle, transportation network companies, and electric vehicles are the technologies that will shape our future. Though we cannot predict how this future will look, we can and will begin to plan for it.
··················· 45 “All Electric Vehicles,” US Department of Energy,
Office of Energy Efficiency & Renewable Energy and US Environmental Protection Agency, accessed July
27, 2020, https://www.fueleconomy.gov/feg/evtech.shtml.
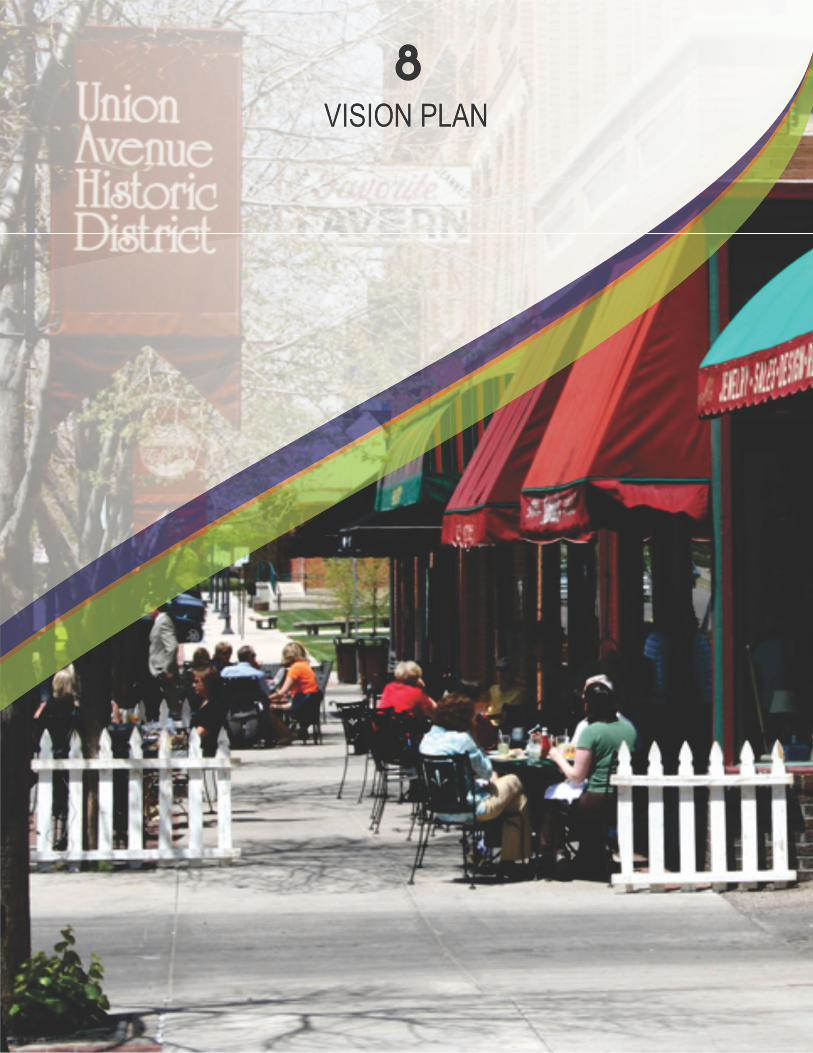
PACOG MOVES the Region 2045 LRTP April 2021 | 121
PACOG MOVES the Region 2045 LRTP April 2021 | 121
8.0 Vision Plan
8.1 Introduction
In order to achieve the Pueblo Area Council of Government’s (PACOG’s) multimodal transportation system vision for the region, the Metropolitan Planning Organization (MPO), along with the help of the Colorado Department of Transportation (CDOT), created a Vision Plan. The Vision Plan covers the 25-year period that has been discussed throughout this Long Range Transportation Plan (LRTP). The Vision Plan includes both projects for which funding has been programmed and projects that do not currently have earmarked funding.
8.2 Vision Plan Roadway Projects
The Vision Plan includes roadway projects that are grouped in four different categories based on the status and source of supporting funding. Those categories are as follows:
1. 10-Year Capital Improvements Program (CIP) projects, including 4-Year Transportation Improvement Projects that are funded by state and federal sources.
2. State/Federally funded projects that are not included in the 10-year CIP.
3. Locally funded projects, and 4. Privately funded, development-driven
projects.
Each of these categories is discussed below. A full list of Vision Plan roadway projects can be found in Table 8.1.
8.2.1 The 10‐Year CIP and Transportation Improvement Program (TIP)
The current 10-year CIP covers from FY 2021 through FY 2030. The projects listed in the CIP are funded with state and federal funding through CDOT. Although the CIP covers a 10-year span of projects, not all of the projects within the CIP are guaranteed to be funded and constructed. The first four years of the 10-
year CIP (FY 2021–FY 2024) make up the Transportation Improvement Program (TIP). Those projects are funded and programmed to be constructed within the four-year period that make up the current TIP. The TIP is a four-year document that is updated on a yearly basis. Projects that will be moved into the TIP each year as funding becomes available comprise the remaining six years of the 10-year CIP. The projects programmed in that six-year period are projects that are considered eligible for state and federal funding each year when new funds become available.
8.2.2 State & Federally Funded Projects
A shortlist of additional projects eligible for state and/or federal funding has also been identified. The projects that fall into this category are those that are on state and federal highways for which funds have not yet become available, precluding them from being placed on the 10-year CIP. These projects are a part of the Vision Plan of the 2045 LRTP and are projects that the PACOG MPO would like to see completed.
8.2.3 Locally Funded Projects
Projects on the locally funded project list are projects that are not on the state or federal highway system and cannot be funded using state and/or federal monies. These projects are high priorities for the region and are included in the 2045 LRTP Vision Plan. As local funding becomes available, these projects can be moved to the TIP. A variety of local funding options are being considered to advance these local projects.
122 | April 2021 PACOG MOVES the Region 2045 LRTP
8.2.4 Developer Driven Projects
The last category of roadway projects that comprise the Vision Plan includes those projects that are development driven. These projects will be privately funded by development interests when they are needed to advance private development projects. This means that the roadway improvement projects will be needed as more businesses come into the region and as outlying areas are developed as residential neighborhoods, employment centers, and communities.
Theoretically, when a business wants to enter the region, they will need access to their industry suppliers and workforce, and therefore will have to develop a connecting road. The projects on this list are located in areas that are considered desirable as industrial and business sites and that will require further expansion of roads to accommodate incoming industries. These privately funded projects readily combine with the other resource categories to create the Vision Plan for the 2045 LRTP.
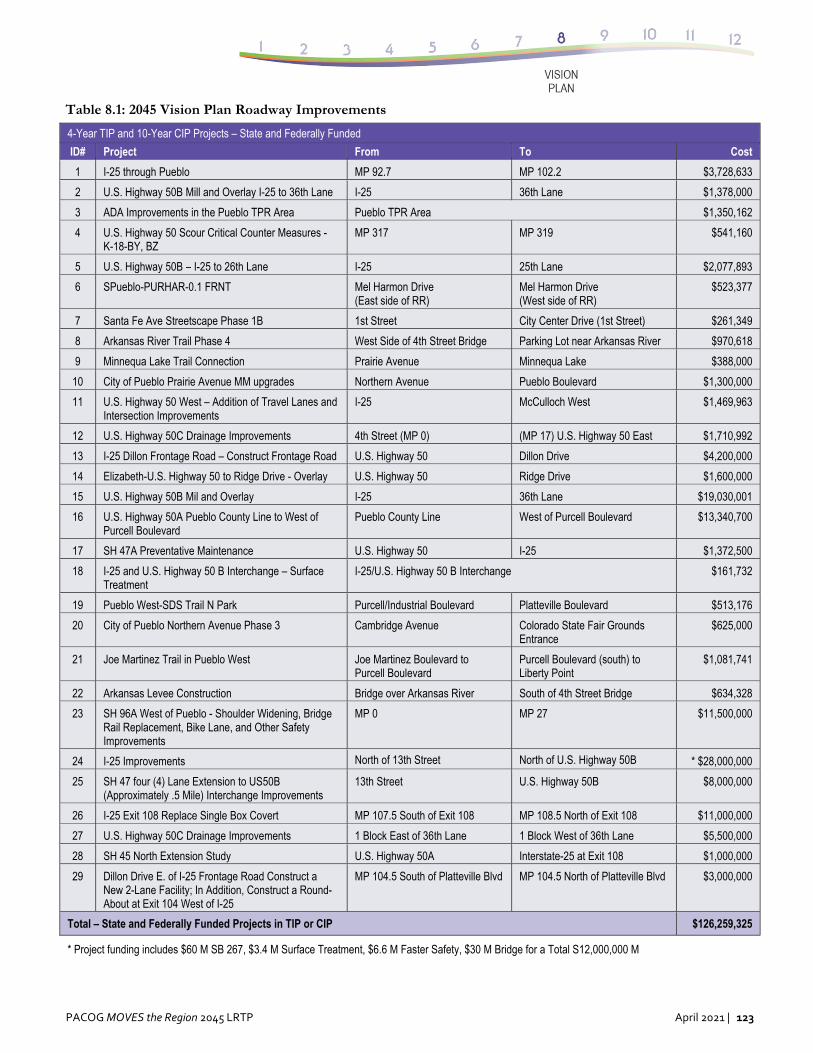
PACOG MOVES the Region 2045 LRTP April 2021 | 123
Table 8.1: 2045 Vision Plan Roadway Improvements
4-Year TIP and 10-Year CIP Projects – State and Federally Funded
ID# Project From To Cost
1 I-25 through Pueblo MP 92.7 MP 102.2 $3,728,633
2 U.S. Highway 50B Mill and Overlay I-25 to 36th Lane I-25 36th Lane $1,378,000
3 ADA Improvements in the Pueblo TPR Area Pueblo TPR Area $1,350,162
4 U.S. Highway 50 Scour Critical Counter Measures - K-18-BY, BZ
MP 317 MP 319 $541,160
5 U.S. Highway 50B – I-25 to 26th Lane I-25 25th Lane $2,077,893
6 SPueblo-PURHAR-0.1 FRNT Mel Harmon Drive (East side of RR)
Mel Harmon Drive (West side of RR)
$523,377
7 Santa Fe Ave Streetscape Phase 1B 1st Street City Center Drive (1st Street) $261,349
8 Arkansas River Trail Phase 4 West Side of 4th Street Bridge Parking Lot near Arkansas River $970,618
9 Minnequa Lake Trail Connection Prairie Avenue Minnequa Lake $388,000
10 City of Pueblo Prairie Avenue MM upgrades Northern Avenue Pueblo Boulevard $1,300,000
11 U.S. Highway 50 West – Addition of Travel Lanes and Intersection Improvements
I-25 McCulloch West $1,469,963
12 U.S. Highway 50C Drainage Improvements 4th Street (MP 0) (MP 17) U.S. Highway 50 East $1,710,992
13 I-25 Dillon Frontage Road – Construct Frontage Road U.S. Highway 50 Dillon Drive $4,200,000
14 Elizabeth-U.S. Highway 50 to Ridge Drive - Overlay U.S. Highway 50 Ridge Drive $1,600,000
15 U.S. Highway 50B Mil and Overlay I-25 36th Lane $19,030,001
16 U.S. Highway 50A Pueblo County Line to West of Purcell Boulevard
Pueblo County Line West of Purcell Boulevard $13,340,700
17 SH 47A Preventative Maintenance U.S. Highway 50 I-25 $1,372,500
18 I-25 and U.S. Highway 50 B Interchange – Surface Treatment
I-25/U.S. Highway 50 B Interchange $161,732
19 Pueblo West-SDS Trail N Park Purcell/Industrial Boulevard Platteville Boulevard $513,176
20 City of Pueblo Northern Avenue Phase 3 Cambridge Avenue Colorado State Fair Grounds Entrance
$625,000
21 Joe Martinez Trail in Pueblo West Joe Martinez Boulevard to Purcell Boulevard
Purcell Boulevard (south) to Liberty Point
$1,081,741
22 Arkansas Levee Construction Bridge over Arkansas River South of 4th Street Bridge $634,328
23 SH 96A West of Pueblo - Shoulder Widening, Bridge Rail Replacement, Bike Lane, and Other Safety Improvements
MP 0 MP 27 $11,500,000
24 I-25 Improvements North of 13th Street North of U.S. Highway 50B * $28,000,000
25 SH 47 four (4) Lane Extension to US50B (Approximately .5 Mile) Interchange Improvements
13th Street U.S. Highway 50B $8,000,000
26 I-25 Exit 108 Replace Single Box Covert MP 107.5 South of Exit 108 MP 108.5 North of Exit 108 $11,000,000
27 U.S. Highway 50C Drainage Improvements 1 Block East of 36th Lane 1 Block West of 36th Lane $5,500,000
28 SH 45 North Extension Study U.S. Highway 50A Interstate-25 at Exit 108 $1,000,000
29 Dillon Drive E. of I-25 Frontage Road Construct a New 2-Lane Facility; In Addition, Construct a Round-About at Exit 104 West of I-25
MP 104.5 South of Platteville Blvd MP 104.5 North of Platteville Blvd $3,000,000
Total – State and Federally Funded Projects in TIP or CIP $126,259,325
* Project funding includes $60 M SB 267, $3.4 M Surface Treatment, $6.6 M Faster Safety, $30 M Bridge for a Total S12,000,000 M
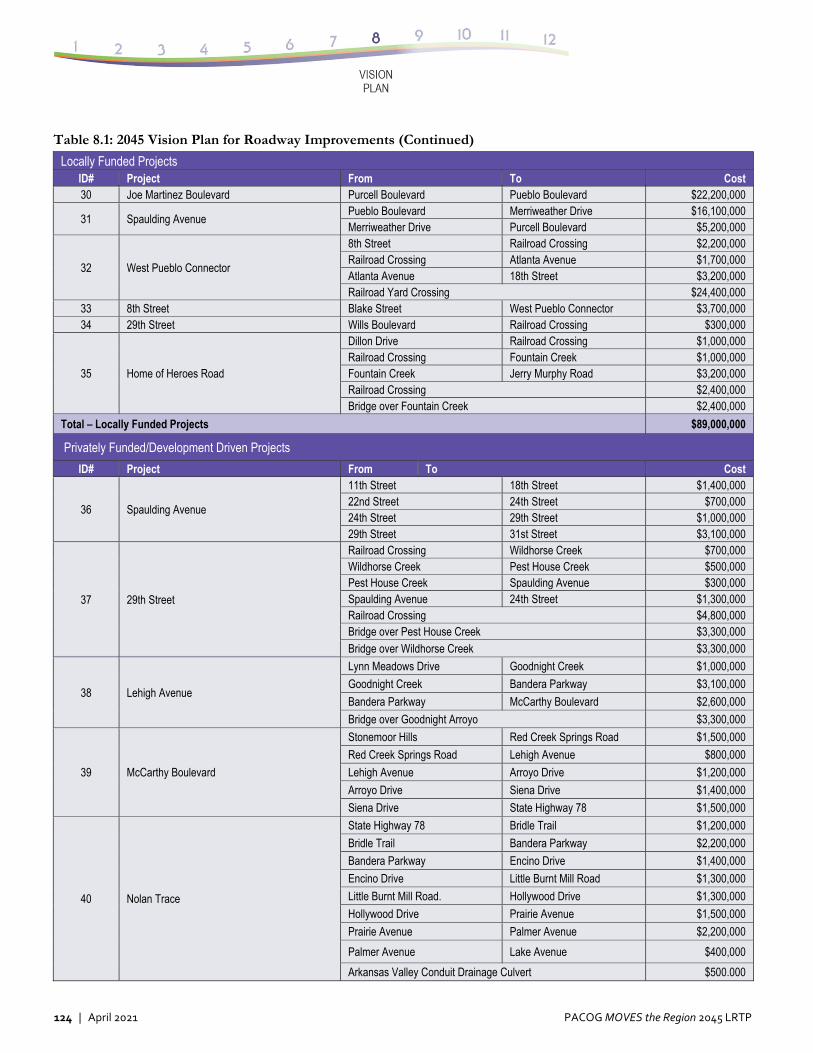
124 | April 2021 PACOG MOVES the Region 2045 LRTP
Table 8.1: 2045 Vision Plan for Roadway Improvements (Continued)
Locally Funded Projects ID# Project From To Cost 30 Joe Martinez Boulevard Purcell Boulevard Pueblo Boulevard $22,200,000
31 Spaulding Avenue Pueblo Boulevard Merriweather Drive $16,100,000 Merriweather Drive Purcell Boulevard $5,200,000
32 West Pueblo Connector
8th Street Railroad Crossing $2,200,000 Railroad Crossing Atlanta Avenue $1,700,000 Atlanta Avenue 18th Street $3,200,000 Railroad Yard Crossing $24,400,000
33 8th Street Blake Street West Pueblo Connector $3,700,000 34 29th Street Wills Boulevard Railroad Crossing $300,000
35 Home of Heroes Road
Dillon Drive Railroad Crossing $1,000,000 Railroad Crossing Fountain Creek $1,000,000 Fountain Creek Jerry Murphy Road $3,200,000 Railroad Crossing $2,400,000 Bridge over Fountain Creek $2,400,000
Total – Locally Funded Projects $89,000,000
Privately Funded/Development Driven Projects
ID# Project From To Cost
36 Spaulding Avenue
11th Street 18th Street $1,400,000 22nd Street 24th Street $700,000 24th Street 29th Street $1,000,000 29th Street 31st Street $3,100,000
37 29th Street
Railroad Crossing Wildhorse Creek $700,000 Wildhorse Creek Pest House Creek $500,000 Pest House Creek Spaulding Avenue $300,000 Spaulding Avenue 24th Street $1,300,000 Railroad Crossing $4,800,000 Bridge over Pest House Creek $3,300,000 Bridge over Wildhorse Creek $3,300,000
38 Lehigh Avenue
Lynn Meadows Drive Goodnight Creek $1,000,000
Goodnight Creek Bandera Parkway $3,100,000
Bandera Parkway McCarthy Boulevard $2,600,000
Bridge over Goodnight Arroyo $3,300,000
39 McCarthy Boulevard
Stonemoor Hills Red Creek Springs Road $1,500,000
Red Creek Springs Road Lehigh Avenue $800,000
Lehigh Avenue Arroyo Drive $1,200,000
Arroyo Drive Siena Drive $1,400,000
Siena Drive State Highway 78 $1,500,000
40 Nolan Trace
State Highway 78 Bridle Trail $1,200,000
Bridle Trail Bandera Parkway $2,200,000
Bandera Parkway Encino Drive $1,400,000
Encino Drive Little Burnt Mill Road $1,300,000
Little Burnt Mill Road. Hollywood Drive $1,300,000
Hollywood Drive Prairie Avenue $1,500,000
Prairie Avenue Palmer Avenue $2,200,000
Palmer Avenue Lake Avenue $400,000
Arkansas Valley Conduit Drainage Culvert $500.000
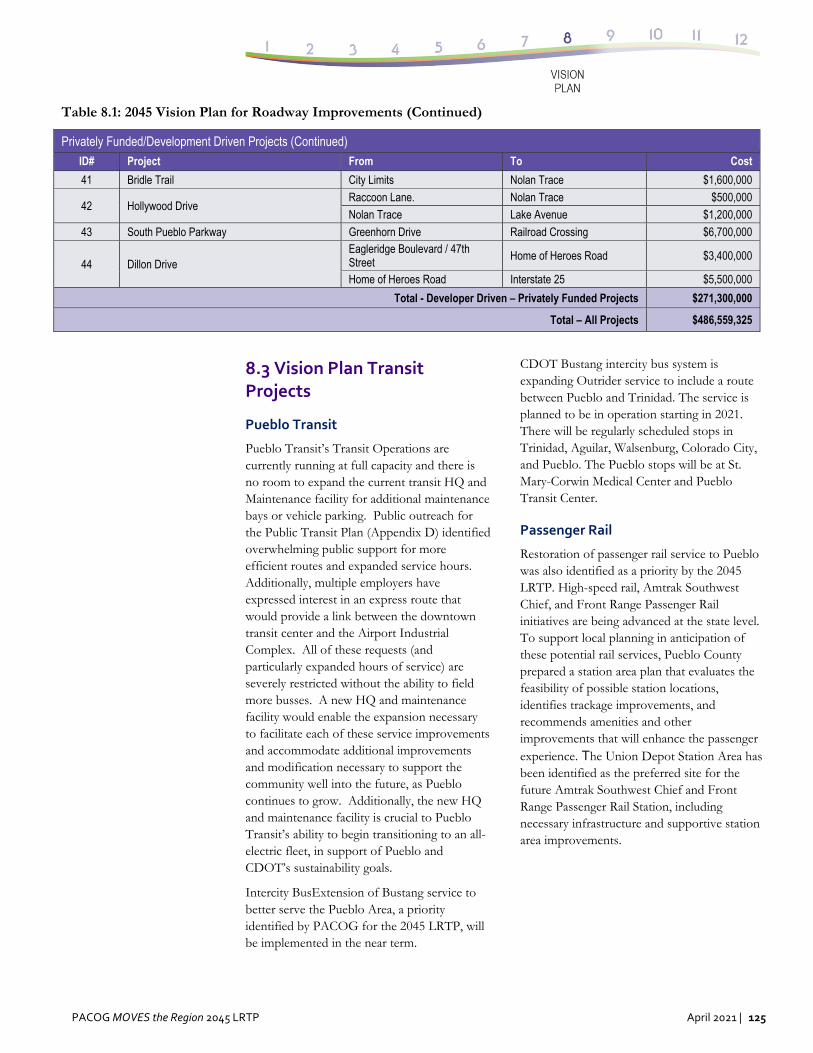
PACOG MOVES the Region 2045 LRTP April 2021 | 125
8.3 Vision Plan Transit Projects
Pueblo Transit
Pueblo Transit’s Transit Operations are currently running at full capacity and there is no room to expand the current transit HQ and Maintenance facility for additional maintenance bays or vehicle parking. Public outreach for the Public Transit Plan (Appendix D) identified overwhelming public support for more efficient routes and expanded service hours. Additionally, multiple employers have expressed interest in an express route that would provide a link between the downtown transit center and the Airport Industrial Complex. All of these requests (and particularly expanded hours of service) are severely restricted without the ability to field more busses. A new HQ and maintenance facility would enable the expansion necessary to facilitate each of these service improvements and accommodate additional improvements and modification necessary to support the community well into the future, as Pueblo continues to grow. Additionally, the new HQ and maintenance facility is crucial to Pueblo Transit’s ability to begin transitioning to an all- electric fleet, in support of Pueblo and CDOT’s sustainability goals.
Intercity BusExtension of Bustang service to better serve the Pueblo Area, a priority identified by PACOG for the 2045 LRTP, will be implemented in the near term.
CDOT Bustang intercity bus system is expanding Outrider service to include a route between Pueblo and Trinidad. The service is planned to be in operation starting in 2021. There will be regularly scheduled stops in Trinidad, Aguilar, Walsenburg, Colorado City, and Pueblo. The Pueblo stops will be at St. Mary-Corwin Medical Center and Pueblo Transit Center.
Passenger Rail
Restoration of passenger rail service to Pueblo was also identified as a priority by the 2045 LRTP. High-speed rail, Amtrak Southwest Chief, and Front Range Passenger Rail initiatives are being advanced at the state level. To support local planning in anticipation of these potential rail services, Pueblo County prepared a station area plan that evaluates the feasibility of possible station locations, identifies trackage improvements, and recommends amenities and other improvements that will enhance the passenger experience. The Union Depot Station Area has been identified as the preferred site for the future Amtrak Southwest Chief and Front Range Passenger Rail Station, including necessary infrastructure and supportive station area improvements.
Table 8.1: 2045 Vision Plan for Roadway Improvements (Continued)
Privately Funded/Development Driven Projects (Continued)
ID# Project From To Cost
41 Bridle Trail City Limits Nolan Trace $1,600,000
42 Hollywood Drive Raccoon Lane. Nolan Trace $500,000
Nolan Trace Lake Avenue $1,200,000
43 South Pueblo Parkway Greenhorn Drive Railroad Crossing $6,700,000
44 Dillon Drive Eagleridge Boulevard / 47th Street
Home of Heroes Road $3,400,000
Home of Heroes Road Interstate 25 $5,500,000
Total - Developer Driven – Privately Funded Projects $271,300,000
Total – All Projects $486,559,325
126 | April 2021 PACOG MOVES the Region 2045 LRTP
The overall recommendation is to lead with design and engineering for Union Depot Phase 1 to accommodate the Amtrak Branch Service option under study in the 2020 CRISI Grant, ensuring that key infrastructure elements in the design can accommodate station elements included in Phase 2 for Front Range Passenger Rail and the long-term potential for the Amtrak Reroute option.
8.4 Bikeway & Trail Improvements
8.4.1 Bikeway & Trails Planning
The PACOG Trails Master Plan was used to identify both existing facilities and future planned facilities. The bikeway alignments included in the PACOG Trails Master Plan include facilities drawn from the current City of
Pueblo, Pueblo County, and Pueblo West trails plans, the future roadway plan, facility spacing, and connectivity considerations. The City’s current Trails Master Plan, County Trail Plans for the St. Charles Mesa, and current trails plan for Pueblo West were incorporated into the plan. The region’s inventory of existing and planned bikeway and trail facilities included in the 2040 LRTP is summarized in Table 8.2. Existing and planned trails throughout Pueblo County are presented in Figure 8.1.
Since adoption of the 2040 LRTP, local jurisdictions—the City of Pueblo and Pueblo West Metropolitan District prominent among them—have been actively involved in advancing planned bikeway, bike lane, and trails projects. An updated map of City of Pueblo and Pueblo West bike lanes and routes is presented in Figure 8.2.
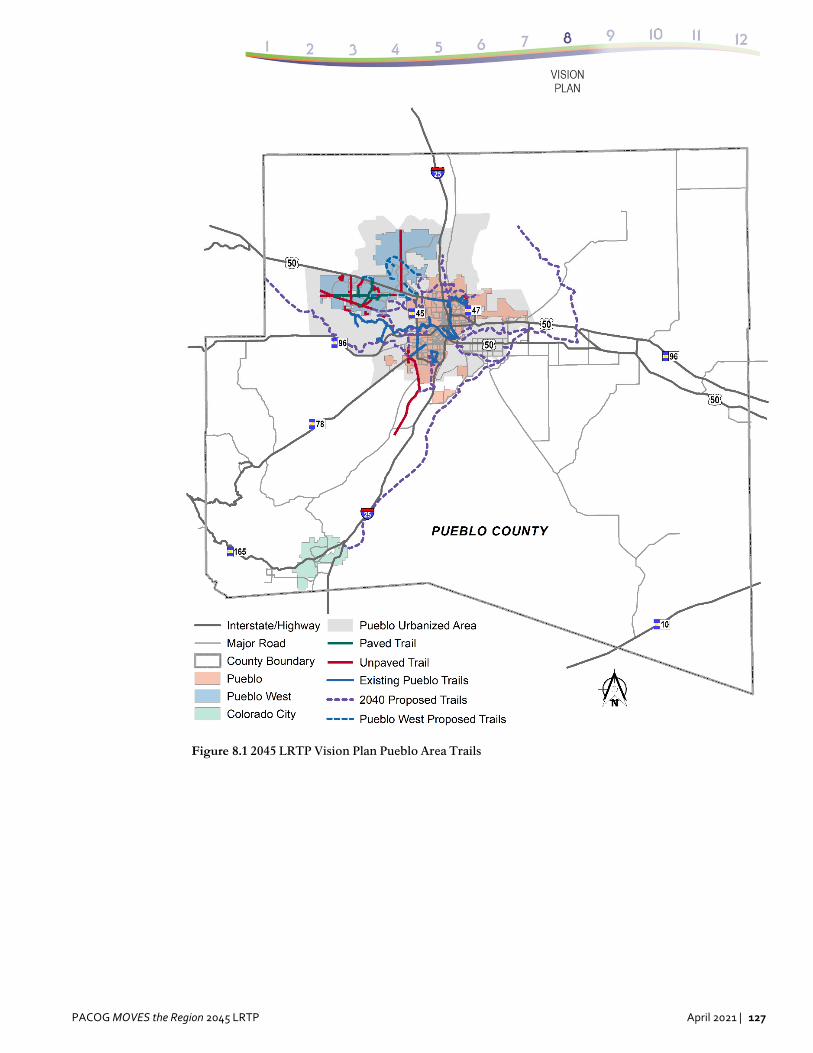
PACOG MOVES the Region 2045 LRTP April 2021 | 127
Figure 8.1 2045 LRTP Vision Plan Pueblo Area Trails
128 | April 2021 PACOG MOVES the Region 2045 LRTP
Collaborative planning has also identified trail development priorities for the City of Pueblo and Pueblo West, as well as for the remainder of unincorporated Pueblo County. Figure 8.3 presents an updated map of City of Pueblo and Pueblo West trails. A closer look at Pueblo West trail facilities is presented by Figure 8.4.
The focus of this most-recent planning has been on improving trail connectivity and providing trail crossings of significant barriers, including the Arkansas River. Table 8.3 presents updated trails priorities for each of the three jurisdictions.
8.4.2 Bikeway & Trails Funding
Funding for Trail improvement projects using state/federal Transportation Alternatives Program (TAP) funds has considered the following priorities established by the 2040 LRTP and local planning processes:
Wildhorse Creek Trail: Complete the Wildhorse Trail from its existing northern terminus at 17th and Tuxedo north to U.S. Highway 50, about three miles, in conjunction with the development of the YMCA Complex. The approximate cost for constructing a 10’ wide concrete trail is $1,500,000 in 2008 dollars.
Dry Creek Trail: This ten-mile trail extends north from the Arkansas River on the east side of Pueblo. When completed, the Dry Creek Trail will form a loop with the Fountain Creek Trail around the east side neighborhood and will link the CSU Pueblo campus with the residential areas to the south. The approximate cost for constructing a 10’ wide concrete trail is $5,000,000 in 2008 dollars.
Goodnight Arroyo: The Goodnight Arroyo extends south from the Arkansas River. The 6-mile trail will provide a link between the Arkansas River and the large reservoirs to the south. The approximate cost for constructing a 10’ wide concrete trail is $3,000,000 in 2008 dollars.
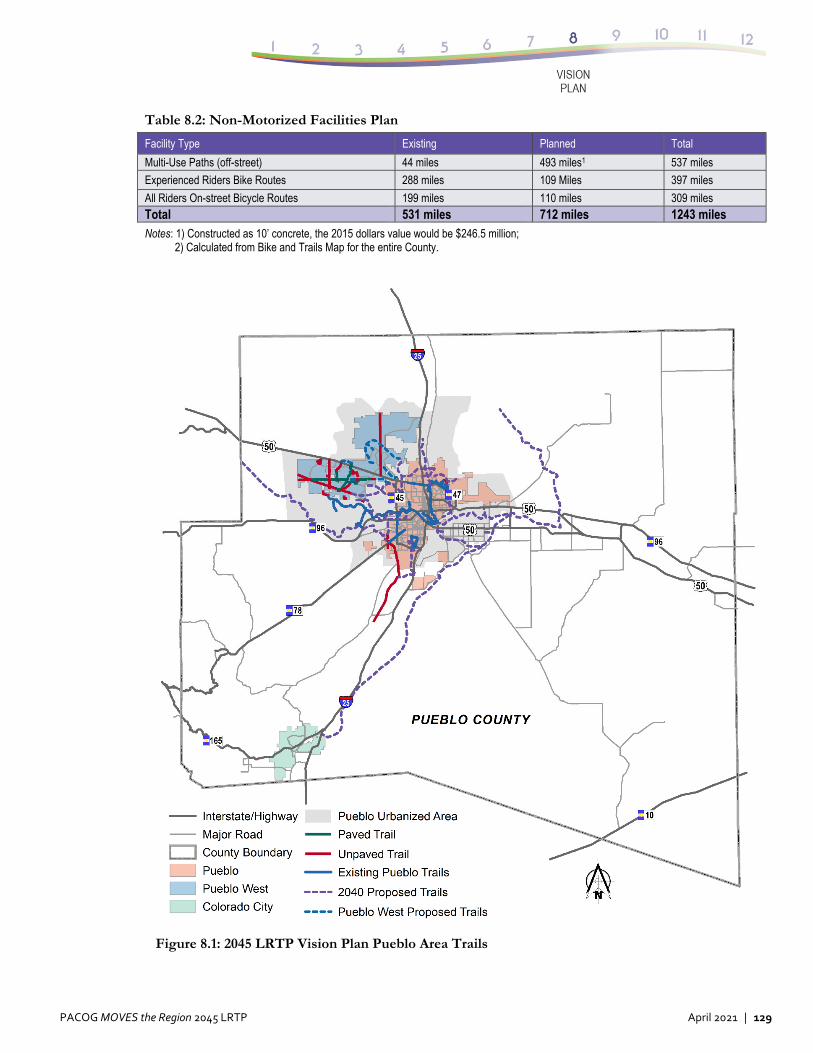
PACOG MOVES the Region 2045 LRTP April 2021 | 129
Table 8.2: Non-Motorized Facilities Plan
Facility Type Existing Planned Total
Multi-Use Paths (off-street) 44 miles 493 miles1 537 miles
Experienced Riders Bike Routes 288 miles 109 Miles 397 miles
All Riders On-street Bicycle Routes 199 miles 110 miles 309 miles Total 531 miles 712 miles 1243 miles Notes: 1) Constructed as 10’ concrete, the 2015 dollars value would be $246.5 million; 2) Calculated from Bike and Trails Map for the entire County.
Figure 8.1: 2045 LRTP Vision Plan Pueblo Area Trails
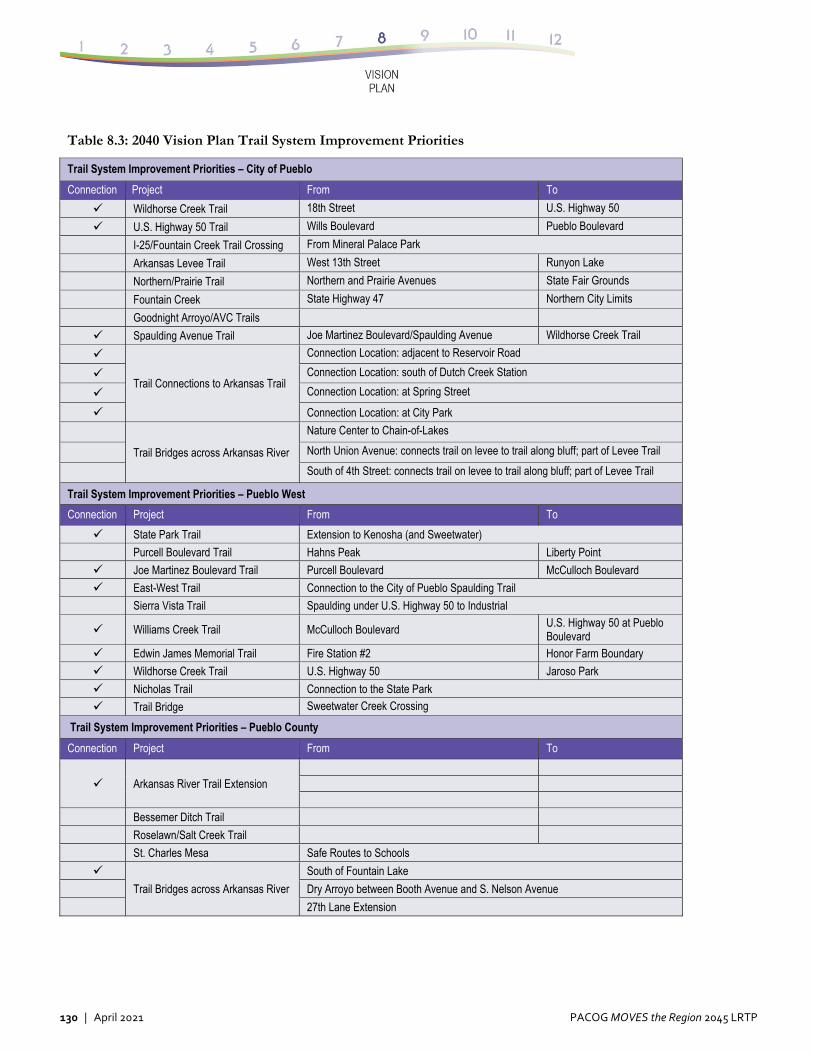
130 | April 2021 PACOG MOVES the Region 2045 LRTP
Table 8.3: 2040 Vision Plan Trail System Improvement Priorities
Trail System Improvement Priorities – City of Pueblo
Connection Project From To
Wildhorse Creek Trail 18th Street U.S. Highway 50
U.S. Highway 50 Trail Wills Boulevard Pueblo Boulevard
I-25/Fountain Creek Trail Crossing From Mineral Palace Park
Arkansas Levee Trail West 13th Street Runyon Lake
Northern/Prairie Trail Northern and Prairie Avenues State Fair Grounds
Fountain Creek State Highway 47 Northern City Limits
Goodnight Arroyo/AVC Trails
Spaulding Avenue Trail Joe Martinez Boulevard/Spaulding Avenue Wildhorse Creek Trail
Trail Connections to Arkansas Trail
Connection Location: adjacent to Reservoir Road
Connection Location: south of Dutch Creek Station
Connection Location: at Spring Street
Connection Location: at City Park
Trail Bridges across Arkansas River
Nature Center to Chain-of-Lakes
North Union Avenue: connects trail on levee to trail along bluff; part of Levee Trail
South of 4th Street: connects trail on levee to trail along bluff; part of Levee Trail
Trail System Improvement Priorities – Pueblo West
Connection Project From To
State Park Trail Extension to Kenosha (and Sweetwater)
Purcell Boulevard Trail Hahns Peak Liberty Point
Joe Martinez Boulevard Trail Purcell Boulevard McCulloch Boulevard
East-West Trail Connection to the City of Pueblo Spaulding Trail
Sierra Vista Trail Spaulding under U.S. Highway 50 to Industrial
Williams Creek Trail McCulloch Boulevard U.S. Highway 50 at Pueblo Boulevard
Edwin James Memorial Trail Fire Station #2 Honor Farm Boundary
Wildhorse Creek Trail U.S. Highway 50 Jaroso Park
Nicholas Trail Connection to the State Park
Trail Bridge Sweetwater Creek Crossing
Trail System Improvement Priorities – Pueblo County
Connection Project From To
Arkansas River Trail Extension
Bessemer Ditch Trail
Roselawn/Salt Creek Trail
St. Charles Mesa Safe Routes to Schools
Trail Bridges across Arkansas River
South of Fountain Lake
Dry Arroyo between Booth Avenue and S. Nelson Avenue
27th Lane Extension
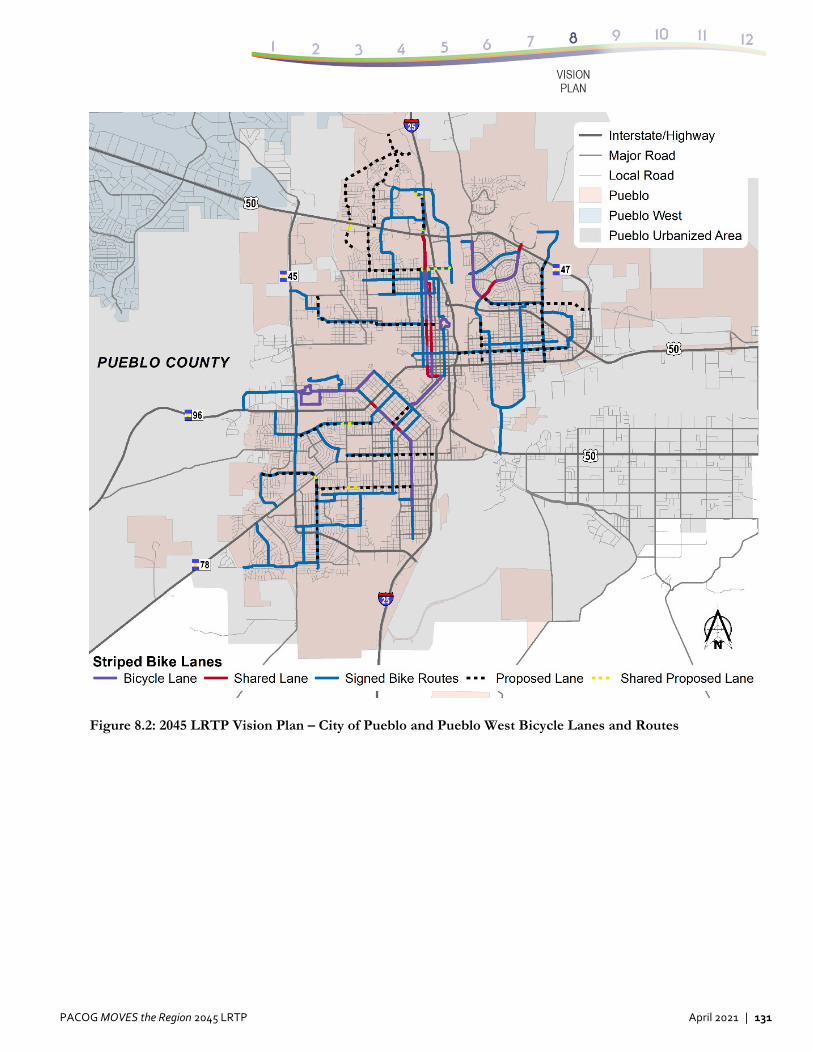
PACOG MOVES the Region 2045 LRTP April 2021 | 131
Figure 8.2: 2045 LRTP Vision Plan – City of Pueblo and Pueblo West Bicycle Lanes and Routes
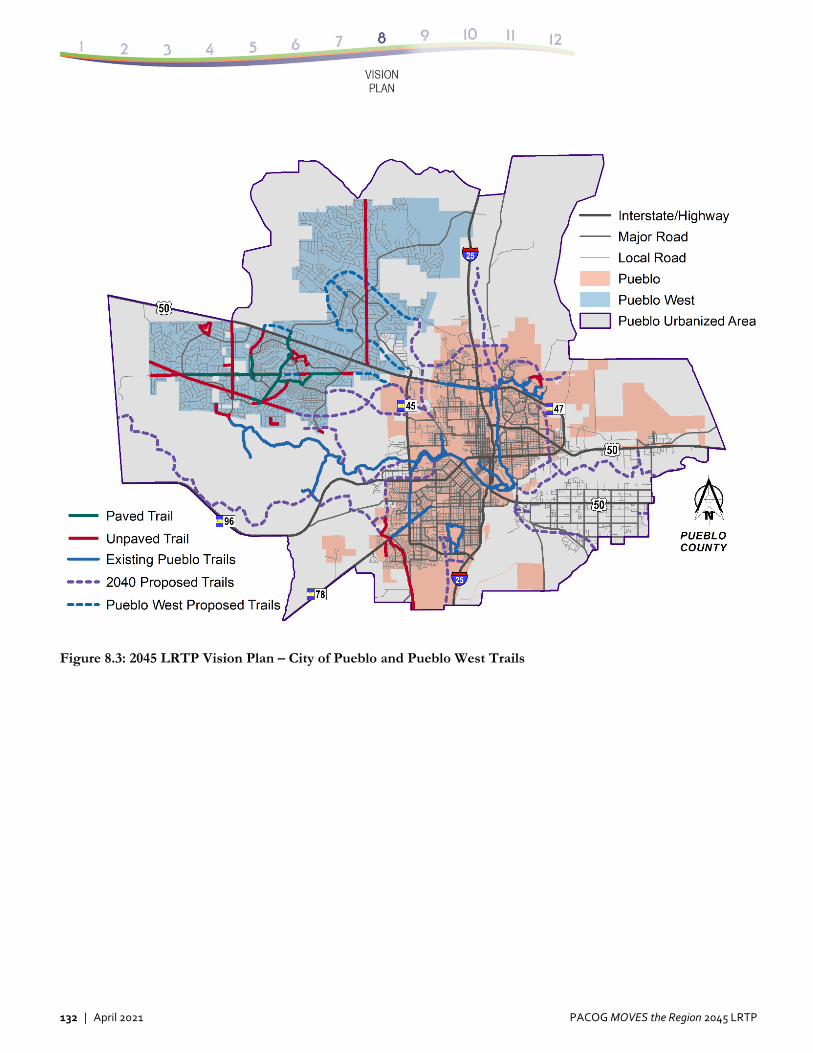
132 | April 2021 PACOG MOVES the Region 2045 LRTP
Figure 8.3: 2045 LRTP Vision Plan – City of Pueblo and Pueblo West Trails
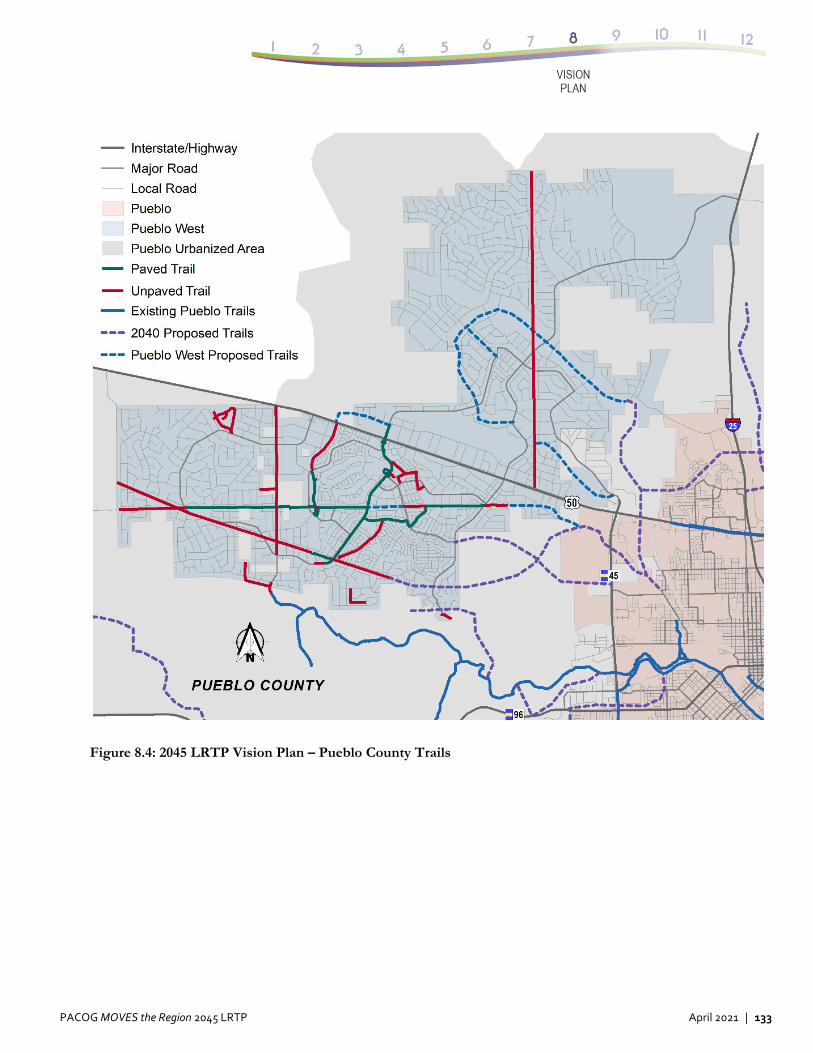
PACOG MOVES the Region 2045 LRTP April 2021 | 133
Figure 8.4: 2045 LRTP Vision Plan – Pueblo County Trails
n 2045 LRTP December 2020 | 134
PACOG MOVES the Region 2045 LRTP April 2021 | 135
9.0 Fiscally Constrained Plan
9.1 Funding Processes
9.1.1 Funding State & Federal Highway Projects & Programs
The funding process for the Pueblo Area Council of Governments (PACOG) region is based on guidance from two key recent project prioritization processes:
1. Colorado Department of Transportation’s (CDOT’s) STIP Development Guidance and Project Priority Programming Process (4P) (FY2021–FY2024)46
2. Funding Advancement for Surface Transportation and Economic Recovery (FASTER) Safety Mitigation Program Guidelines47
The purpose of this section is to present these two processes in the context of PACOG funding decisions.
9.1.2 STIP 4P Funding Process
The STIP process is required by the Federal Highway Administration (FHWA) and the Federal Transit Administration (FTA) for the programming of regionally significant transportation projects, within fiscal constraints and consistent with the CDOT Development Program and the Statewide Transportation Plan (SWP), for a period of at least four years. The STIP Development Guidance and 4P Process guidance is “consistent with Policy Directive (PD) 703.0 Annual Budget, Project Budgeting and Cash Management Principles, Part V., Section F, which outlines the general policy foundation for the STIP. This guidance reflects current regulations and policies and supersedes the Project Priority Programming Process (4P) and STIP
Development Guidelines adopted in February 2015.” (p. 1)
··················· 46 CDOT, STIP Development Guidance and Project
Priority Programming Process (4P), May 2020, https://www.codot.gov/programs/planning/assets/statewide-transportation-improvement-program-stip/stip-development-guidance-and-4p-process-updated-june-2020.pdf.
The updated STIP Development Guidance (pp. 1–2) defines the following terms, relevant to PACOG: Development Program – a 10-year
program of Regionally Significant Projects and other major projects consistent with the long-range Statewide Transportation Plan (SWP). The first four years of the Development Program will match the Statewide Transportation Improvement Program (STIP).
Fiscal Constraint for the STIP – includes sufficient financial information for demonstrating that projects in the STIP can be implemented using committed, available, or reasonably available revenue sources, with reasonable assurance that the federally supported transportation system is being adequately operated and maintained. Financial constraint applies to each program year.
Four-Year Work Plan – a detailed plan for approved transportation projects scheduled for implementation over a four-year time frame including project locations, descriptions, detailed schedules, and estimated expenditures that can be used to track progress and for cash management purposes.
Non-Regionally Significant Project – projects that are not considered to be of appropriate scale for individual identification in the STIP in a given program year and which are grouped in the STIP under a STIP Program or Regional Sub-Program.
Program List – a list of Non-Regionally Significant projects corresponding with STIP Programs or Regional Sub-Programs.
Regionally Significant Project – a project serving regional transportation needs and of significant scale to be typically included in transportation demand modeling for air quality emissions analysis and identified individually in the STIP.
47 CDOT, FASTER Safety Mitigation Program Guidelines and Application, 2014. Please note that data based upon this source remains unchanged from the 2040 LRTP unless otherwise noted. An update to the 2014 guidelines is pending release in 2021.
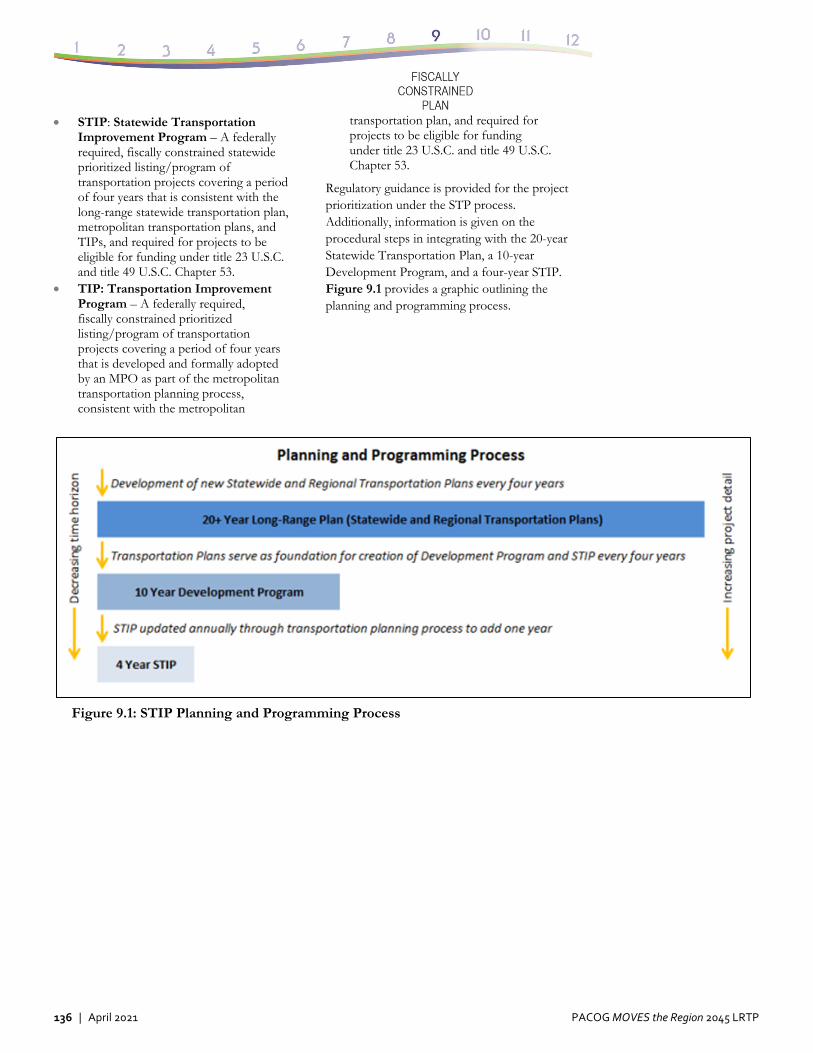
136 | April 2021 PACOG MOVES the Region 2045 LRTP
STIP: Statewide Transportation Improvement Program – A federally required, fiscally constrained statewide prioritized listing/program of transportation projects covering a period of four years that is consistent with the long-range statewide transportation plan, metropolitan transportation plans, and TIPs, and required for projects to be eligible for funding under title 23 U.S.C. and title 49 U.S.C. Chapter 53.
TIP: Transportation Improvement Program – A federally required, fiscally constrained prioritized listing/program of transportation projects covering a period of four years that is developed and formally adopted by an MPO as part of the metropolitan transportation planning process, consistent with the metropolitan
transportation plan, and required for projects to be eligible for funding under title 23 U.S.C. and title 49 U.S.C. Chapter 53.
Regulatory guidance is provided for the project prioritization under the STP process. Additionally, information is given on the procedural steps in integrating with the 20-year Statewide Transportation Plan, a 10-year Development Program, and a four-year STIP. Figure 9.1 provides a graphic outlining the planning and programming process.
Figure 9.1: STIP Planning and Programming Process
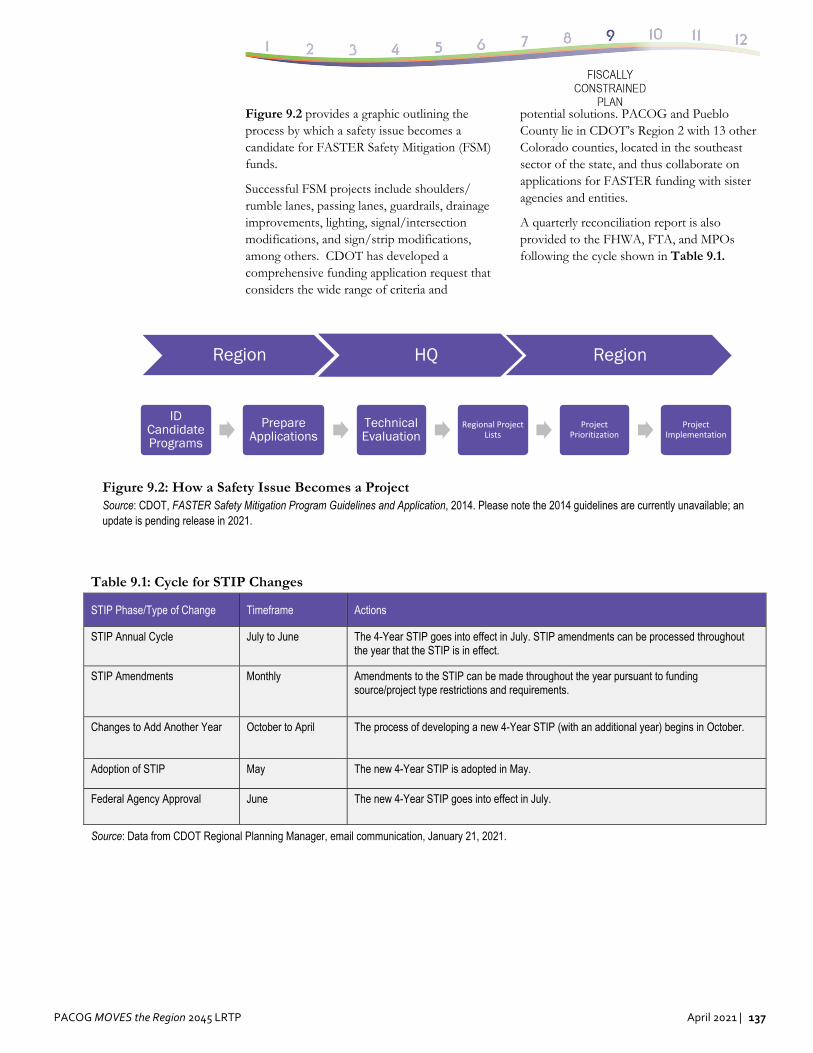
PACOG MOVES the Region 2045 LRTP April 2021 | 137
Figure 9.2 provides a graphic outlining the process by which a safety issue becomes a candidate for FASTER Safety Mitigation (FSM) funds.
Successful FSM projects include shoulders/ rumble lanes, passing lanes, guardrails, drainage improvements, lighting, signal/intersection modifications, and sign/strip modifications, among others. CDOT has developed a comprehensive funding application request that considers the wide range of criteria and
potential solutions. PACOG and Pueblo County lie in CDOT’s Region 2 with 13 other Colorado counties, located in the southeast sector of the state, and thus collaborate on applications for FASTER funding with sister agencies and entities.
A quarterly reconciliation report is also provided to the FHWA, FTA, and MPOs following the cycle shown in Table 9.1.
Table 9.1: Cycle for STIP Changes
STIP Phase/Type of Change Timeframe Actions
STIP Annual Cycle July to June The 4-Year STIP goes into effect in July. STIP amendments can be processed throughout the year that the STIP is in effect.
STIP Amendments Monthly Amendments to the STIP can be made throughout the year pursuant to funding source/project type restrictions and requirements.
Changes to Add Another Year October to April The process of developing a new 4-Year STIP (with an additional year) begins in October.
Adoption of STIP May The new 4-Year STIP is adopted in May.
Federal Agency Approval June The new 4-Year STIP goes into effect in July.
Source: Data from CDOT Regional Planning Manager, email communication, January 21, 2021.
Figure 9.2: How a Safety Issue Becomes a Project Source: CDOT, FASTER Safety Mitigation Program Guidelines and Application, 2014. Please note the 2014 guidelines are currently unavailable; an update is pending release in 2021.
Region HQ Region
ID Candidate Programs
Prepare Applications
Technical Evaluation
Regional Project Lists
Project Prioritization
Project Implementation
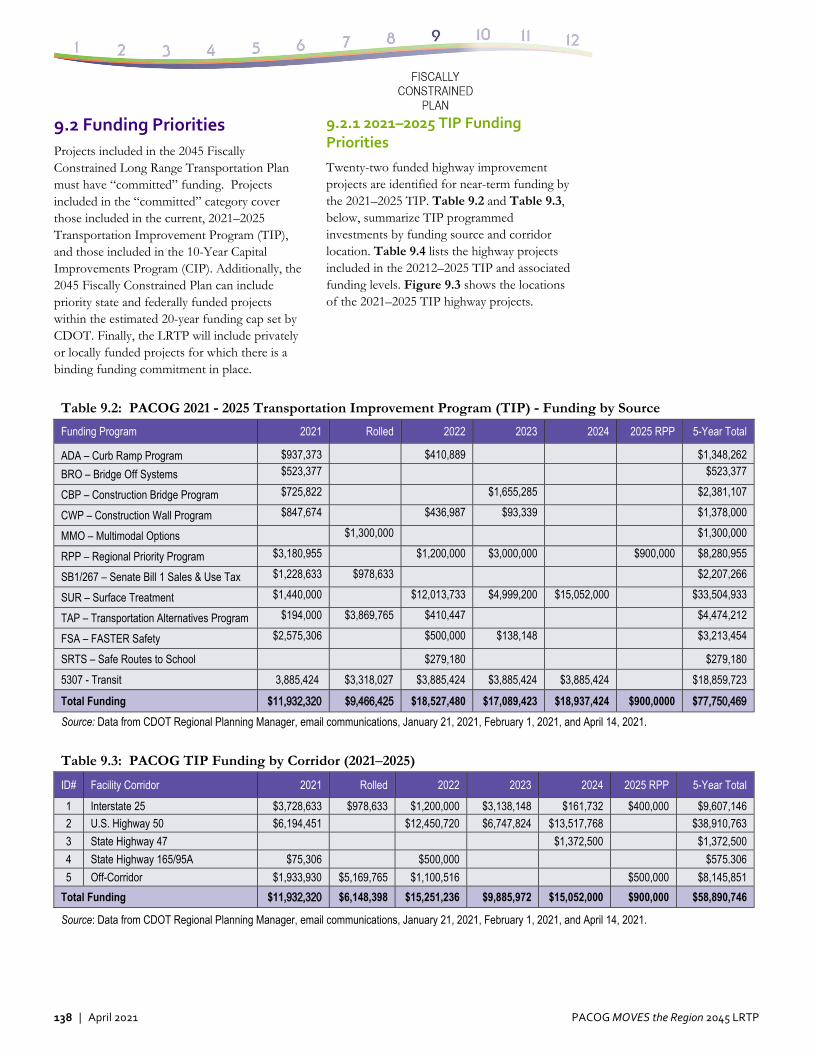
138 | April 2021 PACOG MOVES the Region 2045 LRTP
9.2 Funding Priorities
Projects included in the 2045 Fiscally Constrained Long Range Transportation Plan must have “committed” funding. Projects included in the “committed” category cover those included in the current, 2021–2025 Transportation Improvement Program (TIP), and those included in the 10-Year Capital Improvements Program (CIP). Additionally, the 2045 Fiscally Constrained Plan can include priority state and federally funded projects within the estimated 20-year funding cap set by CDOT. Finally, the LRTP will include privately or locally funded projects for which there is a binding funding commitment in place.
9.2.1 2021–2025 TIP Funding Priorities
Twenty-two funded highway improvement projects are identified for near-term funding by the 2021–2025 TIP. Table 9.2 and Table 9.3, below, summarize TIP programmed investments by funding source and corridor location. Table 9.4 lists the highway projects included in the 20212–2025 TIP and associated funding levels. Figure 9.3 shows the locations of the 2021–2025 TIP highway projects.
Table 9.3: PACOG TIP Funding by Corridor (2021–2025)
ID# Facility Corridor 2021 Rolled 2022 2023 2024 2025 RPP 5-Year Total
1 Interstate 25 $3,728,633 $978,633 $1,200,000 $3,138,148 $161,732 $400,000 $9,607,146
2 U.S. Highway 50 $6,194,451 $12,450,720 $6,747,824 $13,517,768 $38,910,763
3 State Highway 47 $1,372,500 $1,372,500
4 State Highway 165/95A $75,306 $500,000 $575.306
5 Off-Corridor $1,933,930 $5,169,765 $1,100,516 $500,000 $8,145,851
Total Funding $11,932,320 $6,148,398 $15,251,236 $9,885,972 $15,052,000 $900,000 $58,890,746
Source: Data from CDOT Regional Planning Manager, email communications, January 21, 2021, February 1, 2021, and April 14, 2021.
Table 9.2: PACOG 2021 ‐ 2025 Transportation Improvement Program (TIP) ‐ Funding by Source
Funding Program 2021 Rolled 2022 2023 2024 2025 RPP 5-Year Total
ADA – Curb Ramp Program $937,373 $410,889 $1,348,262
BRO – Bridge Off Systems $523,377 $523,377
CBP – Construction Bridge Program $725,822 $1,655,285 $2,381,107
CWP – Construction Wall Program $847,674 $436,987 $93,339 $1,378,000
MMO – Multimodal Options $1,300,000 $1,300,000
RPP – Regional Priority Program $3,180,955 $1,200,000 $3,000,000 $900,000 $8,280,955
SB1/267 – Senate Bill 1 Sales & Use Tax $1,228,633 $978,633 $2,207,266
SUR – Surface Treatment $1,440,000 $12,013,733 $4,999,200 $15,052,000 $33,504,933
TAP – Transportation Alternatives Program $194,000 $3,869,765 $410,447 $4,474,212
FSA – FASTER Safety $2,575,306 $500,000 $138,148 $3,213,454
SRTS – Safe Routes to School $279,180 $279,180
5307 - Transit 3,885,424 $3,318,027 $3,885,424 $3,885,424 $3,885,424 $18,859,723
Total Funding $11,932,320 $9,466,425 $18,527,480 $17,089,423 $18,937,424 $900,0000 $77,750,469
Source: Data from CDOT Regional Planning Manager, email communications, January 21, 2021, February 1, 2021, and April 14, 2021.
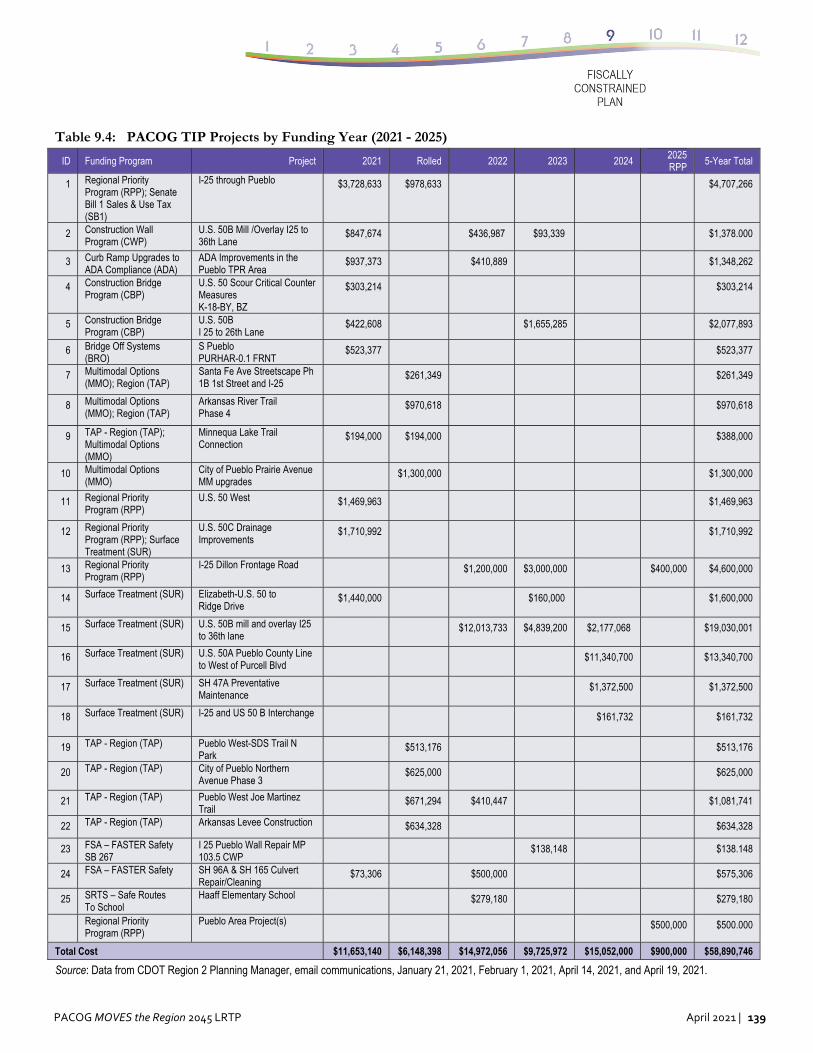
PACOG MOVES the Region 2045 LRTP April 2021 | 139
Table 9.4: PACOG TIP Projects by Funding Year (2021 ‐ 2025)
ID Funding Program Project 2021 Rolled 2022 2023 2024 2025 RPP
5-Year Total
1 Regional Priority Program (RPP); Senate Bill 1 Sales & Use Tax (SB1)
I-25 through Pueblo $3,728,633 $978,633 $4,707,266
2 Construction Wall Program (CWP)
U.S. 50B Mill /Overlay I25 to 36th Lane
$847,674 $436,987 $93,339 $1,378.000
3 Curb Ramp Upgrades to ADA Compliance (ADA)
ADA Improvements in the Pueblo TPR Area
$937,373 $410,889 $1,348,262
4 Construction Bridge Program (CBP)
U.S. 50 Scour Critical Counter Measures K-18-BY, BZ
$303,214 $303,214
5 Construction Bridge Program (CBP)
U.S. 50B I 25 to 26th Lane
$422,608 $1,655,285 $2,077,893
6 Bridge Off Systems (BRO)
S Pueblo PURHAR-0.1 FRNT
$523,377 $523,377
7 Multimodal Options (MMO); Region (TAP)
Santa Fe Ave Streetscape Ph 1B 1st Street and I-25
$261,349 $261,349
8 Multimodal Options (MMO); Region (TAP)
Arkansas River Trail Phase 4
$970,618 $970,618
9 TAP - Region (TAP); Multimodal Options (MMO)
Minnequa Lake Trail Connection
$194,000 $194,000 $388,000
10 Multimodal Options (MMO)
City of Pueblo Prairie Avenue MM upgrades
$1,300,000 $1,300,000
11 Regional Priority Program (RPP)
U.S. 50 West $1,469,963 $1,469,963
12 Regional Priority Program (RPP); Surface Treatment (SUR)
U.S. 50C Drainage Improvements
$1,710,992 $1,710,992
13 Regional Priority Program (RPP)
I-25 Dillon Frontage Road $1,200,000 $3,000,000 $400,000 $4,600,000
14 Surface Treatment (SUR) Elizabeth-U.S. 50 to Ridge Drive
$1,440,000 $160,000 $1,600,000
15 Surface Treatment (SUR) U.S. 50B mill and overlay I25 to 36th lane
$12,013,733 $4,839,200 $2,177,068 $19,030,001
16 Surface Treatment (SUR) U.S. 50A Pueblo County Line to West of Purcell Blvd
$11,340,700 $13,340,700
17 Surface Treatment (SUR) SH 47A Preventative Maintenance
$1,372,500 $1,372,500
18 Surface Treatment (SUR) I-25 and US 50 B Interchange $161,732 $161,732
19 TAP - Region (TAP) Pueblo West-SDS Trail N Park
$513,176 $513,176
20 TAP - Region (TAP) City of Pueblo Northern Avenue Phase 3
$625,000 $625,000
21 TAP - Region (TAP) Pueblo West Joe Martinez Trail
$671,294 $410,447 $1,081,741
22 TAP - Region (TAP) Arkansas Levee Construction $634,328 $634,328
23 FSA – FASTER Safety SB 267
I 25 Pueblo Wall Repair MP 103.5 CWP
$138,148 $138.148
24 FSA – FASTER Safety SH 96A & SH 165 Culvert Repair/Cleaning
$73,306 $500,000 $575,306
25 SRTS – Safe Routes To School
Haaff Elementary School $279,180 $279,180
Regional Priority Program (RPP)
Pueblo Area Project(s) $500,000 $500.000
Total Cost $11,653,140 $6,148,398 $14,972,056 $9,725,972 $15,052,000 $900,000 $58,890,746
Source: Data from CDOT Region 2 Planning Manager, email communications, January 21, 2021, February 1, 2021, April 14, 2021, and April 19, 2021.
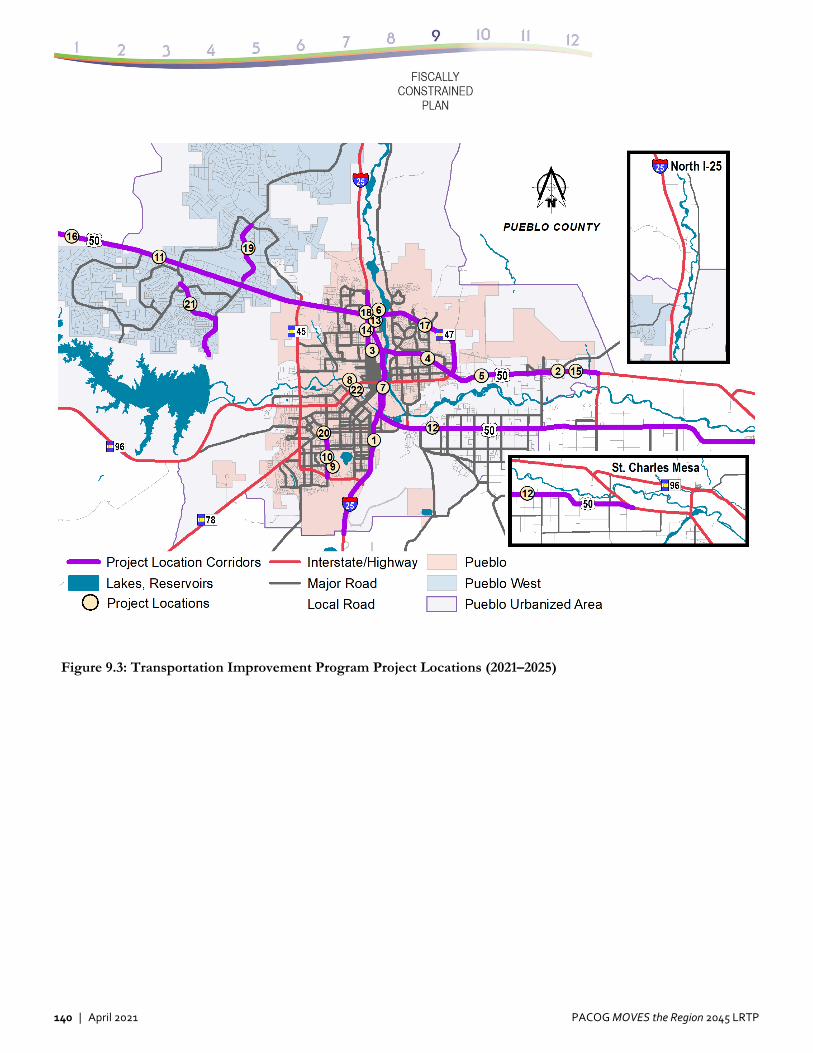
140 | April 2021 PACOG MOVES the Region 2045 LRTP
Figure 9.3: Transportation Improvement Program Project Locations (2021–2025)
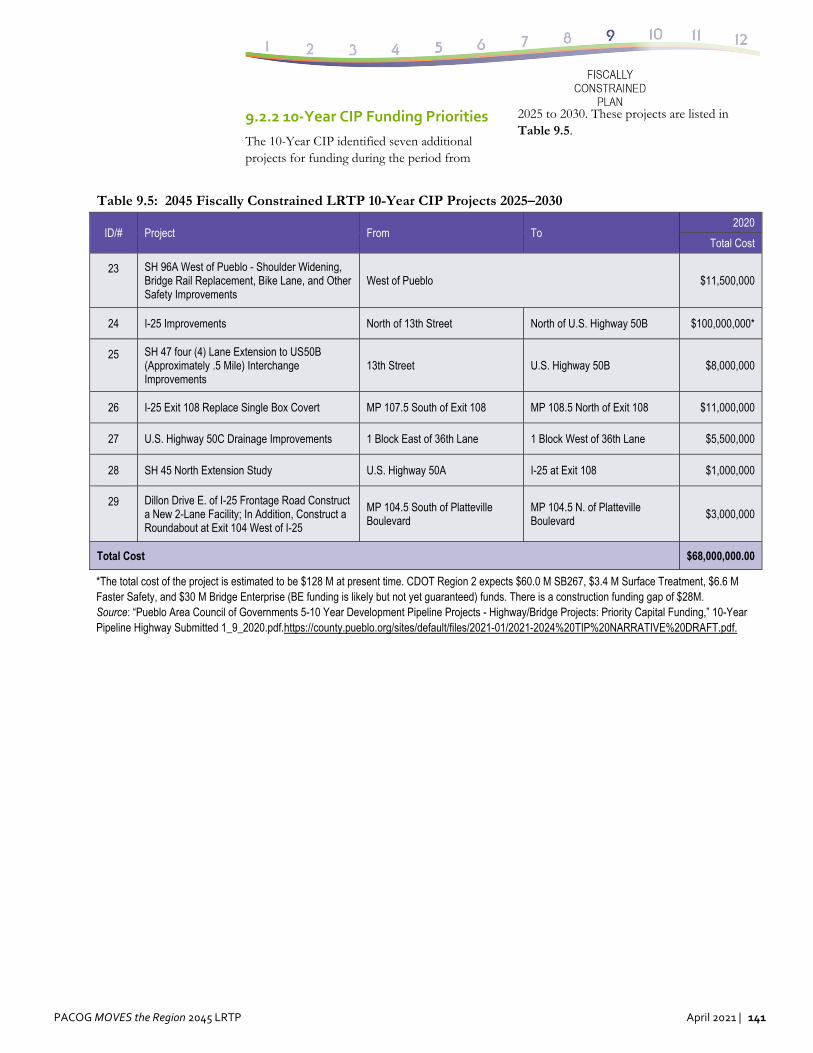
PACOG MOVES the Region 2045 LRTP April 2021 | 141
9.2.2 10‐Year CIP Funding Priorities
The 10-Year CIP identified seven additional projects for funding during the period from
2025 to 2030. These projects are listed in Table 9.5.
Table 9.5: 2045 Fiscally Constrained LRTP 10-Year CIP Projects 2025–2030
ID/# Project From To 2020
Total Cost
23 SH 96A West of Pueblo - Shoulder Widening, Bridge Rail Replacement, Bike Lane, and Other Safety Improvements
West of Pueblo $11,500,000
24 I-25 Improvements North of 13th Street North of U.S. Highway 50B $100,000,000*
25 SH 47 four (4) Lane Extension to US50B (Approximately .5 Mile) Interchange Improvements
13th Street U.S. Highway 50B $8,000,000
26 I-25 Exit 108 Replace Single Box Covert MP 107.5 South of Exit 108 MP 108.5 North of Exit 108 $11,000,000
27 U.S. Highway 50C Drainage Improvements 1 Block East of 36th Lane 1 Block West of 36th Lane $5,500,000
28 SH 45 North Extension Study U.S. Highway 50A I-25 at Exit 108 $1,000,000
29 Dillon Drive E. of I-25 Frontage Road Construct a New 2-Lane Facility; In Addition, Construct a Roundabout at Exit 104 West of I-25
MP 104.5 South of Platteville Boulevard
MP 104.5 N. of Platteville Boulevard
$3,000,000
Total Cost $68,000,000.00
*The total cost of the project is estimated to be $128 M at present time. CDOT Region 2 expects $60.0 M SB267, $3.4 M Surface Treatment, $6.6 M Faster Safety, and $30 M Bridge Enterprise (BE funding is likely but not yet guaranteed) funds. There is a construction funding gap of $28M. Source: “Pueblo Area Council of Governments 5-10 Year Development Pipeline Projects - Highway/Bridge Projects: Priority Capital Funding,” 10-Year Pipeline Highway Submitted 1_9_2020.pdf.https://county.pueblo.org/sites/default/files/2021-01/2021-2024%20TIP%20NARRATIVE%20DRAFT.pdf.
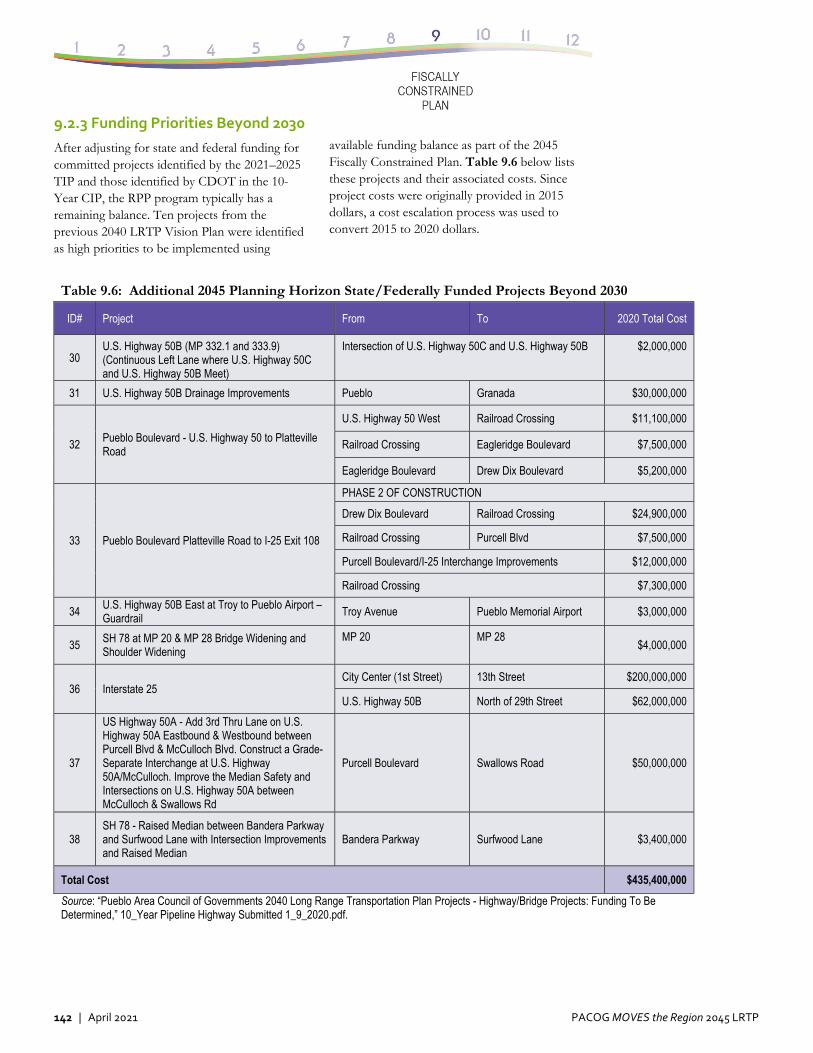
142 | April 2021 PACOG MOVES the Region 2045 LRTP
9.2.3 Funding Priorities Beyond 2030
After adjusting for state and federal funding for committed projects identified by the 2021–2025 TIP and those identified by CDOT in the 10-Year CIP, the RPP program typically has a remaining balance. Ten projects from the previous 2040 LRTP Vision Plan were identified as high priorities to be implemented using
available funding balance as part of the 2045 Fiscally Constrained Plan. Table 9.6 below lists these projects and their associated costs. Since project costs were originally provided in 2015 dollars, a cost escalation process was used to convert 2015 to 2020 dollars.
Table 9.6: Additional 2045 Planning Horizon State/Federally Funded Projects Beyond 2030
ID# Project From To 2020 Total Cost
30 U.S. Highway 50B (MP 332.1 and 333.9) (Continuous Left Lane where U.S. Highway 50C and U.S. Highway 50B Meet)
Intersection of U.S. Highway 50C and U.S. Highway 50B $2,000,000
31 U.S. Highway 50B Drainage Improvements Pueblo Granada $30,000,000
32 Pueblo Boulevard - U.S. Highway 50 to Platteville Road
U.S. Highway 50 West Railroad Crossing $11,100,000
Railroad Crossing Eagleridge Boulevard $7,500,000
Eagleridge Boulevard Drew Dix Boulevard $5,200,000
33 Pueblo Boulevard Platteville Road to I-25 Exit 108
PHASE 2 OF CONSTRUCTION
Drew Dix Boulevard Railroad Crossing $24,900,000
Railroad Crossing Purcell Blvd $7,500,000
Purcell Boulevard/I-25 Interchange Improvements $12,000,000
Railroad Crossing $7,300,000
34 U.S. Highway 50B East at Troy to Pueblo Airport – Guardrail
Troy Avenue Pueblo Memorial Airport $3,000,000
35 SH 78 at MP 20 & MP 28 Bridge Widening and Shoulder Widening
MP 20 MP 28 $4,000,000
36 Interstate 25 City Center (1st Street) 13th Street $200,000,000
U.S. Highway 50B North of 29th Street $62,000,000
37
US Highway 50A - Add 3rd Thru Lane on U.S. Highway 50A Eastbound & Westbound between Purcell Blvd & McCulloch Blvd. Construct a Grade-Separate Interchange at U.S. Highway 50A/McCulloch. Improve the Median Safety and Intersections on U.S. Highway 50A between McCulloch & Swallows Rd
Purcell Boulevard Swallows Road $50,000,000
38 SH 78 - Raised Median between Bandera Parkway and Surfwood Lane with Intersection Improvements and Raised Median
Bandera Parkway Surfwood Lane $3,400,000
Total Cost $435,400,000
Source: “Pueblo Area Council of Governments 2040 Long Range Transportation Plan Projects - Highway/Bridge Projects: Funding To Be Determined,” 10_Year Pipeline Highway Submitted 1_9_2020.pdf.
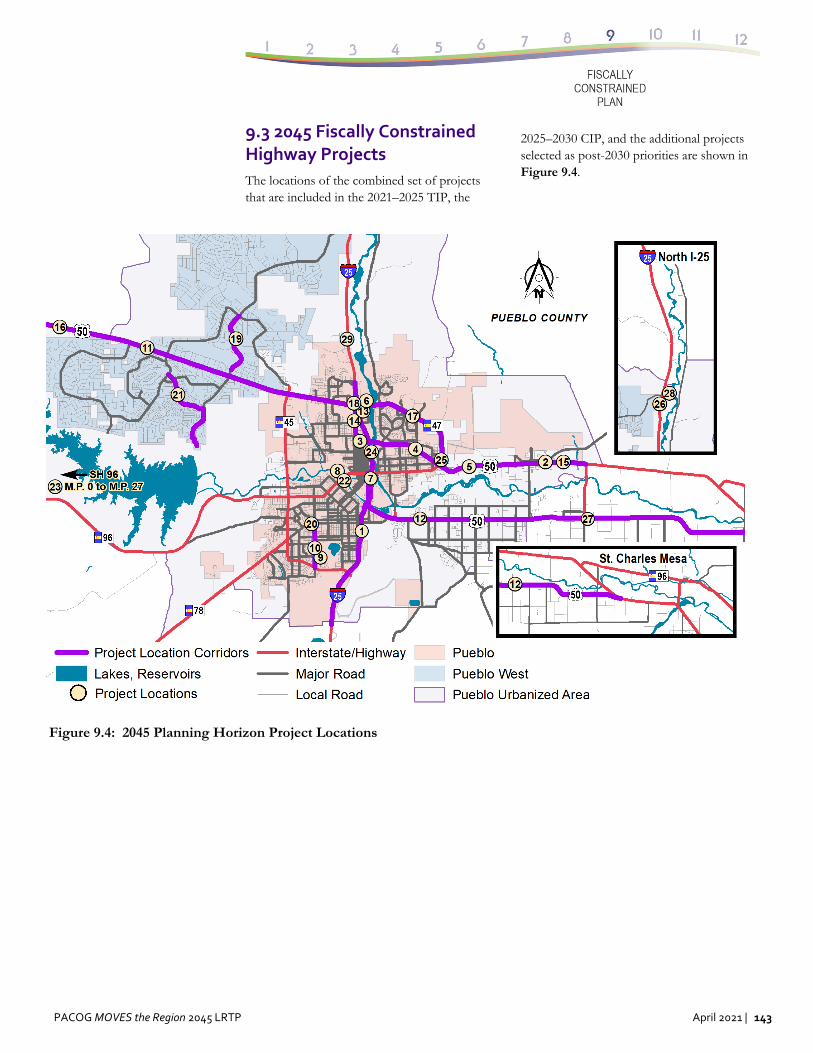
PACOG MOVES the Region 2045 LRTP April 2021 | 143
9.3 2045 Fiscally Constrained Highway Projects
The locations of the combined set of projects that are included in the 2021–2025 TIP, the
2025–2030 CIP, and the additional projects selected as post-2030 priorities are shown in Figure 9.4.
Figure 9.4: 2045 Planning Horizon Project Locations
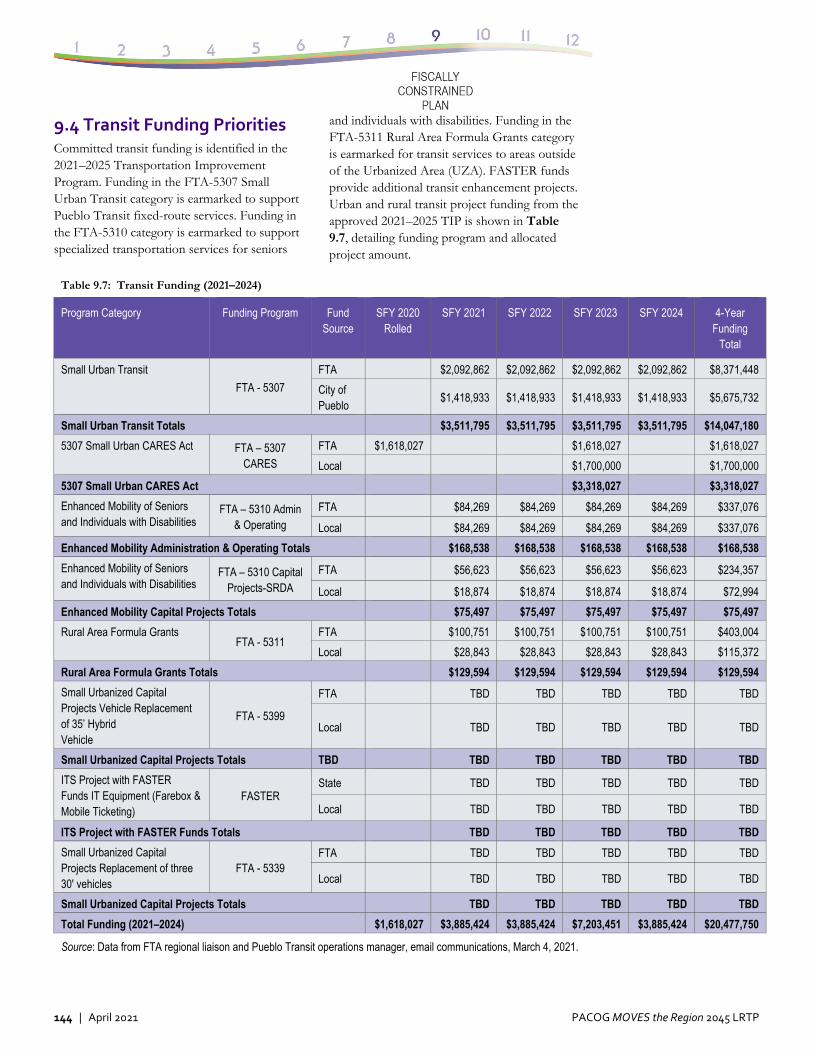
144 | April 2021 PACOG MOVES the Region 2045 LRTP
9.4 Transit Funding Priorities Committed transit funding is identified in the 2021–2025 Transportation Improvement Program. Funding in the FTA-5307 Small Urban Transit category is earmarked to support Pueblo Transit fixed-route services. Funding in the FTA-5310 category is earmarked to support specialized transportation services for seniors
and individuals with disabilities. Funding in the FTA-5311 Rural Area Formula Grants category is earmarked for transit services to areas outside of the Urbanized Area (UZA). FASTER funds provide additional transit enhancement projects. Urban and rural transit project funding from the approved 2021–2025 TIP is shown in Table 9.7, detailing funding program and allocated project amount.
Table 9.7: Transit Funding (2021–2024)
Program Category Funding Program Fund Source
SFY 2020 Rolled
SFY 2021 SFY 2022 SFY 2023 SFY 2024 4-Year Funding
Total
Small Urban Transit
FTA - 5307
FTA $2,092,862 $2,092,862 $2,092,862 $2,092,862 $8,371,448
City of Pueblo
$1,418,933 $1,418,933 $1,418,933 $1,418,933 $5,675,732
Small Urban Transit Totals $3,511,795 $3,511,795 $3,511,795 $3,511,795 $14,047,180
5307 Small Urban CARES Act FTA – 5307 CARES
FTA $1,618,027 $1,618,027 $1,618,027
Local $1,700,000 $1,700,000
5307 Small Urban CARES Act $3,318,027 $3,318,027
Enhanced Mobility of Seniors and Individuals with Disabilities
FTA – 5310 Admin & Operating
FTA $84,269 $84,269 $84,269 $84,269 $337,076
Local $84,269 $84,269 $84,269 $84,269 $337,076
Enhanced Mobility Administration & Operating Totals $168,538 $168,538 $168,538 $168,538 $168,538
Enhanced Mobility of Seniors and Individuals with Disabilities
FTA – 5310 Capital Projects-SRDA
FTA $56,623 $56,623 $56,623 $56,623 $234,357
Local $18,874 $18,874 $18,874 $18,874 $72,994
Enhanced Mobility Capital Projects Totals $75,497 $75,497 $75,497 $75,497 $75,497
Rural Area Formula Grants
FTA - 5311
FTA $100,751 $100,751 $100,751 $100,751 $403,004
Local $28,843 $28,843 $28,843 $28,843 $115,372
Rural Area Formula Grants Totals $129,594 $129,594 $129,594 $129,594 $129,594
Small Urbanized CapitaI Projects Vehicle Replacement of 35’ Hybrid Vehicle
FTA - 5399
FTA TBD TBD TBD TBD TBD
Local TBD TBD TBD TBD TBD
Small Urbanized CapitaI Projects Totals TBD TBD TBD TBD TBD TBD
ITS Project with FASTER Funds IT Equipment (Farebox & Mobile Ticketing)
FASTER State TBD TBD TBD TBD TBD
Local TBD TBD TBD TBD TBD
ITS Project with FASTER Funds Totals TBD TBD TBD TBD TBD
Small Urbanized Capital Projects Replacement of three 30′ vehicles
FTA - 5339 FTA TBD TBD TBD TBD TBD
Local TBD TBD TBD TBD TBD
Small Urbanized Capital Projects Totals TBD TBD TBD TBD TBD
Total Funding (2021–2024) $1,618,027 $3,885,424 $3,885,424 $7,203,451 $3,885,424 $20,477,750
Source: Data from FTA regional liaison and Pueblo Transit operations manager, email communications, March 4, 2021.
PACOG MOVES the Region 2045 LRTP April 2021 | 145
10.0 Congestion Management Process
10.1 Introduction
Financial considerations, constraints on capacity expansion, and increasing congestion nationally and in Pueblo County are causing concern for the Metropolitan Planning Organization (MPO)—Pueblo Area Council of Governments (PACOG)—and for the residents of the region. PACOG’s metropolitan transportation planning process has traditionally focused on constructing and maintaining new roadways and widening existing highways; however, current challenges associated with transportation system reliability, safety, and security require new methods targeted to improve the operations of the existing system.
Additionally, renewed interest in efficient freight movement means that delays affecting tightly scheduled manufacturing distribution procedures can affect the economic viability of a region. An example in the PACOG region is the need for safe and convenient access for trucks to I-25. There is also an increasing recognition locally of the impact of congestion beyond the need for capacity for trucks. There is growing understanding of the significance of road construction, weather conditions, traffic incidents, special events, and emergency situations on the reliability of the transportation system. It is estimated that about half of regional traffic congestion is caused by temporary disruptions that take away part of the roadway from use (“nonrecurring” congestion). Current challenges associated with transportation system reliability, safety, and security will require new strategies. These strategies are delivered by means of a Congestion Management System (CMS).
10.2 Background on Congestion Management
10.2.1 Definition
A CMS is an integrated approach to optimize the performance of existing infrastructure by
implementing multimodal, intermodal, and often cross-jurisdictional systems, services and projects. This effort includes regional operations collaboration and coordination activities among transportation and public safety agencies. CMS is not routine road maintenance such as resurfacing or guardrail replacement. CMS strategies improve system efficiency, enhance public safety and security, reduce traffic delays of road users, and improve access to information for travelers. The emphasis of CMS is an outcome-driven, performance-based system. CMS strategies include but are not limited to the following:
Traffic incident management Travel information services Roadway weather information
Freeway management Automatic vehicle location Traffic signal coordination Work zone management Electronic payment/toll collection Emergency response and homeland
security Freight management Transit fleet management and dispatching.
10.2.2 Interface with NEPA, the LRTP, & the TIP
The 2045 Long Range Transportation Plan (LRTP) must include congestion management planning, however, the effort is not intended to be viewed in isolation. In fact, a focus on improving transportation system management and operations can support other planning areas. For instance, congestion management strategies can:
Emphasize preservation of the existing transportation system by focusing resources on optimizing existing capacity rather than building new capacity.
Improve accessibility and mobility for all modes by implementing strategies that reduce recurring and nonrecurring congestion and improve the efficiency of operations such as: transit bus priority, signal timing, and, when the region is ready, pricing.
146 | April 2021 PACOG MOVES the Region 2045 LRTP
Support regional economic vitality by improving system reliability, which is valued by the freight and business communities.
Increase safety by focusing attention on operational strategies such as driver education, speed enforcement, and technologies to improve pedestrian safety.
Enhance regional environment, energy conservation, quality of life, and consistency with planned growth by implementing programs to manage travel demand, providing traveler information to help avoid and reduce time stuck in traffic delay, and avoiding the need to develop new transportation infrastructure with negative impacts to the environment and communities.
Increase security by improving communication and coordination between transportation agencies and law enforcement.
10.2.3 Objectives for Operations
Objectives related to congestion management are important to cite at the outset of this discussion. Regional operations objectives are specific, measurable statements of performance that describe the desired operations of the regional transportation system. They are specific, agreed-upon measures of system performance that are time-sensitive and can be tracked on a regional level over time. The objectives should relate to both recurring and nonrecurring congestion, access to traveler information, emergency response, and ease of movement across modes and jurisdictions. These measurable regional operations objectives focus attention on the performance of the transportation system and ensure that the CMS is integrated into the long-range transportation planning process. An increased focus on congestion management within the 2040 PACOG LRTP will not only fulfill Fixing America’s Surface Transportation (FAST) Act requirements but also address pressing issues facing the Pueblo region, such as congestion, air quality, safety, and security.
Lastly, regional collaboration is a key component of congestion management. The
two transportation facilities of focus in the region with serious congestion issues are I-25 and U.S. Highway 50. Both facilities are key corridors in Pueblo and have national significance. Developing effective operations objectives requires regional collaboration among the Colorado Department of Transportation (CDOT), Pueblo Transit Agency, Pueblo County, public safety officials, and PACOG and local entity transportation planners. It is in everyone’s interest to establish a framework useful to all in the region.
10.2.4 Congestion Management Process
Within the overall LRTP, there is a Congestion Management Process (CMP). The CMP is a systematic approach to identify the causes of congestion and develop solutions to address congestion problems. A CMP is utilized as part of the metropolitan planning process and includes:
Methods to monitor and evaluate the performance of the multimodal transportation system, identify the causes of congestion, identify and evaluate alternative actions, provide information supporting the implementation of actions, and evaluate the efficiency and effectiveness of implemented actions.
Definitions of the parameters for measuring the extent of congestion and for supporting the evaluation of the effectiveness of congestion reduction strategies for the movement of people and goods.
Establishment of a program for data collection to monitor system performance to define the extent and duration of congestion, to help determine the causes of congestion, and to evaluate the efficiency and effectiveness of implemented actions.
Identification and evaluation of the anticipated performance and expected benefits of appropriate traditional and nontraditional congestion management strategies.
PACOG MOVES the Region 2045 LRTP April 2021 | 147
Identification of an implementation schedule, implementation responsibilities, and possible funding sources for each strategy.
Implementation of a process for periodic assessment of the efficiency and effectiveness of implemented strategies, in terms of the area’s established performance measures.
Within the process, goals are quite naturally translated into tactics, that is, concrete steps or strategies that define the way forward. These strategies involve short-range actions and normally require a low level of capital investment. These types of actions resemble measures classified as traditional Transportation System Management (TSM) strategies. PACOG will utilize measures defined in the previous LRTP as well as those emerging through the renewed focus on freight and non-motorized modes of travel. The CMP will help PACOG:
Develop a definition of congestion. Identify congested locations. Determine the causes of recurring and
nonrecurring congestion.
Develop a menu of choices of strategies to mitigate congestion.
Evaluate the potential of different strategies.
Propose alternative strategies to address specific occurrences of congestion.
Develop performance measures to assess the effectiveness of implemented actions and evaluate the level of congestion of the system.
Establish a program for data collection to measure system performance.
Set priorities among projects for incorporation into the Transportation Improvement Program (TIP).
Restore natural ecosystems and wildlife habitat.
Keep agricultural lands productive and vibrant.
··················· 48 National Academy of Sciences, Transportation Research Board, HCM 2010: Highway Capacity Manual (Washington, DC: The National Academies Press, 2010).
Preserve a “greenbelt” of open space as a community separator and scenic corridor along Interstate 25 between Pueblo and Colorado Springs.
10.3 Definition of Congestion
One of the immediate first tasks of the CMP is determining how to measure congestion. Congestion is a relative rather than an absolute condition, and a uniform measurement cannot be used for all facilities and cities. In the Pueblo region, roadway congestion is defined by a volume to capacity (V/C) ratio of 1.00 or greater. This corresponds to a Level of Service (LOS) F for regionally significant roadways.
Facilities with LOS D and E are designated as “approaching congestion” and contain V/C ratios with a range of 0.71–0.99 V/CV/CV/C. Facilities with a LOS A–C can be described as generally “free-flow conditions” and are not considered congested. Some explanation of LOS is provided in the following section.
10.3.1 Levels of Service (Road Capacity)
The actual capacity of a given road cannot realistically be expressed in an absolute number such as 2,400 vehicles per lane per hour. The traffic stream is not uniform with regard to either weather conditions or driver behavior. The presence of friction from traffic entering or leaving a highway also impacts the through-put of traffic, as does operating speed, number of lanes, width of lanes, shoulder width, sight distance, horizontal (left or right) curvature, and vertical curvature (up and down, or grade) of the road.
What is typically used to measure capacity deficiency is the assignment of LOS to traffic operations under various traffic flow conditions.48 LOS measures the restrictive relationship between traffic speed, volume, and density and provides an index to the quality of traffic flow in terms of travel time, freedom to maneuver, traffic interruptions, comfort,
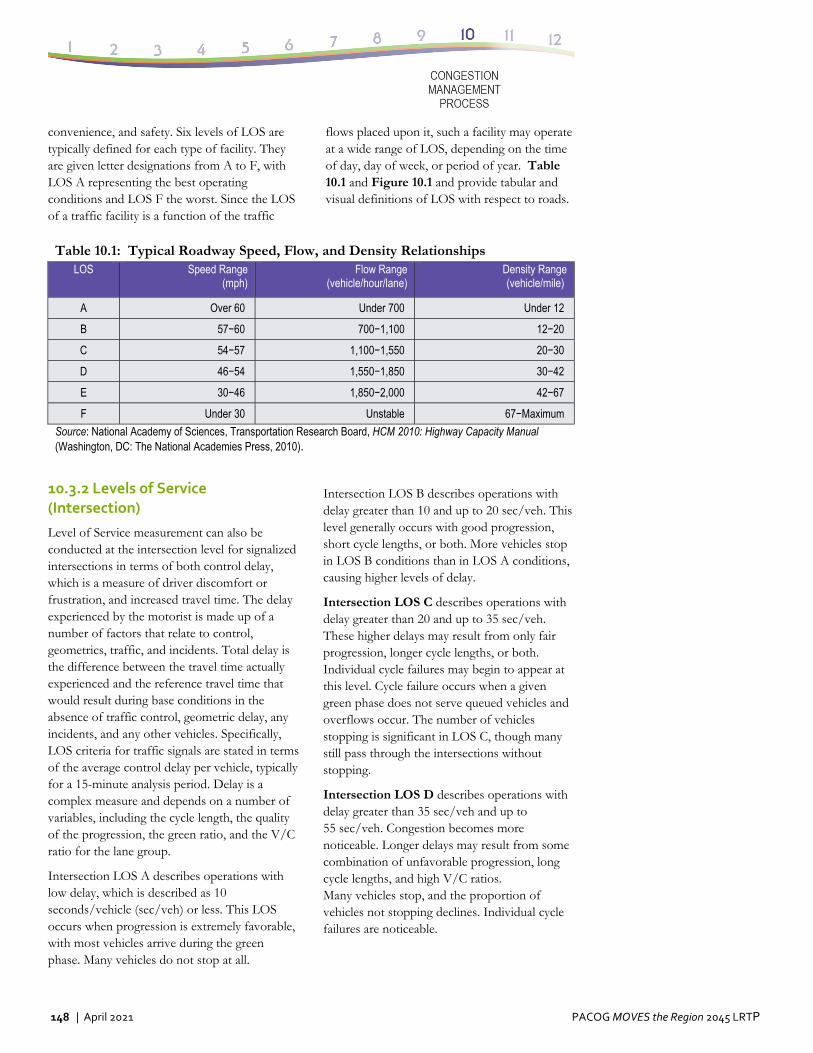
148 | April 2021 PACOG MOVES the Region 2045 LRTP
convenience, and safety. Six levels of LOS are typically defined for each type of facility. They are given letter designations from A to F, with LOS A representing the best operating conditions and LOS F the worst. Since the LOS of a traffic facility is a function of the traffic
flows placed upon it, such a facility may operate at a wide range of LOS, depending on the time of day, day of week, or period of year. Table 10.1 and Figure 10.1 and provide tabular and visual definitions of LOS with respect to roads.
Table 10.1: Typical Roadway Speed, Flow, and Density Relationships LOS Speed Range
(mph) Flow Range
(vehicle/hour/lane) Density Range (vehicle/mile)
A Over 60 Under 700 Under 12
B 57−60 700−1,100 12−20
C 54−57 1,100−1,550 20−30
D 46−54 1,550−1,850 30−42
E 30−46 1,850−2,000 42−67
F Under 30 Unstable 67−Maximum
Source: National Academy of Sciences, Transportation Research Board, HCM 2010: Highway Capacity Manual (Washington, DC: The National Academies Press, 2010).
10.3.2 Levels of Service (Intersection)
Level of Service measurement can also be conducted at the intersection level for signalized intersections in terms of both control delay, which is a measure of driver discomfort or frustration, and increased travel time. The delay experienced by the motorist is made up of a number of factors that relate to control, geometrics, traffic, and incidents. Total delay is the difference between the travel time actually experienced and the reference travel time that would result during base conditions in the absence of traffic control, geometric delay, any incidents, and any other vehicles. Specifically, LOS criteria for traffic signals are stated in terms of the average control delay per vehicle, typically for a 15-minute analysis period. Delay is a complex measure and depends on a number of variables, including the cycle length, the quality of the progression, the green ratio, and the V/C ratio for the lane group.
Intersection LOS A describes operations with low delay, which is described as 10 seconds/vehicle (sec/veh) or less. This LOS occurs when progression is extremely favorable, with most vehicles arrive during the green phase. Many vehicles do not stop at all.
Intersection LOS B describes operations with delay greater than 10 and up to 20 sec/veh. This level generally occurs with good progression, short cycle lengths, or both. More vehicles stop in LOS B conditions than in LOS A conditions, causing higher levels of delay.
Intersection LOS C describes operations with delay greater than 20 and up to 35 sec/veh. These higher delays may result from only fair progression, longer cycle lengths, or both. Individual cycle failures may begin to appear at this level. Cycle failure occurs when a given green phase does not serve queued vehicles and overflows occur. The number of vehicles stopping is significant in LOS C, though many still pass through the intersections without stopping.
Intersection LOS D describes operations with delay greater than 35 sec/veh and up to 55 sec/veh. Congestion becomes more noticeable. Longer delays may result from some combination of unfavorable progression, long cycle lengths, and high V/C ratios. Many vehicles stop, and the proportion of vehicles not stopping declines. Individual cycle failures are noticeable.
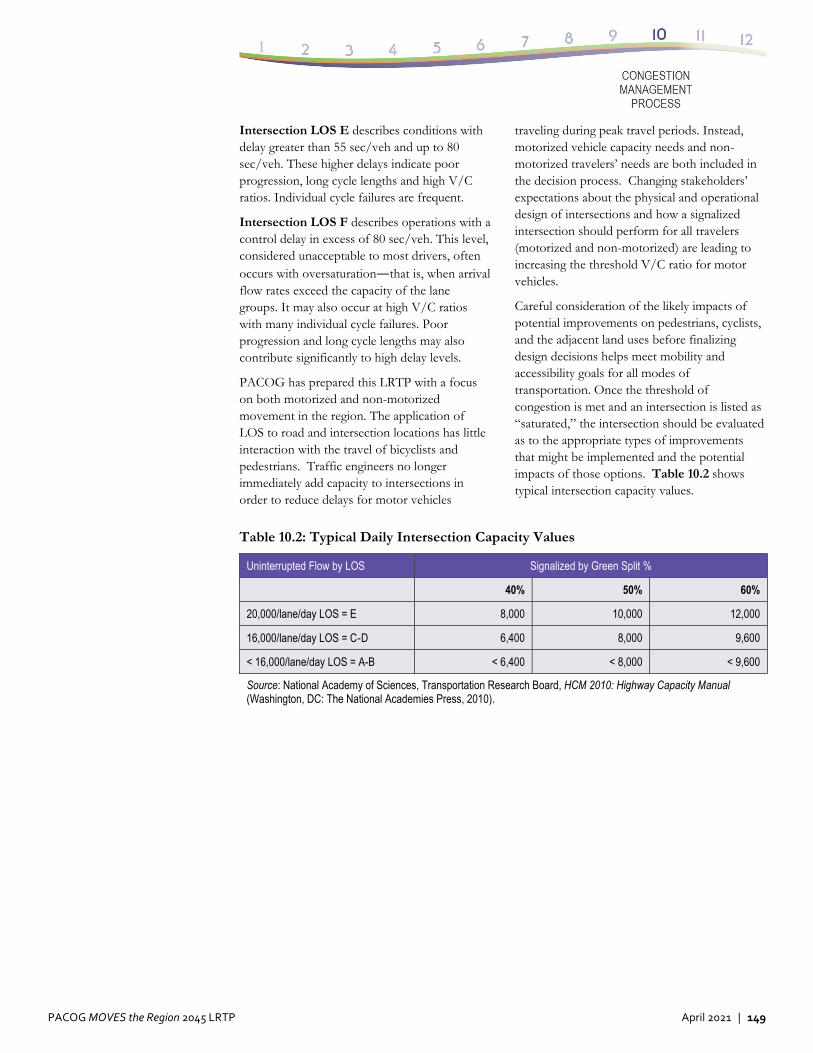
PACOG MOVES the Region 2045 LRTP April 2021 | 149
Intersection LOS E describes conditions with delay greater than 55 sec/veh and up to 80 sec/veh. These higher delays indicate poor progression, long cycle lengths and high V/C ratios. Individual cycle failures are frequent.
Intersection LOS F describes operations with a control delay in excess of 80 sec/veh. This level, considered unacceptable to most drivers, often occurs with oversaturation—that is, when arrival flow rates exceed the capacity of the lane groups. It may also occur at high V/C ratios with many individual cycle failures. Poor progression and long cycle lengths may also contribute significantly to high delay levels.
PACOG has prepared this LRTP with a focus on both motorized and non-motorized movement in the region. The application of LOS to road and intersection locations has little interaction with the travel of bicyclists and pedestrians. Traffic engineers no longer immediately add capacity to intersections in order to reduce delays for motor vehicles
traveling during peak travel periods. Instead, motorized vehicle capacity needs and non-motorized travelers’ needs are both included in the decision process. Changing stakeholders’ expectations about the physical and operational design of intersections and how a signalized intersection should perform for all travelers (motorized and non-motorized) are leading to increasing the threshold V/C ratio for motor vehicles.
Careful consideration of the likely impacts of potential improvements on pedestrians, cyclists, and the adjacent land uses before finalizing design decisions helps meet mobility and accessibility goals for all modes of transportation. Once the threshold of congestion is met and an intersection is listed as “saturated,” the intersection should be evaluated as to the appropriate types of improvements that might be implemented and the potential impacts of those options. Table 10.2 shows typical intersection capacity values.
Table 10.2: Typical Daily Intersection Capacity Values
Uninterrupted Flow by LOS Signalized by Green Split %
40% 50% 60%
20,000/lane/day LOS = E 8,000 10,000 12,000
16,000/lane/day LOS = C-D 6,400 8,000 9,600
< 16,000/lane/day LOS = A-B < 6,400 < 8,000 < 9,600
Source: National Academy of Sciences, Transportation Research Board, HCM 2010: Highway Capacity Manual (Washington, DC: The National Academies Press, 2010).
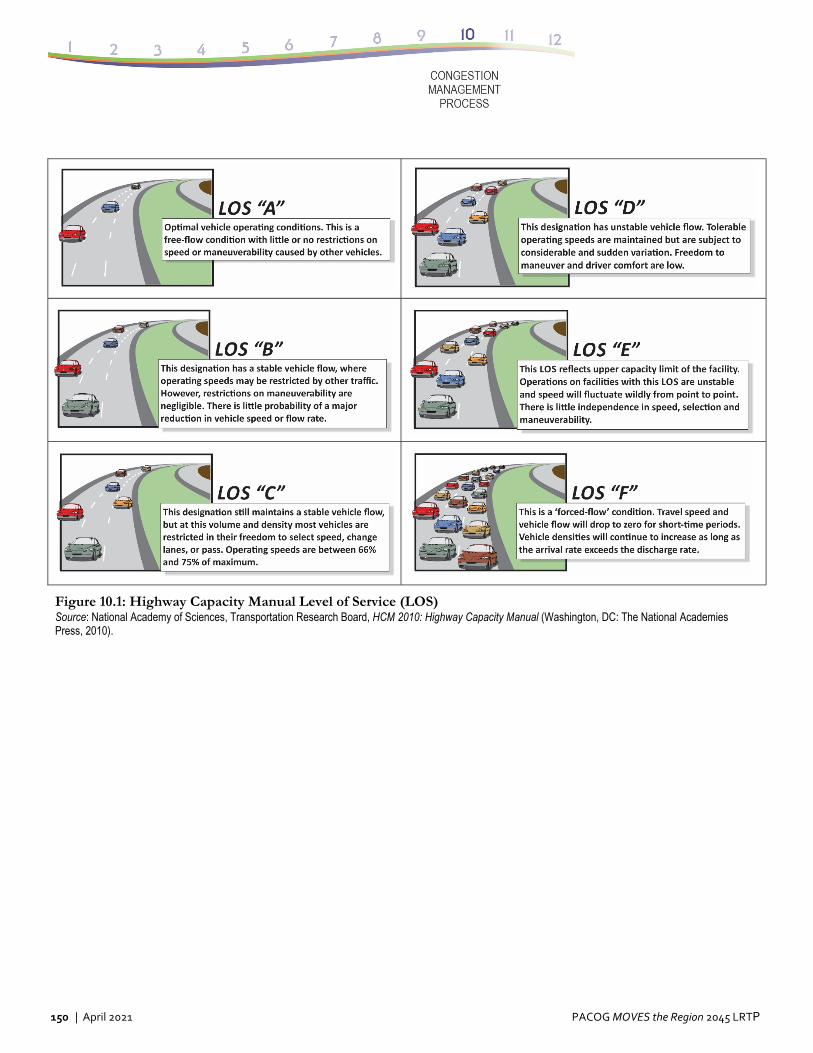
150 | April 2021 PACOG MOVES the Region 2045 LRTP
Figure 10.1: Highway Capacity Manual Level of Service (LOS) Source: National Academy of Sciences, Transportation Research Board, HCM 2010: Highway Capacity Manual (Washington, DC: The National Academies Press, 2010).
PACOG MOVES the Region 2045 LRTP April 2021 | 151
10.4 CMP Goals and Strategies
The goals of the PACOG region related to operations and their identified measurements are to:
Reduce total congested vehicle miles/hours of travel in the region.
Optimize the function of existing facilities through Intelligent Transportation Systems (ITS) and surface condition improvements (measured by speed).
10.4.1 CMP Data Collection
Given these performance measures related to congestion, observed data is needed to establish a baseline and to evaluate the impact that the chosen strategies are having on the system. Classified vehicle counts and transit ridership are examples of routinely collected data. However, travel times and length of congested periods are more challenging to collect and analyze. Congestion in the Pueblo region exists; the challenge is how to measure it. The MPO has available a newly calibrated 2020 and 2045 travel demand model, which can provide future traffic volumes and areas where congestion is expected to occur.
The PACOG 2045 LRTP is built on this travel demand model that describes the region, its socioeconomic/demographic patterns, its travel patterns, and its transportation system, both currently and in the future. While this usually means that vehicular volumes are growing, growth rates can vary by location and time of day. To monitor the performance of the system, data such as vehicular counts must be collected for roadway links represented in the regional modeling system. Basic data that was needed and collected included:
Traffic Counts – Needed to monitor the changes in vehicular volume over time and to recalibrate the PACOG travel model in the next cycle. Counts are taken at locations around the PACOG region and compared to the modeled vehicular volumes for all links to determine if the modeled volumes are reasonable. The collection of traffic data is organized and
standardized. CDOT counts are integrated with any city, county, and/or MPO count collection data.
Travel Speed – Actual vehicular travel speeds may be sampled along the major corridors in the county. This data can then be used to calibrate the model in the next cycle. Continuous collection of speed data allows comparison between scenario years to capture improvements in mobility, for example, if I-25 is widened.
In general, travel time data are collected through two types of techniques:
Roadside techniques utilizing detecting devices (radar/laser) physically located along study routes that obtain travel time data from vehicles traversing the route at predefined checkpoints.
Vehicle techniques utilizing detection devices carried inside the vehicle—these range from traditional stopwatch and clipboard techniques to use of distance measuring instruments and Global Positioning System (GPS) techniques).
Definitions of performance measures for management and operations that are relevant to the CMP include:
Travel Time – Travel time measures focus on the time needed to travel along a selected portion of the transportation system and can be applied for specific roadways, corridors, and transit lines or at a regional level. Common travel time metrics include:
Average travel time, which can be measured based on travel time surveys.
Average travel speeds, which can be calculated based on travel time divided by segment length or measured based on real-time information collection.
Travel time index: the ratio of peak to non-peak travel time, which provides a measure of congestion.
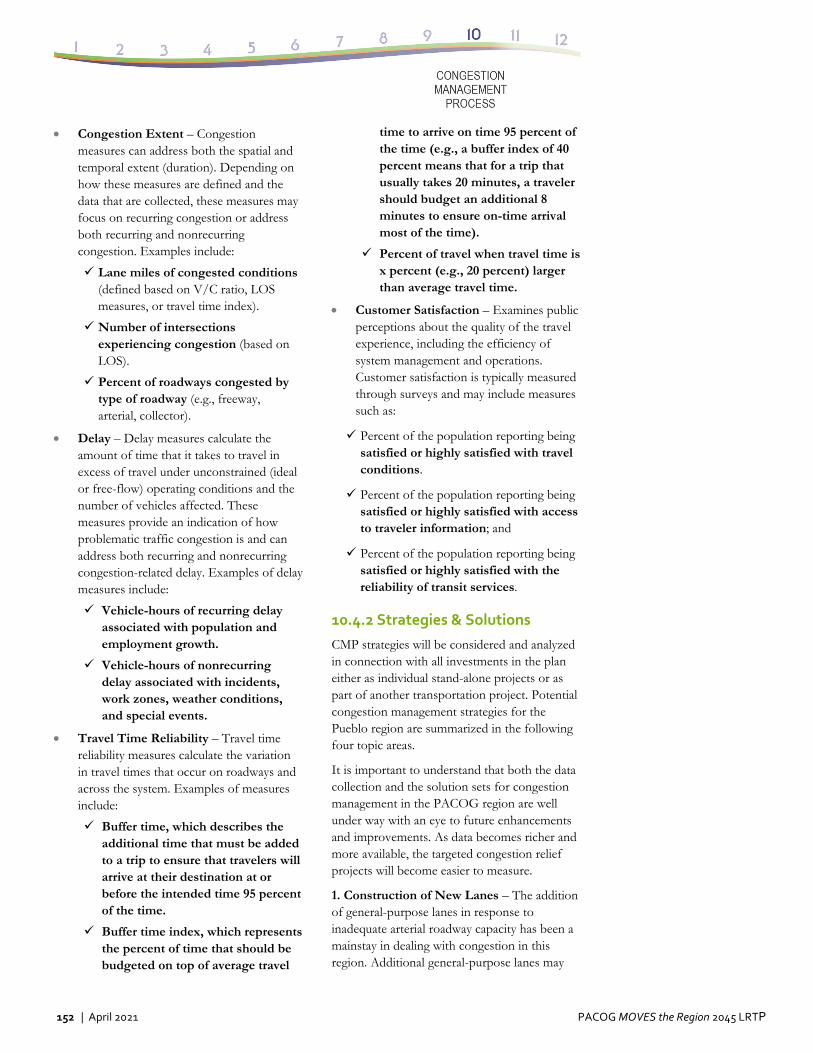
152 | April 2021 PACOG MOVES the Region 2045 LRTP
Congestion Extent – Congestion measures can address both the spatial and temporal extent (duration). Depending on how these measures are defined and the data that are collected, these measures may focus on recurring congestion or address both recurring and nonrecurring congestion. Examples include:
Lane miles of congested conditions (defined based on V/C ratio, LOS measures, or travel time index).
Number of intersections experiencing congestion (based on LOS).
Percent of roadways congested by type of roadway (e.g., freeway, arterial, collector).
Delay – Delay measures calculate the amount of time that it takes to travel in excess of travel under unconstrained (ideal or free-flow) operating conditions and the number of vehicles affected. These measures provide an indication of how problematic traffic congestion is and can address both recurring and nonrecurring congestion-related delay. Examples of delay measures include:
Vehicle-hours of recurring delay associated with population and employment growth.
Vehicle-hours of nonrecurring delay associated with incidents, work zones, weather conditions, and special events.
Travel Time Reliability – Travel time reliability measures calculate the variation in travel times that occur on roadways and across the system. Examples of measures include:
Buffer time, which describes the additional time that must be added to a trip to ensure that travelers will arrive at their destination at or before the intended time 95 percent of the time.
Buffer time index, which represents the percent of time that should be budgeted on top of average travel
time to arrive on time 95 percent of the time (e.g., a buffer index of 40 percent means that for a trip that usually takes 20 minutes, a traveler should budget an additional 8 minutes to ensure on-time arrival most of the time).
Percent of travel when travel time is x percent (e.g., 20 percent) larger than average travel time.
Customer Satisfaction – Examines public perceptions about the quality of the travel experience, including the efficiency of system management and operations. Customer satisfaction is typically measured through surveys and may include measures such as:
Percent of the population reporting being satisfied or highly satisfied with travel conditions.
Percent of the population reporting being satisfied or highly satisfied with access to traveler information; and
Percent of the population reporting being satisfied or highly satisfied with the reliability of transit services.
10.4.2 Strategies & Solutions
CMP strategies will be considered and analyzed in connection with all investments in the plan either as individual stand-alone projects or as part of another transportation project. Potential congestion management strategies for the Pueblo region are summarized in the following four topic areas.
It is important to understand that both the data collection and the solution sets for congestion management in the PACOG region are well under way with an eye to future enhancements and improvements. As data becomes richer and more available, the targeted congestion relief projects will become easier to measure.
1. Construction of New Lanes – The addition of general-purpose lanes in response to inadequate arterial roadway capacity has been a mainstay in dealing with congestion in this region. Additional general-purpose lanes may
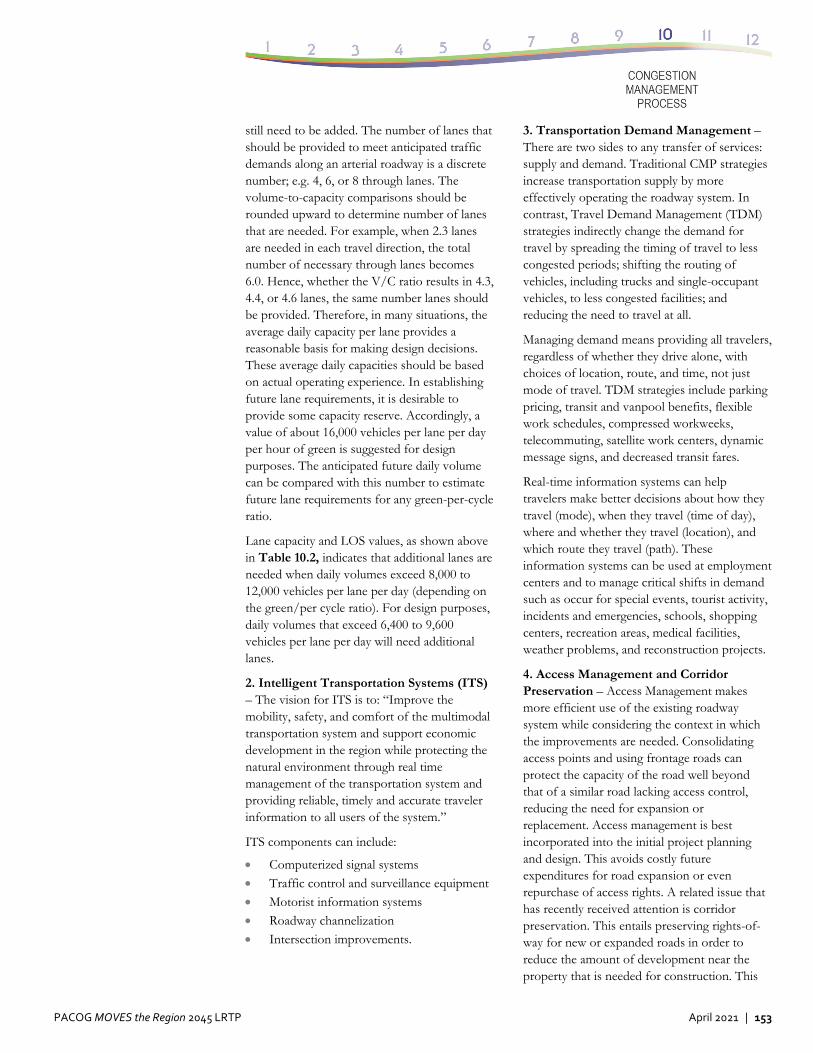
PACOG MOVES the Region 2045 LRTP April 2021 | 153
still need to be added. The number of lanes that should be provided to meet anticipated traffic demands along an arterial roadway is a discrete number; e.g. 4, 6, or 8 through lanes. The volume-to-capacity comparisons should be rounded upward to determine number of lanes that are needed. For example, when 2.3 lanes are needed in each travel direction, the total number of necessary through lanes becomes 6.0. Hence, whether the V/C ratio results in 4.3, 4.4, or 4.6 lanes, the same number lanes should be provided. Therefore, in many situations, the average daily capacity per lane provides a reasonable basis for making design decisions. These average daily capacities should be based on actual operating experience. In establishing future lane requirements, it is desirable to provide some capacity reserve. Accordingly, a value of about 16,000 vehicles per lane per day per hour of green is suggested for design purposes. The anticipated future daily volume can be compared with this number to estimate future lane requirements for any green-per-cycle ratio.
Lane capacity and LOS values, as shown above in Table 10.2, indicates that additional lanes are needed when daily volumes exceed 8,000 to 12,000 vehicles per lane per day (depending on the green/per cycle ratio). For design purposes, daily volumes that exceed 6,400 to 9,600 vehicles per lane per day will need additional lanes.
2. Intelligent Transportation Systems (ITS) – The vision for ITS is to: “Improve the mobility, safety, and comfort of the multimodal transportation system and support economic development in the region while protecting the natural environment through real time management of the transportation system and providing reliable, timely and accurate traveler information to all users of the system.”
ITS components can include:
Computerized signal systems Traffic control and surveillance equipment Motorist information systems Roadway channelization Intersection improvements.
3. Transportation Demand Management – There are two sides to any transfer of services: supply and demand. Traditional CMP strategies increase transportation supply by more effectively operating the roadway system. In contrast, Travel Demand Management (TDM) strategies indirectly change the demand for travel by spreading the timing of travel to less congested periods; shifting the routing of vehicles, including trucks and single-occupant vehicles, to less congested facilities; and reducing the need to travel at all.
Managing demand means providing all travelers, regardless of whether they drive alone, with choices of location, route, and time, not just mode of travel. TDM strategies include parking pricing, transit and vanpool benefits, flexible work schedules, compressed workweeks, telecommuting, satellite work centers, dynamic message signs, and decreased transit fares.
Real-time information systems can help travelers make better decisions about how they travel (mode), when they travel (time of day), where and whether they travel (location), and which route they travel (path). These information systems can be used at employment centers and to manage critical shifts in demand such as occur for special events, tourist activity, incidents and emergencies, schools, shopping centers, recreation areas, medical facilities, weather problems, and reconstruction projects.
4. Access Management and Corridor Preservation – Access Management makes more efficient use of the existing roadway system while considering the context in which the improvements are needed. Consolidating access points and using frontage roads can protect the capacity of the road well beyond that of a similar road lacking access control, reducing the need for expansion or replacement. Access management is best incorporated into the initial project planning and design. This avoids costly future expenditures for road expansion or even repurchase of access rights. A related issue that has recently received attention is corridor preservation. This entails preserving rights-of-way for new or expanded roads in order to reduce the amount of development near the property that is needed for construction. This
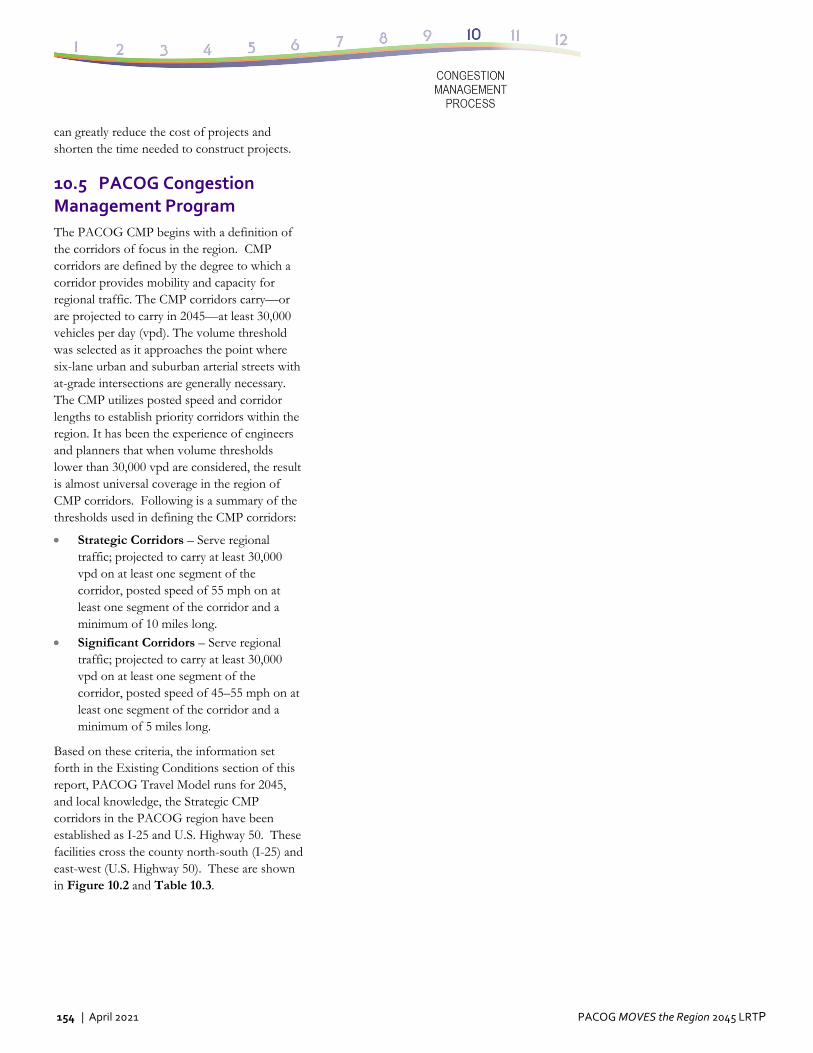
154 | April 2021 PACOG MOVES the Region 2045 LRTP
can greatly reduce the cost of projects and shorten the time needed to construct projects.
10.5 PACOG Congestion Management Program
The PACOG CMP begins with a definition of the corridors of focus in the region. CMP corridors are defined by the degree to which a corridor provides mobility and capacity for regional traffic. The CMP corridors carry—or are projected to carry in 2045—at least 30,000 vehicles per day (vpd). The volume threshold was selected as it approaches the point where six-lane urban and suburban arterial streets with at-grade intersections are generally necessary. The CMP utilizes posted speed and corridor lengths to establish priority corridors within the region. It has been the experience of engineers and planners that when volume thresholds lower than 30,000 vpd are considered, the result is almost universal coverage in the region of CMP corridors. Following is a summary of the thresholds used in defining the CMP corridors:
Strategic Corridors – Serve regional traffic; projected to carry at least 30,000 vpd on at least one segment of the corridor, posted speed of 55 mph on at least one segment of the corridor and a minimum of 10 miles long.
Significant Corridors – Serve regional traffic; projected to carry at least 30,000 vpd on at least one segment of the corridor, posted speed of 45–55 mph on at least one segment of the corridor and a minimum of 5 miles long.
Based on these criteria, the information set forth in the Existing Conditions section of this report, PACOG Travel Model runs for 2045, and local knowledge, the Strategic CMP corridors in the PACOG region have been established as I-25 and U.S. Highway 50. These facilities cross the county north-south (I-25) and east-west (U.S. Highway 50). These are shown in Figure 10.2 and Table 10.3.
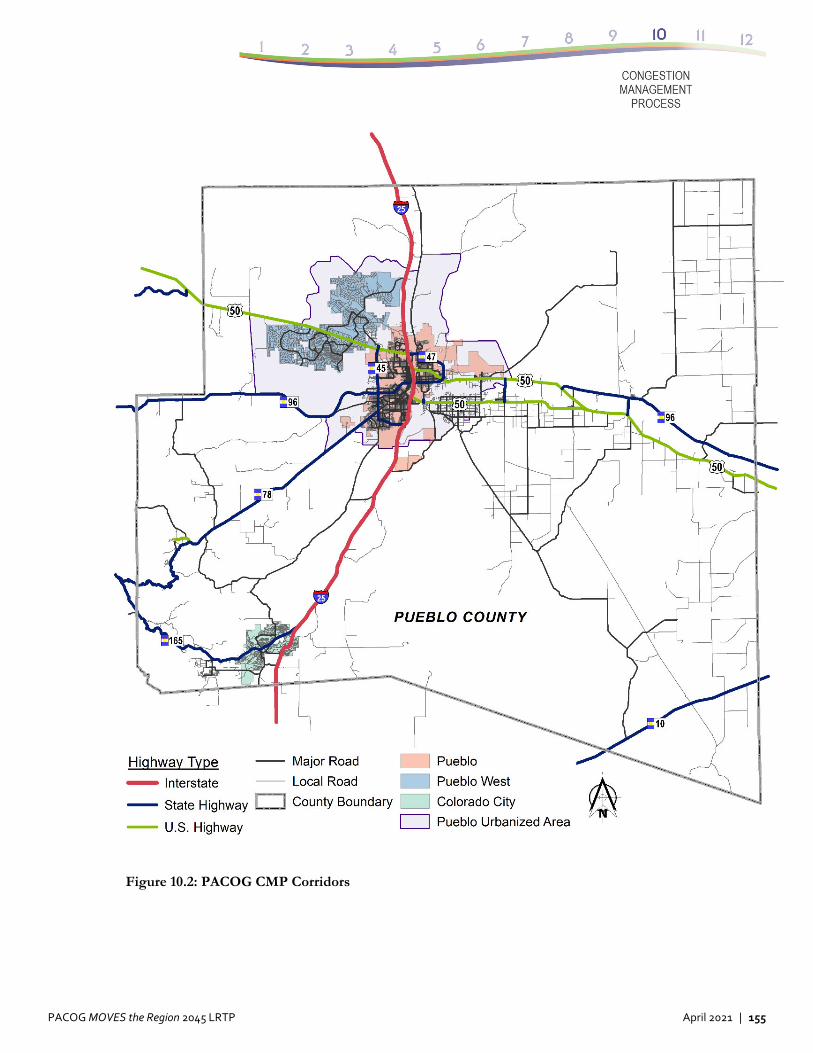
PACOG MOVES the Region 2045 LRTP April 2021 | 155
Figure 10.2: PACOG CMP Corridors
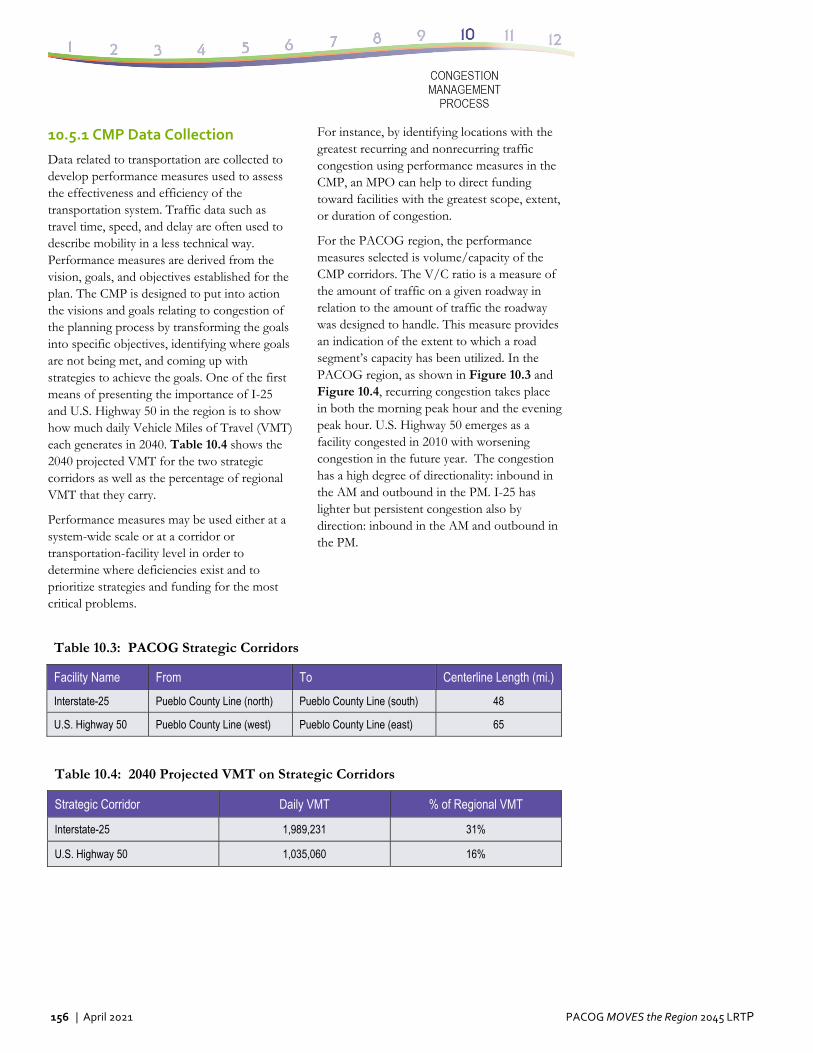
156 | April 2021 PACOG MOVES the Region 2045 LRTP
10.5.1 CMP Data Collection
Data related to transportation are collected to develop performance measures used to assess the effectiveness and efficiency of the transportation system. Traffic data such as travel time, speed, and delay are often used to describe mobility in a less technical way. Performance measures are derived from the vision, goals, and objectives established for the plan. The CMP is designed to put into action the visions and goals relating to congestion of the planning process by transforming the goals into specific objectives, identifying where goals are not being met, and coming up with strategies to achieve the goals. One of the first means of presenting the importance of I-25 and U.S. Highway 50 in the region is to show how much daily Vehicle Miles of Travel (VMT) each generates in 2040. Table 10.4 shows the 2040 projected VMT for the two strategic corridors as well as the percentage of regional VMT that they carry.
Performance measures may be used either at a system-wide scale or at a corridor or transportation-facility level in order to determine where deficiencies exist and to prioritize strategies and funding for the most critical problems.
For instance, by identifying locations with the greatest recurring and nonrecurring traffic congestion using performance measures in the CMP, an MPO can help to direct funding toward facilities with the greatest scope, extent, or duration of congestion.
For the PACOG region, the performance measures selected is volume/capacity of the CMP corridors. The V/C ratio is a measure of the amount of traffic on a given roadway in relation to the amount of traffic the roadway was designed to handle. This measure provides an indication of the extent to which a road segment’s capacity has been utilized. In the PACOG region, as shown in Figure 10.3 and Figure 10.4, recurring congestion takes place in both the morning peak hour and the evening peak hour. U.S. Highway 50 emerges as a facility congested in 2010 with worsening congestion in the future year. The congestion has a high degree of directionality: inbound in the AM and outbound in the PM. I-25 has lighter but persistent congestion also by direction: inbound in the AM and outbound in the PM.
Table 10.3: PACOG Strategic Corridors
Facility Name From To Centerline Length (mi.)
Interstate-25 Pueblo County Line (north) Pueblo County Line (south) 48
U.S. Highway 50 Pueblo County Line (west) Pueblo County Line (east) 65
Table 10.4: 2040 Projected VMT on Strategic Corridors
Strategic Corridor Daily VMT % of Regional VMT
Interstate-25 1,989,231 31%
U.S. Highway 50 1,035,060 16%
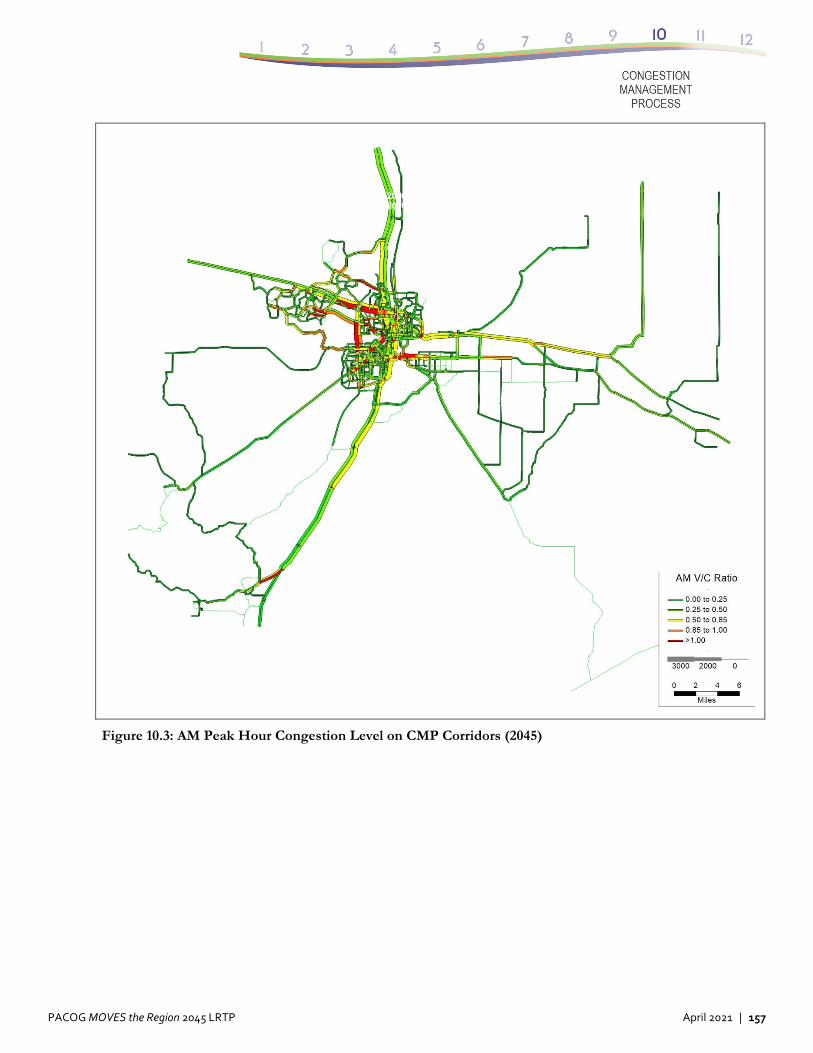
PACOG MOVES the Region 2045 LRTP April 2021 | 157
Figure 10.3: AM Peak Hour Congestion Level on CMP Corridors (2045)
2040 Fiscally Constrained Network 2040 Socioeconomic
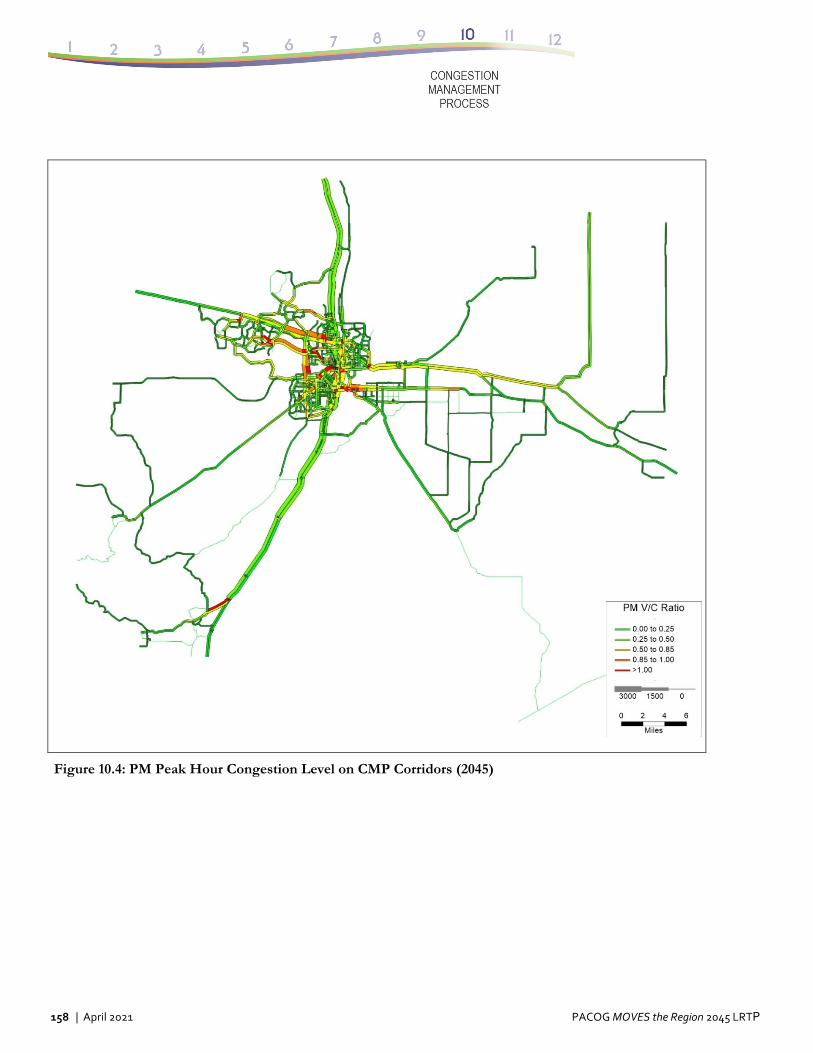
158 | April 2021 PACOG MOVES the Region 2045 LRTP
Figure 10.4: PM Peak Hour Congestion Level on CMP Corridors (2045)
PACOG MOVES the Region 2045 LRTP April 2021 | 159
10.5.2 CMP Corridor Plan
The starting point for congestion relief is to organize and tabulate a set of tools. Table 10.5 shows the strategies and specific details for managing the congestion on the two CMP corridors. The table contains both system-related and capacity-related strategies, which include Roadway Capacity Improvements, TSM, TDM, Bicycle, and Transit.
The tools described in Table 10.5 are an important start to the CMP process. It must be understood that CMP corridor plans are to be developed in collaboration with local communities with a guiding philosophy that corridor plans include only tools and projects that are appropriate for representative corridors. The proposed plans for each CMP corridor are regional in nature and will assist local communities and PACOG in developing projects to manage congestion.
The congestion management plans for the two CMP corridors, I-25 and U.S. Highway 50 are presented in Table 10.6 and Table 10.7.
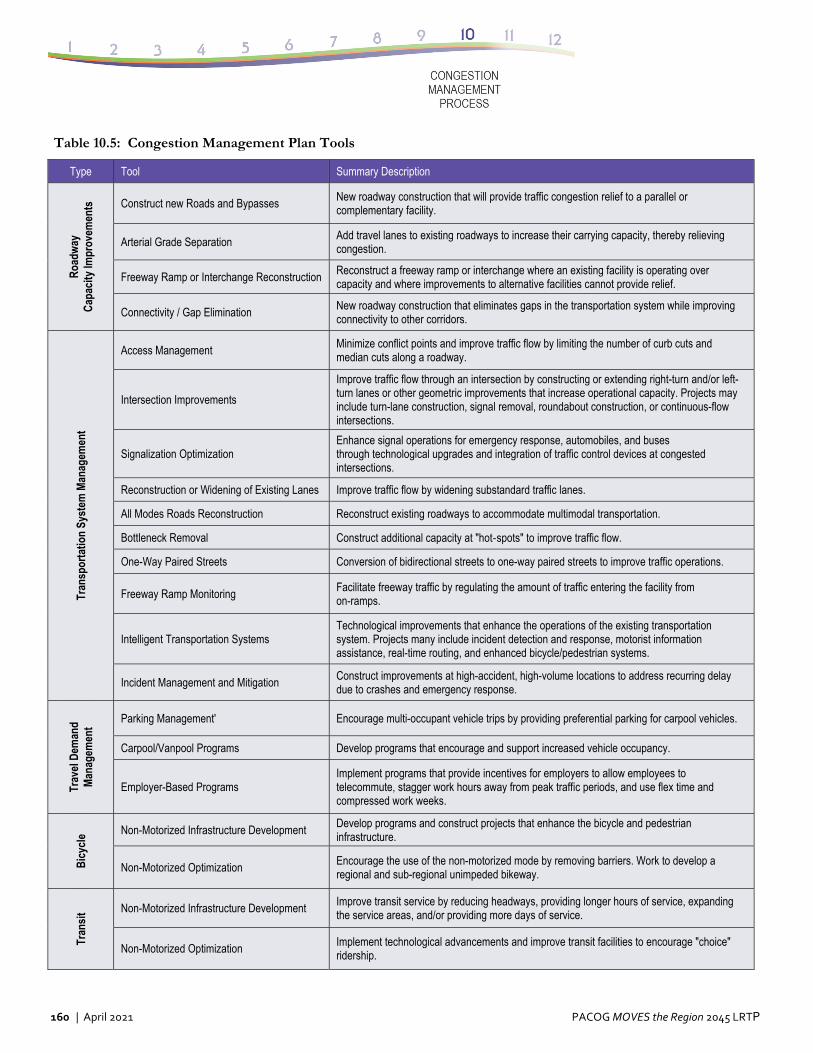
160 | April 2021 PACOG MOVES the Region 2045 LRTP
Table 10.5: Congestion Management Plan Tools
Type Tool Summary Description
Roa
dway
C
apac
ity Im
prov
emen
ts Construct new Roads and Bypasses
New roadway construction that will provide traffic congestion relief to a parallel or complementary facility.
Arterial Grade Separation Add travel lanes to existing roadways to increase their carrying capacity, thereby relieving congestion.
Freeway Ramp or Interchange Reconstruction Reconstruct a freeway ramp or interchange where an existing facility is operating over capacity and where improvements to alternative facilities cannot provide relief.
Connectivity / Gap Elimination New roadway construction that eliminates gaps in the transportation system while improving connectivity to other corridors.
Tran
spor
tatio
n Sy
stem
Man
agem
ent
Access Management Minimize conflict points and improve traffic flow by limiting the number of curb cuts and median cuts along a roadway.
Intersection Improvements
Improve traffic flow through an intersection by constructing or extending right-turn and/or left-turn lanes or other geometric improvements that increase operational capacity. Projects may include turn-lane construction, signal removal, roundabout construction, or continuous-flow intersections.
Signalization Optimization Enhance signal operations for emergency response, automobiles, and buses through technological upgrades and integration of traffic control devices at congested intersections.
Reconstruction or Widening of Existing Lanes Improve traffic flow by widening substandard traffic lanes.
All Modes Roads Reconstruction Reconstruct existing roadways to accommodate multimodal transportation.
Bottleneck Removal Construct additional capacity at "hot-spots" to improve traffic flow.
One-Way Paired Streets Conversion of bidirectional streets to one-way paired streets to improve traffic operations.
Freeway Ramp Monitoring Facilitate freeway traffic by regulating the amount of traffic entering the facility from on-ramps.
Intelligent Transportation Systems Technological improvements that enhance the operations of the existing transportation system. Projects many include incident detection and response, motorist information assistance, real-time routing, and enhanced bicycle/pedestrian systems.
Incident Management and Mitigation Construct improvements at high-accident, high-volume locations to address recurring delay due to crashes and emergency response.
Trav
el D
eman
d
Man
agem
ent
Parking Management' Encourage multi-occupant vehicle trips by providing preferential parking for carpool vehicles.
Carpool/Vanpool Programs Develop programs that encourage and support increased vehicle occupancy.
Employer-Based Programs Implement programs that provide incentives for employers to allow employees to telecommute, stagger work hours away from peak traffic periods, and use flex time and compressed work weeks.
Bic
ycle
Non-Motorized Infrastructure Development Develop programs and construct projects that enhance the bicycle and pedestrian infrastructure.
Non-Motorized Optimization Encourage the use of the non-motorized mode by removing barriers. Work to develop a regional and sub-regional unimpeded bikeway.
Tran
sit Non-Motorized Infrastructure Development
Improve transit service by reducing headways, providing longer hours of service, expanding the service areas, and/or providing more days of service.
Non-Motorized Optimization Implement technological advancements and improve transit facilities to encourage "choice" ridership.
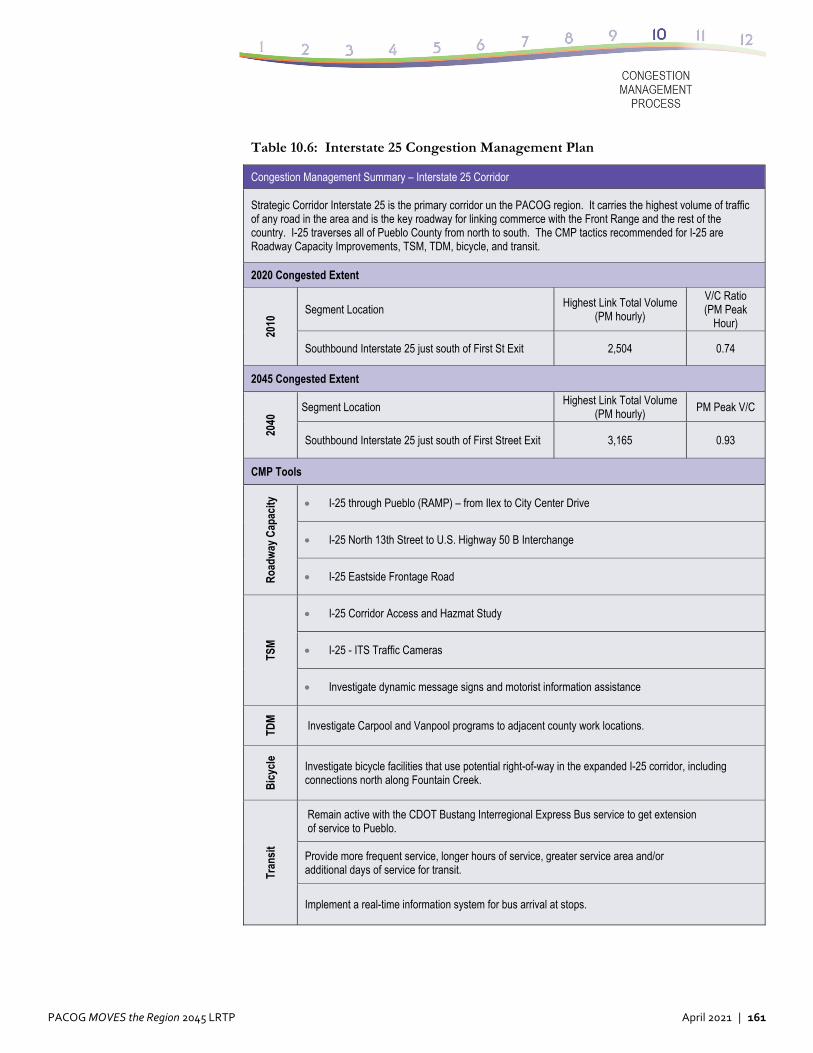
PACOG MOVES the Region 2045 LRTP April 2021 | 161
Table 10.6: Interstate 25 Congestion Management Plan
Congestion Management Summary – Interstate 25 Corridor
Strategic Corridor Interstate 25 is the primary corridor un the PACOG region. It carries the highest volume of traffic of any road in the area and is the key roadway for linking commerce with the Front Range and the rest of the country. I-25 traverses all of Pueblo County from north to south. The CMP tactics recommended for I-25 are Roadway Capacity Improvements, TSM, TDM, bicycle, and transit.
2020 Congested Extent 20
10 Segment Location
Highest Link Total Volume (PM hourly)
V/C Ratio (PM Peak
Hour)
Southbound Interstate 25 just south of First St Exit 2,504 0.74
2045 Congested Extent
2040
Segment Location Highest Link Total Volume
(PM hourly) PM Peak V/C
Southbound Interstate 25 just south of First Street Exit 3,165 0.93
CMP Tools
Roa
dway
Cap
acity
I-25 through Pueblo (RAMP) – from Ilex to City Center Drive
I-25 North 13th Street to U.S. Highway 50 B Interchange
I-25 Eastside Frontage Road
TSM
I-25 Corridor Access and Hazmat Study
I-25 - ITS Traffic Cameras
Investigate dynamic message signs and motorist information assistance
TDM
Investigate Carpool and Vanpool programs to adjacent county work locations.
Bic
ycle
Investigate bicycle facilities that use potential right-of-way in the expanded I-25 corridor, including connections north along Fountain Creek.
Tran
sit
Remain active with the CDOT Bustang Interregional Express Bus service to get extension of service to Pueblo.
Provide more frequent service, longer hours of service, greater service area and/or additional days of service for transit.
Implement a real-time information system for bus arrival at stops.
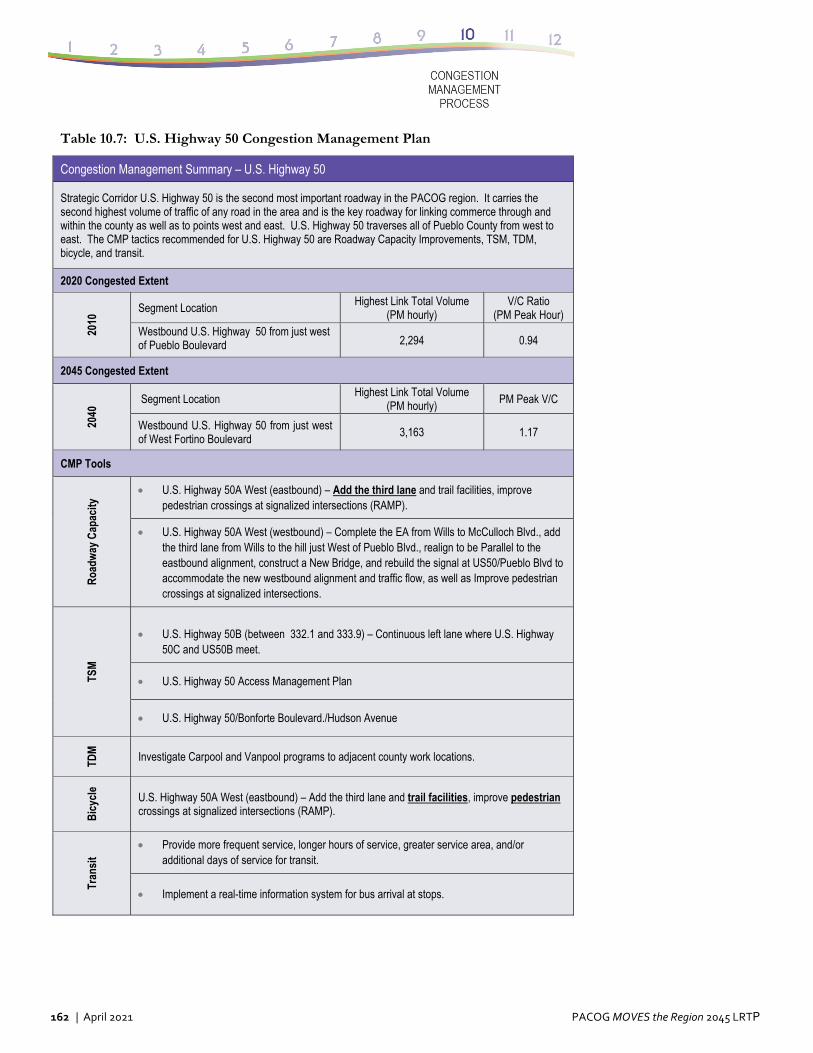
162 | April 2021 PACOG MOVES the Region 2045 LRTP
Table 10.7: U.S. Highway 50 Congestion Management Plan
Congestion Management Summary – U.S. Highway 50
Strategic Corridor U.S. Highway 50 is the second most important roadway in the PACOG region. It carries the second highest volume of traffic of any road in the area and is the key roadway for linking commerce through and within the county as well as to points west and east. U.S. Highway 50 traverses all of Pueblo County from west to east. The CMP tactics recommended for U.S. Highway 50 are Roadway Capacity Improvements, TSM, TDM, bicycle, and transit.
2020 Congested Extent
2010
Segment Location Highest Link Total Volume
(PM hourly) V/C Ratio
(PM Peak Hour) Westbound U.S. Highway 50 from just west of Pueblo Boulevard 2,294 0.94
2045 Congested Extent
2040
Segment Location Highest Link Total Volume
(PM hourly) PM Peak V/C
Westbound U.S. Highway 50 from just west of West Fortino Boulevard
3,163 1.17
CMP Tools
Roa
dway
Cap
acity
U.S. Highway 50A West (eastbound) – Add the third lane and trail facilities, improve pedestrian crossings at signalized intersections (RAMP).
U.S. Highway 50A West (westbound) – Complete the EA from Wills to McCulloch Blvd., add the third lane from Wills to the hill just West of Pueblo Blvd., realign to be Parallel to the eastbound alignment, construct a New Bridge, and rebuild the signal at US50/Pueblo Blvd to accommodate the new westbound alignment and traffic flow, as well as Improve pedestrian crossings at signalized intersections.
TSM
U.S. Highway 50B (between 332.1 and 333.9) – Continuous left lane where U.S. Highway 50C and US50B meet.
U.S. Highway 50 Access Management Plan
U.S. Highway 50/Bonforte Boulevard./Hudson Avenue
TDM
Investigate Carpool and Vanpool programs to adjacent county work locations.
Bic
ycle
U.S. Highway 50A West (eastbound) – Add the third lane and trail facilities, improve pedestrian crossings at signalized intersections (RAMP).
Tran
sit
Provide more frequent service, longer hours of service, greater service area, and/or additional days of service for transit.
Implement a real-time information system for bus arrival at stops.
PACOG MOVES the Region 2045 LRTP April 2021 | 163
10.6 Summary
PACOG, as the MPO for the Pueblo region, recognizes that implementation of the majority of congestion management strategies must rest with local operating agencies. Many of these agencies are indeed already making progress towards their diverse goals. There is much to be gained by working together on common goals aimed toward the resolution of regional problems. PACOG will continue refinement of congestion performance measures. Data collection, model improvement, and work with the CMP metrics will continue. PACOG and associated local governments in the metropolitan planning area will participate in the identification of activities to address congestion
problems on individual facilities through established planning processes: TIP, long-range plan development, congested corridor feasibility studies, the Congestion Mitigation Air Quality (CMAQ) program, and others. Appropriate strategies will be selected and implemented.
The PACOG region can improve performance and reduce congestion using an objective-driven and performance-based transportation planning process that specifically considers congestion management strategies that address safety, security, mobility, recurring and nonrecurring congestion, and other issues. These strategies will result in a mix of infrastructure and operational strategies founded on measurable, regional, performance-based objectives.
.
PACOG MOVES the Region 2045 LRTP April 2021 | 165
11.0 Freight & Commodity Flows
11.1 Freight in the Context of the Long Range Plan
Efficient freight movement is a key component of a well-functioning transportation system. Commodity flows using the various freight modes available in the Pueblo region support industry, manufacturing, agriculture, and retail, and they also provide a framework for the growth of commerce and trade. The Colorado Department of Transportation (CDOT) and the Pueblo Area Council of Governments (PACOG) are equally responsible for ensuring that freight planning is incorporated into the transportation planning process, both to fulfill planning requirements and to build the economic strength of the state and region. CDOT and PACOG have systematically incorporated freight into their planning activities by:
Defining those elements of a metropolitan area's transportation system that are critical for the efficient movement of freight.
Identifying ways to measure system performance in terms of freight movement.
Developing freight-oriented data collection and modeling to identify problems and develop potential solutions.
Creating and supporting freight advisory committees to advocate for freight issues, including the identification of bottlenecks in the freight network.
11.1.1 Federal Guidance
Federal guidance on freight planning has evolved significantly in the past 20 years, consistently expanding transportation aspects to address emerging elements such as freight-related congestion. Current guidance on freight is provided by the Fixing America’s Surface Transportation (FAST) Act legislation enacted in 2015. In general, the freight-related planning requirements in the FAST Act are addressed to the state departments of transportation with the goal of focusing attention on freight at the
national level by supporting investment in freight-related surface transportation projects. Specifically, the legislation requires the U.S. secretary of transportation to encourage each state to develop a comprehensive state freight plan and establish a state freight advisory committee. While freight plans and freight advisory committees are not required by the FAST Act, many states and MPOs are in the process of establishing or updating them to support and enable freight plans. As an example of the value of a state freight plan, the FAST Act cites that projects listed in a state freight plan are eligible for a higher percentage of federal matching funds than are unlisted projects. Freight planning at all levels of government simply makes good financial sense in the global economy.
There are four elements that FAST Act requires of state freight plans. States are asked to:
1. Describe how the state freight plan supports national freight goals.
2. Describe freight policies, strategies, and performance measures.
3. Describe freight trends, needs, and issues.
4. Inventory bottlenecks and develop freight improvement strategies.
PACOG’s long range transportation plan (LRTP) follows FAST Act guidance. Continued attention to the FAST Act freight requirements at the state level and measuring PACOG’s progress toward them are part of the ongoing regional transportation planning (RTP) process. It is further understood that the PACOG LRTP provides a useful repository of 2020 freight summaries, goals, and status. It also reflects progress toward freight goals at all levels and across all modes. The work conducted by PACOG thus folds into work at the state level led by CDOT. Many of the means by which the state supports national freight goals, such as improving the state of good repair, reducing congestion, and growing the economy by means of the freight system, are echoed by PACOG. For example, keeping Interstate 25 (I-25) in a state of good repair is important to the nation, the state, and Pueblo County.
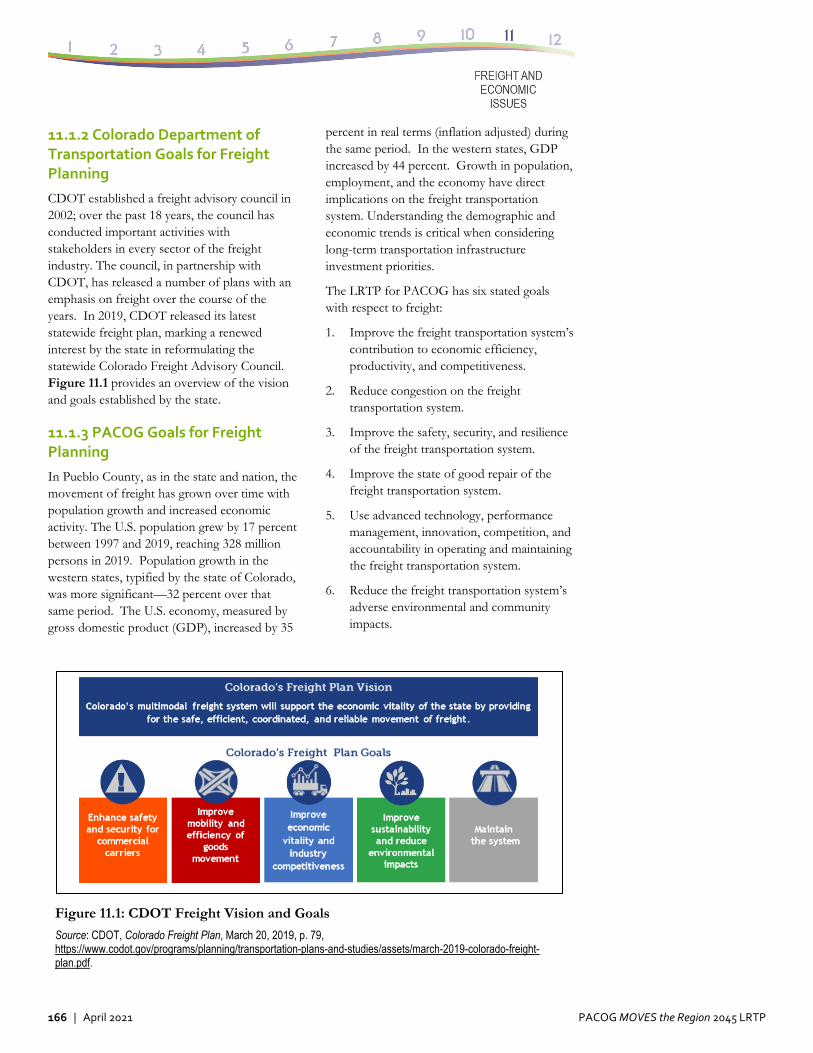
166 | April 2021 PACOG MOVES the Region 2045 LRTP
11.1.2 Colorado Department of Transportation Goals for Freight Planning
CDOT established a freight advisory council in 2002; over the past 18 years, the council has conducted important activities with stakeholders in every sector of the freight industry. The council, in partnership with CDOT, has released a number of plans with an emphasis on freight over the course of the years. In 2019, CDOT released its latest statewide freight plan, marking a renewed interest by the state in reformulating the statewide Colorado Freight Advisory Council. Figure 11.1 provides an overview of the vision and goals established by the state.
11.1.3 PACOG Goals for Freight Planning
In Pueblo County, as in the state and nation, the movement of freight has grown over time with population growth and increased economic activity. The U.S. population grew by 17 percent between 1997 and 2019, reaching 328 million persons in 2019. Population growth in the western states, typified by the state of Colorado, was more significant—32 percent over that same period. The U.S. economy, measured by gross domestic product (GDP), increased by 35
percent in real terms (inflation adjusted) during the same period. In the western states, GDP increased by 44 percent. Growth in population, employment, and the economy have direct implications on the freight transportation system. Understanding the demographic and economic trends is critical when considering long-term transportation infrastructure investment priorities.
The LRTP for PACOG has six stated goals with respect to freight:
1. Improve the freight transportation system’s contribution to economic efficiency, productivity, and competitiveness.
2. Reduce congestion on the freight transportation system.
3. Improve the safety, security, and resilience of the freight transportation system.
4. Improve the state of good repair of the freight transportation system.
5. Use advanced technology, performance management, innovation, competition, and accountability in operating and maintaining the freight transportation system.
6. Reduce the freight transportation system’s adverse environmental and community impacts.
Figure 11.1: CDOT Freight Vision and Goals
Source: CDOT, Colorado Freight Plan, March 20, 2019, p. 79, https://www.codot.gov/programs/planning/transportation-plans-and-studies/assets/march-2019-colorado-freight-plan.pdf.
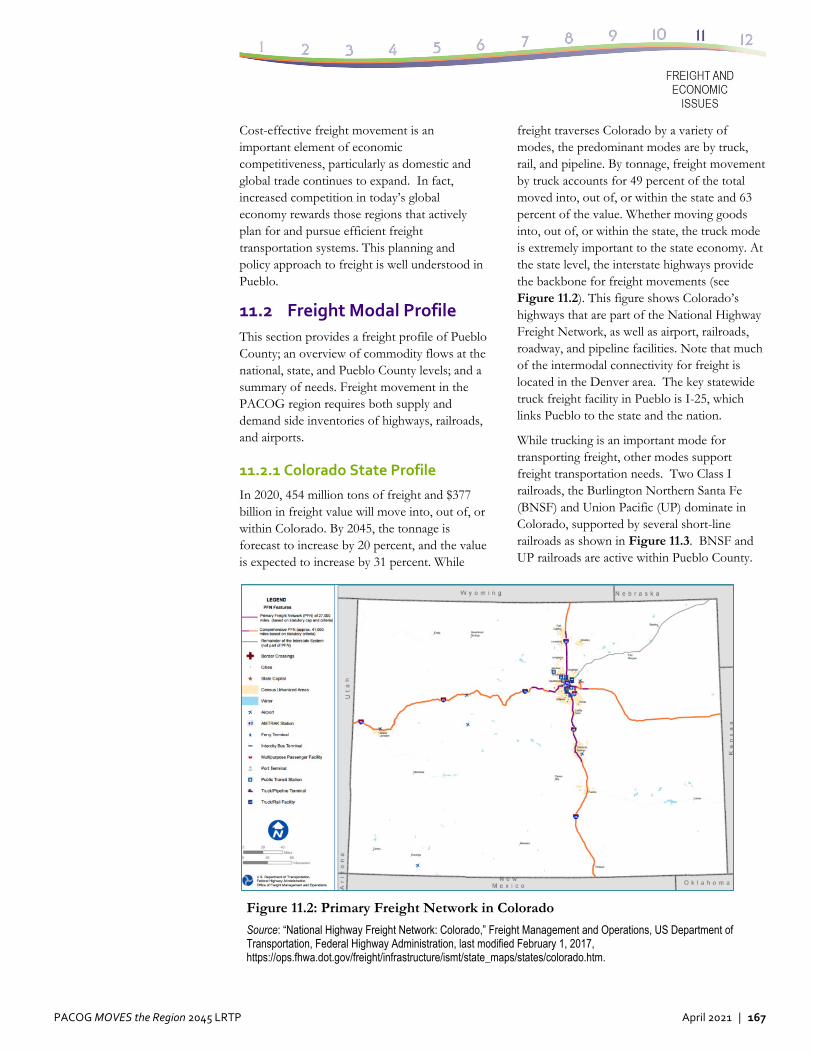
PACOG MOVES the Region 2045 LRTP April 2021 | 167
Cost-effective freight movement is an important element of economic competitiveness, particularly as domestic and global trade continues to expand. In fact, increased competition in today’s global economy rewards those regions that actively plan for and pursue efficient freight transportation systems. This planning and policy approach to freight is well understood in Pueblo.
11.2 Freight Modal Profile
This section provides a freight profile of Pueblo County; an overview of commodity flows at the national, state, and Pueblo County levels; and a summary of needs. Freight movement in the PACOG region requires both supply and demand side inventories of highways, railroads, and airports.
11.2.1 Colorado State Profile
In 2020, 454 million tons of freight and $377 billion in freight value will move into, out of, or within Colorado. By 2045, the tonnage is forecast to increase by 20 percent, and the value is expected to increase by 31 percent. While
freight traverses Colorado by a variety of modes, the predominant modes are by truck, rail, and pipeline. By tonnage, freight movement by truck accounts for 49 percent of the total moved into, out of, or within the state and 63 percent of the value. Whether moving goods into, out of, or within the state, the truck mode is extremely important to the state economy. At the state level, the interstate highways provide the backbone for freight movements (see Figure 11.2). This figure shows Colorado’s highways that are part of the National Highway Freight Network, as well as airport, railroads, roadway, and pipeline facilities. Note that much of the intermodal connectivity for freight is located in the Denver area. The key statewide truck freight facility in Pueblo is I-25, which links Pueblo to the state and the nation.
While trucking is an important mode for transporting freight, other modes support freight transportation needs. Two Class I railroads, the Burlington Northern Santa Fe (BNSF) and Union Pacific (UP) dominate in Colorado, supported by several short-line railroads as shown in Figure 11.3. BNSF and UP railroads are active within Pueblo County.
Figure 11.2: Primary Freight Network in Colorado
Source: “National Highway Freight Network: Colorado,” Freight Management and Operations, US Department of Transportation, Federal Highway Administration, last modified February 1, 2017, https://ops.fhwa.dot.gov/freight/infrastructure/ismt/state_maps/states/colorado.htm.
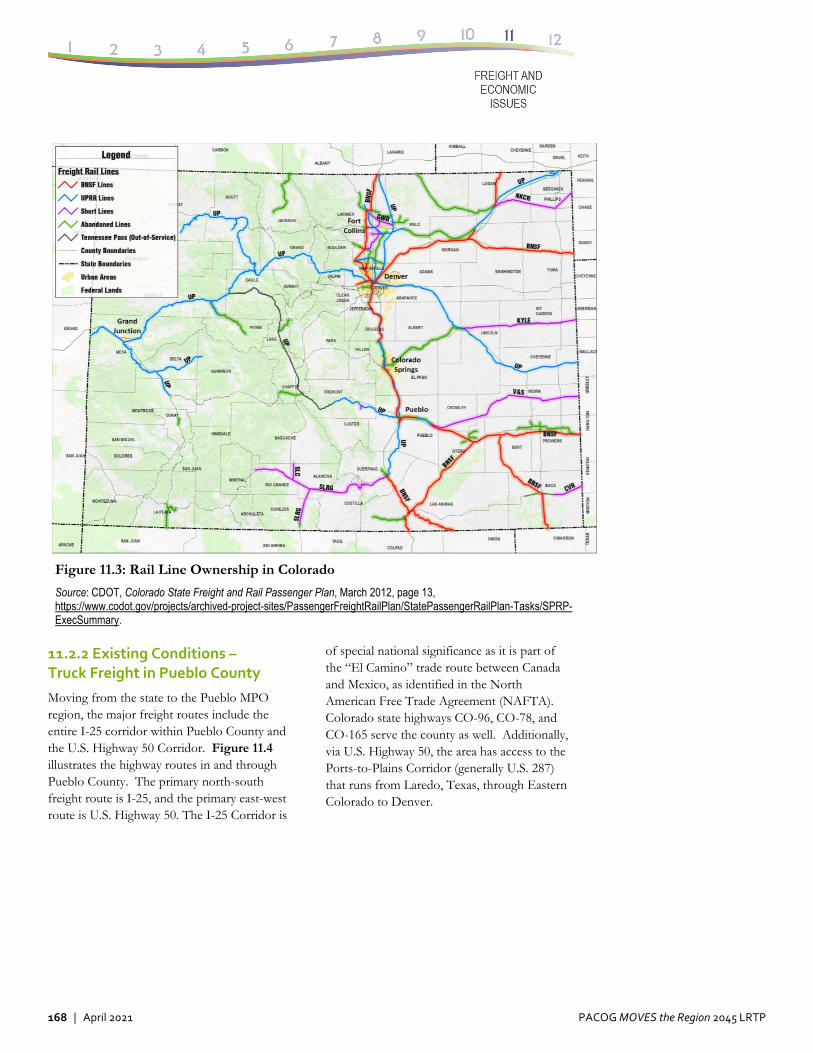
168 | April 2021 PACOG MOVES the Region 2045 LRTP
Figure 11.3: Rail Line Ownership in Colorado
Source: CDOT, Colorado State Freight and Rail Passenger Plan, March 2012, page 13, https://www.codot.gov/projects/archived-project-sites/PassengerFreightRailPlan/StatePassengerRailPlan-Tasks/SPRP-ExecSummary.
11.2.2 Existing Conditions – Truck Freight in Pueblo County
Moving from the state to the Pueblo MPO region, the major freight routes include the entire I-25 corridor within Pueblo County and the U.S. Highway 50 Corridor. Figure 11.4 illustrates the highway routes in and through Pueblo County. The primary north-south freight route is I-25, and the primary east-west route is U.S. Highway 50. The I-25 Corridor is
of special national significance as it is part of the “El Camino” trade route between Canada and Mexico, as identified in the North American Free Trade Agreement (NAFTA). Colorado state highways CO-96, CO-78, and CO-165 serve the county as well. Additionally, via U.S. Highway 50, the area has access to the Ports-to-Plains Corridor (generally U.S. 287) that runs from Laredo, Texas, through Eastern Colorado to Denver.
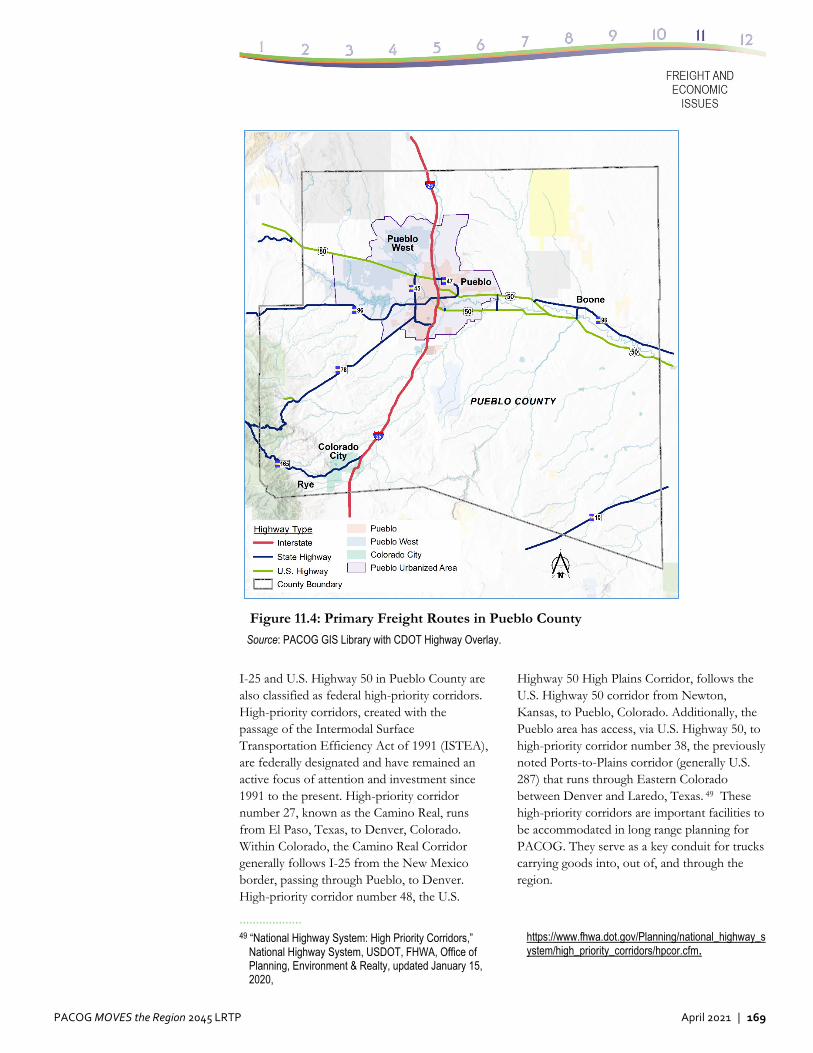
PACOG MOVES the Region 2045 LRTP April 2021 | 169
Figure 11.4: Primary Freight Routes in Pueblo County
Source: PACOG GIS Library with CDOT Highway Overlay.
I-25 and U.S. Highway 50 in Pueblo County are also classified as federal high-priority corridors. High-priority corridors, created with the passage of the Intermodal Surface Transportation Efficiency Act of 1991 (ISTEA), are federally designated and have remained an active focus of attention and investment since 1991 to the present. High-priority corridor number 27, known as the Camino Real, runs from El Paso, Texas, to Denver, Colorado. Within Colorado, the Camino Real Corridor generally follows I-25 from the New Mexico border, passing through Pueblo, to Denver. High-priority corridor number 48, the U.S.
··················· 49 “National Highway System: High Priority Corridors,”
National Highway System, USDOT, FHWA, Office of Planning, Environment & Realty, updated January 15, 2020,
Highway 50 High Plains Corridor, follows the U.S. Highway 50 corridor from Newton, Kansas, to Pueblo, Colorado. Additionally, the Pueblo area has access, via U.S. Highway 50, to high-priority corridor number 38, the previously noted Ports-to-Plains corridor (generally U.S. 287) that runs through Eastern Colorado between Denver and Laredo, Texas. 49 These high-priority corridors are important facilities to be accommodated in long range planning for PACOG. They serve as a key conduit for trucks carrying goods into, out of, and through the region.
https://www.fhwa.dot.gov/Planning/national_highway_system/high_priority_corridors/hpcor.cfm.
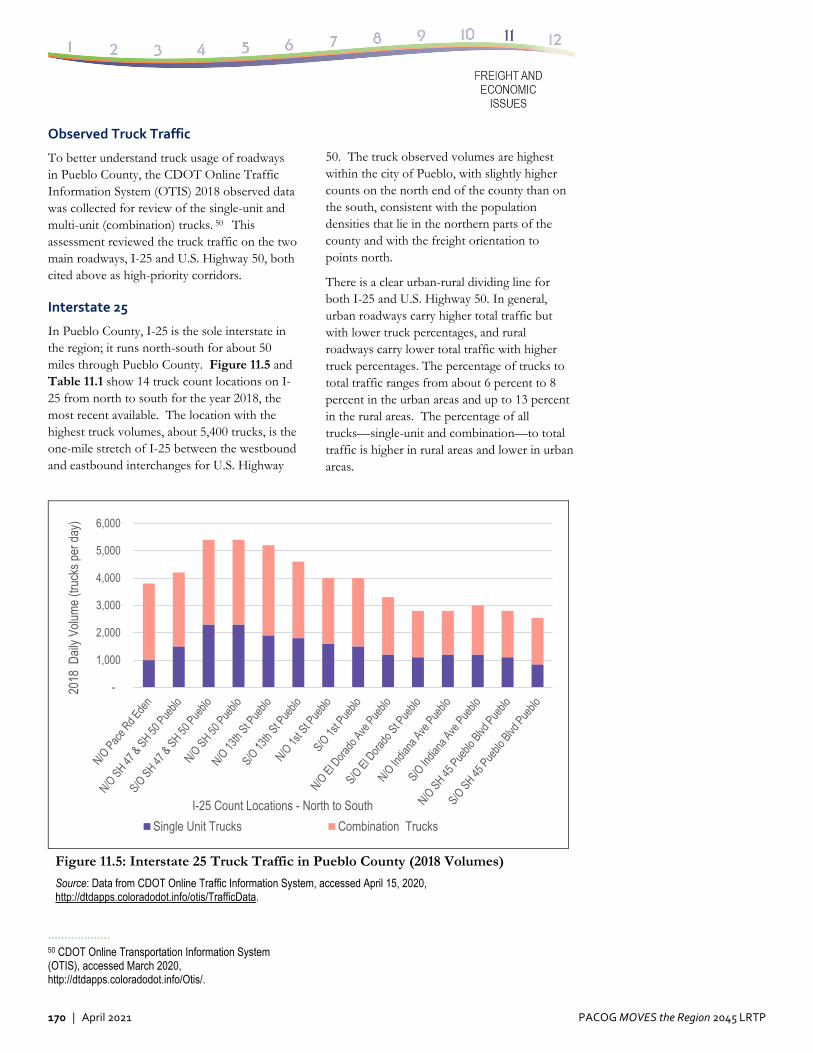
170 | April 2021 PACOG MOVES the Region 2045 LRTP
Observed Truck Traffic
To better understand truck usage of roadways in Pueblo County, the CDOT Online Traffic Information System (OTIS) 2018 observed data
was collected for review of the single-unit and multi-unit (combination) trucks. 50 This assessment reviewed the truck traffic on the two main roadways, I-25 and U.S. Highway 50, both cited above as high-priority corridors.
Interstate 25
In Pueblo County, I-25 is the sole interstate in the region; it runs north-south for about 50 miles through Pueblo County. Figure 11.5 and Table 11.1 show 14 truck count locations on I-25 from north to south for the year 2018, the most recent available. The location with the highest truck volumes, about 5,400 trucks, is the one-mile stretch of I-25 between the westbound and eastbound interchanges for U.S. Highway
50. The truck observed volumes are highest within the city of Pueblo, with slightly higher counts on the north end of the county than on the south, consistent with the population densities that lie in the northern parts of the county and with the freight orientation to points north.
There is a clear urban-rural dividing line for both I-25 and U.S. Highway 50. In general, urban roadways carry higher total traffic but with lower truck percentages, and rural roadways carry lower total traffic with higher truck percentages. The percentage of trucks to total traffic ranges from about 6 percent to 8 percent in the urban areas and up to 13 percent in the rural areas. The percentage of all trucks—single-unit and combination—to total traffic is higher in rural areas and lower in urban areas.
Figure 11.5: Interstate 25 Truck Traffic in Pueblo County (2018 Volumes)
Source: Data from CDOT Online Traffic Information System, accessed April 15, 2020, http://dtdapps.coloradodot.info/otis/TrafficData.
··················· 50 CDOT Online Transportation Information System (OTIS), accessed March 2020, http://dtdapps.coloradodot.info/Otis/.
-
1,000
2,000
3,000
4,000
5,000
6,000
2018
Dai
ly V
olum
e (tr
ucks
per
day
)
I-25 Count Locations - North to South
Single Unit Trucks Combination Trucks
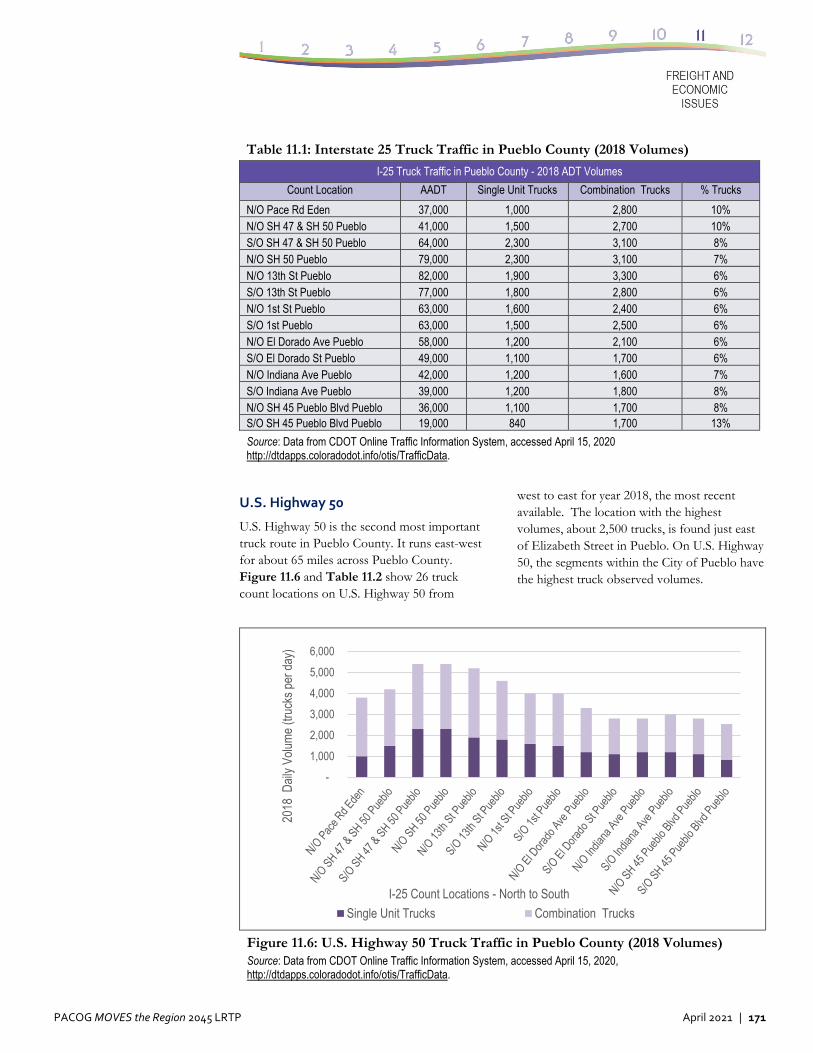
PACOG MOVES the Region 2045 LRTP April 2021 | 171
Table 11.1: Interstate 25 Truck Traffic in Pueblo County (2018 Volumes)
I-25 Truck Traffic in Pueblo County - 2018 ADT Volumes
Count Location AADT Single Unit Trucks Combination Trucks % Trucks
N/O Pace Rd Eden 37,000 1,000 2,800 10% N/O SH 47 & SH 50 Pueblo 41,000 1,500 2,700 10% S/O SH 47 & SH 50 Pueblo 64,000 2,300 3,100 8% N/O SH 50 Pueblo 79,000 2,300 3,100 7% N/O 13th St Pueblo 82,000 1,900 3,300 6% S/O 13th St Pueblo 77,000 1,800 2,800 6% N/O 1st St Pueblo 63,000 1,600 2,400 6% S/O 1st Pueblo 63,000 1,500 2,500 6% N/O El Dorado Ave Pueblo 58,000 1,200 2,100 6% S/O El Dorado St Pueblo 49,000 1,100 1,700 6% N/O Indiana Ave Pueblo 42,000 1,200 1,600 7% S/O Indiana Ave Pueblo 39,000 1,200 1,800 8% N/O SH 45 Pueblo Blvd Pueblo 36,000 1,100 1,700 8% S/O SH 45 Pueblo Blvd Pueblo 19,000 840 1,700 13%
Source: Data from CDOT Online Traffic Information System, accessed April 15, 2020 http://dtdapps.coloradodot.info/otis/TrafficData.
U.S. Highway 50
U.S. Highway 50 is the second most important truck route in Pueblo County. It runs east-west for about 65 miles across Pueblo County. Figure 11.6 and Table 11.2 show 26 truck count locations on U.S. Highway 50 from
west to east for year 2018, the most recent available. The location with the highest volumes, about 2,500 trucks, is found just east of Elizabeth Street in Pueblo. On U.S. Highway 50, the segments within the City of Pueblo have the highest truck observed volumes.
Figure 11.6: U.S. Highway 50 Truck Traffic in Pueblo County (2018 Volumes) Source: Data from CDOT Online Traffic Information System, accessed April 15, 2020, http://dtdapps.coloradodot.info/otis/TrafficData.
-
1,000
2,000
3,000
4,000
5,000
6,000
2018
Dai
ly V
olum
e (tr
ucks
per
day
)
I-25 Count Locations - North to South
Single Unit Trucks Combination Trucks
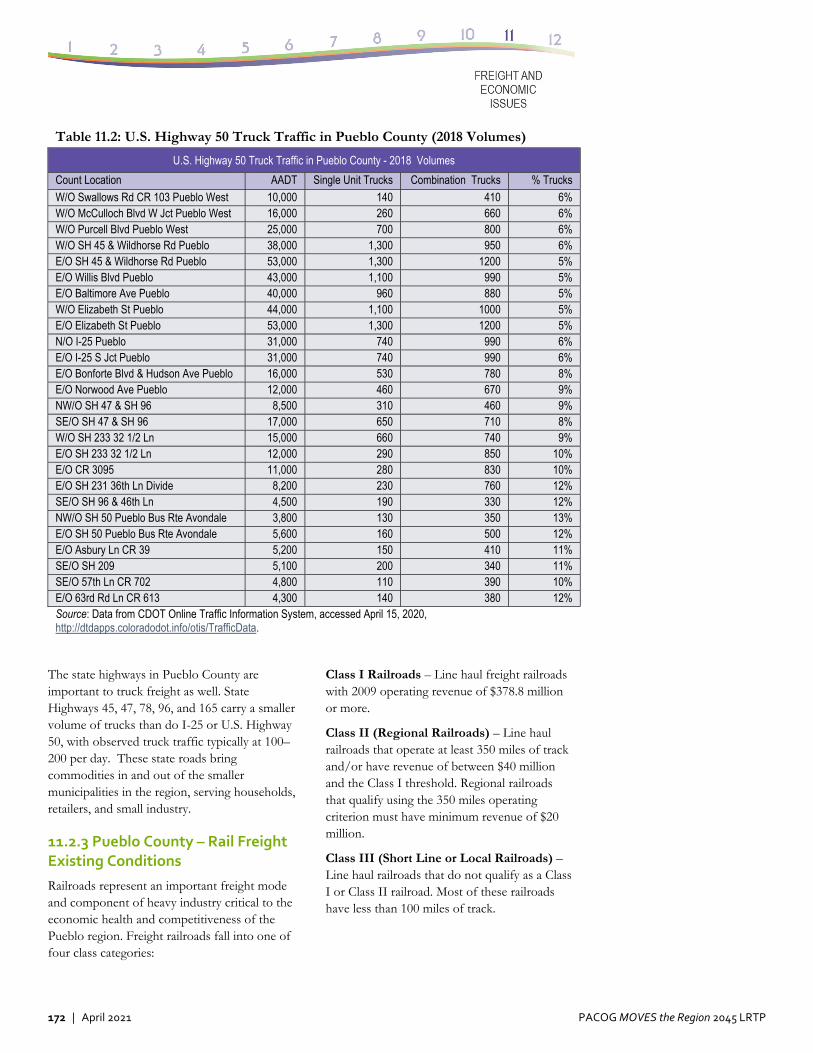
172 | April 2021 PACOG MOVES the Region 2045 LRTP
Table 11.2: U.S. Highway 50 Truck Traffic in Pueblo County (2018 Volumes)
U.S. Highway 50 Truck Traffic in Pueblo County - 2018 Volumes
Count Location AADT Single Unit Trucks Combination Trucks % Trucks
W/O Swallows Rd CR 103 Pueblo West 10,000 140 410 6% W/O McCulloch Blvd W Jct Pueblo West 16,000 260 660 6% W/O Purcell Blvd Pueblo West 25,000 700 800 6% W/O SH 45 & Wildhorse Rd Pueblo 38,000 1,300 950 6% E/O SH 45 & Wildhorse Rd Pueblo 53,000 1,300 1200 5% E/O Willis Blvd Pueblo 43,000 1,100 990 5% E/O Baltimore Ave Pueblo 40,000 960 880 5% W/O Elizabeth St Pueblo 44,000 1,100 1000 5% E/O Elizabeth St Pueblo 53,000 1,300 1200 5% N/O I-25 Pueblo 31,000 740 990 6% E/O I-25 S Jct Pueblo 31,000 740 990 6% E/O Bonforte Blvd & Hudson Ave Pueblo 16,000 530 780 8% E/O Norwood Ave Pueblo 12,000 460 670 9% NW/O SH 47 & SH 96 8,500 310 460 9% SE/O SH 47 & SH 96 17,000 650 710 8% W/O SH 233 32 1/2 Ln 15,000 660 740 9% E/O SH 233 32 1/2 Ln 12,000 290 850 10% E/O CR 3095 11,000 280 830 10% E/O SH 231 36th Ln Divide 8,200 230 760 12% SE/O SH 96 & 46th Ln 4,500 190 330 12% NW/O SH 50 Pueblo Bus Rte Avondale 3,800 130 350 13% E/O SH 50 Pueblo Bus Rte Avondale 5,600 160 500 12% E/O Asbury Ln CR 39 5,200 150 410 11% SE/O SH 209 5,100 200 340 11% SE/O 57th Ln CR 702 4,800 110 390 10% E/O 63rd Rd Ln CR 613 4,300 140 380 12% Source: Data from CDOT Online Traffic Information System, accessed April 15, 2020, http://dtdapps.coloradodot.info/otis/TrafficData.
The state highways in Pueblo County are important to truck freight as well. State Highways 45, 47, 78, 96, and 165 carry a smaller volume of trucks than do I-25 or U.S. Highway 50, with observed truck traffic typically at 100–200 per day. These state roads bring commodities in and out of the smaller municipalities in the region, serving households, retailers, and small industry.
11.2.3 Pueblo County – Rail Freight Existing Conditions
Railroads represent an important freight mode and component of heavy industry critical to the economic health and competitiveness of the Pueblo region. Freight railroads fall into one of four class categories:
Class I Railroads – Line haul freight railroads with 2009 operating revenue of $378.8 million or more.
Class II (Regional Railroads) – Line haul railroads that operate at least 350 miles of track and/or have revenue of between $40 million and the Class I threshold. Regional railroads that qualify using the 350 miles operating criterion must have minimum revenue of $20 million.
Class III (Short Line or Local Railroads) – Line haul railroads that do not qualify as a Class I or Class II railroad. Most of these railroads have less than 100 miles of track.
PACOG MOVES the Region 2045 LRTP April 2021 | 173
Class IV (Switching and Terminal Railroads) – Provide switching and/or terminal services. Rather than point-to-point transportation, they usually perform pick-up and delivery services within a special area or funnel traffic between other railroads.
The current rail lines in operation in Pueblo County are the BNSF, UP, and the Victoria & Southern (V&S) Railway, Inc.
Class I Railroads
The two Class I railroads in Pueblo County, the BNSF and the UP, operate over 95 percent of the miles of track and carry the majority of rail freight in the county. They provide north-south and east-west service in Colorado, although only the UP owns trackage across the Continental Divide. In many cases, these two railroads provide trackage rights to each other to jointly operate trains over a single line owned and maintained by one of them. The line that carries the greatest amount of freight is the consolidated mainline, which runs along the Front Range between Denver and Pueblo. Portions of this line are owned by BNSF and UP, but they both operate on it for the length of the line. Figure 11.7 illustrates the rail lines and facilities in Pueblo County.
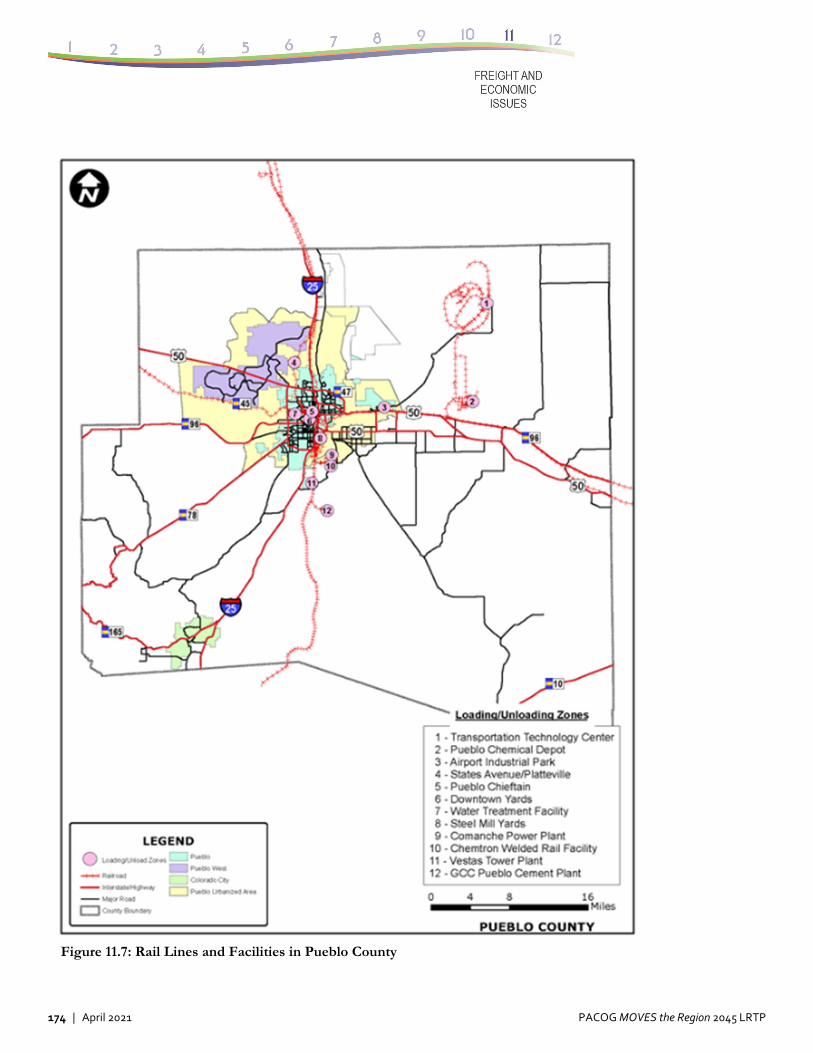
174 | April 2021 PACOG MOVES the Region 2045 LRTP
Figure 11.7: Rail Lines and Facilities in Pueblo County
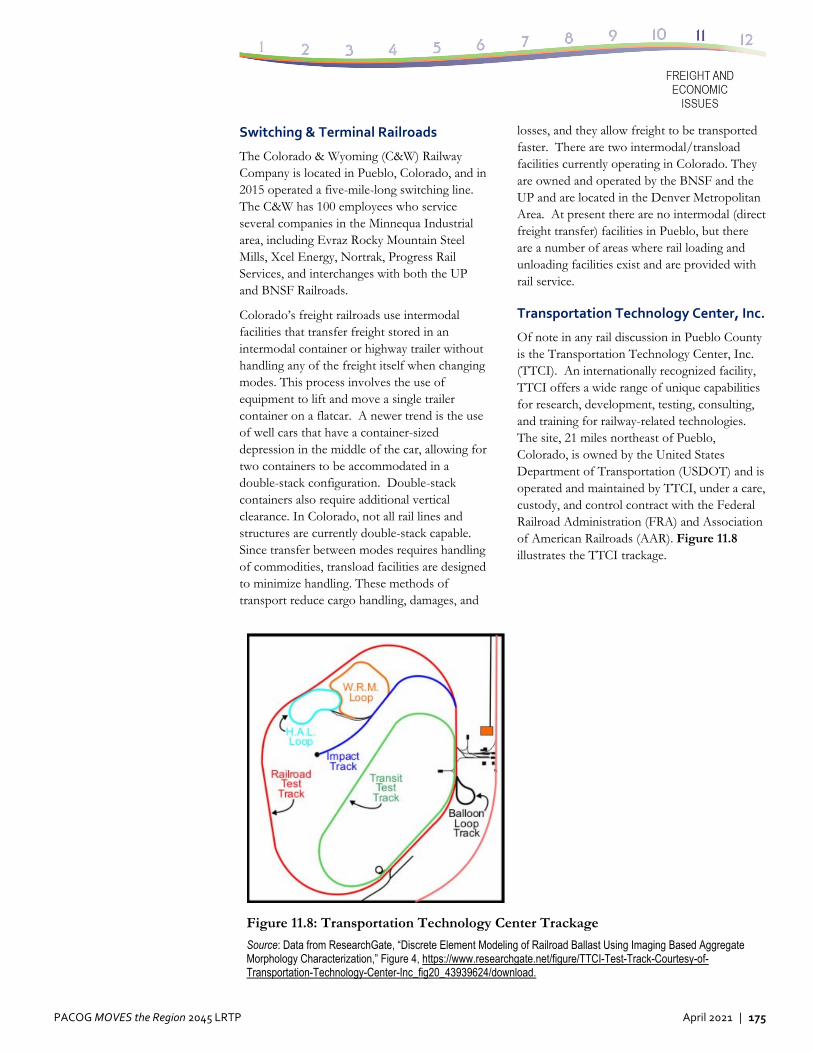
PACOG MOVES the Region 2045 LRTP April 2021 | 175
Switching & Terminal Railroads
The Colorado & Wyoming (C&W) Railway Company is located in Pueblo, Colorado, and in 2015 operated a five-mile-long switching line. The C&W has 100 employees who service several companies in the Minnequa Industrial area, including Evraz Rocky Mountain Steel Mills, Xcel Energy, Nortrak, Progress Rail Services, and interchanges with both the UP and BNSF Railroads.
Colorado’s freight railroads use intermodal facilities that transfer freight stored in an intermodal container or highway trailer without handling any of the freight itself when changing modes. This process involves the use of equipment to lift and move a single trailer container on a flatcar. A newer trend is the use of well cars that have a container-sized depression in the middle of the car, allowing for two containers to be accommodated in a double-stack configuration. Double-stack containers also require additional vertical clearance. In Colorado, not all rail lines and structures are currently double-stack capable. Since transfer between modes requires handling of commodities, transload facilities are designed to minimize handling. These methods of transport reduce cargo handling, damages, and
losses, and they allow freight to be transported faster. There are two intermodal/transload facilities currently operating in Colorado. They are owned and operated by the BNSF and the UP and are located in the Denver Metropolitan Area. At present there are no intermodal (direct freight transfer) facilities in Pueblo, but there are a number of areas where rail loading and unloading facilities exist and are provided with rail service.
Transportation Technology Center, Inc.
Of note in any rail discussion in Pueblo County is the Transportation Technology Center, Inc. (TTCI). An internationally recognized facility, TTCI offers a wide range of unique capabilities for research, development, testing, consulting, and training for railway-related technologies. The site, 21 miles northeast of Pueblo, Colorado, is owned by the United States Department of Transportation (USDOT) and is operated and maintained by TTCI, under a care, custody, and control contract with the Federal Railroad Administration (FRA) and Association of American Railroads (AAR). Figure 11.8 illustrates the TTCI trackage.
Figure 11.8: Transportation Technology Center Trackage
Source: Data from ResearchGate, “Discrete Element Modeling of Railroad Ballast Using Imaging Based Aggregate Morphology Characterization,” Figure 4, https://www.researchgate.net/figure/TTCI-Test-Track-Courtesy-of-Transportation-Technology-Center-Inc_fig20_43939624/download.
176 | April 2021 PACOG MOVES the Region 2045 LRTP
11.2.4 Pueblo County – Air Freight Existing Conditions
The Pueblo Memorial Airport (PUB) is located at 31201 Bryan Circle, about six miles east of downtown Pueblo. It features:
Three runways with the longest measuring 10,496 feet.
A Federal Aviation Administration (FAA) air traffic control tower, the Terminal Radar Approach Control in Tower Cab (TRACAB).
The National Weather Service on site with Next-Generation Radar (NEXRAD) and Automated Surface Observing Systems (ASOS).
A 24-hour fire station with airport rescue firefighting on site and Index B capabilities.
Airport facilities, including terminal, restaurant space, and rental car services.
Navigational aids, including very high-frequency omni-directional range (VOR), instrumental landing system (ILS), non-directional beacon (NDB), and Global Positioning System (GPS) instrument approaches.
Two fixed-base operators (FBOs), a flight school, and a self-serve 100LL fuel station.
Air-based freight movement in and out of Pueblo is a very small proportion of total freight flows. The USDOT Bureau of Transportation Statistics (BTS) provides records for air carrier statistics (T-100 data) for all U.S. airports. Both mail and freight use the air cargo facilities at the Pueblo Airport, and the tonnage shows only small variation over the past five years. Outbound combined freight/mail shipments by air in 2019 summed to 51,000 pounds. 51
··················· 51 “Airline Activity: Air Freight Summary,” USDOT, Bureau of Transportation Statistics, accessed July 28, 2020, https://www.transtats.bts.gov/airports.asp?pn=1&Airport=PUB&Airport_Name=Pueblo, CO: Pueblo Memorial&carrier=FACTS.
11.3 Commodity Flows by Freight Mode
The goal of conducting an inventory of freight infrastructure and use of facilities is to understand the modes that are in place to move commodities. This section looks beneath the actual freight mode, such as truck, rail, or air, to identify the goods that are being moved into, out of, and within Pueblo County. The type of commodities and the changes expected to occur provide some insight for county freight planning. The framework of analyzing freight at the national, then state, and then Pueblo County level is used.
11.3.1 Data Sources
PACOG has a key data source available for tabulating freight mode and commodity flows for both a base (current) year and a future year: the Federal Highway Administration (FHWA) Freight Analysis Framework (FAF) data. Supported by the FHWA, FAF is a public database that integrates data from a variety of business sources to create a comprehensive picture of freight movement among states and major metropolitan areas by all modes of transportation. With data from the 2012 Commodity Flow Survey and additional sources, FAF version 4 (FAF4) provides estimates for tonnage and value by region of origin and destination, commodity type, and mode for individual years from 2002 to 2045. These tabulations are used to provide national, state, and Pueblo County freight tabulation for 2020 and 2045 to serve the PACOG LRTP.52
It is important to note that this report has been released during the 2020 COVID-19 pandemic, which has greatly affected all industries throughout the United States.
52 FHWA Freight Analysis Framework (FAF) Data Tabulation Tool, data for US & Colorado, accessed April 15, 2020, https://faf.ornl.gov/fafweb/Extraction1.aspx.
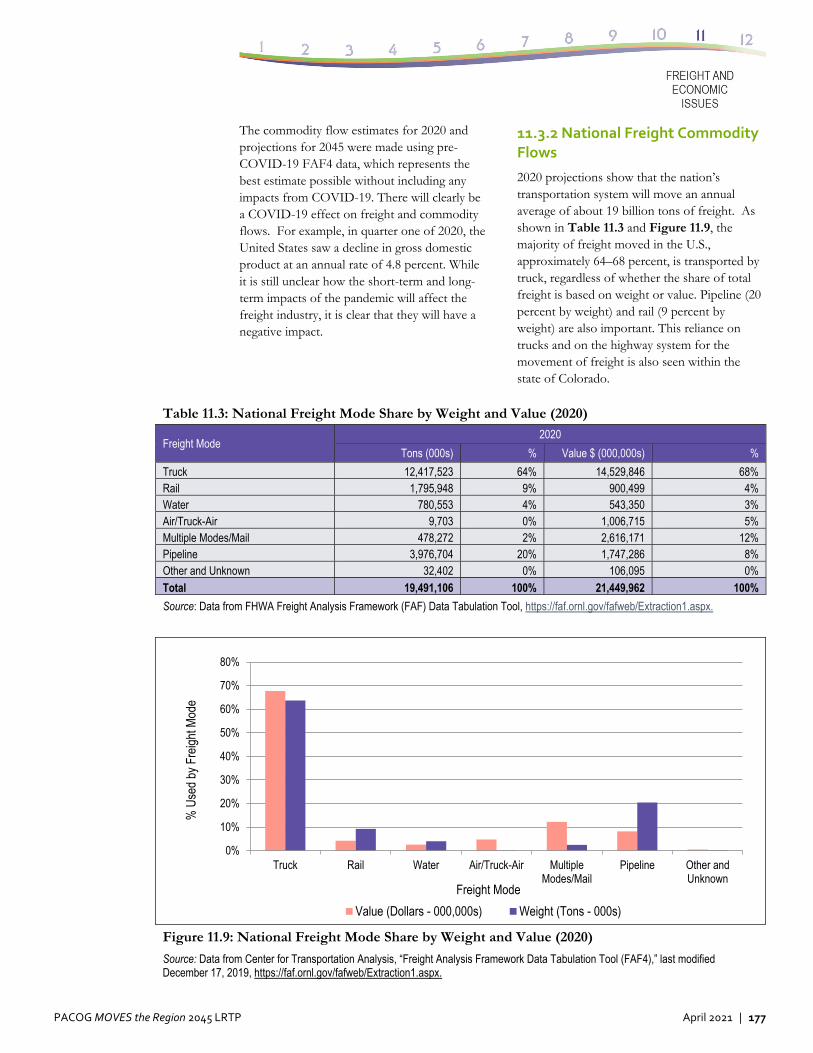
PACOG MOVES the Region 2045 LRTP April 2021 | 177
The commodity flow estimates for 2020 and projections for 2045 were made using pre-COVID-19 FAF4 data, which represents the best estimate possible without including any impacts from COVID-19. There will clearly be a COVID-19 effect on freight and commodity flows. For example, in quarter one of 2020, the United States saw a decline in gross domestic product at an annual rate of 4.8 percent. While it is still unclear how the short-term and long-term impacts of the pandemic will affect the freight industry, it is clear that they will have a negative impact.
11.3.2 National Freight Commodity Flows
2020 projections show that the nation’s transportation system will move an annual average of about 19 billion tons of freight. As shown in Table 11.3 and Figure 11.9, the majority of freight moved in the U.S., approximately 64–68 percent, is transported by truck, regardless of whether the share of total freight is based on weight or value. Pipeline (20 percent by weight) and rail (9 percent by weight) are also important. This reliance on trucks and on the highway system for the movement of freight is also seen within the state of Colorado.
Table 11.3: National Freight Mode Share by Weight and Value (2020)
Freight Mode 2020
Tons (000s) % Value $ (000,000s) %
Truck 12,417,523 64% 14,529,846 68% Rail 1,795,948 9% 900,499 4% Water 780,553 4% 543,350 3% Air/Truck-Air 9,703 0% 1,006,715 5% Multiple Modes/Mail 478,272 2% 2,616,171 12% Pipeline 3,976,704 20% 1,747,286 8% Other and Unknown 32,402 0% 106,095 0% Total 19,491,106 100% 21,449,962 100%
Source: Data from FHWA Freight Analysis Framework (FAF) Data Tabulation Tool, https://faf.ornl.gov/fafweb/Extraction1.aspx.
Figure 11.9: National Freight Mode Share by Weight and Value (2020)
Source: Data from Center for Transportation Analysis, “Freight Analysis Framework Data Tabulation Tool (FAF4),” last modified December 17, 2019, https://faf.ornl.gov/fafweb/Extraction1.aspx.
0%
10%
20%
30%
40%
50%
60%
70%
80%
Truck Rail Water Air/Truck-Air MultipleModes/Mail
Pipeline Other andUnknown
% U
sed
by F
reig
ht M
ode
Freight Mode
Value (Dollars - 000,000s) Weight (Tons - 000s)
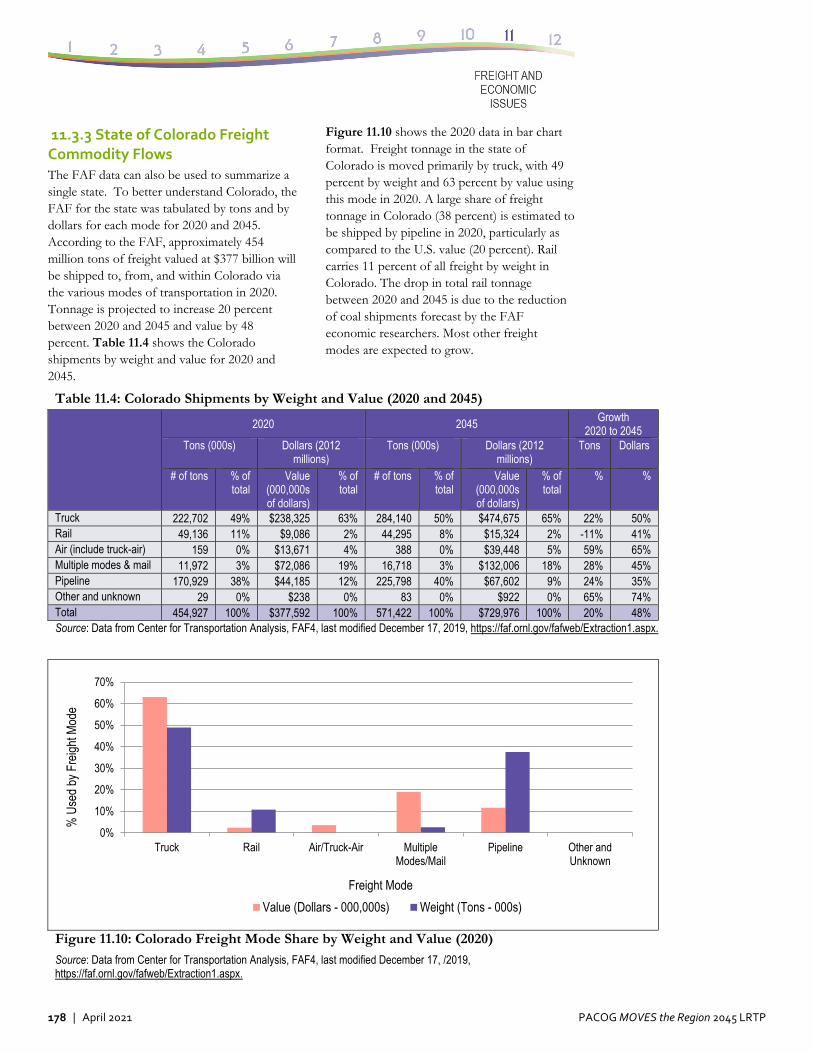
178 | April 2021 PACOG MOVES the Region 2045 LRTP
11.3.3 State of Colorado Freight Commodity Flows The FAF data can also be used to summarize a single state. To better understand Colorado, the FAF for the state was tabulated by tons and by dollars for each mode for 2020 and 2045. According to the FAF, approximately 454 million tons of freight valued at $377 billion will be shipped to, from, and within Colorado via the various modes of transportation in 2020. Tonnage is projected to increase 20 percent between 2020 and 2045 and value by 48 percent. Table 11.4 shows the Colorado shipments by weight and value for 2020 and 2045.
Figure 11.10 shows the 2020 data in bar chart format. Freight tonnage in the state of Colorado is moved primarily by truck, with 49 percent by weight and 63 percent by value using this mode in 2020. A large share of freight tonnage in Colorado (38 percent) is estimated to be shipped by pipeline in 2020, particularly as compared to the U.S. value (20 percent). Rail carries 11 percent of all freight by weight in Colorado. The drop in total rail tonnage between 2020 and 2045 is due to the reduction of coal shipments forecast by the FAF economic researchers. Most other freight modes are expected to grow.
Table 11.4: Colorado Shipments by Weight and Value (2020 and 2045)
2020 2045 Growth
2020 to 2045 Tons (000s) Dollars (2012
millions) Tons (000s) Dollars (2012
millions) Tons Dollars
# of tons % of total
Value (000,000s of dollars)
% of total
# of tons % of total
Value (000,000s of dollars)
% of total
% %
Truck 222,702 49% $238,325 63% 284,140 50% $474,675 65% 22% 50% Rail 49,136 11% $9,086 2% 44,295 8% $15,324 2% -11% 41% Air (include truck-air) 159 0% $13,671 4% 388 0% $39,448 5% 59% 65% Multiple modes & mail 11,972 3% $72,086 19% 16,718 3% $132,006 18% 28% 45% Pipeline 170,929 38% $44,185 12% 225,798 40% $67,602 9% 24% 35% Other and unknown 29 0% $238 0% 83 0% $922 0% 65% 74% Total 454,927 100% $377,592 100% 571,422 100% $729,976 100% 20% 48% Source: Data from Center for Transportation Analysis, FAF4, last modified December 17, 2019, https://faf.ornl.gov/fafweb/Extraction1.aspx.
Figure 11.10: Colorado Freight Mode Share by Weight and Value (2020)
Source: Data from Center for Transportation Analysis, FAF4, last modified December 17, /2019, https://faf.ornl.gov/fafweb/Extraction1.aspx.
0%
10%
20%
30%
40%
50%
60%
70%
Truck Rail Air/Truck-Air MultipleModes/Mail
Pipeline Other andUnknown
% U
sed
by F
reig
ht M
ode
Freight Mode
Value (Dollars - 000,000s) Weight (Tons - 000s)
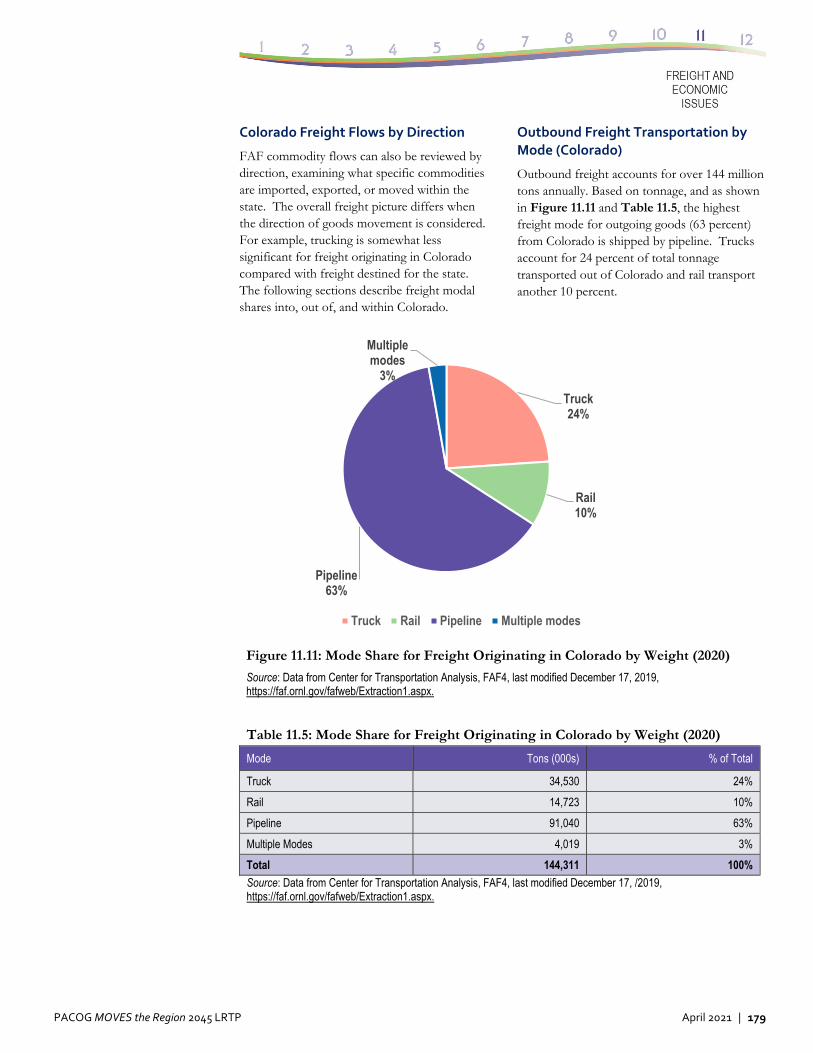
PACOG MOVES the Region 2045 LRTP April 2021 | 179
Colorado Freight Flows by Direction
FAF commodity flows can also be reviewed by direction, examining what specific commodities are imported, exported, or moved within the state. The overall freight picture differs when the direction of goods movement is considered. For example, trucking is somewhat less significant for freight originating in Colorado compared with freight destined for the state. The following sections describe freight modal shares into, out of, and within Colorado.
Outbound Freight Transportation by Mode (Colorado)
Outbound freight accounts for over 144 million tons annually. Based on tonnage, and as shown in Figure 11.11 and Table 11.5, the highest freight mode for outgoing goods (63 percent) from Colorado is shipped by pipeline. Trucks account for 24 percent of total tonnage transported out of Colorado and rail transport another 10 percent.
Figure 11.11: Mode Share for Freight Originating in Colorado by Weight (2020)
Source: Data from Center for Transportation Analysis, FAF4, last modified December 17, 2019, https://faf.ornl.gov/fafweb/Extraction1.aspx.
Table 11.5: Mode Share for Freight Originating in Colorado by Weight (2020)
Mode Tons (000s) % of Total
Truck 34,530 24%
Rail 14,723 10%
Pipeline 91,040 63%
Multiple Modes 4,019 3%
Total 144,311 100%
Source: Data from Center for Transportation Analysis, FAF4, last modified December 17, /2019, https://faf.ornl.gov/fafweb/Extraction1.aspx.
Truck24%
Rail10%
Pipeline63%
Multiple modes
3%
Truck Rail Pipeline Multiple modes
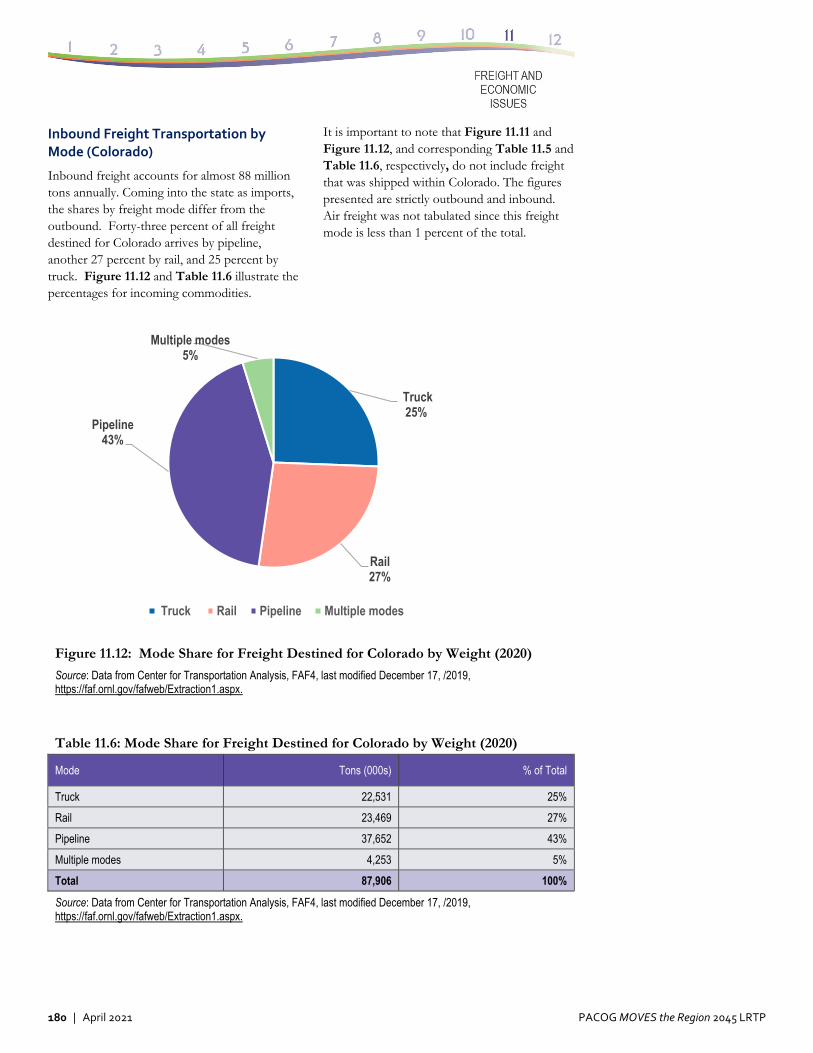
180 | April 2021 PACOG MOVES the Region 2045 LRTP
Inbound Freight Transportation by Mode (Colorado)
Inbound freight accounts for almost 88 million tons annually. Coming into the state as imports, the shares by freight mode differ from the outbound. Forty-three percent of all freight destined for Colorado arrives by pipeline, another 27 percent by rail, and 25 percent by truck. Figure 11.12 and Table 11.6 illustrate the percentages for incoming commodities.
It is important to note that Figure 11.11 and Figure 11.12, and corresponding Table 11.5 and Table 11.6, respectively, do not include freight that was shipped within Colorado. The figures presented are strictly outbound and inbound. Air freight was not tabulated since this freight mode is less than 1 percent of the total.
Figure 11.12: Mode Share for Freight Destined for Colorado by Weight (2020)
Source: Data from Center for Transportation Analysis, FAF4, last modified December 17, /2019, https://faf.ornl.gov/fafweb/Extraction1.aspx.
Table 11.6: Mode Share for Freight Destined for Colorado by Weight (2020)
Mode Tons (000s) % of Total
Truck 22,531 25%
Rail 23,469 27%
Pipeline 37,652 43%
Multiple modes 4,253 5%
Total 87,906 100%
Source: Data from Center for Transportation Analysis, FAF4, last modified December 17, /2019, https://faf.ornl.gov/fafweb/Extraction1.aspx.
Truck 25%
Rail27%
Pipeline43%
Multiple modes5%
Truck Rail Pipeline Multiple modes
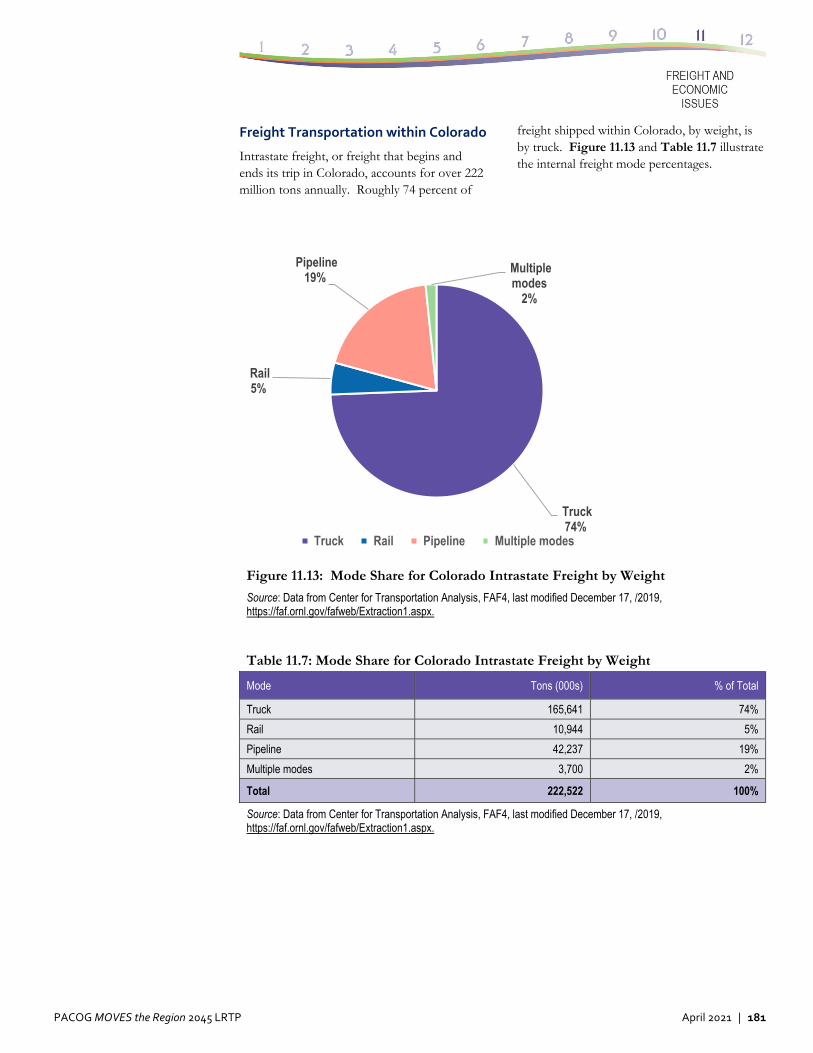
PACOG MOVES the Region 2045 LRTP April 2021 | 181
Freight Transportation within Colorado
Intrastate freight, or freight that begins and ends its trip in Colorado, accounts for over 222 million tons annually. Roughly 74 percent of
freight shipped within Colorado, by weight, is by truck. Figure 11.13 and Table 11.7 illustrate the internal freight mode percentages.
Figure 11.13: Mode Share for Colorado Intrastate Freight by Weight
Source: Data from Center for Transportation Analysis, FAF4, last modified December 17, /2019, https://faf.ornl.gov/fafweb/Extraction1.aspx.
Table 11.7: Mode Share for Colorado Intrastate Freight by Weight
Mode Tons (000s) % of Total
Truck 165,641 74%
Rail 10,944 5%
Pipeline 42,237 19%
Multiple modes 3,700 2%
Total 222,522 100%
Source: Data from Center for Transportation Analysis, FAF4, last modified December 17, /2019, https://faf.ornl.gov/fafweb/Extraction1.aspx.
Truck 74%
Rail 5%
Pipeline 19%
Multiple modes
2%
Truck Rail Pipeline Multiple modes
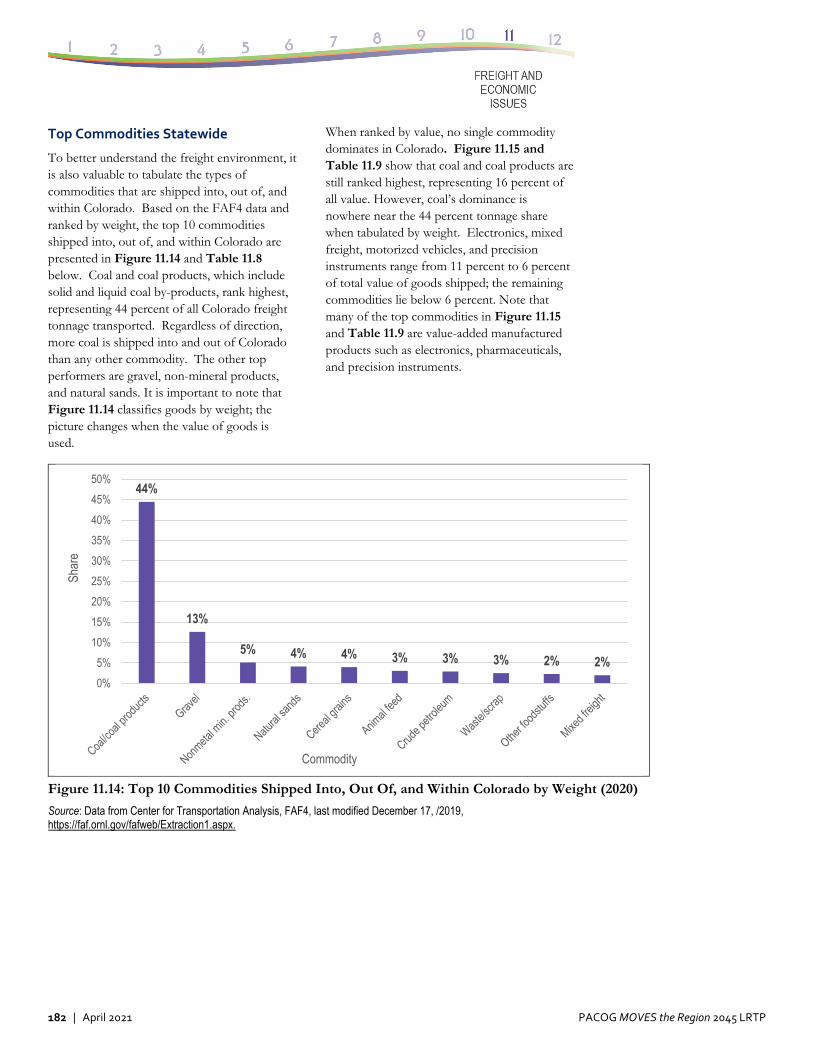
182 | April 2021 PACOG MOVES the Region 2045 LRTP
Top Commodities Statewide
To better understand the freight environment, it is also valuable to tabulate the types of commodities that are shipped into, out of, and within Colorado. Based on the FAF4 data and ranked by weight, the top 10 commodities shipped into, out of, and within Colorado are presented in Figure 11.14 and Table 11.8 below. Coal and coal products, which include solid and liquid coal by-products, rank highest, representing 44 percent of all Colorado freight tonnage transported. Regardless of direction, more coal is shipped into and out of Colorado than any other commodity. The other top performers are gravel, non-mineral products, and natural sands. It is important to note that Figure 11.14 classifies goods by weight; the picture changes when the value of goods is used.
When ranked by value, no single commodity dominates in Colorado. Figure 11.15 and Table 11.9 show that coal and coal products are still ranked highest, representing 16 percent of all value. However, coal’s dominance is nowhere near the 44 percent tonnage share when tabulated by weight. Electronics, mixed freight, motorized vehicles, and precision instruments range from 11 percent to 6 percent of total value of goods shipped; the remaining commodities lie below 6 percent. Note that many of the top commodities in Figure 11.15 and Table 11.9 are value-added manufactured products such as electronics, pharmaceuticals, and precision instruments.
Figure 11.14: Top 10 Commodities Shipped Into, Out Of, and Within Colorado by Weight (2020)
Source: Data from Center for Transportation Analysis, FAF4, last modified December 17, /2019, https://faf.ornl.gov/fafweb/Extraction1.aspx.
44%
13%
5% 4% 4% 3% 3% 3% 2% 2%
0%
5%
10%
15%
20%
25%
30%
35%
40%
45%
50%
Shar
e
Commodity
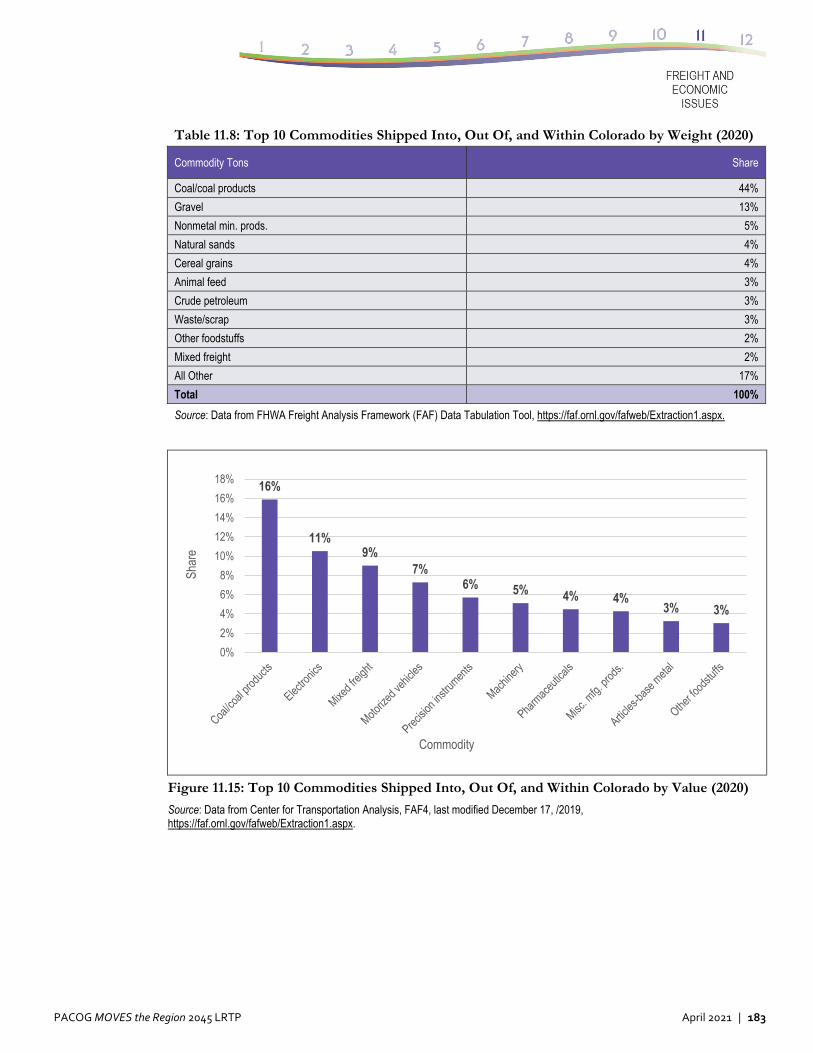
PACOG MOVES the Region 2045 LRTP April 2021 | 183
Table 11.8: Top 10 Commodities Shipped Into, Out Of, and Within Colorado by Weight (2020)
Commodity Tons Share
Coal/coal products 44%
Gravel 13%
Nonmetal min. prods. 5%
Natural sands 4%
Cereal grains 4%
Animal feed 3%
Crude petroleum 3%
Waste/scrap 3%
Other foodstuffs 2%
Mixed freight 2%
All Other 17%
Total 100%
Source: Data from FHWA Freight Analysis Framework (FAF) Data Tabulation Tool, https://faf.ornl.gov/fafweb/Extraction1.aspx.
Figure 11.15: Top 10 Commodities Shipped Into, Out Of, and Within Colorado by Value (2020)
Source: Data from Center for Transportation Analysis, FAF4, last modified December 17, /2019, https://faf.ornl.gov/fafweb/Extraction1.aspx.
16%
11%9%
7%6% 5% 4% 4%
3% 3%
0%
2%
4%
6%
8%
10%
12%
14%
16%
18%
Shar
e
Commodity
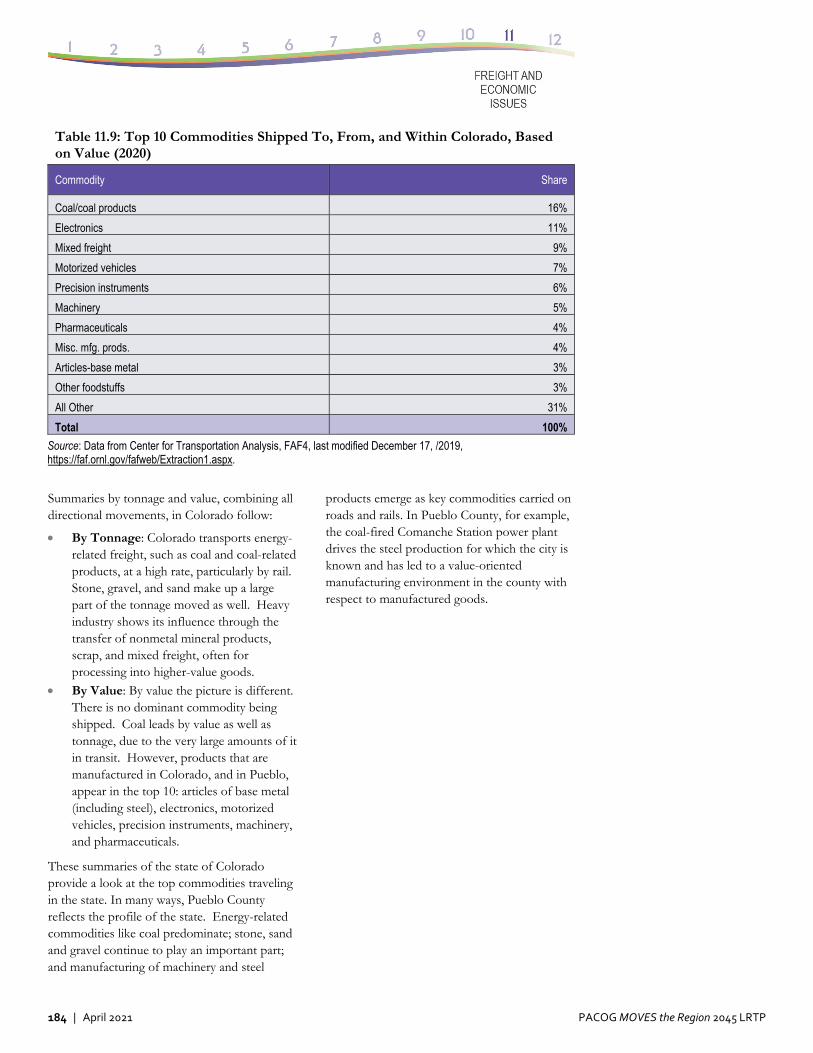
184 | April 2021 PACOG MOVES the Region 2045 LRTP
Table 11.9: Top 10 Commodities Shipped To, From, and Within Colorado, Based on Value (2020)
Commodity Share
Coal/coal products 16%
Electronics 11%
Mixed freight 9%
Motorized vehicles 7%
Precision instruments 6%
Machinery 5%
Pharmaceuticals 4%
Misc. mfg. prods. 4%
Articles-base metal 3%
Other foodstuffs 3%
All Other 31%
Total 100%
Source: Data from Center for Transportation Analysis, FAF4, last modified December 17, /2019, https://faf.ornl.gov/fafweb/Extraction1.aspx.
Summaries by tonnage and value, combining all directional movements, in Colorado follow:
By Tonnage: Colorado transports energy-related freight, such as coal and coal-related products, at a high rate, particularly by rail. Stone, gravel, and sand make up a large part of the tonnage moved as well. Heavy industry shows its influence through the transfer of nonmetal mineral products, scrap, and mixed freight, often for processing into higher-value goods.
By Value: By value the picture is different. There is no dominant commodity being shipped. Coal leads by value as well as tonnage, due to the very large amounts of it in transit. However, products that are manufactured in Colorado, and in Pueblo, appear in the top 10: articles of base metal (including steel), electronics, motorized vehicles, precision instruments, machinery, and pharmaceuticals.
These summaries of the state of Colorado provide a look at the top commodities traveling in the state. In many ways, Pueblo County reflects the profile of the state. Energy-related commodities like coal predominate; stone, sand and gravel continue to play an important part; and manufacturing of machinery and steel
products emerge as key commodities carried on roads and rails. In Pueblo County, for example, the coal-fired Comanche Station power plant drives the steel production for which the city is known and has led to a value-oriented manufacturing environment in the county with respect to manufactured goods.
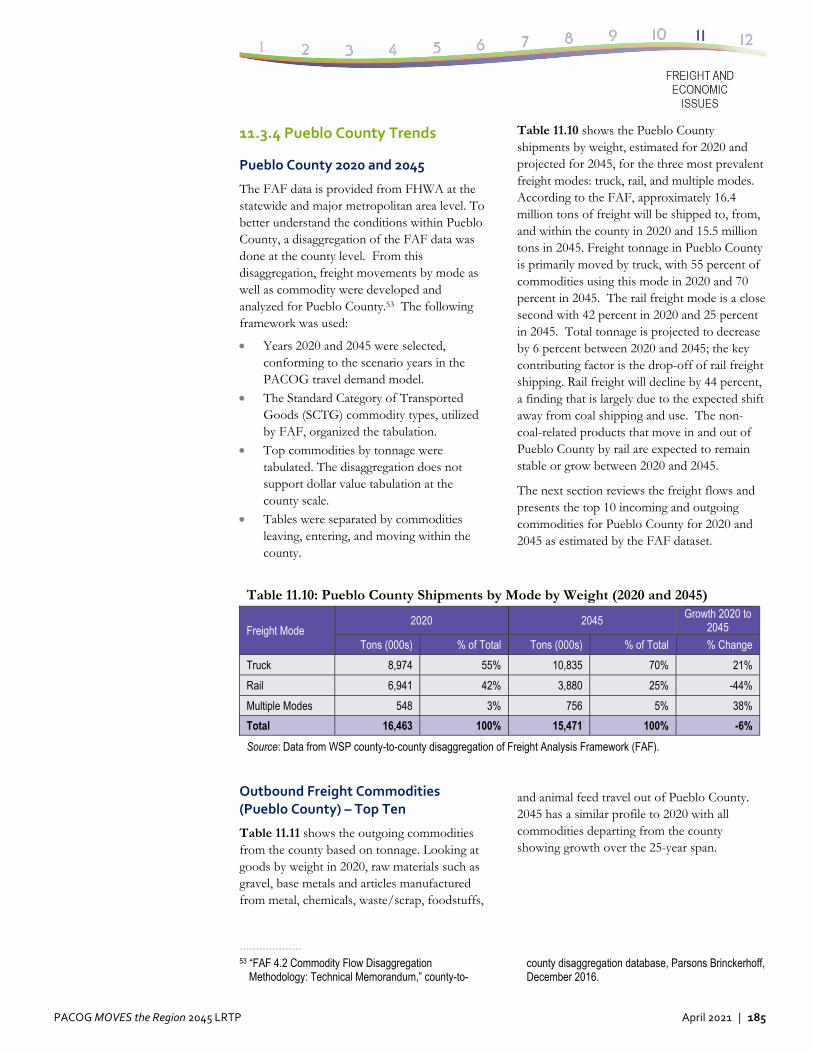
PACOG MOVES the Region 2045 LRTP April 2021 | 185
11.3.4 Pueblo County Trends
Pueblo County 2020 and 2045
The FAF data is provided from FHWA at the statewide and major metropolitan area level. To better understand the conditions within Pueblo County, a disaggregation of the FAF data was done at the county level. From this disaggregation, freight movements by mode as well as commodity were developed and analyzed for Pueblo County.53 The following framework was used:
Years 2020 and 2045 were selected, conforming to the scenario years in the PACOG travel demand model.
The Standard Category of Transported Goods (SCTG) commodity types, utilized by FAF, organized the tabulation.
Top commodities by tonnage were tabulated. The disaggregation does not support dollar value tabulation at the county scale.
Tables were separated by commodities leaving, entering, and moving within the county.
Table 11.10 shows the Pueblo County shipments by weight, estimated for 2020 and projected for 2045, for the three most prevalent freight modes: truck, rail, and multiple modes. According to the FAF, approximately 16.4 million tons of freight will be shipped to, from, and within the county in 2020 and 15.5 million tons in 2045. Freight tonnage in Pueblo County is primarily moved by truck, with 55 percent of commodities using this mode in 2020 and 70 percent in 2045. The rail freight mode is a close second with 42 percent in 2020 and 25 percent in 2045. Total tonnage is projected to decrease by 6 percent between 2020 and 2045; the key contributing factor is the drop-off of rail freight shipping. Rail freight will decline by 44 percent, a finding that is largely due to the expected shift away from coal shipping and use. The non-coal-related products that move in and out of Pueblo County by rail are expected to remain stable or grow between 2020 and 2045.
The next section reviews the freight flows and presents the top 10 incoming and outgoing commodities for Pueblo County for 2020 and 2045 as estimated by the FAF dataset.
Table 11.10: Pueblo County Shipments by Mode by Weight (2020 and 2045)
Freight Mode 2020 2045
Growth 2020 to 2045
Tons (000s) % of Total Tons (000s) % of Total % Change
Truck 8,974 55% 10,835 70% 21%
Rail 6,941 42% 3,880 25% -44%
Multiple Modes 548 3% 756 5% 38%
Total 16,463 100% 15,471 100% -6%
Source: Data from WSP county-to-county disaggregation of Freight Analysis Framework (FAF).
Outbound Freight Commodities (Pueblo County) – Top Ten
Table 11.11 shows the outgoing commodities from the county based on tonnage. Looking at goods by weight in 2020, raw materials such as gravel, base metals and articles manufactured from metal, chemicals, waste/scrap, foodstuffs,
··················· 53 “FAF 4.2 Commodity Flow Disaggregation
Methodology: Technical Memorandum,” county-to-
and animal feed travel out of Pueblo County. 2045 has a similar profile to 2020 with all commodities departing from the county showing growth over the 25-year span.
county disaggregation database, Parsons Brinckerhoff, December 2016.
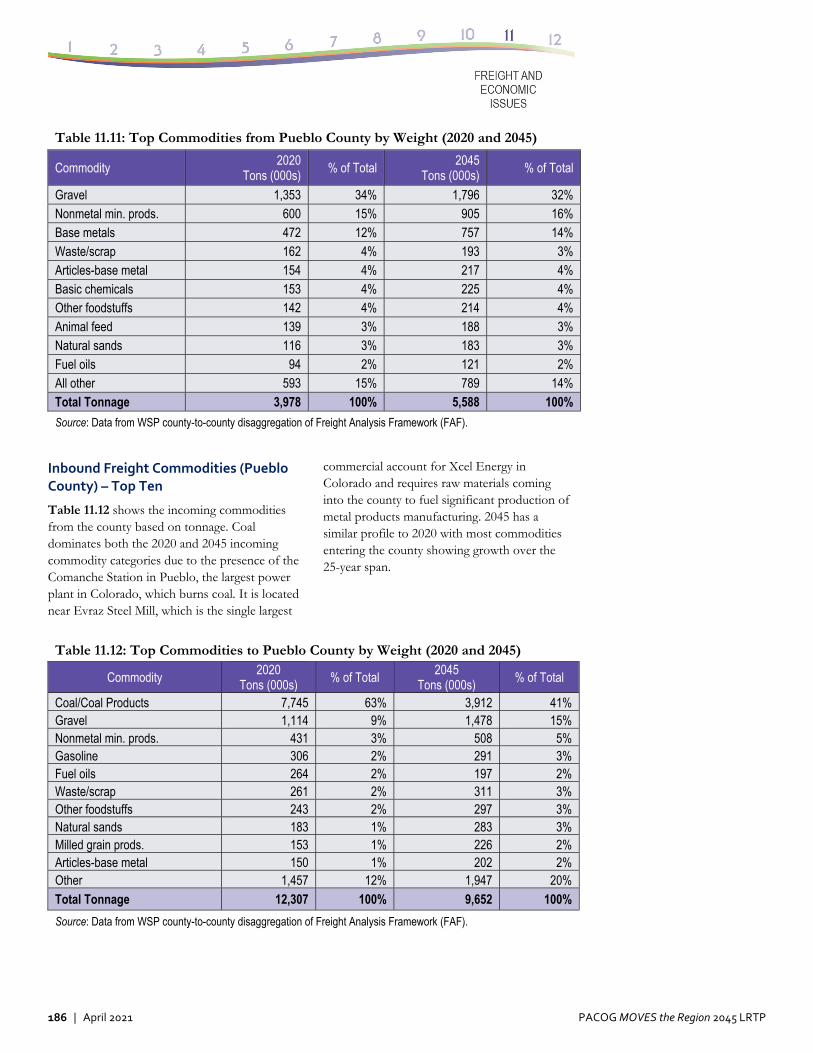
186 | April 2021 PACOG MOVES the Region 2045 LRTP
Table 11.11: Top Commodities from Pueblo County by Weight (2020 and 2045)
Commodity 2020 Tons (000s)
% of Total 2045 Tons (000s)
% of Total
Gravel 1,353 34% 1,796 32% Nonmetal min. prods. 600 15% 905 16% Base metals 472 12% 757 14% Waste/scrap 162 4% 193 3% Articles-base metal 154 4% 217 4% Basic chemicals 153 4% 225 4% Other foodstuffs 142 4% 214 4% Animal feed 139 3% 188 3% Natural sands 116 3% 183 3% Fuel oils 94 2% 121 2% All other 593 15% 789 14% Total Tonnage 3,978 100% 5,588 100%
Source: Data from WSP county-to-county disaggregation of Freight Analysis Framework (FAF).
Inbound Freight Commodities (Pueblo County) – Top Ten
Table 11.12 shows the incoming commodities from the county based on tonnage. Coal dominates both the 2020 and 2045 incoming commodity categories due to the presence of the Comanche Station in Pueblo, the largest power plant in Colorado, which burns coal. It is located near Evraz Steel Mill, which is the single largest
commercial account for Xcel Energy in Colorado and requires raw materials coming into the county to fuel significant production of metal products manufacturing. 2045 has a similar profile to 2020 with most commodities entering the county showing growth over the 25-year span.
Table 11.12: Top Commodities to Pueblo County by Weight (2020 and 2045)
Commodity 2020
Tons (000s) % of Total 2045
Tons (000s) % of Total
Coal/Coal Products 7,745 63% 3,912 41% Gravel 1,114 9% 1,478 15% Nonmetal min. prods. 431 3% 508 5% Gasoline 306 2% 291 3% Fuel oils 264 2% 197 2% Waste/scrap 261 2% 311 3% Other foodstuffs 243 2% 297 3% Natural sands 183 1% 283 3% Milled grain prods. 153 1% 226 2% Articles-base metal 150 1% 202 2% Other 1,457 12% 1,947 20% Total Tonnage 12,307 100% 9,652 100%
Source: Data from WSP county-to-county disaggregation of Freight Analysis Framework (FAF).
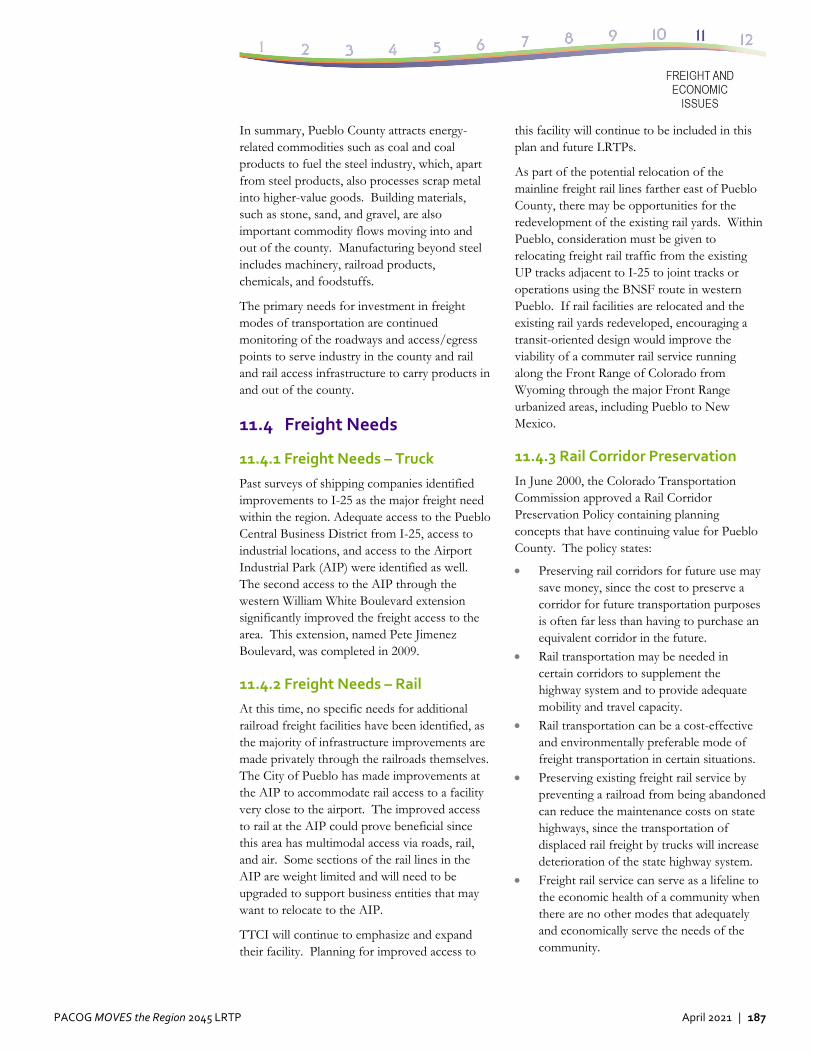
PACOG MOVES the Region 2045 LRTP April 2021 | 187
In summary, Pueblo County attracts energy-related commodities such as coal and coal products to fuel the steel industry, which, apart from steel products, also processes scrap metal into higher-value goods. Building materials, such as stone, sand, and gravel, are also important commodity flows moving into and out of the county. Manufacturing beyond steel includes machinery, railroad products, chemicals, and foodstuffs.
The primary needs for investment in freight modes of transportation are continued monitoring of the roadways and access/egress points to serve industry in the county and rail and rail access infrastructure to carry products in and out of the county.
11.4 Freight Needs
11.4.1 Freight Needs – Truck
Past surveys of shipping companies identified improvements to I-25 as the major freight need within the region. Adequate access to the Pueblo Central Business District from I-25, access to industrial locations, and access to the Airport Industrial Park (AIP) were identified as well. The second access to the AIP through the western William White Boulevard extension significantly improved the freight access to the area. This extension, named Pete Jimenez Boulevard, was completed in 2009.
11.4.2 Freight Needs – Rail
At this time, no specific needs for additional railroad freight facilities have been identified, as the majority of infrastructure improvements are made privately through the railroads themselves. The City of Pueblo has made improvements at the AIP to accommodate rail access to a facility very close to the airport. The improved access to rail at the AIP could prove beneficial since this area has multimodal access via roads, rail, and air. Some sections of the rail lines in the AIP are weight limited and will need to be upgraded to support business entities that may want to relocate to the AIP.
TTCI will continue to emphasize and expand their facility. Planning for improved access to
this facility will continue to be included in this plan and future LRTPs.
As part of the potential relocation of the mainline freight rail lines farther east of Pueblo County, there may be opportunities for the redevelopment of the existing rail yards. Within Pueblo, consideration must be given to relocating freight rail traffic from the existing UP tracks adjacent to I-25 to joint tracks or operations using the BNSF route in western Pueblo. If rail facilities are relocated and the existing rail yards redeveloped, encouraging a transit-oriented design would improve the viability of a commuter rail service running along the Front Range of Colorado from Wyoming through the major Front Range urbanized areas, including Pueblo to New Mexico.
11.4.3 Rail Corridor Preservation
In June 2000, the Colorado Transportation Commission approved a Rail Corridor Preservation Policy containing planning concepts that have continuing value for Pueblo County. The policy states:
Preserving rail corridors for future use may save money, since the cost to preserve a corridor for future transportation purposes is often far less than having to purchase an equivalent corridor in the future.
Rail transportation may be needed in certain corridors to supplement the highway system and to provide adequate mobility and travel capacity.
Rail transportation can be a cost-effective and environmentally preferable mode of freight transportation in certain situations.
Preserving existing freight rail service by preventing a railroad from being abandoned can reduce the maintenance costs on state highways, since the transportation of displaced rail freight by trucks will increase deterioration of the state highway system.
Freight rail service can serve as a lifeline to the economic health of a community when there are no other modes that adequately and economically serve the needs of the community.
188 | April 2021 PACOG MOVES the Region 2045 LRTP
The Rail Corridor Preservation Policy also identified the following criteria to be used to prioritize corridors for funding:
Magnitude of negative impacts upon adjacent highways.
Immediacy of the possible abandonment of the rail line.
Immediacy of possible encroachment on an existing rail corridor that may jeopardize the implementation of passenger rail service in the corridor.
Estimated cost to acquire the rail corridor. Opportunity for public-private
partnerships.
Subsequently, in November 2000, CDOT identified a list of State Significant Rail Corridors, which was adopted by the Transportation Commission as part of the Statewide Transportation Plan. The criteria used to identify these state corridors included existing and potential future demand for passenger and freight services and local/regional support for the preservation of the corridor.54 It is the intent of PACOG to remain aware and involved in CDOT rail preservation efforts.
In 2018, CDOT updated this effort with a follow-on report examining rail abandonment and the potential for rail line acquisition.55 In the Pueblo region, the single relevant service noted was Amtrak’s Southwest Chief.
11.5 Summary
PACOG understands the FAST Act environment and how the MPO collaborates with federal and state efforts to leverage freight planning. PACOG conducts planning with full knowledge of the assets in place in the MPO region as well as the commodities that move in and out of the region. On the freight supply side for trucks in the MPO, there are two strategic
··················· 54 “Prioritization of Railroad Corridors for Preservation,”
Colorado Department of Transportation, October 1, 2013, pp. 5–6, https://www.colorado.gov/pacific/sites/default/files/CDOT%20Prioritization%20of%20Railroad%20Corridors%20for%20Preservation.pdf.
55 “Report to the Transportation Legislation Review Committee on Rail Abandonments and the Potential for Rail Line Acquisitions”, Colorado Department of
national highways, I-25 and U.S. Highway 50, plus a set of state highways. Two Class I railroads (BNSF and UP) and the C&W switching railroad also serve the PACOG area. The Pueblo Airport provides a third means of moving cargo. In service of the PACOG LRTP, an FHWA data source was tapped to understand the commodity flows into and out of the state and county. This source was the 2020 and 2045 FAF, which provided a snapshot of goods movements in the region. Key long-range plans related to freight are to focus on concepts cited in the PACOG freight plan: safety, efficiency, economic vitality, and environmental stewardship. Tactics include investment in I-25, U.S. Highway 50, and rail and air assets in the region.
Transportation, September 2018, https://www.codot.gov/programs/transitandrail/plans-studies-reports/report-to-the-transportation-legislation-review-committee-on-rail-abandonments-and-the-potential-for-rail-line-acquisitions
PACOG MOVES the Region 2045 LRTP April 2021 | 189
12.0 Financial Plan
12.1 Introduction
This chapter describes the revenue sources, anticipated revenues, and estimated costs to maintain, operate, and expand the transportation system in the Pueblo Transportation Planning Region (TPR) from 2021 until 2045. The financial analysis presented in this chapter meets the federal transportation planning requirements pursuant to the Fixing America’s Surface Transportation (FAST) Act (2015). Though the FAST Act expired on September 30, 2020, its planning requirements remain in effect until and unless modified by future legislation. In particular, the requirements for a financial plan as part of the long range transportation plan (LRTP) are found in the Code of Federal Regulations at 23 CFR § 450.324(f)(11).
It must be emphasized that this is a long-range, systems-level plan; most of the cost and revenue estimates will be revisited several times over the years before the projects are undertaken. The intent of this plan is to provide an approximate but realistic estimate of both the total funds available and the total program cost. This information is helpful in determining which transportation improvements should be prioritized when funding needs exceed available resources, which is typically the case.
12.2 Critical Funding Challenges
Federal and state transportation funds are critically important to the PACOG region, and these revenue sources have not increased sufficiently over time to keep up with increasing construction costs and increased population-based transportation demand, as noted in the “Funding Not Keeping Pace” text box to the left. In the absence of new or enhanced revenue sources, this trend is expected to continue.
Colorado is one of many states that has pointed out that its limited funds will be spent predominantly on maintaining existing roadways, rather than on adding new road
capacity. Due to lack of funding for capacity projects, many key highways in the Denver region now have tolled express lanes. Tolled lanes are currently being constructed on Interstate 25 (I-25) between Castle Rock and Monument, north of Colorado Springs. Additionally, the Colorado Department of Transportation (CDOT) is increasingly focusing its expenditures on transit and other alternatives to reduce reliance on single-occupant use of automobiles.
Satisfying the Pueblo region’s transportation financial needs during the next 25 years is a major challenge. For example, the Final Environmental Impact Statement (FEIS) for improvements to I-25 (constructed some 60 years ago) called for reconstructing the highway to correct many design deficiencies that do not meet modern freeway standards. The Preferred Alternative from this FEIS was estimated to cost $760 million in 2010 dollars. The FEIS recognized that this project would have to be designed and constructed in phases over many years. I-25 is the busiest roadway in the Pueblo region and is vital to its economy, but the region has other transportation needs as well.
COVID‐19 Impact on Transportation Funding
Emergence of the global corona virus disease (COVID-19) pandemic in December 2019 sent shock waves through the national economy in early 2020, reaching down to every community. Many businesses were temporarily closed, and employees and customers stayed at home, not driving their motor vehicles, and not using public transportation. While the roads remained open and were less crowded, public transit systems across the country found it necessary to reduce service and limit bus occupancy.
Funds Not Keeping Pace
The Colorado gasoline tax was last raised (to 22 cents per gallon) 29 years ago, in 1991.
The federal gasoline tax was last raised (to 18.4 cents per gallon) 27 years ago, in 1993.
Meanwhile, construction costs have increased dramatically over the past quarter of a century. Also, Colorado’s population has grown from 3.3 million in 1990 to about 5.8 million in 2020, an increase of 2.5 million (76%). Vehicle miles of travel have increased faster than the population.
Vehicle fuel economy has increased substantially over the past quarter of a century, resulting in less average tax collected for each mile driven, and electric vehicles pay no gas tax at all.
As a result of these factors, gasoline tax revenues are unable to keep pace with increasing transportation demands in Colorado, including the Pueblo region.
190 | April 2021 PACOG MOVES the Region 2045 LRTP
As part of its effort to mitigate the risk of exposure to COVID-19, Pueblo Transit reduced bus occupancy to 10 and offered fare-free service for five months, which ended on August 31, except for K–12 students.56 CDOT Bustang interregional service was cancelled for the months of April and May. except for K–12 students.57 CDOT Bustang interregional service was cancelled for the months of April and May. Transit operators faced not only reduced ridership and fare collection but also increased costs for vehicle disinfection.
Colorado’s 2020 Statewide Transit Plan states that in “March 2020, the CARES Act was signed into law to provide relief funds due to the COVID-19 pandemic. This funding allocated $30 million to rural areas. Additionally, 5311 and 5311(f) programs, used to fund Bustang and Greyhound services, also received increased funding.”58
With regard to transportation finances, CDOT’s analysts examined the state’s revenue situation to determine what sorts of immediate budget cuts might be needed. In a September 2020 memo to the Colorado Transportation Commission, CDOT’s Chief Financial Officer predicted a $50 million revenue reduction would be incurred between March 2020 and February 2021.59
Following the initial Stay-at-Home Order issued by the governor to reduce the spread of COVID-19, some parts of the economy rebounded somewhat as public health restrictions eased in counties that met the conditions of the less restrictive Safer-at-Home Order. However, as of October 2020, transportation activity had not returned to pre-COVID levels, and with increasing community spread of the virus nationwide, this may not occur until the newly released COVID-19 vaccines are widely distributed and administered.
··················· 56 “Notice: Temporary Boarding and Fare Policy,” Pueblo
Transit, updated August 24, 2020, https://www.pueblo.us/104/Pueblo-Transit.
57 “Notice: Temporary Boarding and Fare Policy,” Pueblo Transit, updated August 24, 2020, https://www.pueblo.us/104/Pueblo-Transit.
58 Colorado Department of Transportation, Statewide Transit Plan, August 20, 2020, p. 48,
For purposes of long-range planning, analysts must always be careful to be neither too optimistic during an economic surge nor too pessimistic during down times. Over the long term, conditions tend to average out to resemble historical trends. Therefore, this long-range plan relies on revenue forecasts that do not reflect a sustained long-term negative impact from the COVID-19 pandemic.
12.3 Federal Requirements for a Financial Plan As noted above, the federal regulations requiring inclusion of a financial plan in the long-range transportation plan are found at 23 CFR § 450.324(f)(11). Four key requirements from this section include:
(i) The financial plan shall contain system-level estimates of costs and revenue sources that are reasonably expected to be available to adequately operate and maintain the Federal-aid highways. [emphasis added]
(ii) The MPO(s), public transportation operator(s), and State shall cooperatively develop estimates of funds that will be available to support metropolitan transportation plan implementation.
(iii) The financial plan shall include recommendations on any additional financing strategies to fund projects and programs included in the metropolitan transportation plan. In the case of new funding sources, strategies for ensuring their availability shall be identified.
(iv) Revenue and cost estimates that support the metropolitan transportation plan must use an inflation rate(s) to reflect “year of expenditure dollars,” based on reasonable financial principles and information, developed cooperatively by the MPO,
https://www.codot.gov/programs/your-transportation-priorities/assets/statewidetransitplan.pdf.
59 Jeff Sudmeier, Colorado Department of Transportation Memorandum to the Transportation Commission, September 17, 2020, in “Colorado Transportation Commission Schedule & Agenda,” September 16–17, p. 162, https://www.codot.gov/about/transportation-commission/documents/2020-supporting-documents/september-2020/tc_bp_2020_09-final.pdf.
Fiscal Year Definitions
A calendar year (CY) is January to December, but a fiscal year (FY) is an accounting period of 12 months that can begin on any month.
The federal fiscal year (FFY) begins on October 1 and ends on the following September 30.
Colorado’s state fiscal year (SFY) begins three months earlier, on July 1, and ends on June 30.
A fiscal year ends in the year indicated (for example, SFY 2021 and FYY 2021 both end during calendar year 2021).
PACOG MOVES the Region 2045 LRTP April 2021 | 191
State(s), and public transportation operator(s).
Federal regulations also emphasize the concept of fiscal constraint, which applies intensely to the first several years in both the long-range plan and the short-term Transportation Improvement Program (TIP). Both a TIP prepared by an MPO and a statewide TIP prepared by a state department of transportation are required to be fiscally constrained such that the proposed expenditures for projects in each of those early years does not exceed the amount of funding reasonably expected to be available in each year. Beyond the near-term TIP years in the LRTP, foreseeable funding is a lot less certain, and the general concept of fiscal constraint remains applicable but not in the same rigid, year-by-year manner.
12.4 Plan Development This LRTP extends to the year 2045, with revenue and expenditure projects relying on historical patterns of funding from local, state, and federal sources, as well as additional assumptions about future economic, social, and behavioral conditions. In developing this financial plan, PACOG followed a few basic principles, as follows:
Financial planning documents developed by local agencies were incorporated when available.
Consistency with state planning documents was ensured. In May 2019, the Colorado Transportation Commission approved the fiscal year (FY) 2020–2045 Program Distribution allocation methodologies for formula programs for use in developing both the FY 2020–2045 Statewide Transportation Plan and regional transportation plans and to guide the development of the FY 2021 Statewide Transportation Improvement Program (STIP).
Published data sources were utilized to evaluate historical trends and augment local information as needed.
The first 10 years of this LRTP (short-term implementation) comprise a four-year TIP period (FY 2021–2024) and a six-year future
capital improvement period (CIP), thus providing a 10-year CIP (2021–2030). The last 15 (“outer”) years of the plan are broken out into five-year increments of funding for the period between 2031 and 2045. The dates used for the TIP and CIP refer to federal fiscal years.
12.5 Funding Sources
Provision of transportation infrastructure has traditionally been funded by user fees. Today, the major tax sources to fund transportation are federal and state fuel excise taxes, vehicle license fees, sales taxes, and transit fare box revenues. Federal funding is derived primarily from the federal gas tax, which is currently 18.4 cents per gallon for gas and 24.4 cents for diesel. Federal Highway Administration (FHWA) funds may be used to reimburse project costs for general transportation planning, preliminary engineering, right-of-way acquisition, construction, and audit.
FHWA Funding Programs
Colorado’s STIP for fiscal years 2021–2024, adopted in June 2020 by the Colorado Transportation Commission, lists and describes the Federal Highway Administration (FHWA) funding programs through which federal funding is provided to the state. It describes two programs as being for flexible use and nine other programs as being inflexible, for focused, specific uses. The two flexible programs are:
1. National Highway Performance Program (NHPP): Available for surface treatment, bridges, tunnels, walls, culverts, signals and bike/pedestrian curbs to meet requirements of the Americans with Disabilities Act (ADA).
2. Surface Transportation Block Group (STBG) Program (formerly the Surface Transportation Program [STP]): Available for all NHPP uses plus transit.
FHWA’s less flexible funding programs are listed below. For many of these, funded projects are selected by CDOT Region 2 and not PACOG.
1. Highway Safety Improvement Program (HSIP): Funds CDOT’s Hazard Elimination Program.
192 | April 2021 PACOG MOVES the Region 2045 LRTP
2. Railway Highway Elimination of Hazards: Funds CDOT’s Railroad Crossing (RRX) Program.
3. Bridge Off System (BRO) – for bridges that are not on the National Highway System.
4. National Highway Freight Program (NHFP): Funds FR8 – Freight Program.
5. Transportation Alternatives Program (TAP): Available for CDOT Statewide Projects and metro areas with population greater than 200,000.
6. Congestion Mitigation and Air Quality (CMAQ) Program: Funds available in areas with a history of air quality violations; not applicable for PACOG.
7. Emergency Relief (ER): Available only for emergency response; no funds currently programmed for the PACOG region.
Additionally, two federal funding programs are available for planning purposes but are not available for construction projects: 1. State Planning and Research (SPR): Funds
used for planning and research by CDOT and the rural Transportation Planning Regions.
2. Metropolitan Planning (MPL): Planning funds used by Metropolitan Planning Organizations, including PACOG.60
USDOT Discretionary Grants
The U.S. Department of Transportation (USDOT), typically on a yearly basis, may offer competitive, discretionary grants, which usually are awarded to perhaps one or two projects in the entire state. A current example is the Better Utilizing Investments to Leverage Development (BUILD) grant program. A prior federal administration called its discretionary program Transportation Investment Generating Economic Recover (TIGER) grants, which are no longer available. Regardless of the latest grant program’s title, there is no assurance that any particular region, such as PACOG, will win a discretionary grant, and no discretionary grant funding is assumed in this long-range plan.
··················· 60 Colorado Department of Transportation, Colorado
Statewide Transportation Improvement Program: Fiscal Years 2021–2024, June 18, 2020, Chapter 1, p.11,
FTA Funding Programs
As in the menu of FHWA programs, some Federal Transit Administration (FTA) programs are more flexible than others. Colorado’s STIP for fiscal years 2021–2024 lists the following FHWA programs as transit funding sources. The numbers in front of each program refer to the sections of U.S. Code, Title 49, where the programs are established. 5307: Urbanized Area Formula Program:
For areas with 50,000 or more residents). 5309: Capital Investment Grant Program 5310: Enhanced Mobility of Seniors and
Individuals with Disabilities 5311: Formula Grants for Rural Areas 5314: Capital Investment Program 5337: State of Good Repair 5339: Bus & Bus Facilities Infrastructure
Investment Program
Section 5312 National Research and Technology Funds are typically not applicable for PACOG.
Similar to FHWA, FTA also has funds available specifically for planning and not project implementation:
5303, 5304, and 5305: Metropolitan and Statewide Planning, and Non-Metropolitan Planning
State Funding for Transportation
Discussed briefly below are Colorado’s primary transportation funding source (the Highway Users Revenue Users Fund), the relatively new Funding Advancements for Surface Transportation and Economic Recovery (FASTER) funding program, and one-time appropriations from the State General Fund.
State Funding – HUTF
The primary source of state highway revenue in Colorado is the Highway Users Tax Fund (HUTF), which includes collection of 22 cents per gallon for gasoline and 20.5 cents per gallon for diesel. This dedicated revenue source is supplemented by car registration fees and other miscellaneous revenue. There are two levels of
https://www.codot.gov/programs/planning/documents/statewide-transportation-improvement-program-stip/fy2021-fy2024_adopted_stip_june_2020.pdf.
PACOG MOVES the Region 2045 LRTP April 2021 | 193
funding to HUTF—a basic level and an additional funding level. All fuel taxes up to seven cents per gallon are considered basic funding. A portion of the basic funding is allocated off the top to the Department of Public Safety for the State Patrol and Department of Revenue for the Ports of Entry.
The Colorado State Treasury distributes the remaining basic funding as follows:
65 percent to CDOT 26 percent to Colorado counties 9 percent to Colorado cities
The amount over seven cents per gallon is considered additional funding, which is distributed as follows:
60 percent to CDOT 22 percent to Colorado counties 18 percent to Colorado cities
State Funding – FASTER
In 2009, through Senate Bill 09-108, the Colorado General Assembly created the Funding Advancements for Surface Transportation and Economic Recovery (FASTER) program. FASTER provides CDOT and local governments with a new funding source separate from the General Fund that is stable and predictable. The funds derive from modest increases to vehicle registration fees and other funding mechanisms and are dedicated to specific programs. These funds are split into several categories for distribution:
Statewide Bridge Enterprise (BE) High-Performance Transportation
Enterprise (HPTE) FASTER Safety Mitigation (FSM) Program FASTER Transit: includes Transit & Rail
Statewide Grants, Transit & Rail Local Grants, Bustang interregional bus service, and Bustang Outrider Program (BOP)
The FASTER bridge fund is used to repair or replace a specific list of poorly rated bridges on the state highway system. FASTER funds 80 percent of each project, and the local entity funds the remaining 20 percent.
FASTER transit funds are granted to local governments and transit agencies for projects such as new bus stops, maintenance facilities,
and multimodal transportation centers. These funds cannot be used for operations. FASTER supports transit projects with $15 million every year based on a statutory set-aside from the road safety surcharge revenue. FASTER transit dollars help maintain existing local transit systems, support interregional and regional bus transit service (Bustang and Bustang Outrider), and help determine the feasibility of a high-speed rail system in Colorado. FASTER transit funds are split between local transit grants ($5 million per year) and statewide projects ($10 million per year). FASTER funds are not indexed to inflation, however, and the reach of those dollars subsequently erodes over time.
State Funding – Short‐Term Appropriations
From time to time, the Colorado General Assembly authorizes limited transfers of General Fund monies for transportation programs. These initiatives cannot be reliably predicted to occur in the future. A current program is described below for illustrative purposes and emphasizes that this particular program is not a long-term funding source.
In 2017, the Colorado General Assembly passed Senate Bill (SB) 267, “Concerning the Sustainability of Rural Colorado,” which established a funding pool dedicated to improving transit service for rural parts of the state. SB 267 provides $500 million in general funds for each of four years (through SFY 2022) for high-priority transportation needs. SB 267 mandates that at least 10 percent, or $50 million, is allocated to transit capital projects. According to the 2020 Statewide Transit Plan, “‘mobility hubs’ will make up a large part of the [SB 267] funding distribution. This will allow further transit development of the intercity and regional bus network and later the passenger rail network.
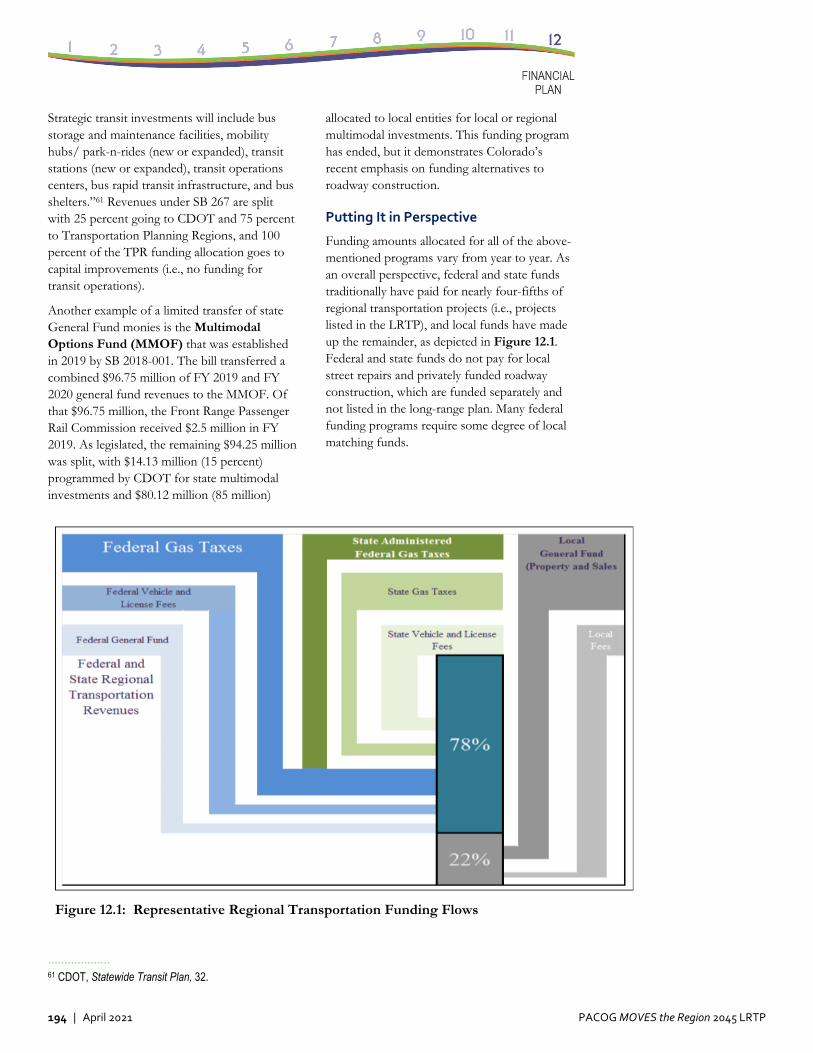
194 | April 2021 PACOG MOVES the Region 2045 LRTP
Strategic transit investments will include bus storage and maintenance facilities, mobility hubs/ park-n-rides (new or expanded), transit stations (new or expanded), transit operations centers, bus rapid transit infrastructure, and bus shelters.”61 Revenues under SB 267 are split with 25 percent going to CDOT and 75 percent to Transportation Planning Regions, and 100 percent of the TPR funding allocation goes to capital improvements (i.e., no funding for transit operations).
Another example of a limited transfer of state General Fund monies is the Multimodal Options Fund (MMOF) that was established in 2019 by SB 2018-001. The bill transferred a combined $96.75 million of FY 2019 and FY 2020 general fund revenues to the MMOF. Of that $96.75 million, the Front Range Passenger Rail Commission received $2.5 million in FY 2019. As legislated, the remaining $94.25 million was split, with $14.13 million (15 percent) programmed by CDOT for state multimodal investments and $80.12 million (85 million)
allocated to local entities for local or regional multimodal investments. This funding program has ended, but it demonstrates Colorado’s recent emphasis on funding alternatives to roadway construction.
Putting It in Perspective
Funding amounts allocated for all of the above-mentioned programs vary from year to year. As an overall perspective, federal and state funds traditionally have paid for nearly four-fifths of regional transportation projects (i.e., projects listed in the LRTP), and local funds have made up the remainder, as depicted in Figure 12.1. Federal and state funds do not pay for local street repairs and privately funded roadway construction, which are funded separately and not listed in the long-range plan. Many federal funding programs require some degree of local matching funds.
Figure 12.1: Representative Regional Transportation Funding Flows
··················· 61 CDOT, Statewide Transit Plan, 32.
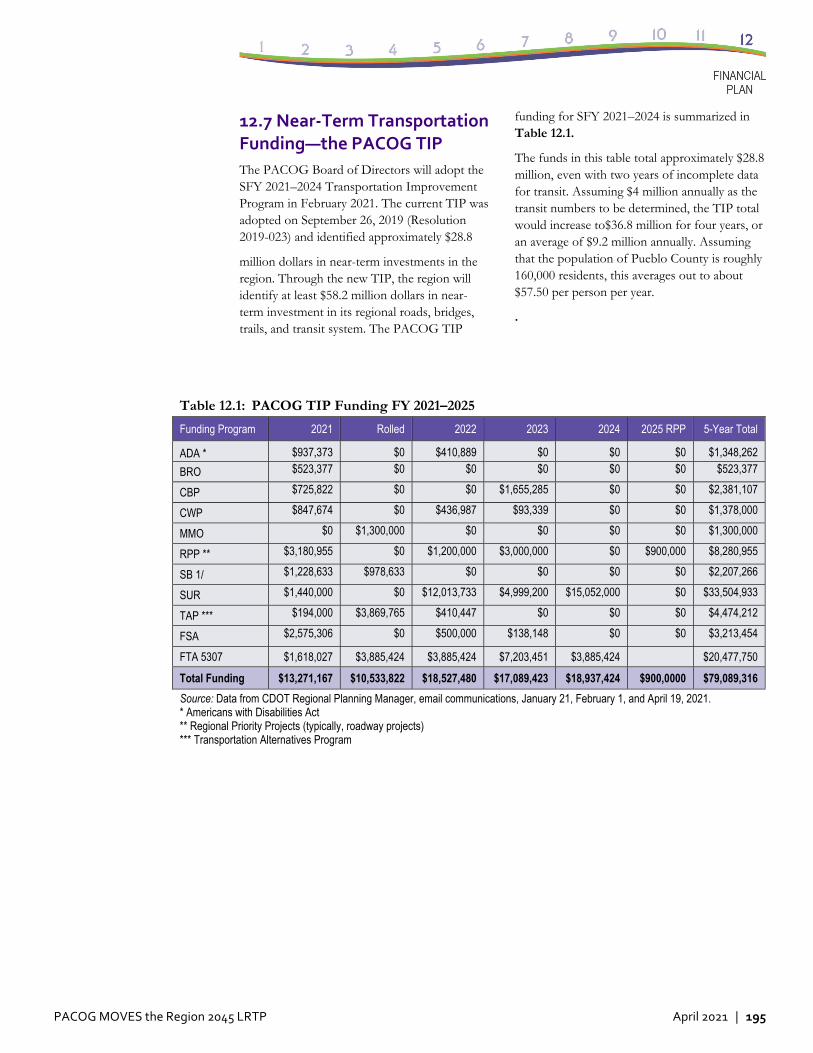
PACOG MOVES the Region 2045 LRTP April 2021 | 195
12.7 Near‐Term Transportation Funding—the PACOG TIP
The PACOG Board of Directors will adopt the SFY 2021–2024 Transportation Improvement Program in February 2021. The current TIP was adopted on September 26, 2019 (Resolution 2019-023) and identified approximately $28.8
million dollars in near-term investments in the region. Through the new TIP, the region will identify at least $58.2 million dollars in near-term investment in its regional roads, bridges, trails, and transit system. The PACOG TIP
funding for SFY 2021–2024 is summarized in Table 12.1.
The funds in this table total approximately $28.8 million, even with two years of incomplete data for transit. Assuming $4 million annually as the transit numbers to be determined, the TIP total would increase to$36.8 million for four years, or an average of $9.2 million annually. Assuming that the population of Pueblo County is roughly 160,000 residents, this averages out to about $57.50 per person per year.
.
Table 12.1: PACOG TIP Funding FY 2021–2025
Funding Program 2021 Rolled 2022 2023 2024 2025 RPP 5-Year Total
ADA * $937,373 $0 $410,889 $0 $0 $0 $1,348,262
BRO $523,377 $0 $0 $0 $0 $0 $523,377
CBP $725,822 $0 $0 $1,655,285 $0 $0 $2,381,107
CWP $847,674 $0 $436,987 $93,339 $0 $0 $1,378,000
MMO $0 $1,300,000 $0 $0 $0 $0 $1,300,000
RPP ** $3,180,955 $0 $1,200,000 $3,000,000 $0 $900,000 $8,280,955
SB 1/ $1,228,633 $978,633 $0 $0 $0 $0 $2,207,266
SUR $1,440,000 $0 $12,013,733 $4,999,200 $15,052,000 $0 $33,504,933
TAP *** $194,000 $3,869,765 $410,447 $0 $0 $0 $4,474,212
FSA $2,575,306 $0 $500,000 $138,148 $0 $0 $3,213,454
FTA 5307 $1,618,027 $3,885,424 $3,885,424 $7,203,451 $3,885,424 $20,477,750
Total Funding $13,271,167 $10,533,822 $18,527,480 $17,089,423 $18,937,424 $900,0000 $79,089,316
Source: Data from CDOT Regional Planning Manager, email communications, January 21, February 1, and April 19, 2021. * Americans with Disabilities Act ** Regional Priority Projects (typically, roadway projects) *** Transportation Alternatives Program
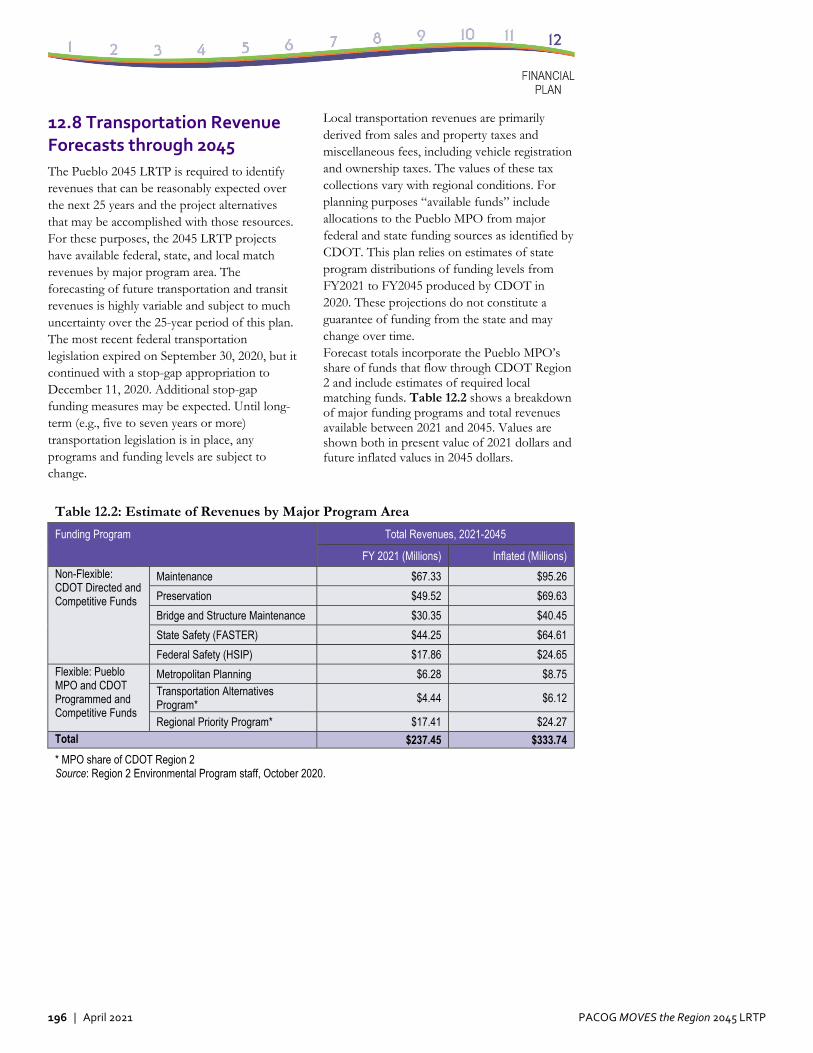
196 | April 2021 PACOG MOVES the Region 2045 LRTP
12.8 Transportation Revenue Forecasts through 2045
The Pueblo 2045 LRTP is required to identify revenues that can be reasonably expected over the next 25 years and the project alternatives that may be accomplished with those resources. For these purposes, the 2045 LRTP projects have available federal, state, and local match revenues by major program area. The forecasting of future transportation and transit revenues is highly variable and subject to much uncertainty over the 25-year period of this plan. The most recent federal transportation legislation expired on September 30, 2020, but it continued with a stop-gap appropriation to December 11, 2020. Additional stop-gap funding measures may be expected. Until long-term (e.g., five to seven years or more) transportation legislation is in place, any programs and funding levels are subject to change.
Local transportation revenues are primarily derived from sales and property taxes and miscellaneous fees, including vehicle registration and ownership taxes. The values of these tax collections vary with regional conditions. For planning purposes “available funds” include allocations to the Pueblo MPO from major federal and state funding sources as identified by CDOT. This plan relies on estimates of state program distributions of funding levels from FY2021 to FY2045 produced by CDOT in 2020. These projections do not constitute a guarantee of funding from the state and may change over time. Forecast totals incorporate the Pueblo MPO’s share of funds that flow through CDOT Region 2 and include estimates of required local matching funds. Table 12.2 shows a breakdown of major funding programs and total revenues available between 2021 and 2045. Values are shown both in present value of 2021 dollars and future inflated values in 2045 dollars.
Table 12.2: Estimate of Revenues by Major Program Area
Funding Program Total Revenues, 2021-2045
FY 2021 (Millions) Inflated (Millions)
Non-Flexible: CDOT Directed and Competitive Funds
Maintenance $67.33 $95.26
Preservation $49.52 $69.63
Bridge and Structure Maintenance $30.35 $40.45
State Safety (FASTER) $44.25 $64.61
Federal Safety (HSIP) $17.86 $24.65 Flexible: Pueblo MPO and CDOT Programmed and Competitive Funds
Metropolitan Planning $6.28 $8.75 Transportation Alternatives Program*
$4.44 $6.12
Regional Priority Program* $17.41 $24.27 Total $237.45 $333.74
* MPO share of CDOT Region 2 Source: Region 2 Environmental Program staff, October 2020.
PACOG MOVES the Region 2045 LRTP April 2021 | 197
12.9 Future Transit Funding
Estimating future revenues for transit is particularly challenging as a variety of federal, state, and local funding sources are utilized to support transit services in the region. Pueblo Transit relies on financial support from federal agencies, Colorado’s FASTER program, and local governments to support transit capital construction projects. Capital expenses vary from year to year with vehicle replacement needs and construction of facilities. Annual operating and administration costs are primarily supported by local governments, FTA grants, and agency-generated revenues such as service fares. Operating expenses are more stable but vary with changes in the prices of fuel, labor rates, and contracted transportation services.
Colorado’s 2020 Statewide Transit Plan assumes a “2 percent annual increase in federal transit funding apportioned or awarded to transit agencies in the state, above and beyond levels that are reflected in FTA’s 2018 [National Transit Database] (NTD) data.”62 The plan indicates that these 2018 data showed transit funding in the Pueblo region as $40.60 per capita. The plan also assumes an annual inflation rate of 2.8 percent annual,63 which exceeds expected transit revenue growth, resulting in ongoing erosion of the statewide fiscal position. The overall outlook is quite sensitive to inflation, so if average inflation were to exceed 2.8 percent, the situation would deteriorate to a greater degree.
The City of Pueblo and Pueblo County collectively contribute over $2 million annually to support essential transit services in the region. These funds are primarily derived from sales and property tax revenues from local governments. Fixed-route service is provided by Pueblo Transit, which has a fleet of 19 buses. The Senior Resource Development Agency (SRDA) provides seniors with door-to-door wheelchair accessible van service. SRDA services are available on weekdays only, by making a reservation in advance.
··················· 62 CDOT, Statewide Transit Plan Draft, 47. 63 CDOT, Statewide Transit Plan Draft, 44. 64 Nelson Nygaard and Felsburg Holt & Ullevig, Pueblo
Transit Study: Final Report, Pueblo Transit, June 2017,
The June 2017 Pueblo Transit Study did not reflect major changes to Pueblo Transit in the near future. It recommended fare simplification and increasing the base fare from $1.25 to $1.50. It also recommended $129,000 in bus stop improvements and aggressive replacement of aging buses to modernize the 19-bus fleet.64 CDOT’s 2020 Statewide Transit Plan indicates there are 50 transit vehicles in the Pueblo region and that 11 of them (22 percent) are “beyond state of good repair,” representing a financial backlog of approximately $2 million. CDOT reports that the typical replacement vehicle costs about $300,000.65 Thus, considerable resources will be needed to maintain existing services. Chapter 1 of this PACOG Long Range Transportation Plan identified a goal of improving the percentage of transit vehicles in good repair over time.
12.10 Potential Future Revenue Sources
The key question for future transportation revenues revolves around replacing the FAST Act with stable, five- to seven-year national transportation appropriations legislation. Both major U.S. political parties have talked about the need for a major infrastructure funding plan for the past five years, but without taking action. The safest assumption to make is that future federal funding will be similar to the funding that has been available under the FAST Act.
At the state level, the Colorado General Assembly is keenly aware of the need for increased transportation funding. The legislators have the power to establish fees, but any new taxes would require voter approval in a statewide referendum. A February 17, 2020, article in the Denver Post explored the difficulty legislators have in finding the political will to take action, despite a single party holding the
https://county.pueblo.org/sites/default/files/2020-05/Pueblo%20Transit%20Study_Final%20Report_061317.pdf.
65 CDOT, Statewide Transit Plan, 28.
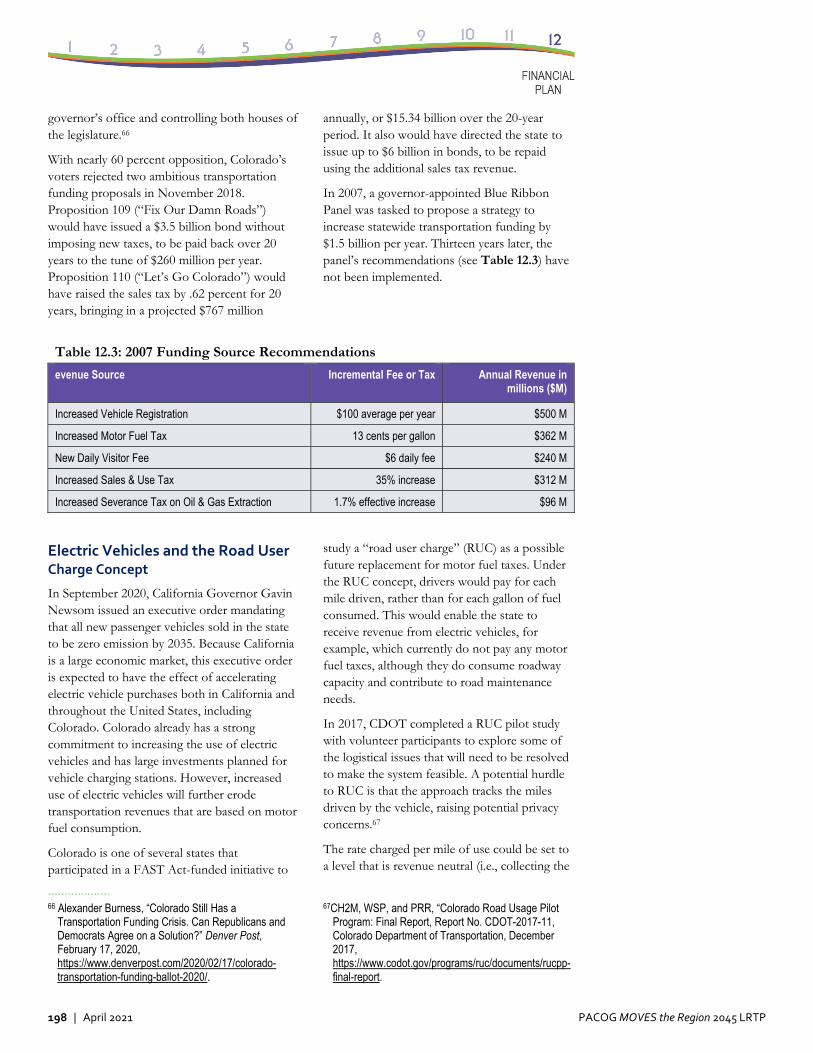
198 | April 2021 PACOG MOVES the Region 2045 LRTP
governor’s office and controlling both houses of the legislature.66
With nearly 60 percent opposition, Colorado’s voters rejected two ambitious transportation funding proposals in November 2018. Proposition 109 (“Fix Our Damn Roads”) would have issued a $3.5 billion bond without imposing new taxes, to be paid back over 20 years to the tune of $260 million per year. Proposition 110 (“Let’s Go Colorado”) would have raised the sales tax by .62 percent for 20 years, bringing in a projected $767 million
annually, or $15.34 billion over the 20-year period. It also would have directed the state to issue up to $6 billion in bonds, to be repaid using the additional sales tax revenue.
In 2007, a governor-appointed Blue Ribbon Panel was tasked to propose a strategy to increase statewide transportation funding by $1.5 billion per year. Thirteen years later, the panel’s recommendations (see Table 12.3) have not been implemented.
Table 12.3: 2007 Funding Source Recommendations
evenue Source Incremental Fee or Tax Annual Revenue in millions ($M)
Increased Vehicle Registration $100 average per year $500 M
Increased Motor Fuel Tax 13 cents per gallon $362 M
New Daily Visitor Fee $6 daily fee $240 M
Increased Sales & Use Tax 35% increase $312 M
Increased Severance Tax on Oil & Gas Extraction 1.7% effective increase $96 M
Electric Vehicles and the Road User Charge Concept
In September 2020, California Governor Gavin Newsom issued an executive order mandating that all new passenger vehicles sold in the state to be zero emission by 2035. Because California is a large economic market, this executive order is expected to have the effect of accelerating electric vehicle purchases both in California and throughout the United States, including Colorado. Colorado already has a strong commitment to increasing the use of electric vehicles and has large investments planned for vehicle charging stations. However, increased use of electric vehicles will further erode transportation revenues that are based on motor fuel consumption.
Colorado is one of several states that participated in a FAST Act-funded initiative to
··················· 66 Alexander Burness, “Colorado Still Has a
Transportation Funding Crisis. Can Republicans and Democrats Agree on a Solution?” Denver Post, February 17, 2020, https://www.denverpost.com/2020/02/17/colorado-transportation-funding-ballot-2020/.
study a “road user charge” (RUC) as a possible future replacement for motor fuel taxes. Under the RUC concept, drivers would pay for each mile driven, rather than for each gallon of fuel consumed. This would enable the state to receive revenue from electric vehicles, for example, which currently do not pay any motor fuel taxes, although they do consume roadway capacity and contribute to road maintenance needs.
In 2017, CDOT completed a RUC pilot study with volunteer participants to explore some of the logistical issues that will need to be resolved to make the system feasible. A potential hurdle to RUC is that the approach tracks the miles driven by the vehicle, raising potential privacy concerns.67
The rate charged per mile of use could be set to a level that is revenue neutral (i.e., collecting the
67CH2M, WSP, and PRR, “Colorado Road Usage Pilot Program: Final Report, Report No. CDOT-2017-11, Colorado Department of Transportation, December 2017, https://www.codot.gov/programs/ruc/documents/rucpp-final-report.
PACOG MOVES the Region 2045 LRTP April 2021 | 199
same total revenue as motor fuel taxes) or could be set at a higher level to increase revenues. If set at a rate that is initially revenue neutral, it would at least protect the state from further revue erosion due to increased electric vehicle use.
Though the RUC approach remains hypothetical, this study provides a springboard for future discussions regarding policies related to RUC.
Need for Additional Transit Funding Sources
CDOT’s 2020 Statewide Transit Plan indicates that current transit plans are not sustainable over the long term without a significant infusion of additional resources. It examined several scenarios for future transit development and recommended the infusion of an additional $50 million annually on a statewide basis. It identified the following potential methods for creating the additional funds:
• State legislature approval of general funds for transportation with a transit set-aside
• An increase in the state sales tax by 0.04%(currently requires statewide vote)
• An increase in personal income tax by 0.025% (currently requires statewide vote)
• An increase in property tax by 0.43 mills (currently requires statewide vote)68
Given the uncertainty of funding from the federal and state levels, PACOG cannot confidently rely on future federal or state funding mechanisms to substantially increase transportation plan revenues above current levels.
··················· 68 CDOT, Statewide Transit Plan, 52.
The Statewide Transit Plan identifies the following types of alternative funding sources for consideration at the regional and local level:
• General funds• Lodging taxes• Parking fees• Property taxes• Public-private partnerships• Rural transportation authorities• Sales and use taxes Sponsorships/donations• Tourism taxes• Utility taxes/fees• Vehicle fees69
69 CDOT, Statewide Transit Plan, 48.
Related Documents


![Classic XL V2- Type 90Front view Side view Top view Model size S SL XS M ML L LL XL XXL H [mm] [inch] 1385 54.53 1385 54.53 1385 54.53 2045 80.51 2045 80.51 2045 80.51 2045 80.51 2045](https://static.cupdf.com/doc/110x72/5ffc896ed78d2176ac478c13/classic-xl-v2-type-90-front-view-side-view-top-view-model-size-s-sl-xs-m-ml-l-ll.jpg)