Corporation -- A Global Business Simulation
Presented by: John Doe Jane Doe Mary Jane

Company Background
DEEP BLUE INTERNATIONAL, INC
A multi-divisional firm operating in the highly competitive information systems industry

Company Background
Deep Blue International, Inc.
SBU#1Hardware
SBU#2Software
SBU#3Integrated MIS

Company Background
Two level decision making process•SBU: President•Parent corporation:
•CEO•Board of Directors

Mission Statement
To be the market leader in the information industry through the establishment of competitive advantages so as to increase the value of the company.

Strategy
Target on High-end product consumers Strategic development on “vertical”
applications Achieve competitive advantages by
Increasing marketing, operation technology new product research and HR investment.

Operation of SBU #1 Pricing Strategy: High end and keep increasing
because of market demand and lost sales. Constant improvement and moderate more
expense than industry average in:-Marketing Expenses
-Operations Technology
-Quality Budget
-New Product Research
-Human resource Budget
Export Strategy : Start export to ASEAN (Area 2) in Period 4, based on competitive advantages already set up and little competition in ASEAN.

Final Result (SBU #1)
Capacity: from 3610 to 3710 units (3% ) Book value: from $3500 to $3600 (3% ) Export: area 2, 15.1% Sales: from $ 1879 to $ 2518 (34% ) Cost of sales: $913(49%) to $1053 (42%) Profit: $198 to $426 (215% ) SBU profit/sales: from 11% to 17%
(All numbers in thousands)

Operation of SBU #2
Pricing Strategy: competitive in high end Constant improvement and moderate
more expense than industry average in:-Marketing Expenses
-Operations Technology
-Quality Budget
-New Product Research
-Human resource Budget

Operation of SBU #2
Capacity expansion Strategy: - Constant moderate expansion based on
market demand increase- Major expansion in Period 6 based on
competitive advantage, lost sales and demand increase
Export Strategy: - Export Area: MERSUR (4)- Capacity availability- Little competition in the market

Operation of SBU #2
Selling Price of SBU#2
480
500
520540
560
580
600
1 2 3 4 5 6
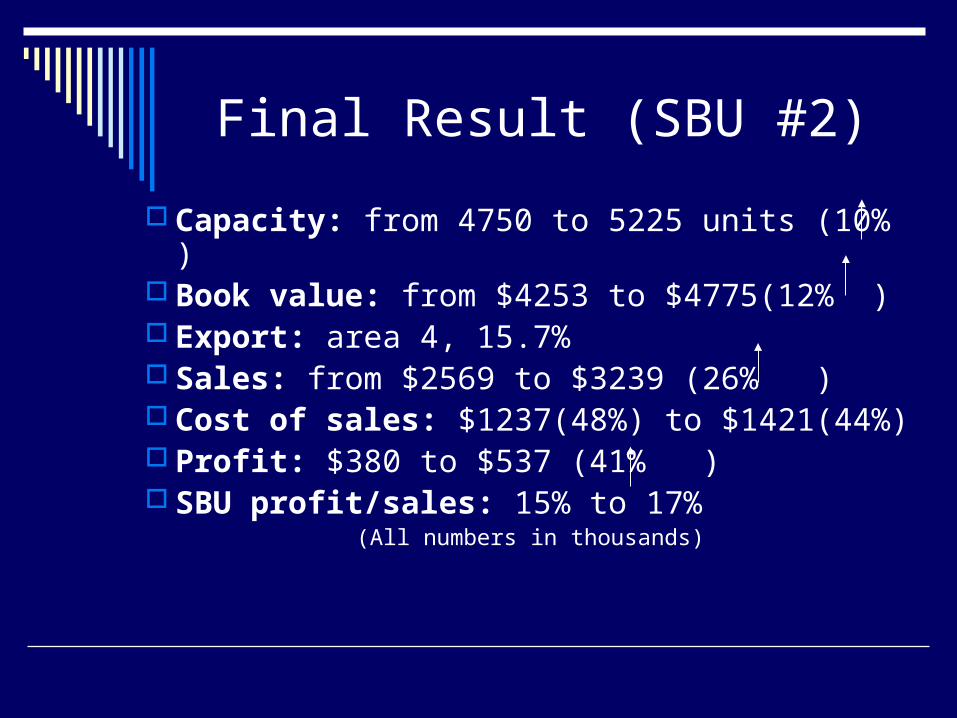
Final Result (SBU #2)
Capacity: from 4750 to 5225 units (10% ) Book value: from $4253 to $4775(12% ) Export: area 4, 15.7% Sales: from $2569 to $3239 (26% ) Cost of sales: $1237(48%) to $1421(44%) Profit: $380 to $537 (41% ) SBU profit/sales: 15% to 17%
(All numbers in thousands)

Operation of SBU #3
Pricing Strategy: competitive in high end Constant improvement and moderate
more expense than industry average in:-Marketing Expenses
-Operations Technology
-Quality Budget
-New Product Research
-Human resource Budget
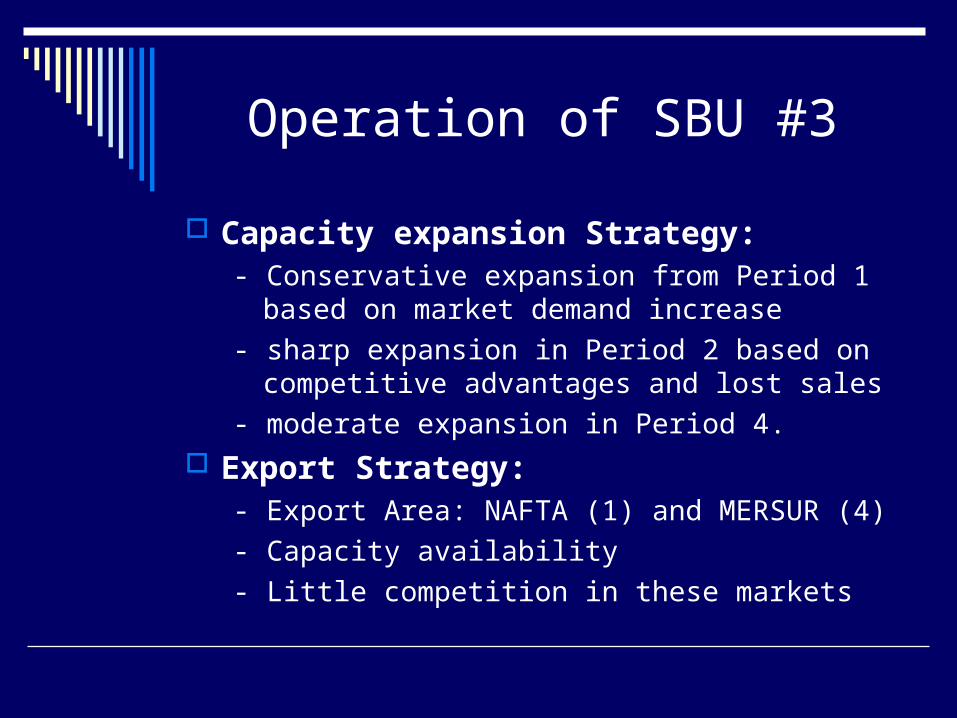
Operation of SBU #3
Capacity expansion Strategy: - Conservative expansion from Period 1 based on
market demand increase
- sharp expansion in Period 2 based on competitive advantages and lost sales
- moderate expansion in Period 4.
Export Strategy: - Export Area: NAFTA (1) and MERSUR (4)
- Capacity availability
- Little competition in these markets

Operation of SBU #3
Selling Price of SBU#3
500
520
540
560
580
600
1 2 3 4 5 6

Final Result (SBU #3)
Capacity: from 5415 to 6545 units (21% ) Book value: from $5762 to $6355 ( 10% ) Export: area 1 , 12.7%
area 4, 12.8% Sales: from $3376 to $3603 (7% ) Cost of sales: from $1631(48%) to $1594(44%) Profit: $362 to $514 (42% ) SBU profit/sales: from 11% to 14%
(All numbers in thousands)

Result (SBU level)
SBU profit analysis
0
100
200
300
400
500
600
1 2 3 4 5 6
SBU1
SBU2
SBU3

Result (SBU level)
COGS percentage
0.41
0.42
0.43
0.44
0.45
0.46
0.47
0.48
0.49
1 2 3 4 5 6

Capacity Analysis
01000
200030004000
50006000
70008000
1 2 3 4 5 6 7
SBU#1
SBU#2
SBU#3

Capacity Analysis
Beginning Capacity
3610, 26%
4750, 34%
5415, 40%
1 2 3
Ending Capacity
3710, 24%
5225, 34%
6545, 42%
1 2 3

Problem Areas
Cash managementSales forecastingPricing

Corporate Decisions
Based on the SBU decisions Sales forecast Pricing
Immature market Domestic International expansion
Financial management

Capital Structure
Capital Needs: Expand capacity for each SBU according
to sales forecast in 1st period Aggressively expand capacity of SBU#3 in
2nd period Constantly Increase marketing, operation
technology and new product research budget
Human resource expenses Export & marketing abroad

Capital Structure
Decision Criteria: Increase shareholders’ value Not dilute EPS and stock price Keep reasonable D/E ratio
Plan of action: Borrow 1000 bank loan in 1st period Borrow 400 bank loan and issue 2000 bond in 2nd
period Pay back bank loan in the following period by using
internal generated cash flow

Ratio Analysis
Debt/Equity Ratio
1.691.94
1.671.51
1.21 1.13
0.00
0.50
1.00
1.50
2.00
2.50
1 2 3 4 5 6

Dividend Policy
In 1st period, we kept the previous dividend level We decreased the dividend payment in 2nd
period We decided to follow a constant amount plus
extra payment policy since 3nd period We started by paying $.03 and kept increasing
the level of dividend according to our operation profits increase.

Dividend Policy
0
0.01
0.02
0.03
0.04
0.05
0.06
0.07
1 2 3 4 5 6
0
10
20
30
40
50
60
Div P/S
Dividend Payment

Incident Report (E)
New Advertising Campaign in Period 5 Emphasizes our presence in the market
in terms of growth in sales and profits. In major business publication and airline
or-board magazines. Response: Key decision makers in major
corp. are reached, smaller businesses are missed.

Incident Report (F)
New Business Tactics in Period 6 Host a party and provide image building
items in export areas Cost: $ 15,000 Effective promotion Legal promotion

Performance Evaluation
DEEP BLUE INTERNATIONAL, INC.
Period 1 ----------- Period 6

Financial Statement ----balance sheet
Cash 909 Accounts Payable 1220
Accounts Receivable 2808 Annual Loan Payment 767
Short Term Investment 0 Annual Bond Payment 190
Current Assets 3717 Current Liabilities 2177
Bank Loans due>12 months 6903
Building & Equipment 21807 Bonds due>12 months 1712
Less Accum. Depreciation
7077 Total Liabilities 10792
Net Fixed Assets 14730 Common Stock 4000
Retained Earnings 3655
Total Equity 7655
Total Assets 18447 Total Liabilities & Equity 18447

Financial Statement ---- income statement
Sales Revenue 9360
COGS 4068
Gross Margin 5292
Operation Expenses 3815
EBIT(SBU Profits) 1477
Interest Expense 363
Other Expense 46
Income before Taxes 1068
Taxes 320
Net Income after Taxes 748
Dividends Paid 40
Retained Earnings 708
EPS 0.94

Competitive Advantages
SBU#1 SBU#2 SBU#3
marketing 168 153 225 184 192 241
operation tech. 91 115 123 135 145 153
new product 79 81 96 135 119 136
sales person 2.5 3 2 2 2.5 3
service person 1.75 2 1.5 2 1.75 3
employee turnover rate 9.7% 8.4% 9.7% 9.0% 9.7% 7.7%
defective goods 2.4% 2.3% 2.2% 2.1% 2.1% 1.8%

Evaluation: Profitability
7000
7500
8000
8500
9000
9500
1 2 3 4 5 6
0
100
200
300
400
500
600
700
800
Total Sales
Net Profit
49.00%
50.00%
51.00%
52.00%
53.00%
54.00%
55.00%
56.00%
57.00%
1 2 3 4 5 6
0.00%
1.00%
2.00%
3.00%
4.00%
5.00%
6.00%
7.00%
8.00%
9.00%
Gross Margin
Profit Margin

Evaluation: Stock Price
Stock Price
10.01 8.8214.03 15.34
23.1527.56
0
5
10
15
20
25
30
1 2 3 4 5 6
Stock Price
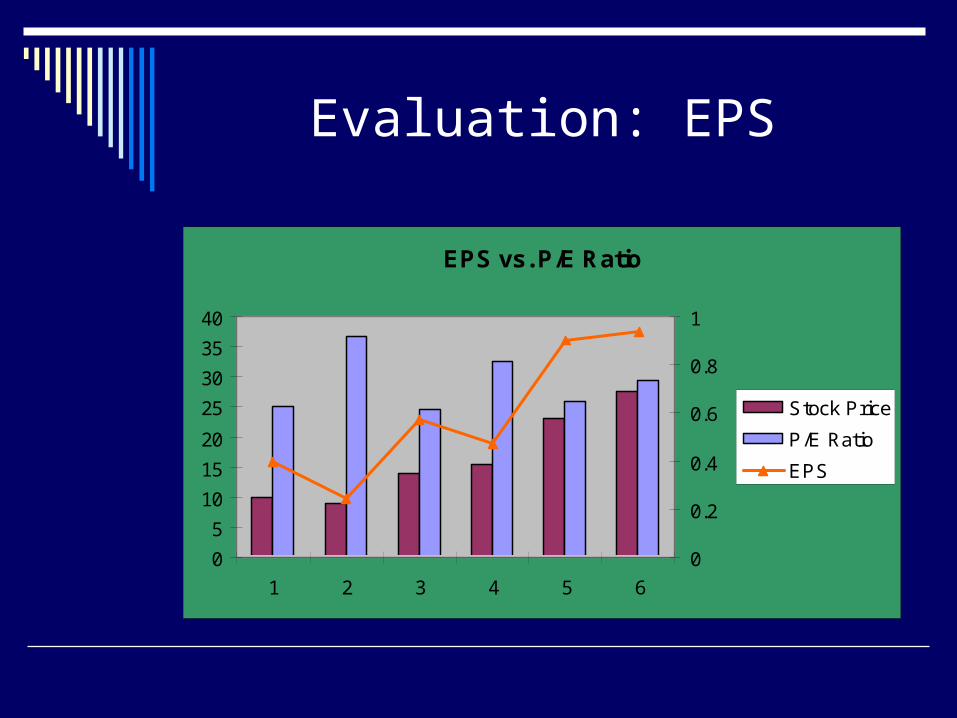
Evaluation: EPS
EPS vs. P/E Ratio
0
5
10
15
20
25
30
35
40
1 2 3 4 5 6
0
0.2
0.4
0.6
0.8
1
Stock Price
P/E Ratio
EPS

Evaluation: Returns
0.00%
2.00%
4.00%
6.00%
8.00%
10.00%
12.00%
1 2 3 4 5 6
Return on Sales
Return on Assets
Return on Equity
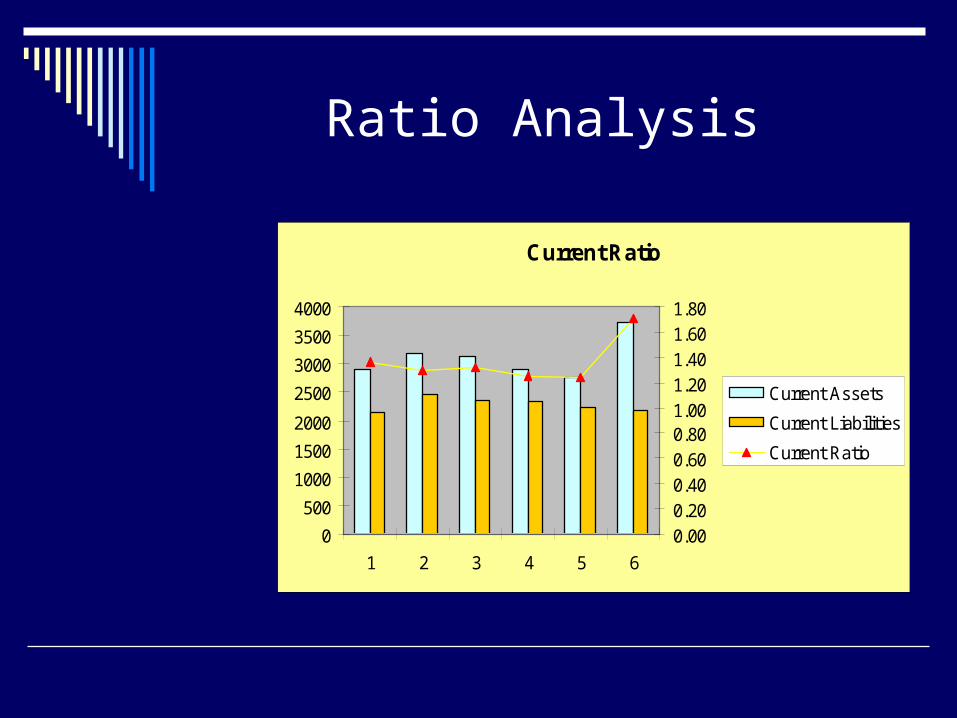
Ratio Analysis
Current Ratio
0
500
1000
1500
2000
2500
3000
3500
4000
1 2 3 4 5 6
0.000.200.400.600.801.001.201.401.601.80
Current Assets
Current Liabilities
Current Ratio

Strategy Adjustment
SBU1 SBU2 SBU3
Period Profit Expense Profit Expense Profit Expense
1 198 1681 380 2189 362 3014
2 224 1753 222 2631 356 3795
3 283 1771 395 2535 461 3577
4 182 2077 423 2736 366 3507
5 408 2006 549 2543 505 3199
6 426 2092 537 2702 514 3089
Total 1721 11380 2506 15336 2564 20181
Profit/Cost 15.12% 16.34% 12.71%

Strategy Adjustment
Initially, we wanted to strategically expand SBU#3
Based on the profit/cost efficiency analysis, we change the strategy to follow a more balance expansion plan
In the latter period, we reduced the capacity of SBU#3 by depreciation, while kept the reasonable operation budget
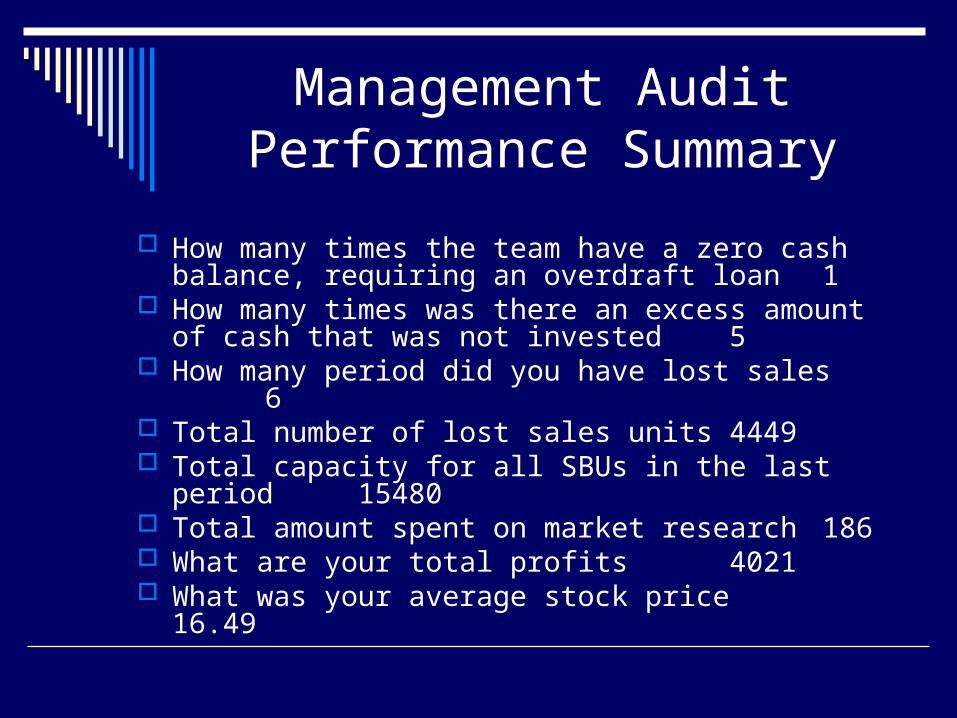
Management Audit Performance Summary
How many times the team have a zero cash balance, requiring an overdraft loan 1
How many times was there an excess amount of cash that was not invested 5
How many period did you have lost sales 6 Total number of lost sales units
4449 Total capacity for all SBUs in the last period 15480 Total amount spent on market research 186 What are your total profits
4021 What was your average stock price 16.49

Q & A
Thanks a lot!
Good luck in the real world!!