


1
CORPORATE FINANCE
Fall 2015 – Period I
Lecturer: Bünyamin ‘Ben’ Önal
2
Course objective• Purpose of the course
• Provide a basic understanding of the financial decisions anybusiness enterprise faces
• Key financial decisions:• Investment decisions
• Capital budgeting• M&A
• Financing decisions• Capital structure• Securities offerings• Financial planning• Credit management
• Payout decisions• Dividends, Stock repurchases
3
Why “corporate” finance?• Most corporate finance textbooks are intended for
publicly traded (large) corporations• In financial theory, (public) financial markets have an
important role in corporate decision making• Most small firms do not operate on financial markets (i.e., not
listed on stock exchanges and have no bond issues)• However, the underlying principles generally apply to
smaller firms too• Financial markets have a less important role in e.g.
financial planning, credit and cash management• Theories related to these issues are directly applicable to
smaller companies

4
What this course requires• Good command of the material covered in the Introduction to
Finance (Rahoituksen perusteet, 28A00110) course / Chapters1-13 of Brealey-Myers-Allen textbook 11th edition
• No additional math skills required• Good work ethics
• Large sample evidence (own questionnaire, response rate 90%)• Statistics on hours worked on this course:
– Mean: 130-160 hours– Median: 120-130 hours
• Other same level courses with same number of credit units:– Mean: 80-90 hours– Median: 70-80 hours
• Small sample evidence (official questionnaire, response rate 10%)• Amount of effort spent relative to 160 hours
– Much more effort: 28%; somewhat more effort: 48%; effort equals 160 hours:16%; somewhat less effort: 8%; much less effort: 0%
5
Readings / class material
• Brealey-Myers-Allen, Principles of Corporate Finance,6th, 7th, 8th, 9th,10th or 11th edition• McGraw-Hill 11th edition, chapters 14-19, 25, 28-33
(students are required to be familiar with chapters 1-13)• Lecture notes• Guest lecture slides• Exercises• Any other material posted on course webpage

6
12 Lectures: time, topic and materialTime and topic
08.09. Introduction: Overview ofcorporate finance
10.09. How corporations issue securities15.09. Payout policy17.09. Guest lecture on IPOs
22.09. Capital structure24.09. Capital structure and valuation29.09. Leasing
Textbook chapters / Other
• Ch. 14
• Ch. 15• Ch. 16• Material provided by Antti Niini
(Goldman Sachs)• Ch. 17• Ch. 18-19• Ch. 25

7
Lectures: time, topic and materialTime and topic
01.10. Financial planning06.10. Working capital management08.10. Mergers and acquisitions13.10. Guest lecture on M&As
15.10. Control, governance, andcorporate restructuring
Textbook chapters / Other
• Ch. 28 and 29• Ch. 30• Ch. 31• Material provided by Timo
Pohjakallio (Bain & Company)• Ch. 32-33

8
Exercises: practicalities
• Exercises should be done in groups consisting of nomore than three (3) students
• Co-operation among groups or individuals belongingto different groups is prohibited
• To help preserve your privacy, include a personal aliasalong with your name and student number in eachexercise report• Alias must not be confused with a student number and
should not consist solely of numbers

9
Exercises: Deadlines
• Exercises are due at the following times:• Tuesday 12:00 (sharp!) in the week the exercise is due• Deadlines are the same for both groups
• Exercises should be placed on instructor’s desk at U2• If none of the group members cannot make the class that
day, you can also drop it into the course box in Chydenia, by10:00 (Sharp!)

10
Accessing course material
• Textbook: Amazon / bookstore or library• The graphs in the lecture notes where source is not
mentioned are obtained from the course book – check thesources there if you are interested
• Lecture notes, exercises and results: course web site• Course home page can be accessed via the MyCourses
portal: https://mycourses.aalto.fi/• You need to log in to access exercises, lectures, grading and
possible other materials• Let me know if you do not have personal login for the
network

11
Grade• Part I. Exam: 60%
• Closed-book exam; two make-up exams• 5 True-False questions; 10 points• 5 problems; 50 points• Problems also have verbal parts; overall 15-20% verbal
• Part II. Exercises: 40%• 4 Exercise sets; points are not evenly distributed
• Minimum requirement for a “passing” grade: 40% ofpoints on each part• Must score at least 16 points on the exercises• Must score at least 24 points on the exam

Scholastic honesty and academicintegrity
• We expect adherence to highest standards of scholastic honesty
• Examples of scholastic dishonesty are:- sharing exercise answers between groups- presenting answers as own work without proper citation tothe sources (plagiarism)- sharing answers during the final exam
• All classwork must be done by the students that return the work,co-operation in preparing answers to the exercises betweengroups (i.e., any individuals not belonging to the same group) isstrictly prohibited
12

Scholastic honesty and academicintegrity
• However, you are allowed to discuss the exercise problems withfellow students in general terms: the definition of terms andconcepts in the questions, and what issues are central to aparticular question. Every group should proceed on their ownfrom there
• Failure to adhere to these guidelines is subject to disciplinaryaction, varying from receiving no points on the particular exerciseor exam to complete removal from the course. Turning in classassignments is considered acknowledgement of these guidelines
• For more information, consult the section Academic Integrity andHandling Violations Thereof at Into for Aalto Students
13

14
FAQs related to exam
• Do we need to memorize the formulas for the exam?• You are expected to know the basic formulas by heart, e.g., value of a
right, WACC, etc.• But you do NOT need to know the derivation of the formulas• Complex formulas or schedules such as MACRS depreciation schedules
will be provided to you if a related problem appears in the exam, no needto memorize those
• Do we need to memorize verbal concepts for the exam?• You are expected to know the basic concepts by heart, for ex. winner’s
curse, pecking order theory, etc.• But you do NOT need to know exact definitions or memorize long lists• I will never ask you questions such as “Define winner’s curse”, “List four
cases when potential gains to leasing are highest”
15
FAQs related to course administration
• Why don't you post model answers to exercises on the web?• Supply of high quality questions is limited• Giving out model answers in electronic format would, in the long run,
probably lead to a situation where there would be a full menu of modelanswers that could be applied without much thought to whatever questiontype we have in mind
• The learning experience, aggregated over all students, and taking intoaccount future students, would probably not improve from what it ispresently
• Do I need to register separately for the exam?• Yes! Via WebOodi as usual• Exam registration on WebOodi closes always 7 days before the exam!

16
FAQs related to course administration
• What is the idea behind closed-door policy?• Experience has shown that without the policy, many students
will arrive to the class late, one by one, mostly during thefirst 15 minutesThis is highly disturbing both to the instructor and manystudents
• Assuming that there are 200 students in the class and that10% of them arrive late within the first 15 minutes, thepolicy will waste on average 7.5 minutes of 20 students’ timewhile guaranteeing an uninterrupted learning experience forthe remaining 180 students

Course messengers
• As in all courses, I am going to collect student evaluationsduring the last lecture
• In addition, KY Finance has launched the “messenger students”channel for selected Bachelor’s level courses
• Two students will gather feedback from students during thecourse and provide it to the professors
• Corporate Finance is one of the selected courses• Your suggestions (especially those that are easy to implement
“during” the course) are welcome
17

Course messengers
• Juha Vänttinen & Risto Pitkänen• Facebook group: Corporate finance fall 2015 28C00100
18

Logistical and contact information• Lectures (see syllabus for details)
• Tuesdays 12:15-13:45 at U2• Thursdays 12:15-13:45 at U2
• Exercises (four demo and four exercise sessions; see the detailedschedule on the syllabus) and course administration• Demos: Thursdays 14:15-15:45 at U2• Exercises: Tuesdays 14:15-15:45 or 16:15-17:45 at U2
• Regular “Office” hours: Tue and Thu, 30 minutes followingthe sessions of the day. In addition:
• E-mail: [email protected] (for quick questions)• Office phone: 050 410 5011• By appointment
19
20
A detour: B.Sc. thesis seminar“The seminar is going to be the most important and educational finance classyou've taken so far…” – Student comment
• This course can help you find a good research idea for yourthesis. Some examples from previous years’ thesis titles:
• Top-tier Investment Banks and Bidders’ Announcement Returns: Evidencefrom European Mergers and Acquisitions
• Rationale for LBOs: Empirical Evidence from Europe• The Role of Women Directors in Finnish Boardrooms – Examination of
Committee Memberships
• Start thinking about your thesis topic!• Feel free to discuss topics and research questions with potential
supervisors

21
Lecture 1
IntroductionOverview of corporate financing
Overview
• Sources of funds• Internal• External
• External financing• Stages of external financing• Principal forms of capital
• Debt financing• Equity financing
– Venture capital– Next lecture: public equity issues
22

23
Sources of funds for non-financial firmsin the U.S.

24
Finnish corporate sector’sself-financing ratio
25
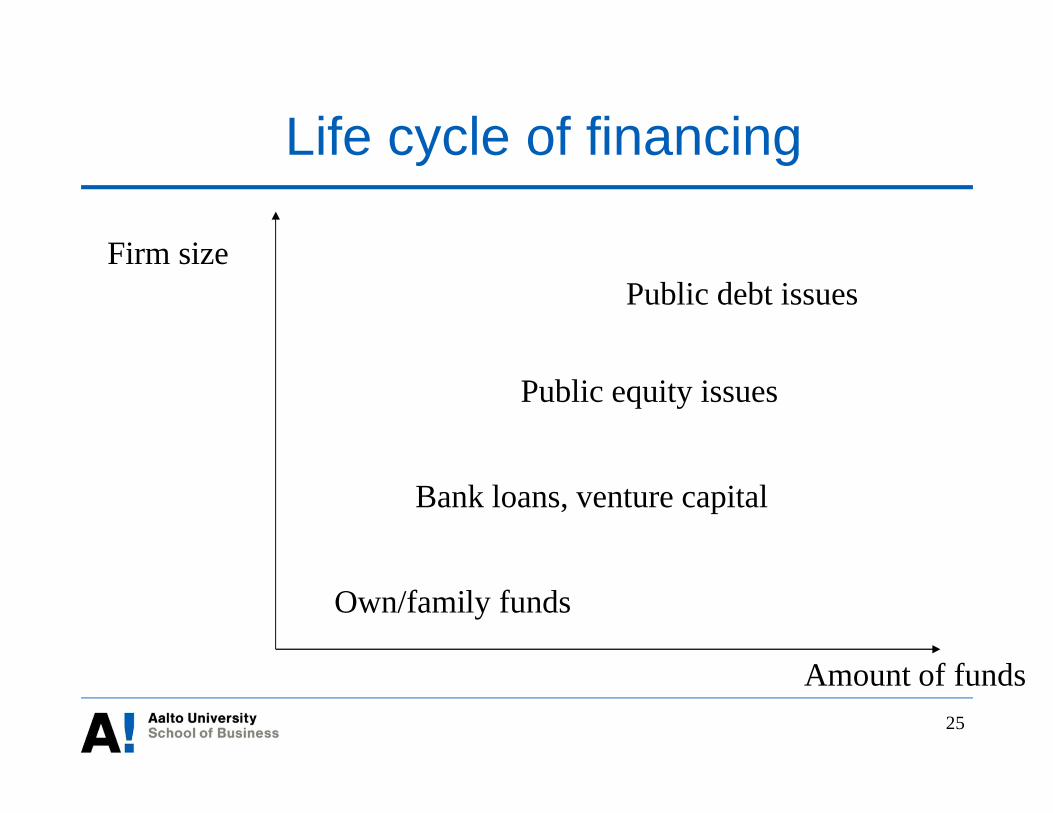
Life cycle of financing
Firm size
Own/family funds
Bank loans, venture capital
Public equity issues
Public debt issues
Amount of funds
26
Two principal forms of capital
• Equity capital• Gives ultimate control rights, subject to debt covenants• Provides residual cash flows
• Debt capital• Provides privileged cash flow rights• No control rights as long as the firm keeps its promises
• And there are hybrid securities• E.g., Preferred equity• Contain features of both equity and debt
27
Debt financing
• Different features:• Private vs. public• Maturity• Convertibility• Callability• Seniority and collateral• Fixed vs. floating rate• Country and currency• Default risk• On- vs. off-balance sheet financing

Example: Apple’s recent debt moves• Apple issued debt (worth $17 billion) in 2013 for the
first time since 1994• Despite sitting on $145 billion of cash ($100 billion abroad)• Issued to partly finance the promised $100 billion cash return
to shareholders• It included 3-year, 5-year, 10-year and 30-year fixed-rate
bonds and 3-year and 5-year floating-rate notes• 3-year floating rate bonds were sold at 5bp and 5-year ones
for 25bp over the LIBOR• Continued to sell bonds in 2014, including 8 and 12-
year euro-denominated bonds worth €2.8bn28
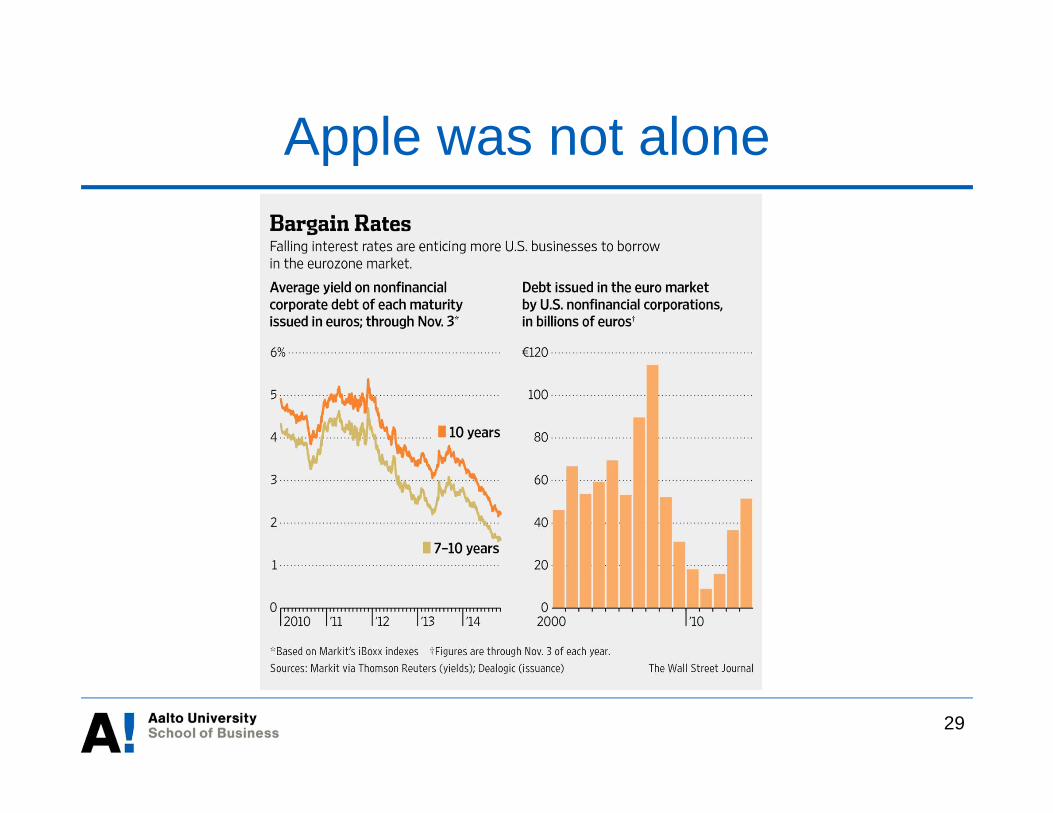
Apple was not alone
29

In Finland
30
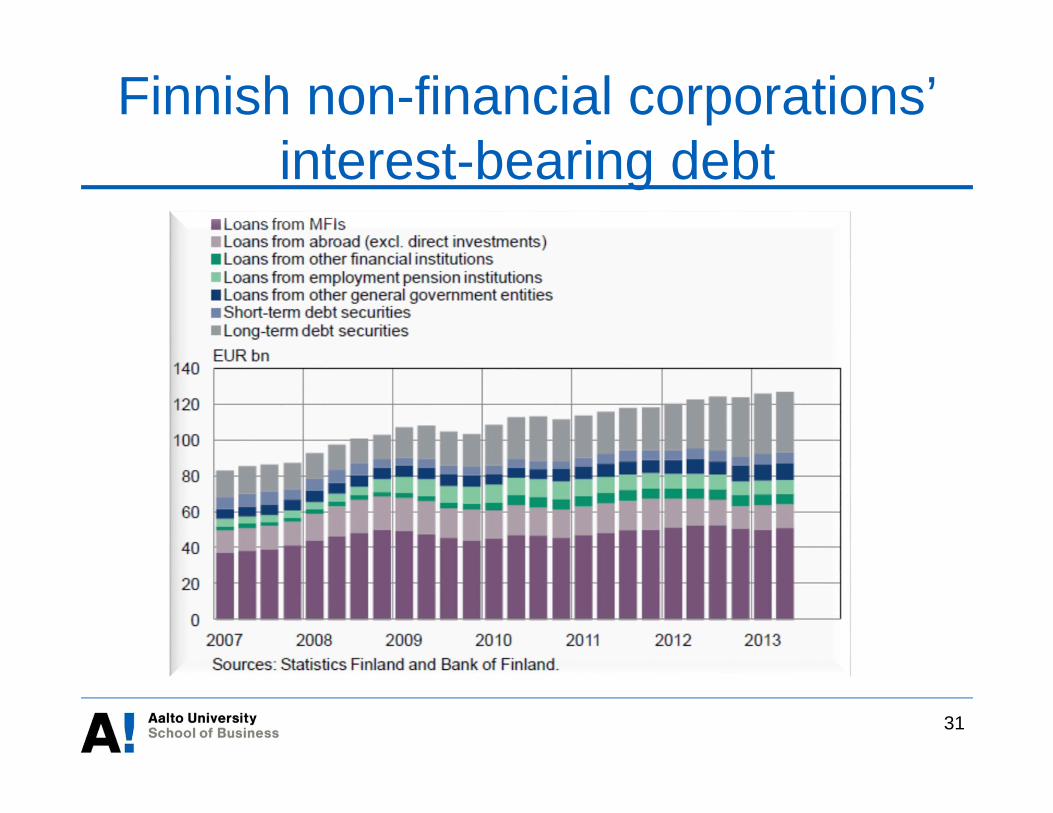
Finnish non-financial corporations’interest-bearing debt
31
32
Role of venture capitalists• Who are venture capitalists?
• Financial institutions, wealthy individual investors (businessangels) and some large technology firms (i.e., corporate VCs)
• What do venture capital firms do?• Pool investors’ cash and invest it in new businesses• Bring in managerial/tech expertise and contacts• Provide these benefits at a high “price” (a large equity stake and
say in decision-making)• Venture capitalists expect to be able to make an exit – to
sell their stake in an IPO or buyout transaction – withinseveral years from their investment• Most VC funds are limited partnerships and have a fixed life of
about 10 years
VC game on TV• e.g., Shark tank:
• First an example: https://www.youtube.com/watch?v=opNiKBP7hQo• $20 million invested in 109 companies, 84% of offers accepted by sharks• Average $182k raised; relative to $210k asked• Average 40% equity stake taken; relative to 20% offered• Sharks’ average valuation $465k; relative to entrepreneurs’ average valuation
$1.06 million• Source: http://www.sharktank.tvquotes.net/
• VC market for internet/software startups:• Median of $900k raised in convertible notes at $6 million valuation• Corresponds to 15% of company given up• Source: http://www.forbes.com/sites/georgedeeb/2013/10/09/comparing-shark-
tank-to-venture-capital-reality/
33

34
Venture capital payoff patterns• Venture capitalists tend to invest in companies which
have a chance of becoming highly successful• Expect to be able to earn a very high return on their capital• Venture capital is expensive
• Venture capitalists tend to be selective in theirinvestments• E.g., Finnish venture capitalists tend to accept less than one-
tenth of the applications for capital• Distribution of the outcome from a venture capital
(VC) investment tends to be very skew• For every ten first-stage venture capital investments,
• only two or three may survive as successful businesses• only one may pay off big (e.g., Facebook)
35
Elements of venture capital• VC investments tend to be made in several stages
• New ventures often have very large financing needs andmajor uncertainties
• There are significant asymmetries of information (andrelated agency problems) between the founding owners andthe venture capitalistsIt makes little sense to provide venture financing for a longperiod at any one time
• Venture capitalists tend to seek for boardrepresentation in the company they invest in• Allows them to monitor their investment and to help in the
strategic management of the company
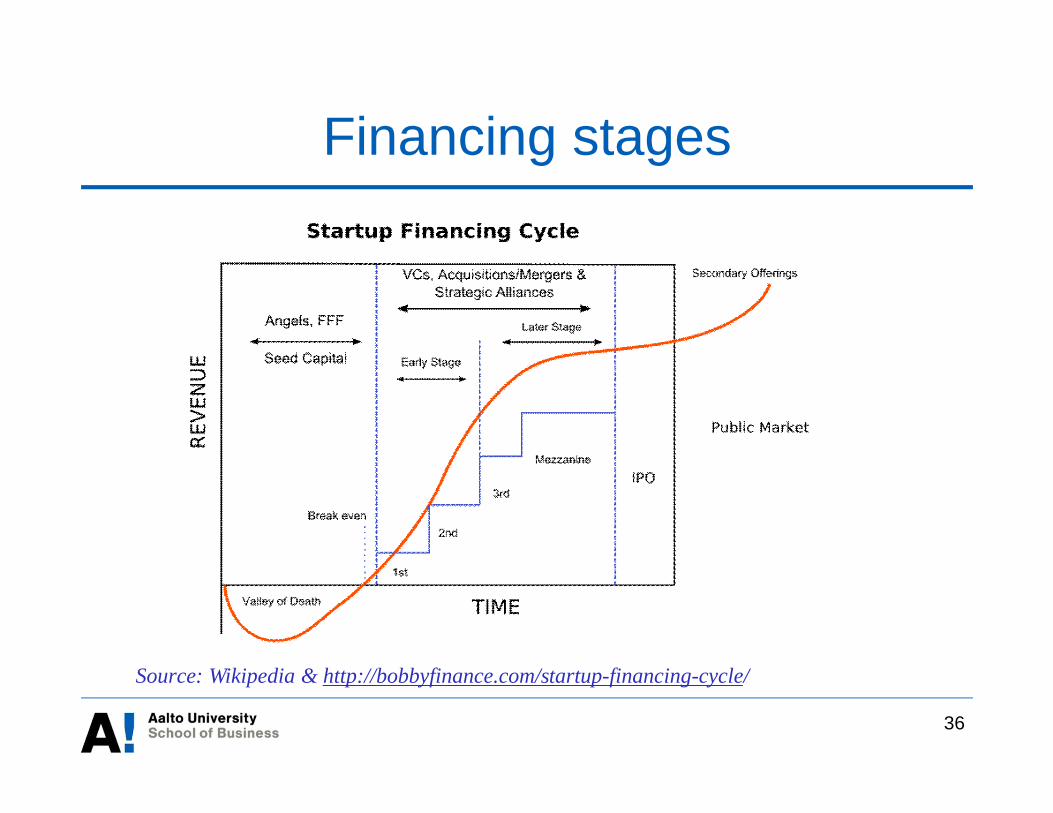
Financing stages
36
Source: Wikipedia & http://bobbyfinance.com/startup-financing-cycle/
37
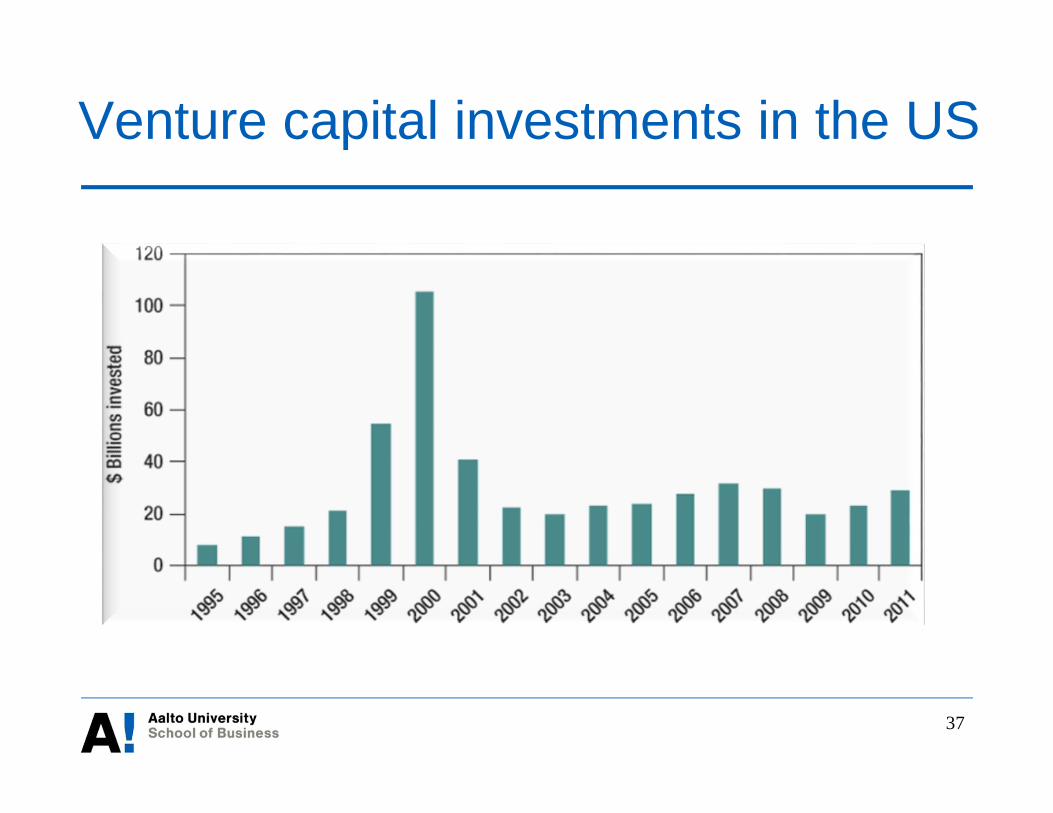
Venture capital investments in the US
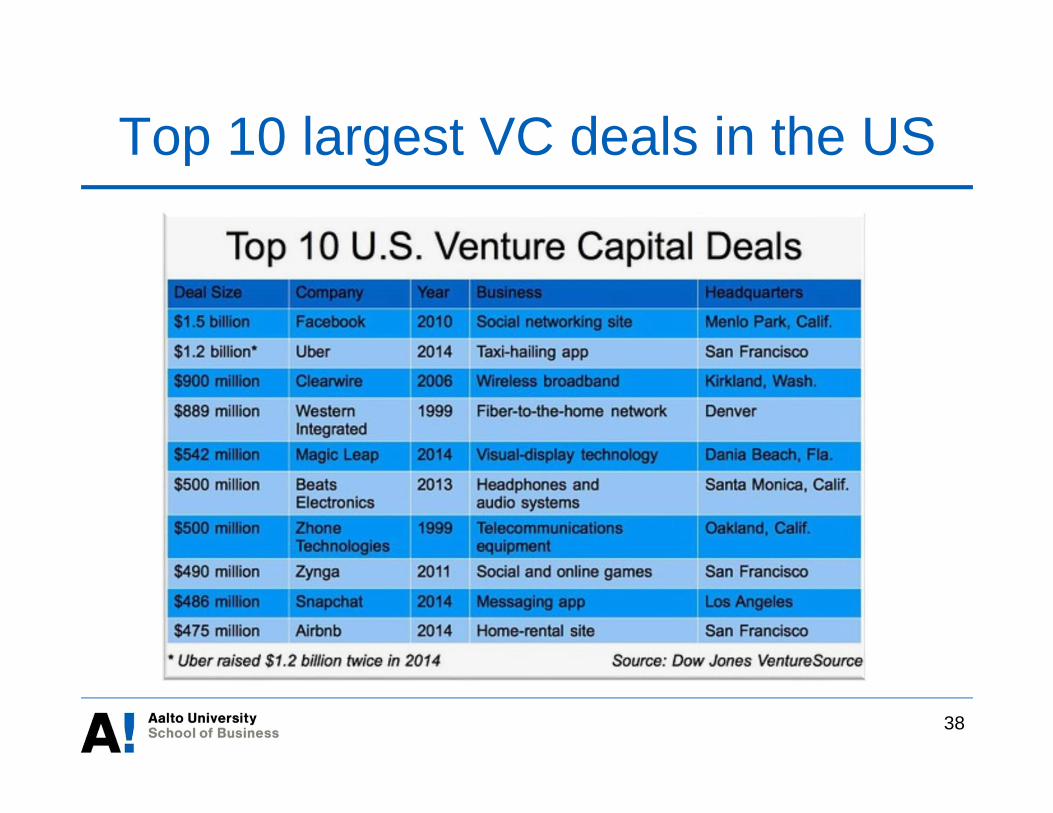
Top 10 largest VC deals in the US
38
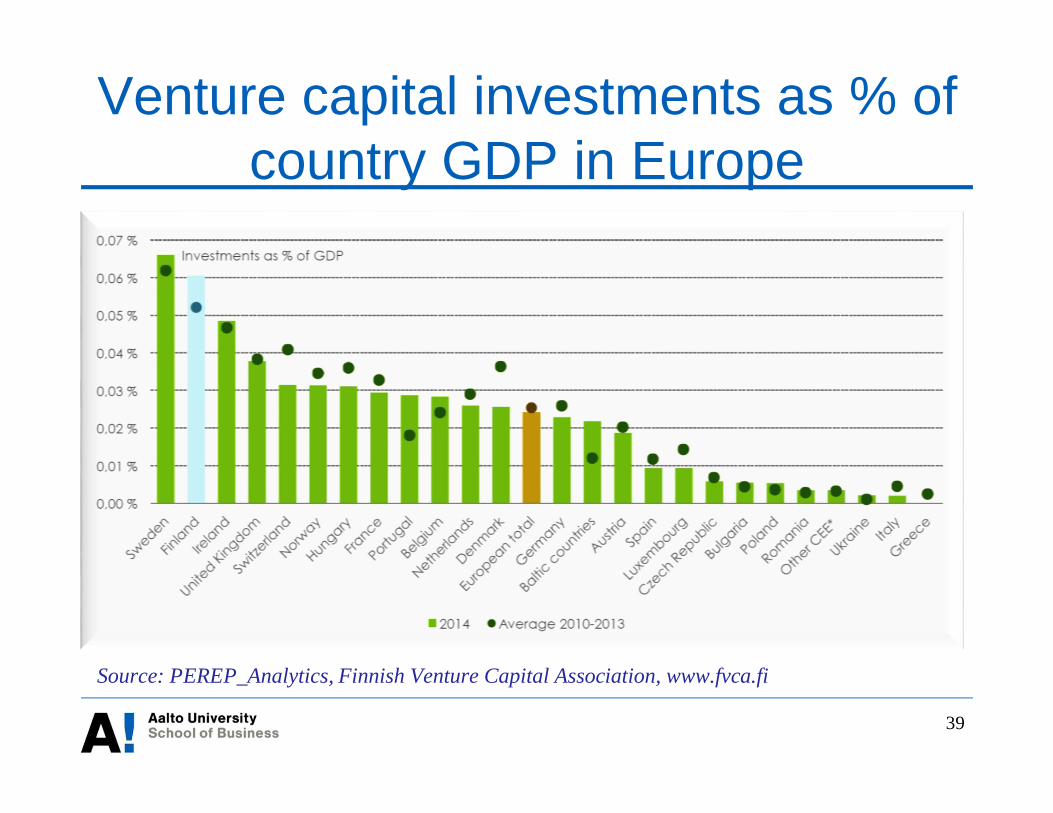
Source: PEREP_Analytics, Finnish Venture Capital Association, www.fvca.fi
39
Venture capital investments as % ofcountry GDP in Europe
40
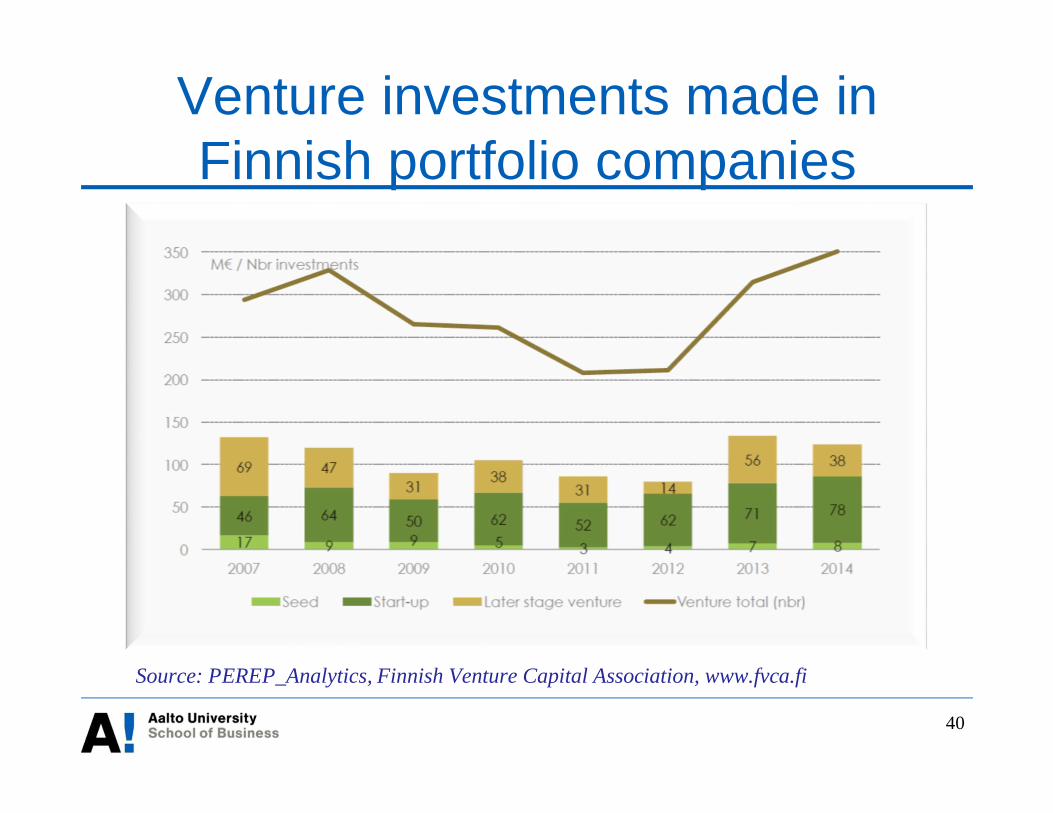
Venture investments made inFinnish portfolio companies
Source: PEREP_Analytics, Finnish Venture Capital Association, www.fvca.fi

41
Lecture 2
How corporations issue securities

42
Overview
• Equity offerings: key concepts
• IPOs• Motives for going public• Short-term performance
• Underpricing and winner’s curse hypothesis• Timing
• Long-term performance
• SEOs• Announcement effect• Rights offer

43
Equity offerings: key concepts
• Three questions(1) Have the shares been listed before?
• In an initial public offering (IPO) the issuer sells its shares (on averageabout a third of the stocks outstanding) to the market for the first time
• In an seasoned equity offering (SEO) the share is already listed at thetime of the issue
(2) Who are the shares sold to?• Rights offerings are targeted to current stockholders• General cash offerings are targeted to the investing public in general
(3) Who gets the money?• In a primary offering the issuer issues new shares• In a secondary offering the original owners sell their shares to investors
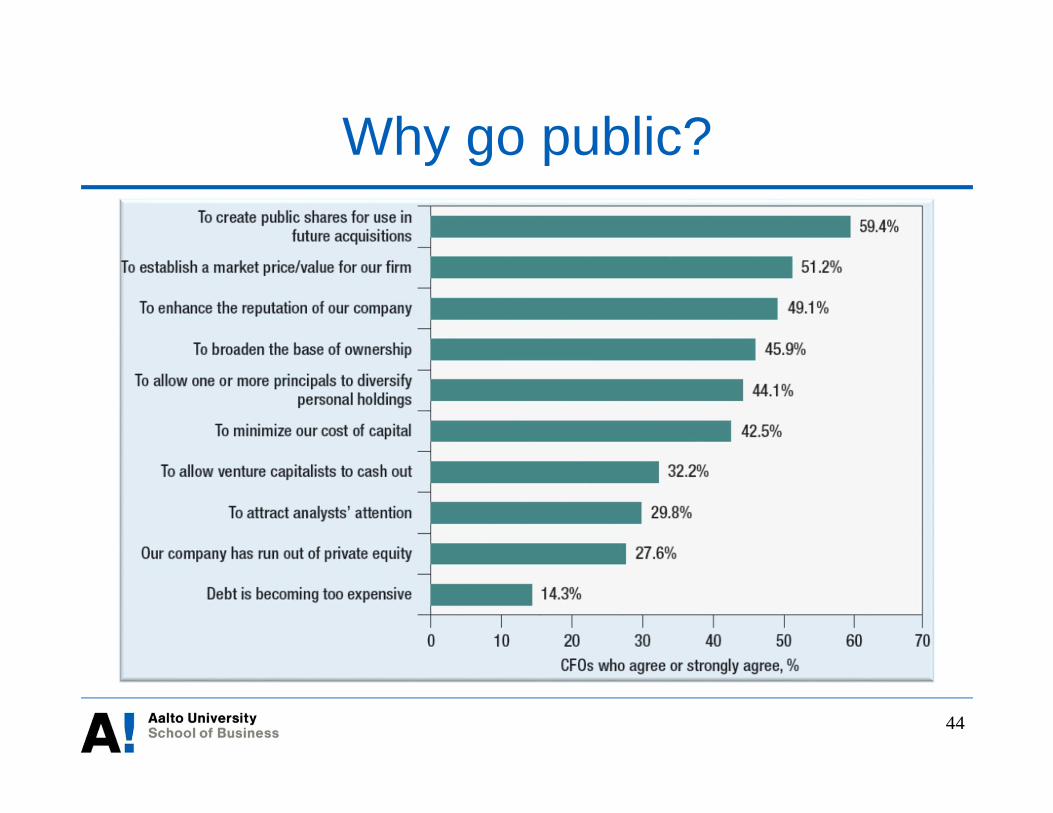
44
Why go public?
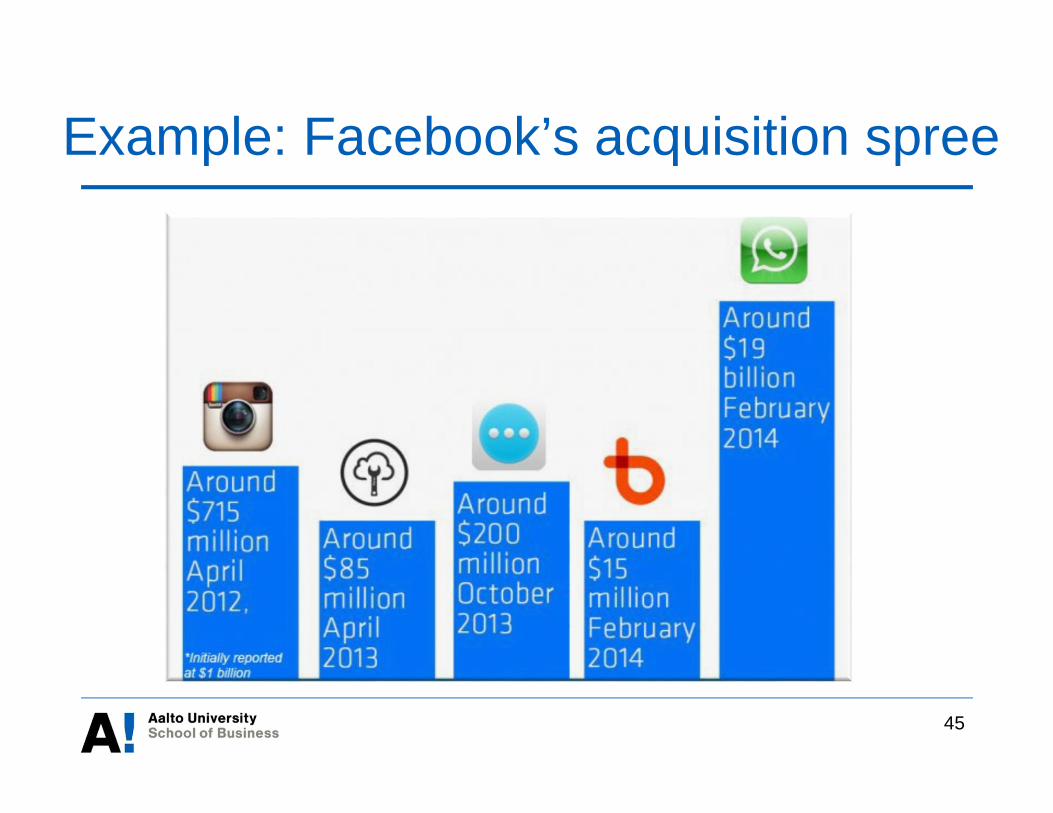
Example: Facebook’s acquisition spree
45

46
Key (hidden) cost: IPO underpricing• IPO firms and their original shareholders leave
substantial amounts of money on the table• Most IPO shares trade initially at substantial premiums
relative to offer price• Initial IPO return in Finland and in U.S. has been on average
15-20%• These returns are typically realized during a short period of
time (a few days or so)• This initial return is frequently called the "underpricing"
of IPOs• IPOs by small and risky firms tend to be most
underpriced

Examples: Money left on the table
47
Source: Jay Ritter, http://bear.warrington.ufl.edu/ritter/ipodata.htm
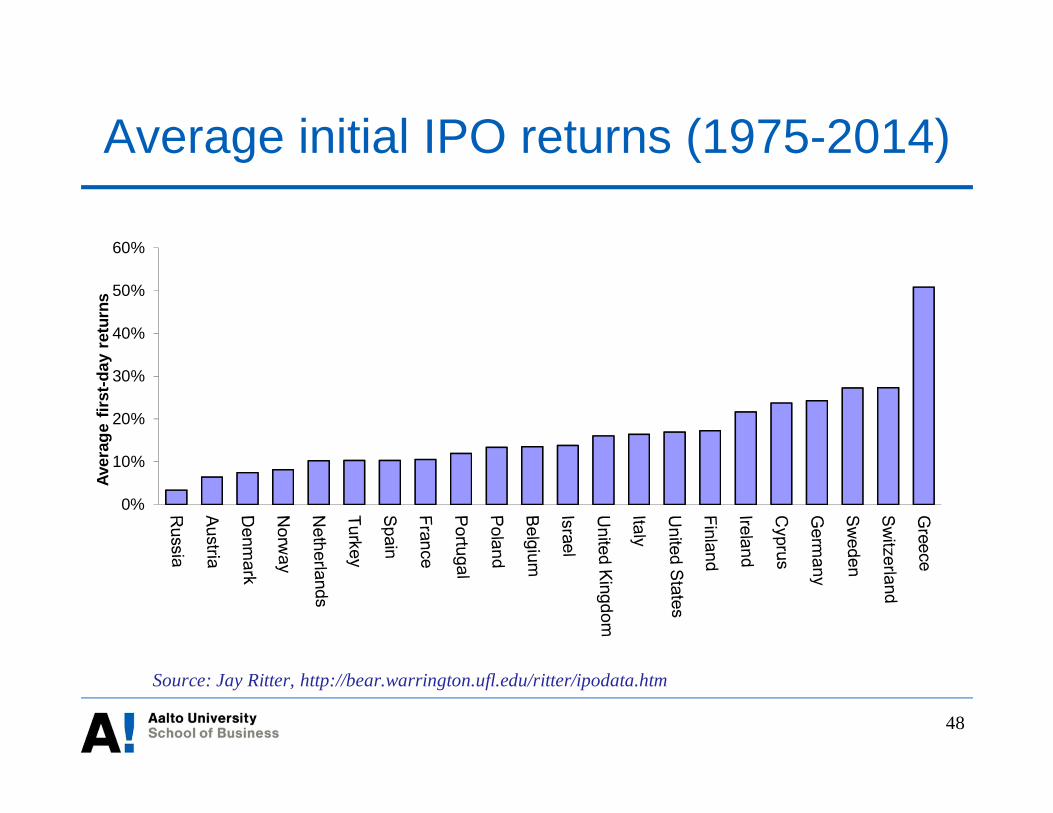
48
Average initial IPO returns (1975-2014)
0%
10%
20%
30%
40%
50%
60%
Aver
age
first
-day
retu
rns
Source: Jay Ritter, http://bear.warrington.ufl.edu/ritter/ipodata.htm
49
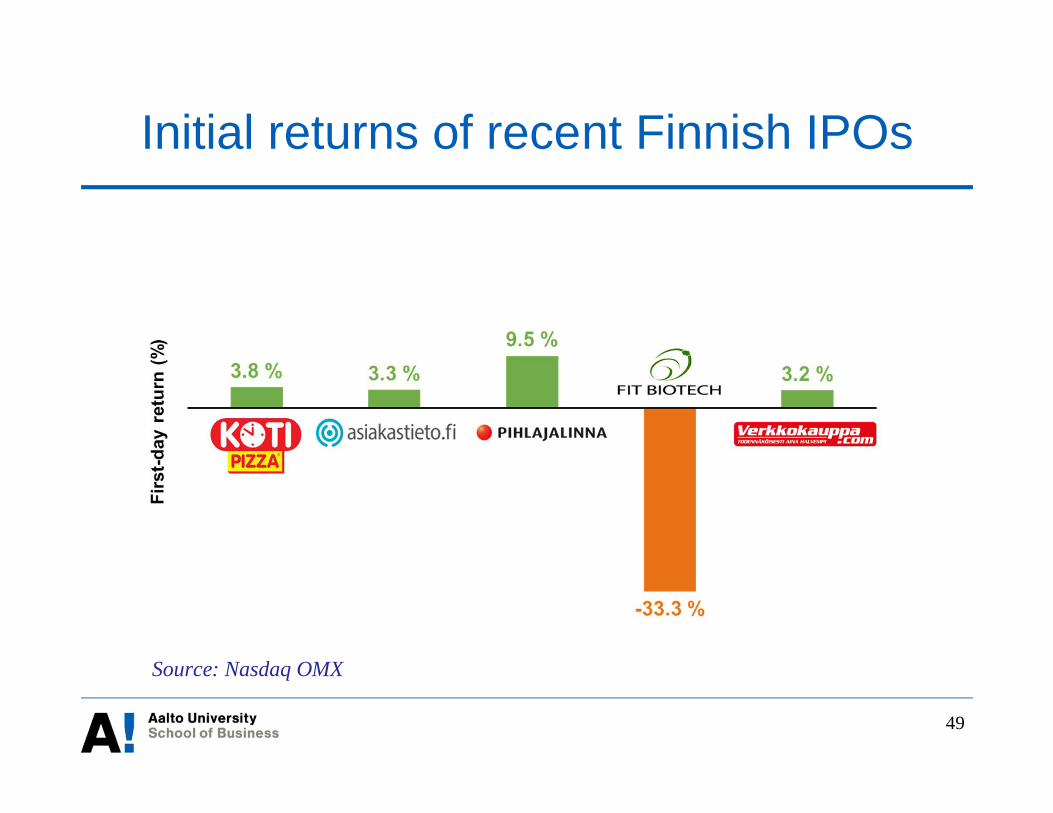
Initial returns of recent Finnish IPOs
Source: Nasdaq OMX
50
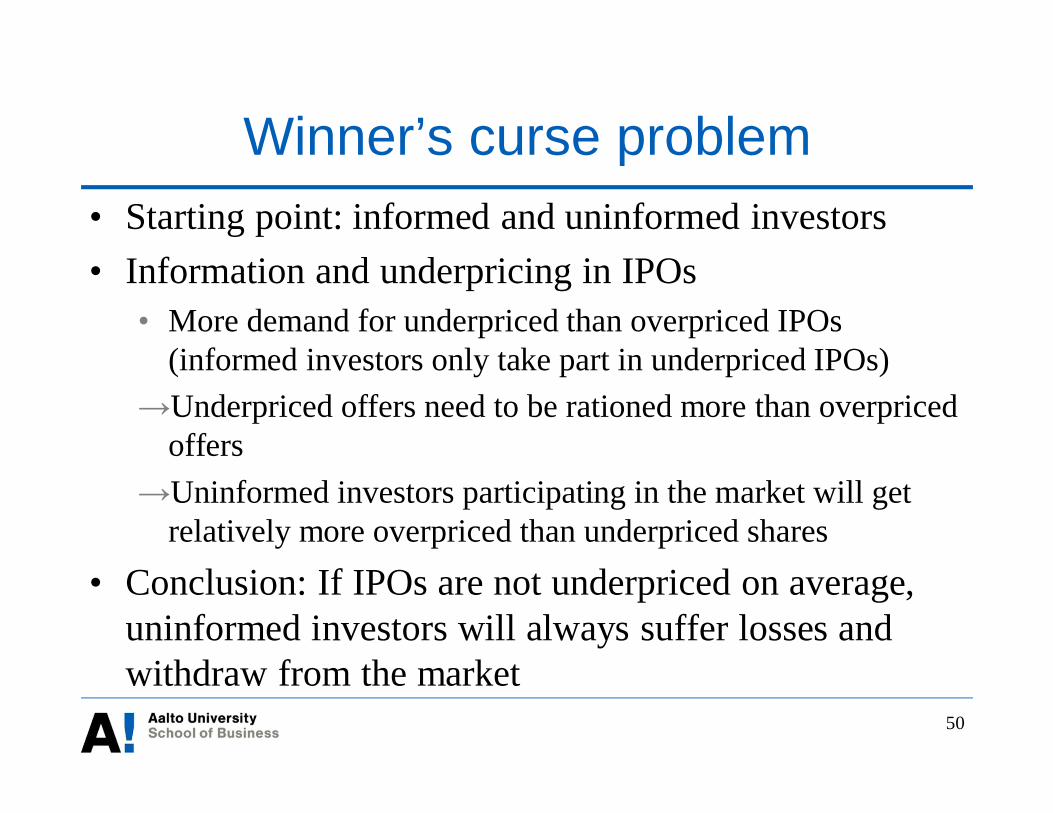
Winner’s curse problem• Starting point: informed and uninformed investors• Information and underpricing in IPOs
• More demand for underpriced than overpriced IPOs(informed investors only take part in underpriced IPOs)Underpriced offers need to be rationed more than overpricedoffersUninformed investors participating in the market will getrelatively more overpriced than underpriced shares
• Conclusion: If IPOs are not underpriced on average,uninformed investors will always suffer losses andwithdraw from the market
51
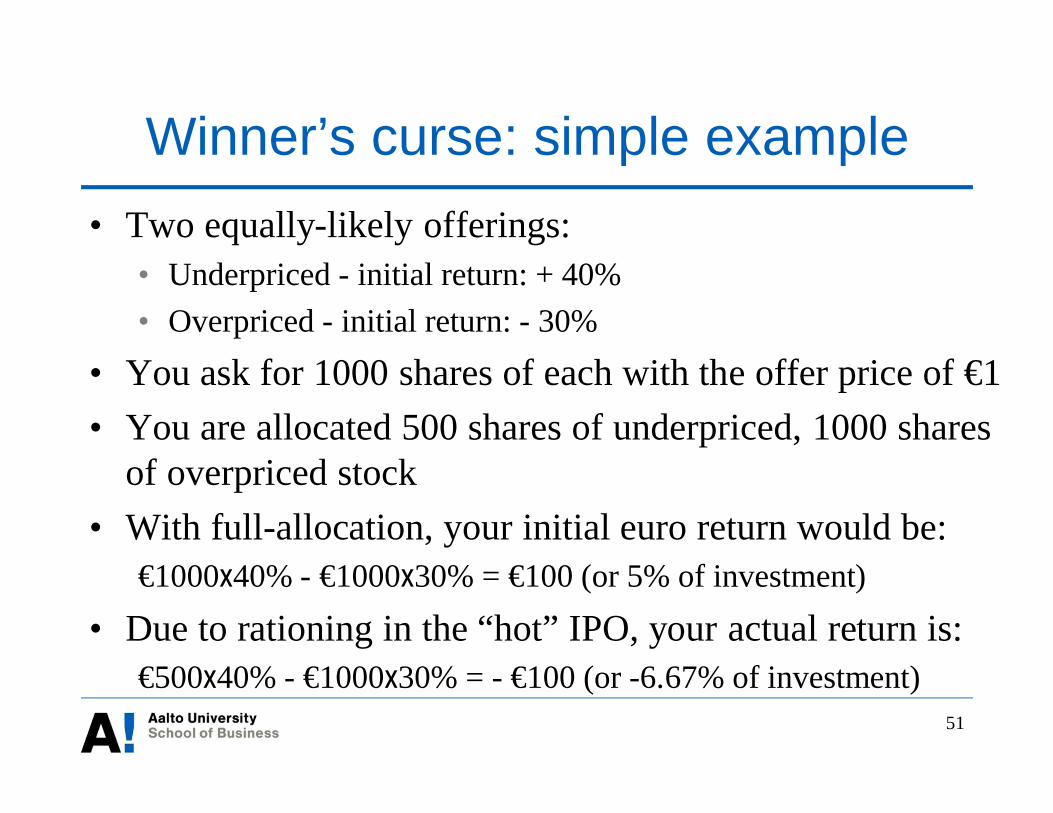
Winner’s curse: simple example• Two equally-likely offerings:
• Underpriced - initial return: + 40%• Overpriced - initial return: - 30%
• You ask for 1000 shares of each with the offer price of €1• You are allocated 500 shares of underpriced, 1000 shares
of overpriced stock• With full-allocation, your initial euro return would be:
€1000x40% - €1000x30% = €100 (or 5% of investment)
• Due to rationing in the “hot” IPO, your actual return is:€500x40% - €1000x30% = - €100 (or -6.67% of investment)

Empirical Evidence on Winner’sCurse (e.g., Keloharju, 1993)
52
53
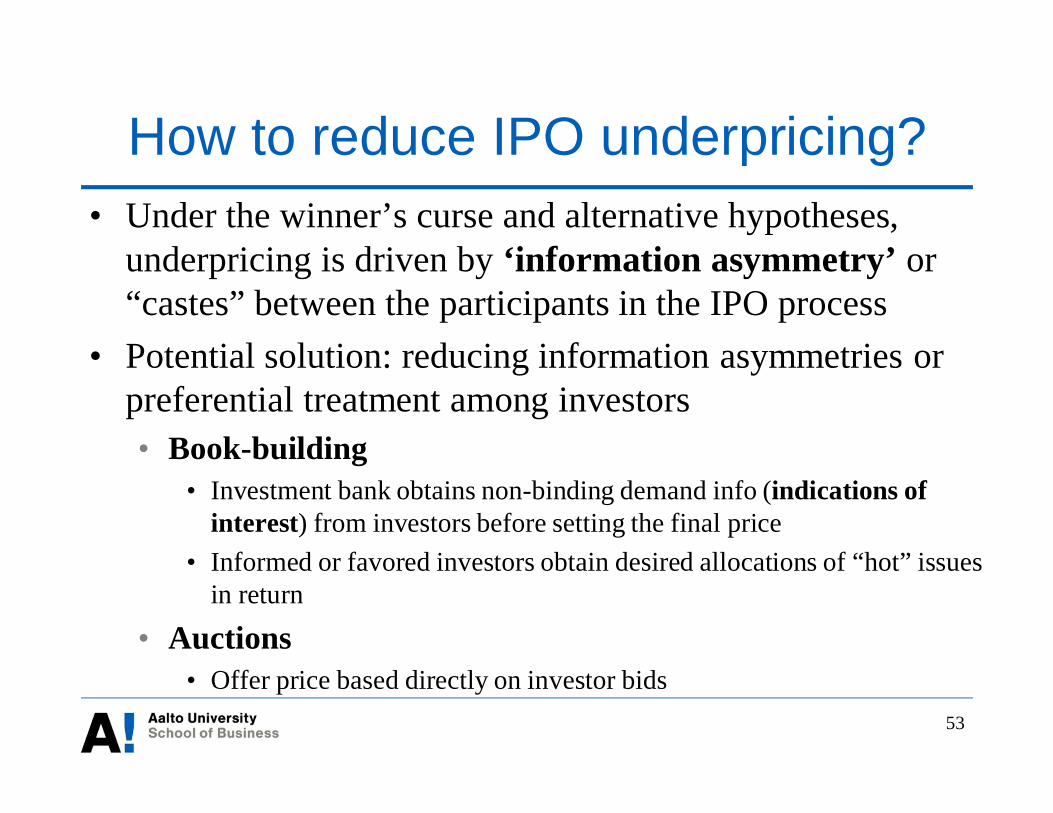
How to reduce IPO underpricing?• Under the winner’s curse and alternative hypotheses,
underpricing is driven by ‘information asymmetry’ or“castes” between the participants in the IPO process
• Potential solution: reducing information asymmetries orpreferential treatment among investors• Book-building
• Investment bank obtains non-binding demand info (indications ofinterest) from investors before setting the final price
• Informed or favored investors obtain desired allocations of “hot” issuesin return
• Auctions• Offer price based directly on investor bids

54
Hot new-issue periods• Equity offerings, particularly IPOs, tend to be clustered in hot-
issue periods, i.e., when stock prices are in general at historicalhighs:• IPOs are timed to coincide with these periods – leading to
IPO waves• Hot issue markets are often driven by issuers in a given industry
The Economist (2011)

55
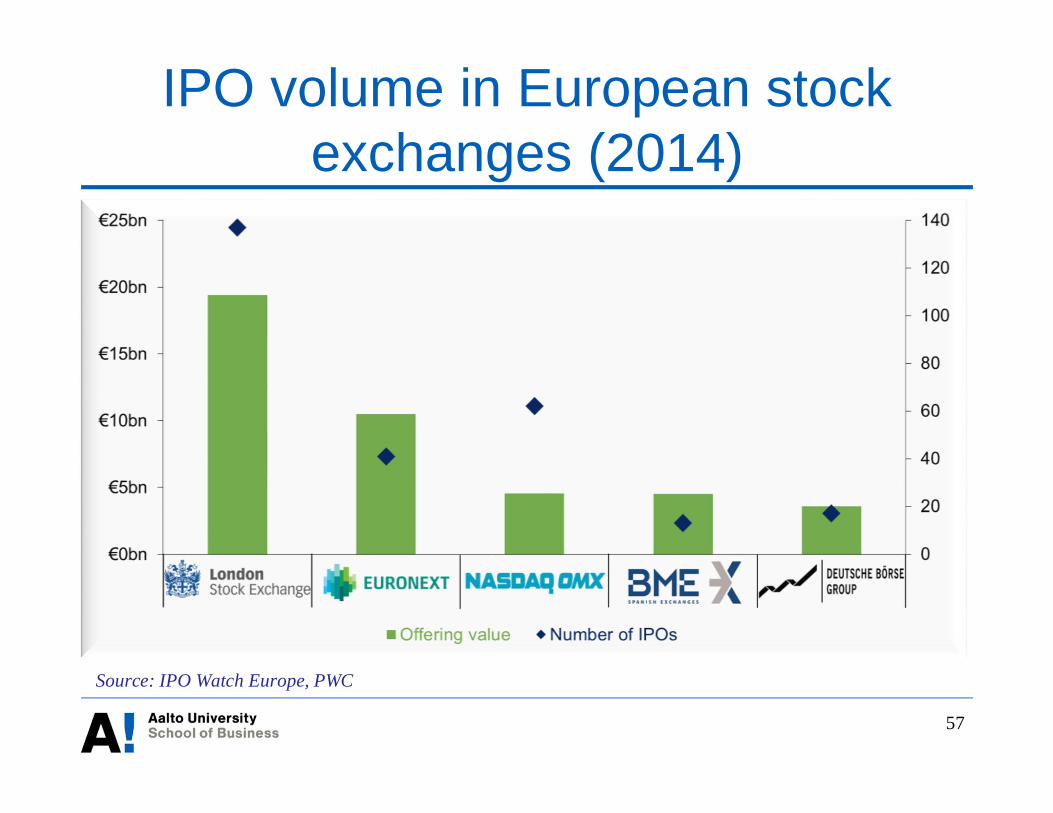
IPO volume in the U.S.In 1980-2000, an average of 310 firms went public every yearIn 2001-2014, an average of 111 firms went public every year
Aggregate IPO proceeds in 2014: $ 42.30 billion
Source: Jay Ritter, http://bear.warrington.ufl.edu/ritter/ipodata.htm
56
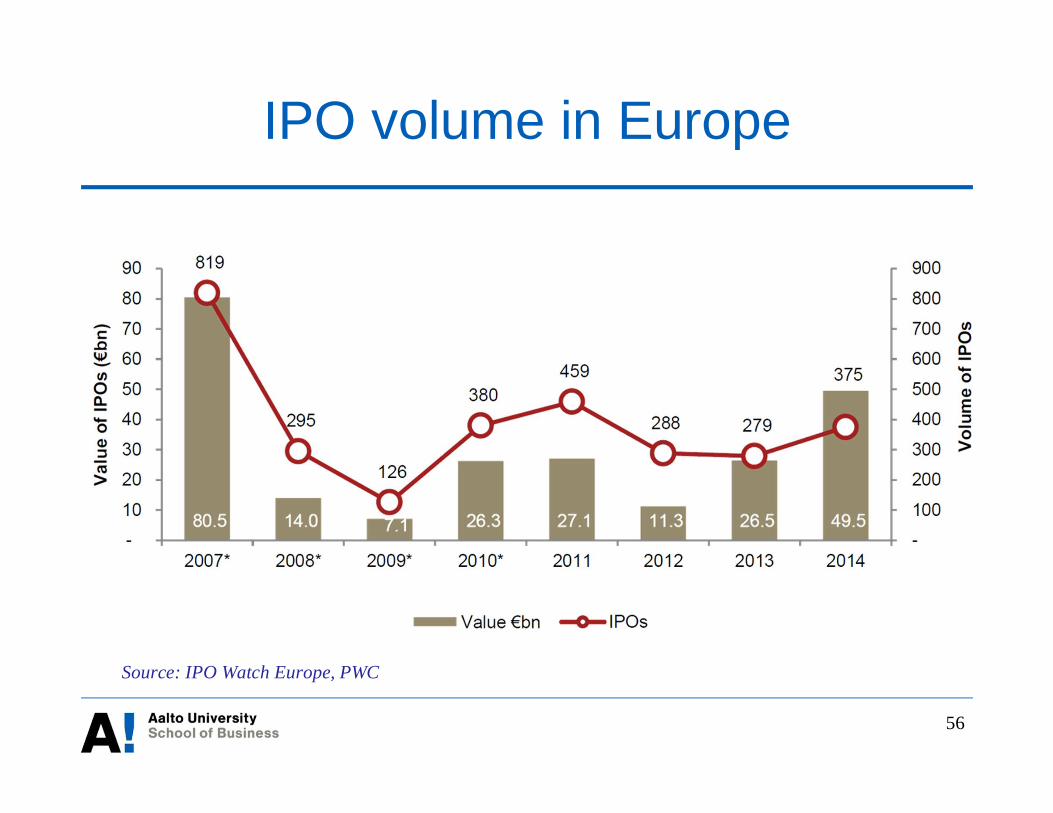
IPO volume in Europe
Source: IPO Watch Europe, PWC
57
IPO volume in European stockexchanges (2014)
Source: IPO Watch Europe, PWC
IPOs in Finland
58
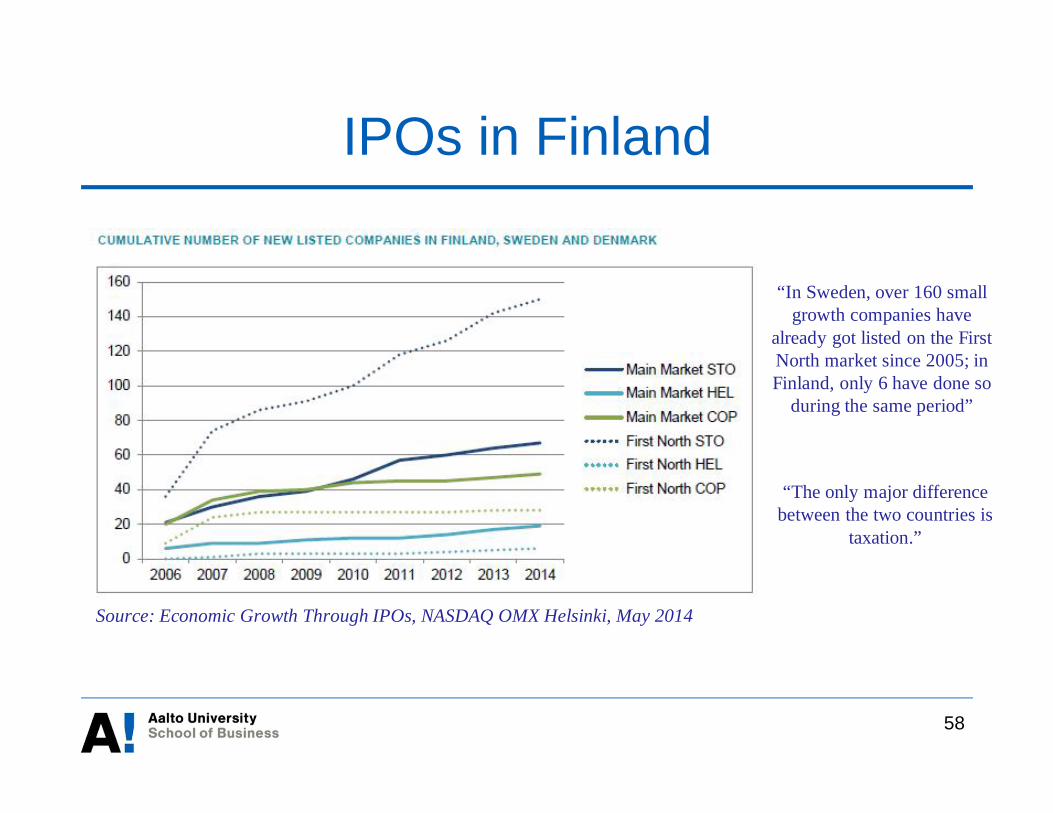
Source: Economic Growth Through IPOs, NASDAQ OMX Helsinki, May 2014
“In Sweden, over 160 smallgrowth companies have
already got listed on the FirstNorth market since 2005; inFinland, only 6 have done so
during the same period”
“The only major differencebetween the two countries is
taxation.”

59
Long-term performance
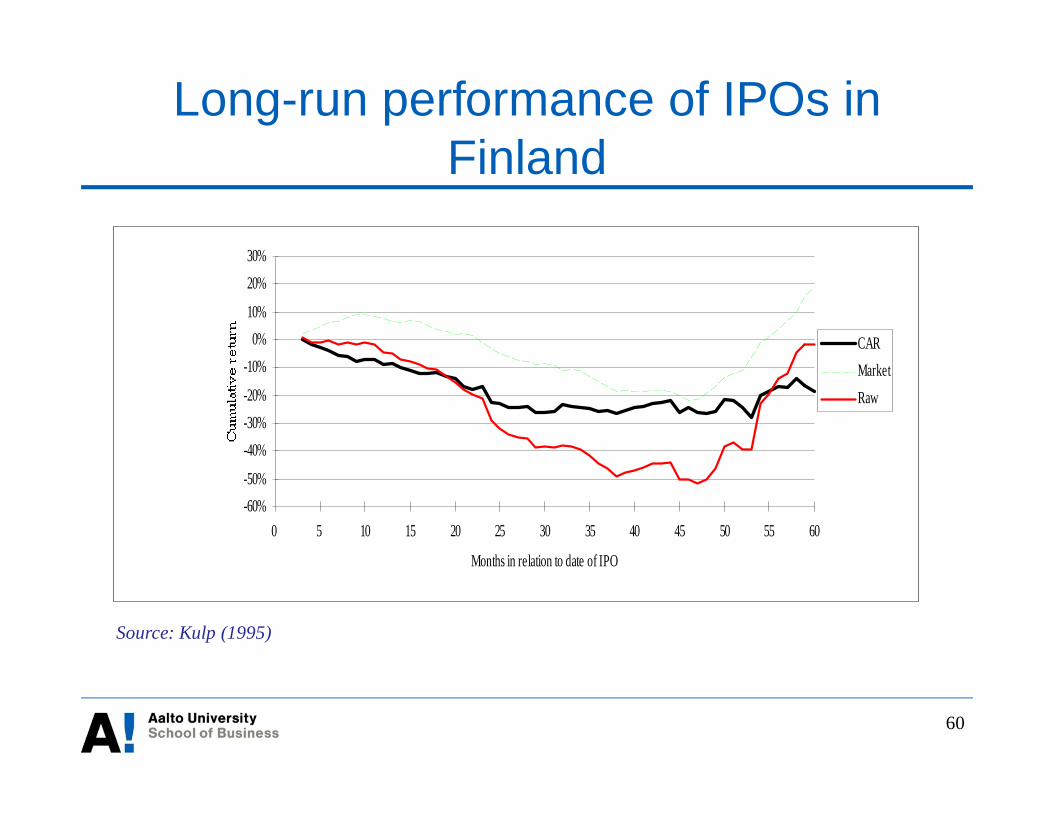
• IPOs (and SEOs) tend to underperform similar firms inthe long run, both in terms of operating performanceand stock market performance
• The underperformance appears to last at least 3 years
Source: Loughran and Ritter (Journal of Finance, 1995)
”An investor would have toinvest 44% more money in theIPO firms than non-issuers to
have the same wealth five yearsafter the offering.”
60
Long-run performance of IPOs inFinland
-60%-50%
-40%-30%-20%
-10%0%
10%
20%30%
0 5 10 15 20 25 30 35 40 45 50 55 60
Months in relation to date of IPO
CARMarketRaw
Source: Kulp (1995)
61
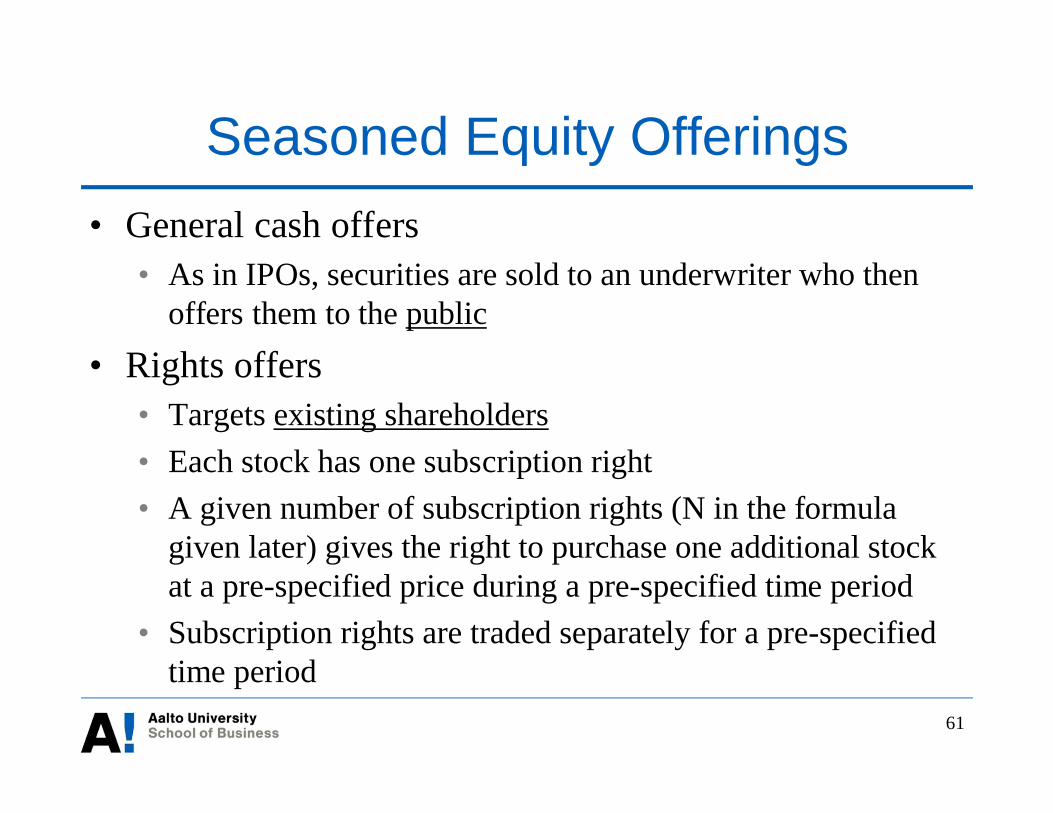
Seasoned Equity Offerings• General cash offers
• As in IPOs, securities are sold to an underwriter who thenoffers them to the public
• Rights offers• Targets existing shareholders• Each stock has one subscription right• A given number of subscription rights (N in the formula
given later) gives the right to purchase one additional stockat a pre-specified price during a pre-specified time period
• Subscription rights are traded separately for a pre-specifiedtime period

62
SEO announcement effect
• Announcement of seasoned equity offerings tend tolead to adverse price effects• In the U.S., announcement of an SEO typically results in a 3-
4% decline in the stock price• This decline is economically important
• On average, the fall in the stock value is equivalent to about a third ofthe new money raised by the offering
• Why?• Greater supply of stocksè lower stock price? Not so much!• Information revealed by the stock issue
SEOs in Europe
63
Source: IPO Watch Europe, PWC
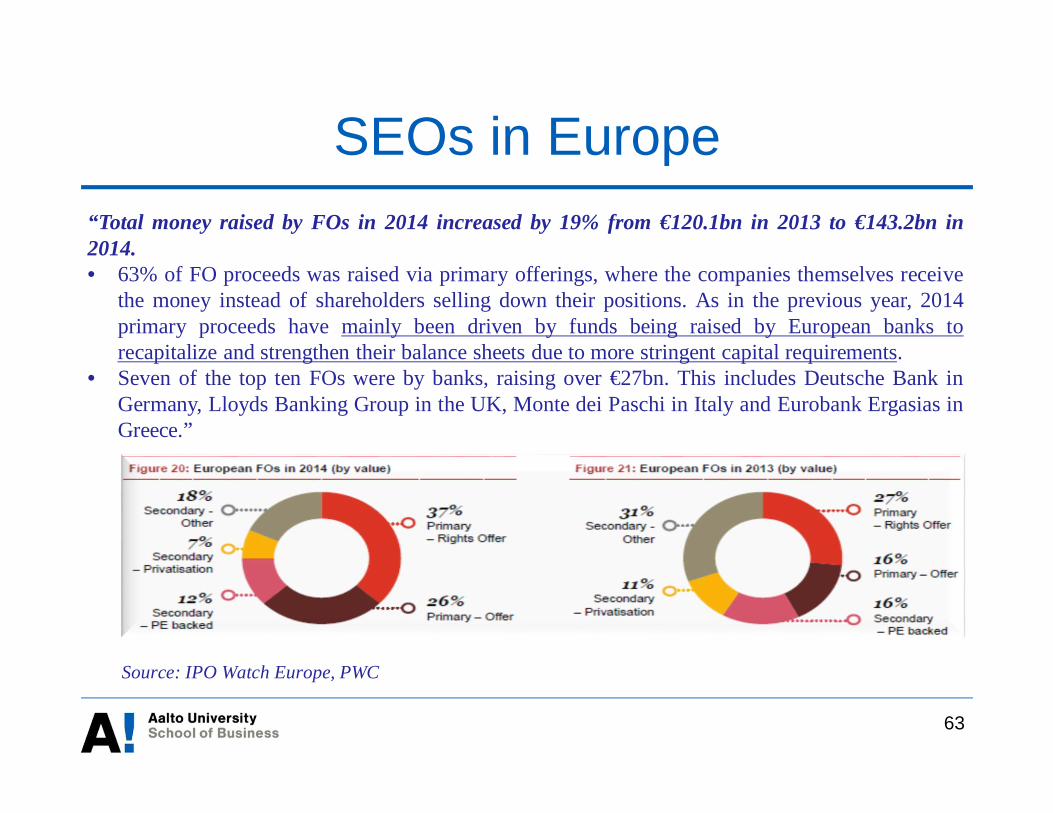
“Total money raised by FOs in 2014 increased by 19% from €120.1bn in 2013 to €143.2bn in2014.• 63% of FO proceeds was raised via primary offerings, where the companies themselves receive
the money instead of shareholders selling down their positions. As in the previous year, 2014primary proceeds have mainly been driven by funds being raised by European banks torecapitalize and strengthen their balance sheets due to more stringent capital requirements.
• Seven of the top ten FOs were by banks, raising over €27bn. This includes Deutsche Bank inGermany, Lloyds Banking Group in the UK, Monte dei Paschi in Italy and Eurobank Ergasias inGreece.”
64
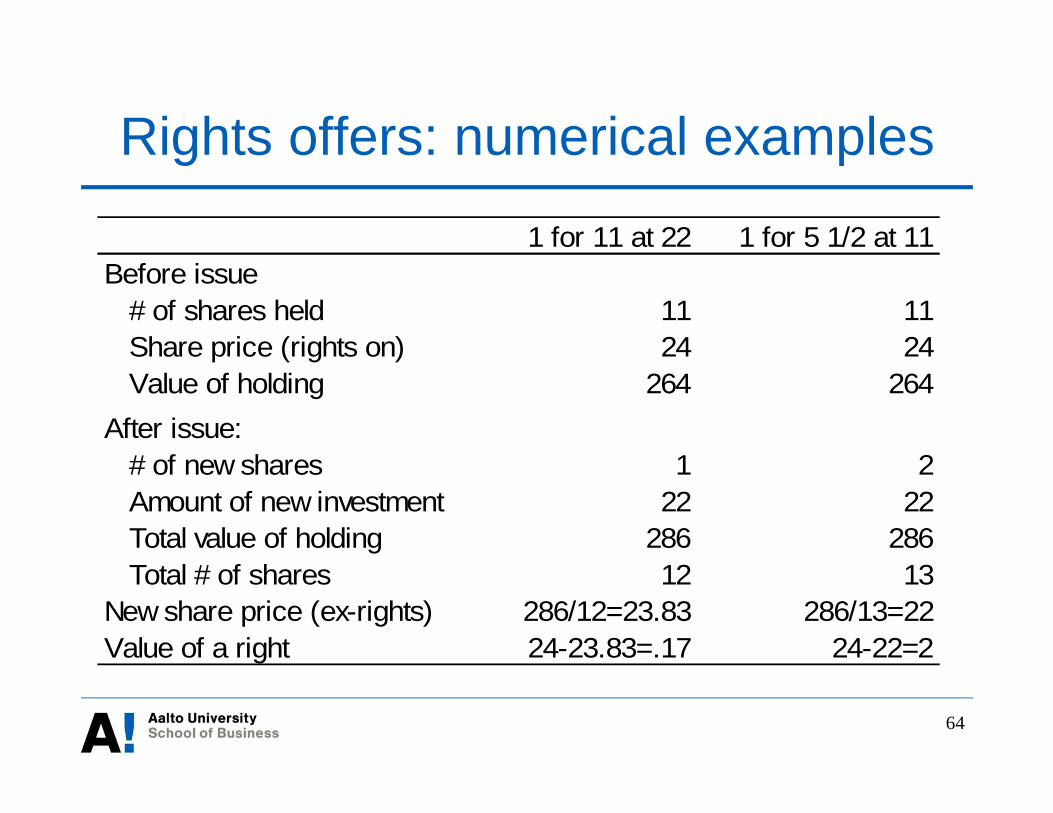
Rights offers: numerical examples
1 for 11 at 22 1 for 5 1/2 at 11Before issue # of shares held 11 11 Share price (rights on) 24 24 Value of holding 264 264After issue: # of new shares 1 2 Amount of new investment 22 22 Total value of holding 286 286 Total # of shares 12 13New share price (ex-rights) 286/12=23.83 286/13=22Value of a right 24-23.83=.17 24-22=2
65
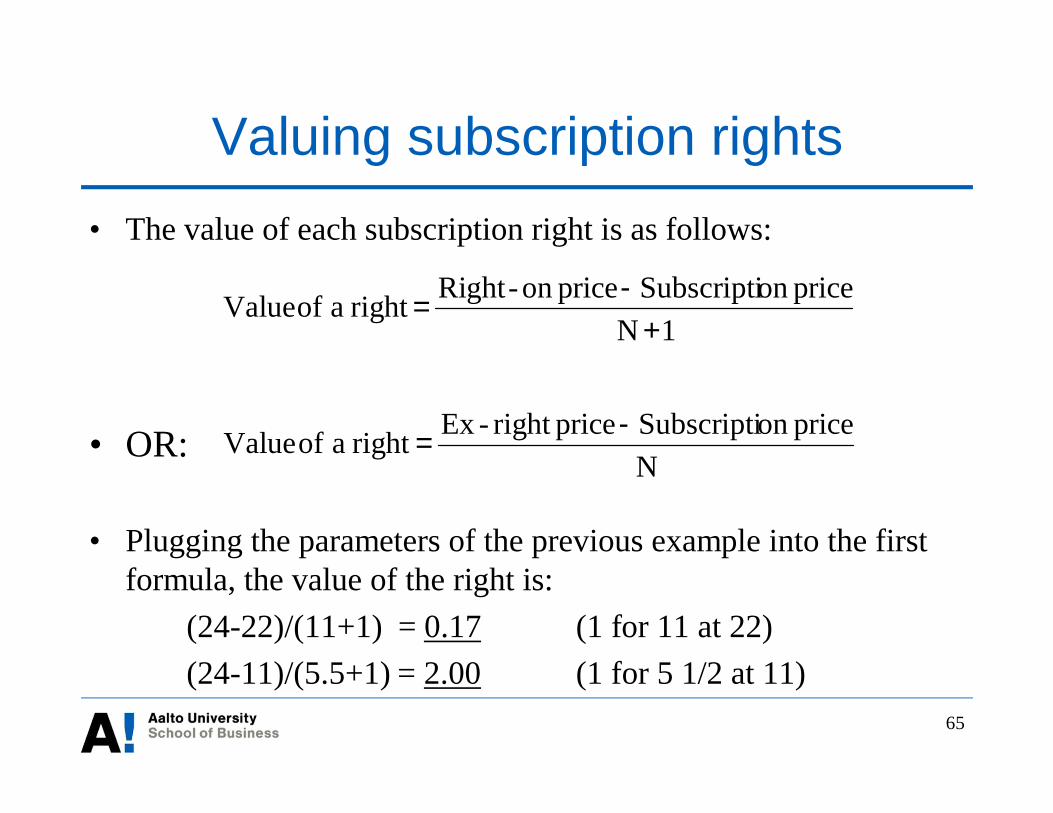
Valuing subscription rights• The value of each subscription right is as follows:
• OR:
• Plugging the parameters of the previous example into the firstformula, the value of the right is:
(24-22)/(11+1) = 0.17 (1 for 11 at 22)(24-11)/(5.5+1) = 2.00 (1 for 5 1/2 at 11)
1NpriceonSubscriptipriceon-RightrightaofValue
+-
=
NpriceonSubscriptipriceright-ExrightaofValue -
=

66
Rights issue price is irrelevant but...• Subscription price for rights issues is irrelevant for the
owners if all existing owners participate in the issue• Easy to see that this holds in the previous example
• In both cases the amount of new investment and the value of theportfolio after the offering is the same, although terms of the tworights offers are very different
• In practice some subscription rights are sold tooutsiders• This matters if existing shareholders (i.e. the investors who
sell their rights) have inside information• If all rights are sold to outsiders, rights offers should have
similar adverse selection effects as general cash offerings

67
Signaling with rights offers
• Rights offers may act as a signal of the management’sintentions or expectations
• A lower offer price:• May be a good signal implies a larger increase in the
future dividends• Companies tend to be reluctant to decrease the dividend per share
• But may also signal management’s concern of offer failure ata higher price
• Evidence so far: It doesn’t matter in the US and Norway, butproduces a positive reaction in Italy
68
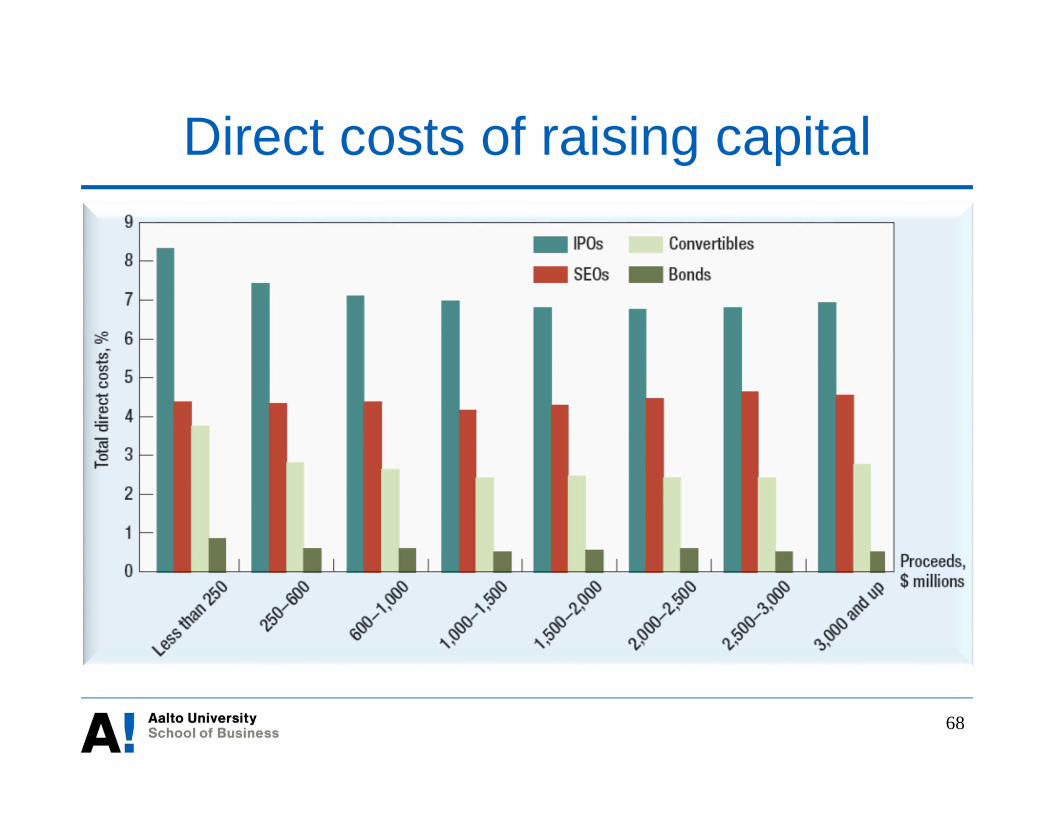
Direct costs of raising capital
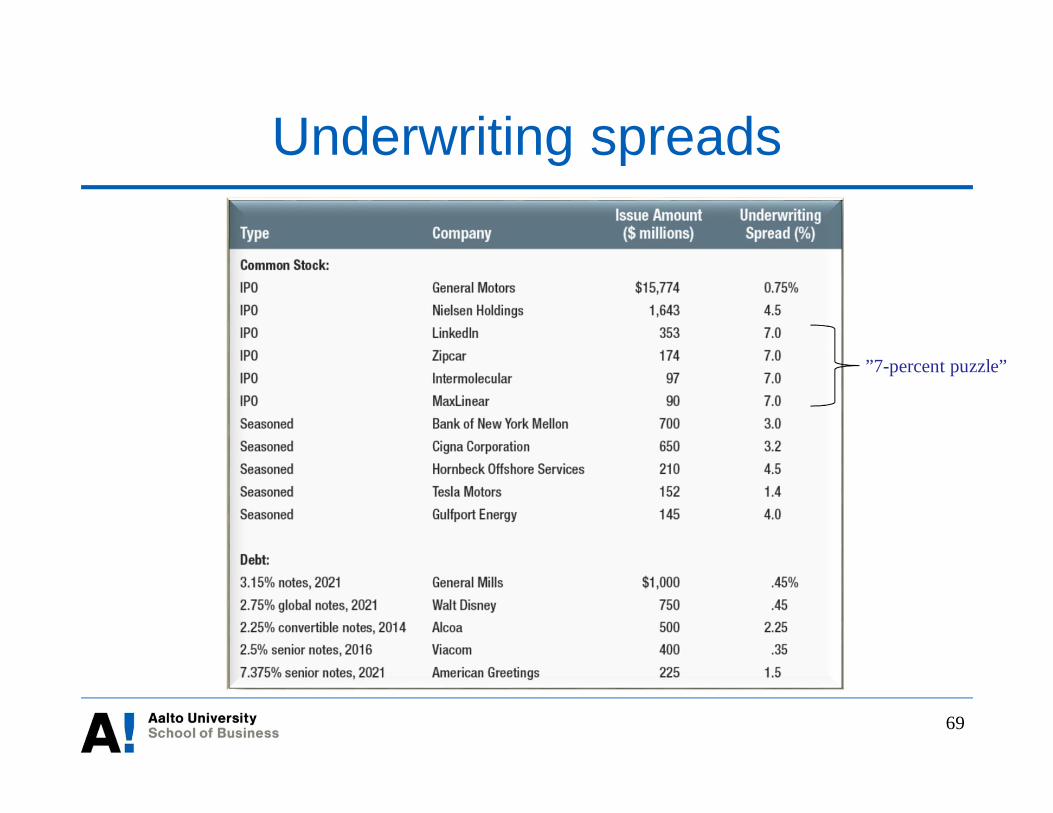
69
Underwriting spreads
”7-percent puzzle”
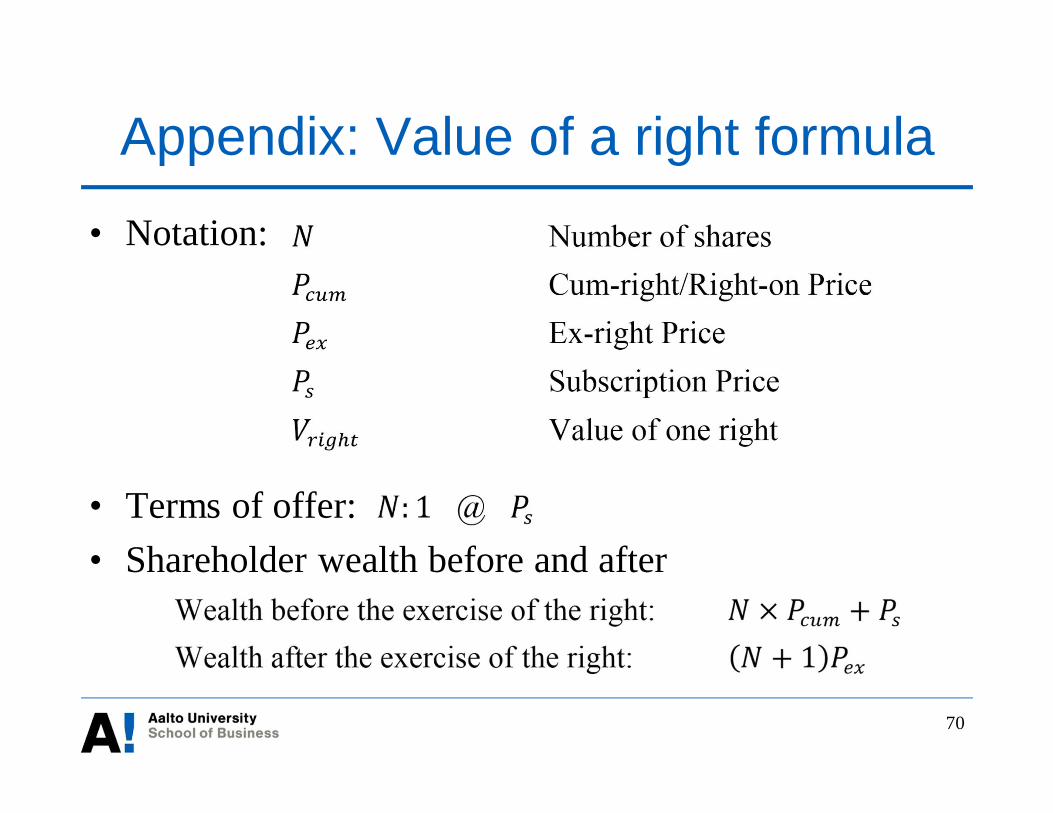
• Notation:
• Terms of offer:• Shareholder wealth before and after
70
Appendix: Value of a right formula

71
• Formula derivation:
Appendix: Value of a right formula

72
Appendix: Value of a right formula
• Alternative formula:

73
Lecture 3
Payout policy
74
Overview• Dividends: key concepts• Share repurchases• Payout decisions in practice
• Time trends• Survey evidence
• Do dividends matter? Three opposing views:• Center – Dividends are irrelevant• Rightists – Dividends are valuable• Leftists – Tax considerations
• Dividends and taxes in Finland

75
Dividends: important concepts• Dividend per share• Dividend yield = Dividend per share / Stock price• Dividend payout ratio = Dividend per share / Earnings
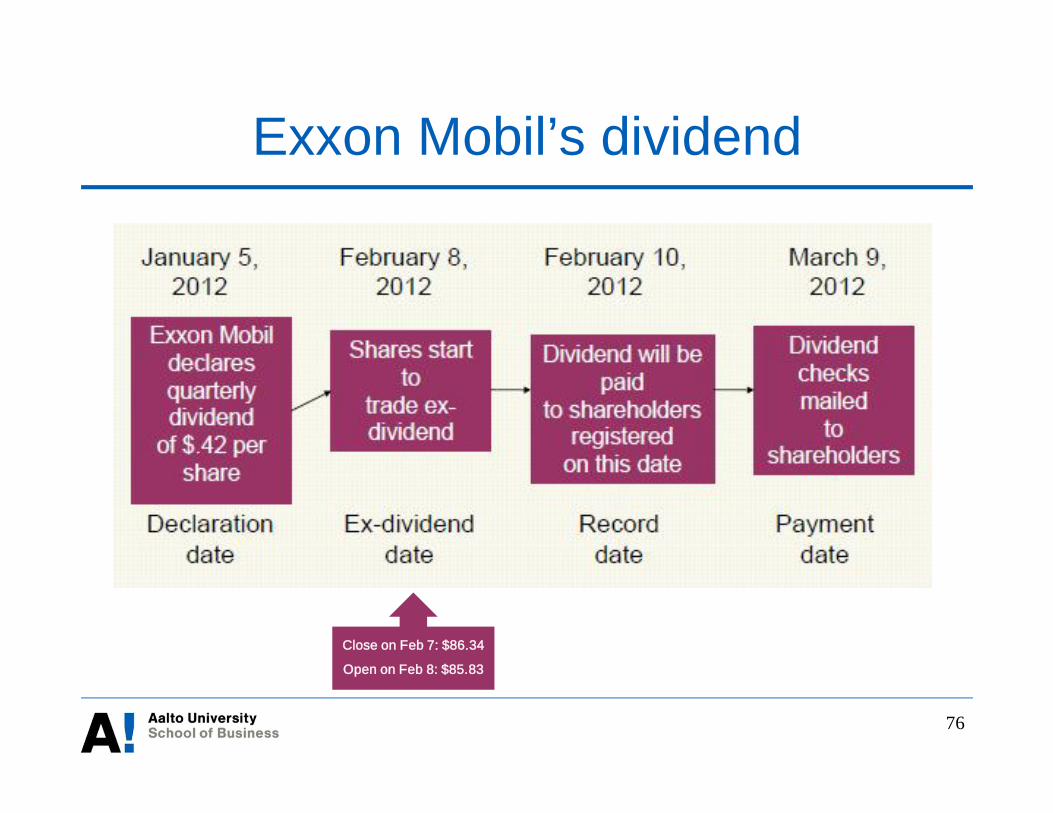
per share• Timeline of events
• Announcement date = Board’s suggestion for dividend per shareis announced
• Ex-dividend date = First day on which the stock trades withoutthe dividend; 1-2 business days before record date
• Record date = Date by which a shareholder must officially ownshares in order to be entitled to a dividend
• Date of payment
76
Exxon Mobil’s dividend
Close on Feb 7: $86.34
Open on Feb 8: $85.83
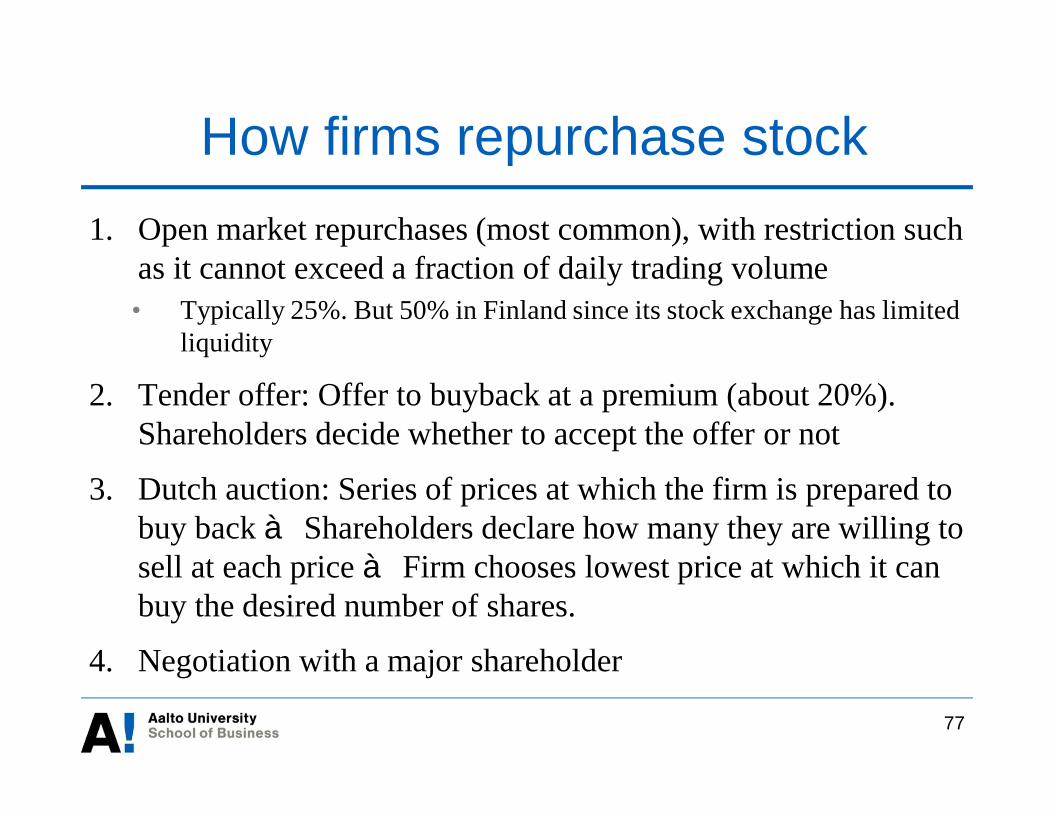
How firms repurchase stock1. Open market repurchases (most common), with restriction such
as it cannot exceed a fraction of daily trading volume• Typically 25%. But 50% in Finland since its stock exchange has limited
liquidity
2. Tender offer: Offer to buyback at a premium (about 20%).Shareholders decide whether to accept the offer or not
3. Dutch auction: Series of prices at which the firm is prepared tobuy backà Shareholders declare how many they are willing tosell at each priceà Firm chooses lowest price at which it canbuy the desired number of shares.
4. Negotiation with a major shareholder
77
78
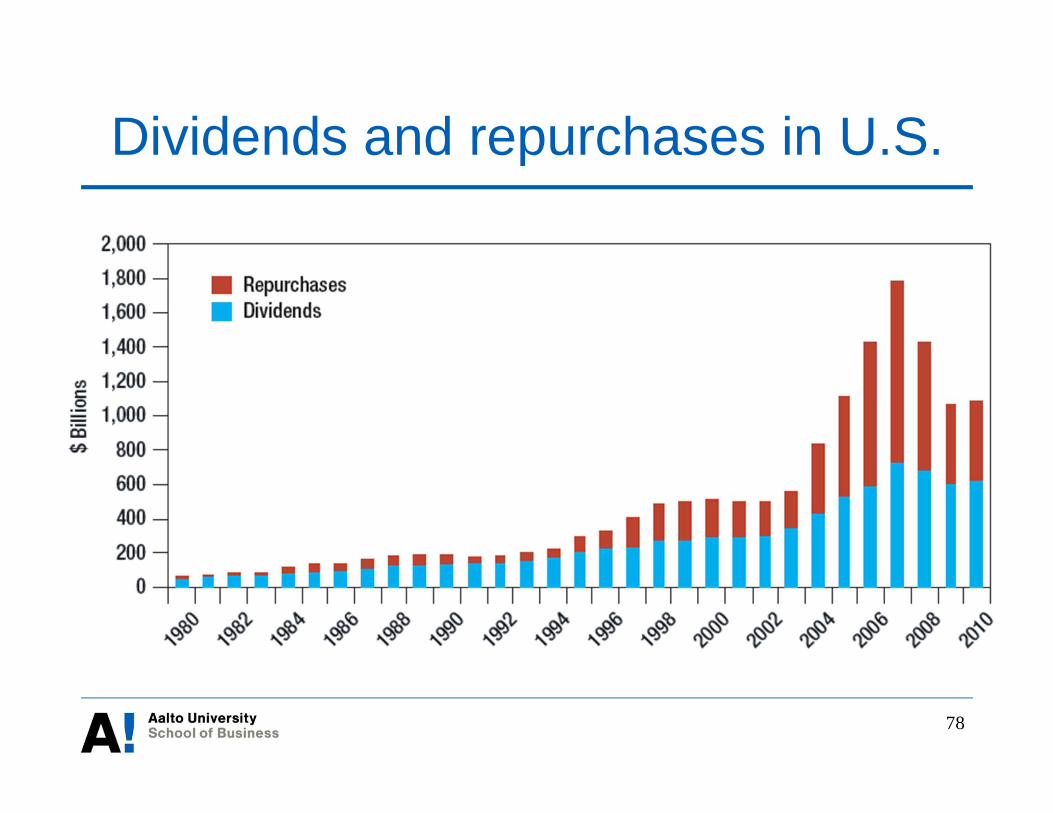
Dividends and repurchases in U.S.
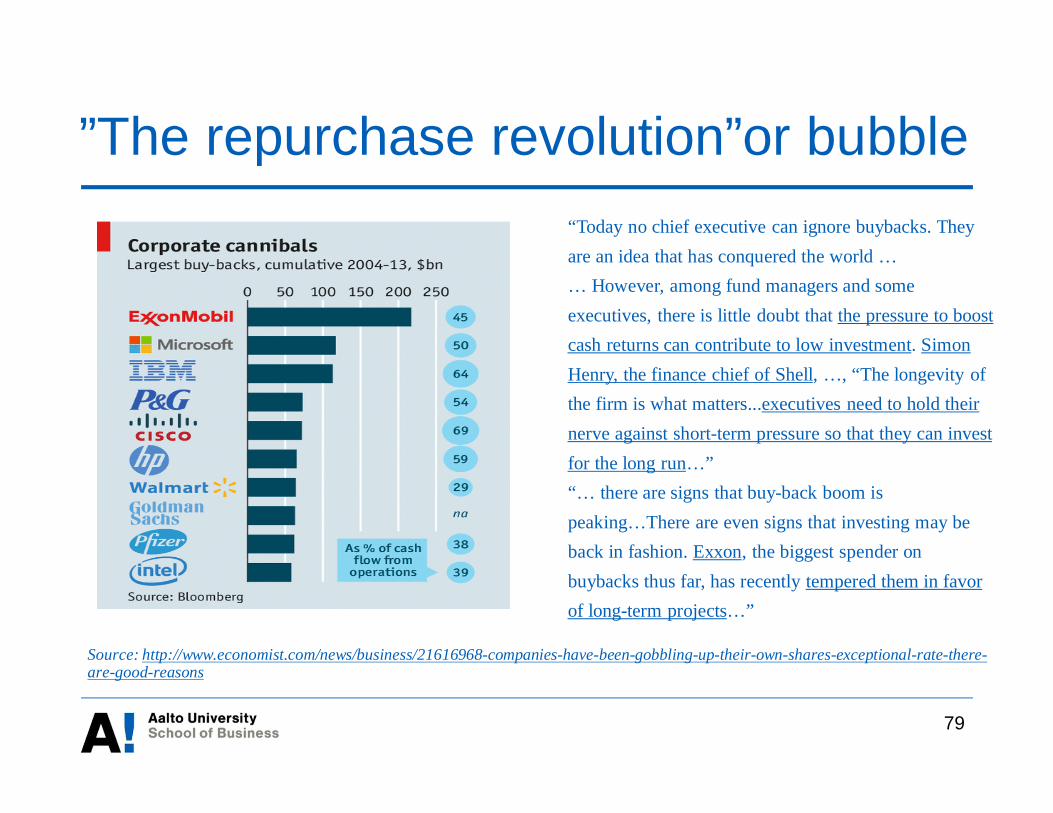
”The repurchase revolution”or bubble
79
Source: http://www.economist.com/news/business/21616968-companies-have-been-gobbling-up-their-own-shares-exceptional-rate-there-are-good-reasons
“Today no chief executive can ignore buybacks. Theyare an idea that has conquered the world …… However, among fund managers and someexecutives, there is little doubt that the pressure to boostcash returns can contribute to low investment. SimonHenry, the finance chief of Shell, …, “The longevity ofthe firm is what matters...executives need to hold theirnerve against short-term pressure so that they can investfor the long run…”“… there are signs that buy-back boom ispeaking…There are even signs that investing may beback in fashion. Exxon, the biggest spender onbuybacks thus far, has recently tempered them in favorof long-term projects…”
80
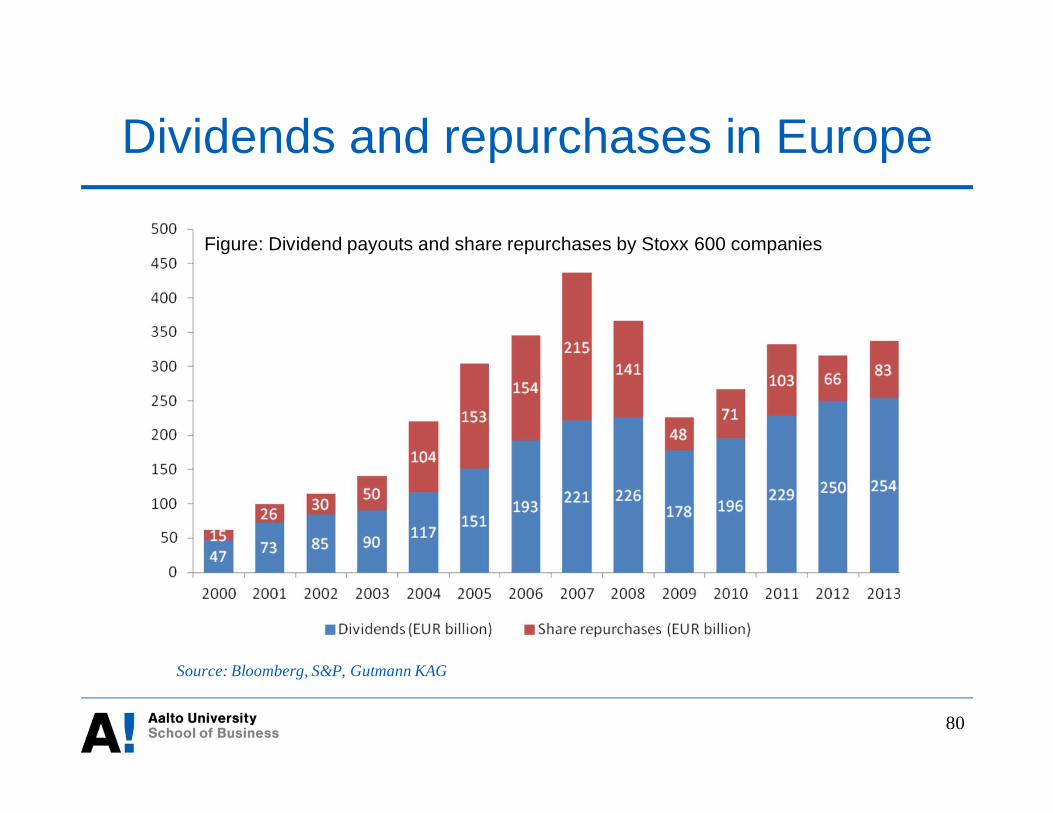
Dividends and repurchases in Europe
Source: Bloomberg, S&P, Gutmann KAG
Figure: Dividend payouts and share repurchases by Stoxx 600 companies
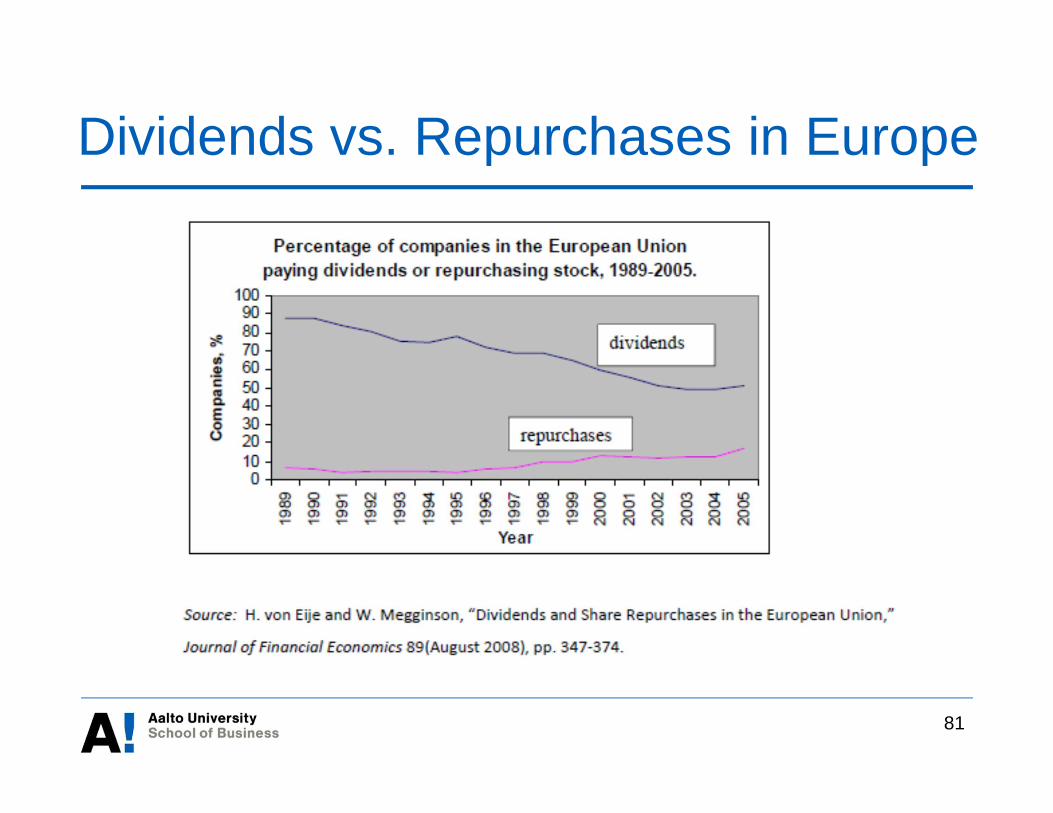
Dividends vs. Repurchases in Europe
81

82
Dividend decision in practice
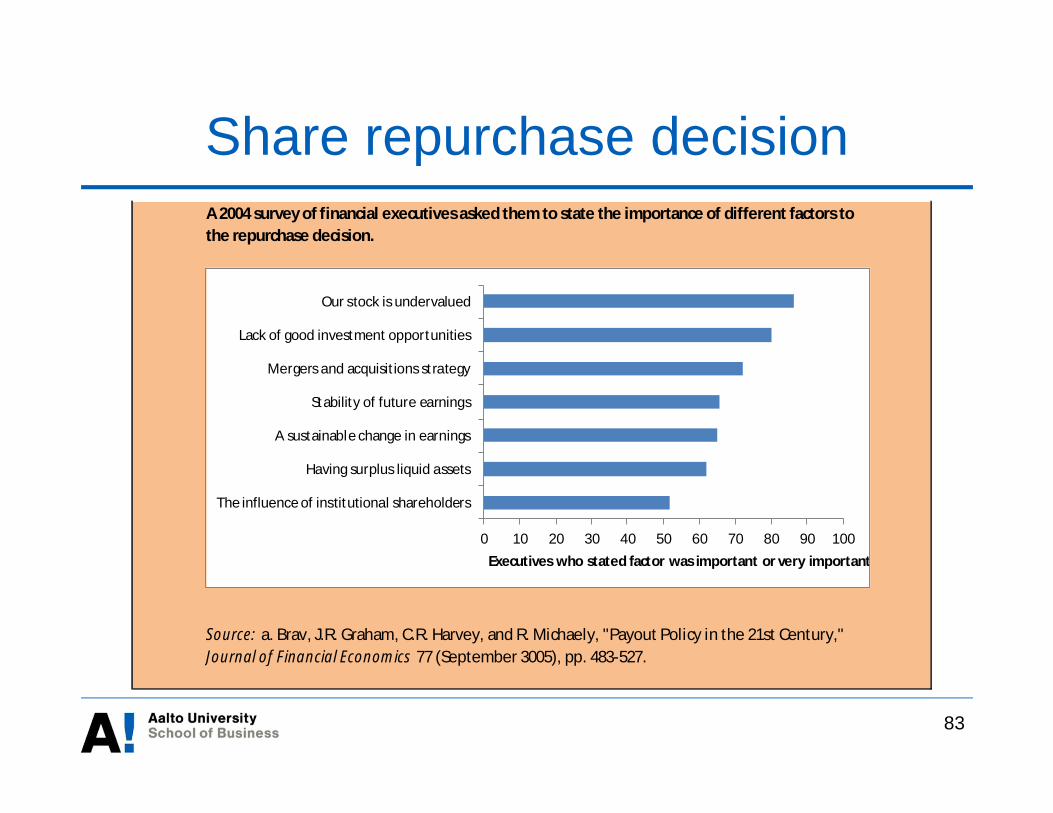
Share repurchase decision
83
A 2004 survey of financial executives asked them to state the importance of different factors tothe repurchase decision.
Source: a. Brav, J.R. Graham, C.R. Harvey, and R. Michaely, "Payout Policy in the 21st Century,"Journal of Financial Economics 77 (September 3005), pp. 483-527.
0 10 20 30 40 50 60 70 80 90 100
The influence of institutional shareholders
Having surplus liquid assets
A sustainable change in earnings
Stability of future earnings
Mergers and acquisitions strategy
Lack of good investment opportunities
Our stock is undervalued
Executives who stated factor was important or very important, %

84
Does payout policy matter?
• Three schools of thought:• “Middle-of-the-roaders”
• Miller and Modigliani (1961)• Payout decision is value-irrelevant and should just be a by-product of
profitability and (positive-NPV) investments, keeping financingpolicy fixed
• “Leftists”• Dividends are wrong because capital gains are historically taxed at
lower rates than dividends
• “Rightists”• Dividends are preferred by certain investors

85
Does payout policy matter?
• Payout decision may be flip side of an investmentdecision or a financing decision• Pay out cash or set it aside for investment• Pay out cash and borrow or use the cash to finance
investments• To understand payout decisions, we must think of them
independently from investment and borrowingdecisions
Miller-Modigliani irrelevancy theorem
86
Dividend irrelevancy theorem• Miller-Modigliani (1961)
• Useful starting point for analysis of dividend policy• Assume:
• No taxes, transaction costs or other imperfections• A fixed capital investment program• A financing policy in which borrowing is set• Remaining needed funds come from retained earnings, and
extra cash is paid as dividends• Capital markets are efficient and transactions take place at fair
prices• No information asymmetry and signaling
87
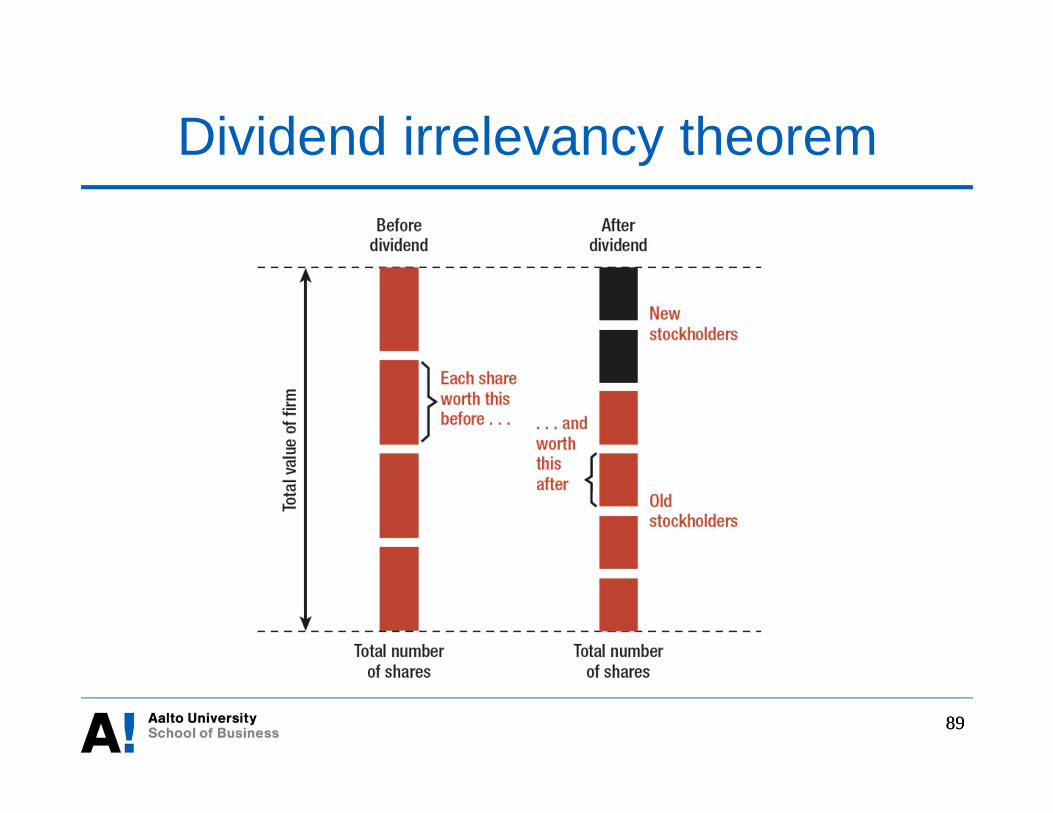
Dividend irrelevancy theorem
• Given the assumptions, if a firm wants to increase itsdividends it needs to finance it with an equity issue• Consequently, each share is worth less because more shares
have to be issued against the firm’s assets• In an efficient market, the decrease in share price is
exactly worth the dividend per shareDividend policy is irrelevant!Firms should let dividends fluctuate as a by-product of theirinvestment and financing decisions
88
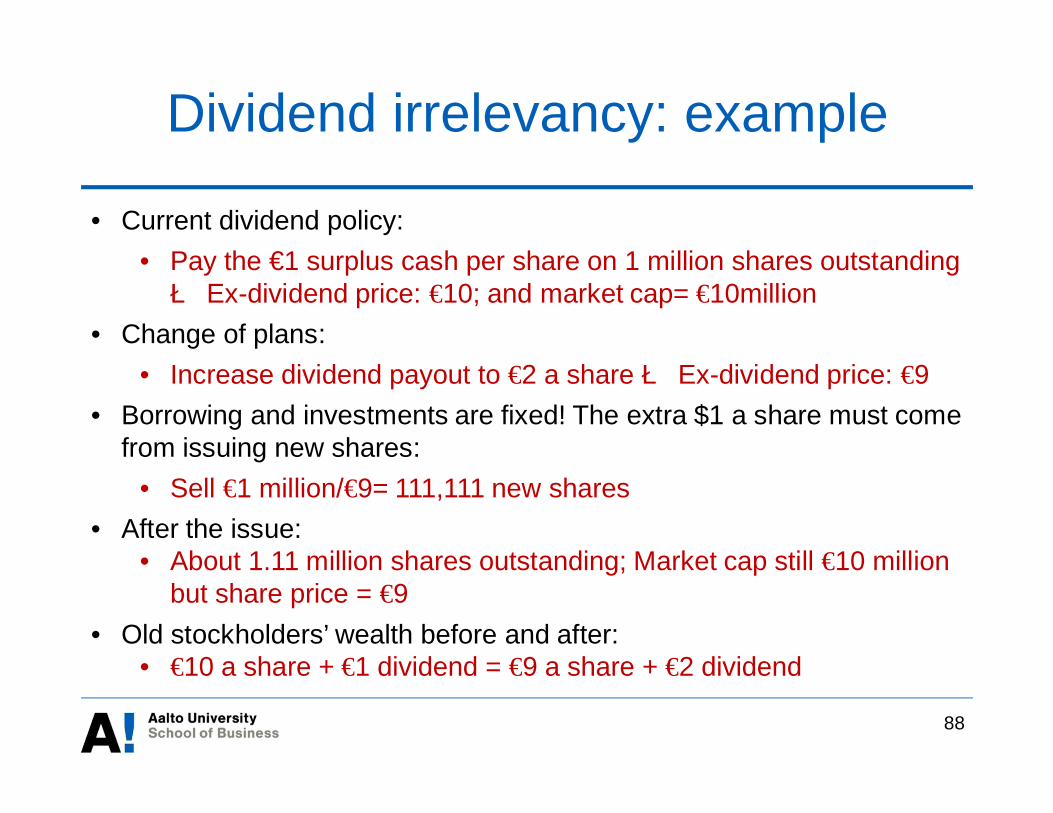
• Current dividend policy:• Pay the €1 surplus cash per share on 1 million shares outstandingè Ex-dividend price: €10; and market cap= €10million
• Change of plans:• Increase dividend payout to €2 a shareè Ex-dividend price: €9
• Borrowing and investments are fixed! The extra $1 a share must comefrom issuing new shares:
• Sell €1 million/€9= 111,111 new shares• After the issue:
• About 1.11 million shares outstanding; Market cap still €10 millionbut share price = €9
• Old stockholders’ wealth before and after:• €10 a share + €1 dividend = €9 a share + €2 dividend
Dividend irrelevancy: example
89
Dividend irrelevancy theorem
89

90
Home-made dividends
• Underlying idea behind dividend irrelevancy theoremcan also be understood by the concept home madedividends• Investors can do or undo at no cost anything the firm can do
• Example• Investors who want more cash income than the company
distributes as dividends can sell some of their shares atmarket pricesInvestors will not be willing to pay anything for somethingthey can do themselves at a zero cost
91
Irrelevancy of repurchases
• Dividend irrelevancy argument also applies to sharerepurchases• In a perfect market, shares will be repurchased at the market
price stock price will not be affected• In the Miller-Modigliani world, dividends and
repurchases can be viewed as substitutes to each other• Only difference between dividends and repurchases
• When paying dividends, the stock price after the dividend paymentwill be less than in the case of repurchase
• This difference will be compensated by the dividend

92
Dividends vs. repurchases: example• Assume: equity: €10 million (1 million shares); no debt;
non-cash assets: €9 million; cash: €1 million• Payout decision 1: Pay dividend of €1 million
• Dividend per share: €1• Stock price on ex-dividend date: (10mn-1mn)/1mn = €9
• Payout decision 2: Repurchase 100,000 shares at €10• Equivalent to the dividend payout• Share price: (€10mn- €1mn)/(1mn-0.1mn) = €10
• Summa summarum for shareholders:• Decision 1: €9+ €1; Decision 2: €10
93
“Middle of the roaders”:Dividends are irrelevant
• A company’s value is not affected by its dividendpolicy• Doesn’t mean payout decisions are random, they should be
based on the life cycle of the firm• Young, growth companies retain and reinvest all earnings to
maximize the cash for investments in positive-NPV projects• Maturing, profitable companies see positive-NPV investments
disappear over time and are left with excess cash that enable largepayouts
• Fixing debt policy, payout decisions are by-product ofinvestments and profitability

94
Life cycle of the firm:Apple’s cash holdings
“They have a ridiculousamount of cash… There is nofeasible acquisition that Applecould do that would need thatmuch cash” Douglas Skinner,Chicago Booth School ofBusiness
“On March 19, 2012, Appleannounced it would pay aquarterly dividend of $2.65per share and spend 10 billionfor share buybacks.”
95
“Right-Wing”:Dividends are valuable
• In practice, firms do not behave as if dividends areirrelevant• E.g., Dividend smoothing
• Natural clientele of investors that prefer regular, stable cashdividends• Legally restricted financial institutions, older individual investors• Does supply of dividend paying firms meet demand? If so, no need
to change dividend policy (middle-of-the-roaders win)• Management can use dividend policy to signal their private
information about the future prospects of the company• Dividend increases send good news about cash flows and earnings• Dividend cuts or omissions send bad news

96
• Most convincing: Commitment to dividends can act asa disciplinary mechanism
• Investors demand high dividends because they do notfully trust the managers with free cash flow
If not paid out, surplus cash can be used for empire-buildingor excessive executive pay and perk consumption (or both)Dividends can also force managers to raise additionalfinancing from capital markets which comes with externalforces of discipline
“Right-Wing”:Dividends are valuable
97
“Left-wing”: Dividends and taxes• If dividends are taxed relatively more than capital
gains (as they are in many countries), companiesshould distribute a relatively smaller fraction of theirprofits as dividends and a relatively larger fraction asrepurchases
• Example: What is the current price of two identicalfirms, except that one pays dividend (firm B) while theother pays no dividend (firm A)?• Suppose that the tax rate on capital gains is zero and the tax
rate on dividends is 30% for all investors• Assume a discount rate of 10% a year
98
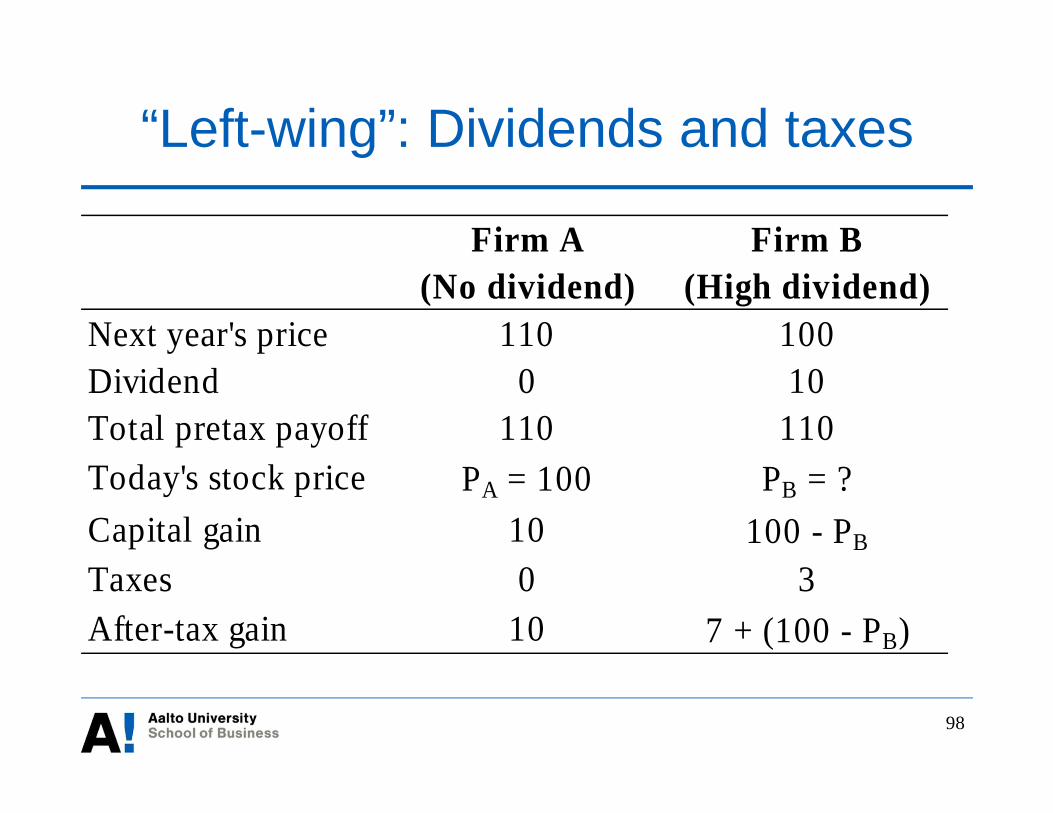
Firm A Firm B(No dividend) (High dividend)
Next year's price 110 100Dividend 0 10Total pretax payoff 110 110Today's stock price PA = 100 PB = ?Capital gain 10 100 - PB
Taxes 0 3After-tax gain 10 7 + (100 - PB)
“Left-wing”: Dividends and taxes

99
• We find the equilibrium level of PB by equating theafter-tax rates of returns on the two firms
10/100 = [7 + (100 - PB)] / PB
PB = 107 / 1.1 = 97.27
• PB is less than PA (= 100)• More generally, whenever the tax rate on dividends is
higher than the tax rate on capital gains, PB would beless than PA
“Left-wing”: Dividends and taxes

100
Postponing capital gains tax
• Unlike dividend tax, capital gains tax can be postponed• Assume: An investor’s stock portfolio includes several
stocks with capital gains and losses on paper• Investor wants to sell stocks with paper gains
• Solution: Sell also stocks with losses on paper• Use realized losses to offset capital gains in personal taxation• Repurchase these stocks (or similar stocks) at a price lower than
original purchase price, possibly after a delay
• In 2004, the Finnish Supreme Administrative Courtdeclined for the first time the tax deduction for such aloss realizing transaction (in an extreme case)
101
Dividends and taxes in Finland• In Finland, corporate taxation is linked to financial
reporting• Corporate tax is paid from reported earnings before tax• In practice, companies can delay paying corporate taxes by
managing earnings downward, BUT• Companies cannot pay dividends without reporting profits
• Current corporate tax rate in Finland is 20%• Capital income – interest income, capital gains, and
dividends – is taxed using a 30% rate (32% for incomeabove €40,000)• However, only 85% of dividend income from publicly listed
companies is considered taxable in personal taxation• Some investor categories, such as foundations and pension funds,
are not subject to taxation

102
Dividends and taxes in Finland
• Both capital gains and dividends are double taxed• First at the company level at the corporate tax rate• Second at the investor level at the capital income tax rate
• Foreign investors are subject to the tax laws of theirhome country

103
Empirical evidence
• The empirical evidence of which of these views(leftist, rightist, or middle-of-the-roader) is mostcorrect seems ambiguous There is some truth to all

104
Lecture 4
IPOsGuest lecturer: Antti Niini

105
Lecture 5
Capital structure and valuation –Part 1

Overview – Part 1
• Irrelevance of capital structure• Modigliani and Miller (1958) Proposition 1: Value of a
business is independent of its financing decisions• How leverage affects returns
• Higher expected return to shareholders• How leverage affects risk
• Higher risk faced by shareholders• Financial innovation
• Angel or evil?
106
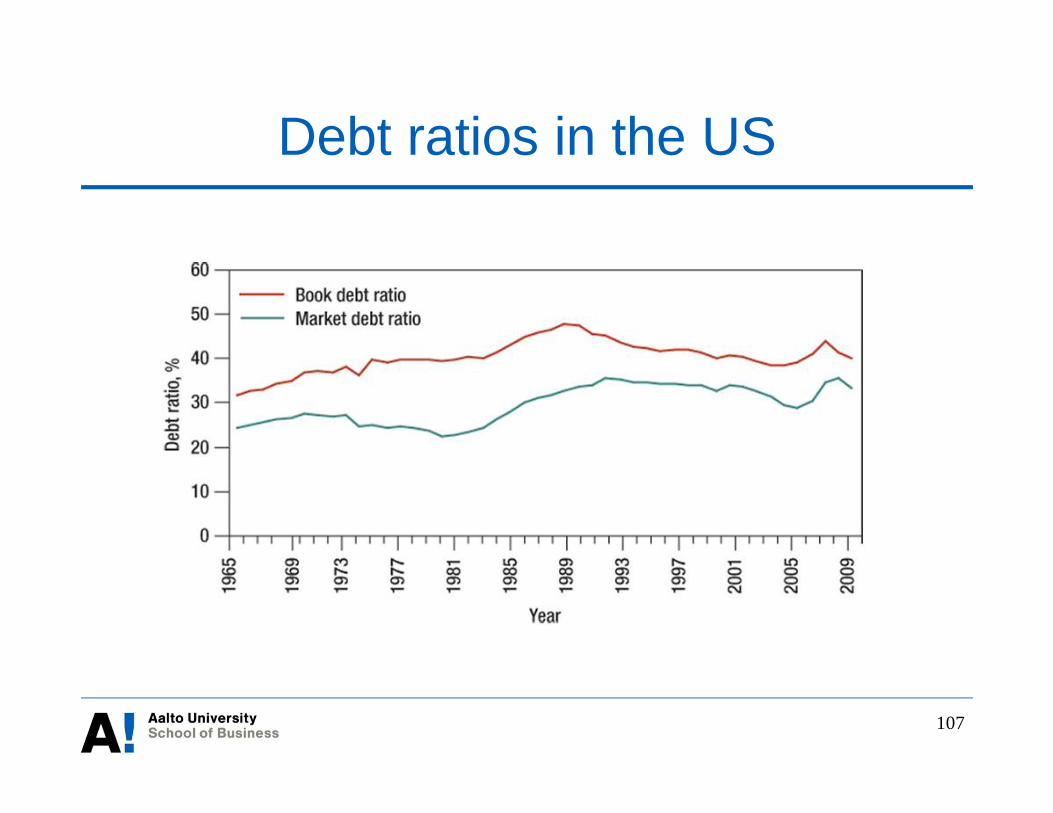
107
Debt ratios in the US

Average Debt Ratios in Europe
108
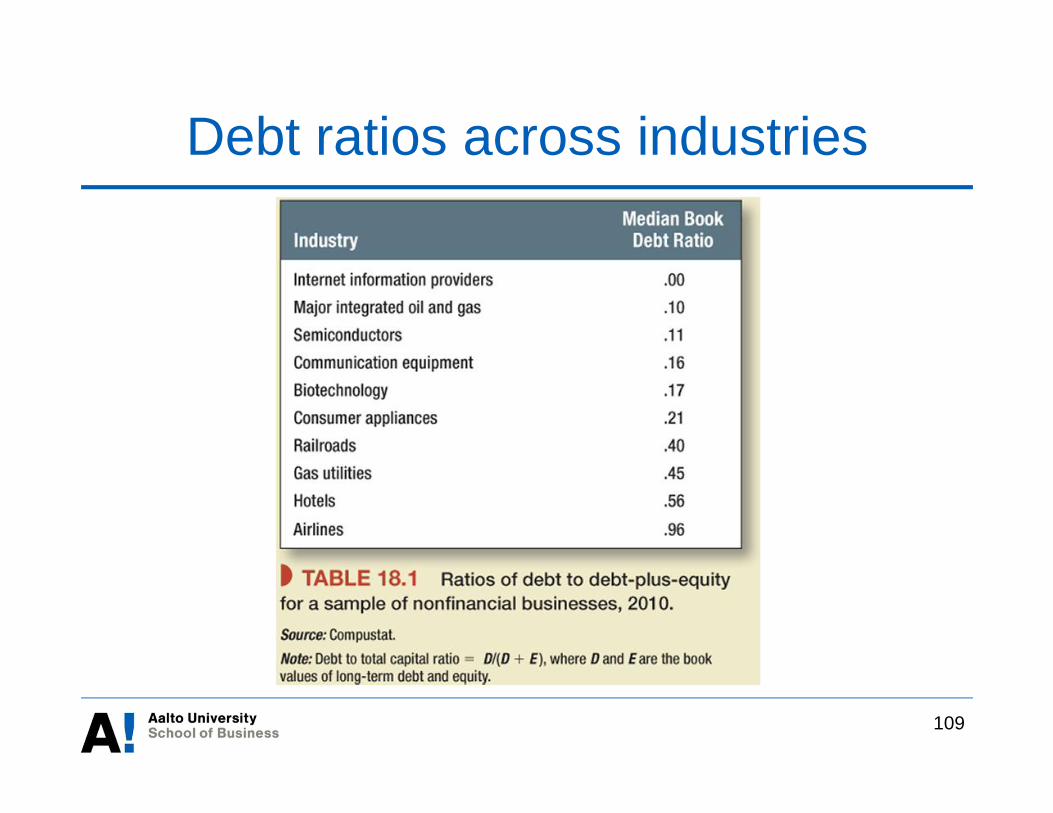
Debt ratios across industries
109
110
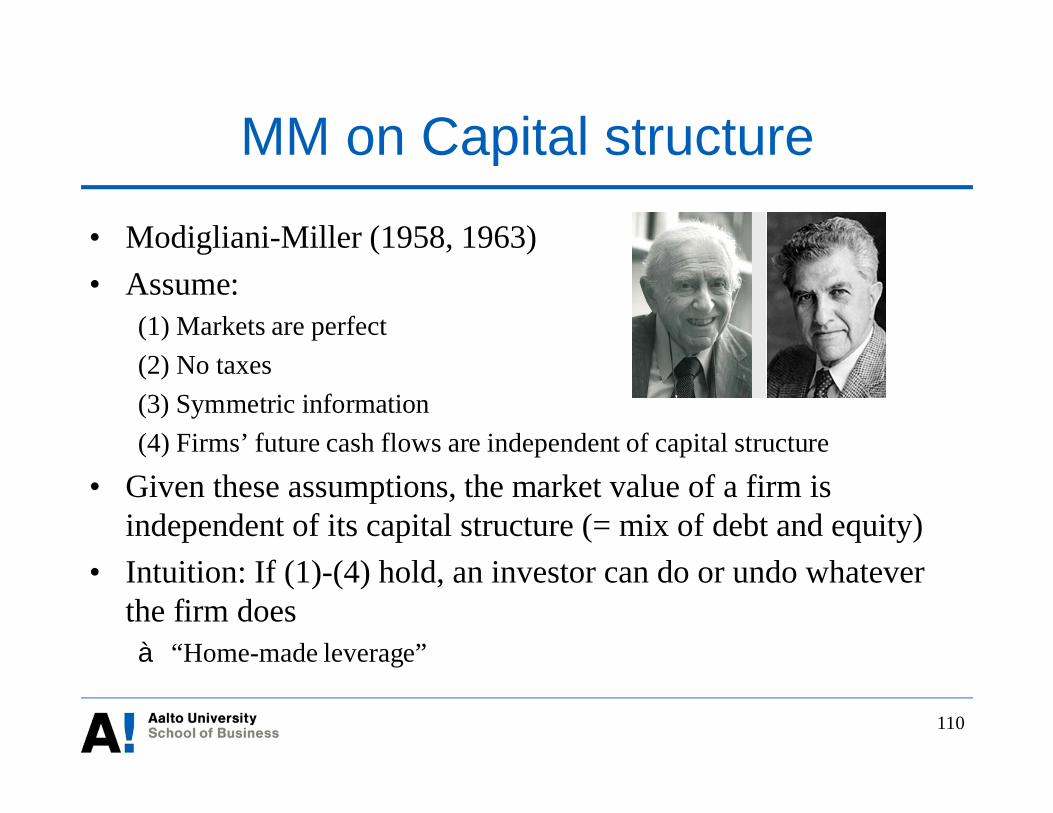
MM on Capital structure
• Modigliani-Miller (1958, 1963)• Assume:
(1) Markets are perfect(2) No taxes(3) Symmetric information(4) Firms’ future cash flows are independent of capital structure
• Given these assumptions, the market value of a firm isindependent of its capital structure (= mix of debt and equity)
• Intuition: If (1)-(4) hold, an investor can do or undo whateverthe firm doesà “Home-made leverage”
111
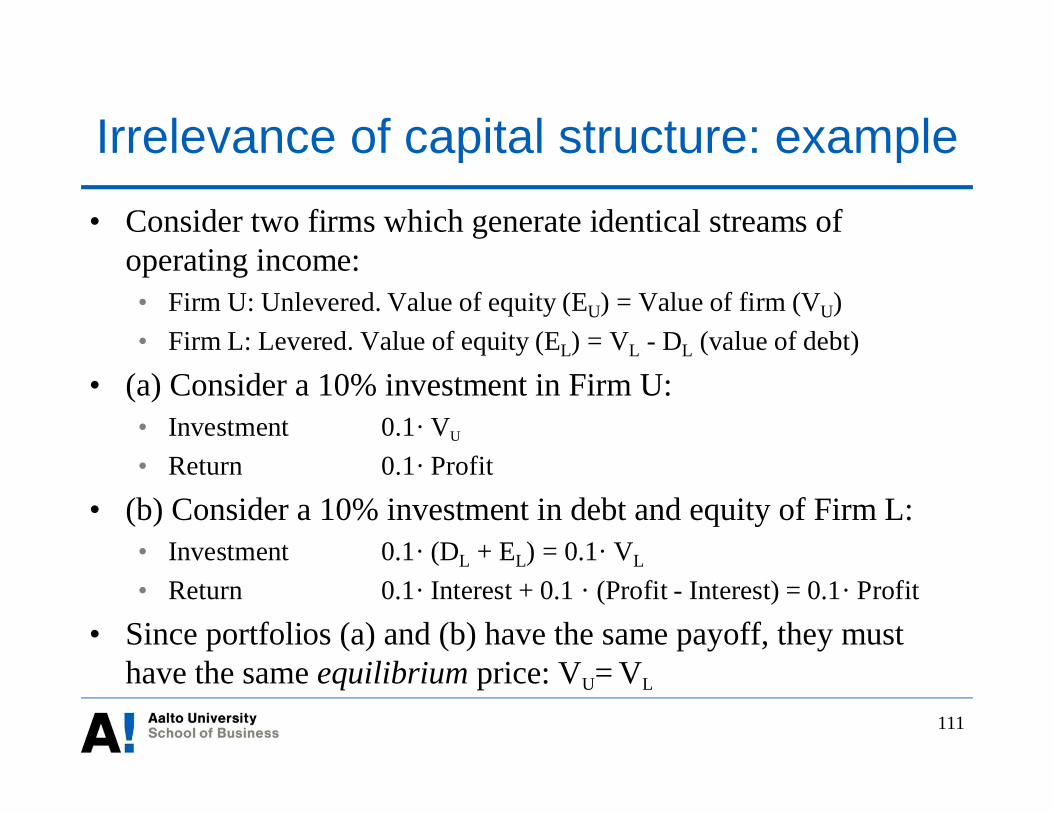
Irrelevance of capital structure: example• Consider two firms which generate identical streams of
operating income:• Firm U: Unlevered. Value of equity (EU) = Value of firm (VU)• Firm L: Levered. Value of equity (EL) = VL - DL (value of debt)
• (a) Consider a 10% investment in Firm U:• Investment 0.1· VU
• Return 0.1· Profit
• (b) Consider a 10% investment in debt and equity of Firm L:• Investment 0.1· (DL + EL) = 0.1· VL
• Return 0.1· Interest + 0.1 · (Profit - Interest) = 0.1· Profit
• Since portfolios (a) and (b) have the same payoff, they musthave the same equilibrium price: VU= VL

112
Irrelevance of capital structure: example
• Example continues:• (a) Consider a 10% investment in Firm L’s equity:
• Investment 0.1· EL = 0.1· (VL - DL)• Return 0.1· (Profit - Interest)
• (b) Borrow 10% of DL and purchase 10% of Firm U:• Investment 0.1· VU - 0.1· DL
• Return 0.1· Profit - 0.1 · Interest = 0.1 · (Profit - Interest)
• Again (a) and (b) have the same payoff and must have the sameprice: VU= VL
• Here (b) is an example of “home-made leverage”

113
How leverage affects returns: example
• Assume an unlevered firm with:• 1000 shares outstanding• Price $10 per share• Expected earnings $1500 per year, to be paid out as
dividends• Expected return:
• $1.50 per share / $10 per share = 15%• Now, suppose that:
• The firm issues $5000 worth of debt at 10% interest• Uses the proceeds to buy back 500 shares
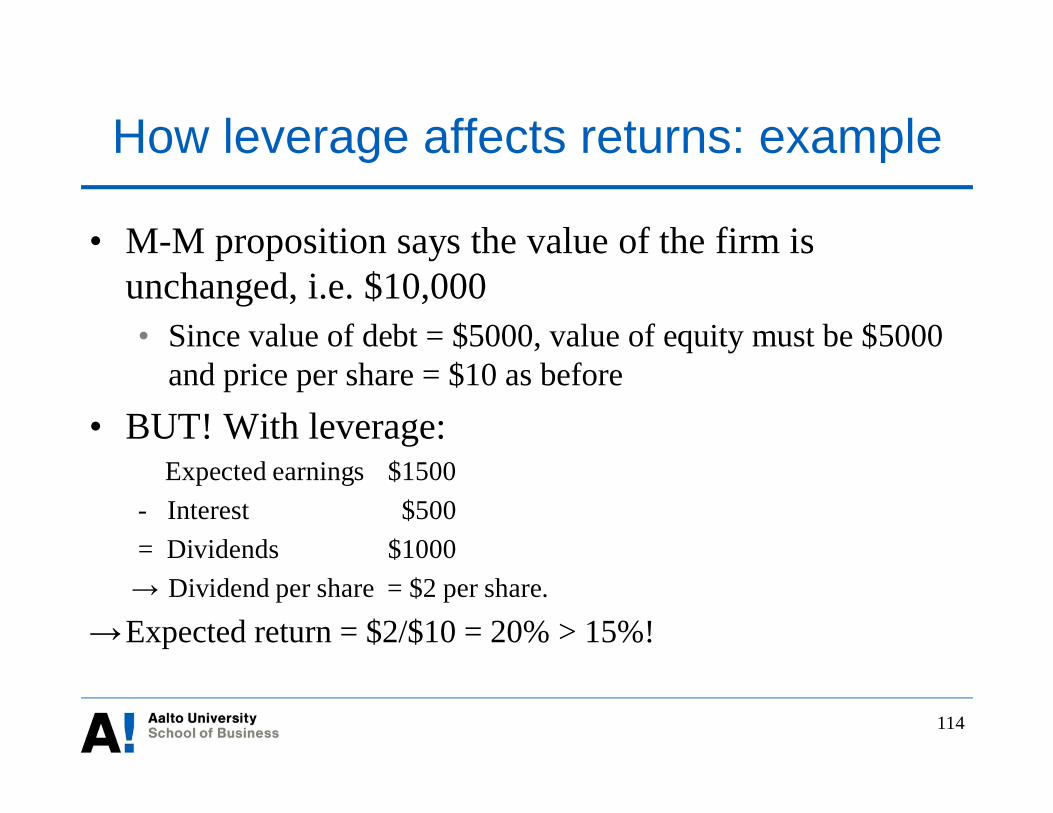
114
How leverage affects returns: example
• M-M proposition says the value of the firm isunchanged, i.e. $10,000• Since value of debt = $5000, value of equity must be $5000
and price per share = $10 as before• BUT! With leverage:
Expected earnings $1500- Interest $500= Dividends $1000
Dividend per share = $2 per share.
Expected return = $2/$10 = 20% > 15%!

115
Earnings and return: all equity financing

116
Earnings and return: 50% debt financing

117
Borrowing and EPS
118
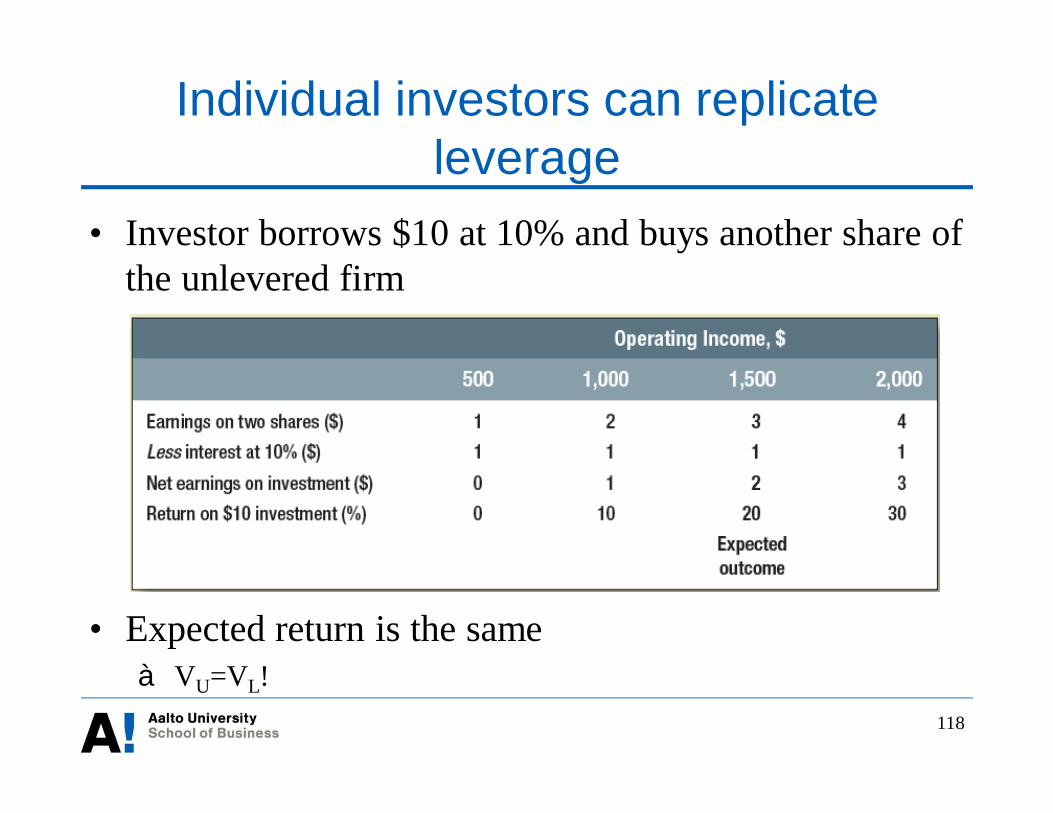
Individual investors can replicateleverage
• Investor borrows $10 at 10% and buys another share ofthe unlevered firm
• Expected return is the sameà VU=VL!
119
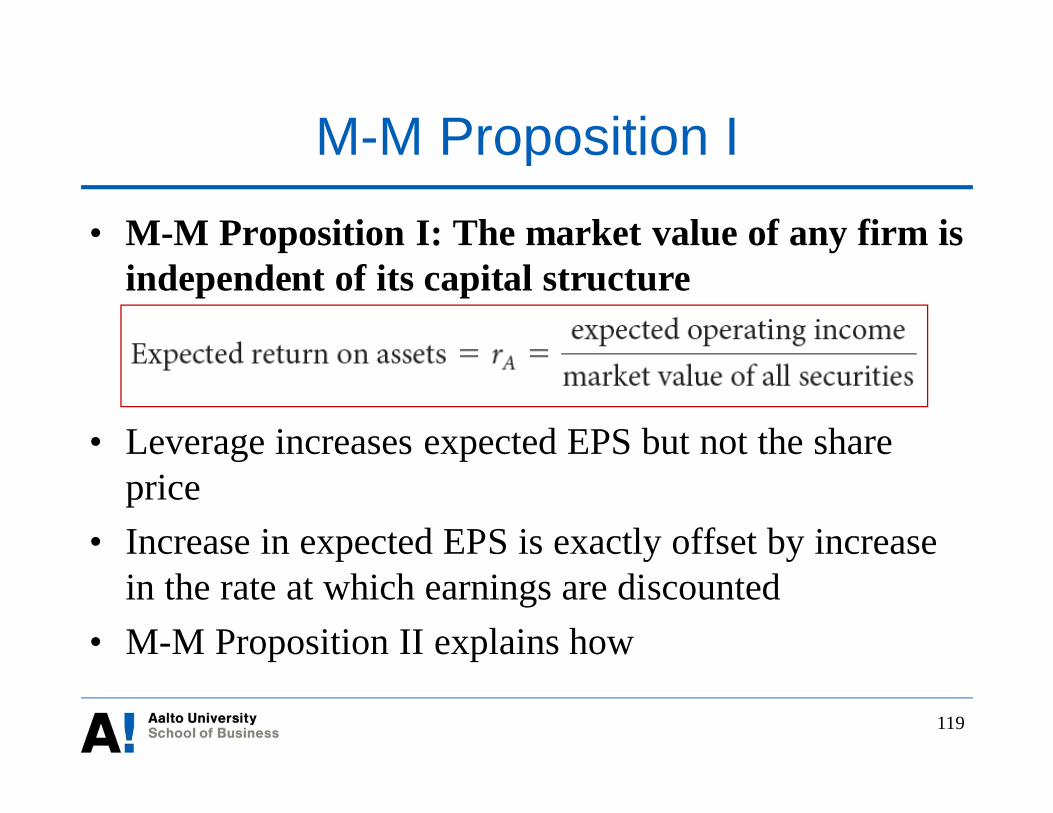
M-M Proposition I
• M-M Proposition I: The market value of any firm isindependent of its capital structure
• Leverage increases expected EPS but not the shareprice
• Increase in expected EPS is exactly offset by increasein the rate at which earnings are discounted
• M-M Proposition II explains how

120
How leverage affects returns
• No-tax weighted average cost of capital (rA, WACC) isas follows:
• where rD and rE refer to cost of debt and equity,respectively
,EDA rED
ErED
DrWACC+
++
==

121
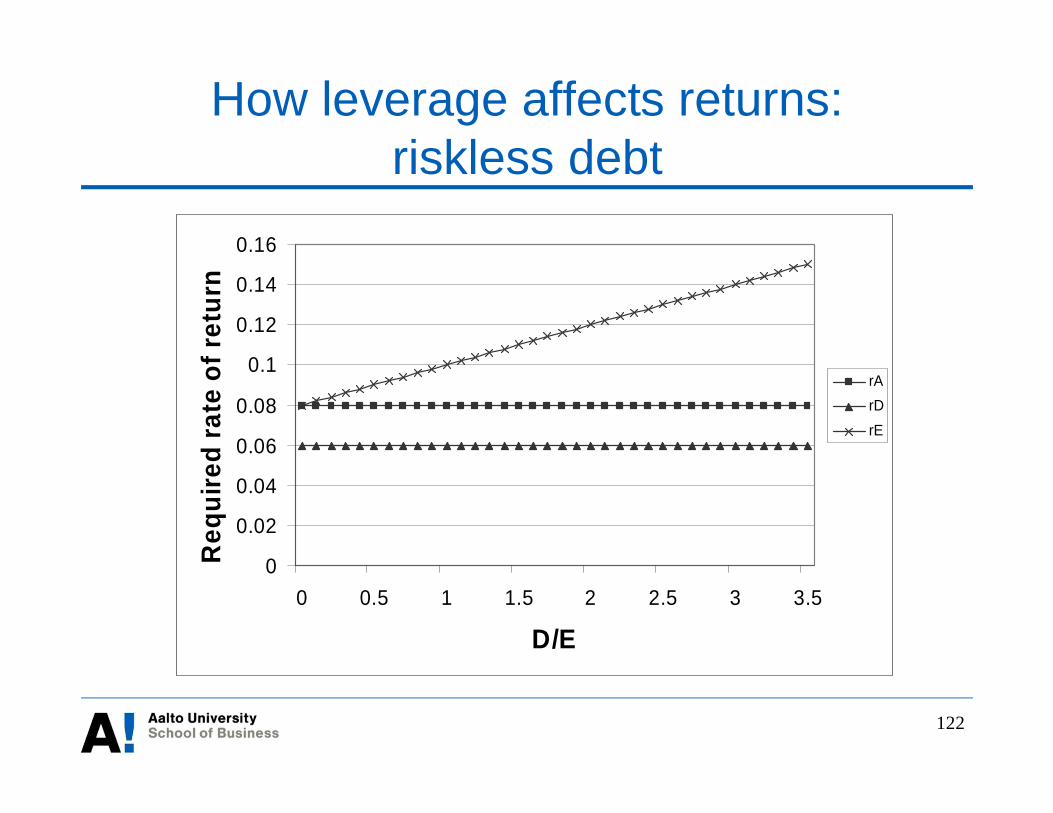
How leverage affects returns• Re-arranging the equation yields:
As D/E increases, rE increases• Why? What happens to risk of shareholders?
• where ßA, ßD, and ßE refer to the betas of the firm’s assets,debt, and equity, respectively
).( DAAE rrEDrr -+=
EDA EDE
EDD bbb
++
+=
122
How leverage affects returns:riskless debt
0
0.02
0.04
0.06
0.08
0.1
0.12
0.14
0.16
0 0.5 1 1.5 2 2.5 3 3.5
D/E
Req
uire
dra
teof
retu
rn
rArDrE
123
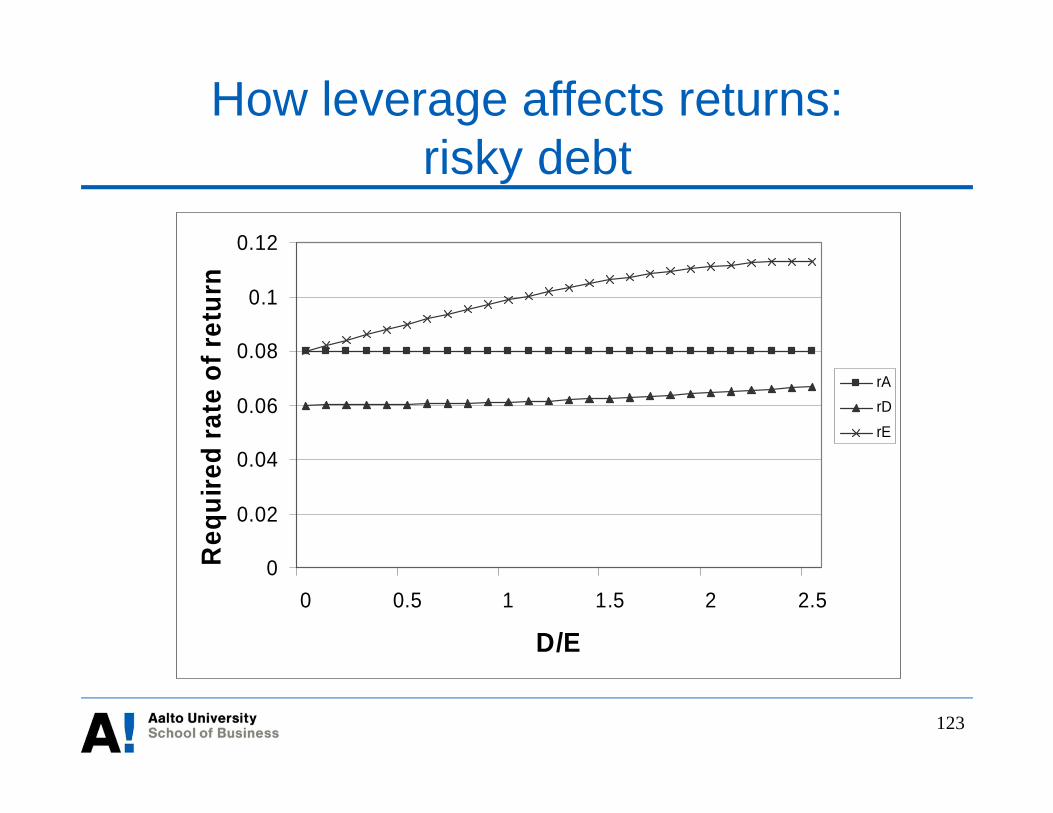
How leverage affects returns:risky debt
0
0.02
0.04
0.06
0.08
0.1
0.12
0 0.5 1 1.5 2 2.5
D/E
Req
uire
dra
teof
retu
rn
rArDrE

124
How leverage affects returns
• Rearranging yields
As D/E increases, ßE increasesRaising D/E is analogous to borrowing to buy thestock
• Q: Why does the expected return on equity go up from15% to 20%?• A: Because the stock is more risky
).( DAAE ED bbbb -+=
125
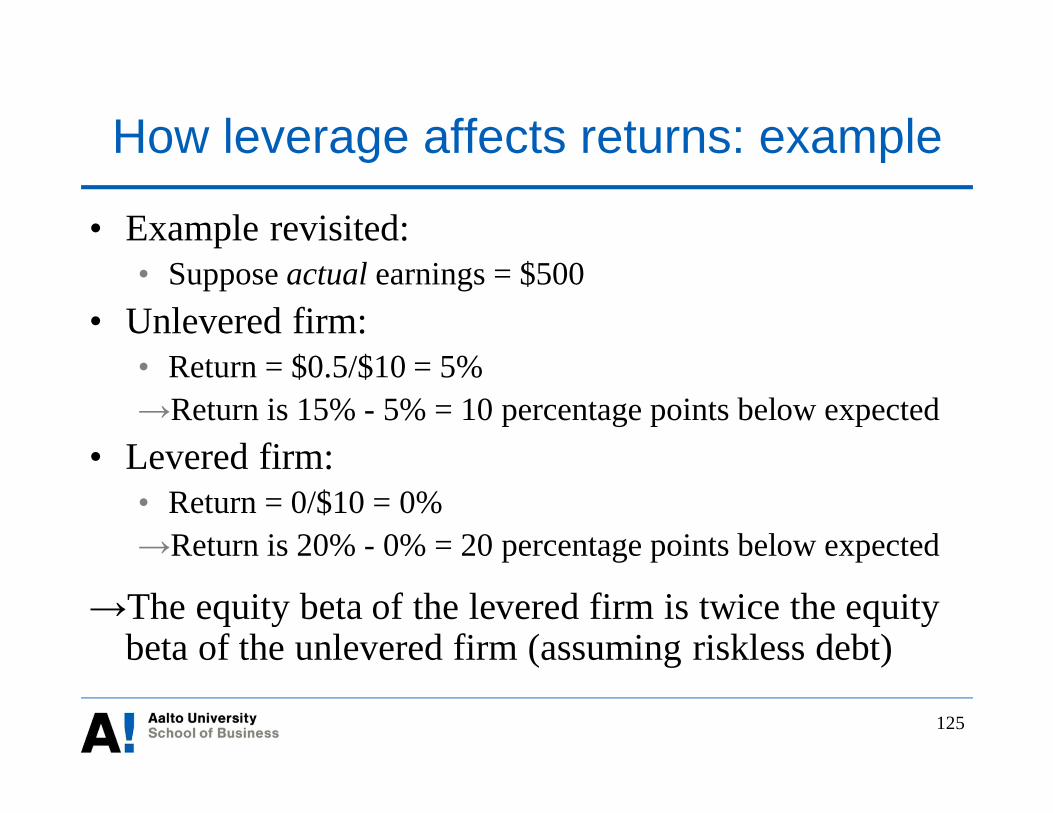
How leverage affects returns: example
• Example revisited:• Suppose actual earnings = $500
• Unlevered firm:• Return = $0.5/$10 = 5%
Return is 15% - 5% = 10 percentage points below expected• Levered firm:
• Return = 0/$10 = 0%Return is 20% - 0% = 20 percentage points below expected
The equity beta of the levered firm is twice the equitybeta of the unlevered firm (assuming riskless debt)

126
How leverage affects risk
0
0.5
1
1.5
2
2.5
3
0 0.5 1 1.5 2 2.5 3 3.5
D/E
Bet
a BetaABetaDBetaE
127
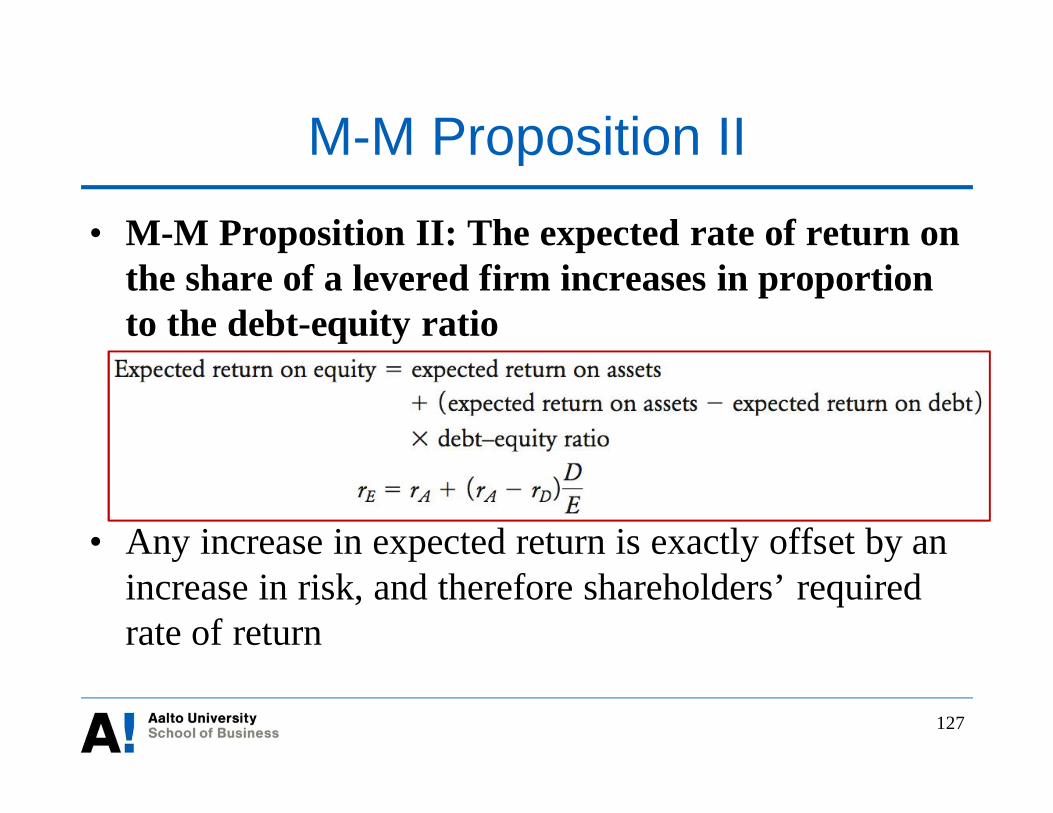
M-M Proposition II
• M-M Proposition II: The expected rate of return onthe share of a levered firm increases in proportionto the debt-equity ratio
• Any increase in expected return is exactly offset by anincrease in risk, and therefore shareholders’ requiredrate of return
128
Financial innovation
• Important implication of the irrelevancy theorem isthat innovations creating exotic financial products donot add value• This is not true if the assumptions of the model do not hold
Financial innovations are likely to be successful onlyif they take advantage of the loopholes in the model
129
Financial innovation
• Qualities that can make financial innovations beneficialfor investors and perhaps the whole economy:• Reduction of transaction costs• Improvement in liquidity• Reallocation of risk• Reduction of taxes• Circumvention of regulation• Reduction of agency costs that arise from conflicts of interest
between different stakeholders

Example: The case of Kinder Morgan“…Kinder Morgan has created value ($12 billion) from nothing… Of course, it did this by reversingfinancial engineering, which is a bit of an embarrassment, but a contingent one. If financialengineering can have negative value then it can have positive value too. Some ways of slicing upcash flows seem to be more valuable than others, so it can be worth billions of dollars to find justthe right way to slice up your cash flows. If you're a skeptic of financial engineering this shouldtrouble you, even though Kinder Morgan is scrapping its particular flavor of financial engineeringas over-complicated and unworkable.”
“Now, there are explanations of where Kinder Morgan found all this value, but they mostly won't bethat satisfying for skeptics... (rules out other explanations)… But there's one other place to look forvalue. If you see a piece of financial engineering that makes everyone involved better off, then areasonable guess is that it makes somebody who's not involved worse off. There are various possibleuninvolved parties, but none is more popular with financial engineers than the IRS. If you canshuffle some papers in a way that saves money on taxes, why wouldn't you?”
“… But mostly it seems to have created some value from the usual place: by reducing its tax bill.And no one doubts that financial engineering is good for that…”
Source: http://www.bloombergview.com/articles/2014-08-11/pipeline-giant-reverse-engineers-itself-12-billion
130
Financial Innovation: Word of caution• Not enough studies on causes and consequences of financial
innovation• Challenges laid out by Lerner and Tufano (2011)
• Financial crisis in 2007-2009• Volcker: ”I wish someone would give me one shred of neutral evidence that financial
innovation has led to economic growth”• Stiglitz: ” Regrettably, many of the worst elements of the US financial system - toxic
mortgages and the practices that led to them - were exported to the rest of the world…It was all done in the name of innovation, and any regulatory initiative was fought awaywith claims that it would suppress that innovation. They were innovating, all right, butnot in ways that made the economy stronger. Some of America's best and brightest weredevoting their talents to getting around standards and regulations designed to ensurethe efficiency of the economy and the safety of the banking system. Unfortunately, theywere far too successful, and we are all - homeowners, workers, investors, taxpayers -paying the price.”.
131
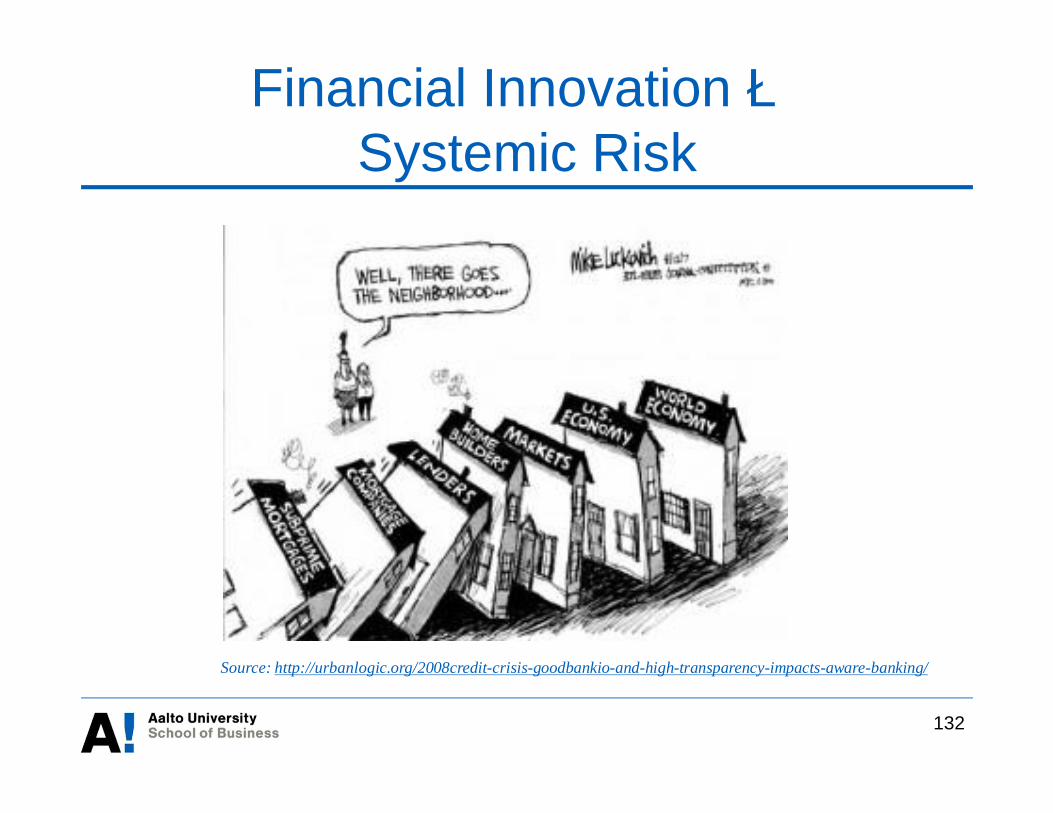
Financial InnovationèSystemic Risk
132
Source: http://urbanlogic.org/2008credit-crisis-goodbankio-and-high-transparency-impacts-aware-banking/
133
Lecture 6
Capital structure and valuation –Part 2

134
Overview• Capital structure theory
• Trade-off theory• Tax benefit of debt• Disciplinary benefit of debt• Financial distress costs• Agency costs of debt
• Pecking order theory• Debt policy in practice• Valuation
• Adjusted discount rate method• Adjusted present value method

0% 5% 10% 15% 20% 25% 30% 35% 40% 45%
Ireland
Finland
United Kingdom
Estonia
Switzerland
Sweden
Germany
France
United States
Tax rate, %
135
Corporate income tax rates around theworld
Source: OECD

136
Corporate taxes and capital structure:example
Unlevered LeveredEBIT 1000 1000Interest (5% on 1000) 0 50EBT 1000 950Corporate tax (20%) 200 190CF to shareholders 800 760CF to debt holders 0 50
CF to share- and debt-holders 800 810Interest tax shield(= 20% x Interest) 0 10
137
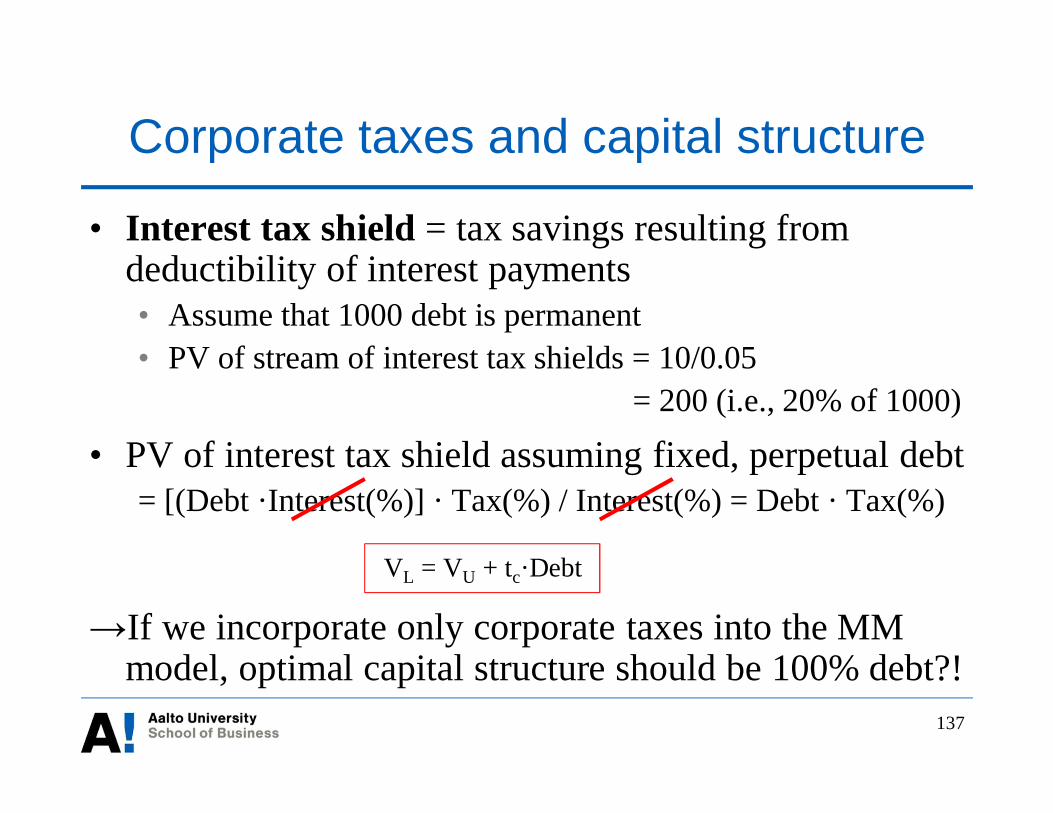
Corporate taxes and capital structure
• Interest tax shield = tax savings resulting fromdeductibility of interest payments• Assume that 1000 debt is permanent• PV of stream of interest tax shields = 10/0.05
= 200 (i.e., 20% of 1000)
• PV of interest tax shield assuming fixed, perpetual debt= [(Debt ·Interest(%)] · Tax(%) / Interest(%) = Debt · Tax(%)
VL = VU + tc·Debt
If we incorporate only corporate taxes into the MMmodel, optimal capital structure should be 100% debt?!

138
Corporate and personal taxes andcapital structure: example
Unlevered LeveredEBIT 1000 1000Interest (5% on 1000) 0 50EBT 1000 950Corporate tax (20%) 200 190CF to shareholders before personal taxes 800 760CF to shareholders after personal taxes (30%) 560 532CF to debt holders before personal taxes 0 50CF to debt holders after personal taxes (30%) 0 35
CF to share- and debt-holders after personal taxes 560 567Value of tax shield 0 7
139
Corporate and personal taxes andcapital structure
140
Relative advantage formula
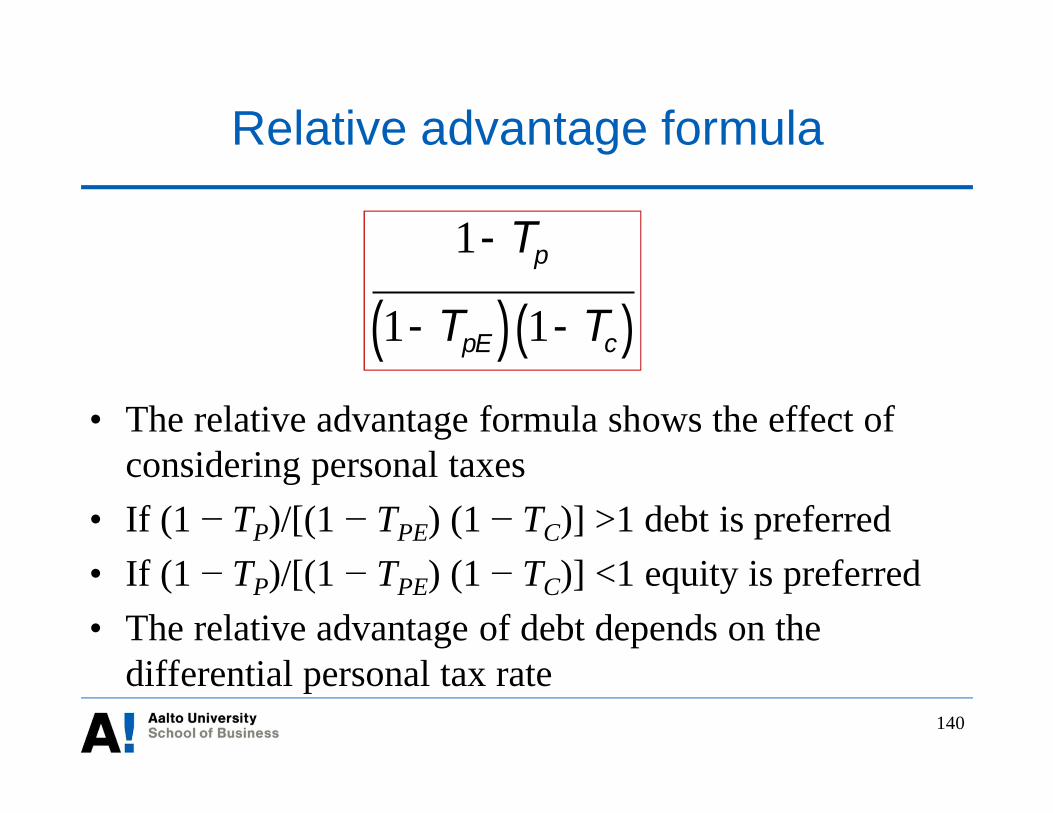
• The relative advantage formula shows the effect ofconsidering personal taxes
• If (1 TP)/[(1 TPE) (1 TC)] >1 debt is preferred• If (1 TP)/[(1 TPE) (1 TC)] <1 equity is preferred• The relative advantage of debt depends on the
differential personal tax rate
1-Tp
1-TpE( ) 1-Tc( )

141
Corporate and personal taxes andcapital structure
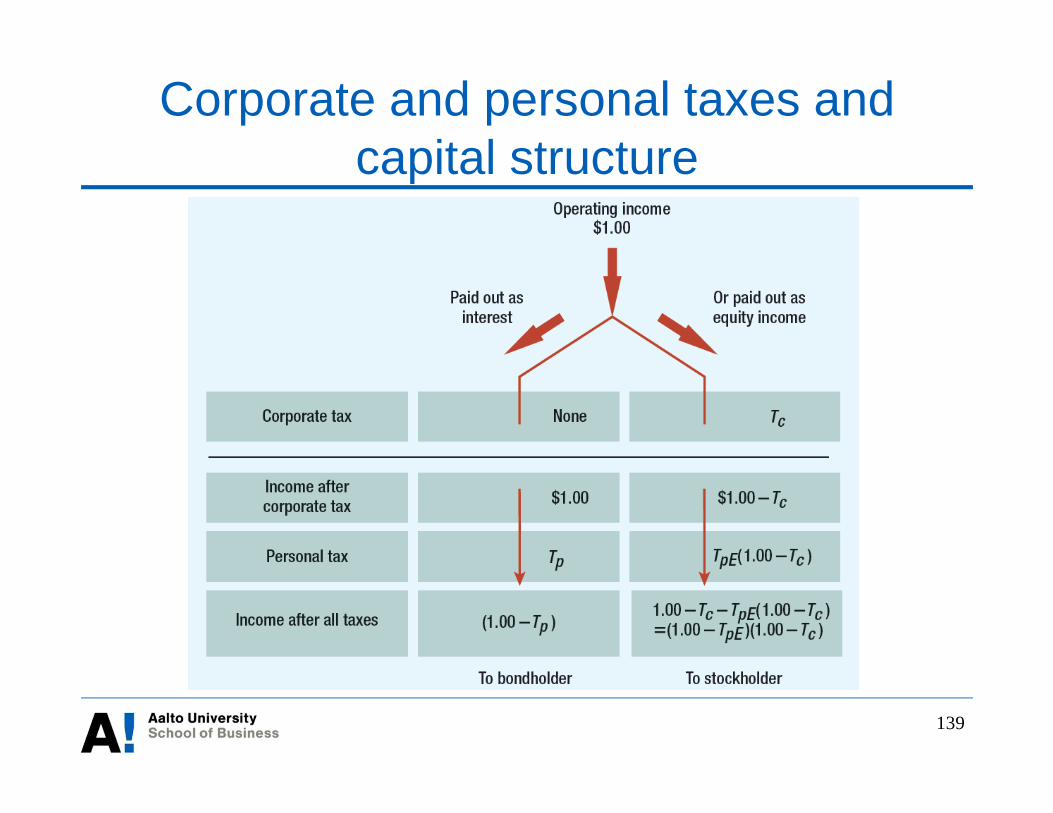
• Unlevered firm:• Cash flow = CFU= EBIT (1-Tc)(1-Tpe)
• Levered firm:• CFL= (EBIT-rDD)(1-Tc)(1-Tpe)+rDD(1- Tpi)
= EBIT (1-Tc)(1-Tpe) + [(1-Tpi)-(1-Tc)(1- Tpe)]rDD
= Cash flow of unlevered firm + Net Tax Effect of Debt• If (1-Tpi) = (1-Tc)(1-Tpe)
• CFU = CFL and capital structure does not matter• If (1-Tpi) > (1-Tc)(1- Tpe)
• Leverage increases the value of the firm
142
Leverage clientelesand optimal capital structure
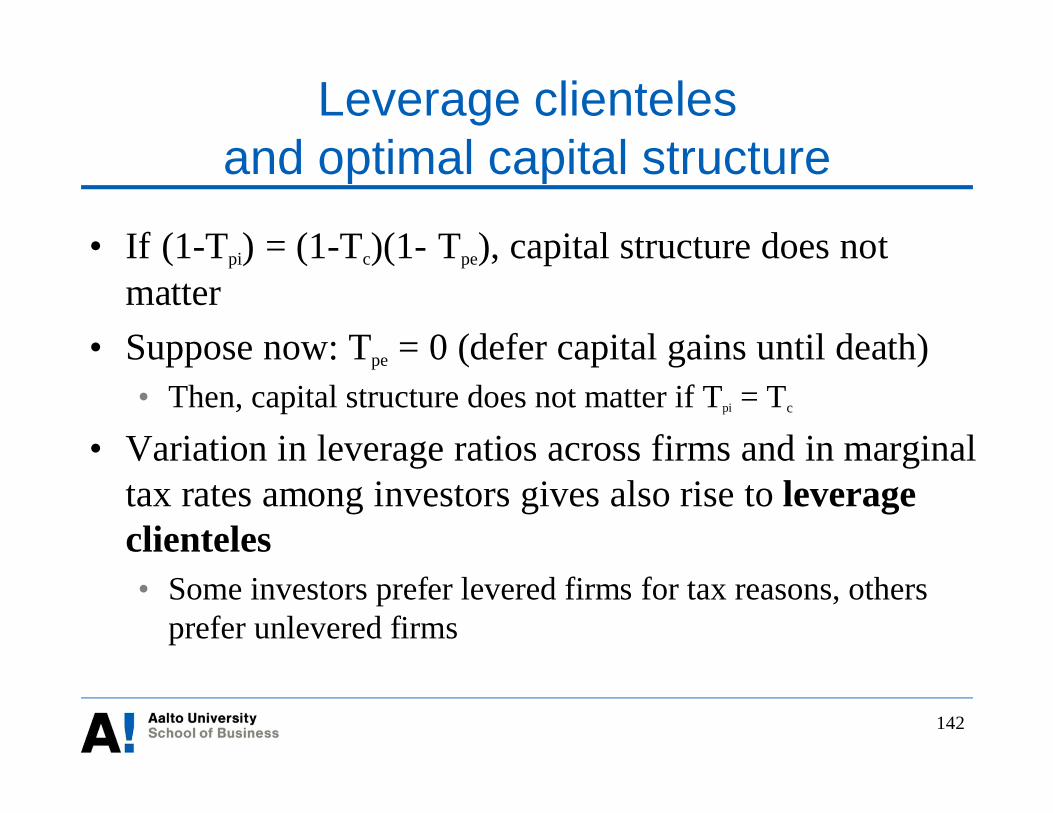
• If (1-Tpi) = (1-Tc)(1- Tpe), capital structure does notmatter
• Suppose now: Tpe = 0 (defer capital gains until death)• Then, capital structure does not matter if Tpi = Tc
• Variation in leverage ratios across firms and in marginaltax rates among investors gives also rise to leverageclienteles• Some investors prefer levered firms for tax reasons, others
prefer unlevered firms

Debt as a disciplining mechanism• Recall: High payout ratio is demanded by investors if
the firm has the free cash flow problem (i.e., cash inexcess of valuable investments and debt repayments)• Dividends are sticky but not guaranteed. Repurchases can be
avoided at no cost.• Managers (and employees) sitting on ample cash have the
temptation to be sloppy, be too generous to themselves incompensation and perks, and make ill-advised investments…
• Higher debt ratio can fix the problem• Unlike dividends, debt repayments are obligatory• Greater monitoring and scrutiny by creditors
143
144
Costs of Debt: Financial distress
• Firms with high debt ratios face the likelihood offinancial distress and even bankruptcy
• Experienced when debt repayments are covered withdifficulty or cannot be coveredExpected Cost of F.D.= Probability of F.D. x Costs of F.D.
• At small debt levels financial distress is unlikely takingon extra debt is not too costly
• At high debt levels taking on extra debt can be very costlydue to increased likelihood of financial distress

145
Costs of financial distress: examples
• Costs of financial distress without bankruptcy• Damage to customer & supplier relations and talent retention• Agency costs /conflict of interests between borrowers and
creditors• e.g., Risk shifting, refusing to contribute new equity capital• Credit rationing and debt covenants
• Costs of financial distress with bankruptcy• Direct costs
• Legal and administrative costs
• Indirect costs• Management of bankrupt firm
146
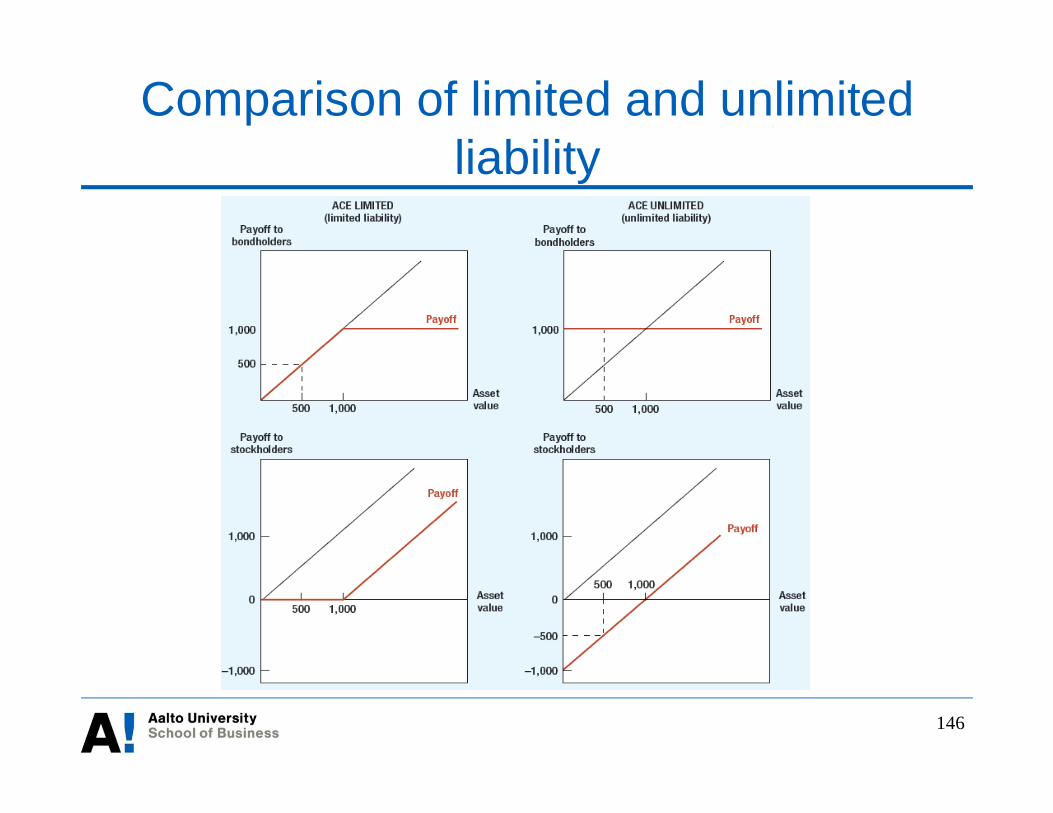
Comparison of limited and unlimitedliability

147
Payoff to security holders of a limitedliability company
148
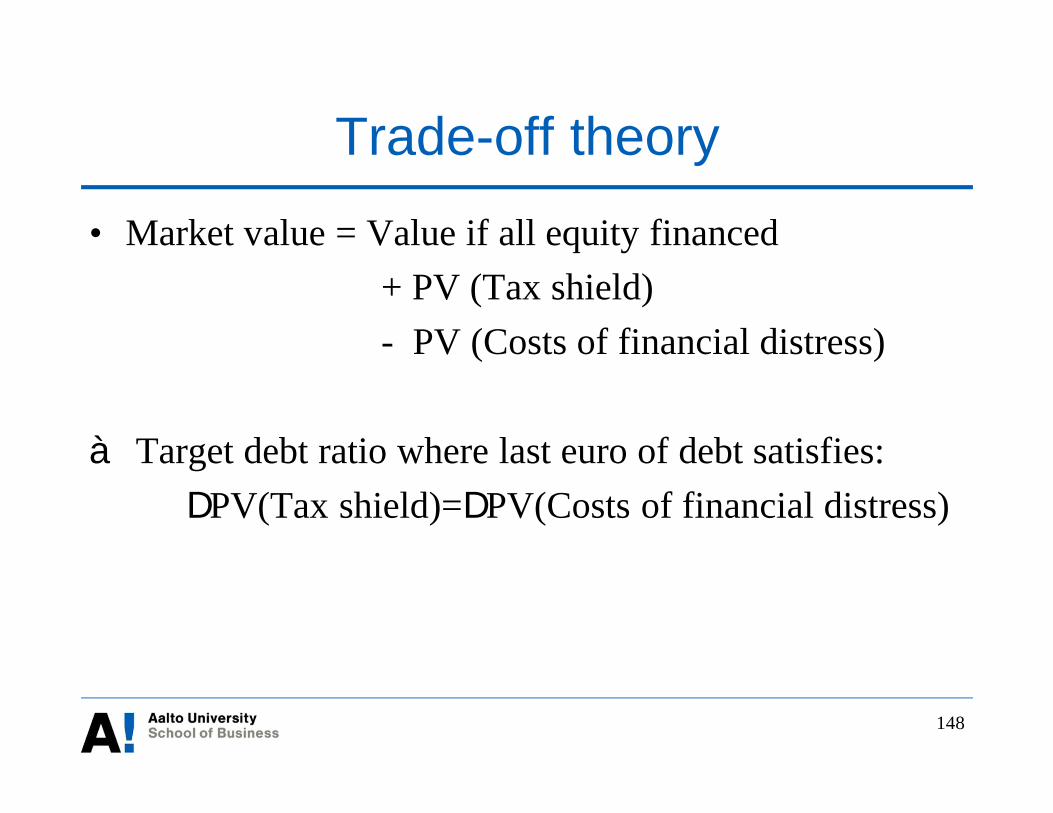
Trade-off theory
• Market value = Value if all equity financed+ PV (Tax shield)- PV (Costs of financial distress)
à Target debt ratio where last euro of debt satisfies:DPV(Tax shield)=DPV(Costs of financial distress)

149
Trade-off theory
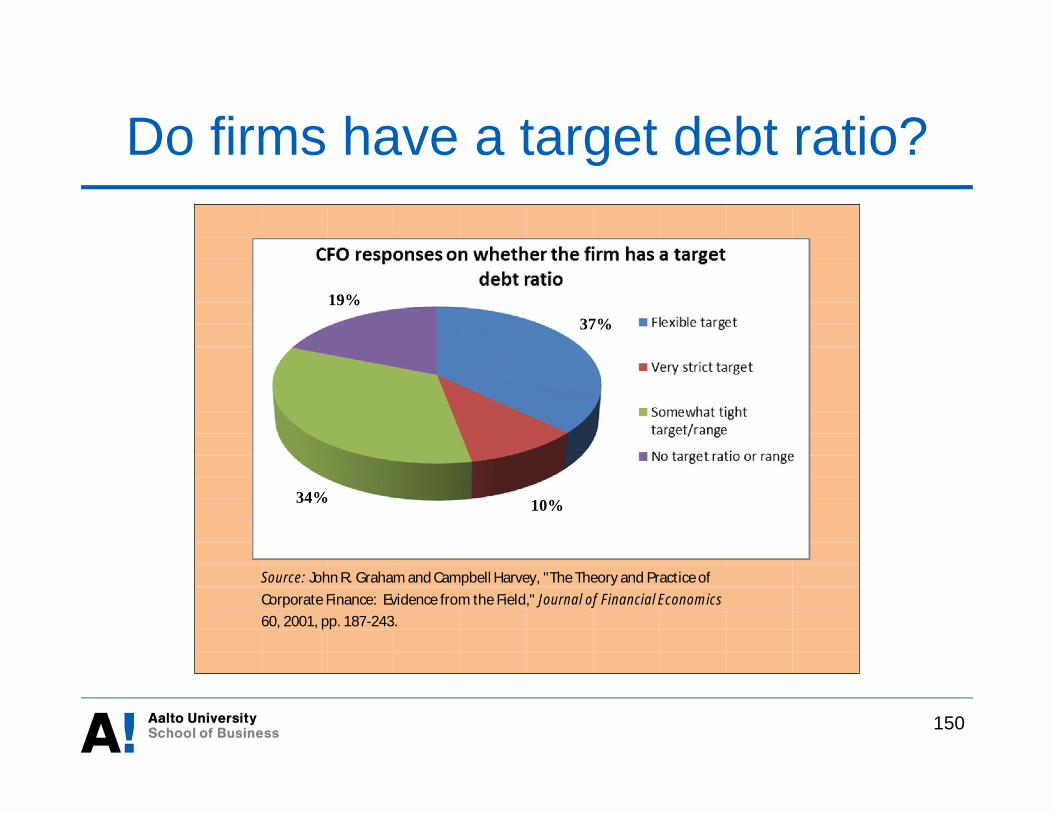
Do firms have a target debt ratio?
150
Source: John R. Graham and Campbell Harvey, "The Theory and Practice ofCorporate Finance: Evidence from the Field," Journal of Financial Economics60, 2001, pp. 187-243.
37%
34% 10%
19%

Trade-off theory: Empirical Evidence• Explains, for example:
• Why high-tech, growth companies use little debt• Why larger firms and firms with tangible assets use more debt• Firms with long-lasting relationships with customers/suppliers use less
debt
• Cannot explain:• Why highly profitable companies use little or no debt (e.g., Apple,
Microsoft, Johnson and Johnson etc.)– Graham (2000): Average tax-paying firm can add 7.5% to firm value
by increasing leverage moderately• Why interest tax shields do not add to firm value (Fama and French, 1998)• Large and permanent variations within industries• Variations across time and countries
151
152
Pecking order theory: motivation• Starts with asymmetric information• Press releases of two seemingly identical companies:
• Company A will issue 120 million EUR five-year seniordebt
• Company B plans to issue 1.2 million new shares ofcommon stock; expects to raise 120 million EUR
• Stock prices based on current information: 100 – truevalue could be higher or lower
• What do rational investors learn from theseannouncements?

153
Pecking order theory
• Assume managers are better informed than investorsand maximize the wealth of existing shareholders• Firm will sell equity only if management knows their stock
is overvalued (i.e., true value < 100)• If firm announces an equity issue, market participants can
infer that management thinks the shares are overvalued Negative stock price reaction!
• If there is no other way to raise capital, the fear of adversestock price reaction can even lead to rejection of a positiveNPV investment

154
Pecking order theory• The firm with underpriced stock can issue debt, which is less
affected by information asymmetriesDebt is preferred to external equity
• Internal equity is least affected by information asymmetryInternal equity (i.e., profits) is most preferred
• This gives the pecking order of corporate financing:(1) Internal equity(2) Debt(3) External equity
• List of most used sources of finance has the same ranking asthat given by the pecking order theory (see Chapter 14)

155
Choice of debt level in practice
Source: Bancel and Mittoo (2004)
156
Valuation
• How to value a project including the valuecontributed by financing decisions?
• Two ways:1. Adjust the discount rate
• Modify the discount rate to reflect capital structure,bankruptcy risk, and other factors
2. Adjust the present value• Assume an all equity financed firm and then make
adjustments to value based on financing
• Either, not both!
157
After-tax weightedaverage cost of capital
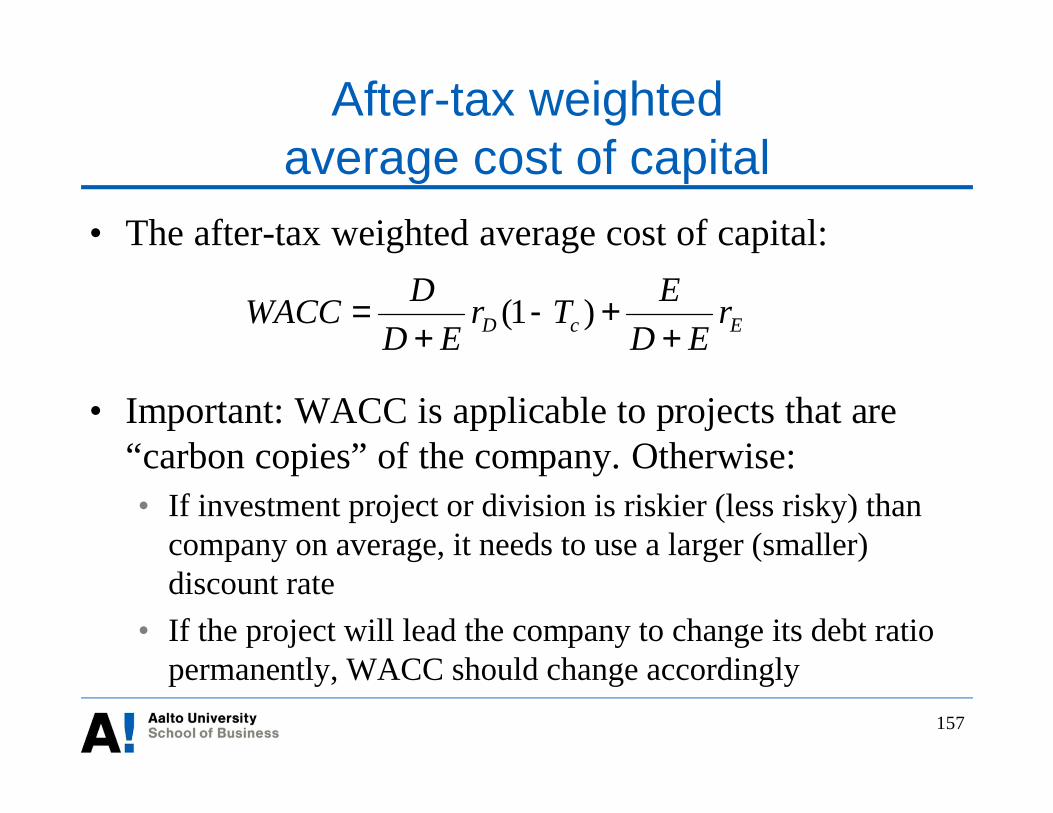
• The after-tax weighted average cost of capital:
• Important: WACC is applicable to projects that are“carbon copies” of the company. Otherwise:• If investment project or division is riskier (less risky) than
company on average, it needs to use a larger (smaller)discount rate
• If the project will lead the company to change its debt ratiopermanently, WACC should change accordingly
EcD rED
ETrED
DWACC+
+-+
= )1(

After-tax WACC at varying debtratios
158
Differently from the MM-based graph, WACC decreasesas debt ratio increases thanksto tax-deductibility of interest!
How to calculate WACC at adifferent debt ratio?
à Follow the three-step process:Step 1: Calculate r = WACC as if
there are no taxes. This alsogives rE at D/E=0
Step 2: Estimate rD at the newD/E and calculate rE at the new
D/EStep 3: Recalculate WACC using
the new weights, rD and rE
Correction: The x-line plots D/E, not D/V.

159
Most common ways of determining thediscount rate in Finland
Source: Keloharju and Puttonen (1995)

160
The adjusted present value (APV)
• The value to shareholders from an investment project isexpressed as the sum of the following components:• The NPV of the project’s after-tax cash flows (as if the firm
is all-equity financed; discount rate = r)• The NPV of costs due to the financing of the project• The NPV of subsidies (tax breaks plus other subsidies) due to
the financing of the project• Any transfers to shareholders from existing debt holders due
to the financing of the project

161
APV method• Example: Consider a project with a cost of capital of 8% if
financed entirely with equity• Project is expected to generate the following after-tax cash flows at the
end of each year:Year 1 Year 2 Year 3 Year 4100 100 1000 1000
• The project will be initially financed with equity capital• At the start of year 3 the firm will repurchase some of its equity and
borrow 2000 to finance for the two remaining years• Risk-free rate is 5% and corporate tax rate is 20%
• What is the present value for the project given the plan fordebt financing?

162
APV method
• Step 1: Compute present value of cash flows iffinanced entirely with equity:
• Step 2: Compute present value of the tax shieldgenerated by the debt financing:
2.170708.1
100008.1
100008.1
10008.1
100432 =+++=PV

163
APV method
• Step 3: The present value of the project given itsoperating and financing aspects is:
• 1707.2 + 33.7 = 1740.9
• Benefits of the APV method:• Exposes each financing side effect distinctly and how much
it adds or takes away from project (and firm) value• In the WACC method, they will all be hidden in the WACC estimate
• Doesn’t require a fixed debt ratio (i.e., continuousrebalancing) assumption as WACC method

Lecture 7
Leasing
164

Overview
• Leasing: key concepts• Operating vs. financial leases• Lease accounting in Finland• Why lease?
• Sensible reasons• Dubious reasons
• Agency problems in leasing and some solutions• Valuation of financial leases• International leasing
165

Leasing volumes by asset type inEurope
Source: Leaseurope, http://www.leaseurope.org/index.php?page=key-facts-figures
166
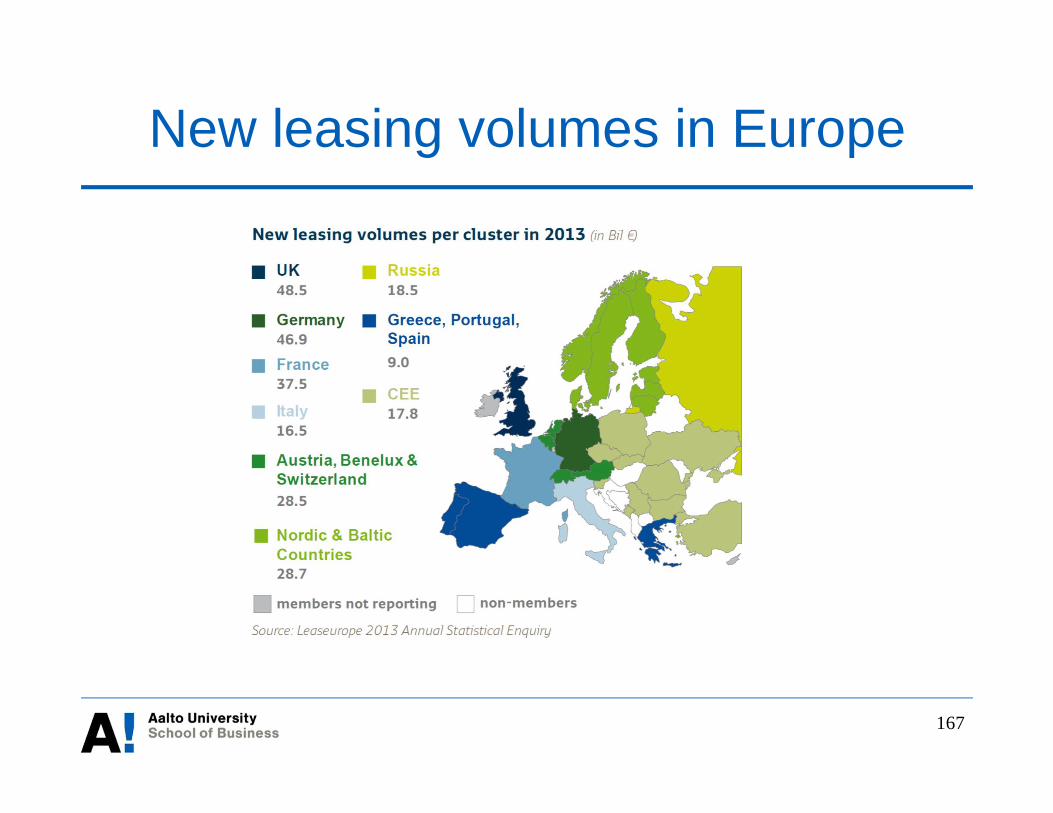
New leasing volumes in Europe
167

Leasing agreement• Lease = Rental agreement that extends for a year or more and
involves a series of fixed payments• A lease agreement is made between the lessor (= the owner of
the leased property) and the lessee (= the user)• Ownership of the asset makes a difference on
• who gets the salvage value at the end of the lease period• who gets the tax privileges
• Lease agreement gives lessee control over the asset for a pre-specified period of time• At end of the leasing period lessee often has the option to purchase the
asset from lessor• Typical leased assets include automobiles, airplanes, machinery
and industrial equipment, computers, real estate
168
Operating and financial leases: generalcharacteristics
• Operating lease• Short-term lease• Cancelable at the option of the lessee
• Financial lease• Non-cancelable• Long-term lease for most of the asset’s economic life
Operating leases are much riskier for the lessor thanfinancial leases
In operating leases, lessor must consider the risk that theasset will stay idle at least for some of the time
169
Leasing: further definitions
• Full-service or rental lease• Lessor maintains, insures, and pays taxes on the equipment
• Net lease• Lessee maintains, insures, and pays taxes on the property
• Sale and leaseback• Arrangement where a firm sells an asset to the lessor and
leases it back from the lessor• Leveraged lease
• Financial lease where the lessor borrows part of the purchaseprice using the leased equipment as collateral
170

Operating and financial leasesaccording to IFRS rules
• Categorization according to IFRS rules (IAS 17– Leases )• Financial lease “transfer substantially all the risks
and rewards of ownership, and give rise to asset andliability recognition by the lessee”
• Operating lease “result in expense recognition bythe lessee, with the asset remaining recognized by thelessor”
• Criteria for financial leases are broadly defined171
Lease accounting in Finland
• Listed Finnish companies have to conform toIFRS rules• Financial leases have to be reported on the balance
sheet as equivalent ownership of the asset with thelease obligations capitalized and shown on theliability side
• Non-listed Finnish companies do not need toreport financial leases on their balance sheets
172

Accounting Analysis
• Objective: To what extent the firm’s accountingnumbers capture its business reality?
• Identify any significant distortions where there isaccounting flexibility and using cash flow informationand notes to adjust accounting numbers to “undo” thedistortions
• Sound accounting analysisè sound financial analysis

Why account for operating leases?“On December 27, 2011, the Group sold a portfolio of 97 supermarketproperties owned by Carrefour Property for 365 million euros. Thesupermarkets will continue to be operated under the Carrefour Marketbanner under long-term fixed rent leases with an indexation clause.
The transaction qualifies as a sale-and-leaseback transaction under IAS 17 –Leases. The leases with the new owner of the properties, for an initial term of12 years with multiple renewal options, fulfill the criteria for classification asoperating leases, as substantially all the risks and rewards incidental toownership of the asset are retained by the lessor.
The properties were sold at market price and the capital gain, net oftransaction costs, was recognized in full in the 2011 income statement in theamount of 229 million euros.”
Source: Carrefour, 2011 Financial Report

• Criteria for classifying leases as operational are not strictlydefined and leave room for opportunistic accounting• Important particularly for heavy-asset industries to detect and correct for
such distortions
• One of Carrefour’s key assets are the company’s stores, manyof which are leased under operating leases• Estimated PV of these leases in 2011= 3.15 billion EUR
• 33% of long-term borrowings• 23% of tangible fixed assets
• To synchronize the financials across comparable firms
Why account for operating leases?
Sensible reasons for leasing
• Given the Modigliani-Miller assumptions, thereis no difference between owning an asset andleasing an assetLeasing policy is just a special case of financialpolicy, and can matter if at least one of thefollowing is true:• Financial policy affects a firm’s tax obligations• Financial policy affects contracting costs• Financial policy affects real investment policy
176
Sensible reasons for leasing
• Convenience• Flexibility• Shifting the risk of obsolescence• Standardization leads to low costs• Lessor may be able to use tax breaks from
depreciation more effectively• Additional source of financing, less susceptible
to financial distress177
Dubious reasons for leasing
• Leasing avoids internal capital expenditurecontrols
• Leasing preserves capital• Leases may be off balance sheet financing• Leasing increases book rate of return
• In early years, lease payments < interest + depreciation• Off-balance sheet assets may never appear in the
denominator
178
Agency problems and leaseprovisions
• Leasing separates rights to the cash flows of the asset from itssalvage value
• This generates incentives for agency problems such as assetabuse, under-maintenance
• Provisions in lease contracts are designed to solve theseproblems. For example:
• Deposits and penalty clauses• Options to extend/purchase or cancel• Restrictions to sublease• Metering: a contractual provision that ties lease payments to some measure of
the intensity of the asset’s use• Tie-in sale: a contractual requirement to use a specified nondurable input in the
operation of the leased asset
179
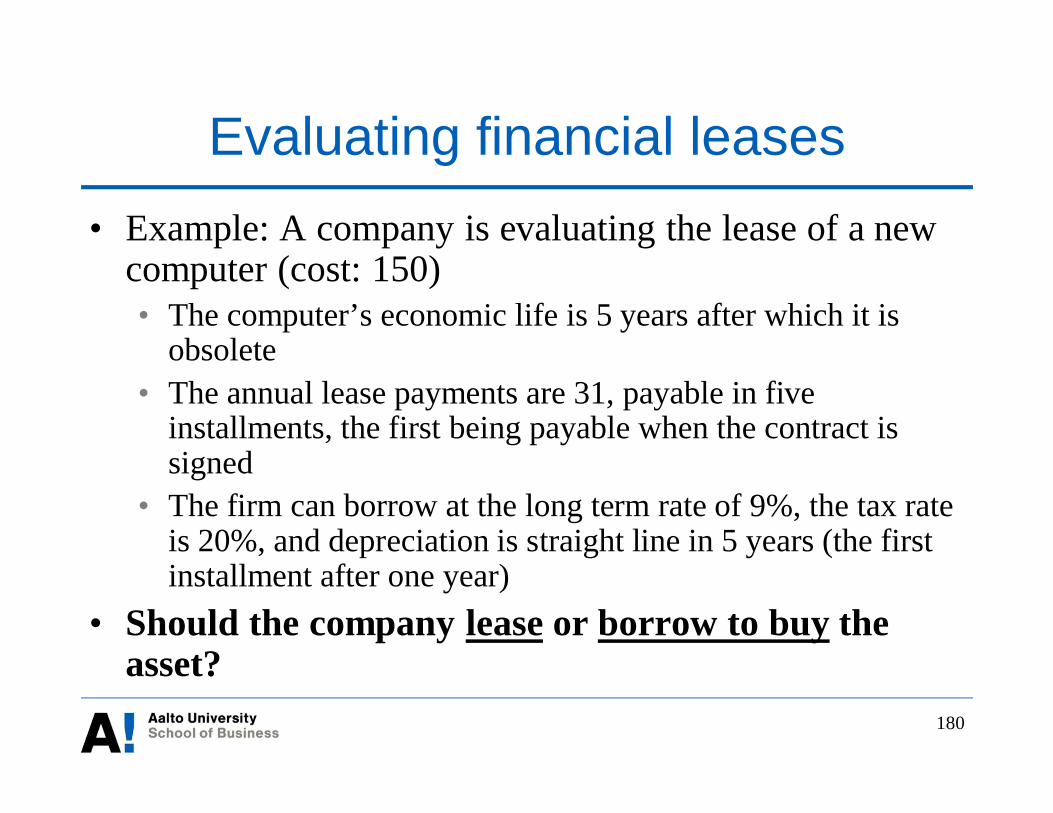
Evaluating financial leases• Example: A company is evaluating the lease of a new
computer (cost: 150)• The computer’s economic life is 5 years after which it is
obsolete• The annual lease payments are 31, payable in five
installments, the first being payable when the contract issigned
• The firm can borrow at the long term rate of 9%, the tax rateis 20%, and depreciation is straight line in 5 years (the firstinstallment after one year)
• Should the company lease or borrow to buy theasset?
180
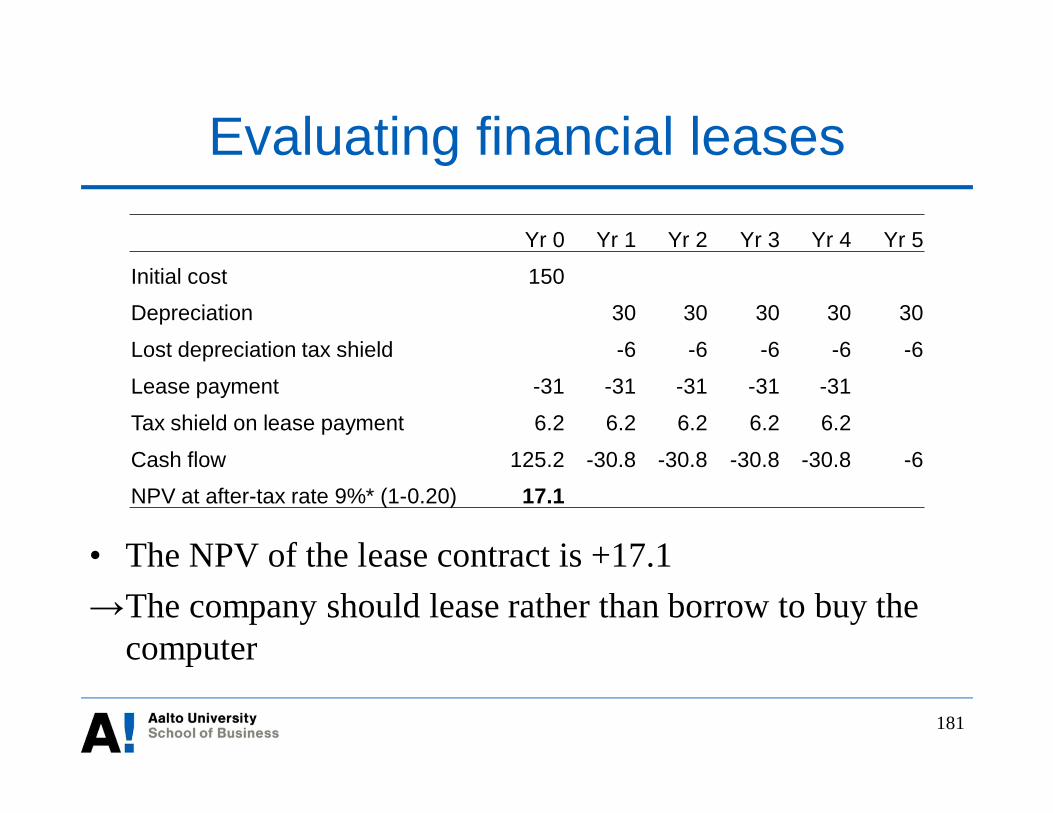
Evaluating financial leases
• The NPV of the lease contract is +17.1The company should lease rather than borrow to buy thecomputer
181
Yr 0 Yr 1 Yr 2 Yr 3 Yr 4 Yr 5
Initial cost 150
Depreciation 30 30 30 30 30
Lost depreciation tax shield -6 -6 -6 -6 -6
Lease payment -31 -31 -31 -31 -31
Tax shield on lease payment 6.2 6.2 6.2 6.2 6.2
Cash flow 125.2 -30.8 -30.8 -30.8 -30.8 -6
NPV at after-tax rate 9%* (1-0.20) 17.1
Evaluating financial leases
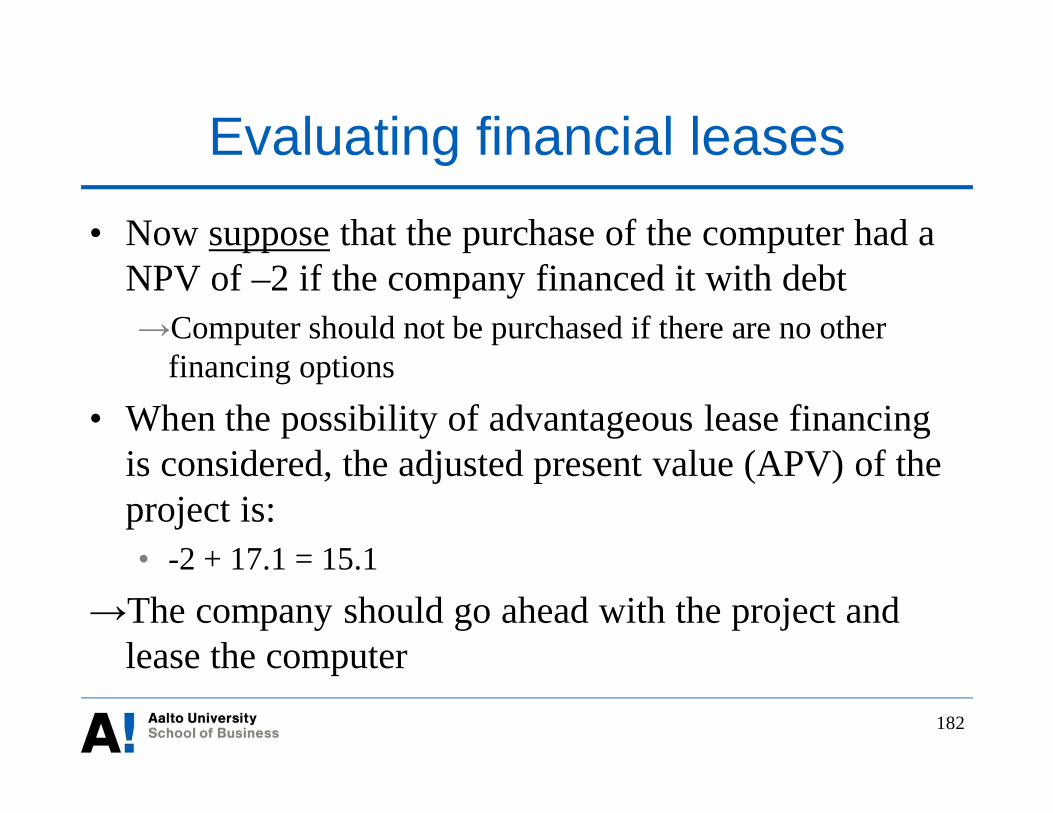
• Now suppose that the purchase of the computer had aNPV of –2 if the company financed it with debt
Computer should not be purchased if there are no otherfinancing options
• When the possibility of advantageous lease financingis considered, the adjusted present value (APV) of theproject is:• -2 + 17.1 = 15.1
The company should go ahead with the project andlease the computer
182

Formal analysis of lease vs. borrow to buy• Denote corporate tax rate with Tc, lease payment with
L, and depreciation with Dep• Leasing instead of buying generates the following
income stream every year:• -[(1-Tc)Lt + TcDept ]
This reflects the fact that the lessee will lose the depreciationtax shield in addition to having to pay the lease payments
• Therefore, the NPV of the lease decision (vs. borrow tobuy) is:
where I0 is the cost of the asset and (1-Tc)r is the after-taxborrowing rate for the company
183
å= -+
-+-=
n
tt
c
tctc
rTLTDepTILeaseNPV
10 ])1(1[
)1()(

When is leasing most taxadvantageous?
• Other things being equal, the potential gains tolessor and lessee are highest when:• The lessor’s tax rate is substantially higher than the
lessee’s• The depreciation tax shield is received early in the
lease period• The lease period is long and the lease payments are
concentrated toward the end of the period• The interest rate is high
184

Cross-border leasing• Cross-border leasing contracts can take advantage of
asymmetric tax treatment of leasing in the countries thelessee and the lessor are domiciled
• Multinational companies may use cross-border leasing• To limit the ownership of assets by subsidiaries in politically
unstable countries• In the event of nationalization, there will be higher chance of
recovering assets if they are not owned by local subsidiary
• To extract cash more easily from affiliates located incountries that have exchange controls
• Lease payments may be a more acceptable method to repatriate fundsthan dividends, interest, or royalty payments
185
186
Lecture 8
Financial planning

187
Overview
• What is financial planning?• Strategic planning and finance• Long-term planning
• Financial planning models: key concepts• Example of financial planning model• External financing and growth
• Short-term planning• Cash budgeting• Sources of short-term financing
188
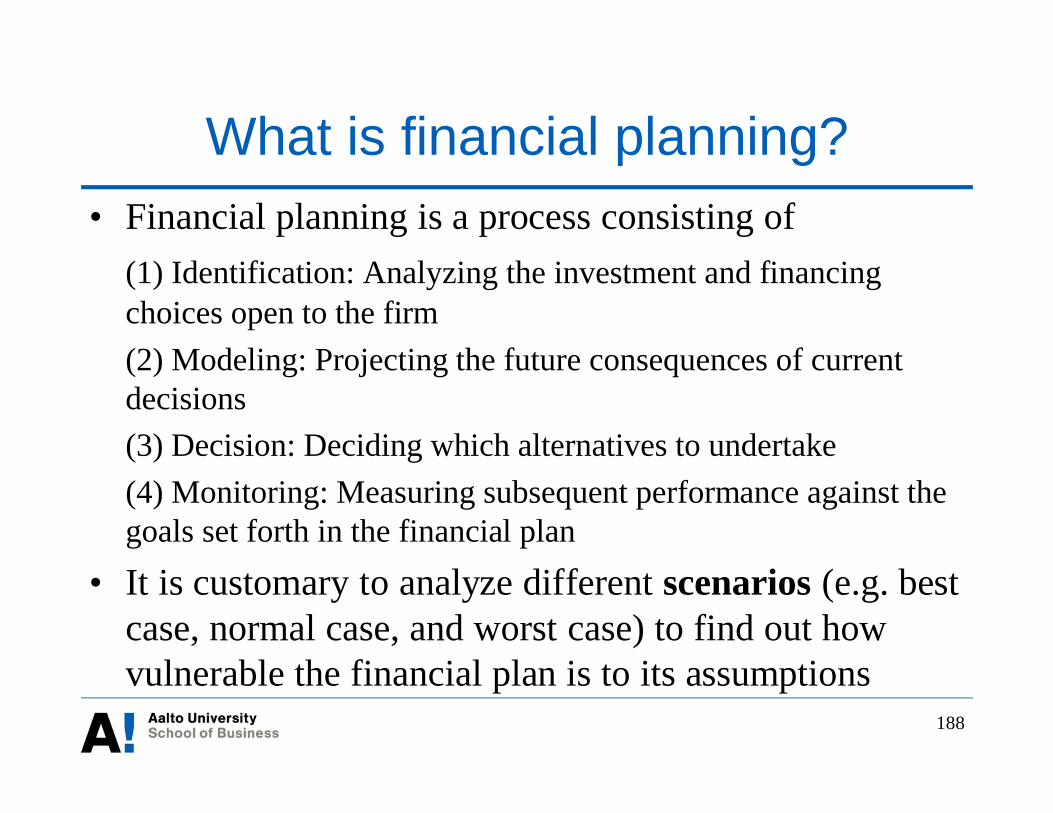
What is financial planning?• Financial planning is a process consisting of
(1) Identification: Analyzing the investment and financingchoices open to the firm(2) Modeling: Projecting the future consequences of currentdecisions(3) Decision: Deciding which alternatives to undertake(4) Monitoring: Measuring subsequent performance against thegoals set forth in the financial plan
• It is customary to analyze different scenarios (e.g. bestcase, normal case, and worst case) to find out howvulnerable the financial plan is to its assumptions
189
Contribution of finance to strategicplanning
• Financial tools are used to determine the feasibility ofa strategic plan, given firm’s existing and prospectivesources of funding
• Finance has control of the implementation of strategicplans• Financial analysts prepare cash budgets that help avoid
liquidity problems• Finance also contributes to strategic planning through
risk management
190
Long-term planning: financial planningmodels
• Financial planning models• Help to explore the consequences of alternative strategies• Are particularly useful for firms with changing capital needs
• Growth firms• Financially distressed firms
• Financial planning models often start from identifyingsales• Costs and variables such as net working capital are often
defined as proportional to sales

191
Long-term planning: financial planningmodels
• The outputs of financial planning models are calledpro formas (= projected or forecast financialstatements)• ”Top-down” approach uses macroeconomic and industry
forecasts to establish sales goals• ”Bottom-up” approach forecasts sales on a customer-by-
customer basis• The balancing item, or the plug, is the variable that
adjusts to maintain the consistency of a financial plan
192
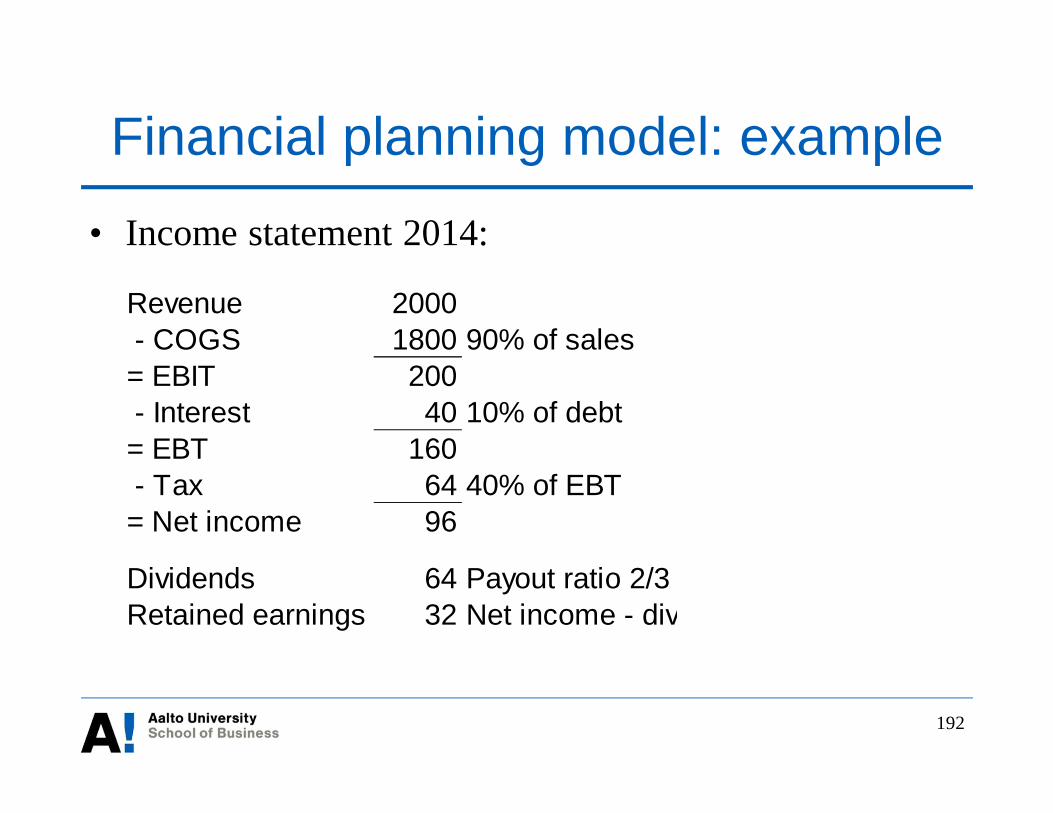
Financial planning model: example
• Income statement 2014:
Revenue 2000 - COGS 1800 90% of sales= EBIT 200 - Interest 40 10% of debt= EBT 160 - Tax 64 40% of EBT= Net income 96
Dividends 64 Payout ratio 2/3Retained earnings 32 Net income - div.
193
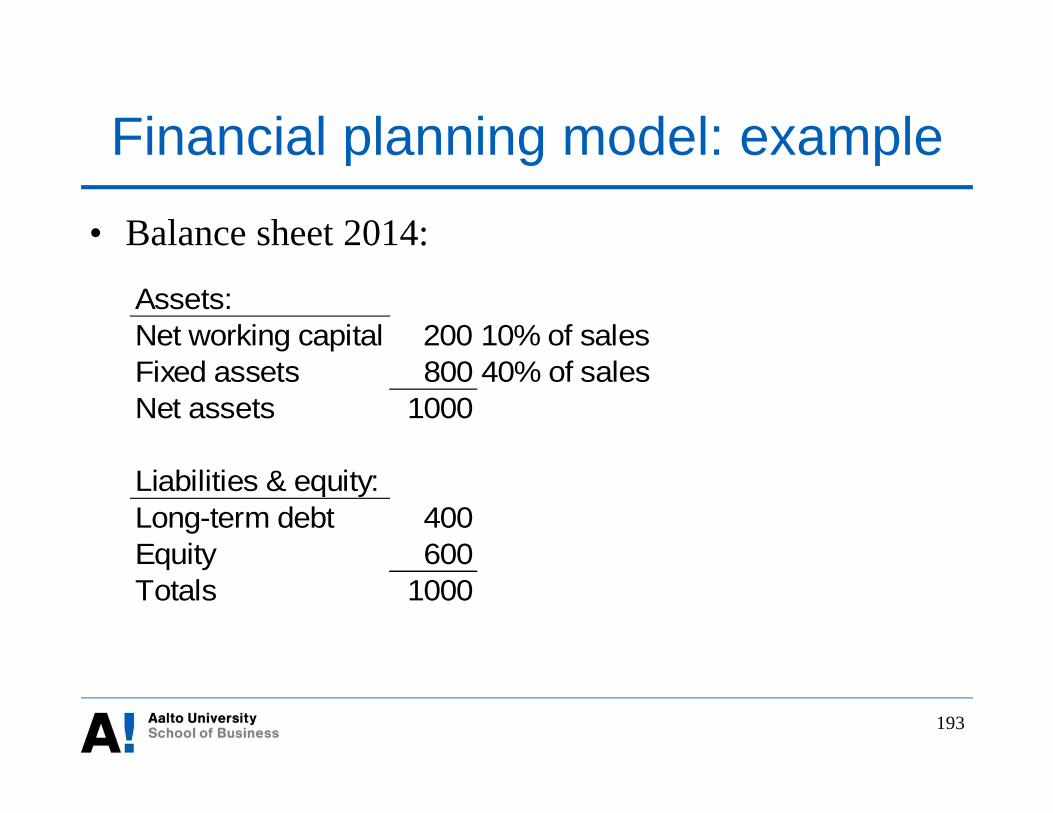
Financial planning model: example
• Balance sheet 2014:
Assets:Net working capital 200 10% of salesFixed assets 800 40% of salesNet assets 1000
Liabilities & equity:Long-term debt 400Equity 600Totals 1000
194
Financial planning model: example
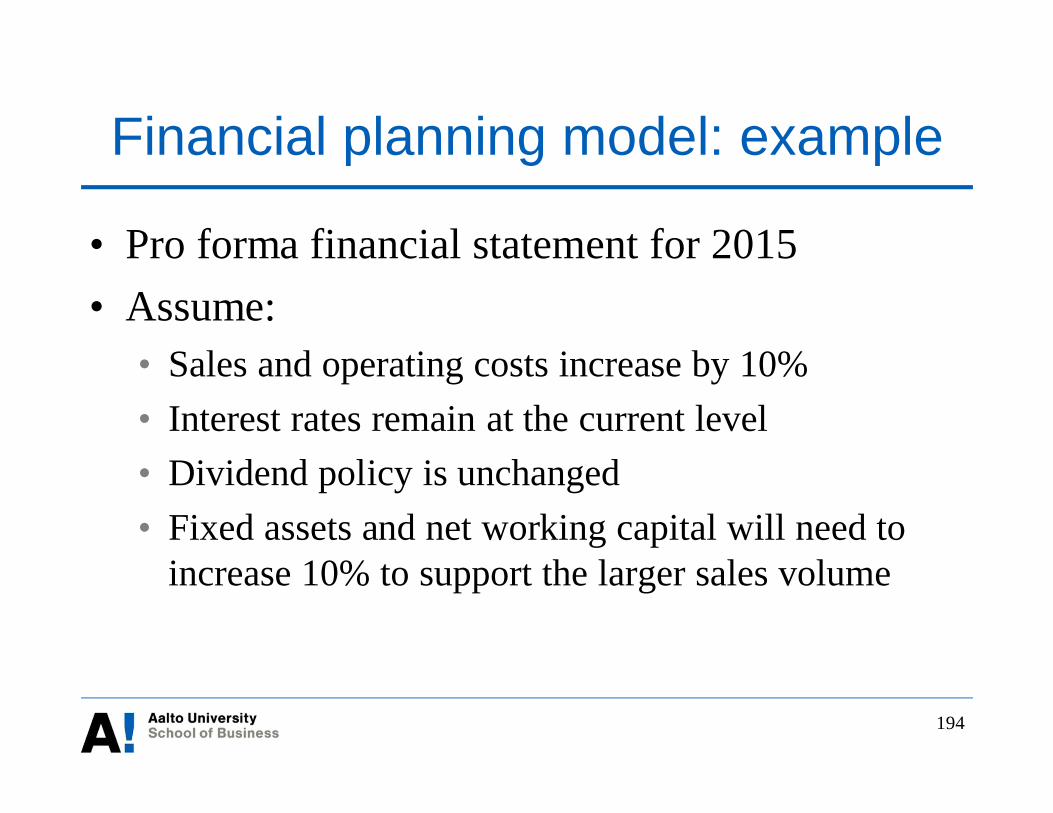
• Pro forma financial statement for 2015• Assume:
• Sales and operating costs increase by 10%• Interest rates remain at the current level• Dividend policy is unchanged• Fixed assets and net working capital will need to
increase 10% to support the larger sales volume
195
Financial planning model: example
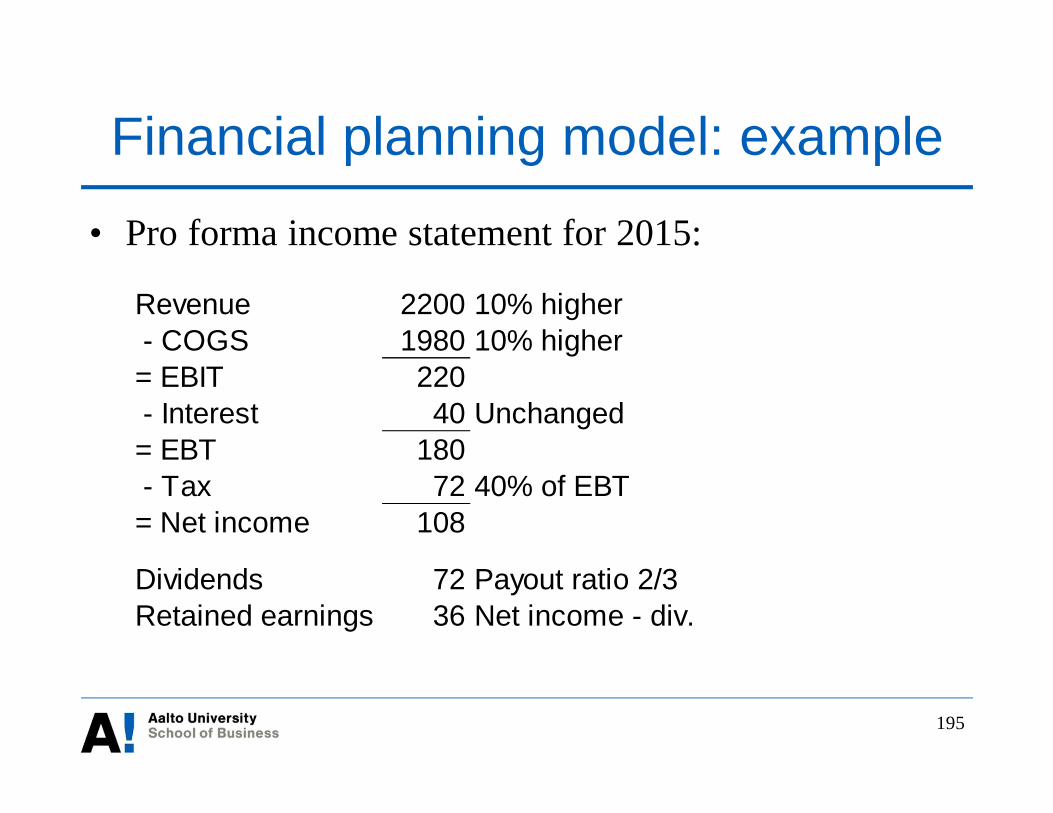
• Pro forma income statement for 2015:
Revenue 2200 10% higher - COGS 1980 10% higher= EBIT 220 - Interest 40 Unchanged= EBT 180 - Tax 72 40% of EBT= Net income 108
Dividends 72 Payout ratio 2/3Retained earnings 36 Net income - div.
196
Financial planning model: example
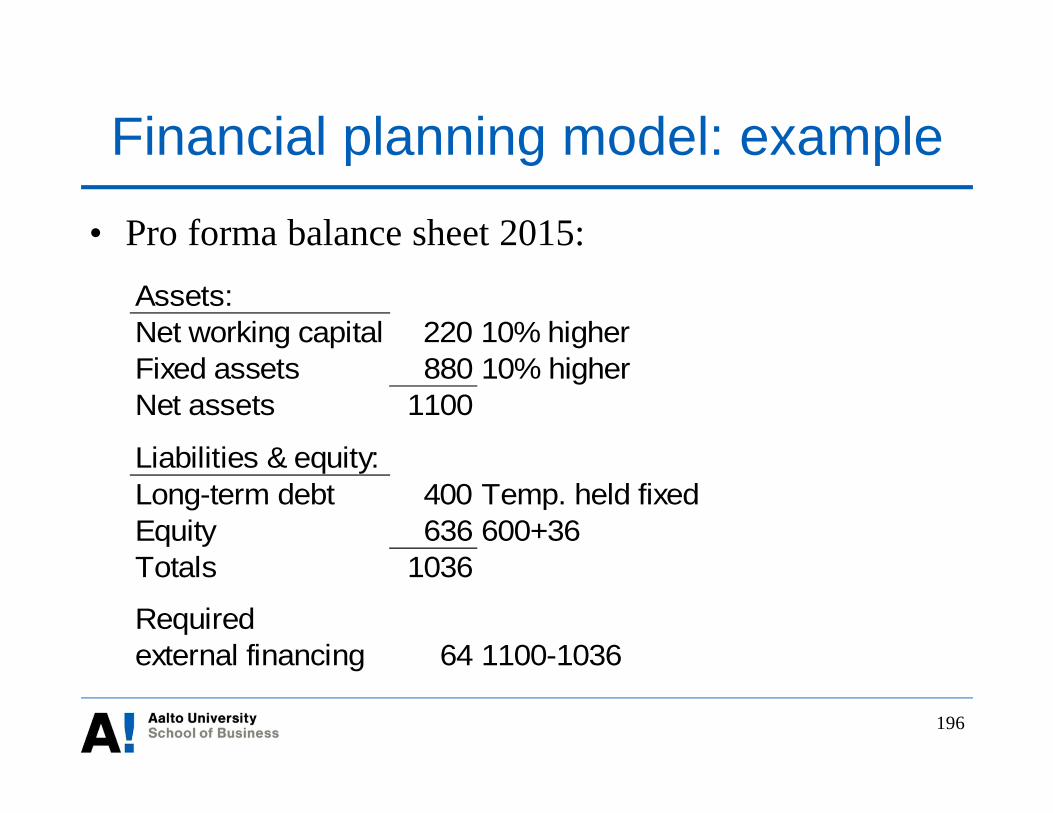
• Pro forma balance sheet 2015:Assets:Net working capital 220 10% higherFixed assets 880 10% higherNet assets 1100
Liabilities & equity:Long-term debt 400 Temp. held fixedEquity 636 600+36Totals 1036
Requiredexternal financing 64 1100-1036

197
Financial planning model: example
• Pro forma statement of sources and uses of funds for2015:
The company needs additional borrowing of 64
Sources:Retained earnings 36New borrowing 64Total sources 100Uses:Investment in working capital 20Investment in fixed assets 80Total uses 100

198
External financing and growth
• Assuming (as in the example before) that a givenincrease in sales requires a similar increase in assets,the requirement for new investment is simply:• New investment = Growth rate x Initial assets
• Since part of the investment requirement can befinanced with retained earnings, the amount ofrequired external financing is:• Required external financing
= New investment - Retained earnings= Growth rate x Initial assets – Retained earnings

199
External financing and growth• Example continues: Using the above formula, the
required external financing is:• 10% × 1,000 - 36 = 64
This is exactly the same result as that obtained from theearlier financial planning modelA company can finance its growth itself only to the extent itcan generate retained earnings
• The internal growth rate is the maximum rate ofgrowth that a company can achieve without externalfinancing:
AssetsearningsRetainedrategrowthInternal =
200
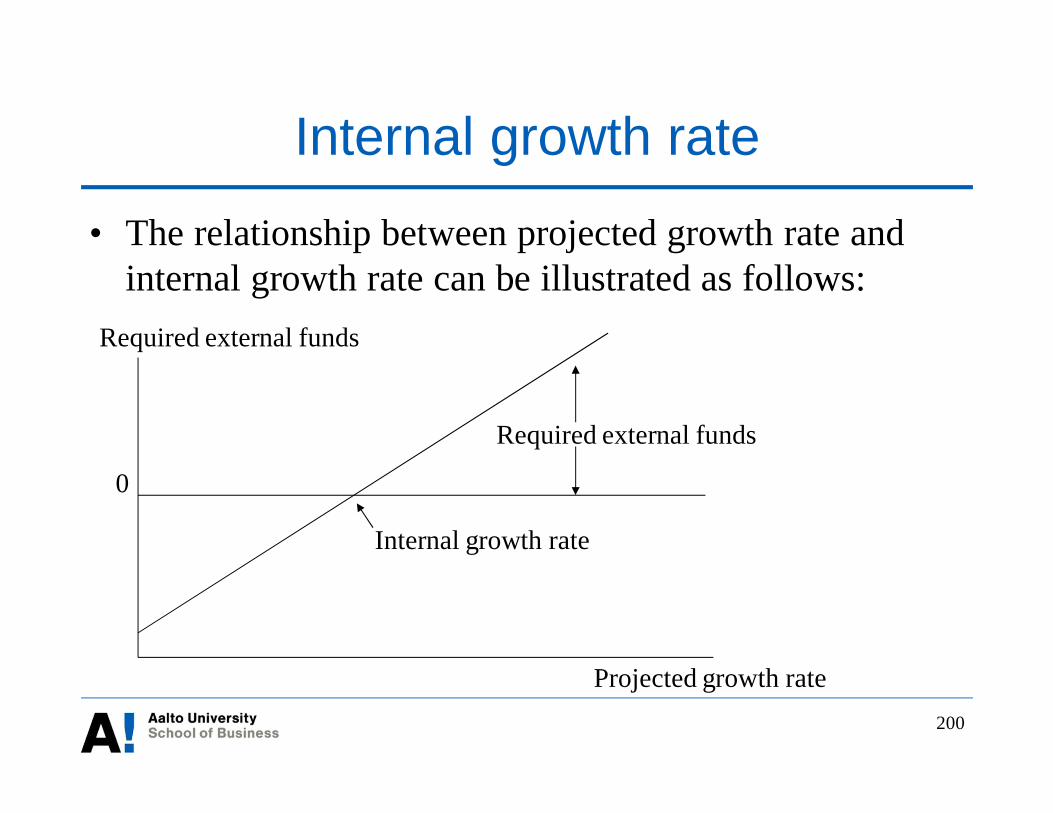
Internal growth rate
• The relationship between projected growth rate andinternal growth rate can be illustrated as follows:
Internal growth rate
Required external funds
0
Projected growth rate
Required external funds

201
External financing and growth• The internal growth rate can be further divided into
several components:
• A firm can achieve a high growth rate without externalcapital if it• Plows back a high proportion of its earnings• Has a high return on equity (ROE)• Has a low total debt ratio
Assets
Equity
Equity
incomeNet
incomeNet
earningsRetainedrategrowthInternal ´´=
Assets
EquityequityonReturnratioPlowback ´´=
202
Sustainable growth rate• Sustainable growth rate
• Growth rate that can be maintained without any furtherequity issues
• Allows further debt issues which maintain the capitalstructure, i.e. the level of Equity/Assets, at the presentlevel
• The sustainable growth rate can be determined asfollows:• Sustainable growth rate
= Plowback ratio x Return on equity
203
Sustainable growth rate
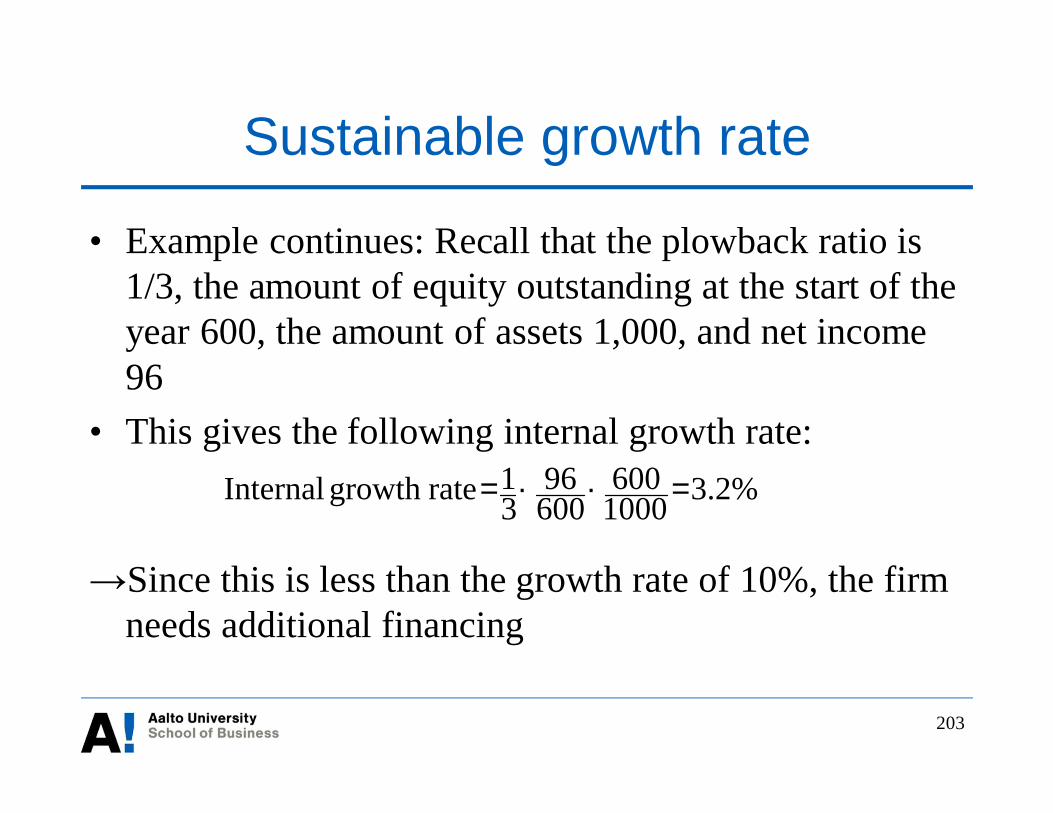
• Example continues: Recall that the plowback ratio is1/3, the amount of equity outstanding at the start of theyear 600, the amount of assets 1,000, and net income96
• This gives the following internal growth rate:
Since this is less than the growth rate of 10%, the firmneeds additional financing
3.2%1000600
60096
31rategrowthInternal =´´=

204
Sustainable growth rate
• The sustainable growth rate is:
This number is also smaller than the projected growthrate• The firm not only requires additional borrowing but also has
to increase its total debt ratioIn the long run, the company either has to raiseadditional equity or cut back its growth rate
5.3%60096
31rategrowtheSustainabl =´=

205
A firm’s cumulative capital requirement
• Line A: Permanent cash surplus• Line B: Short-term lender for part of year, borrower for remainder• Line C: Permanent short-term borrower
206
Short-term planning: cash budget
• Cash budget (for time periods of less than 1 year)• Is a schedule of cash inflows and outflows in the near future• It is necessary for maintaining liquidity at all times
• A firm should have at the same time several cashbudgets for different time periods• E.g. a daily, a weekly, and a monthly cash budget
• The more the cash flows fluctuate, the more importantthe cash budgets are
• The more there are customers, the easier it is to predictcash flows

Value of cash holdings• US and European non-financial firms hold more cash today
than they used to• Advantages of holding more cash
• Readiness for unexpected contingencies• Smaller growth firms facing high costs of raising external capital
• For such firms, value of a $1 of cash is worth $1.2 to investors(Pinkowitz and Williamson, 2007)
• Disadvantage of excess cash• Tax disadvantage of lending (i.e., investing in marketable securities)• Agency problems
• For firms with poor corporate governance or facing financialdistress, a$1 of cash is worth less than a dollar to investors
207

208
Working capital: cycle of operations
208
209
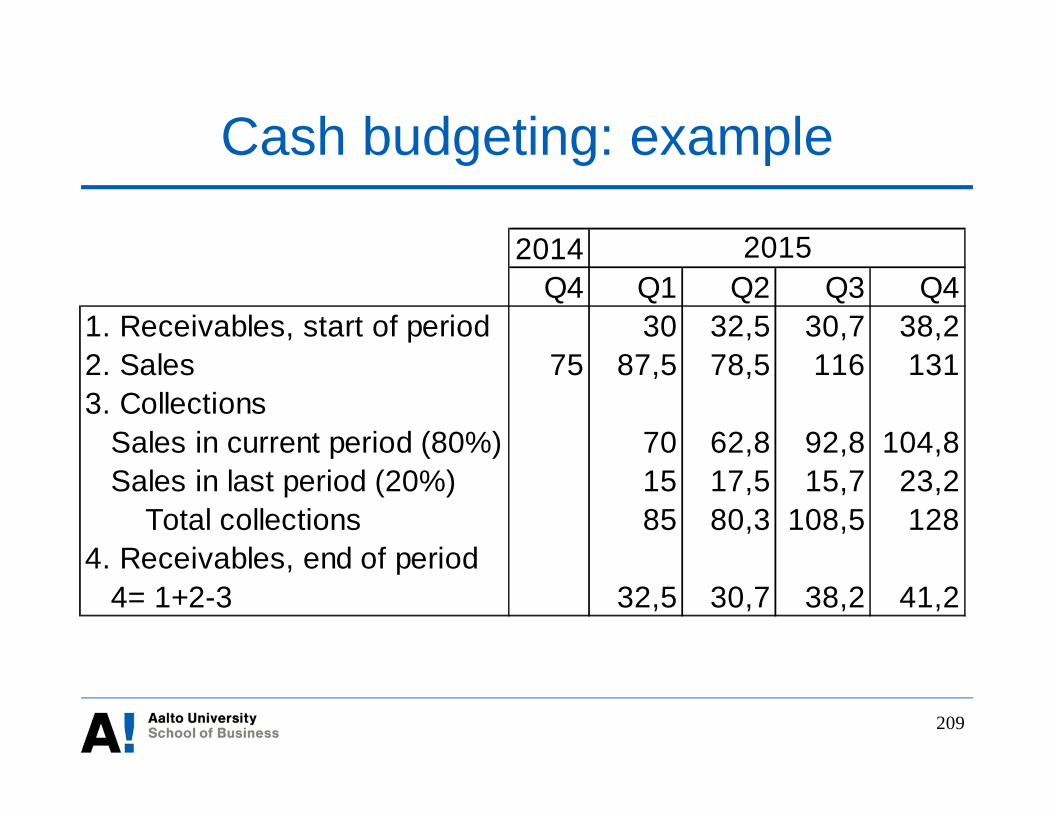
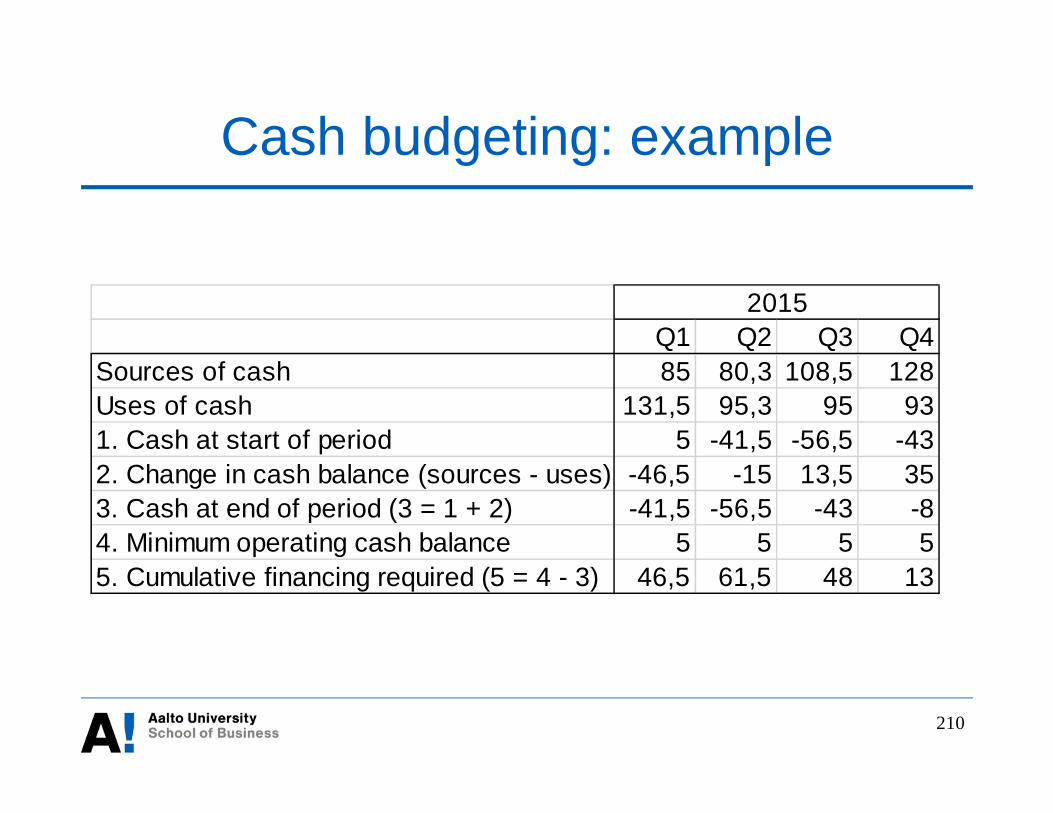
Cash budgeting: example
2014Q4 Q1 Q2 Q3 Q4
1. Receivables, start of period 30 32,5 30,7 38,22. Sales 75 87,5 78,5 116 1313. Collections Sales in current period (80%) 70 62,8 92,8 104,8 Sales in last period (20%) 15 17,5 15,7 23,2 Total collections 85 80,3 108,5 1284. Receivables, end of period 4= 1+2-3 32,5 30,7 38,2 41,2
2015
210
Cash budgeting: example
Q1 Q2 Q3 Q4Sources of cash 85 80,3 108,5 128Uses of cash 131,5 95,3 95 931. Cash at start of period 5 -41,5 -56,5 -432. Change in cash balance (sources - uses) -46,5 -15 13,5 353. Cash at end of period (3 = 1 + 2) -41,5 -56,5 -43 -84. Minimum operating cash balance 5 5 5 55. Cumulative financing required (5 = 4 - 3) 46,5 61,5 48 13
2015

211
Sources of short-term financing• Line of credit
• Agreement with a bank that a company may borrow any time up to anestablished limit
• Typically unsecured, i.e. with no collateral, and reviewed annually• Revolving credit arrangement is a similar agreement but
usually lasts for several years• Factoring
• Company sells its receivables to a factor who then takes care ofcollecting the receivables
• Secured loans which use e.g. accounts receivable or inventoriesas collateral
• Delay payment of accounts payable• Expedite payment of receivables

212
Lecture 9
Working capital management
213
Overview• How to evaluate working capital management• Inventory management
• Optimal order size (i.e., economic order quantity)
• Credit management• Cost of cash allowance• Credit decision• Credit check• Repeat orders• Analysis of credit risk
• Cash management• Cash vs. marketable securities

How to evaluate working capitalmanagement
• Operating cycle• Number of days from purchases of inventory materials to the collection of cash
from customers
• Cash (conversion) cycle• Number of days from cash payment to suppliers to the collection of cash from
customers
214
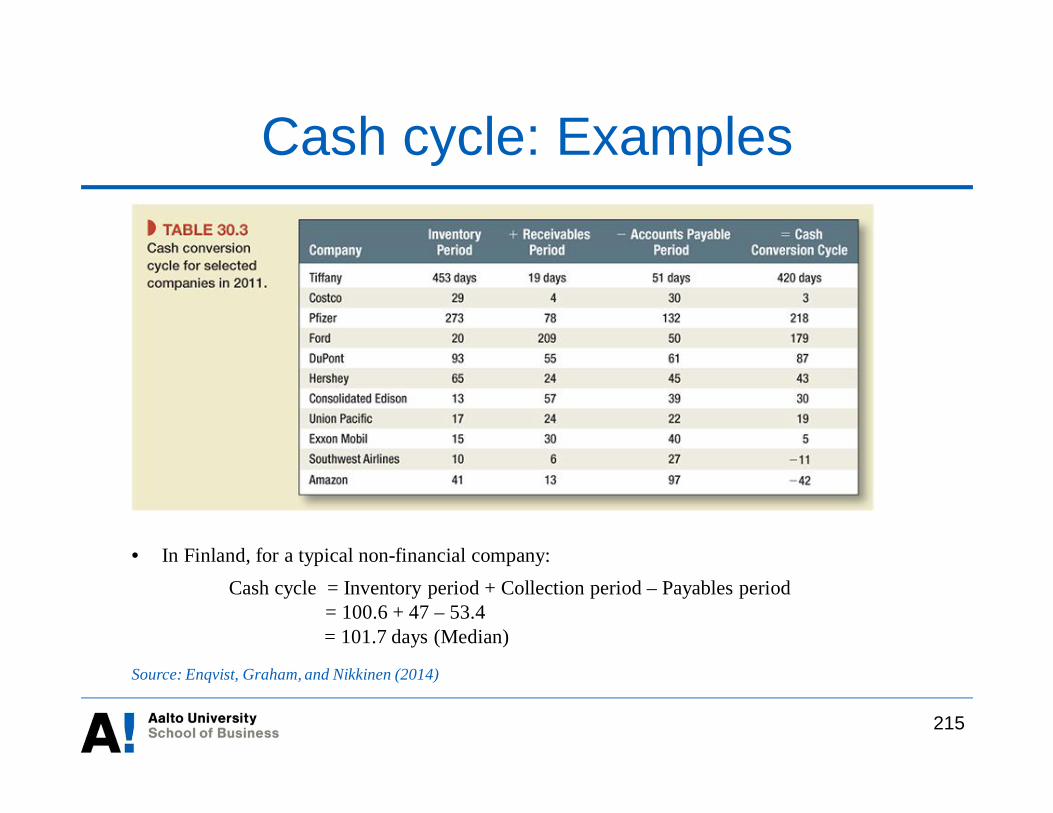
Cash cycle: Examples
215
• In Finland, for a typical non-financial company:Cash cycle = Inventory period + Collection period – Payables period
= 100.6 + 47 – 53.4= 101.7 days (Median)
Source: Enqvist, Graham, and Nikkinen (2014)
216
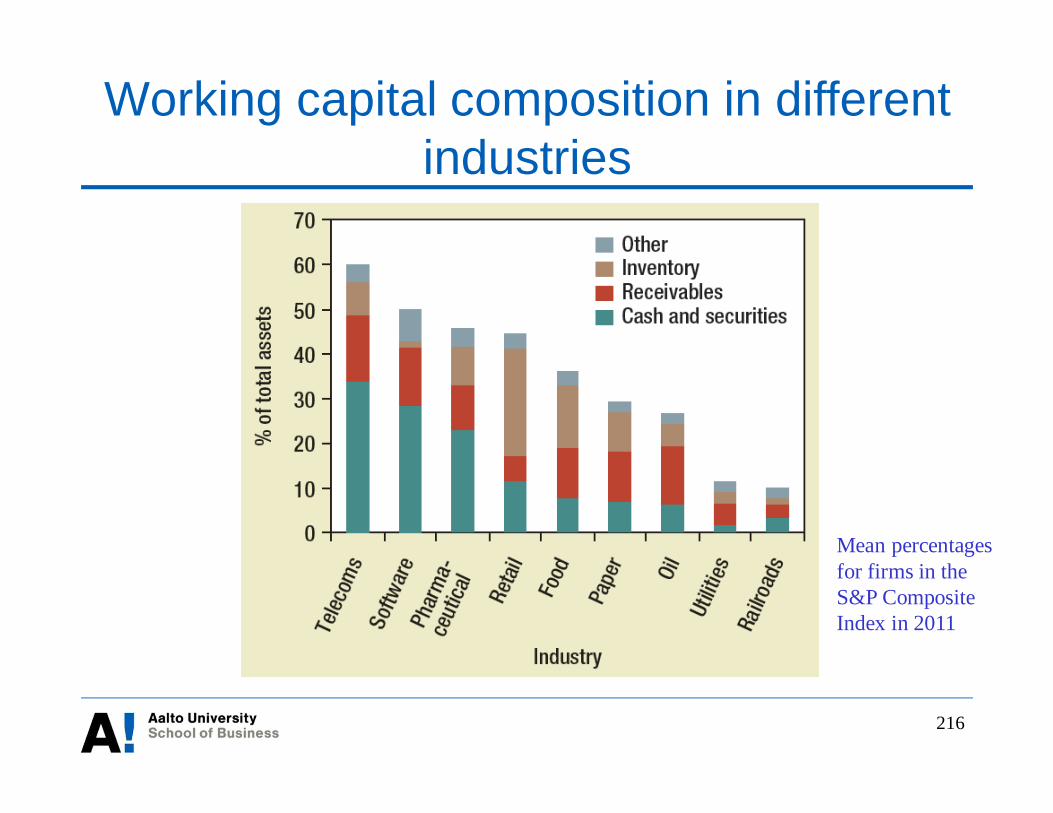
Working capital composition in differentindustries
Mean percentagesfor firms in theS&P CompositeIndex in 2011

217
Working capital management in Finland
Source: Enqvist, Graham, and Nikkinen (2014)

218
Inventory management
• Trade-off: Carrying costs vs. Ordering costs• Benefits of large inventory: Low order frequency, low risk of delays• Costs of large inventory: Storage, insurance, forgone interest etc.
• Example: Assume a bookstore sells 100 copies of a givenbook a year and orders Q books at a time• The number of orders will therefore be 100 / Q
• Assume further:• An order is made at the time when the inventory is empty• The demand for the books is evenly distributed over time
The average inventory size will be Q/2 (see next slide)
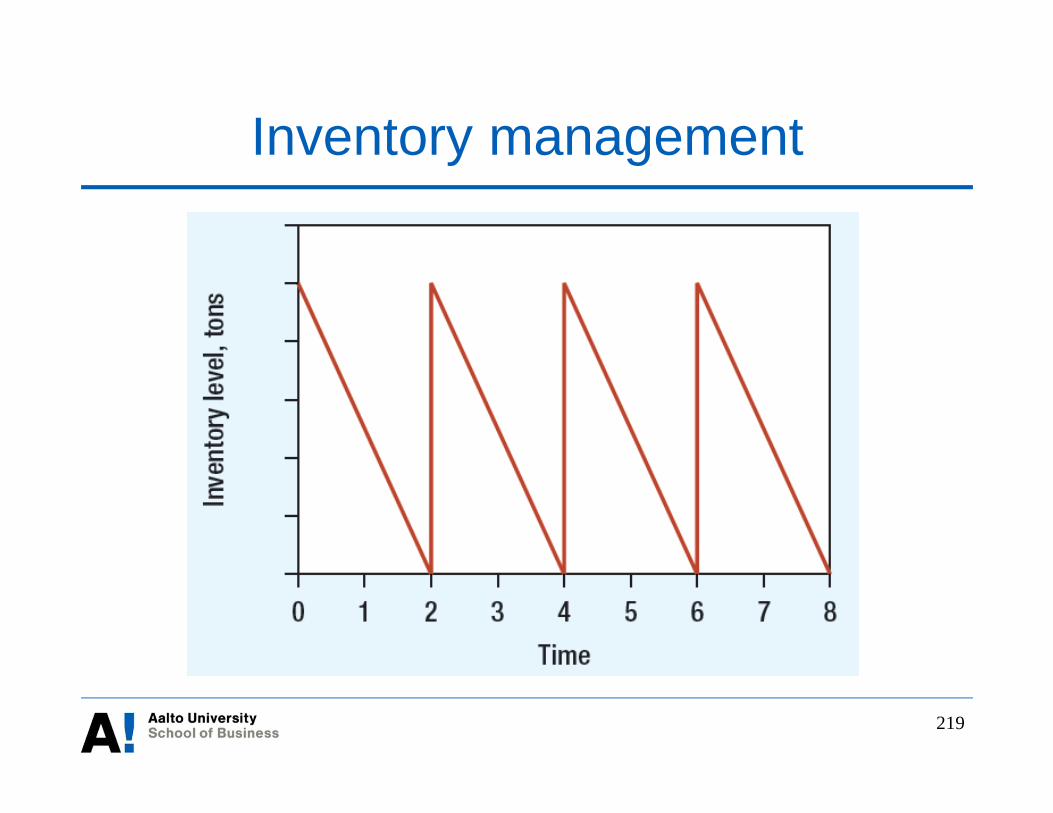
219
Inventory management

220
Inventory management• Assuming further:
• Annual carrying cost per book is 1• Each order costs 2
Total carrying cost= Carrying cost per book × Average inventory of books= 1 × Q/2 = Q/2
Total order cost = N. of orders per year × Cost per order= 100/Q × 2
• Efficient inventory management requires minimizingthe sum of these two costs
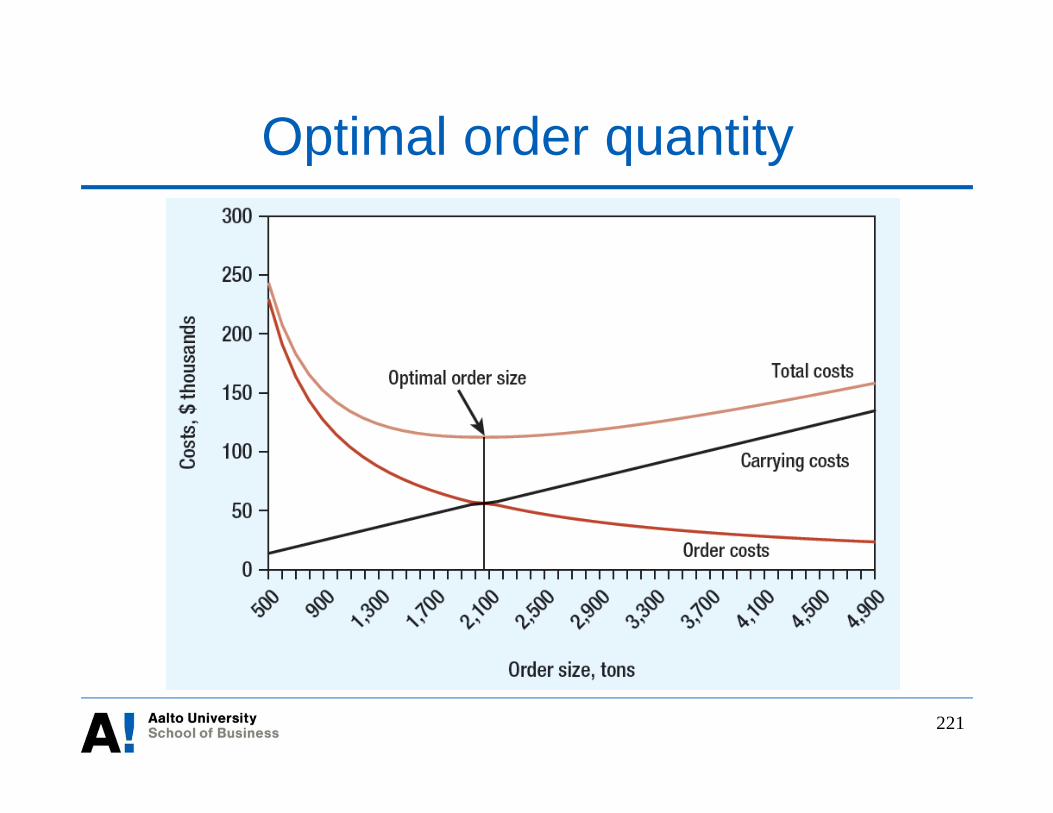
221
Optimal order quantity

222
Inventory management
• The optimum is where the total carrying cost equalstotal order cost:• Q/2 = 100/Q × 2 => Q2 = 400 => Q = 20
The optimal order level is 20 books• This can be generalized with notation. The economic
order quantity (EOQ), i.e. order size that minimizestotal inventory costs, is:
costCarryingorderperCostSales2EOQ ´´
=

223
Inventory management
• Plugging the numbers of the example into this formulagives:
which is exactly the result we obtained earlier
20,1
21002quantityorderEconomic =´´
=

224
Credit management
• Takes several steps:(1) Fix terms of sale (e.g., COD or trade credit with
“2/10 net 30”)(2) Decide on form of contract (e.g., open account or
commercial draft)(3) Analyze credit risk (e.g., internal or external)(4) Grant or refuse credit(5) Collect cash (or sell to a factor)

225
Cost of stretching payables
• Example: -2%/ 10 days, net 30 days; good costs 100• Pay by day 10: Discounted price of the good will be
100 - 100 × 2% = 98• Pay on day 30: Same as a 20-day loan from the seller
You will pay 2/98 = 2.04% more for the good• Number of 20-day periods in a year = 365/20 = 18.25• At the “interest rate” of 2.04%, the principal will grow in a
year to 1.020418.25 = 1.446Your annual cost is 1.446 -1 = 44.6%
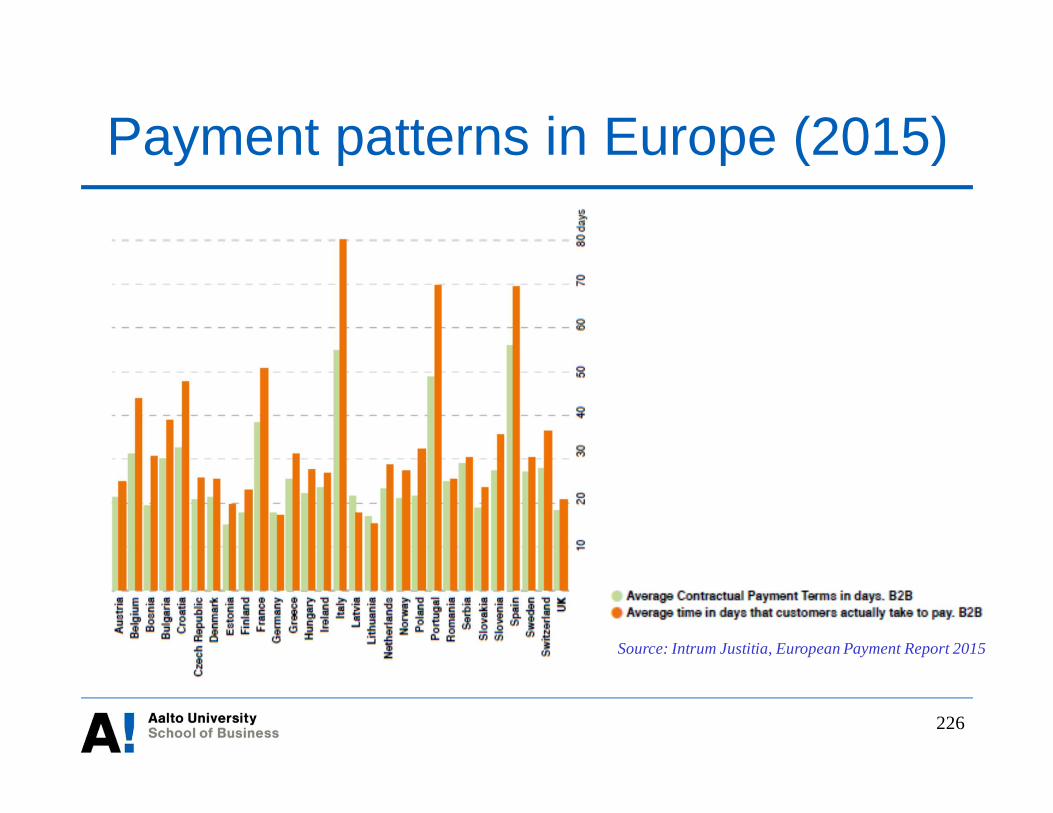
226
Payment patterns in Europe (2015)
Source: Intrum Justitia, European Payment Report 2015
227
Analysis of credit risk• The following C’s are often take into account when
analyzing credit applicants:• The customer’s character• The customer’s capacity to pay• The customer’s capital• The collateral provided by the customer• The condition of the customer’s business
• In Finland, e.g. Asiakastieto Oy and Dun & Bradstreetprovide credit analyses
• In the analysis of large orders, other useful sources includefinancial ratio analysis and the analysis of credit ratings
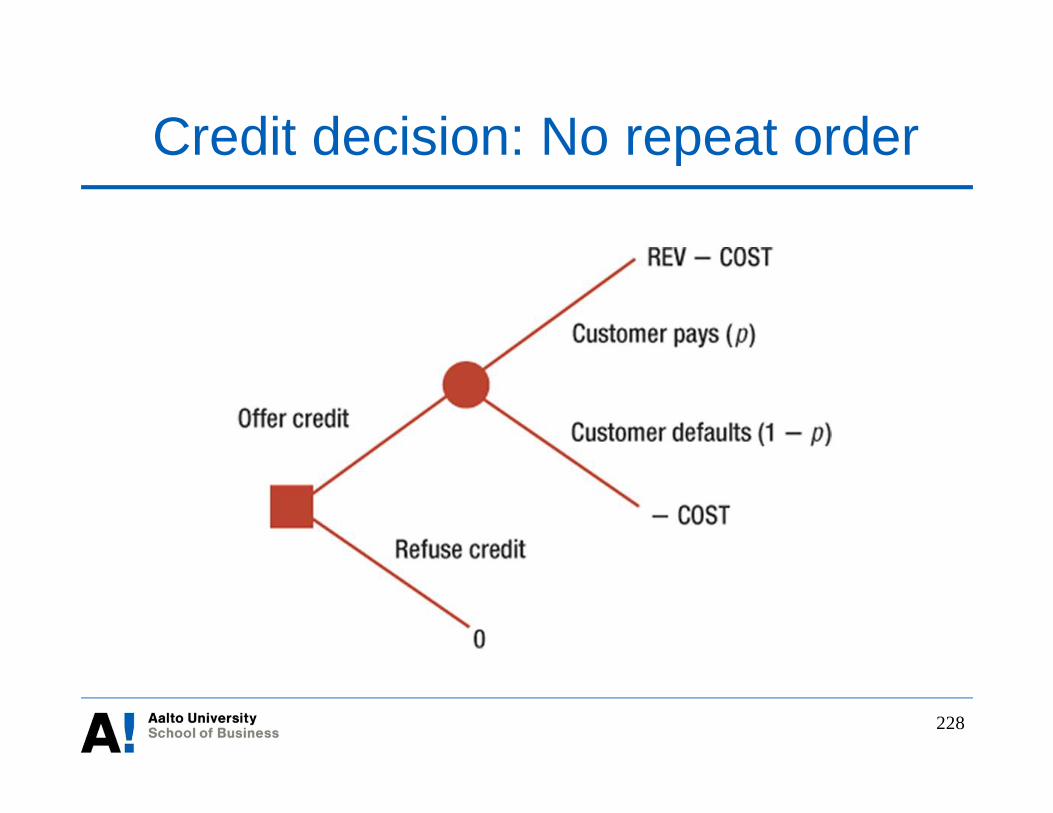
228
Credit decision: No repeat order
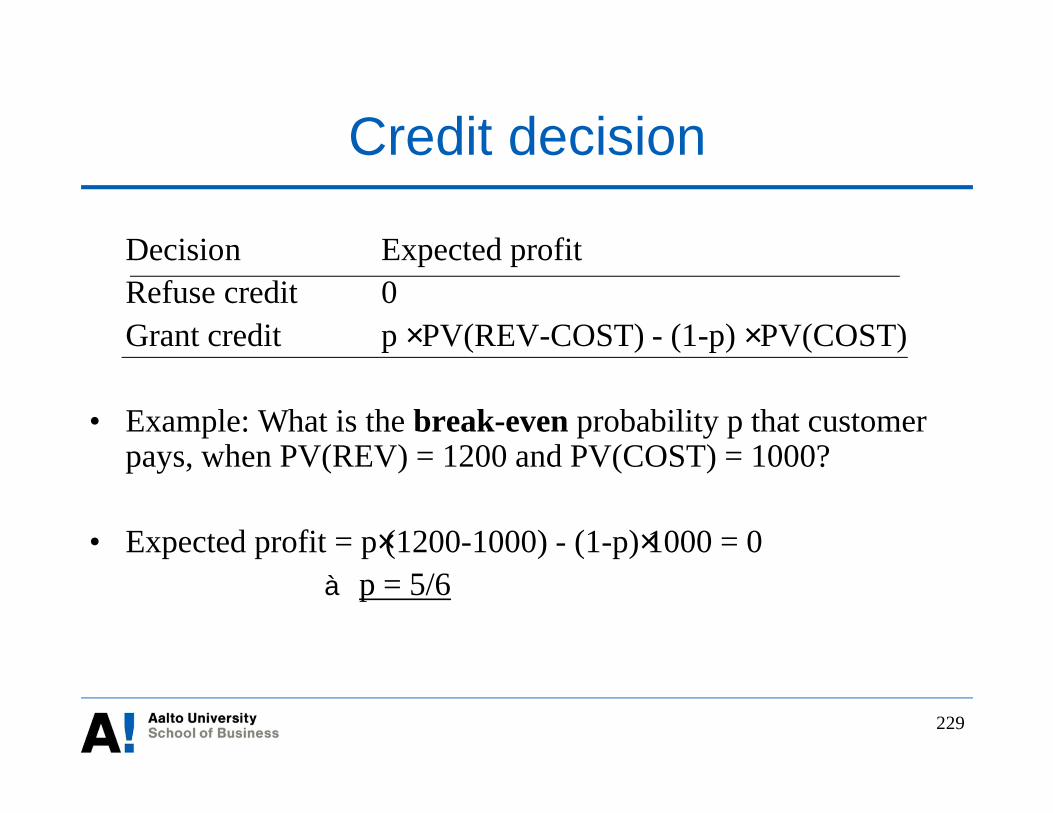
229
Credit decision
Decision Expected profitRefuse credit 0Grant credit p × PV(REV-COST) - (1-p) × PV(COST)
• Example: What is the break-even probability p that customerpays, when PV(REV) = 1200 and PV(COST) = 1000?
• Expected profit = p×(1200-1000) - (1-p)×1000 = 0à p = 5/6
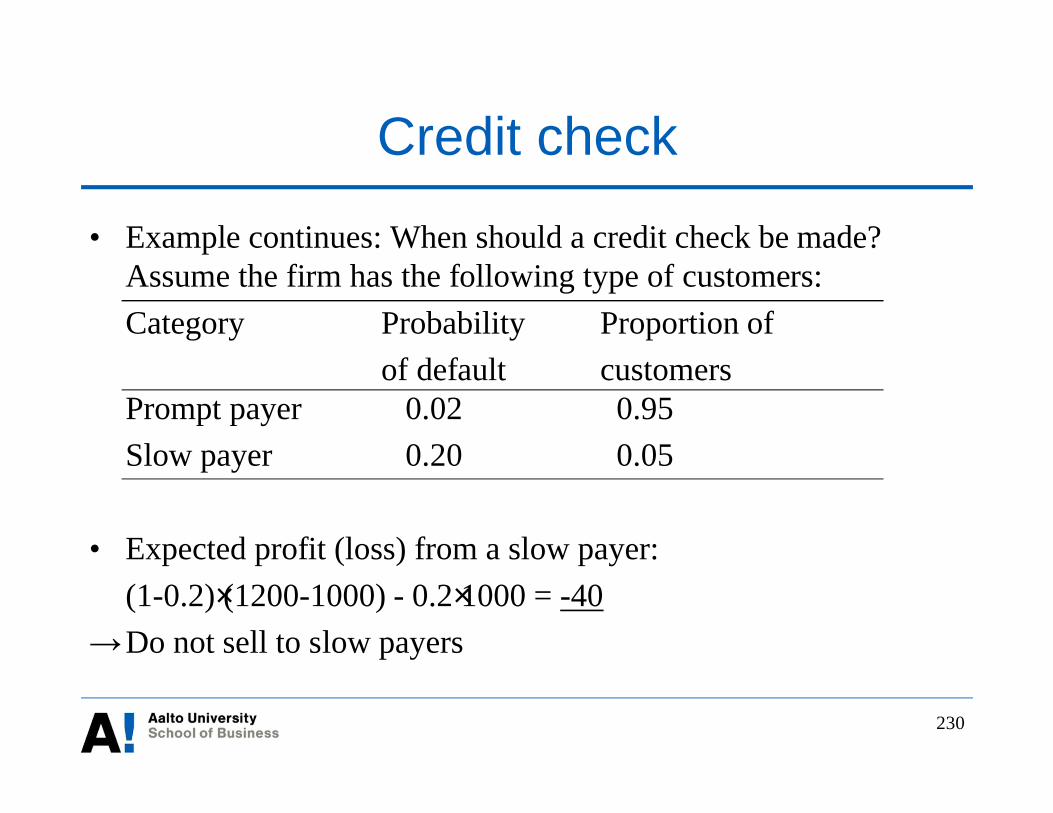
230
Credit check
• Example continues: When should a credit check be made?Assume the firm has the following type of customers:Category Probability Proportion of
of default customersPrompt payer 0.02 0.95Slow payer 0.20 0.05
• Expected profit (loss) from a slow payer:(1-0.2)×(1200-1000) - 0.2×1000 = -40Do not sell to slow payers
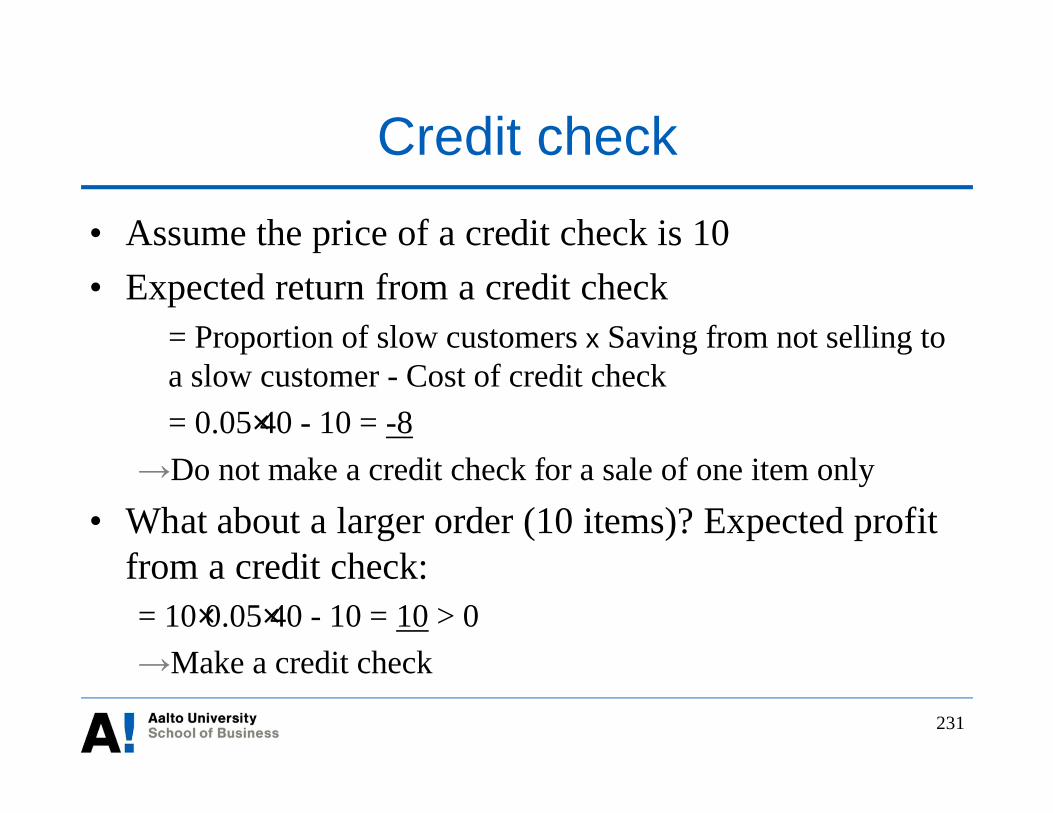
231
Credit check
• Assume the price of a credit check is 10• Expected return from a credit check
= Proportion of slow customers x Saving from not selling toa slow customer - Cost of credit check= 0.05×40 - 10 = -8Do not make a credit check for a sale of one item only
• What about a larger order (10 items)? Expected profitfrom a credit check:= 10×0.05×40 - 10 = 10 > 0
Make a credit check

232
Repeat order and credit decision
• Example continues: What if there is a chance of repeatorders?
• Assume• A new customer will pay with probability 0.8 Using the
earlier result, the expected profit from the initial order is -40• Customer will purchase again next year if she pays for her
first order• Conditional probability of the second payment is 0.95• Suppose discount rate is 20%
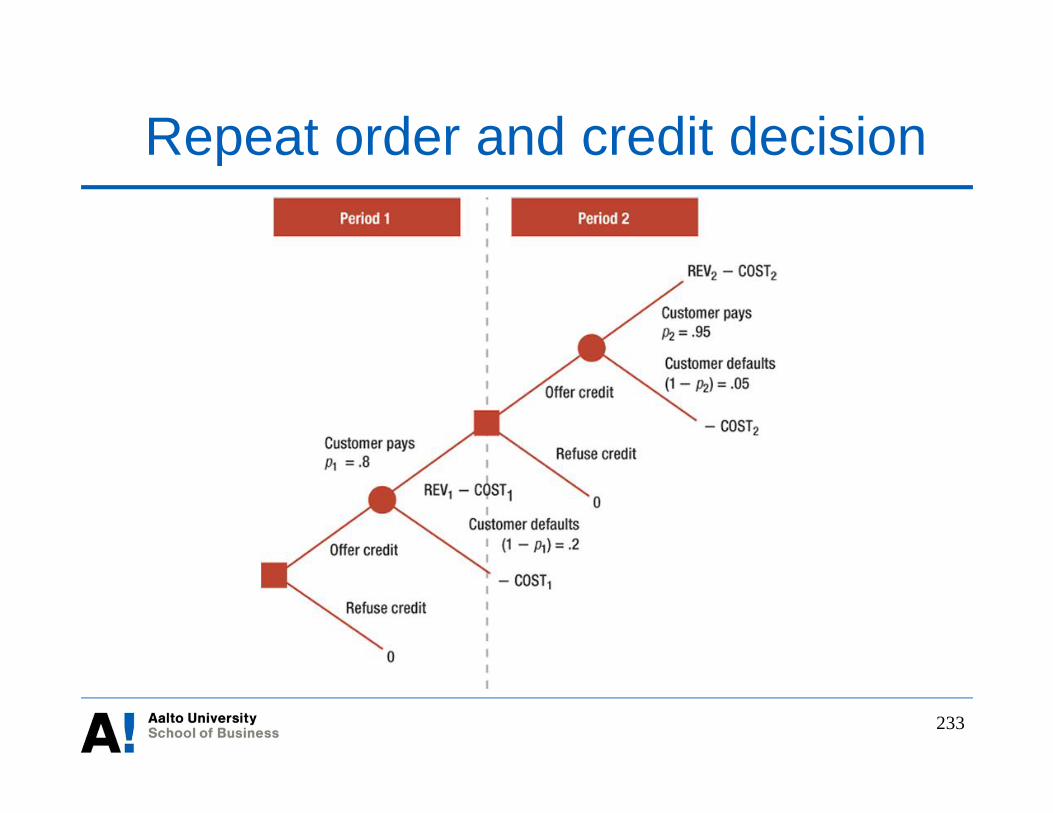
233
Repeat order and credit decision

234
Repeat order and credit decision
• Next year’s expected profit on repeat order:• p2 PV(REV2 - COST2) - (1-p2)PV(COST2)
= 0.95×200 - (1-0.95)×1000 = 140• Taking into account both the initial order and the
repeat order, we obtain:• Total expected profit = Expected profit on initial order
+ Probability of payment and repeat orderx PV (Next year’s expected profit on repeat order)= -40 + 0.80×140/1.2 = 53.33
The customer should be extended credit
235
General principles of credit decisions
• The goal is to maximize profit (NPV), notminimize bad accounts
• Concentrate on large and doubtful applications• Look beyond the immediate order
236
Cash Management
• Personal cash management:• How much cash do you need per month?• Typical amount withdrawn from ATM?• Personal cost for withdrawing from ATM?• Opportunity cost of holding cash?
• Trade-off: Carrying costs vs. order costs• Cash holding vs. investing in short-term securities• Benefits of large cash balance: Liquidity, low transaction costs• Cost of large cash balance: Lost interest income
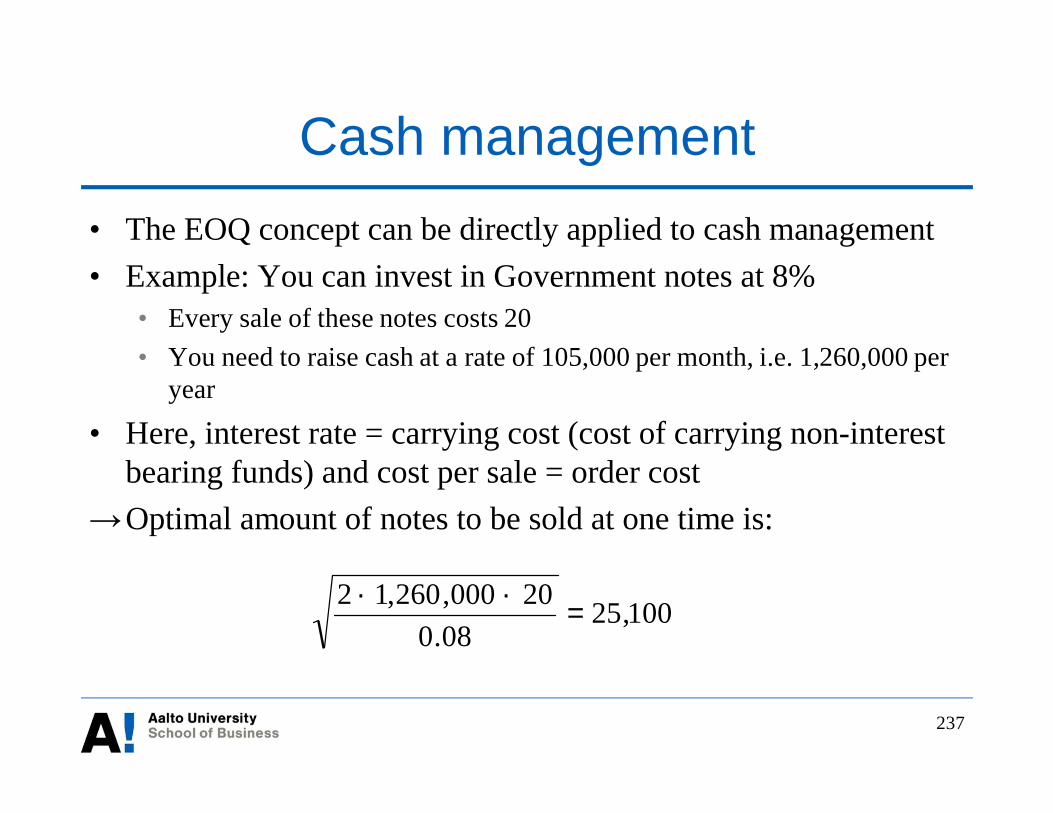
237
Cash management• The EOQ concept can be directly applied to cash management• Example: You can invest in Government notes at 8%
• Every sale of these notes costs 20• You need to raise cash at a rate of 105,000 per month, i.e. 1,260,000 per
year
• Here, interest rate = carrying cost (cost of carrying non-interestbearing funds) and cost per sale = order costOptimal amount of notes to be sold at one time is:
100,2508.0
20000,260,12=
´´

238
Cash management• The notes will have to be sold
• 105,000 / 25,100 = 4.2 times a month• The average cash balance will be
• 25,100 / 2 = 12,550• The above relationships hold only if the firm uses its
cash balance evenly over time• Large firms have subsidiaries each holding cash balances
• To avoid transaction costs paid to outsiders, these cashbalances tend to be centralized all subsidiaries are eitherlending or borrowing at the same time

239
How purchases are paid for
Percentage oftotal volume ofcashlesstransactions in2010

240
Lecture 10
Mergers and acquisitions (M&As)

241
Overview
• M&As: key concepts• Theories of M&As• Dubious motives for M&As• Estimating NPV of M&As• Winner’s curse in acquisitions• Stock price reaction• Risks of M&As• M&A waves
242
Definitions• Market for corporate control
• The mechanism by which firms are matched up with owners and management teamswho make the most of the firm’s resources
• Proxy contests to elect a new board of directors, takeovers or leveraged buyouts are theinstruments enabling changes in control
• Corporate restructuring• Set of actions taken to expand or contract a firm’s operations or to change its asset or
financial structure• Merger
• Transaction forming one economic unit from two or more previous ones• Acquisition
• Purchase of a controlling interest in the firm, generally via a tender offer for thetargeted shares
• Tender offer: One party asks the shareholders of a firm to tender the shares of the firm

243
Mergers and acquisitions (M&As) -Worldwide
Source: Thomson Financial, Institute of Mergers, Acquisitions and Alliances

Largest M&A deals - Worldwide
244
Rank Year Acquiror** Target** Transaction Value(bil. USD)
Transaction Value(bil. EUR)
1 1999 Vodafone AirTouch PLC Mannesmann AG 202.8 204.8
2 2000 America Online Inc Time Warner 164.7 160.7
3 2007 Shareholders Philip Morris Intl Inc 107.6 68.1
4 2007 RFS Holdings BV ABN-AMRO Holding NV 98.2 71.3
5 1999 Pfizer Inc Warner-Lambert Co 89.2 84.9
6 1998 Exxon Corp Mobil Corp 78.9 68.4
7 2000 Glaxo Wellcome PLC SmithKline Beecham PLC 76.0 74.9
8 2004 Royal Dutch Petroleum Co Shell Transport & Trading Co 74.6 58.5
9 2000 AT&T Inc BellSouth Corp 72.7 60.2
10 1998 Travelers Group Inc Citicorp 72.6 67.2
Source: Thomson Financial, Institute of Mergers, Acquisitions and Alliances

245
Mergers and acquisitions - U.S.
Source: Thomson Financial, Institute of Mergers, Acquisitions and Alliances

246
Mergers and acquisitions in Europe
Source: Thomson Financial, Institute of Mergers, Acquisitions and Alliances
247
Types of Acquisitions• Financial acquirers
• Make a return on their investment by re-selling parts of theacquired business
• Strategic (synergistic) acquirers• Keep what they buy and add it to the business they already own• They can pay more than financial acquirers, because the latter
have no strategic synergies
• Hostile acquisition• Present management of target is against the bidder
• Friendly acquisition• Present management of target is in favor of the bidder

248
Types of M&As
• Horizontal• Combining companies in the same line of business
• Vertical• Combining companies from different stages in the supply
chain, that is, a supplier and its customer, vice versa• E.g. pulp-paper, oil drilling - oil refining - gasoline stations
• Conglomerate• Combining companies in unrelated types of business
activities

249
Theories of mergers
(1) Efficiency(1.1) Operating synergy
• Economies of scale; e.g. a big paper mill is likely to bemore cost efficient than a small one
• Complementary resources; large mature firm teaming upwith small innovative target
(1.2) Financial synergy• Economies of scale in security offerings• Lower distress costs: higher debt capacity and larger
interest tax shields(1.3) Adjusting quickly to new environment

250
Theories of mergers
(1.4) Differential managerial efficiency• Management of the acquiring firm may have excess capacity
and more talent than management of the acquired company(1.5) Diversification and internal labor market
• Provides managers and other employees with job securityand opportunities for promotion, resulting in lower laborcosts

251
Theories of mergers(2) Agency problems
• Managerialism: Managers are motivated to increase the sizeof the firm, resulting in merger activity
• Free cash flow hypothesis: Firms tend to use their free cashflows to purchase other companies
• Takeovers are a solution to agency problems which cannotbe resolved otherwise
(3) Hubris hypothesis• Bidders make errors in evaluating the acquired companies• They may think that they make a good deal when they
actually do not(4) Market power and higher profit margins
252
Theories of mergers
(6) Redistribution• Increases in leverage redistributes wealth from bondholders
to stockholders• Renegotiating salaries and other benefits is a wealth transfer
from employees to stockholders(7) Misvaluation
• In the absence of complete information, investors may over-or under-value a firm.
• Acquirers can profit by buying undervalued targets for cashat a price below their intrinsic value or with stock as long astheir stock is more overvalued than target’s
253
Dubious motives for mergers
• Mergers allow to diversify risks in severalindustries• Investors can do this more easily and cheaply than
the company
• BUT: owners of closely-held companies may find itworthwhile to diversify if they do not want to losetheir control in the company
254
Dubious motives for mergers
• Mergers decrease the cost of debt capital• When two companies merge, the probability that one of them
goes bankrupt decreasesDebt has a better security and the cost of debt capitaldecreases
• BUT: because of the decrease in the probability ofbankruptcy, equity loses some of its option characteristics
• Value of equity will decrease• This will eliminate the benefit arising from the decreased interest
costs
• Nevertheless, the expected bankruptcy costs will decrease

255
Dubious motives for mergers• Mergers increase EPS (Bootstrap effect)
• Example: Assume that a merger does not increase thecombined value of the firms (i.e., no synergies)
Firm A Firm B Combined ABV 4,000,000 2,000,000 6,000,000Earnings 200,000 200,000 400,000N 100,000 100,000 150,000P 40 20 40EPS 2 2 2.67P/E 20 10 15E/P 0.05 0.1 0.0667

euro
256
Dubious motives for mergers
+ EPS increases- Average growth rateof the merged companyAB decreases from thatof A
AB
A
B
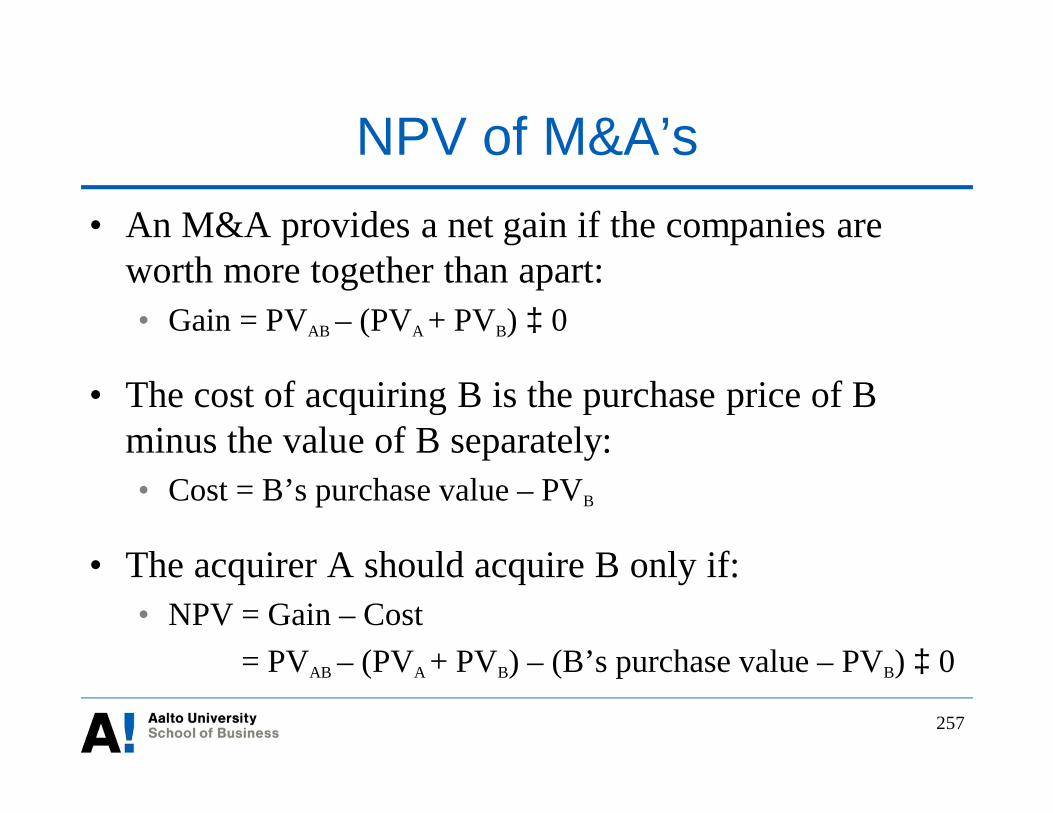
257
NPV of M&A’s• An M&A provides a net gain if the companies are
worth more together than apart:• Gain = PVAB – (PVA + PVB) ³ 0
• The cost of acquiring B is the purchase price of Bminus the value of B separately:• Cost = B’s purchase value – PVB
• The acquirer A should acquire B only if:• NPV = Gain – Cost
= PVAB – (PVA + PVB) – (B’s purchase value – PVB) ³ 0

258
NPV of M&A’s
• Example: A offers 160,000 shares for all of B's shares• If B accepts A's offer, the companies can generate net
savings whose present value is 4.75 million• A's stock price before deal announcement is 75 (1 million
shares outstanding) and B's market value 9 million• The cost would appears to be:
• 160,000 × 75 - 9,000,000 = 3,000,000
• A's and B's joint market value is:• 1,000,000 × 75 + 9,000,000 + 4,750,000 = 88,750,000
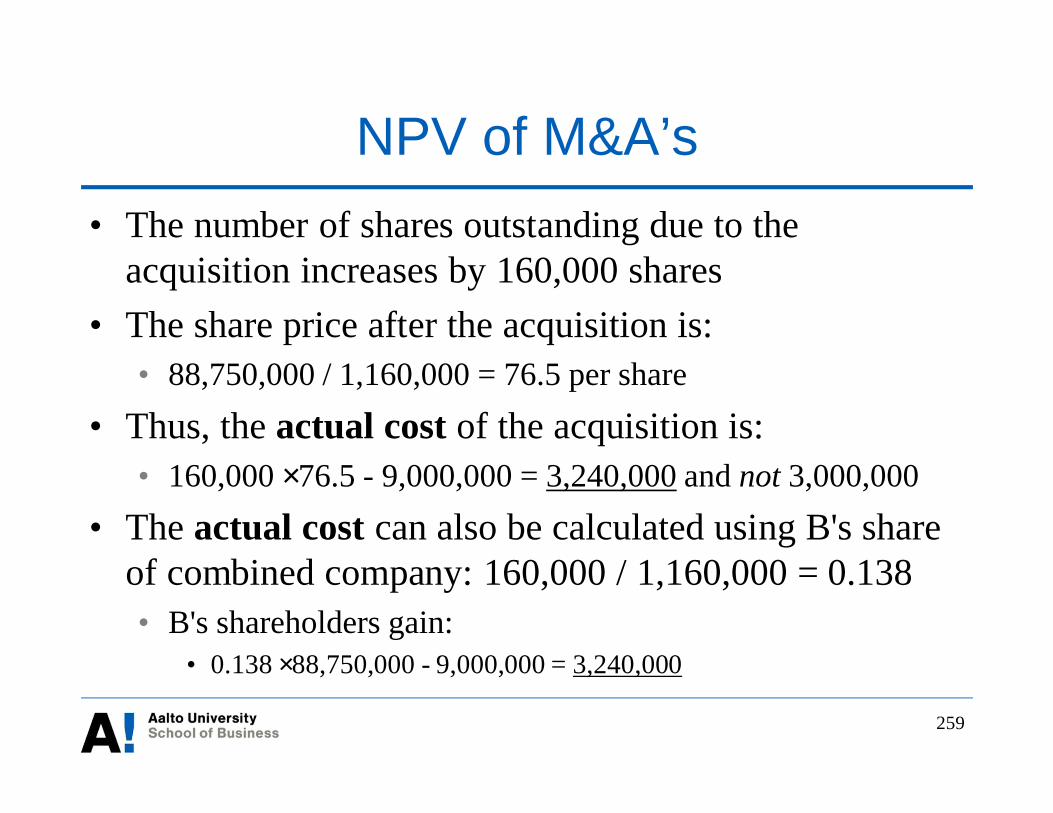
259
NPV of M&A’s• The number of shares outstanding due to the
acquisition increases by 160,000 shares• The share price after the acquisition is:
• 88,750,000 / 1,160,000 = 76.5 per share• Thus, the actual cost of the acquisition is:
• 160,000 × 76.5 - 9,000,000 = 3,240,000 and not 3,000,000• The actual cost can also be calculated using B's share
of combined company: 160,000 / 1,160,000 = 0.138• B's shareholders gain:
• 0.138 × 88,750,000 - 9,000,000 = 3,240,000
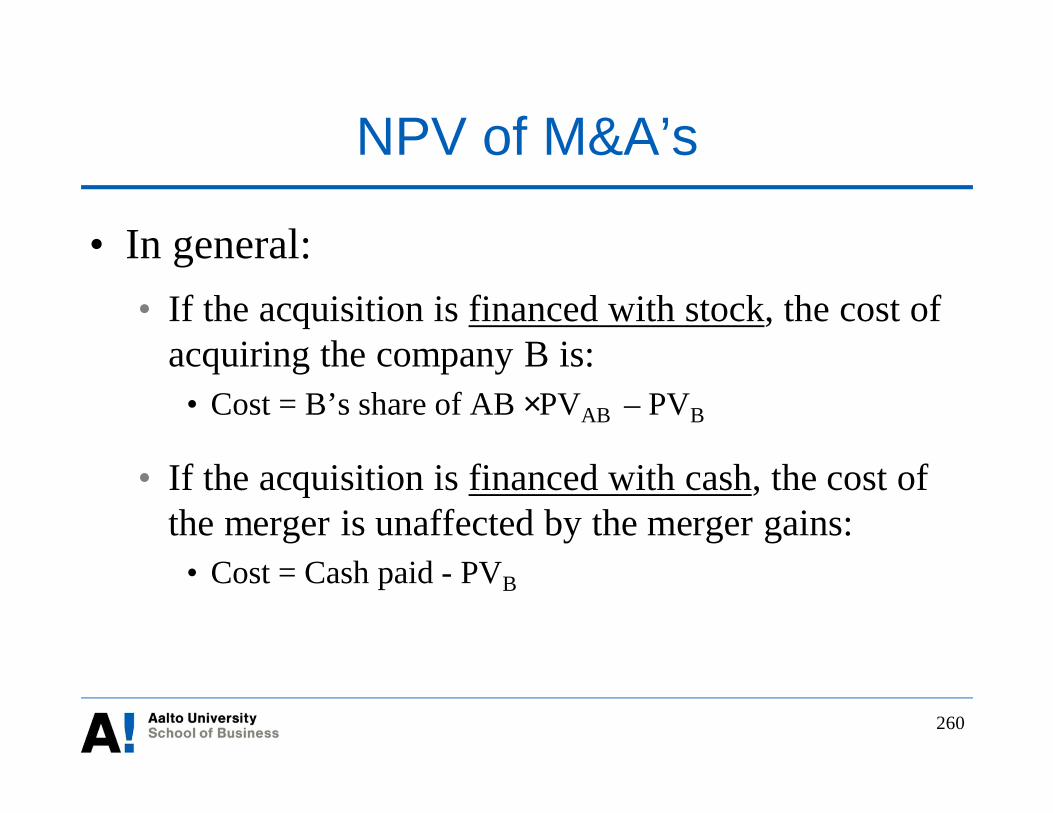
260
NPV of M&A’s
• In general:• If the acquisition is financed with stock, the cost of
acquiring the company B is:• Cost = B’s share of AB × PVAB – PVB
• If the acquisition is financed with cash, the cost ofthe merger is unaffected by the merger gains:
• Cost = Cash paid - PVB
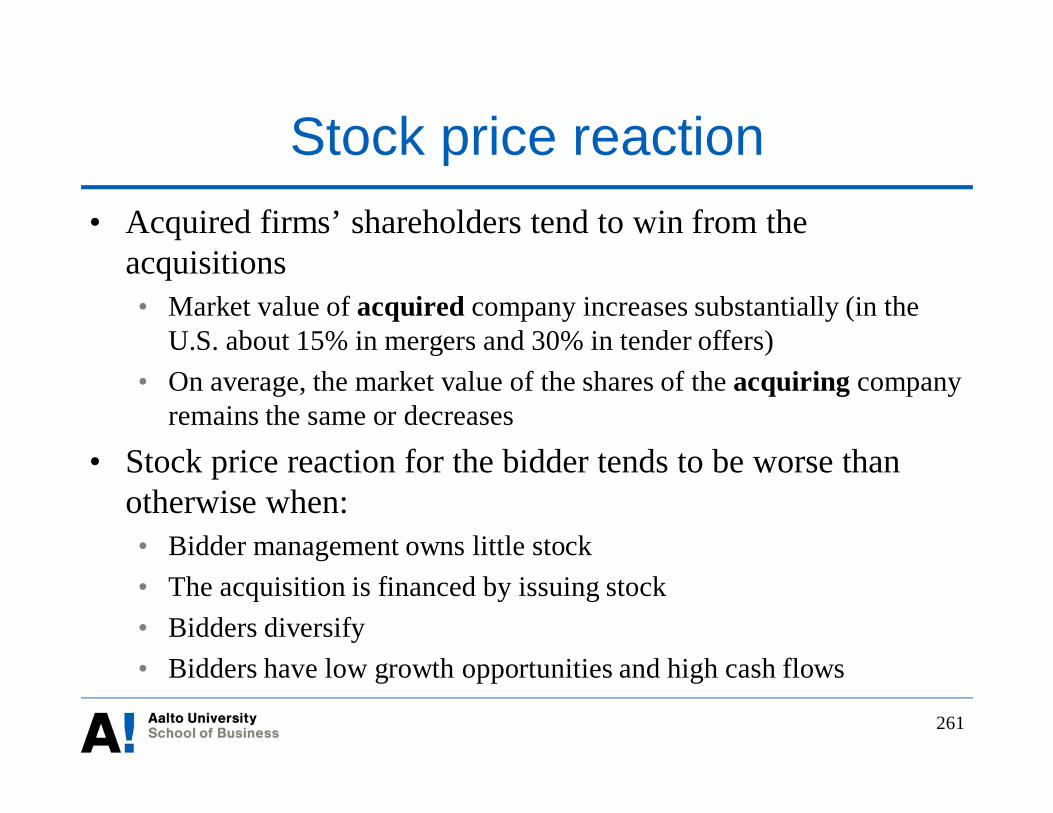
261
Stock price reaction• Acquired firms’ shareholders tend to win from the
acquisitions• Market value of acquired company increases substantially (in the
U.S. about 15% in mergers and 30% in tender offers)• On average, the market value of the shares of the acquiring company
remains the same or decreases
• Stock price reaction for the bidder tends to be worse thanotherwise when:• Bidder management owns little stock• The acquisition is financed by issuing stock• Bidders diversify• Bidders have low growth opportunities and high cash flows

262
Source: Yahoo Finance
Stock price reaction:Case of Microsoft-Nokia

263
Winner’s curse in mergers• In an efficient market: evaluate an acquisition by
asking why the company would be worth morecombined than separately• If target firm has several potential acquirers, you should not
bid for a company if it is not worth more to you than toothers
• Winner's curse: If you pay the most of manycompeting potential acquirers, you are likely to haveoverestimated the value of the target company most
If you "win" the buying competition, you may be "cursed"because you have paid too much

264
Risks of mergers• Many, if not most, acquisitions are not value-enhancing
deals for the buyer, and some of them are disastrous• There are many risks that are often difficult to assess before
the deal• The following types of acquisitions are particularly
risky:• Acquisitions without sufficient strategic fit• Large acquisitions• Cross-border acquisitions• Acquisitions of companies whose most important assets are
human capital

265
Merger waves
• M&A activity tends to be clustered over time• Merger waves tend to occur when stock prices are at
historically high levels• Sector-related changes/shocks vs. valuation errors
The Economist (2008)
266
Lecture 11
Growth and value creation through M&AsGuest lecturer: Timo Pohjakallio
267
Lecture 12
Control, governance and corporaterestructuring

268
Overview
• Corporate control, governance and takeovers• Key concepts• Methods for resisting takeovers
• Leveraged buy-outs (LBOs)• Management buy-outs
• Sell-offs• Key concepts• Reasons for sell-offs
• Reasons to use advisory services

269
The role of corporate control
• The market for corporate control• Internal control mechanisms: board members, proxy fights• External control mechanisms: takeovers, leveraged buyouts
• When inefficient management is deeply entrenched, enable forcefulchange in control through hostile takeovers
• The mere threat of takeover can be an importantmeans for disciplining management
A well-functioning market for corporate control can helpoverall corporate efficiencyBut, there are defense mechanisms at targeted management’sdisposal to reduce the threat

270
What makes a firm vulnerable to hostiletakeover
• Powerful but value-destroying management due toincompetence or misaligned interests (because, e.g.,managers hold little or no stock in the firm) leading to:• A low stock price in relation to the replacement cost of assets
(a.k.a. q-ratio) or their potential earning power or cash flow• A highly liquid balance sheet with large amounts of excess
cash, a valuable securities portfolio, and significant unuseddebt capacity
• Subsidiaries or properties which could be sold off for betteruse and without significantly impairing cash flow

When internal control fails:The case of Disney
• Michael Eisner took over in 1984 as CEO and chairman• In the 80s and early 90s, Disney was revitalized; success brought
monarchic power and monarchic power was corrupting• Some board members appointed during his tenure: Irwin Russell
(Eisner's personal attorney); Architect Robert Stern (designed buildingsfor both Disney and Eisner); Reveta F. Bowers (elementary-schoolprincipal of Eisner's now-grown children); and E. Cardon Walker andRaymond L. Watson (both former Disney chairmen)
• Disney’s acquisition of ABC in 1995 led to problems along with otherbad decisions (such as not pursuing, e.g., the Sixth Sense, Lord of therings, The Sopranos, CSI etc.)Disney’s stock price drops significantly making it target of anunsolicited bid by Comcast (nation’s largest cable operator) in 2004
271

272
Methods for resisting takeovers• Pre-offer defenses
• Shark-repellent charter amendments• Staggered board• Supermajority rule• Cap the number of votes an investor can cast at the
shareholders’ meeting• Issue shares with less voting power (leaving the shares
with superior voting power with initial owners)• Require that the acquirer needs to make a tender offer of
the rest of the shares if it acquires a pre-specified fraction(say, third) of the shares

273
Methods for resisting takeovers• Pre-offer defenses, continues
• Poison pills• E.g. if the takeover succeeds, allow purchase of the merged firm’s
shares at a substantial discount• Restructuring
• Distribute special dividends• Leveraged recapitalization
– Dispersed shareholders receive a large one-time cash dividend andmajor shareholders/managers receive new shares instead of a cashdividend
– Cash dividend is financed mostly by borrowed funds
• Golden parachutes: substantial benefits collected by topmanagers if their employment is terminated through a takeover

274
Methods for resisting takeovers
• Post-offer defenses• Buy assets that the acquirer does not want• Increase employee stock ownership or issue shares to a more
“friendly” third party / ask a white knight (non-hostilebidder) to step in
• Legal action (antitrust laws, securities laws)• Threat of resignation of key people• Ask unions to fight against the acquirer• Make a repurchase offer to the party trying to take the
company over
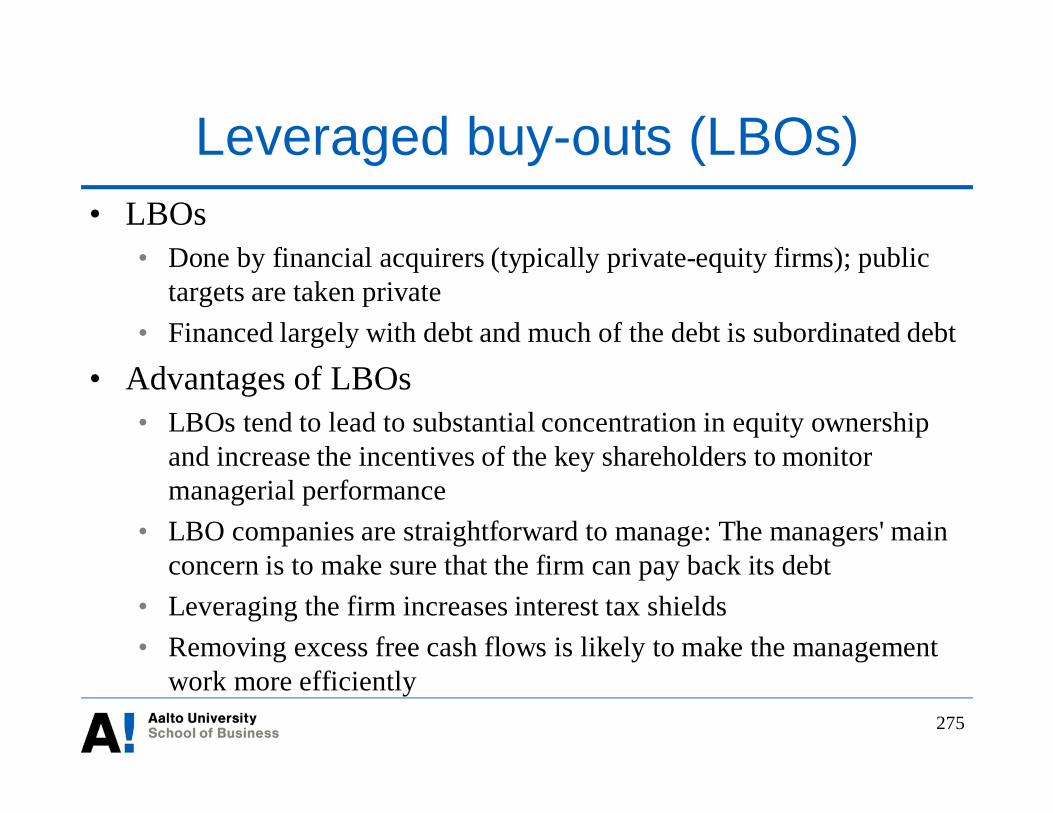
275
Leveraged buy-outs (LBOs)• LBOs
• Done by financial acquirers (typically private-equity firms); publictargets are taken private
• Financed largely with debt and much of the debt is subordinated debt
• Advantages of LBOs• LBOs tend to lead to substantial concentration in equity ownership
and increase the incentives of the key shareholders to monitormanagerial performance
• LBO companies are straightforward to manage: The managers' mainconcern is to make sure that the firm can pay back its debt
• Leveraging the firm increases interest tax shields• Removing excess free cash flows is likely to make the management
work more efficiently
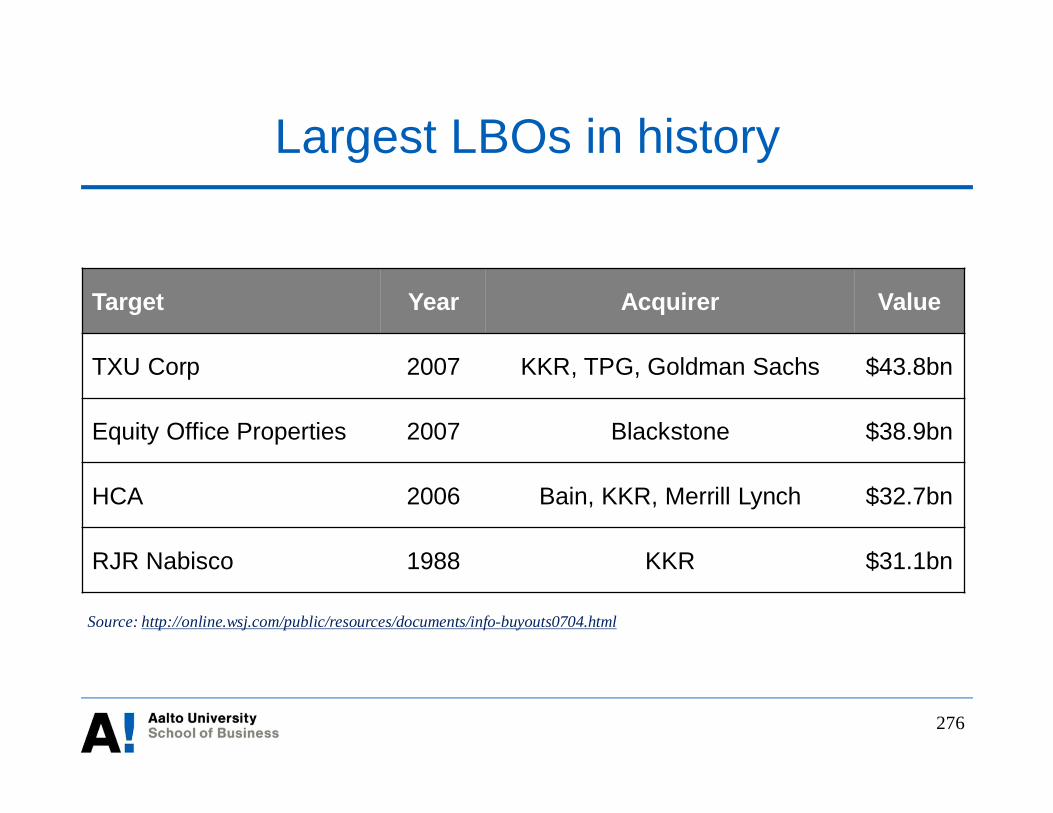
276
Largest LBOs in history
Target Year Acquirer Value
TXU Corp 2007 KKR, TPG, Goldman Sachs $43.8bn
Equity Office Properties 2007 Blackstone $38.9bn
HCA 2006 Bain, KKR, Merrill Lynch $32.7bn
RJR Nabisco 1988 KKR $31.1bn
Source: http://online.wsj.com/public/resources/documents/info-buyouts0704.html
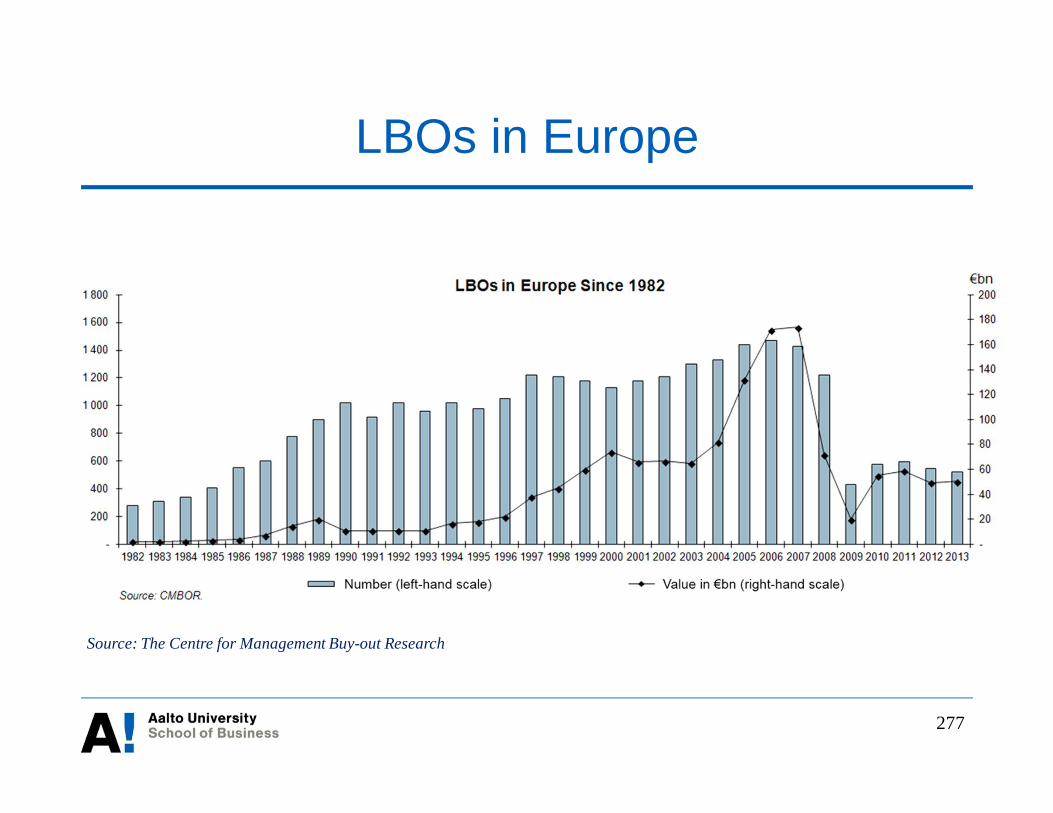
277
LBOs in Europe
Source: The Centre for Management Buy-out Research
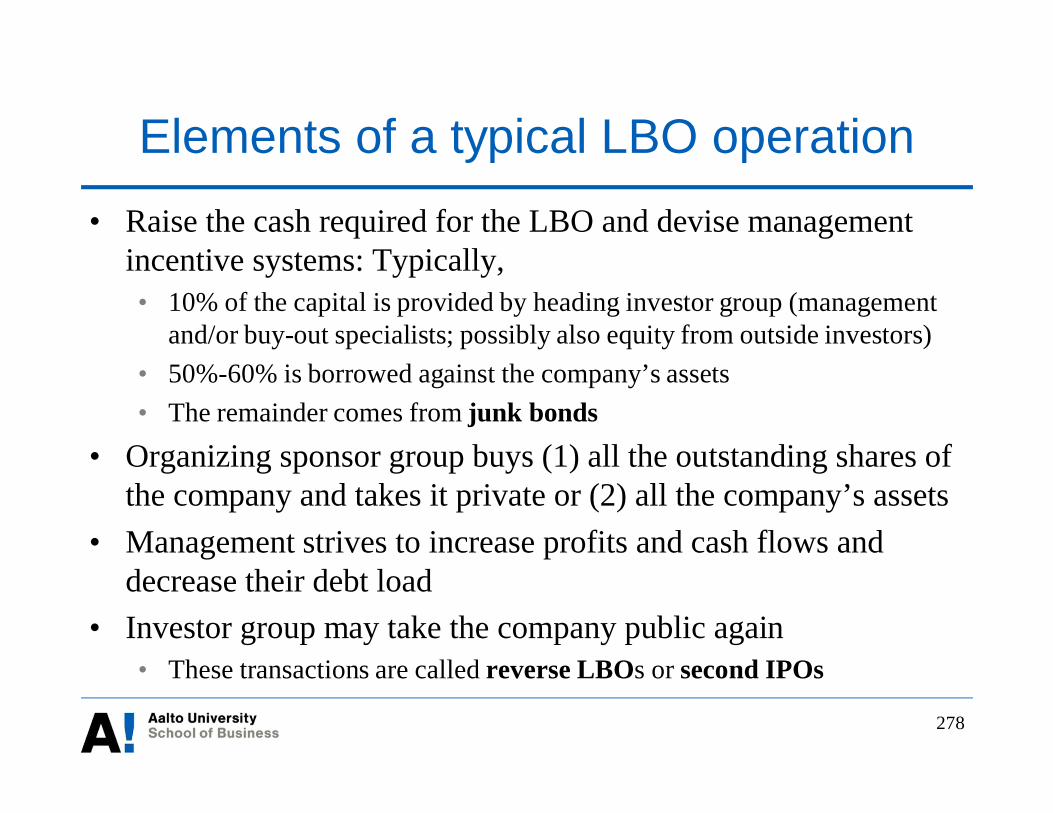
278
Elements of a typical LBO operation• Raise the cash required for the LBO and devise management
incentive systems: Typically,• 10% of the capital is provided by heading investor group (management
and/or buy-out specialists; possibly also equity from outside investors)• 50%-60% is borrowed against the company’s assets• The remainder comes from junk bonds
• Organizing sponsor group buys (1) all the outstanding shares ofthe company and takes it private or (2) all the company’s assets
• Management strives to increase profits and cash flows anddecrease their debt load
• Investor group may take the company public again• These transactions are called reverse LBOs or second IPOs
279
Consequences of LBOs
• Company productivity and operating performancetypically improve substantially in the yearsimmediately following the buyout
• Existing stockholders typically gain 40% or more froma LBO• Pre-buyout bondholders tend to suffer losses, but these losses
account for only a small fraction of the stockholder gains• Many advisors have advised LBO transactions which
make little economic sense or have been overpricedA number of LBO firms have become over-levered andsuffered from financial distress

280
Other ways of changing ownership andcontrol: sell-offs
• Spin-off: Creates a separate new legal entity, whose sharesare distributed on a pro rata basis to existing shareholders
• Split-off: A portion of the shareholders receives stocks of asubsidiary in exchange for parent company stock
• Split-up: The entire firm is broken up in a series of spin-offs so that the parent no longer exists and only the newoffspring survive
• Divestiture: Sale of part of the firm to an outside party• Equity carve-out (a.k.a partial IPO): Sale of a subsidiary
of the firm through a public equity offering
281
Reasons for sell-offs• Achieves a better business fit and sharpens management focus• Insufficient incentives for subsidiary’s management to perform• Changing economic environment• Information: True value of a subsidiary is hidden behind the
parent business structure• Creates pure-plays that have unique investment appeal
• E.g. a firm may include two separate businesses, one with low riskseasoned properties and another with risky new property development
• They may attract different investor clienteles as separate but beunattractive as a combination
• Facilitate mergers when the bidder is interested only in a subsetof a target's operations
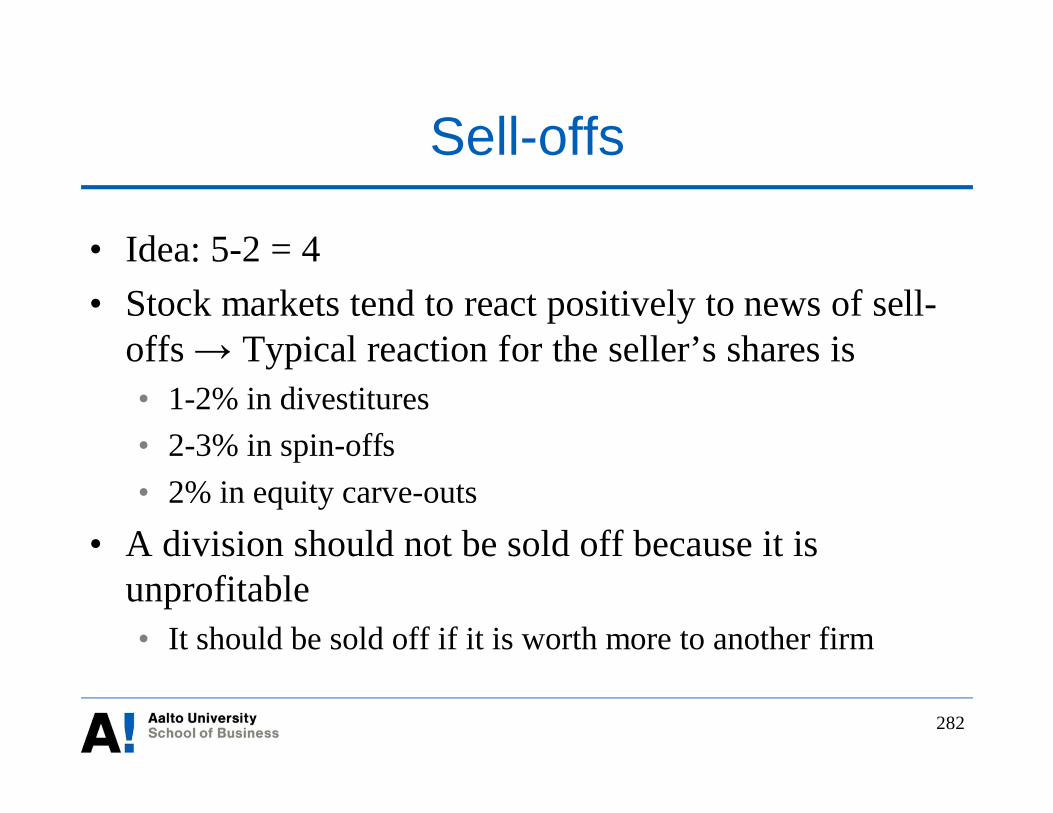
282
Sell-offs
• Idea: 5-2 = 4• Stock markets tend to react positively to news of sell-
offs Typical reaction for the seller’s shares is• 1-2% in divestitures• 2-3% in spin-offs• 2% in equity carve-outs
• A division should not be sold off because it isunprofitable• It should be sold off if it is worth more to another firm

283
Why do firms use advisory services incorporate restructuring?
• (1) Specialists can value companies and make bids atlower costs than acquirersThis is likely to happen particularly if• The transaction is complex
• The size of the transaction is large• Payment is not in cash only• Acquirer is not the first bidder• The target resists the acquisition
• The acquirer has little prior acquisition experience

284
Why do firms use advisory services incorporate restructuring?
• (2) Specialists reduce the information asymmetriesbetween targets and acquirersThis is particularly valuable when• The acquisition is in an unrelated industry or the target is a
conglomerate• The acquirer is the first bidder
• (3) Specialists can reduce the agency problemsbetween the acquiring firm, its managers, and itsshareholdersThis is particularly valuable when management/boardownership in the company is small


