Adriano Alessandrini,Francesco Filippi, Fernando Ortenzi
Consumption calculation of vehicles using OBD data
www.ctl.uniroma1.it [email protected]
CTL introduction
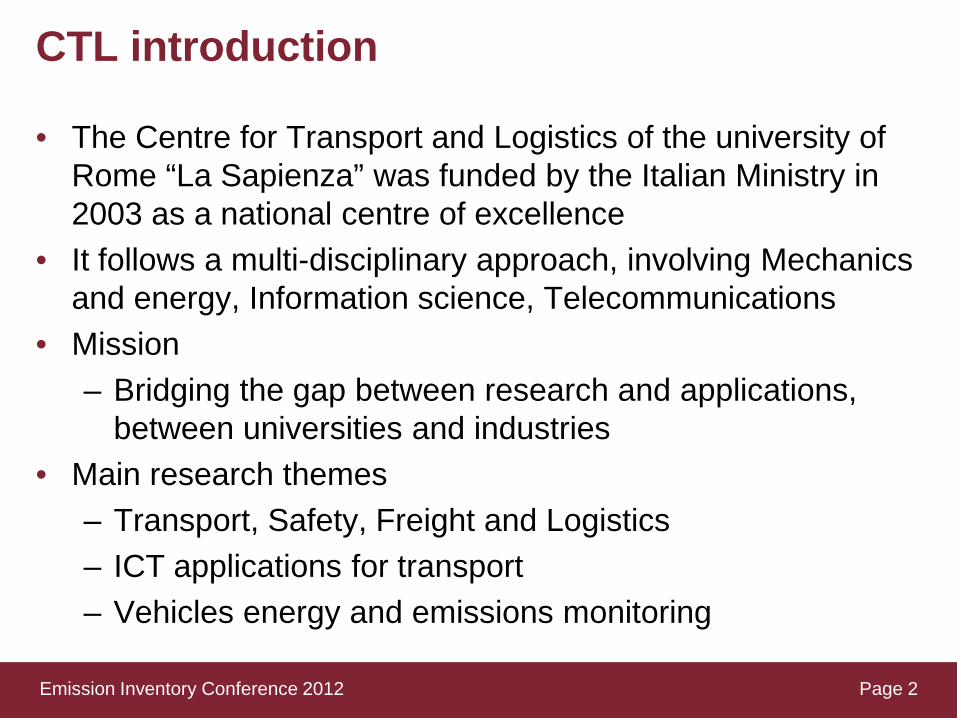
• The Centre for Transport and Logistics of the university of Rome “La Sapienza” was funded by the Italian Ministry in 2003 as a national centre of excellence
• It follows a multi-disciplinary approach, involving Mechanics and energy, Information science, Telecommunications
• Mission – Bridging the gap between research and applications,
between universities and industries • Main research themes
– Transport, Safety, Freight and Logistics – ICT applications for transport – Vehicles energy and emissions monitoring
Page 2 Emission Inventory Conference 2012

27/08/2012 Pagina 3
Contents
Method and models to calculate instantaneous power and consumption • On-board tool • Available onboard sensors • Power calculation • Consumption calculation • Accuracy of the models
Emission Inventory Conference 2012

The Onboard Unit
Emission Inventory Conference 2012 Page 4

Available sensors on-board
• Vehicle speed • Rpm • Accelarator pedal • Engine Load% • Intake Airflow • Air/fuel Ratio • Coolant Temperature • Catalyst Temperature • ………..
Page 5 Emission Inventory Conference 2012

OBD Parameters: Calculated Engine Load
• Reaches 1 at full open throttle for any altitude, temperature and pressure or rpm for both naturally aspirated and boosted engines;
• Indicated percent of peak available torque; • Linearly correlated with engine vacuum; • Often used to schedule power enrichment. • Compression ignition engines (Diesels) shall support this
parameter using fuel flow in place of airflow.
Page 6
( )273
29892.29
_
__
+⋅⋅
=
ambTBaroRpmAirflowMax
AirFlowCurrentLoadEngine
Emission Inventory Conference 2012
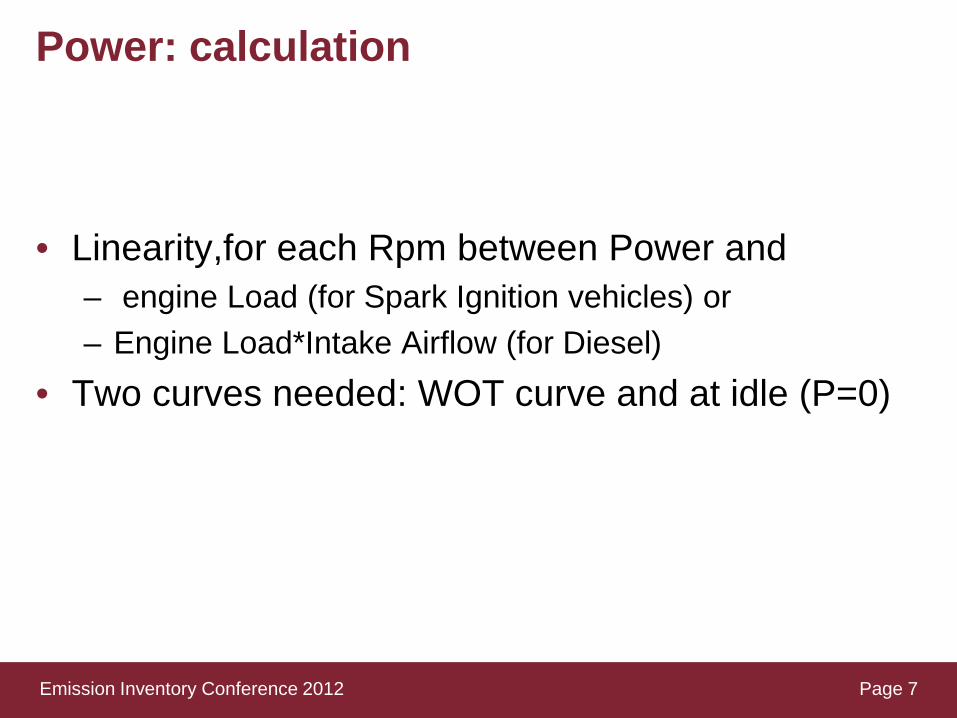
Power: calculation
• Linearity,for each Rpm between Power and – engine Load (for Spark Ignition vehicles) or – Engine Load*Intake Airflow (for Diesel)
• Two curves needed: WOT curve and at idle (P=0)
Page 7 Emission Inventory Conference 2012
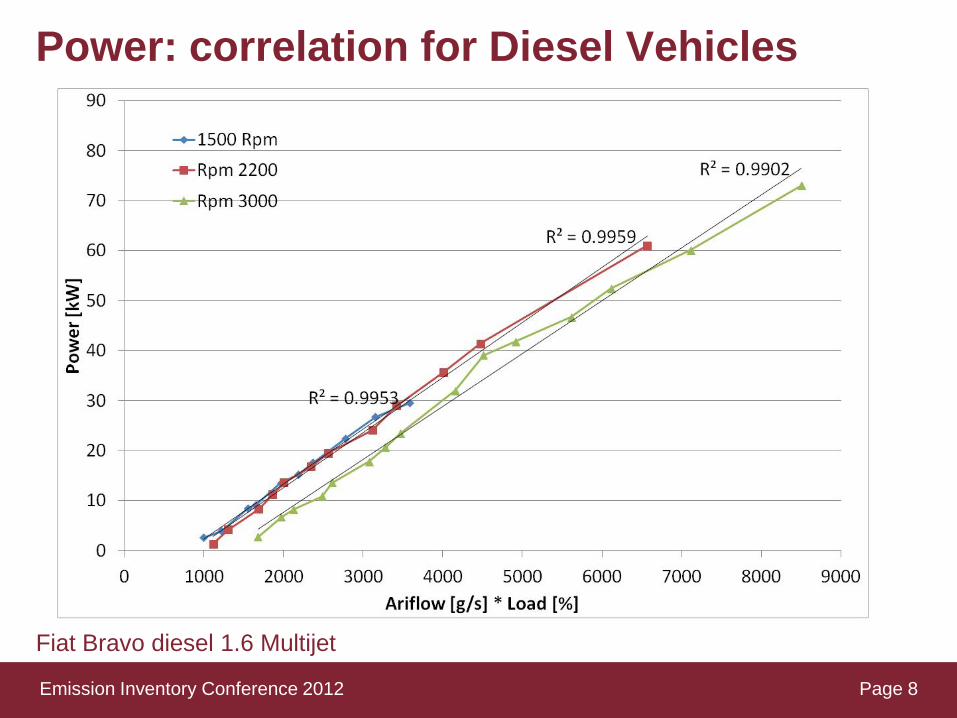
Power: correlation for Diesel Vehicles
Page 8
Fiat Bravo diesel 1.6 Multijet
Emission Inventory Conference 2012

Power: correlation for Spark Ignition Vehicles
Page 9 Emission Inventory Conference 2012

Consumption: Formulation
• Calculated directly from PID or • Calculated by:
– Airflow • Read from OBD • Calculated
– Air/Fuel Ratio • Read from OBD • Calculated
Page 10 Emission Inventory Conference 2012

Intake Airflow: Calculation (Spark ignition vehicles)
• Linearity correlation between airflow and engine
load (or engine Load*airflow for diesel): – Maximum and minimum values are measured (at full
load and idle) for each rpm – linear interpolation at fixed Rpm between the extreme
points
Page 11
( )( ) ( )idleactual
idleWOT
idleWOTidleactual LoadLoad
LoadLoadAirFlowAirFlowAirFlowAirFlow −⋅
−−
+=
Emission Inventory Conference 2012

Intake Airflow: Correlation (Honda Civic 2.0 SI)
Page 12 Emission Inventory Conference 2012
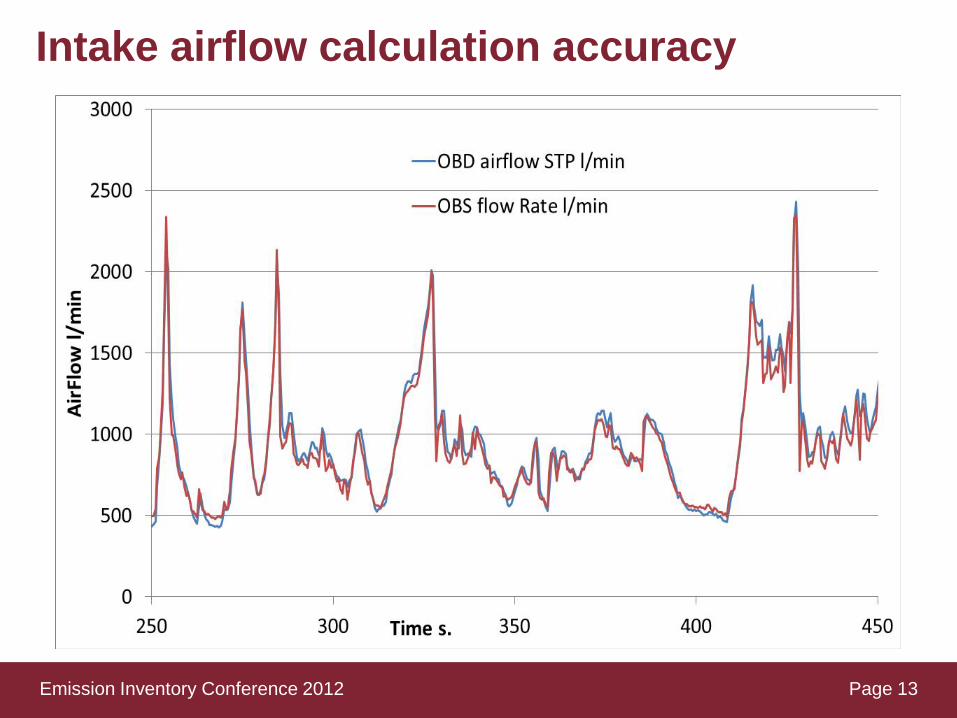
Intake airflow calculation accuracy
Page 13 Emission Inventory Conference 2012

Air/fuel ratio for spark ignition vehicles
• Measured by OBD or • Calculated:
– Full load: λ=λ(rpm) – Cut-off: λ=λmax (~∞) – Partial Loads: stoichiometric (~1) (with fuel enrichment with accelerator pedal gradients).
Page 14 Emission Inventory Conference 2012

Lambda measured (Honda Civic Hybrid)
Page 15 Emission Inventory Conference 2012

Consumption: Diesel vehicles
• Variable with: – engine load – Intake airflow
Page 16
( ) ( ) bLoadAirflowahlFuelFlow +⋅⋅=
Emission Inventory Conference 2012

Consumption: Correlation (Diesel)
Page 17 Emission Inventory Conference 2012
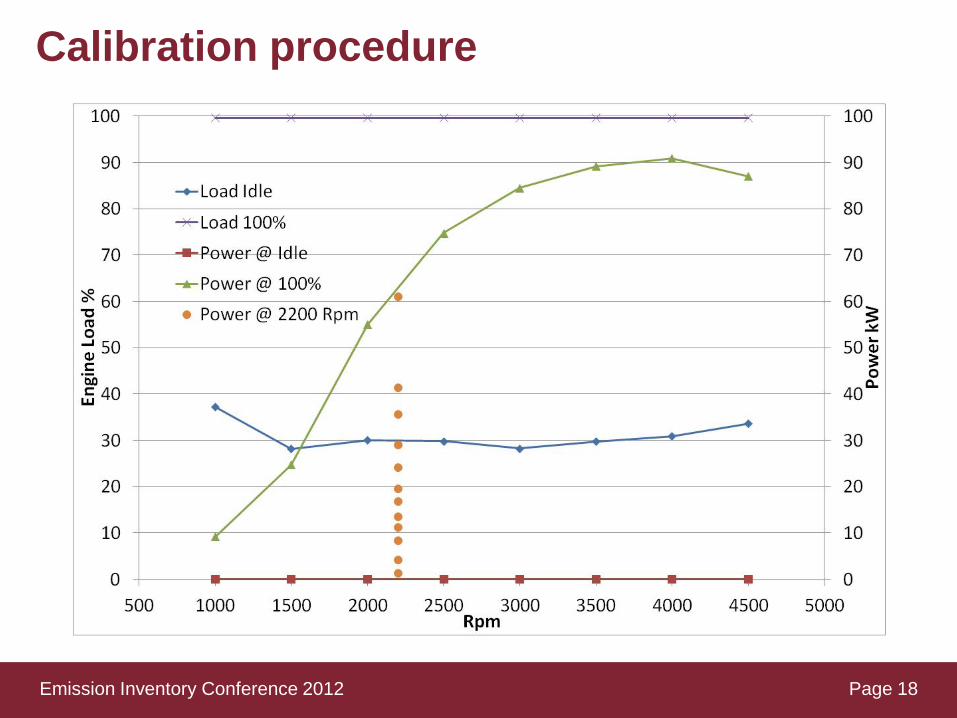
Calibration procedure
Page 18 Emission Inventory Conference 2012

Consumption: Diesel Vehicles
Vehicle Sensors used MeasurementSystem Error %
Fiat Punto Diesel
Fiat Protocol OBS 0.71 AirFlow OBS 0.06
Fiat 500 Fiat Protocol CVS 3.184 AMA 3.07
Ford Focus Airflow OBS 3.25 Fiat Bravo Airflow OBS 2.93
Page 19 Emission Inventory Conference 2012

Consumption: Spark Ignition Vehicles
Vehicle Sensors used
Measurement System
Error %
Alfa Romeo 147 1.6 Airflow CVS 3.8
Honda Civic Hybrid Airflow, AFR CVS 4.00
Fiat 500 1.2 Fiat Protocol OBS 2.37
Page 20 Emission Inventory Conference 2012

Conclusions
• OBD data can be used as input to calculate instantaneous power and consumption of vehicles
• OBD sensors have been validated and have good accuracies to be used
• If not available on-board, airflow and air/fuel ratio can be calculated using rpm, engine Load and other parameters always available;
• Models have been validated on a dynamometer chassis with different vehicles and driving cycles.
• Consumption, for both Spark ignition an diesel Vehicles have errors always lower than 4% for the vehicles tested
Page 21 Emission Inventory Conference 2012