Idling Fuel Consumption and Emissions of Public Vehicles run by Bhaktapur Minibus Sewa Samiti and its Reduction Possibilities Ravi Suwal 1 , Bhakta Bahadur Ale 2 1 Department of Applied Science, Pulchowk Campus, Tribhuvan University, Nepal 2 Department of Mechanical Engineering, Pulchowk Campus, Tribhuvan University, Nepal Corresponding authors: [email protected] and [email protected] Received: Nov 8, 2018 Revised: Jan 26, 2019 Accepted: Jan 28, 2019 Abstract: This research paper is carried out to analyze the idling fuel consumption and emissions of public vehicles of Bhaktapur Minibus Sewa Samiti (BMSS) and quantify the reduction possibilities of idling emission. In order to reduce the air pollution in Kathmandu Valley, low carbon technology like idling reduction has become necessity. Idling of passenger vehicle is mainly due to waiting for passengers at the bus stops and stopped by traffic. Idling contributes significantly to energy consumption without any useful output. Many researchers found that idling is harmful to engine and increases maintenance. For that, idling data of different routes were collected and fuel consumption were tested using pseudo method. These data were used to calculate the total idling time, fuel consumption, GHG emissions and financial loss in the routes. Idling time was as high as an hour in a trip. About 18% to 32 % of idling time was due to traffic only and the traffic were high at day (11 am – 5 pm) and evening. The idling fuel consumption and GHG emissions were 117.56 ml to 181.16 ml and 0.31 kg to 0.478 kg per trip in the routes of BMSS respectively. Using 3 minutes of limit, the fuel consumption and emissions could be reduced by 22.48 ml to 59.45 ml and 0.059 kg to 0.157 kg per trip respectively. Rs. 943,783 out of Rs. 3,214,872 of financial loss could be saved in selected routes annually. Key words: Idling, Fuel consumption, GHG emissions, Route, Traffic, Bus stop 1. Introduction The poor planning and management of development led to frequent traffic jams, especially during office hours, which results vehicle fuel consumption and emission much higher than expected. Although the automobile industry is the major contributor of air pollutions in big cities like Kathmandu Valley, it is difficult to imagine the world without it. So low carbon technology like idling reduction has become necessity. Idling of passenger vehicle is mainly due to waiting for passengers at the bus stop or outside a business and stop at red lights, stopped by traffic and during traffic jam. When idling, the engine runs without any loads except the engine accessories. So, idling contributes significantly to energy consumption without any useful work. The most important facts about idling is, it gets you nowhere. Idling reduces the vehicle’s fuel economy, costs more money, and creates pollution without any outcome. Out of 9,019,400 tons of oil equivalent Journal of the Institute of Engineering July 2019, Vol. 15 (No. 2): 155-164 © TUTA/IOE/PCU, Printed in Nepal TUTA/IOE/PCU

Welcome message from author
This document is posted to help you gain knowledge. Please leave a comment to let me know what you think about it! Share it to your friends and learn new things together.
Transcript
155
then it is clear that Col 𝑈𝑈 = Col 𝐴𝐴 & Row 𝑊𝑊 = Row 𝑉𝑉𝑇𝑇 = Col 𝑉𝑉 = Row 𝐴𝐴, in according with (2), therefore the columns of 𝐴𝐴 are all linear combinations of the columns of 𝑈𝑈, and the rows of 𝐴𝐴 are all linear combinations of the rows of 𝑊𝑊 In [2], there is the factorization of (1) for the particular case 𝑛𝑛 𝑚𝑚 and 𝑝𝑝 𝑛𝑛 that is, for singular square matrices.
3. Conclusion
Our approach shows that the Singular Value Decomposition gives a natural full-rank factorization for an arbitrary matrix, which is useful to determine the Moore-Penrose pseudoinverse [1, 10, 14].
References
[1] Ben-Israel A and Greville TNE (2003), Generalized inverses: Theory and applications, Springer, New York, USA.
[2] Frazer RA, Duncan WJ and Collar AR (1963), Elementary matrices and some applications to dynamics and differential equations, Cambridge University Press.
[3] Gaftoi V, López-Bonilla J and Ovando G (2007), Singular value decomposition and Lanczos potential, in “Current topics in quantum field theory research”, Ed. O. Kovras, Nova Science Pub., New York, Chap. 10, 313-316.
[4] Guerrero-Moreno I, López-Bonilla J and Rosales-Roldán L (2012), SVD applied to Dirac super matrix, The SciTech, J. Sci. & Tech. (India), Special Issue, 111-114.
[5] Jordan C (1874), Mémoire sur les forms bilinéaires, J. de Mathématiques Pures et Appliquées, Deuxiéme Série, 19: 35-54.
[6] Kalman D (1996), A singularly valuable decomposition: The SVD of a matrix, The College Mathematics Journal, 27: 2-23.
[7] Lanczos C (1958), Linear systems in self-adjoint form, Am. Math. Monthly, 65(9): 665-679. [8] Lanczos C (1960), Extended boundary value problems, Proc. Int. Congr. Math. Edinburgh-
1958, Cambridge University Press, 154-181. [9] Lanczos C (1966), Boundary value problems and orthogonal expansions, SIAM J. Appl. Math.,
14(4): 831-863. [10] Lanczos C (1997), Linear differential operators, Dover, New York, USA. [11] Ruhe A (1998), Commentary on Lanczos ‘Linear systems in self-adjoint form’, Cornelius
Lanczos Collected Published Papers. Vol. V, North Carolina State University, North Carolina, USA, 213.
[12] Schwerdtfeger H (1960), Direct proof of Lanczos decomposition theorem, Am. Math. Monthly, 67(9): 855-860.
[13] Stewart GW and Sun J (1990), Matrix perturbation theory, Academic Press, San Diego. [14] Thapa GB, Lam-Estrada P and López-Bonilla J (2018), On the Moore-Penrose generalized
inverse matrix, World Scientific News, 95: 100-110.
Idling Fuel Consumption and Emissions of Public Vehicles run by Bhaktapur Minibus Sewa Samiti
and its Reduction Possibilities
Ravi Suwal1, Bhakta Bahadur Ale2
1Department of Applied Science, Pulchowk Campus, Tribhuvan University, Nepal2Department of Mechanical Engineering, Pulchowk Campus, Tribhuvan University, Nepal
Corresponding authors: [email protected] and [email protected]
Received: Nov 8, 2018 Revised: Jan 26, 2019 Accepted: Jan 28, 2019
Abstract: This research paper is carried out to analyze the idling fuel consumption and emissions of public vehicles of Bhaktapur Minibus Sewa Samiti (BMSS) and quantify the reduction possibilities of idling emission. In order to reduce the air pollution in Kathmandu Valley, low carbon technology like idling reduction has become necessity. Idling of passenger vehicle is mainly due to waiting for passengers at the bus stops and stopped by traffic. Idling contributes significantly to energy consumption without any useful output. Many researchers found that idling is harmful to engine and increases maintenance. For that, idling data of different routes were collected and fuel consumption were tested using pseudo method. These data were used to calculate the total idling time, fuel consumption, GHG emissions and financial loss in the routes. Idling time was as high as an hour in a trip. About 18% to 32 % of idling time was due to traffic only and the traffic were high at day (11 am – 5 pm) and evening. The idling fuel consumption and GHG emissions were 117.56 ml to 181.16 ml and 0.31 kg to 0.478 kg per trip in the routes of BMSS respectively. Using 3 minutes of limit, the fuel consumption and emissions could be reduced by 22.48 ml to 59.45 ml and 0.059 kg to 0.157 kg per trip respectively. Rs. 943,783 out of Rs. 3,214,872 of financial loss could be saved in selected routes annually.
Key words: Idling, Fuel consumption, GHG emissions, Route, Traffic, Bus stop
1. Introduction
The poor planning and management of development led to frequent traffic jams, especially during office hours, which results vehicle fuel consumption and emission much higher than expected. Although the automobile industry is the major contributor of air pollutions in big cities like Kathmandu Valley, it is difficult to imagine the world without it. So low carbon technology like idling reduction has become necessity. Idling of passenger vehicle is mainly due to waiting for passengers at the bus stop or outside a business and stop at red lights, stopped by traffic and during traffic jam. When idling, the engine runs without any loads except the engine accessories. So, idling contributes significantly to energy consumption without any useful work. The most important facts about idling is, it gets you nowhere. Idling reduces the vehicle’s fuel economy, costs more money, and creates pollution without any outcome. Out of 9,019,400 tons of oil equivalent
Journal of the Institute of Engineering July 2019, Vol. 15 (No. 2): 155-164
© TUTA/IOE/PCU, Printed in NepalTUTA/IOE/PCU
156 Idling Fuel Consumption and Emissions of Public Vehicles run by Bhaktapur Minibus Sewa Samiti and ...
(ToE) of energy consumed for first eight months, among which 18.7 % were petroleum products in 2017/18 [5]. Nepal’s total energy consumption was 12.87 million ToE in fiscal year 2016/17, out of the total energy consumption, 2.088 million ToE were due to petroleum products [5]. The petroleum product use had been increased to 16.2 % of total energy consumption in 2016/17 [5] from 8.2 % in 2008/09 [13]. According to Nepal Oil Corporation, in fiscal year 2074/75, the import of Diesel fuel was 1,588,869 kL, which was 20 % more than previous year [10]. Moreover, the rate of fuel has been increasing day by day, which increases financial loss and price hike in everything. So the purpose of the research is to analyze the exhaust fuel consumption and emissions of public vehicles of Bhaktapur Minibus Sewa Samiti (BMSS) in the idle mode and to quantify the reduction possibilities of fuel consumption and emission due to idling. For that, Bhaktapur Minibus Sewa Samiti and its routes were selected as study site.
2. Literature Review
According to Department of Transport Management, the number of bus and minibus registered in Bagmati zone have reached 10379 and 9835 respectively in last fiscal year 2072/73 [9]. A report on Data Collection Survey on Traffic Improvement in Kathmandu Valley by JICA (2012) have forecasted that total trips in the valley would be 5,456 thousand/day in 2022 by 1.59 times of the present (2011) [7]. Many researchers from Nepal as well as abroad have studied the environmental pollution in Kathmandu valley and have proved that one of the major polluter in Kathmandu valley is Transport Sector. During the study of 19 heavy-duty trucks, including 15 diesel and 4 gasoline trucks, ABM S. Khan et al. (2009) found that the gasoline trucks consumed substantially more fuel at an hourly rate (0.84 gal/h) than their diesel counterparts (0.44 gal/h) during idling [8]. According to Argonne National Laboratory (2009), the average sleeper cab tractor idles 6 hours per day, 300 days a year, burning nearly 1 gallon of diesel fuel an hour or about 1,800 gallons annually [3].
Idling for more than 10 seconds consumes more fuel than restarting it [6, 11]. The operator manual of TATA recommend to stop the engine and start it again, if you have to wait for more than a minute, e.g. at Traffic Signals [12]. Further, truck idling emits, annually, 11 million tons of carbon dioxide (a major greenhouse gas), 180,000 tons of nitrogen oxides (precursor to ozone formation), 5,000 tons of fine particulate matter (likely carcinogen), and other harmful air toxics [2]. There are 600 intersections in Delhi so fuel loss (in rupees) per day due to idling of vehicles in Delhi (2013) is Rs 35,406,547.09 [1]. The U. S. Environmental Protection Agency (EPA) estimates that long duration idling consumes over one billion gallons of fuel annually, at a cost of over $2.5 billion [2].
3. Methodology
Using random sampling, the idling time at different bus stops and traffics were recorded in selected routes of Bhaktapur Minibus Sewa Samiti. There were a total of 327 public buses registered in this organization. These buses were providing services to local peoples around Bhaktapur district through 13 routes. The vehicles running under this organization were registered after 2008 and most of them were not older than 2 years. During the study, there were 83 of TATA LP 709 Ex/38 model, 172 of LP 712 Ex/38 model and 22 of TATA Ultra Bus model, a total of 277 buses of TATA motors. A total of 49 buses manufactured by Mahindra and Mahindra were run by BMSS where 48 of them were Mahindra Tourister and 1 was Mahindra Loadking. Among 327 buses, one of them was 10.75 E Bus manufactured by Eicher company.
The fuel consumption by buses of engine capacity 3783 cc and 2609 cc during idling at no load
157 Suwal and Ale
were measured. For measuring fuel consumption, there is not any device available, so a pseudo method is used. Initially, the fuel tank was fully filled with diesel, and then the engine was started in idle mode with no load condition at garage. After certain time, the engine was stopped and the fuel used during the idling was observed. Then the fuel tank was refueled slowly using pipette with least count of 0.1 ml until the tank is fully filled up to initial condition. Then the fuel consumed during the refueling is the fuel used by the idling for that time period. This method was repeated at least 3 times each for 3783 cc and 2609 cc engine capacity.
These data will be used as fuel consumption during the idling. So that, these data can be used for idling fuel consumption of the BMSS in different routes and their idling fuel consumption per day. Further, these data will be used for finding the greenhouse emission due to idling. Similarly, the buses were restarted multiple times for each measurement and same as idling fuel consumption at restart were measured for restarting.
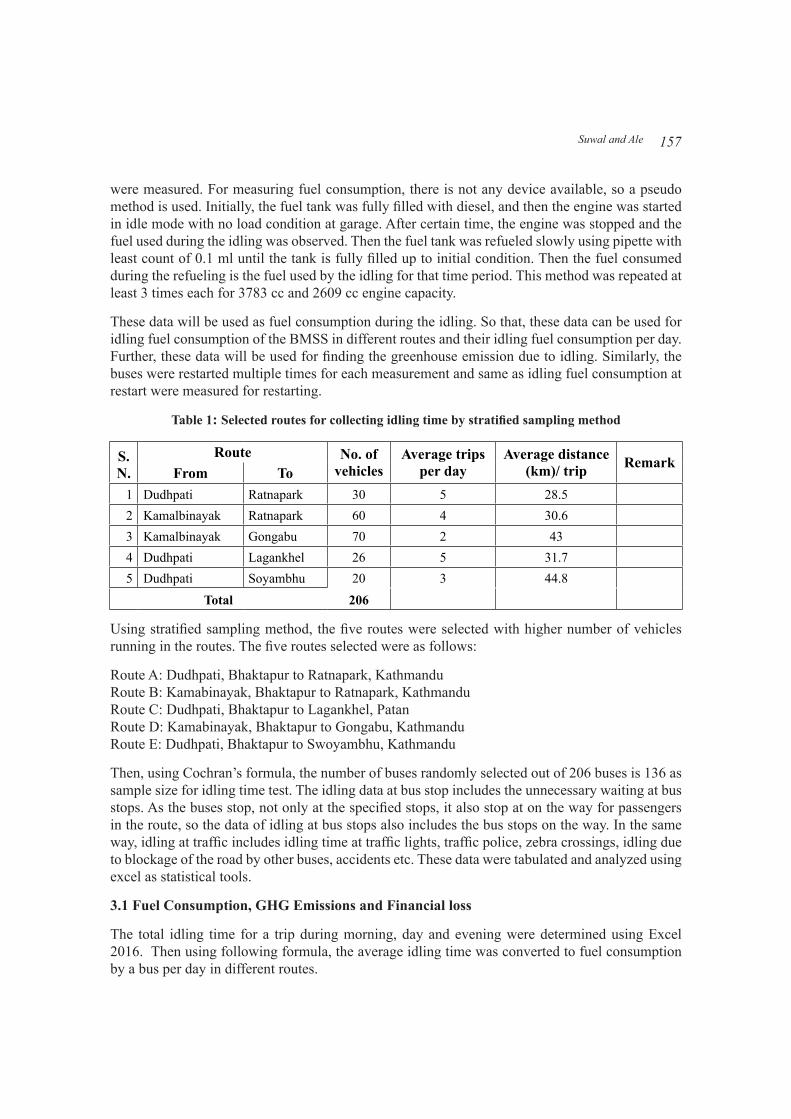
Table 1: Selected routes for collecting idling time by stratified sampling method
S. N.
Route No. of vehicles
Average trips per day
Average distance (km)/ trip Remark
From To1 Dudhpati Ratnapark 30 5 28.5 2 Kamalbinayak Ratnapark 60 4 30.6 3 Kamalbinayak Gongabu 70 2 43 4 Dudhpati Lagankhel 26 5 31.7 5 Dudhpati Soyambhu 20 3 44.8
Total 206
Using stratified sampling method, the five routes were selected with higher number of vehicles running in the routes. The five routes selected were as follows:
Route A: Dudhpati, Bhaktapur to Ratnapark, KathmanduRoute B: Kamabinayak, Bhaktapur to Ratnapark, KathmanduRoute C: Dudhpati, Bhaktapur to Lagankhel, PatanRoute D: Kamabinayak, Bhaktapur to Gongabu, KathmanduRoute E: Dudhpati, Bhaktapur to Swoyambhu, Kathmandu
Then, using Cochran’s formula, the number of buses randomly selected out of 206 buses is 136 as sample size for idling time test. The idling data at bus stop includes the unnecessary waiting at bus stops. As the buses stop, not only at the specified stops, it also stop at on the way for passengers in the route, so the data of idling at bus stops also includes the bus stops on the way. In the same way, idling at traffic includes idling time at traffic lights, traffic police, zebra crossings, idling due to blockage of the road by other buses, accidents etc. These data were tabulated and analyzed using excel as statistical tools.
3.1 Fuel Consumption, GHG Emissions and Financial loss
The total idling time for a trip during morning, day and evening were determined using Excel 2016. Then using following formula, the average idling time was converted to fuel consumption by a bus per day in different routes.
158 Idling Fuel Consumption and Emissions of Public Vehicles run by Bhaktapur Minibus Sewa Samiti and ...
Fuel Consumption by a bus per day (L/day) = average idling time in hour/trip * fuel consumption per hour * number of trip/ day
For the idling emissions of diesel vehicles, there are not any measuring instruments available for measuring pollutants so secondary method of determining the pollutants was used. The Carbon dioxide (CO2) emission for a liter diesel fuel is taken as 2.64 kg [3]. To determine the GHG emission following formula was used. GHG emission by a bus in a trip (kg/day) = 2.64 * fuel consumption by a bus per trip. For financial analysis, the fuel consumption cost of each bus per day in every route have been analyzed. The following formula was used to determine cost of fuel consumption by bus per day. Cost of fuel loss by bus per day (Rs./day) = cost of fuel /ltr* fuel consumption by a bus /dayThese data were further used to determine the fuel consumption, GHG emissions and financial loss in a year.
3.2 Reduction Possibilities
First, the time of idling equivalent to a single restart evaluated. Then, using this time of idling as base or minimum time of idling before restarting, the maximum possibility of reduction of idling were determined and its saving of fuel, GHG emissions and financial saving were determined. As this time was less and little impractical, another idling time was chosen which require less restart a day and more practical. Then, again the saving of fuel, reduction of GHG emission and cost saving were determined.
4. Results and Discussions
Most of the buses registered in Bhaktapur Minibus Sewa Samiti were manufactured in 2016.
4.1 Idling Time
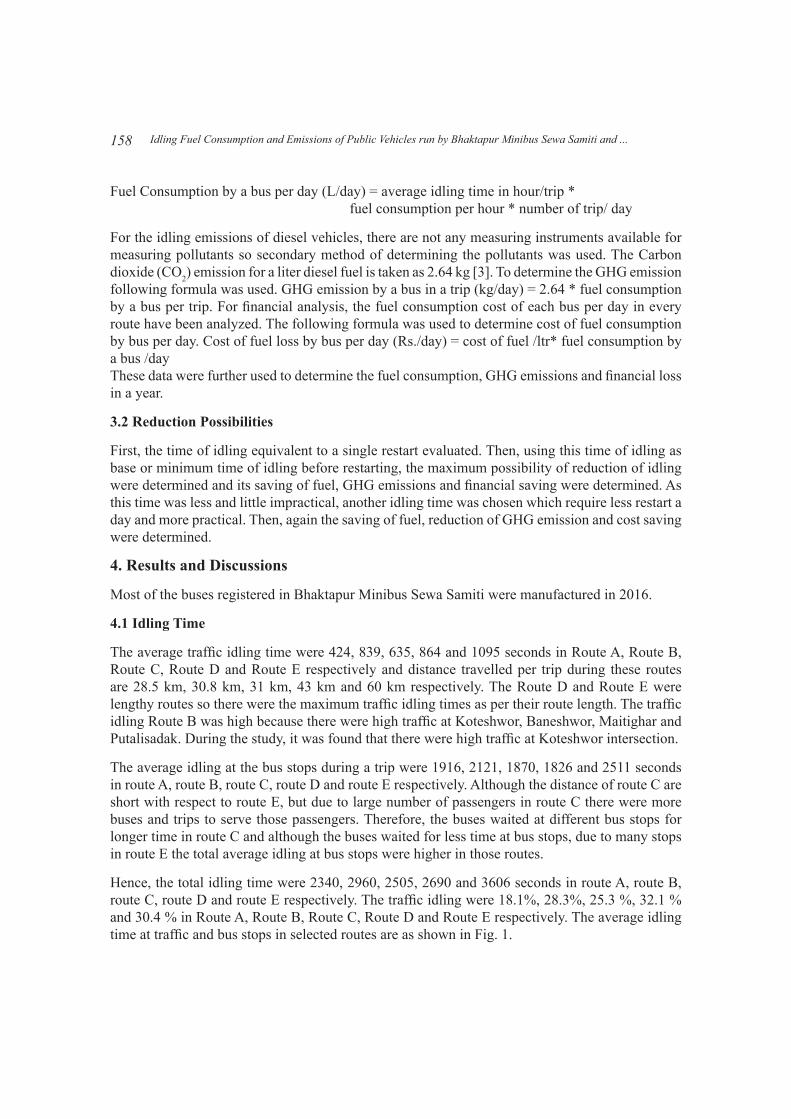
The average traffic idling time were 424, 839, 635, 864 and 1095 seconds in Route A, Route B, Route C, Route D and Route E respectively and distance travelled per trip during these routes are 28.5 km, 30.8 km, 31 km, 43 km and 60 km respectively. The Route D and Route E were lengthy routes so there were the maximum traffic idling times as per their route length. The traffic idling Route B was high because there were high traffic at Koteshwor, Baneshwor, Maitighar and Putalisadak. During the study, it was found that there were high traffic at Koteshwor intersection.
The average idling at the bus stops during a trip were 1916, 2121, 1870, 1826 and 2511 seconds in route A, route B, route C, route D and route E respectively. Although the distance of route C are short with respect to route E, but due to large number of passengers in route C there were more buses and trips to serve those passengers. Therefore, the buses waited at different bus stops for longer time in route C and although the buses waited for less time at bus stops, due to many stops in route E the total average idling at bus stops were higher in those routes.
Hence, the total idling time were 2340, 2960, 2505, 2690 and 3606 seconds in route A, route B, route C, route D and route E respectively. The traffic idling were 18.1%, 28.3%, 25.3 %, 32.1 % and 30.4 % in Route A, Route B, Route C, Route D and Route E respectively. The average idling time at traffic and bus stops in selected routes are as shown in Fig. 1.
159 Suwal and Ale
Fig. 1: Average idling time at traffic and bus stops in selected routes
4.2 Idling Fuel Consumption and GHG Emission
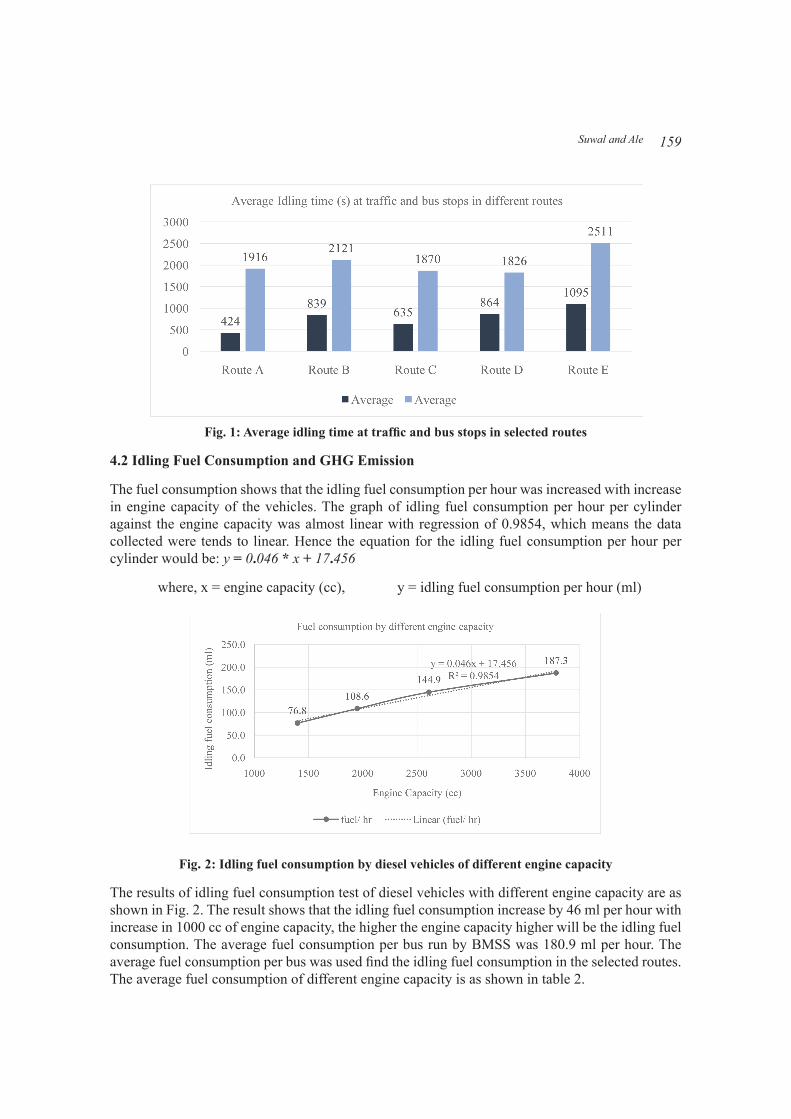
The fuel consumption shows that the idling fuel consumption per hour was increased with increase in engine capacity of the vehicles. The graph of idling fuel consumption per hour per cylinder against the engine capacity was almost linear with regression of 0.9854, which means the data collected were tends to linear. Hence the equation for the idling fuel consumption per hour per cylinder would be: y = 0.046 * x + 17.456
where, x = engine capacity (cc), y = idling fuel consumption per hour (ml)
Fig. 2: Idling fuel consumption by diesel vehicles of different engine capacity
The results of idling fuel consumption test of diesel vehicles with different engine capacity are as shown in Fig. 2. The result shows that the idling fuel consumption increase by 46 ml per hour with increase in 1000 cc of engine capacity, the higher the engine capacity higher will be the idling fuel consumption. The average fuel consumption per bus run by BMSS was 180.9 ml per hour. The average fuel consumption per bus was used find the idling fuel consumption in the selected routes. The average fuel consumption of different engine capacity is as shown in table 2.
160 Idling Fuel Consumption and Emissions of Public Vehicles run by Bhaktapur Minibus Sewa Samiti and ...
Table 2: Idling fuel consumption by buses of different engine capacity of BMSS
S. N. Engine (cc) No. of bus fuel/ h (ml) Average fuel consumption (ml)1 3783 277 187.25
180.92 2609 49 144.93 3298 1 170.8116
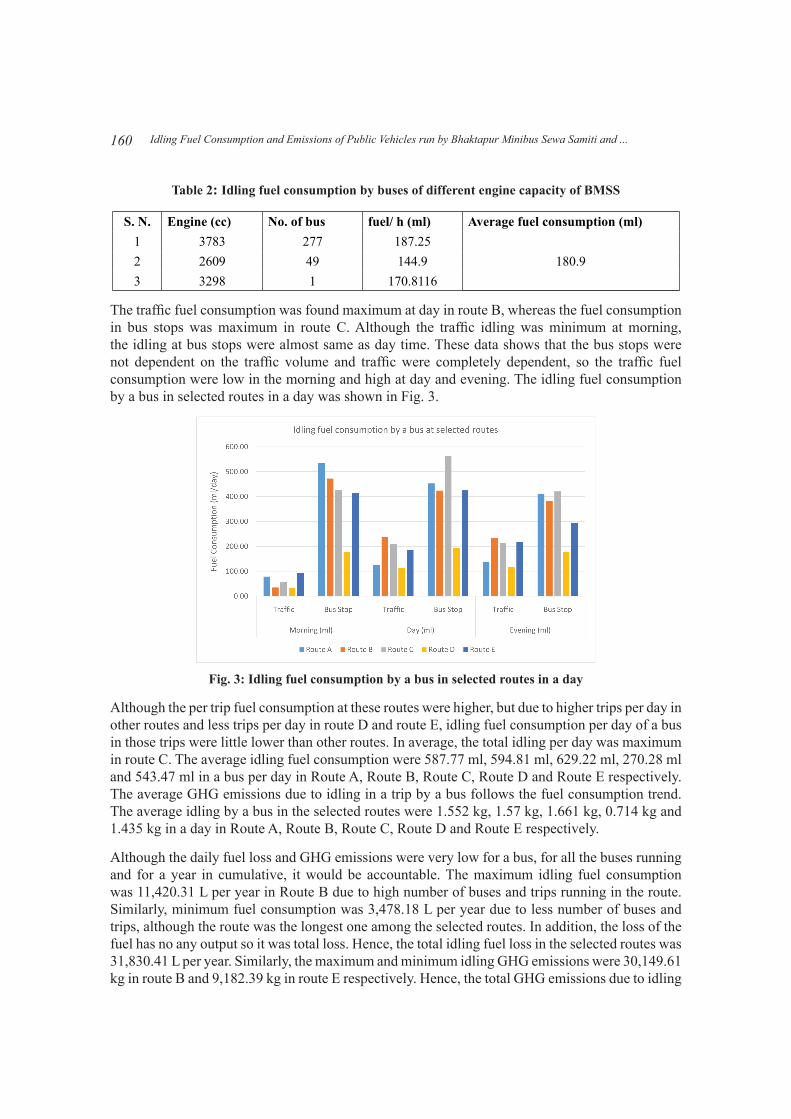
The traffic fuel consumption was found maximum at day in route B, whereas the fuel consumption in bus stops was maximum in route C. Although the traffic idling was minimum at morning, the idling at bus stops were almost same as day time. These data shows that the bus stops were not dependent on the traffic volume and traffic were completely dependent, so the traffic fuel consumption were low in the morning and high at day and evening. The idling fuel consumption by a bus in selected routes in a day was shown in Fig. 3.
Fig. 3: Idling fuel consumption by a bus in selected routes in a day
Although the per trip fuel consumption at these routes were higher, but due to higher trips per day in other routes and less trips per day in route D and route E, idling fuel consumption per day of a bus in those trips were little lower than other routes. In average, the total idling per day was maximum in route C. The average idling fuel consumption were 587.77 ml, 594.81 ml, 629.22 ml, 270.28 ml and 543.47 ml in a bus per day in Route A, Route B, Route C, Route D and Route E respectively. The average GHG emissions due to idling in a trip by a bus follows the fuel consumption trend. The average idling by a bus in the selected routes were 1.552 kg, 1.57 kg, 1.661 kg, 0.714 kg and 1.435 kg in a day in Route A, Route B, Route C, Route D and Route E respectively.
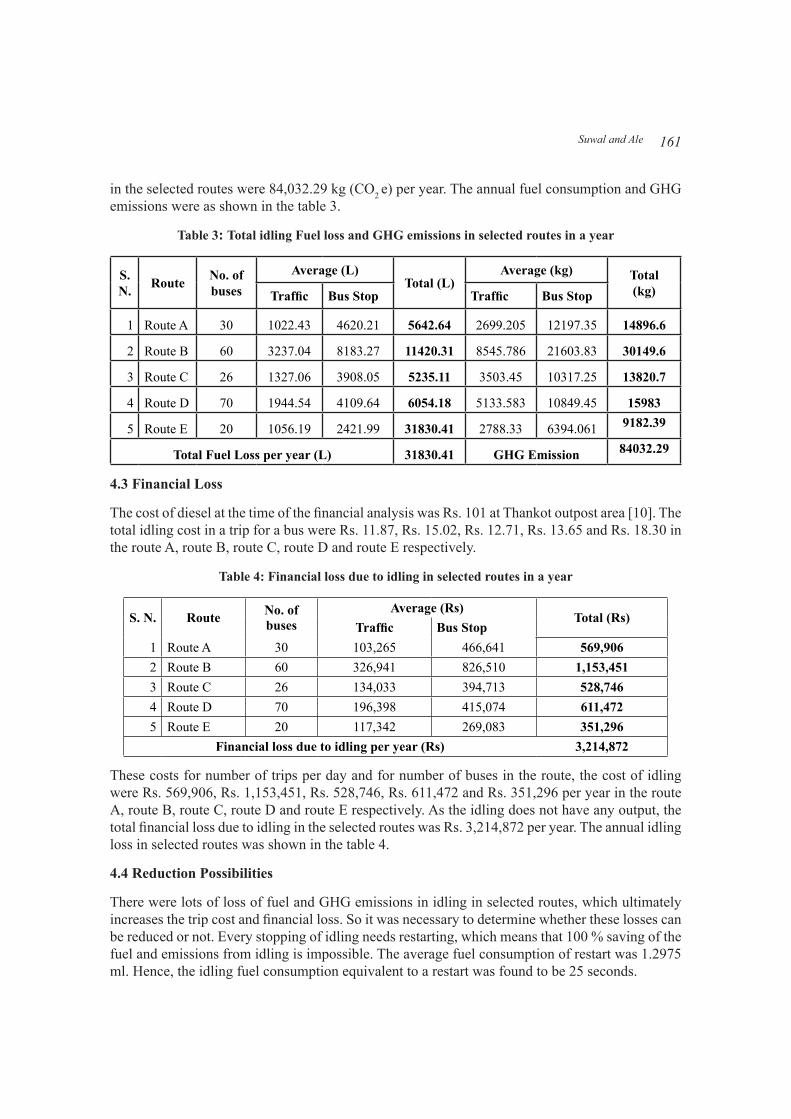
Although the daily fuel loss and GHG emissions were very low for a bus, for all the buses running and for a year in cumulative, it would be accountable. The maximum idling fuel consumption was 11,420.31 L per year in Route B due to high number of buses and trips running in the route. Similarly, minimum fuel consumption was 3,478.18 L per year due to less number of buses and trips, although the route was the longest one among the selected routes. In addition, the loss of the fuel has no any output so it was total loss. Hence, the total idling fuel loss in the selected routes was 31,830.41 L per year. Similarly, the maximum and minimum idling GHG emissions were 30,149.61 kg in route B and 9,182.39 kg in route E respectively. Hence, the total GHG emissions due to idling
161 Suwal and Ale
in the selected routes were 84,032.29 kg (CO2 e) per year. The annual fuel consumption and GHG emissions were as shown in the table 3.
Table 3: Total idling Fuel loss and GHG emissions in selected routes in a year
S. N. Route No. of
busesAverage (L)
Total (L)Average (kg) Total
(kg)Traffic Bus Stop Traffic Bus Stop
1 Route A 30 1022.43 4620.21 5642.64 2699.205 12197.35 14896.6
2 Route B 60 3237.04 8183.27 11420.31 8545.786 21603.83 30149.6
3 Route C 26 1327.06 3908.05 5235.11 3503.45 10317.25 13820.7
4 Route D 70 1944.54 4109.64 6054.18 5133.583 10849.45 15983
5 Route E 20 1056.19 2421.99 31830.41 2788.33 6394.061 9182.39
Total Fuel Loss per year (L) 31830.41 GHG Emission 84032.29
4.3 Financial Loss
The cost of diesel at the time of the financial analysis was Rs. 101 at Thankot outpost area [10]. The total idling cost in a trip for a bus were Rs. 11.87, Rs. 15.02, Rs. 12.71, Rs. 13.65 and Rs. 18.30 in the route A, route B, route C, route D and route E respectively.
Table 4: Financial loss due to idling in selected routes in a year
S. N. Route No. of buses
Average (Rs)Total (Rs)
Traffic Bus Stop1 Route A 30 103,265 466,641 569,9062 Route B 60 326,941 826,510 1,153,4513 Route C 26 134,033 394,713 528,7464 Route D 70 196,398 415,074 611,4725 Route E 20 117,342 269,083 351,296
Financial loss due to idling per year (Rs) 3,214,872
These costs for number of trips per day and for number of buses in the route, the cost of idling were Rs. 569,906, Rs. 1,153,451, Rs. 528,746, Rs. 611,472 and Rs. 351,296 per year in the route A, route B, route C, route D and route E respectively. As the idling does not have any output, the total financial loss due to idling in the selected routes was Rs. 3,214,872 per year. The annual idling loss in selected routes was shown in the table 4.
4.4 Reduction Possibilities
There were lots of loss of fuel and GHG emissions in idling in selected routes, which ultimately increases the trip cost and financial loss. So it was necessary to determine whether these losses can be reduced or not. Every stopping of idling needs restarting, which means that 100 % saving of the fuel and emissions from idling is impossible. The average fuel consumption of restart was 1.2975 ml. Hence, the idling fuel consumption equivalent to a restart was found to be 25 seconds.
162 Idling Fuel Consumption and Emissions of Public Vehicles run by Bhaktapur Minibus Sewa Samiti and ...
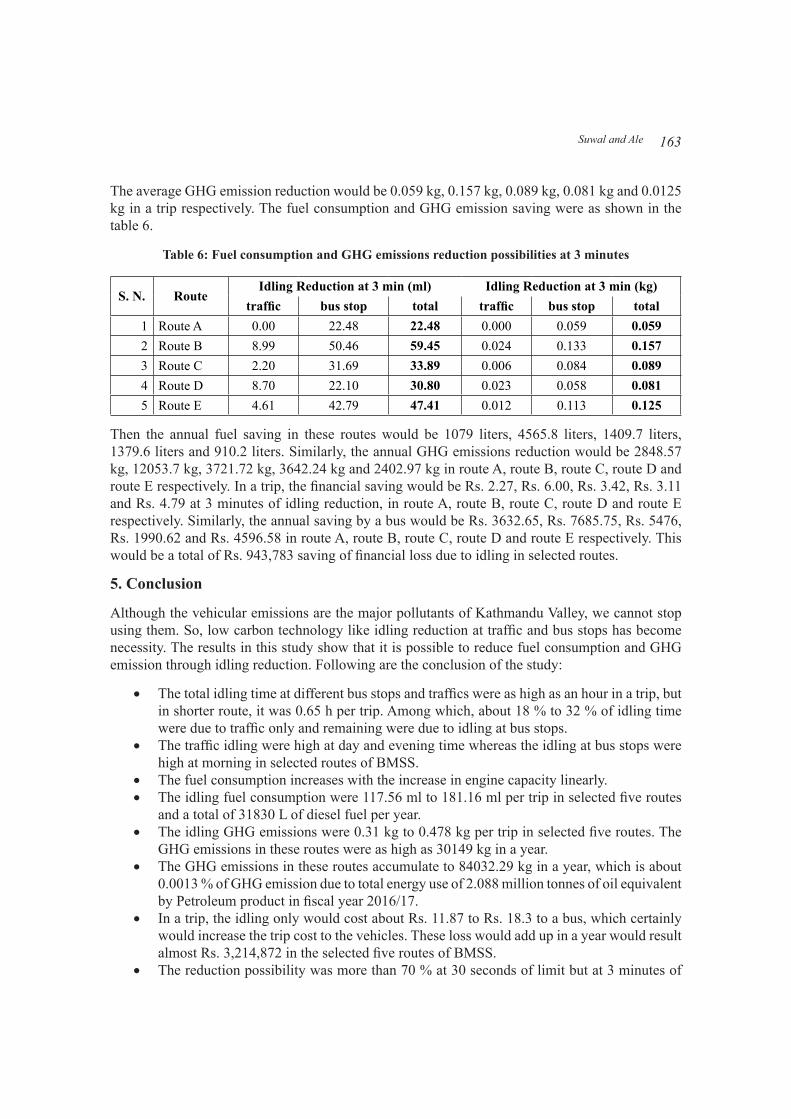
This result clearly shows that the idling less than 25 seconds did not need to be restarted. It is wise to restart at the bus stops and traffics only for more than 25 seconds of idling time. Therefore, during this study, the possible saving was determined for 30 seconds. However, it was less practical that would made the bus to restart at every stops so the possible saving was also determined. To minimize the number of restarts, it would be wise to use higher idling time before restarting. So during this study 3 minute time was chosen to determine the possible saving of the idling. This would require less number of restarts in a trip. The average saving of idling time during a trip by a bus in selected routes is as shown in the table 5.
Table 5: Total reduction possibilities during a trip in selected routes at 30 s and 3 minutes
S. N. Route
Idling Reduction at 30 s (%) Idling Reduction at 3 min (%)traffic bus stop total traffic bus stop total
1 Route A 43.52 76.80 70.71 0.00 23.35 19.352 Route B 51.30 81.20 77.41 21.32 47.36 43.663 Route C 48.07 79.53 72.83 6.89 33.73 27.534 Route D 55.95 76.62 72.23 20.04 24.09 24.895 Route E 59.83 79.51 74.80 8.39 33.92 28.01
It had been found that idling for more than 30 seconds were maximum at route B and minimum at route A. If the buses were, start off for every 30 seconds of idling or higher, more than 70 % of idling time can be saved in a trip in all the selected routes. But this would led to restart at almost every stops and major intersections. In a trip for the selected routes, the number of restart would be more than 20 restarts. This might hamper the life of starter motor and the battery. However, the idling saving at 3 minutes were reduced drastically than 30 seconds of idling saving. Except for route B, the saving reduced by more than 50 % in all the routes. Also the saving at traffic idling had become almost impossible.
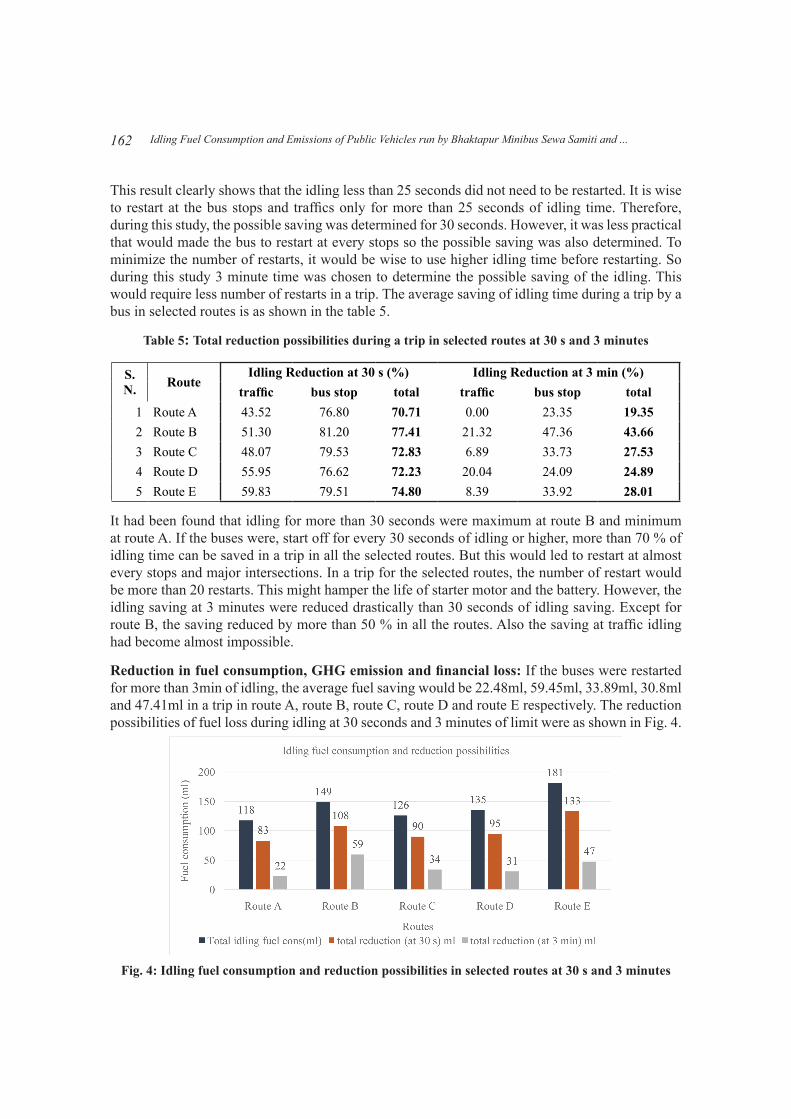
Reduction in fuel consumption, GHG emission and financial loss: If the buses were restarted for more than 3min of idling, the average fuel saving would be 22.48ml, 59.45ml, 33.89ml, 30.8ml and 47.41ml in a trip in route A, route B, route C, route D and route E respectively. The reduction possibilities of fuel loss during idling at 30 seconds and 3 minutes of limit were as shown in Fig. 4.
Fig. 4: Idling fuel consumption and reduction possibilities in selected routes at 30 s and 3 minutes
163 Suwal and Ale
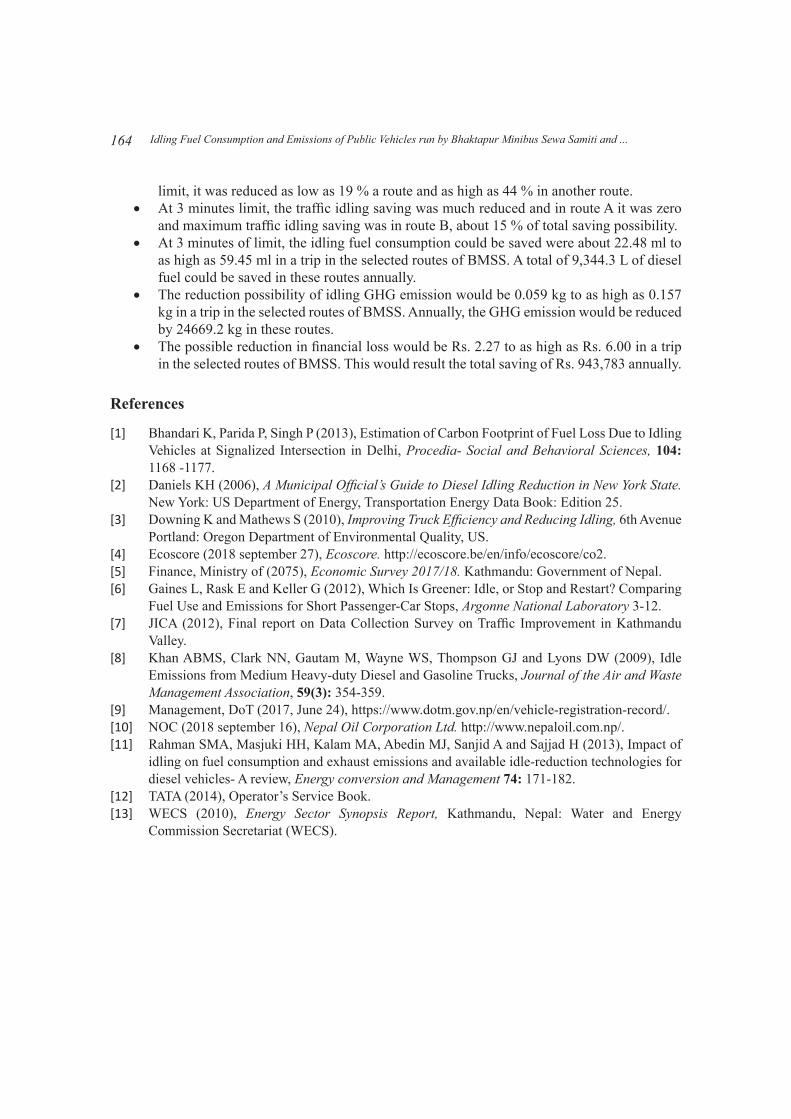
The average GHG emission reduction would be 0.059 kg, 0.157 kg, 0.089 kg, 0.081 kg and 0.0125 kg in a trip respectively. The fuel consumption and GHG emission saving were as shown in the table 6.
Table 6: Fuel consumption and GHG emissions reduction possibilities at 3 minutes
S. N. RouteIdling Reduction at 3 min (ml) Idling Reduction at 3 min (kg)
traffic bus stop total traffic bus stop total1 Route A 0.00 22.48 22.48 0.000 0.059 0.0592 Route B 8.99 50.46 59.45 0.024 0.133 0.1573 Route C 2.20 31.69 33.89 0.006 0.084 0.0894 Route D 8.70 22.10 30.80 0.023 0.058 0.0815 Route E 4.61 42.79 47.41 0.012 0.113 0.125
Then the annual fuel saving in these routes would be 1079 liters, 4565.8 liters, 1409.7 liters, 1379.6 liters and 910.2 liters. Similarly, the annual GHG emissions reduction would be 2848.57 kg, 12053.7 kg, 3721.72 kg, 3642.24 kg and 2402.97 kg in route A, route B, route C, route D and route E respectively. In a trip, the financial saving would be Rs. 2.27, Rs. 6.00, Rs. 3.42, Rs. 3.11 and Rs. 4.79 at 3 minutes of idling reduction, in route A, route B, route C, route D and route E respectively. Similarly, the annual saving by a bus would be Rs. 3632.65, Rs. 7685.75, Rs. 5476, Rs. 1990.62 and Rs. 4596.58 in route A, route B, route C, route D and route E respectively. This would be a total of Rs. 943,783 saving of financial loss due to idling in selected routes.
5. Conclusion
Although the vehicular emissions are the major pollutants of Kathmandu Valley, we cannot stop using them. So, low carbon technology like idling reduction at traffic and bus stops has become necessity. The results in this study show that it is possible to reduce fuel consumption and GHG emission through idling reduction. Following are the conclusion of the study:
• The total idling time at different bus stops and traffics were as high as an hour in a trip, but in shorter route, it was 0.65 h per trip. Among which, about 18 % to 32 % of idling time were due to traffic only and remaining were due to idling at bus stops.
• The traffic idling were high at day and evening time whereas the idling at bus stops were high at morning in selected routes of BMSS.
• The fuel consumption increases with the increase in engine capacity linearly.• The idling fuel consumption were 117.56 ml to 181.16 ml per trip in selected five routes
and a total of 31830 L of diesel fuel per year.• The idling GHG emissions were 0.31 kg to 0.478 kg per trip in selected five routes. The
GHG emissions in these routes were as high as 30149 kg in a year. • The GHG emissions in these routes accumulate to 84032.29 kg in a year, which is about
0.0013 % of GHG emission due to total energy use of 2.088 million tonnes of oil equivalent by Petroleum product in fiscal year 2016/17.
• In a trip, the idling only would cost about Rs. 11.87 to Rs. 18.3 to a bus, which certainly would increase the trip cost to the vehicles. These loss would add up in a year would result almost Rs. 3,214,872 in the selected five routes of BMSS.
• The reduction possibility was more than 70 % at 30 seconds of limit but at 3 minutes of
164 Idling Fuel Consumption and Emissions of Public Vehicles run by Bhaktapur Minibus Sewa Samiti and ...
limit, it was reduced as low as 19 % a route and as high as 44 % in another route.• At 3 minutes limit, the traffic idling saving was much reduced and in route A it was zero
and maximum traffic idling saving was in route B, about 15 % of total saving possibility.• At 3 minutes of limit, the idling fuel consumption could be saved were about 22.48 ml to
as high as 59.45 ml in a trip in the selected routes of BMSS. A total of 9,344.3 L of diesel fuel could be saved in these routes annually.
• The reduction possibility of idling GHG emission would be 0.059 kg to as high as 0.157 kg in a trip in the selected routes of BMSS. Annually, the GHG emission would be reduced by 24669.2 kg in these routes.
• The possible reduction in financial loss would be Rs. 2.27 to as high as Rs. 6.00 in a trip in the selected routes of BMSS. This would result the total saving of Rs. 943,783 annually.
References
[1] Bhandari K, Parida P, Singh P (2013), Estimation of Carbon Footprint of Fuel Loss Due to Idling Vehicles at Signalized Intersection in Delhi, Procedia- Social and Behavioral Sciences, 104: 1168 -1177.
[2] Daniels KH (2006), A Municipal Official’s Guide to Diesel Idling Reduction in New York State. New York: US Department of Energy, Transportation Energy Data Book: Edition 25.
[3] Downing K and Mathews S (2010), Improving Truck Efficiency and Reducing Idling, 6th Avenue Portland: Oregon Department of Environmental Quality, US.
[4] Ecoscore (2018 september 27), Ecoscore. http://ecoscore.be/en/info/ecoscore/co2.[5] Finance, Ministry of (2075), Economic Survey 2017/18. Kathmandu: Government of Nepal.[6] Gaines L, Rask E and Keller G (2012), Which Is Greener: Idle, or Stop and Restart? Comparing
Fuel Use and Emissions for Short Passenger-Car Stops, Argonne National Laboratory 3-12.[7] JICA (2012), Final report on Data Collection Survey on Traffic Improvement in Kathmandu
Valley.[8] Khan ABMS, Clark NN, Gautam M, Wayne WS, Thompson GJ and Lyons DW (2009), Idle
Emissions from Medium Heavy-duty Diesel and Gasoline Trucks, Journal of the Air and Waste Management Association, 59(3): 354-359.
[9] Management, DoT (2017, June 24), https://www.dotm.gov.np/en/vehicle-registration-record/.[10] NOC (2018 september 16), Nepal Oil Corporation Ltd. http://www.nepaloil.com.np/.[11] Rahman SMA, Masjuki HH, Kalam MA, Abedin MJ, Sanjid A and Sajjad H (2013), Impact of
idling on fuel consumption and exhaust emissions and available idle-reduction technologies for diesel vehicles- A review, Energy conversion and Management 74: 171-182.
[12] TATA (2014), Operator’s Service Book.[13] WECS (2010), Energy Sector Synopsis Report, Kathmandu, Nepal: Water and Energy
Commission Secretariat (WECS).
Related Documents