Consumer confusion proneness: insights from a developingeconomy
Author
Tjiptono, Fandy, Arli, Denni, Bucic, Tania
Published
2014
Journal Title
Marketing Intelligence & Planning
DOI
https://doi.org/10.1108/MIP-05-2013-0082
Copyright Statement
© 2014 Emerald. This is the author-manuscript version of this paper. Reproduced in accordancewith the copyright policy of the publisher. Please refer to the journal's website for access to thedefinitive, published version.
Downloaded from
http://hdl.handle.net/10072/64020
Griffith Research Online
https://research-repository.griffith.edu.au

1
Consumer Confusion Proneness: Insights from a Developing Economy
Abstract Purpose – The present study aims to examine young consumers’ general tendency to become confused and its effect on the word of mouth, trust, and consumer satisfaction in Indonesia – the largest smartphone market in Southeast Asia. Design/ methodology/ approach – A combination of convenience and purposive sampling were used to select the sample of young adults in Daerah Istimewa Yogyakarta (DIY), Indonesia. Findings – The results confirm that consumer confusion proneness comprises three dimensions; similarity confusion, overload confusion, and ambiguity confusion among young consumers in the smartphone market. Furthermore, each dimension has different consumer behavioural implications. Practical implications – In the context of Indonesia and when targeting young consumers, companies should focus on defining unique product features instead of simply imitating competitor offerings, because similarity confusion negatively affects consumer trust Moreover, managers should consistently emphasise unique and value-adding features to overload the product. This will lead to increased positive word of mouth, especially with the growing trend of social media usage among youg consumers in Indonesia. Originality/ value – This paper represents a replication of Walsh and Mitchell’s (2010) study. It is unique in that it is set in the context of the Indonesian smartphone market – the largest smartphone market in Southeast Asia, and concentrates specifically on the young consumer market. It provides valuable insights into the impact of consumer confusion proneness on the word of mouth, trust, and consumer across this age group and in this market. Keywords consumer confusion, word of mouth, trust, consumer satisfaction, young
consumers, developing countries, Indonesia. Paper type Research paper
.
2
1. Introduction
Consumer democracy, or consumer power (Bosshart, 2004) is driving an expansion of options
in consumer markets (Schweizer, Kotouc, and Wagner, 2006). In their role as consumers thus,
people have become ‘spoiled for choice.’ However, if consumers are provided with too much
information such that it exceeds their processing limits, overload occurs and consumers
become confused, which then leads to poorer decision making (Malhotra, 1982). Consumer
confusion stems from consumer confusion proneness, which is ‘consumers’ general tolerance
for processing similarity, overload or ambiguity information, which negatively affects
consumers’ information processing and decision-making abilities’ (Walsh, Hennig-Thurau,
and Mitchell, 2007, p. 699). It is an issue that is especially pertinent in today’s world, where
there is relentless product proliferation, growing adoption of product imitation strategies, and
increasing amounts of marketplace information all of which make purchase decisions
confusing (Persaud and Azhar, 2012; Schweizer, Kotouc, and Wagner, 2006).
Understanding consumer decision making is important in terms of perceived value for
consumers and value capture for businesses (Bettman, Johnson, and Payne, 1990). Economic
theorists imply that this process is easily understood because consumers are rational beings
and make perfectly informed decisions based on a comparison of utility across alternatives
and select the option that gives maximum benefit (Ratchford, 1975). However, consumers are
limited by their own bounded rationality – or limited cognitive ability to process information
and thus cannot be perfectly rational (Simon, 1955). In addition, they make decisions based
on an array of inputs, and by using imperfect information in various ways (Bettman, 1979).
Having too many choices can be as problematic as having no choice.
Consumer confusion is increasingly being reported in developed as well as transitional
economies such as the US, the UK, Germany, France, Netherlands, China, South Korea, and
India (Leek and Kun, 2006), and across product categories (such as telecommunications,

3
watches, washing powder, fashion, and private labels) (Walsh, Hennig-Thurau, and Mitchell,
2007; Walsh and Mitchell, 2010). This situation has important implications for both
consumers and businesses. Yet, the notion of consumer confusion, is a relatively new concept
in marketing and consumer research (Matzler and Waiguny, 2005; Mitchell and
Papavassiliou, 1999), with no consideration in reputable consumer behaviour textbooks
(Schweizer, Kotouc and Wagner, 2006), and limited research attention (Turnbull et al., 2000;
Walsh et al., 2007).
Many consumers are trapped in the ‘tyranny of choice,’ where greater choice leads to
consumers suffering poor decisions (Schweizer et al., 2006, p. 184). The consumer decision
making process is a complex system (Punj and Stewart, 1983; DeWulf and Odeberken-
Schröder, 2003) that continues to be the source of many research investigations. At the
foundation of inquiry regarding consumer decision making is the ‘buyer’s black box’ — the
manner in which consumers make choices between alternatives, and evaluate bundles of
attributes among competing products remains poorly understood (Leek and Chansawatkit,
2006). What we do know is that within the limitations of their bounded rationality (Simon,
1955) consumers make decisions as best they can. Few studies have examined the issue in
developing economies such as those in Eastern cultures (Leek and Green, 1991; Turnbull et
al, 2010). This is pertinent for at least two reasons: Consumers in these countries represent a
less mature consumer market where there are many challenges including imitation products
and little or no consumer protection (Fan and Xiao, 1998); and developing economies are
collectively a powerful consumer force estimated to contribute 60% of the world GDP by
2030 (OECD, 2010).
In this paper, we explore how consumers cope with the challenge of confusion. We
respond to two calls for research issues in prior research: The first is to study consumer
confusion as the darker side of the shopping experience and to try and identify the elements

4
that create negative consumer feelings during shopping (D’Astous, 2000, p. 149); the second
is to undertake a consumer confusion study in a developing country representing a developing
economy (Leek and Kun, 2006). We achieve this by focusing on the young consumer market
in Indonesia and conducting a replication of Walsh and Mitchell’s study (2010), which
investigated the effect of consumer confusion proneness on word of mouth, trust, and
customer satisfaction. Our guiding research question is ‘How does consumer confusion
proneness affect word of mouth, trust, and customer satisfaction among young consumers in
the Indonesian consumer market?’
2. Literature review
2.1.Indonesia
Indonesia’s large populations (about 237 million people in 2010) and high economic growth
(6.0% in 2010) have attracted many multinational companies to establish local operations
(Safra and Aguilar-Cauz, 2011). The consumer market is diverse and developing. Consumer
choice, too, is developing and is currently characterized by a plethora of options. The
Indonesian consumer technology market, for example, is a prime case study for examining the
issue of consumer confusion proneness. Indonesia is the largest notebook market in Southeast
Asia with about 2 million units sold in 2011 (Waluyo, 2012); smartphone usage and
ownership are growing rapidly (Suling, 2010; Wahono, 2010), and according to the
Indonesian Association of Cellular Telecommunication as at 2011 there were more than 250
million cellular phone subscriptions, where one person may have more than one subscription.
Using a more specific example, BlackBerry reported an exponential upsurge of users from
2010 to 2011 when the number of users exploded from 1 million to 5 million, and in addition,
they project a further increase to 9.7 million by 2015 (Suara Pembaruan, 2012). Such factors
can make the shopping experience challenging and when posed for complex purchase
5
decisions such as technical products, consumer confusion can become high (Leek and Kun,
2006).
2.2.Defining consumer confusion
Consumer confusion has been defined in the literature in several ways ranging from Foxman,
Berger, and Cote’s (1992) version that focuses on consumer error in inferential processing
that leads to inaccurate beliefs based on inference from a familiar brand’s performance; to
consumer misinterpretation of the components of a product, which then leads to a broader
misinterpretation of the market (Turnbull, Leek, and Ying, 2000), to the temporary
exceedance of an individual capacity threshold for absorbing and processing environment
stimuli (Schweizer, Kotouc, and Wagner, 2006, p. 185). Consistent among such definitions is
the notion that consumer confusion is a negative emotional state that creates difficulties for a
decision-maker to compare, evaluate, and rank options for a decision to be made (Lakotta and
Jacob, 2008, p. 3). This type of confusion is caused by factors including product similarity,
product complexity, marketplace information similarity, marketplace information complexity,
and/or consumers’ cognitive limitations. Walsh, Hennig-Thurau, and Mitchell (2007) provide
a well-rounded conceptualization of the dimensions of consumer confusion in their definition
of consumer confusion proneness: a distinct tri-component confusion model including
similarity confusion, overload confusion, and ambiguity confusion. Specifically, a
consumer’s general tolerance for processing similarity, overload or ambiguity information,
which negatively affects consumers’ information processing and decision-making abilities (p.
699). We adopt their conceptualization in our replication of their study.
Subsequent to the Walsh, Hennig-Thurau, and Mitchell’s (2007) validation of their
three-dimensional model of consumer confusion proneness, Walsh and Mitchell (2010)
further tested the scale and found a significant impact on word of mouth, trust, and customer
satisfaction. We examined the three dimensions and their impacts in the developing country

6
setting as the foundation of the current study. Because the present research is a modified
replication of Walsh and Mitchell’s study (2010), the hypotheses were adapted from the
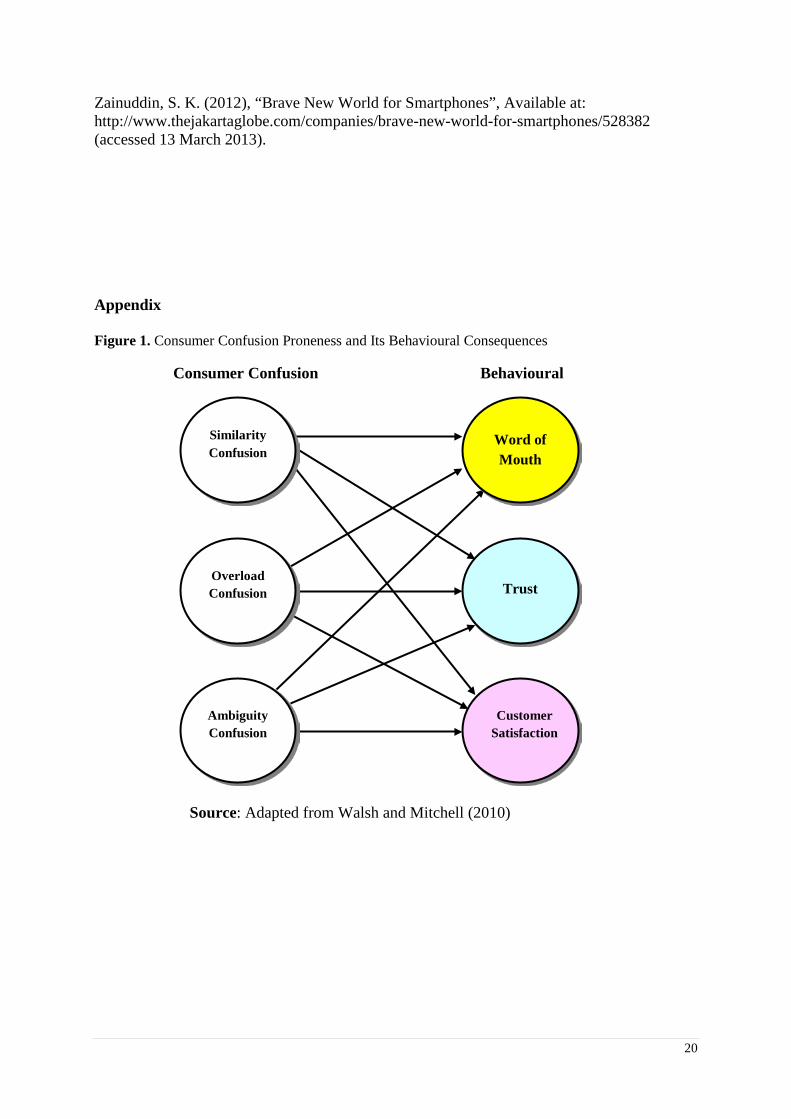
original study summarized in Figure 1.
Insert Figure 1 About Here 2.3.Similarity confusion
Similarity confusion can be defined as ‘consumers’ propensity to think that different products
in a product category are visually and functionally similar’ (Walsh, Hennig-Thurau, and
Mitchell, 2007, p. 702). This confusion may occur due to decreasing inter-brand differences,
increasing number of parity products, and increasing number of ‘me-too’ products. Many
manufacturers desperately seek competitive advantages by developing minor differentiations
and/or imitating market leaders’ products or brands. As a result, consumers face an
overchoice of similar products (Foxman, Berger, and Cote, 1992). In their study, Walsh and
Mitchell (2010) postulated an insignificant impact of similarity confusion on word of mouth;
however, their results indicated that the effect was significant and negative. They offered two
explanations for this finding. First, when consumers perceived products as being similar, they
are more reluctant to offer word of mouth because the situation gives them less to talk about
to their friends and family members. Second, similarity confusion prone consumers may find
it embarrassing to admit their mistakes and inability to differentiate between brands.
Therefore, hypothesis 1 can be formulated as follows:
H1. Similarity confusion proneness negatively affects consumer word of mouth.
Furthermore, the attribution theory explains how people determine whether the cause
for an action or an event resulted from something internal or external to themselves or object
in question (Schiffman and Kanuk, 2010). In general, people tend to credit themselves for
success (internal attribution) and blame others for product failure (external attribution) (Peter

7
and Olson, 2010). Therefore, when they get confused with too many similar products within a
product category, they will blame the company. As a result, the trust they have in the products
and their manufacturers will lessen. Hence, hypothesis 2 can be stated as follows:
H2. Similarity confusion proneness negatively affects consumer trust.
When consumers find it difficult to choose between brands or products, their overall
(or macro) satisfaction will decrease. They have to spend more time, efforts, and money to
collect information, evaluate alternatives, and make decisions. Walsh and Mitchell (2010)
found support for the negative impact of similarity confusion proneness on macro customer
satisfaction. In line with this, hypothesis 3 can be postulated as follows:
H3. Similarity confusion proneness negatively affects consumer satisfaction.
2.4.Overload confusion
Overload confusion is ‘consumers’ difficulty when confronted with more product information
and alternatives than they can process in order to get to know, to compare, and to
comprehend alternatives’ (Walsh, Hennig-Thurau, and Mitchell, 2007, p. 704). When
consumers are in such situation, they may engage in more communications with reference
group members (e.g., family members, friends, and co-workers) to clarify some of the
information they have and/or to work through some of their confusion. In other words, it is
more likely that they involve in word of mouth to seek for advice and to reduce anxiety
(Sundaram, Mitra, and Webster, 1998). Support was found in Walsh and Mitchell’s study
(2010) that overload confusion prone consumers involve others in the purchase decision
making to help them solve some of their overload confusion. Thus, hypothesis 4 can be stated
as follows:
H4. Overload confusion proneness positively affects consumer word of mouth.
8
Moreover, information overload is a situation in which a consumer is presented with
too much product- or brand-related information (Schiffman and Kanuk, 2010). Consumers
may get confused in evaluating alternative brands and/or products. Consistent with external
attribution theory, consumers tend to blame the companies for the complexity and difficulty to
understand marketplace information provided to them and they will question the companies’
motives. It will lead to decreasing trust in the companies and their products. Thus, hypothesis
5 can be formulated as follows:
H5. Overload confusion proneness negatively affects consumer trust.
Overload confusion makes consumers feel overwhelmed and dissatisfied, or choose
not to make a choice at all (Huffman and Kahn, 1998). They may also blame the companies
for their inability to process all the information. Walsh and Mitchell (2010) reveal that
overload confusion has a negative impact on customer satisfaction because too much
information can cause consumer anxiety, frustration, and stress that will lead to
dissatisfaction. Consequently, hypothesis 6 can be proposed as follows:
H6. Overload confusion proneness negatively affects consumer satisfaction.
2.5.Ambiguity confusion
Ambiguity confusion is ‘consumers’ tolerance for processing unclear, misleading, or
ambiguous products, product-related information or advertisements’ (Walsh, Hennig-Thurau,
and Mitchell, 2007, p. 705). In an earlier work, Mitchell, Walsh, and Yamin (2005) used the
term ‘unclarity confusion’ to refer to this type of confusion. In general, ambiguity confusion
may arise from four factors: technological complexity, ambiguous information/product
claims, contradictory information, and incorrect interpretation (Leek and Kun, 2006).

9
When consumers face multiple interpretations of product quality from different
sources, they can get confused. Such confusion can be even more problematic if the
information is conflicting and inconsistent with the consumer’s prior beliefs and knowledge.
To overcome the confusion, a consumer may seek support or help from others to establish
which information is more credible. Once they understand the ambiguity or conflicting
information, they may share their new knowledge with others, which in turn will increase
their word of mouth (Walsh, Hennig-Thurau, and Mitchell, 2007). In their study, Walsh and
Mitchell (2010) found support for a significant positive impact of ambiguity confusion
proneness on word of mouth. As a result, hypothesis 7 is formulated as follows:
H7. Ambiguity confusion proneness positively affects consumer word of mouth.
Inability to choose among many very similar products with ambiguous information
about their differences may cause confusion and frustration, which lead to purchase decision
delay. Consumers are likely to take time to overcome some of their confusion. In addition to
uncertain feelings, in some situations ambiguity is likely to cause consumers to suspect that
the companies providing conflicting product information are attempting to take advantage of
them. As a result, ambiguity-prone consumers may have less trust in the companies and their
products. Following the original formulation in Walsh and Mitchell (2010), hypothesis 8 is
stated as follows:
H8. Ambiguity confusion proneness negatively affects consumer trust.
Complex and ambiguous information is likely to cause consumers to be uncertain and
anxious as to which information to believe. To reduce the ambiguity, consumers need extra
time, effort, and sometimes money to obtain the needed additional information. Such extra
processing will result in the reduction of consumer satisfaction with the companies and
10
products. As argued in Walsh and Mitchell (2010), this reasoning leads to the following
hypothesis 9:
H9. Ambiguity confusion proneness negatively affects consumer satisfaction.
3. Method
This study is set in the context of the Indonesian smartphone market. This specific market was
selected because the consumer confusion proneness is high during decision making for the
purchase of this product type (Leek and Kun, 2006). In addition, the influx of affordable
smartphones as well as easy access to financing companies have contributed to a perceptual
shift from luxury item to a commodity in Indonesia (Melouney, 2013). This is attributable to
the rapid technological change and dynamic competition that characterizes the industry
(Turnbull, Leek, and Ying, 2000). The ever-growing features, applications, and operating
systems of smartphones may cause confusion among consumers who are attempting to
decipher marketing information, evaluate among alternatives, and make a choice regarding
which brand and features to select (Walsh, Hennig-Thurau, and Mitchell, 2007). In the
smartphone market, many consumers are trapped in the ‘tyranny of choice’ (Schwartz, 2004),
where greater choice leads to consumers suffering the potential for poor decisions.
A combination of convenience and purposive sampling were used to select the sample
of young adults. The sample was drawn from a pool of university students fitting the same
demographic criteria in Daerah Istimewa Yogyakarta (DIY), Indonesia. More specifically, the
criterion used for the purposive sampling was young adults who used and/or owned a
smartphone. Young adults were targeted as the sample because the majority of smartphone
users in Indonesia are between 18 and 24 years of age (Firman, 2010).
A structured, three-part questionnaire was administered to collect the data. First,
information about respondent profiles in terms of their gender and smartphone ownership was
11
sought. This was followed by a measure of consumer confusion proneness as adapted from
Walsh, Hennig-Thurau, and Mitchell (2007). And third, further general information regarding
smartphone usage and trust, satisfaction, and word of mouth was collected. A 5-point Likert
scale and Likert-type scale were used. A total of 350 questionnaires were distributed at two
major universities in the Daerah Istimewa Yogyakarta, and 313 were returned in a useable
format (response rate = 89.4%). Female and male respondents were almost equal (51.4% and
48.6%, respectively). All own smartphones, and BlackBerry was identified as the most
popular brand (owned by 155 people or 49.5% of the respondents), followed by Samsung
(20.1%), Nokia (10.9%), and iPhone (8.6%). The remainder own LG, Sony, Motorola, and
Chinese brands (e.g., Nexian, HTC, and Beyond). A small percentage of respondents (2.9%)
indicated that they possess more than one smartphone.
4. Findings
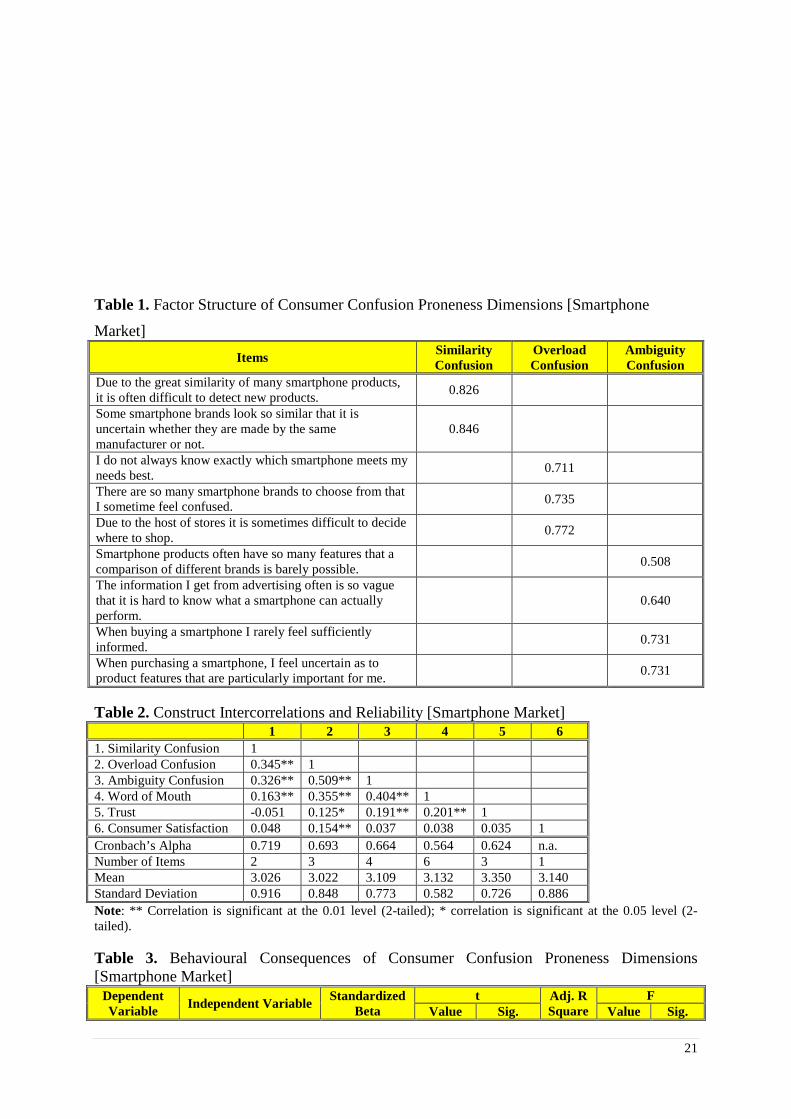
4.1.Dimensions of consumer confusion proneness
A principle component factor analysis using Varimax rotation was conducted on the 9 items
of consumer confusion proneness measure. Our results confirm the 3-factor structure as
identified by Walsh, Hennig-Thurau, and Mitchell (2007) (refer to Table 1). That is, similarity
confusion (2 items), overload confusion (3 items), and ambiguity confusion (4 items).
Intercorrelations indicate a clean factor structure in which convergent and discriminant
validity are evident by the appropriate loadings within factors and no cross-loadings between
factors (Hair et al., 1998) and reliabilities of measures are presented in Table 2. All multiple-
item scales had reasonable reliability (between 0.564 and 0.719). In addition, a confirmatory
factor analysis (CFA) has been conducted on the proposed model to test for convergent factor
validity. Convergent validity was established as factor loadings for all the items were close or
greater than .50 and significant (p=<.05). In addition, the average variances extracted (AVEs)
12
were above .50 (Anderson and Gerbing, 1988). This indicates that the measures were
significantly related to the underlying dimensions. To assess discriminant validity among the
constructs, the AVEs were compared to the squared correlation estimates of the paired
measured constructs in the model (Fornell & Larcker, 1981). All AVE in are larger than the
corresponding interconstruct correlation estimates (SIC). This analysis included similarity
confusion, overload confusion, ambiguity confusion, word of mouth and trust. Satisfaction
was excluded because it is a single item measure and thus is not suited to such treatment. The
CFA model results demonstrate satisfactory fit to the data: X2 = 120.9, df = 55, p=0.000,
AGFI= .90, GFI=.94, NFI=.90, IFI=.94, CFI=.94, RMSEA=.06. All variables demonstrate
adequate construct reliability. Furthermore,
Insert Table 1, 2 and 3 About Here
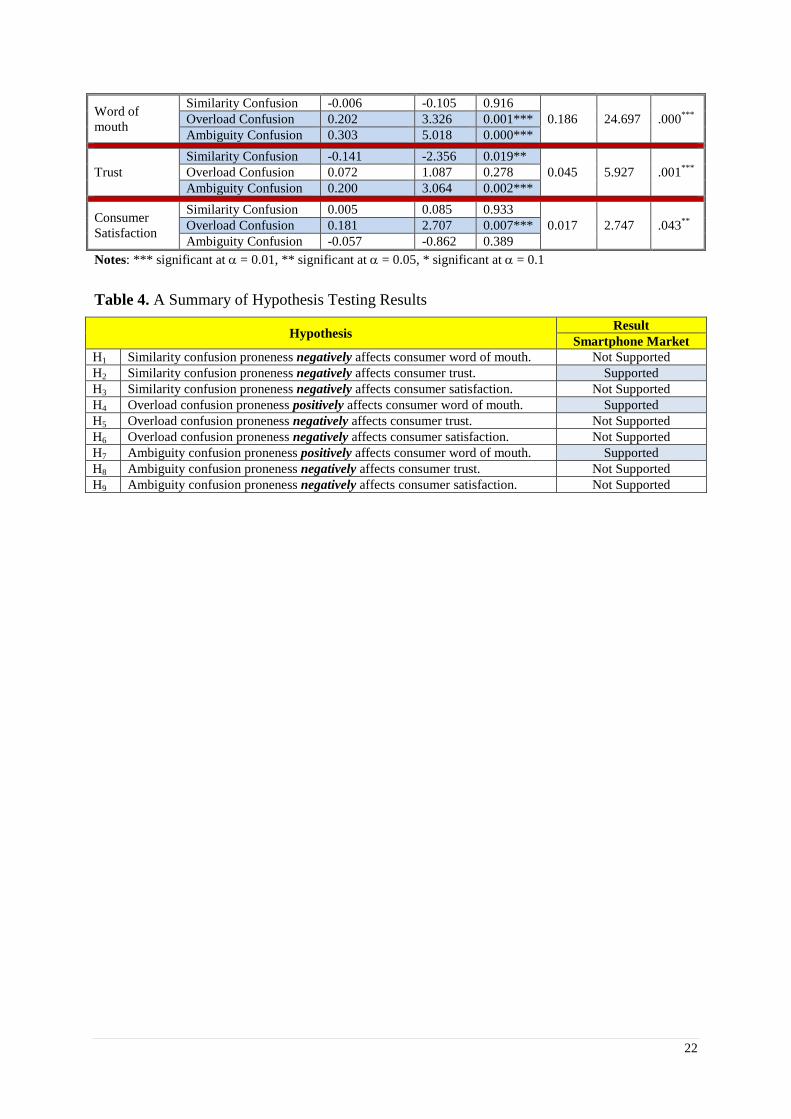
4.2.Behavioural effects of consumer confusion proneness
The effects of consumer confusion proneness on word of mouth, trust, and customer
satisfaction were examined using three multiple regressions. Similarity confusion, overload
confusion, and ambiguity confusion were treated as the independent variables in the three
regressions, while each of the behavioural consequences (i.e., word of mouth, trust, and
customer satisfaction) was used as the dependent variable in each regression, respectively.
Table 3 summarizes the multiple regression results. That is, we found support for only three
of the nine hypotheses. As predicted in H2, a significant negative effect was found (β = -
0.141, ρ = 0.019). This suggests that high degrees of perceived similarity confusion proneness
are associated with low levels of consumer trust, and vice versa. Supporting H4, the effect of
overload confusion on word of mouth was positive and significant (β = 0.202, ρ = 0.001). The
higher the degree of the overload confusion, the more likely consumers are to engage in word
of mouth communications in order to clarify some of their confusion, and vice versa.
13
Meanwhile, H7 postulated that ambiguity confusion has a significant positive impact on word
of mouth. A significant positive effect was found (β = 0.303, ρ = 0.000). Hence, H7 is
supported.
We also found that overload confusion has a significant positive effect on consumer
satisfaction (β = 0.181, ρ = 0.007) and ambiguity confusion positively affects consumer trust
(β = 0.200, ρ = 0.002). However, these contradict the hypothesized negative impacts.
Consequently, H6 and H8 are not supported.
Further, no significant effects of similarity confusion proneness on word of mouth (β
= -0.006, ρ = 0.916) and consumer satisfaction (β = 0.005, ρ = 0.933) were found. Similar
non-significant results were also found for the impact of overload confusion on consumer
trust (β = 0.072, ρ = 0.278) and the effect of ambiguity confusion on consumer satisfaction (β
= -0.057, ρ = 0.389). Therefore, H1, H3, H5, and H9 are not supported. A summary of the
hypothesis testing results are summarised on Table 4.
Insert Table 4 About Here
5. Discussion
Though no previous research has been published about consumer confusion in the Indonesian
market, it may be useful to draw on related research done in the Chinese context to help
explain our findings. Fan and Xiao (1998) suggest that consumer decision making styles may
be attributable to variations in consumer purchasing power and consumer market maturity.
Thus, because Indonesia is a developing economy that is characterized by a constantly
changing market structure (IMF, 2012) it is difficult for consumers to make purchase
decisions. Similar to transitional economies, the market is neither perfectly competitive nor
effectively regulated, counterfeit products are common, and consumer protection is poor (e.g.,
Fan and Xiao, 1998).
14
In terms of the smartphone market wherein rapid technology changes have contributed
to the availability of many smartphone brands with slightly different features, styles, designs,
and operating systems (e.g., iPhone, BlackBerry, Samsung, Nokia, Sony, LG, Nexian),
choosing a product is likely to be confusing for many consumers. This is aligned with Levitt’s
(1996) note that most of what is present in the marketplace is not innovations that are
necessary for social progress, but ‘innovation imitation’ or cloning that leave consumers
worse off (Erickson, 1994, p. 32). However, in contrast to these suggestions, though in line
with Walsh and Mitchell’s (2010) study, our findings show average scores for similarity
confusion (3.026), overload confusion (3.022), and ambiguity confusion (3.109), which
implies that the degree of consumer confusion proneness among the young adults samples is
close to neutral. This may be related to an automatic bounded rationality-induced information
reduction function performed by people who are faced with too much information (e.g.,
Simon, 1955). In this case, people reduce information to terms they commonly understand
and ignore information that they do not easily understand. Thus, they make decisions based
on imperfect information. Further, social networks or peer groups may help in alleviating the
burden imposed by similar, overload, and/or ambiguous information, by way of personal
recommendation regarding product or brand selection. This corresponds to our finding that
overload confusion proneness and ambiguity confusion proneness positively affects word of
mouth. Prior studies have also suggested that peer groups are highly influential in young
adults’ product purchase decisions (Makgosa and Mohube, 2007; Lingga and Tjiptono, 2010).
This finding is in line with Walsh and Mitchell’s study (2010).
Nevertheless, the present study failed to support six hypotheses. Similarity confusion
proneness had no effect on word of mouth (H1) and consumer satisfaction (H3). Overload
confusion did not significantly affect consumer trust (H5), while ambiguity confusion had a
non-significant impact on consumer satisfaction (H9). Unexpected results were found in the

15
current study for the effects of overload confusion on consumer satisfaction (H6) and
ambiguity confusion on consumer trust (H8). Similarly, in their study, Walsh and Mitchell
(2010) found no support for the impact of ambiguity confusion on consumer satisfaction (H9),
and an unexpected positive impact on trust (H8). These non-supported hypotheses imply that
cultural dimensions may play a role in influencing young adult consumers in Indonesia, with
respect to their behaviours toward word of mouth, trust and satisfaction. Future research may
consider the effects of different products and cultural contexts to help clarify the relevance
and impact of these factors.
6. Limitation and direction for future research
The present study has addressed the issue of how consumer confusion proneness affects word
of mouth, trust, and consumer satisfaction among youth in the Indonesian smartphone market.
This study contributes to the understanding of the behavioural consequences of the three
dimensions of consumer confusion proneness in the Indonesian smartphone market and
addressed research gaps put forward by Leek and Kun (2006), Walsh, Hennig-Thurau and
Mitchell (2007), and Walsh and Mitchell (2010), who recommended similar studies using
different geographical contexts.
In the context of Indonesia and when targeting young consumers, companies should
focus on defining unique product features instead of simply imitating competitor offerings,
because similarity confusion negatively affects consumer trust Moreover, managers should
consistently emphasise unique and value-adding features to overload the product. This will
lead to increased positive word of mouth, especially with the growing trend of social media
usage among young consumers in Indonesia.
Despite its contribution, the present study has some limitations. First, the results may
have limited generalizability due to the use of young adult samples and non-probability
16
sampling methods. Second, the geographical scope (only in Daerah Istimewa Yogyakarta,
Indonesia) and the product context (smartphones) may also limit its generalizability. Despite
different results to Walsh and Mitchell’s study (2010), an issue of interest is that each
dimension tends to have differential impacts on word of mouth, trust, and customer
satisfaction. Furthermore, it is important to investigate whether different research contexts
might contribute to divergent empirical findings. Therefore, additional studies are needed to
enrich the understanding of the dimensions of consumer confusion proneness and consumers’
behavioural consequences on other product categories.
7. Conclusion In this study we uncovered a difference between developing- and developed-economy
consumers in how they respond to ambiguity confusion, where Indonesian consumers react
with positive word-of-mouth, compared to a negative word-of-mouth effect for German
consumers as reported in Walsh, Hennig-Thurau, and Mitchell (2007). Furthermore, the
findings of our study are in contrast to the assumption that consumers are rational decision
makers who process extensive information to arrive at a perfectly weighted cost versus benefit
choice (Moore and Lehmann, 1980). Instead, our findings provide further support for prior
suggestions that consumers discount information and seek to verify its authenticity prior to
making decisions (Maute and Forrester, 1991). Indeed, consumers have only limited
information processing abilities (Simon, 1955; Newell and Simon, 1972). Thus, in their role
as consumers who must make choices, people distinguish between the availability and
processability of information because information must be both available and easily
processable to be useful (Russo, Kreiser, and Miyashita, 1975).

17
References Anderson, J. C., & Gerbing, D. W. (1988). Structural equation modeling in practice: A review and recommended two-step approach. Psychological Bulletin, 103 No. 3, 411-423. Bettman, J. R. (1979), An information processing theory of consumer choice Reading, MA: Addison-Wesley. Bettman, J. R., Johnson, E. J., and Payne, J. W. (1990), “A Componential Analysis of Cognitive Effort in Choice”, Organizational Behaviour and Human Decision Processes, Vol. 45, pp. 111–139. Bosshart, D. (2004), “Billig! Wie die Lust am Discount Wirtschaft und Gesellschaft verändert Ueberreuter/Redline”, 3rd edition 2004, 185 p. English translation: Cheap! The Real Cost of Bargains, Discount, and Consumer Choice. Kogan Page 2006, pp. 197 . D’Astous, A. (2000), “Irritating Aspects of the Shopping Environment”, Journal of Business Research, Vol. 49 No. 2, pp. 149–156. DeWulf, K., and Odeberken-Schröder, G. (2003), “Assessing the impact of a retailer’s relationship efforts on consumers’ attitudes and behaviour”, Journal of Retailing and Consumer Services, Vol. 10, pp. 95–108. Fan, J. X., and Xiao, J. J. (1998), “Consumer Decision Making Styles of Young Adult Chinese”, The Journal of Consumer Affairs, Vol. 32 No.2, pp. 275–294. Firman, M. (2010), “Teknologi”, available at: http://teknologi.vivanews.com. (accessed 3 March 2013). Fornell, C. and Larcker, D.F., (1981). Evaluating structural equation models with unobservable variables and measurement error. Journal of Marketing Research, Vol. 18 No. 1, 39-50. Foxman, E. R., Berger, P. W., and Cote, J. A. (1992). Consumer Brand Confusion: A Conceptual Framework. Psychology and Marketing, Vol. 9(3/4l), pp. 123–140. Hair, J. F., Anderson, R. E., Tatham, R. L., and Black, W. (1998). Multivariate Data Analysis, fifth edition, Pearson Education. Huda, E., and Waskita, D. (2012), “Samsung Sasar Pasar Mahasiswa”, available at: http://teknologi.news.viva.co.id/news/read/369552-samsung-sasar-pasar-mahasiswa (accessed 10 January 2013) Huffman, C., and Kahn, B. E. (1998), “Variety for Sale: Mass Customization or Mass Confusion?”, Journal of Retailing, Vol. 74 No. 4, pp. 491–513. IMF. (2012), Retrieved from IMF Advanced Economies List. World Economic Outlook, April 2012, p. 179.

18
Lakotta, J., and Jacob, F. (2008), “Customer Confusion in Service-to-Business Markets—Foundations and First Empirical Results”, ESCP–EAP Working Paper, Vol. 34 No.1, 1–21. Lee, C., and Green, R. T. (1991), “Cross cultural examinations of the Fishbein behavioural intentions model”, Journal of International Business Studies, Vol. 22, pp. 289–305. Leek, S., and Kun, D., (2006), “Consumer Confusion in the Chinese Personal Computer Market”, Journal of Product and Brand Management, Vol. 15 No. 3, pp. 184–193. Levitt, T. (1996), “Innovative imitation”, Harvard Business Review, Vol. 44, pp. 63–70. Lingga, T. P., and Tjiptono, F. (2010), “Peer Influence and Product Conspicuousness Among Youths”, Kinerja, Vol. 14 No. 4, pp. 297–311. Makgosa, R., and Mohube, K. (2007), “Peer Influence on Young Adults’ Products Purchase Decisions”, African Journal of Business Management, Vol. 6, pp. 183–194. Malhotra, N. K. (1984), “Information and Sensory Overload”, Psychology and Marketing, Vol. 1 Nos 3/4, pp. 9–21. Matzler, K., and Waiguny, M. (2005), “Consequences of Customer Confusion in Online Hotel Booking”, Information and Communication Technologies in Tourism, Vol. 10, pp. 306–317. Maute, M., and Forrester, F. (1991), “The Effect of Attribute Qualities on Consumer Decision Making: A Causal Model of External Information Search”, Journal of Economic Psychology, Vol. 12, pp. 643–666. Melouney, C. (2013), “A Good Looking Year for Luxury Brands”, Retrieved from http://www.thefinancialist.com/a-good-looking-year-for-luxury-brands/ Mitchell, V. W., and Papavassiliou, V. (1999), “Marketing Causes and Implications of Consumer Confusion”, Journal of Product and Brand Management, Vol. 8 No. 4, pp. 319–339. Mitchell, V. W., Walsh, G., and Yamin, M. (2005), “Towards a Conceptual Model of Consumer Confusion”, Advances in Consumer Research, Vol. 32 No. 1, pp. 143–150. Moore, W. L., and Lehmann, D. R. (1980), “Individual Differences in Search Behavior for a Nondurable”, Journal of Consumer Research, Vol. 7 No. 12,pp 296–307. Newell, A., and Simon, H. A. (1972), Human problem solving. Englewood Cliffs, NJ: Prentice-Hall. Persaud, A. and Azhar, I. (2012), “Innovative mobile marketing via smartphones: Are consumers ready?”, Marketing Intelligence & Planning, Vol. 30 No. 4, pp.418 - 443 Peter, J. P., and Olson, J. C. (2010), Consumer Behaviour, 9th edition, New York: McGraw Hill/Irwin.
19
Punj, G. N., and Stewart, D. W. (1983), “An Interaction Framework of Consumer Decision Making”, Journal of Consumer Research, Vol. 10 No. 2, pp. 181–196.
Ratchford, B. T. (1975), “The new economic theory of consumer behaviour: an interpretive essay”, Journal of Consumer Research, Vol. 2, pp. 65–75. Russo, J. E., Krieser, G., and Miyashita, S. (1975), “An Effective Display of Unit Price Information”, Journal of Marketing, Vol. 39 No.4,pp. 11–19. Safra, J.E. and Aguilar-Cauz, J. (2011), Time Almanac 2012, Chicago: Encyclopaedia Britannica, Inc. Schiffman, L.G., and Kanuk, L. L. (2010), Consumer Behavior, 10th Edition, Upper Saddle River, NJ: Pearson Education, Inc. Schweizer, M., Kotouc, A. J., and Wagner, T. (2006), “Scale Development for Consumer Confusion”, Advances in Consumer Research, Vol. 33,pp. 184–190. Simon, H. A. (1955), “A Behavioural Model of Rational Choice”, Quarterly Journal of Rational Choice, Vol. 63 No.2, 129–138. Suara Pembaruan (2012), “Pengguna Blackberry di Indonesia capai 97 juta”, available at: http://www.suarapembaruan.com/home/rim-2015-pengguna-blackberry-di-indonesia-capai-97-juta/15497 (accessed 5 February 2013). Suling, Y. (2010). Retrieved from http://www.thejakartapost.com/ Sundaram, D. S., Mitra, K., and Webster, C. (1998), “Word-of-Mouth Communications: A Motivational Analysis”, Advances in Consumer Research, Vol. 25,pp. 527–531. Turnbull, P. W., Leek, S., and Ying, G. (2000), “Customer Confusion: The Mobile Phone Market”, Journal of Marketing Management, Vol. 16,pp. 143–163. Wahono, T. (2010), “Penjualan Smartphones Melonjak 80 persen”, Retrieved from http://tekno.kompas.com/read/2010/10/28/14173984/Penjualan.Smartphone.Melonjak.80.Persen Walsh, G., and Mitchell, V. W. (2010), “The Effect of Consumer Confusion Proneness on Word of Mouth, Trust, and Customer Satisfaction”, European Journal of Marketing, Vol. 44 No. 6,pp. 838–859. Walsh, G., Hennig-Thurau, T., and Mitchell, V. W., (2007), “Consumer Confusion Proneness: Scale Development, Validation, and Application”, Journal of Marketing Management, Vol. 23 Nos 7–8,pp. 697–721. Waluyo, E. A. (2012), “Pasar Notebook semakin menggairahkan”, available at: http://the-marketeers.com/archives/pasar-notebook-premium-semakin-menggairahkan.html (accessed 10 March 2013).
20
Zainuddin, S. K. (2012), “Brave New World for Smartphones”, Available at: http://www.thejakartaglobe.com/companies/brave-new-world-for-smartphones/528382 (accessed 13 March 2013). Appendix Figure 1. Consumer Confusion Proneness and Its Behavioural Consequences
Behavioural
Similarity Confusion
Overload Confusion
Ambiguity Confusion
Word of Mouth
Trust
Customer Satisfaction
Consumer Confusion
Source: Adapted from Walsh and Mitchell (2010)
21
Table 1. Factor Structure of Consumer Confusion Proneness Dimensions [Smartphone
Market] Items Similarity
Confusion Overload Confusion
Ambiguity Confusion
Due to the great similarity of many smartphone products, it is often difficult to detect new products. 0.826
Some smartphone brands look so similar that it is uncertain whether they are made by the same manufacturer or not.
0.846
I do not always know exactly which smartphone meets my needs best. 0.711
There are so many smartphone brands to choose from that I sometime feel confused. 0.735
Due to the host of stores it is sometimes difficult to decide where to shop. 0.772
Smartphone products often have so many features that a comparison of different brands is barely possible. 0.508
The information I get from advertising often is so vague that it is hard to know what a smartphone can actually perform.
0.640
When buying a smartphone I rarely feel sufficiently informed. 0.731
When purchasing a smartphone, I feel uncertain as to product features that are particularly important for me. 0.731
Table 2. Construct Intercorrelations and Reliability [Smartphone Market] 1 2 3 4 5 6 1. Similarity Confusion 1 2. Overload Confusion 0.345** 1 3. Ambiguity Confusion 0.326** 0.509** 1 4. Word of Mouth 0.163** 0.355** 0.404** 1 5. Trust -0.051 0.125* 0.191** 0.201** 1 6. Consumer Satisfaction 0.048 0.154** 0.037 0.038 0.035 1 Cronbach’s Alpha 0.719 0.693 0.664 0.564 0.624 n.a. Number of Items 2 3 4 6 3 1 Mean 3.026 3.022 3.109 3.132 3.350 3.140 Standard Deviation 0.916 0.848 0.773 0.582 0.726 0.886 Note: ** Correlation is significant at the 0.01 level (2-tailed); * correlation is significant at the 0.05 level (2-tailed). Table 3. Behavioural Consequences of Consumer Confusion Proneness Dimensions [Smartphone Market]
Dependent Variable Independent Variable Standardized
Beta t Adj. R
Square F
Value Sig. Value Sig.
22
Word of mouth
Similarity Confusion -0.006 -0.105 0.916 0.186 24.697 .000*** Overload Confusion 0.202 3.326 0.001***
Ambiguity Confusion 0.303 5.018 0.000***
Trust Similarity Confusion -0.141 -2.356 0.019**
0.045 5.927 .001*** Overload Confusion 0.072 1.087 0.278 Ambiguity Confusion 0.200 3.064 0.002***
Consumer Satisfaction
Similarity Confusion 0.005 0.085 0.933 0.017 2.747 .043** Overload Confusion 0.181 2.707 0.007***
Ambiguity Confusion -0.057 -0.862 0.389 Notes: *** significant at α = 0.01, ** significant at α = 0.05, * significant at α = 0.1
Table 4. A Summary of Hypothesis Testing Results
Hypothesis Result Smartphone Market
H1 Similarity confusion proneness negatively affects consumer word of mouth. Not Supported H2 Similarity confusion proneness negatively affects consumer trust. Supported H3 Similarity confusion proneness negatively affects consumer satisfaction. Not Supported H4 Overload confusion proneness positively affects consumer word of mouth. Supported H5 Overload confusion proneness negatively affects consumer trust. Not Supported H6 Overload confusion proneness negatively affects consumer satisfaction. Not Supported H7 Ambiguity confusion proneness positively affects consumer word of mouth. Supported H8 Ambiguity confusion proneness negatively affects consumer trust. Not Supported H9 Ambiguity confusion proneness negatively affects consumer satisfaction. Not Supported