1
APMP.QM-S2.1 report
Comparison APMP.QM-S2.1
Oxygen in nitrogen at atmospheric level
Final Report
ByungMoon Kim1, Kwangsub Kim
1, Jinsang Jung
1,*, Sanghyub Oh
1, Liu Hui
2, Hou Li
2, Teo
Beng Keat2, Chua Hock Ann
2
1Korea Research Institute of Standards and Science (KRISS), Center for Gas Analysis, 267
Gajeong-ro, Yuseong-Gu, Daejeon 305-340, Republic of Korea 2National Metrology Centre, A*STAR, #02-27 TUV SUD PSB building, 1 Science Park Drive,
118221, Singapore
*Corresponding to Jinsang Jung: [email protected]
Field Amount of substance
Subject Comparison of 0.2 mol/mol oxygen in nitrogen
Participants KRISS(Korea), NMC/A*STAR(Singapore)
Organizing body APMP
Table of contents
Introduction……………………………………………………………………………………....3
Supported CMC claims…………………………………………………………………………...3
Schedule…………………………………………………………………………..…….………...3
Process of the comparison………………………………………………………………………..4
Measurement protocol………………………………………………………………………..…..5
Measurement methods…………………………………………………………………………....5
2
Degrees of equivalence…………………………………………………………………………...6
Result………………………………………………………………………….………….……....7
Conclusion………………………………………………………………………….……….…....9
Appendix A. Verification of mixtures with GC-TCD………………………………….………..10
Appendix B. Report from each laboratory……………………………………………….………13

3
Introduction
NMC/A*STAR has a schedule to start the calibration service of oxygen in nitrogen gas mixtures
near atmospheric concentration in recent years. NMC/A*STAR is required to show its
competence in measurement and calibration of oxygen at these concentration levels. KRISS and
NMC/A*STAR agreed to collaborate in the area of gas metrology. KRISS organize a bilateral
comparison between KRISS and NMC/A*STAR to show the comparability between them. This
comparison was suggested and approved in the meetings of APMP TCQM in November 2013
and CCQM GAWG in April 2014.
This document describes results of the bilateral comparison of an oxygen in nitrogen gas
mixture. The nominal amount-of-substance fraction was 0.2 mol/mol oxygen in nitrogen.
Supported CMC claims
This comparison can be used to support CMC claims for oxygen in nitrogen matrix from 0.05
mol/mol to 0.3 mol/mol if same impurity analysis and uncertainty evaluation are performed
based on participants’ reports.
Schedule
November 2013 Protocol issued by KRISS
January 2014 Preparation of mixtures and first verification measurement
April 2014 Shipment of sample cylinder to participating laboratory
(NMC/A*STAR)
31 July 2014 Submission of measurement report to KRISS
September 2014 Return of the sample cylinder to KRISS
March 2015 Second verification measurement
April 2015 Draft A report

4
April 2015 Draft B report
August 2015 Draft B APMP TCQM review
October 2015 Draft B CCQM GAWG review
October 2015 Final approved
Process of the comparison
A set of mixtures of oxygen in nitrogen with nominal fractional amounts of 0.2 mol/mol was
prepared gravimetrically according to ISO 6142 [1]. The mixtures were verified against primary
reference mixtures. The pressure in the cylinders was approximately 100 bar and Luxfer
cylinders of 10 dm3 nominal were used. The amount-of-substance fractions were derived from
gravimetry, molar mass, and purity verification of the parent gases. The gravimetric values were
used as the Key Comparison Reference Values (KCRVs). Thus, each cylinder has its own
reference value.
The participating laboratory was requested to specify in detail which analytical method(s) were
used and how the measurement uncertainty was evaluated. The participating laboratory was
responsible for the calibration of its own equipment. For a proper evaluation of the data, it was
necessary that the calibration method, as well as the way in which the calibration mixtures were
prepared, were reported to the coordinating laboratory.
The laboratory was asked to express the uncertainty on all results withthe evaluation of
measurement uncertainty in accordance with the “Guide to the express of uncertainty in
measurement” (ISO GUM). The participant was asked to provide a detailed description of the
uncertainty budget, including:
- method of evaluation (type A or B)
- (assumed) probability distribution
- standard uncertainties and sensitivity coefficients
5
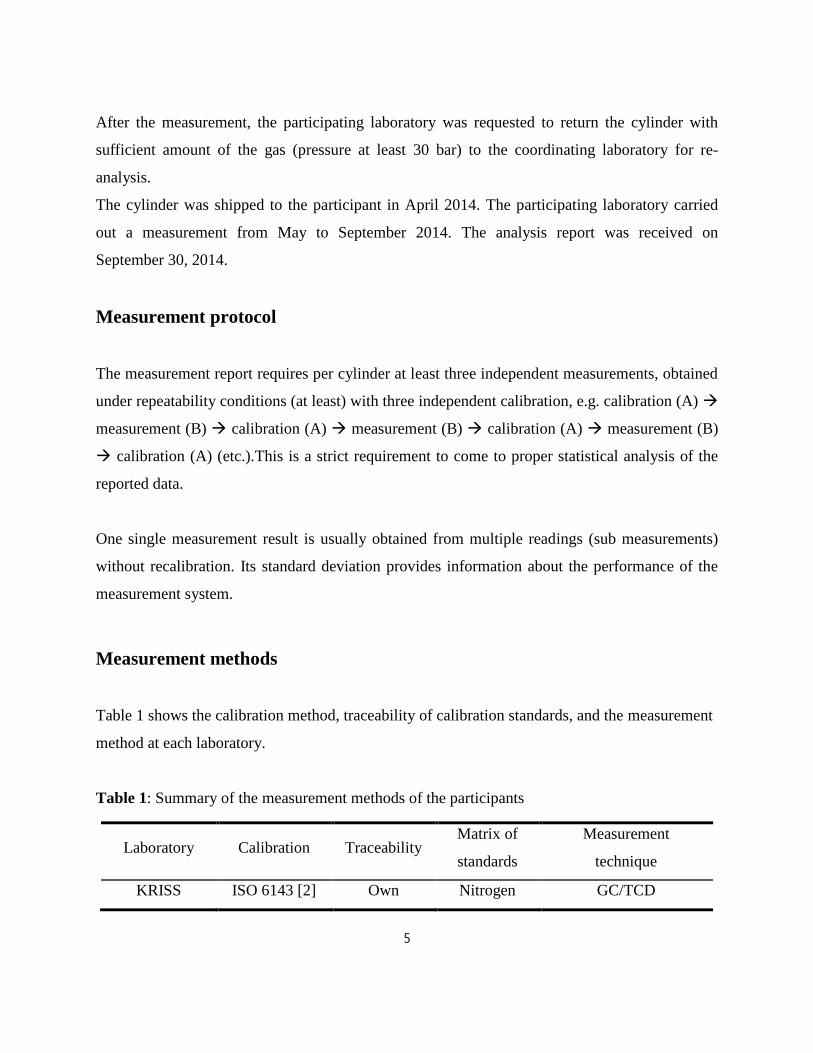
After the measurement, the participating laboratory was requested to return the cylinder with
sufficient amount of the gas (pressure at least 30 bar) to the coordinating laboratory for re-
analysis.
The cylinder was shipped to the participant in April 2014. The participating laboratory carried
out a measurement from May to September 2014. The analysis report was received on
September 30, 2014.
Measurement protocol
The measurement report requires per cylinder at least three independent measurements, obtained
under repeatability conditions (at least) with three independent calibration, e.g. calibration (A)
measurement (B) calibration (A) measurement (B) calibration (A) measurement (B)
calibration (A) (etc.).This is a strict requirement to come to proper statistical analysis of the
reported data.
One single measurement result is usually obtained from multiple readings (sub measurements)
without recalibration. Its standard deviation provides information about the performance of the
measurement system.
Measurement methods
Table 1 shows the calibration method, traceability of calibration standards, and the measurement
method at each laboratory.
Table 1: Summary of the measurement methods of the participants
Laboratory Calibration Traceability Matrix of
standards
Measurement
technique
KRISS ISO 6143 [2] Own Nitrogen GC/TCD

6
standards
NMC/A*STAR ISO 6143 Own
standards Nitrogen
ABB paramagnetic
oxygen analyzer
Degrees of equivalence
A unilateral degree of equivalence, Di, is adopted in this comparison.
∆𝑥𝑖 = 𝐷𝑖 = (𝑥𝑙𝑎𝑏,𝑖 − 𝑥𝑟𝑒𝑓,𝑖)
The uncertainty of the difference, Di, corresponds to 95% level of confidence. Here, xlab,i is a
reported value of the APMP.QM-S2.1 sample i from the participating laboratory and xref,i is the
reference value of the APMP.QM-S2.1 sample i and based on the gravimetric concentration
determined by KRISS.
The standard uncertainty of Di can be expressed as;
𝑢2(𝐷𝑖) = 𝑢𝑙𝑎𝑏,𝑖2 + 𝑢𝑟𝑒𝑓,𝑖
2
where ulab,i and uref,i are the uncertainties of xlab,i and xref,i, respectively. The reference value, xref,i
can be expressed as;
𝑥𝑟𝑒𝑓,𝑖 = 𝑥𝑝𝑟𝑒𝑝,𝑖 + ∆𝑥𝑣𝑒𝑟,𝑖 + ∆𝑥𝑙𝑡𝑠,𝑖
where xprep,i is the amount of substance of a target component in APMP.QM-S2.1 sample i and
obtained from gravimetric preparation. The Δxver,i is the difference between the gravimetric value
and measured one during verification analysis. The Δxlts,i is the difference between the
gravimetric value and measured one during long-term stability study which was performed
before and after the sample cylinder for NMC/A*STAR returned to KRISS. Results showed that
Δxver,i and Δxlts,i were smaller than the expanded analytical uncertainty, and thereby both Δxver,i
and Δxlts,i were set to zero.
Assuming independence between errors, the uncertainty of xref,i, uref,i can be expressed as;
𝑢𝑟𝑒𝑓,𝑖2 = 𝑢𝑝𝑟𝑒𝑝,𝑖
2 + 𝑢𝑣𝑒𝑟,𝑖2 + 𝑢𝑙𝑡𝑠,𝑖
2
where uprep,i, uver,i, and, ults,i are the uncertainties of xprep,i , xver,i, and xlts,i, respectively.
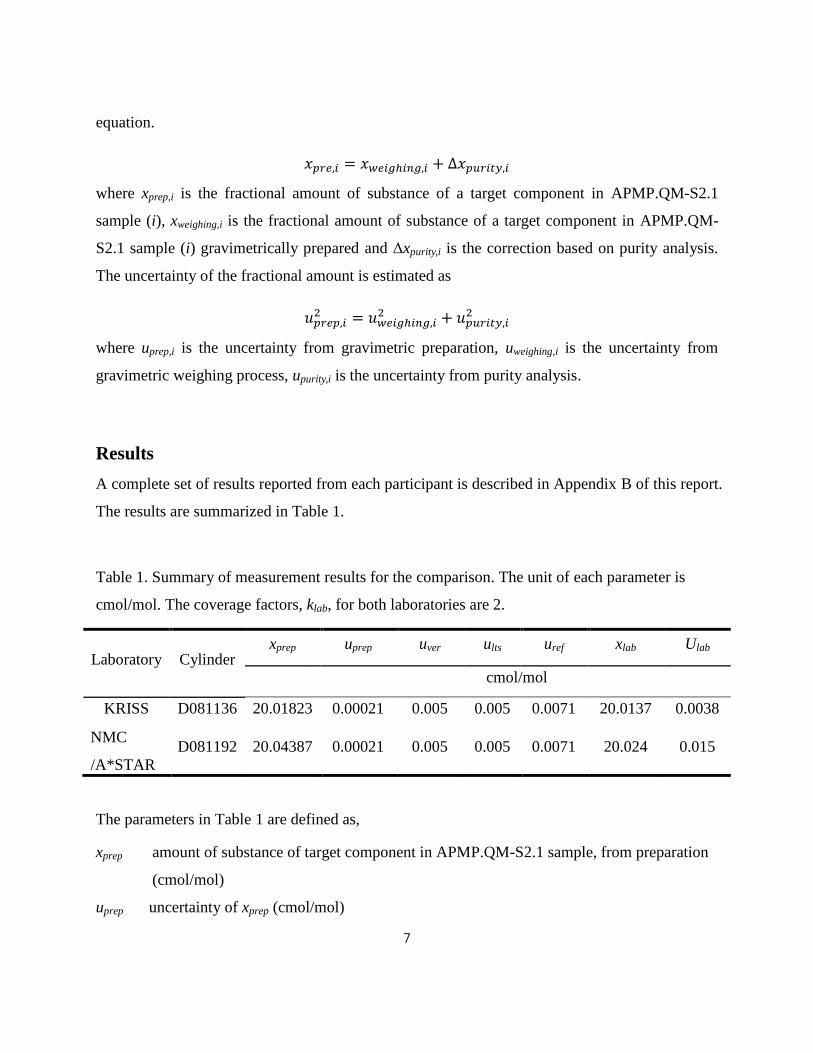
In the gravimetric preparation, the amount of a target component is determined by the following
7
equation.
𝑥𝑝𝑟𝑒,𝑖 = 𝑥𝑤𝑒𝑖𝑔ℎ𝑖𝑛𝑔,𝑖 + ∆𝑥𝑝𝑢𝑟𝑖𝑡𝑦,𝑖
where xprep,i is the fractional amount of substance of a target component in APMP.QM-S2.1
sample (i), xweighing,i is the fractional amount of substance of a target component in APMP.QM-
S2.1 sample (i) gravimetrically prepared and Δxpurity,i is the correction based on purity analysis.
The uncertainty of the fractional amount is estimated as
𝑢𝑝𝑟𝑒𝑝,𝑖2 = 𝑢𝑤𝑒𝑖𝑔ℎ𝑖𝑛𝑔,𝑖
2 + 𝑢𝑝𝑢𝑟𝑖𝑡𝑦,𝑖2
where uprep,i is the uncertainty from gravimetric preparation, uweighing,i is the uncertainty from
gravimetric weighing process, upurity,i is the uncertainty from purity analysis.
Results
A complete set of results reported from each participant is described in Appendix B of this report.
The results are summarized in Table 1.
Table 1. Summary of measurement results for the comparison. The unit of each parameter is
cmol/mol. The coverage factors, klab, for both laboratories are 2.
Laboratory Cylinder xprep uprep uver ults uref xlab Ulab
cmol/mol
KRISS D081136 20.01823 0.00021 0.005 0.005 0.0071 20.0137 0.0038
NMC
/A*STAR
TAR
D081192 20.04387 0.00021 0.005 0.005 0.0071 20.024 0.015
The parameters in Table 1 are defined as,
xprep amount of substance of target component in APMP.QM-S2.1 sample, from preparation
(cmol/mol)
uprep uncertainty of xprep (cmol/mol)
8
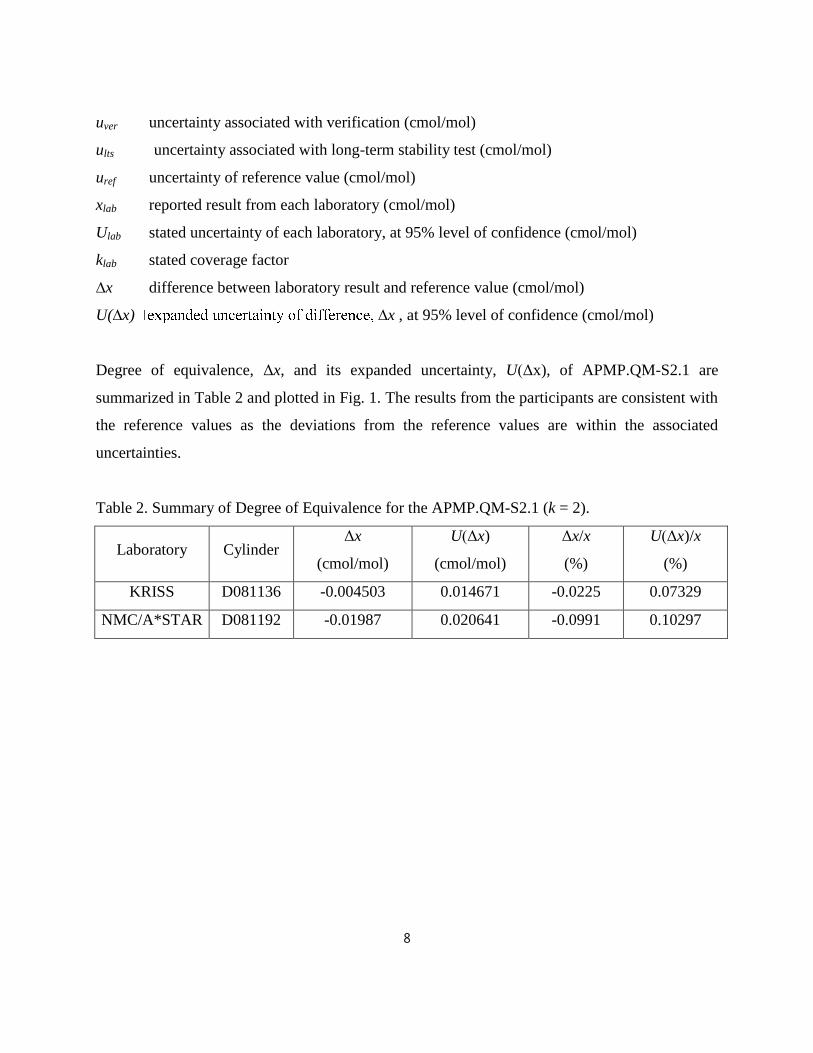
uver uncertainty associated with verification (cmol/mol)
ults uncertainty associated with long-term stability test (cmol/mol)
uref uncertainty of reference value (cmol/mol)
xlab reported result from each laboratory (cmol/mol)
Ulab stated uncertainty of each laboratory, at 95% level of confidence (cmol/mol)
klab stated coverage factor
∆x difference between laboratory result and reference value (cmol/mol)
U(∆x) ∆x , at 95% level of confidence (cmol/mol)
Degree of equivalence, Δx, and its expanded uncertainty, U(Δx), of APMP.QM-S2.1 are
summarized in Table 2 and plotted in Fig. 1. The results from the participants are consistent with
the reference values as the deviations from the reference values are within the associated
uncertainties.
Table 2. Summary of Degree of Equivalence for the APMP.QM-S2.1 (k = 2).
Laboratory Cylinder Δx
(cmol/mol)
U(Δx)
(cmol/mol)
Δx/x
(%)
U(Δx)/x
(%)
KRISS D081136 -0.004503 0.014671 -0.0225 0.07329
NMC/A*STAR D081192 -0.01987 0.020641 -0.0991 0.10297
9
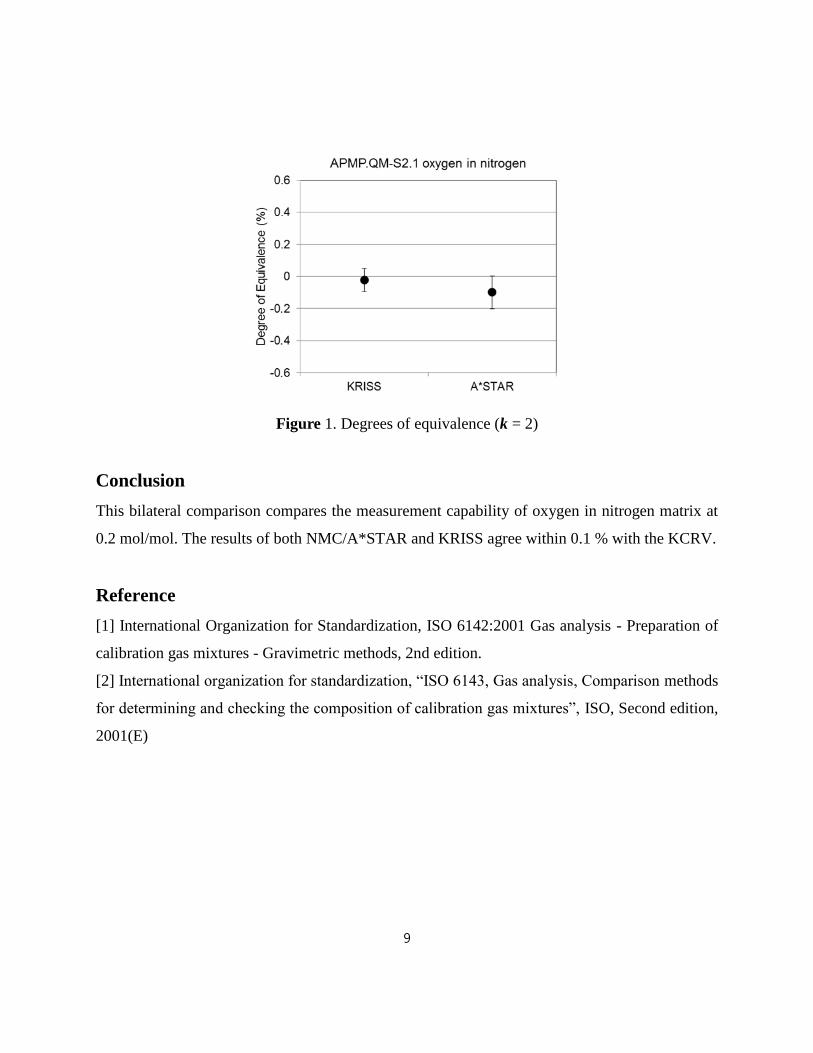
Figure 1. Degrees of equivalence (k = 2)
Conclusion
This bilateral comparison compares the measurement capability of oxygen in nitrogen matrix at
0.2 mol/mol. The results of both NMC/A*STAR and KRISS agree within 0.1 % with the KCRV.
Reference
[1] International Organization for Standardization, ISO 6142:2001 Gas analysis - Preparation of
calibration gas mixtures - Gravimetric methods, 2nd edition.
[2] International organization for standardization, “ISO 6143, Gas analysis, Comparison methods
for determining and checking the composition of calibration gas mixtures”, ISO, Second edition,
2001(E)

10
Appendix A. Verification of mixtures with GC-TCD
Four reference gas mixtures were prepared gravimetrically by KRISS according to ISO 6142.
Table 1 shows a data set of gravimetric concentrations of each cylinder and their relative peak
area of a GC-TCD (HP-7890) compared to a working reference mixture (~20% oxygen in
nitrogen).
Table 1. Analyzed results of four reference gas mixtures of oxygen in nitrogen prepared by
KRISS using a GC-TCD analyzer.
Mixture No.
R
xprep,r
(µmol/mol)
uprep,r
(µmol/mol) yr u(yr)
D325959 204629.0 1.9 1.0230 0.0002
D325944 195244.0 1.9 0.9759 0.00019
D081136(KRISS) 200182.3 2.1 1.0003 0.0002
D081192(A*STAR) 200438.7 2.1 1.0020 0.0002
xprep : gravimetric concentration of reference gas mixtures,
uprep : standard uncertainty of xprep ,
yr : corrected response relative to a QC cylinder (D155880, ~20% oxygen in nitrogen) of GC-
TCD,
u(yr) : standard uncertainty of yr
Linear regression result of xprep,r versus yr in Table 1 is shown in Table 2. The uncertainty of the
linear regression fit is also shown in Table 2.
Table 2. Parameters of a linear regression fit, y = a0 + a1 · x
Parameter Value
a0 -0.00525
u(a0) 0.00742
a1 5.02467×10⁻⁶
u(a1) 3.70584×10⁻⁸
11
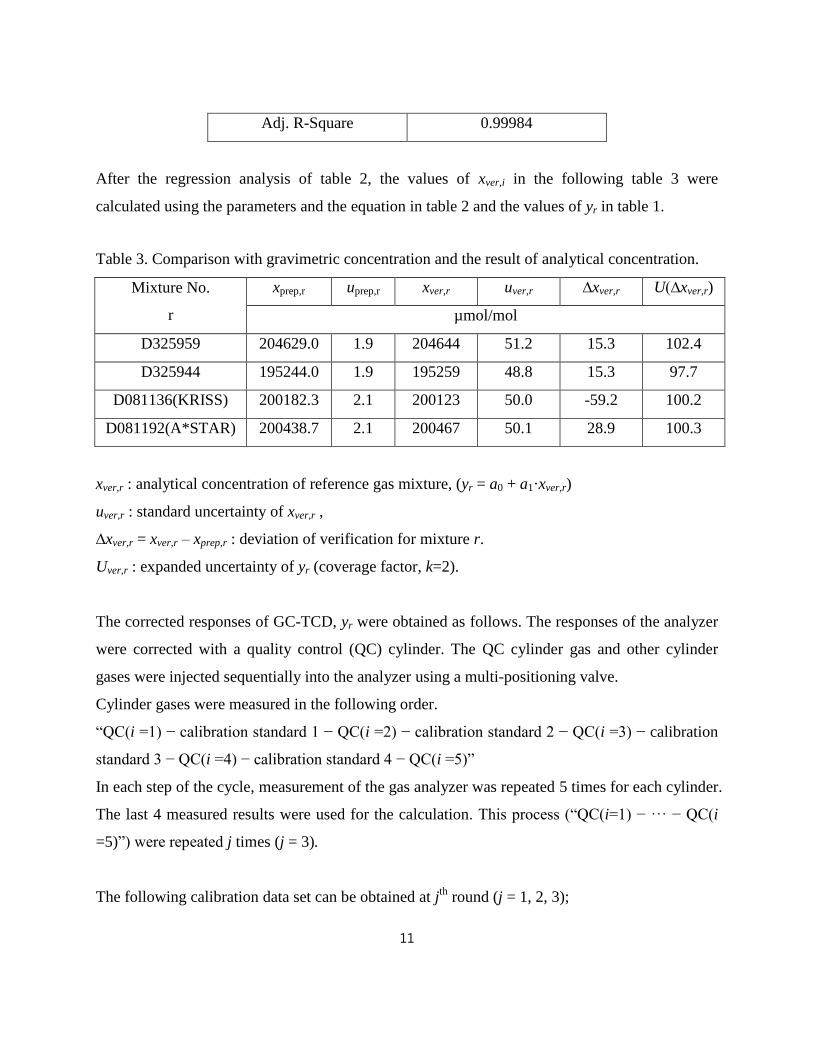
Adj. R-Square 0.99984
After the regression analysis of table 2, the values of xver,i in the following table 3 were
calculated using the parameters and the equation in table 2 and the values of yr in table 1.
Table 3. Comparison with gravimetric concentration and the result of analytical concentration.
Mixture No.
r
xprep,r uprep,r xver,r uver,r ∆xver,r U(∆xver,r)
µmol/mol
D325959 204629.0 1.9 204644 51.2 15.3 102.4
D325944 195244.0 1.9 195259 48.8 15.3 97.7
D081136(KRISS) 200182.3 2.1 200123 50.0 -59.2 100.2
D081192(A*STAR) 200438.7 2.1 200467 50.1 28.9 100.3
xver,r : analytical concentration of reference gas mixture, (yr = a0 + a1·xver,r)
uver,r : standard uncertainty of xver,r ,
∆xver,r = xver,r – xprep,r : deviation of verification for mixture r.
Uver,r : expanded uncertainty of yr (coverage factor, k=2).
The corrected responses of GC-TCD, yr were obtained as follows. The responses of the analyzer
were corrected with a quality control (QC) cylinder. The QC cylinder gas and other cylinder
gases were injected sequentially into the analyzer using a multi-positioning valve.
Cylinder gases were measured in the following order.
“QC(i =1) − calibration standard 1 − QC(i =2) − calibration standard 2 − QC(i =3) − calibration
standard 3 − QC(i =4) − calibration standard 4 − QC(i =5)”
In each step of the cycle, measurement of the gas analyzer was repeated 5 times for each cylinder.
The last 4 measured results were used for the calculation. This process (“QC(i=1) − ··· − QC(i
=5)”) were repeated j times (j = 3).
The following calibration data set can be obtained at jth
round (j = 1, 2, 3);
12
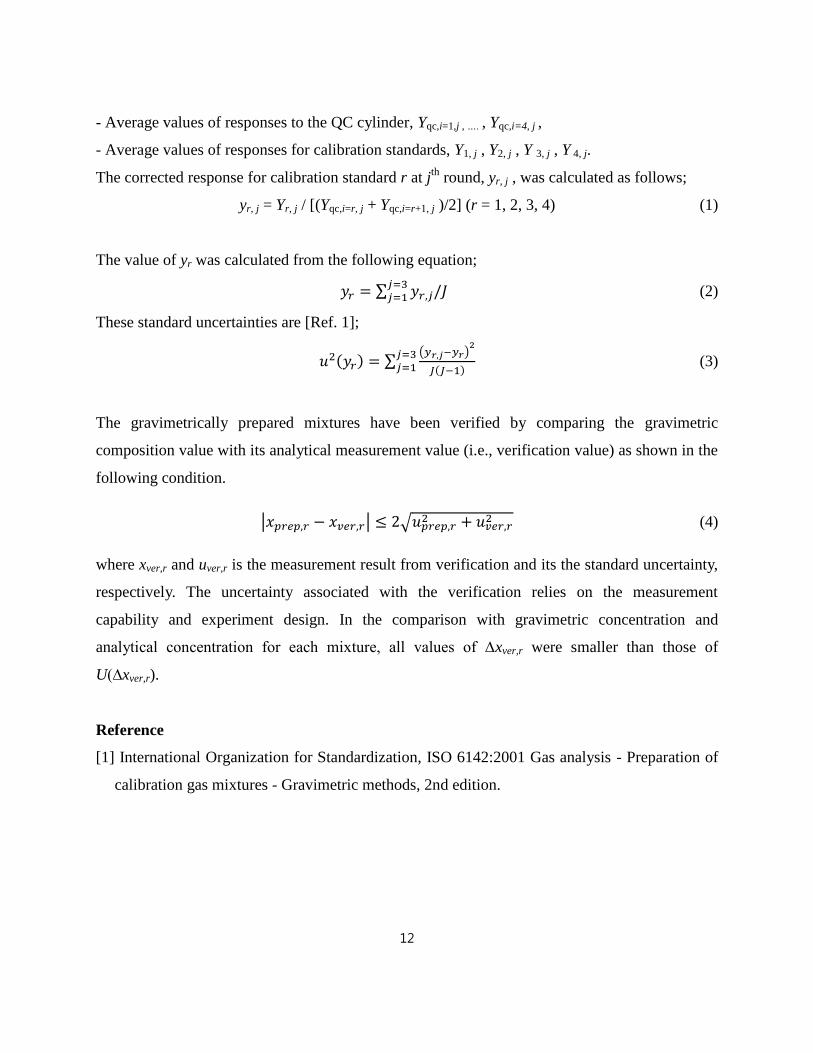
- Average values of responses to the QC cylinder, Yqc,i=1,j , …. , Yqc,i=4, j ,
- Average values of responses for calibration standards, Y1, j , Y2, j , Y 3, j , Y 4, j.
The corrected response for calibration standard r at jth
round, yr, j , was calculated as follows;
yr, j = Yr, j / [(Yqc,i=r, j + Yqc,i=r+1, j )/2] (r = 1, 2, 3, 4) (1)
The value of yr was calculated from the following equation;
𝑦𝑟 = ∑ 𝑦𝑟,𝑗/𝐽𝑗=3𝑗=1 (2)
These standard uncertainties are [Ref. 1];
𝑢2(𝑦𝑟) = ∑(𝑦𝑟,𝑗−𝑦𝑟)
2
𝐽(𝐽−1)
𝑗=3𝑗=1 (3)
The gravimetrically prepared mixtures have been verified by comparing the gravimetric
composition value with its analytical measurement value (i.e., verification value) as shown in the
following condition.
|𝑥𝑝𝑟𝑒𝑝,𝑟 − 𝑥𝑣𝑒𝑟,𝑟| ≤ 2√𝑢𝑝𝑟𝑒𝑝,𝑟2 + 𝑢𝑣𝑒𝑟,𝑟2 (4)
where xver,r and uver,r is the measurement result from verification and its the standard uncertainty,
respectively. The uncertainty associated with the verification relies on the measurement
capability and experiment design. In the comparison with gravimetric concentration and
analytical concentration for each mixture, all values of ∆xver,r were smaller than those of
U(∆xver,r).
Reference
[1] International Organization for Standardization, ISO 6142:2001 Gas analysis - Preparation of
calibration gas mixtures - Gravimetric methods, 2nd edition.

13
Appendix B. Report from each laboratory
Laboratory: KRISS (Korea Research Institute of Standards and Science), Korea
Cylinder number: D081136
Measurement 1#
Component Date
(dd/mm/yy)
Result
(cmol/mol)
Standard
deviation
(% relative)
Number of
replicates
O2 27/03/15 20.0120 0.0074 3
Measurement 2#
Component Date
(dd/mm/yy)
Result
(cmol/mol)
Standard
deviation
(% relative)
Number of
replicates
O2 28/03/15 20.0158 0.018 3
Measurement 3#
Component Date
(dd/mm/yy)
Result
(cmol/mol)
Standard
deviation
(% relative)
Number of
replicates
O2 29/03/15 20.0134 0.0081 3
Results
Component Result
(cmol/mol)
Expanded uncertainty
(cmol/mol) Coverage factor*
O2 20.0137 0.0038 (0.0192 %) 2
*The coverage factor shall be based on approximately 95% confidence.
14
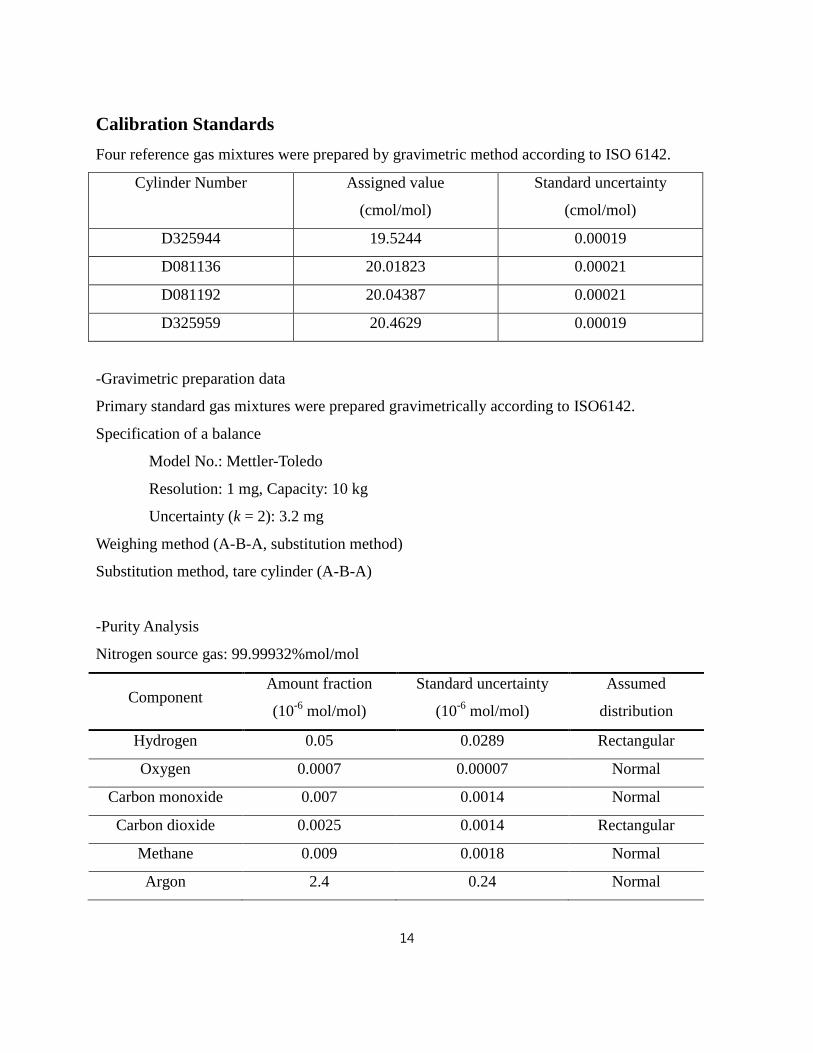
Calibration Standards
Four reference gas mixtures were prepared by gravimetric method according to ISO 6142.
Cylinder Number Assigned value
(cmol/mol)
Standard uncertainty
(cmol/mol)
D325944 19.5244 0.00019
D081136 20.01823 0.00021
D081192 20.04387 0.00021
D325959 20.4629 0.00019
-Gravimetric preparation data
Primary standard gas mixtures were prepared gravimetrically according to ISO6142.
Specification of a balance
Model No.: Mettler-Toledo
Resolution: 1 mg, Capacity: 10 kg
Uncertainty (k = 2): 3.2 mg
Weighing method (A-B-A, substitution method)
Substitution method, tare cylinder (A-B-A)
-Purity Analysis
Nitrogen source gas: 99.99932%mol/mol
Component Amount fraction
(10-6
mol/mol)
Standard uncertainty
(10-6
mol/mol)
Assumed
distribution
Hydrogen 0.05 0.0289 Rectangular
Oxygen 0.0007 0.00007 Normal
Carbon monoxide 0.007 0.0014 Normal
Carbon dioxide 0.0025 0.0014 Rectangular
Methane 0.009 0.0018 Normal
Argon 2.4 0.24 Normal
15
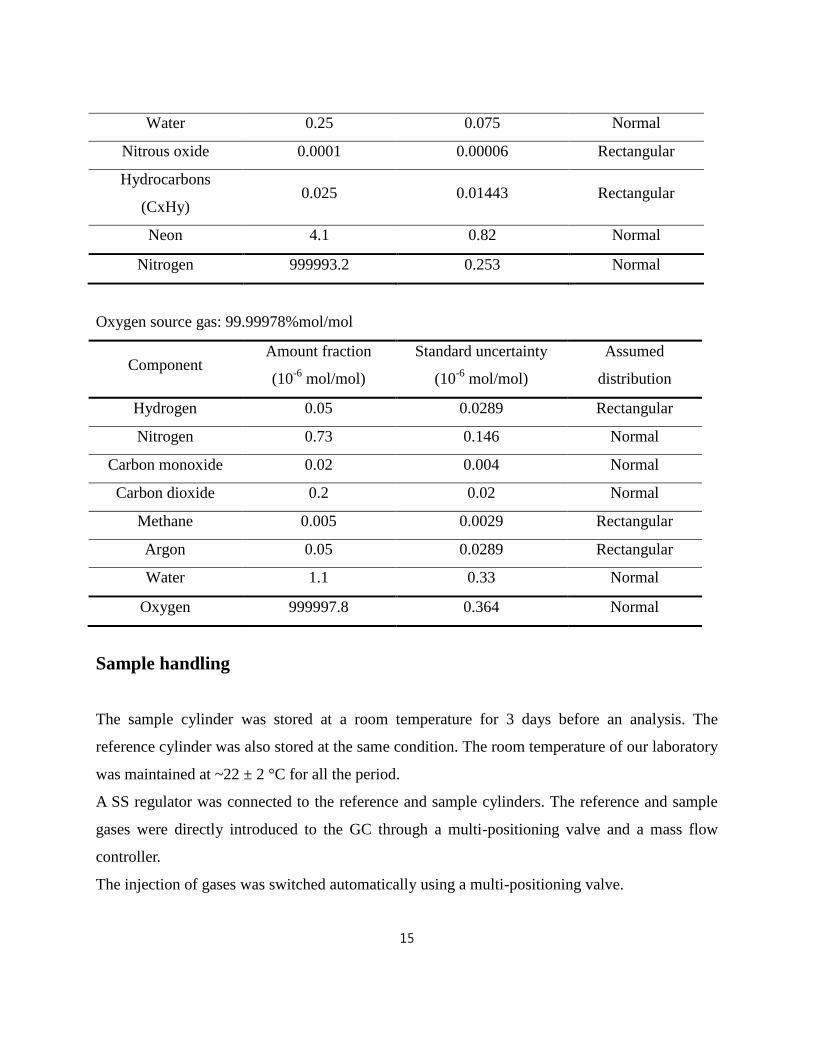
Water 0.25 0.075 Normal
Nitrous oxide 0.0001 0.00006 Rectangular
Hydrocarbons
(CxHy) 0.025 0.01443 Rectangular
Neon 4.1 0.82 Normal
Nitrogen 999993.2 0.253 Normal
Oxygen source gas: 99.99978%mol/mol
Component Amount fraction
(10-6
mol/mol)
Standard uncertainty
(10-6
mol/mol)
Assumed
distribution
Hydrogen 0.05 0.0289 Rectangular
Nitrogen 0.73 0.146 Normal
Carbon monoxide 0.02 0.004 Normal
Carbon dioxide 0.2 0.02 Normal
Methane 0.005 0.0029 Rectangular
Argon 0.05 0.0289 Rectangular
Water 1.1 0.33 Normal
Oxygen 999997.8 0.364 Normal
Sample handling
The sample cylinder was stored at a room temperature for 3 days before an analysis. The
reference cylinder was also stored at the same condition. The room temperature of our laboratory
was maintained at ~22 ± 2 °C for all the period.
A SS regulator was connected to the reference and sample cylinders. The reference and sample
gases were directly introduced to the GC through a multi-positioning valve and a mass flow
controller.
The injection of gases was switched automatically using a multi-positioning valve.
16
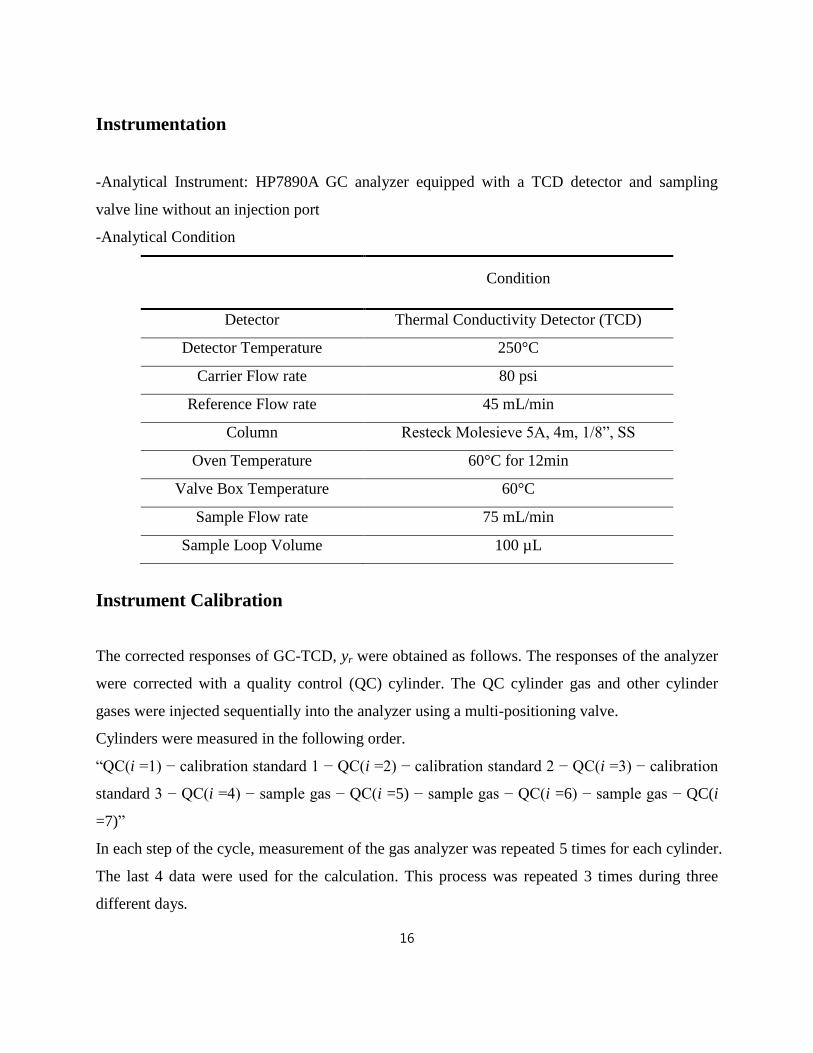
Instrumentation
-Analytical Instrument: HP7890A GC analyzer equipped with a TCD detector and sampling
valve line without an injection port
-Analytical Condition
Condition
Detector Thermal Conductivity Detector (TCD)
Detector Temperature 250°C
Carrier Flow rate 80 psi
Reference Flow rate 45 mL/min
Column Resteck Molesieve 5A, 4m, 1/8”, SS
Oven Temperature 60°C for 12min
Valve Box Temperature 60°C
Sample Flow rate 75 mL/min
Sample Loop Volume 100 µL
Instrument Calibration
The corrected responses of GC-TCD, yr were obtained as follows. The responses of the analyzer
were corrected with a quality control (QC) cylinder. The QC cylinder gas and other cylinder
gases were injected sequentially into the analyzer using a multi-positioning valve.
Cylinders were measured in the following order.
“QC(i =1) − calibration standard 1 − QC(i =2) − calibration standard 2 − QC(i =3) − calibration
standard 3 − QC(i =4) − sample gas − QC(i =5) − sample gas − QC(i =6) − sample gas − QC(i
=7)”
In each step of the cycle, measurement of the gas analyzer was repeated 5 times for each cylinder.
The last 4 data were used for the calculation. This process was repeated 3 times during three
different days.
17
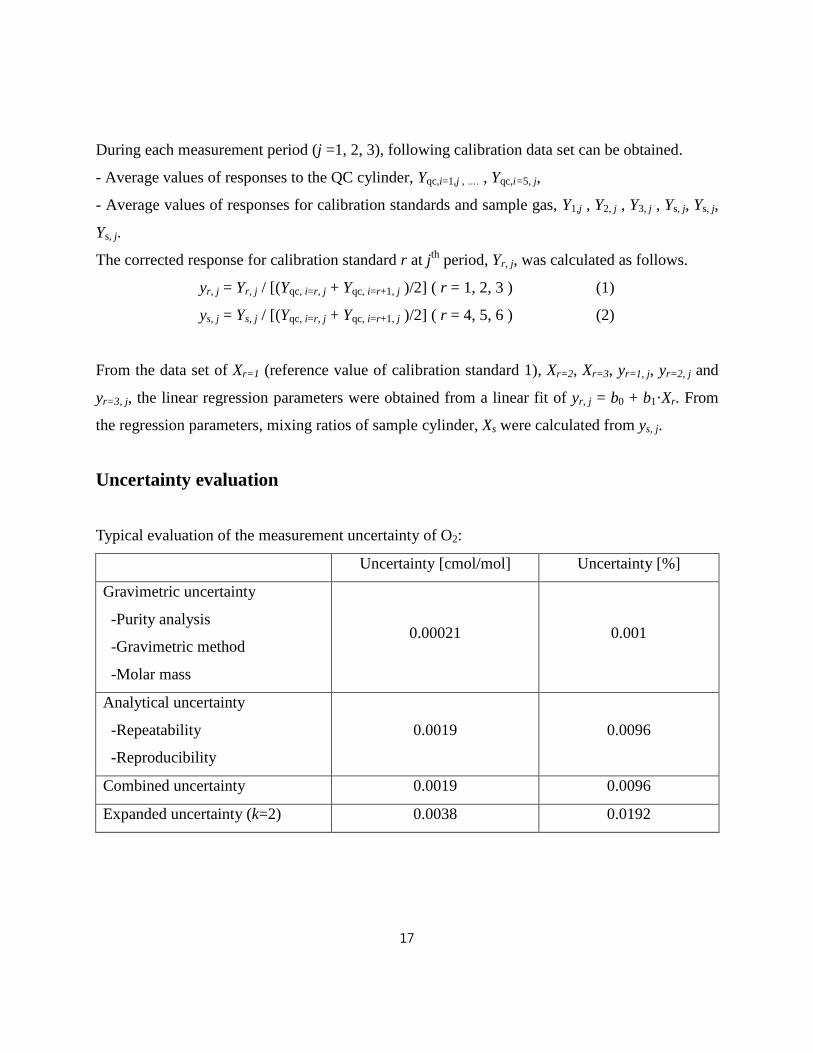
During each measurement period (j =1, 2, 3), following calibration data set can be obtained.
- Average values of responses to the QC cylinder, Yqc,i=1,j , …. , Yqc,i=5, j,
- Average values of responses for calibration standards and sample gas, Y1,j , Y2, j , Y3, j , Ys, j, Ys, j,
Ys, j.
The corrected response for calibration standard r at jth
period, Yr, j, was calculated as follows.
yr, j = Yr, j / [(Yqc, i=r, j + Yqc, i=r+1, j )/2] ( r = 1, 2, 3 ) (1)
ys, j = Ys, j / [(Yqc, i=r, j + Yqc, i=r+1, j )/2] ( r = 4, 5, 6 ) (2)
From the data set of Xr=1 (reference value of calibration standard 1), Xr=2, Xr=3, yr=1, j, yr=2, j and
yr=3, j, the linear regression parameters were obtained from a linear fit of yr, j = b0 + b1·Xr. From
the regression parameters, mixing ratios of sample cylinder, Xs were calculated from ys, j.
Uncertainty evaluation
Typical evaluation of the measurement uncertainty of O2:
Uncertainty [cmol/mol] Uncertainty [%]
Gravimetric uncertainty
-Purity analysis
-Gravimetric method
-Molar mass
0.00021 0.001
Analytical uncertainty
-Repeatability
-Reproducibility
0.0019 0.0096
Combined uncertainty 0.0019 0.0096
Expanded uncertainty (k=2) 0.0038 0.0192
18
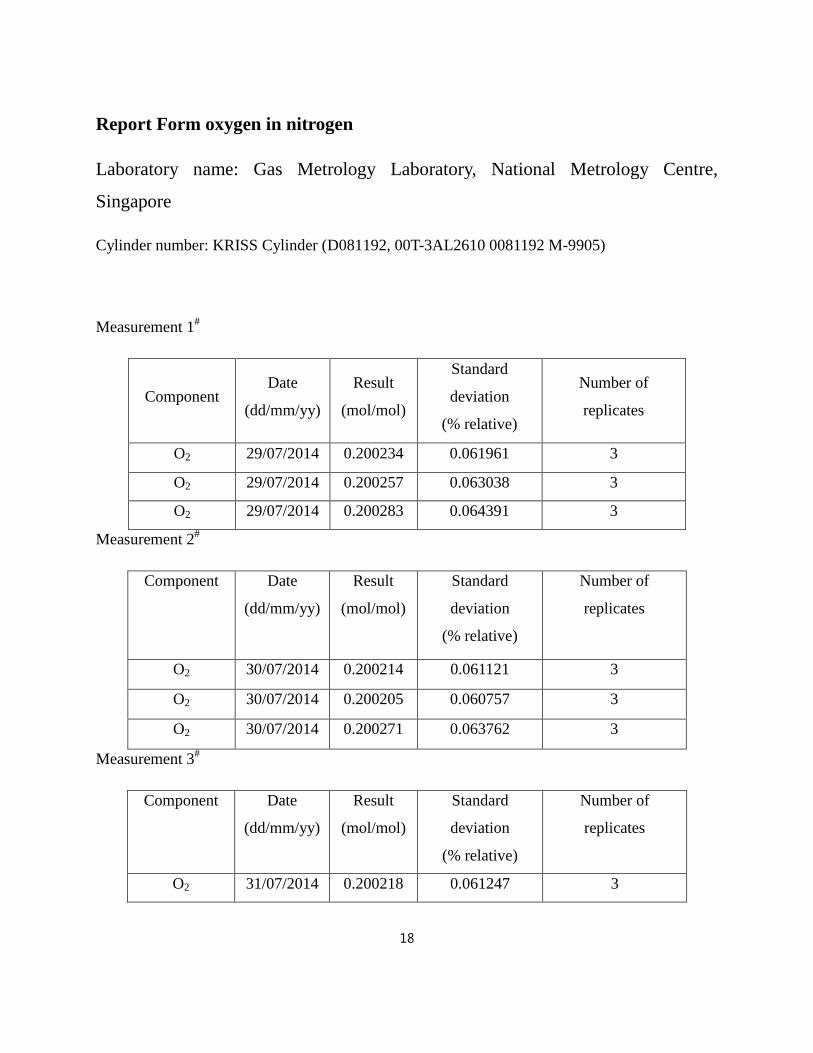
Report Form oxygen in nitrogen
Laboratory name: Gas Metrology Laboratory, National Metrology Centre,
Singapore
Cylinder number: KRISS Cylinder (D081192, 00T-3AL2610 0081192 M-9905)
Measurement 1#
Component Date
(dd/mm/yy)
Result
(mol/mol)
Standard
deviation
(% relative)
Number of
replicates
O2 29/07/2014 0.200234 0.061961 3
O2 29/07/2014 0.200257 0.063038 3
O2 29/07/2014 0.200283 0.064391 3
Measurement 2#
Component Date
(dd/mm/yy)
Result
(mol/mol)
Standard
deviation
(% relative)
Number of
replicates
O2 30/07/2014 0.200214 0.061121 3
O2 30/07/2014 0.200205 0.060757 3
O2 30/07/2014 0.200271 0.063762 3
Measurement 3#
Component Date
(dd/mm/yy)
Result
(mol/mol)
Standard
deviation
(% relative)
Number of
replicates
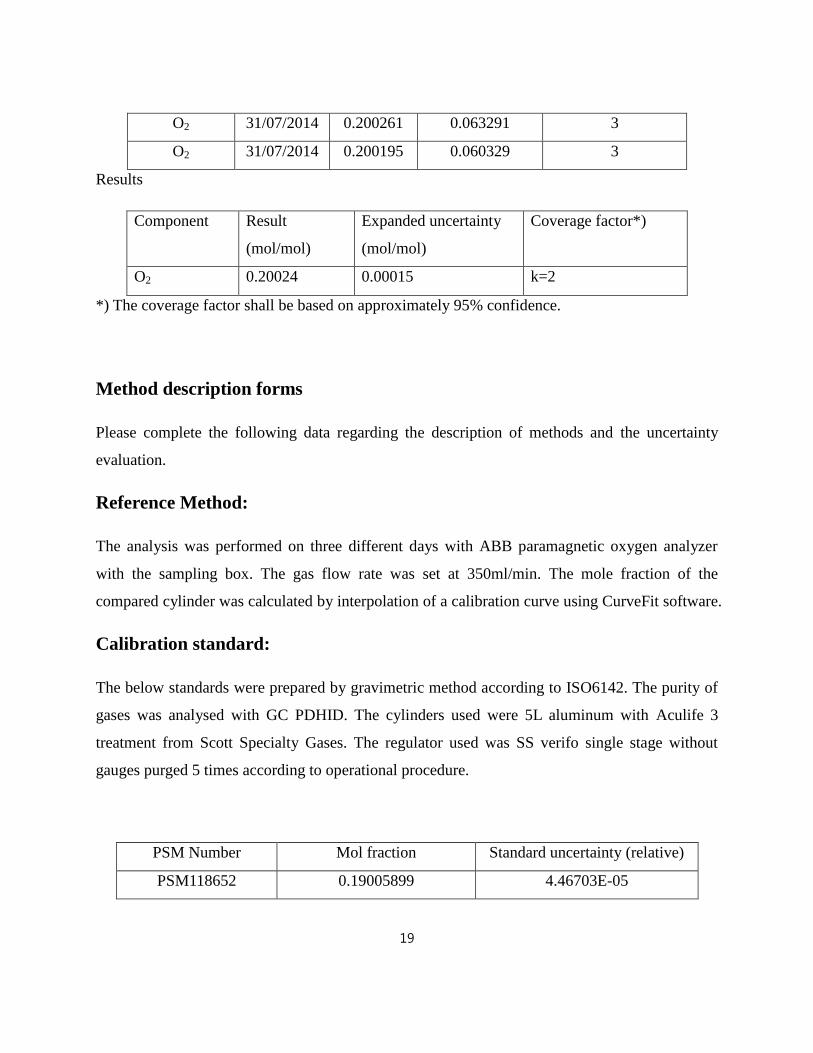
O2 31/07/2014 0.200218 0.061247 3
19
O2 31/07/2014 0.200261 0.063291 3
O2 31/07/2014 0.200195 0.060329 3
Results
Component Result
(mol/mol)
Expanded uncertainty
(mol/mol)
Coverage factor*)
O2 0.20024 0.00015 k=2
*) The coverage factor shall be based on approximately 95% confidence.
Method description forms
Please complete the following data regarding the description of methods and the uncertainty
evaluation.
Reference Method:
The analysis was performed on three different days with ABB paramagnetic oxygen analyzer
with the sampling box. The gas flow rate was set at 350ml/min. The mole fraction of the
compared cylinder was calculated by interpolation of a calibration curve using CurveFit software.
Calibration standard:
The below standards were prepared by gravimetric method according to ISO6142. The purity of
gases was analysed with GC PDHID. The cylinders used were 5L aluminum with Aculife 3
treatment from Scott Specialty Gases. The regulator used was SS verifo single stage without
gauges purged 5 times according to operational procedure.
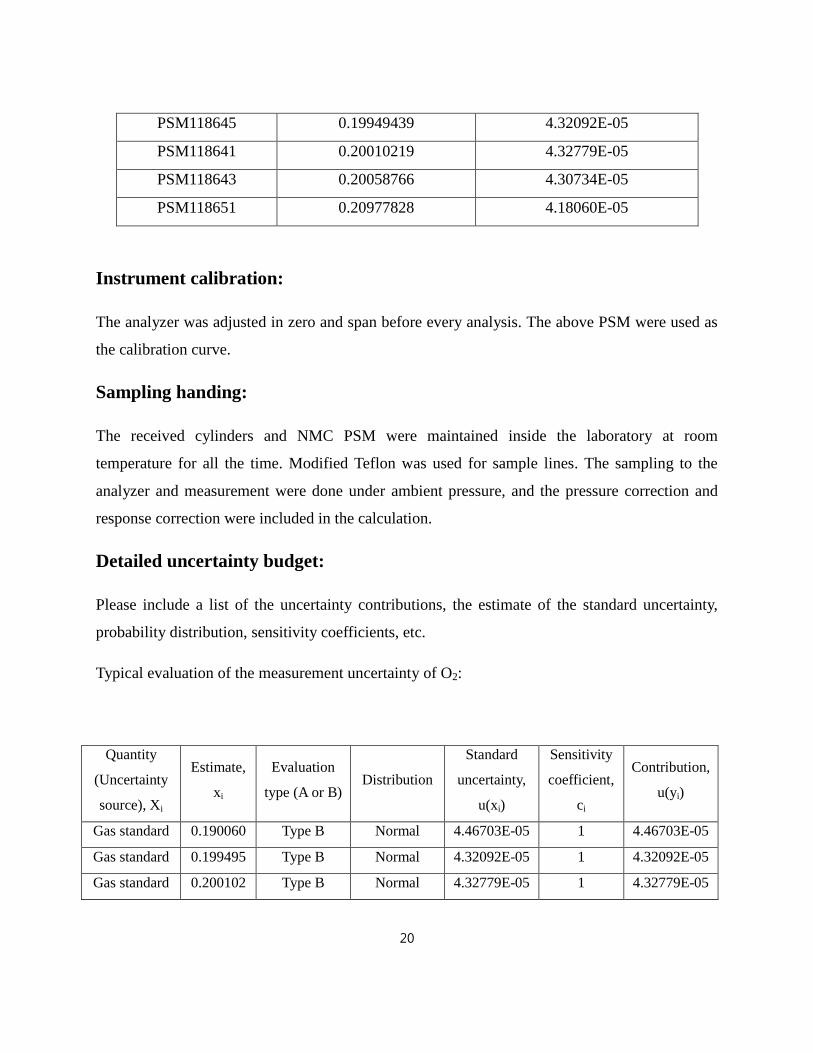
PSM Number Mol fraction Standard uncertainty (relative)
PSM118652 0.19005899 4.46703E-05
20
PSM118645 0.19949439 4.32092E-05
PSM118641 0.20010219 4.32779E-05
PSM118643 0.20058766 4.30734E-05
PSM118651 0.20977828 4.18060E-05
Instrument calibration:
The analyzer was adjusted in zero and span before every analysis. The above PSM were used as
the calibration curve.
Sampling handing:
The received cylinders and NMC PSM were maintained inside the laboratory at room
temperature for all the time. Modified Teflon was used for sample lines. The sampling to the
analyzer and measurement were done under ambient pressure, and the pressure correction and
response correction were included in the calculation.
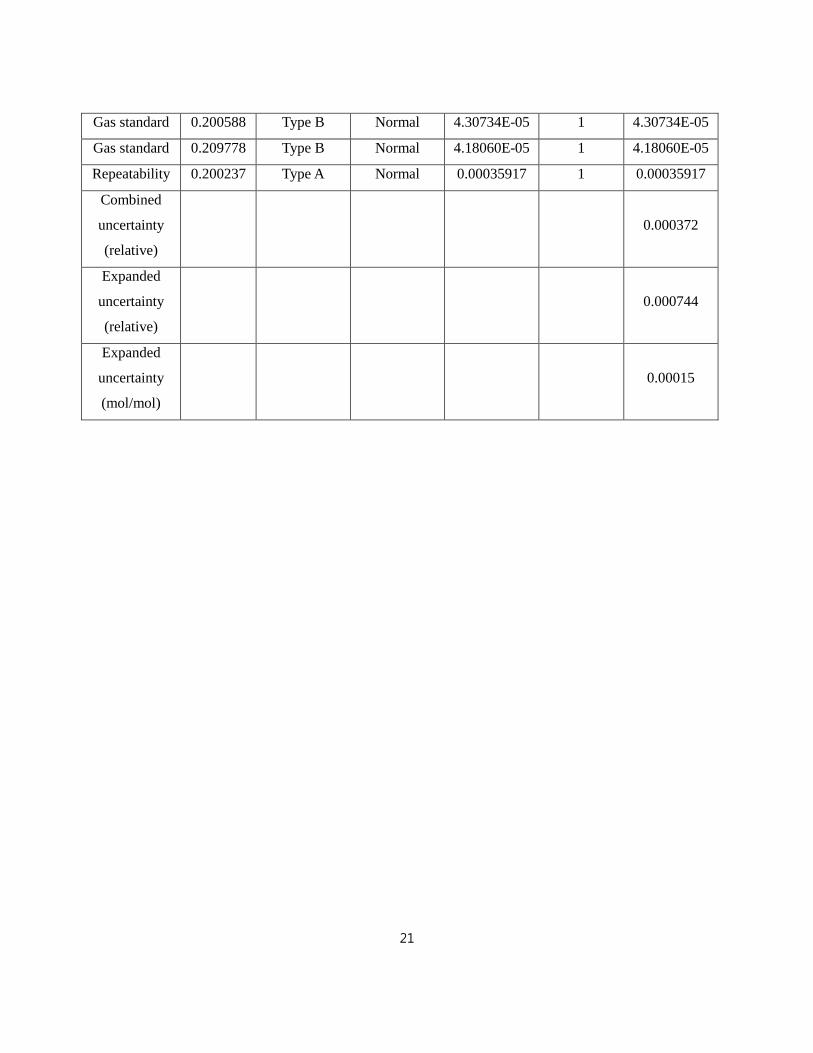
Detailed uncertainty budget:
Please include a list of the uncertainty contributions, the estimate of the standard uncertainty,
probability distribution, sensitivity coefficients, etc.
Typical evaluation of the measurement uncertainty of O2:
Quantity
(Uncertainty
source), Xi
Estimate,
xi
Evaluation
type (A or B) Distribution
Standard
uncertainty,
u(xi)
Sensitivity
coefficient,
ci
Contribution,
u(yi)
Gas standard 0.190060 Type B Normal 4.46703E-05 1 4.46703E-05
Gas standard 0.199495 Type B Normal 4.32092E-05 1 4.32092E-05
Gas standard 0.200102 Type B Normal 4.32779E-05 1 4.32779E-05
21
Gas standard 0.200588 Type B Normal 4.30734E-05 1 4.30734E-05
Gas standard 0.209778 Type B Normal 4.18060E-05 1 4.18060E-05
Repeatability 0.200237 Type A Normal 0.00035917 1 0.00035917
Combined
uncertainty
(relative)
0.000372
Expanded
uncertainty
(relative)
0.000744
Expanded
uncertainty
(mol/mol)
0.00015