Nitrogen Reduction: Process & Application

Nitrogen Reduction: Process & Application. Presentation Outline Environmental effects of Nitrogen Health Effects of Nitrogen The Nitrogen Cycle What interrupts.
Dec 16, 2015
Welcome message from author
This document is posted to help you gain knowledge. Please leave a comment to let me know what you think about it! Share it to your friends and learn new things together.
Transcript
Nitrogen Reduction:Process & ApplicationNitrogen Reduction:
Process & Application
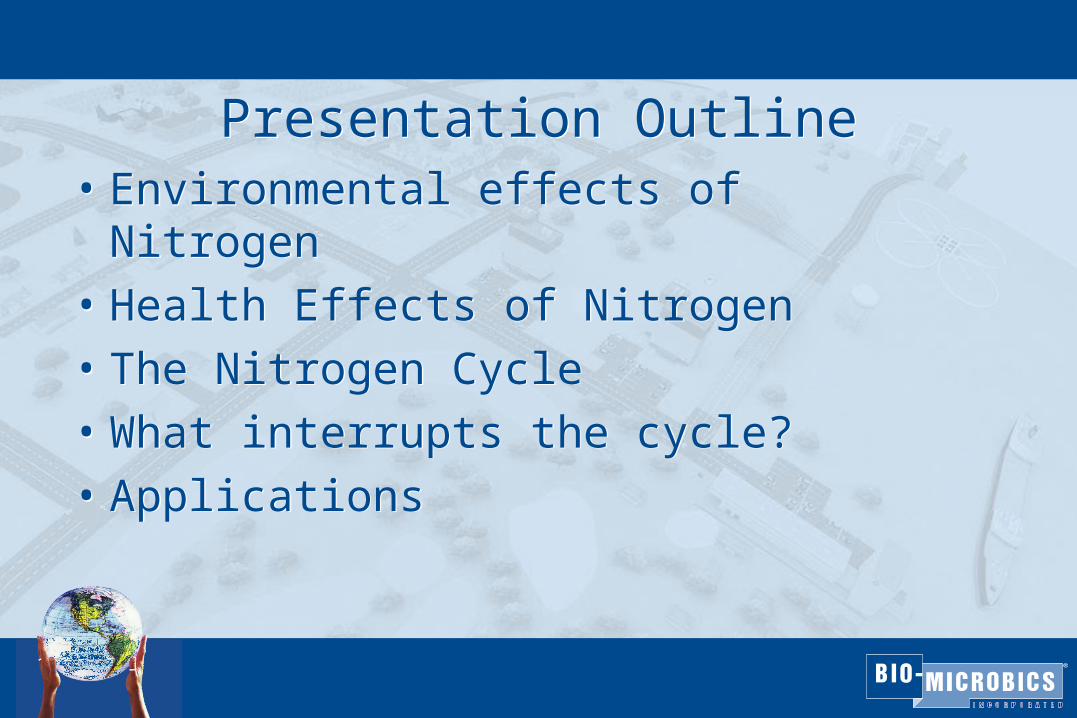
Presentation OutlinePresentation Outline• Environmental effects of Nitrogen• Health Effects of Nitrogen• The Nitrogen Cycle• What interrupts the cycle?• Applications
• Environmental effects of Nitrogen• Health Effects of Nitrogen• The Nitrogen Cycle• What interrupts the cycle?• Applications
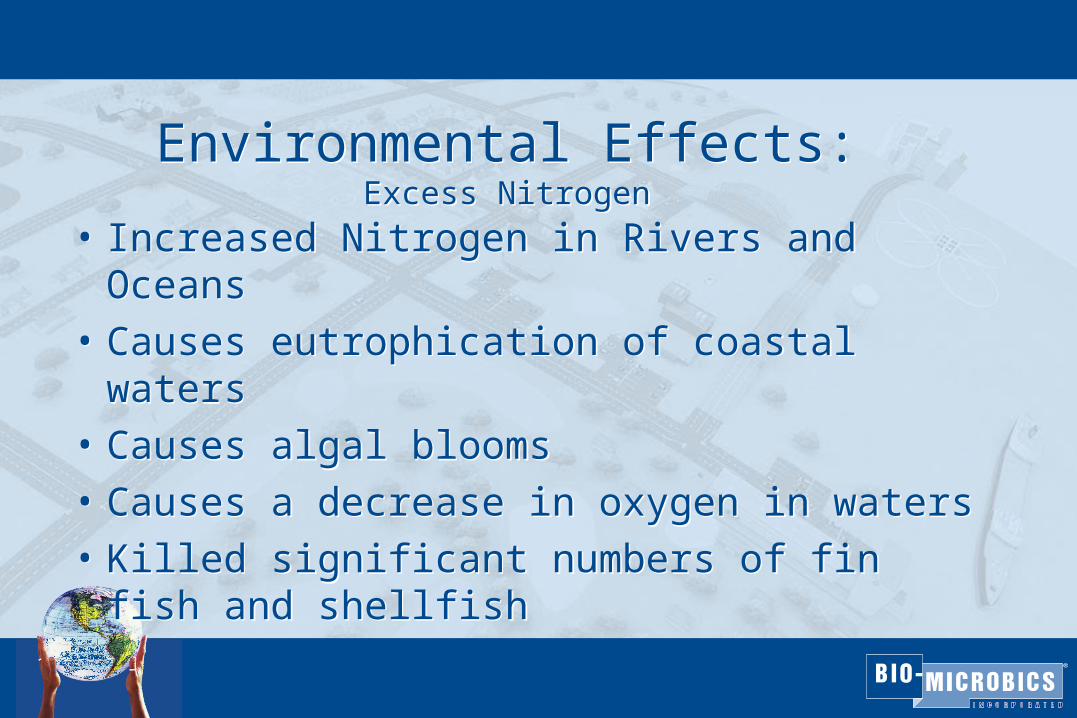
Environmental Effects:Excess Nitrogen
Environmental Effects:Excess Nitrogen
• Increased Nitrogen in Rivers and Oceans
• Causes eutrophication of coastal waters
• Causes algal blooms
• Causes a decrease in oxygen in waters
• Killed significant numbers of fin fish and shellfish
• Increased Nitrogen in Rivers and Oceans
• Causes eutrophication of coastal waters
• Causes algal blooms
• Causes a decrease in oxygen in waters
• Killed significant numbers of fin fish and shellfish
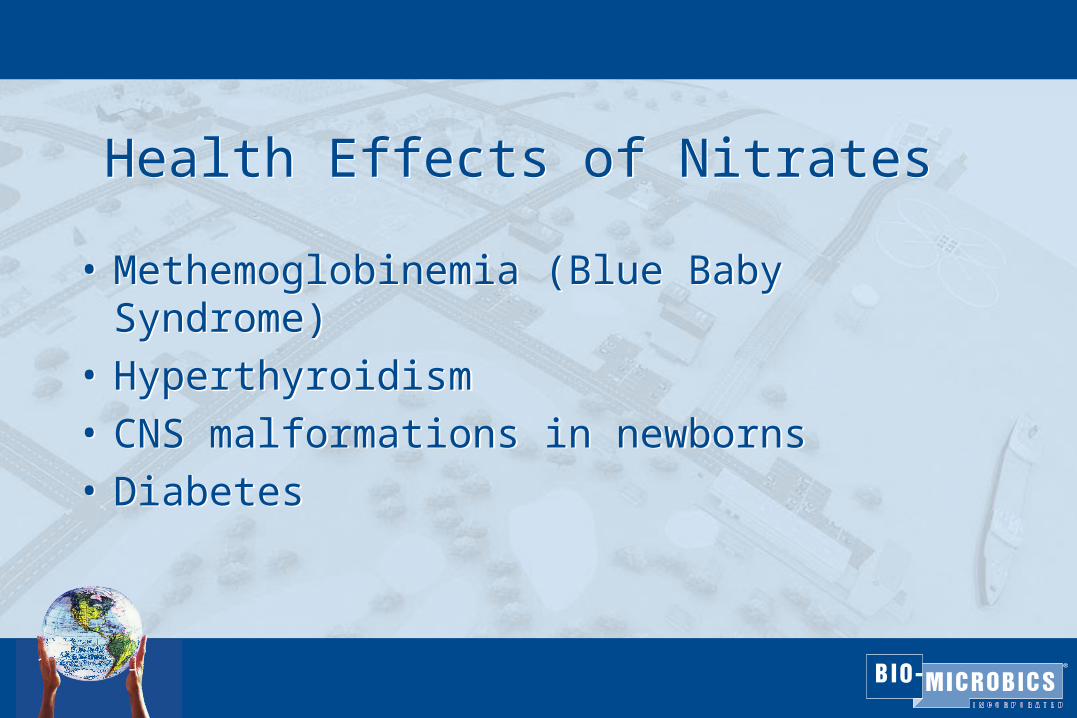
Health Effects of Nitrates Health Effects of Nitrates
• Methemoglobinemia (Blue Baby Syndrome)
• Hyperthyroidism
• CNS malformations in newborns
• Diabetes
• Methemoglobinemia (Blue Baby Syndrome)
• Hyperthyroidism
• CNS malformations in newborns
• Diabetes
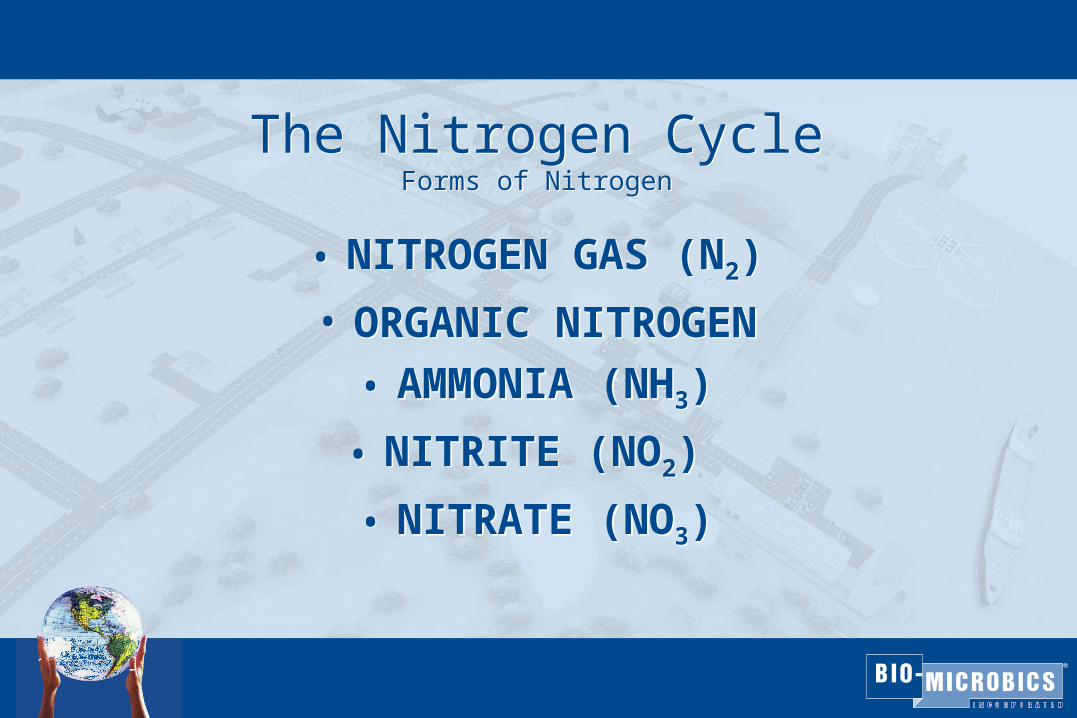
The Nitrogen CycleForms of Nitrogen
The Nitrogen CycleForms of Nitrogen
• NITROGEN GAS (N2)
• ORGANIC NITROGEN
• AMMONIA (NH3)
• NITRITE (NO2)
• NITRATE (NO3)
• NITROGEN GAS (N2)
• ORGANIC NITROGEN
• AMMONIA (NH3)
• NITRITE (NO2)
• NITRATE (NO3)

The Nitrogen CycleThe Nitrogen Cycle
NN22 – 78% of – 78% of
earth’s earth’s atmosphereatmosphere
Lightning – Lightning – High-energy High-energy
fixationfixation
NitratesNitratesNONO33--
BiologicalBiologicalFixationFixation
AmmoniaAmmoniaNHNH33
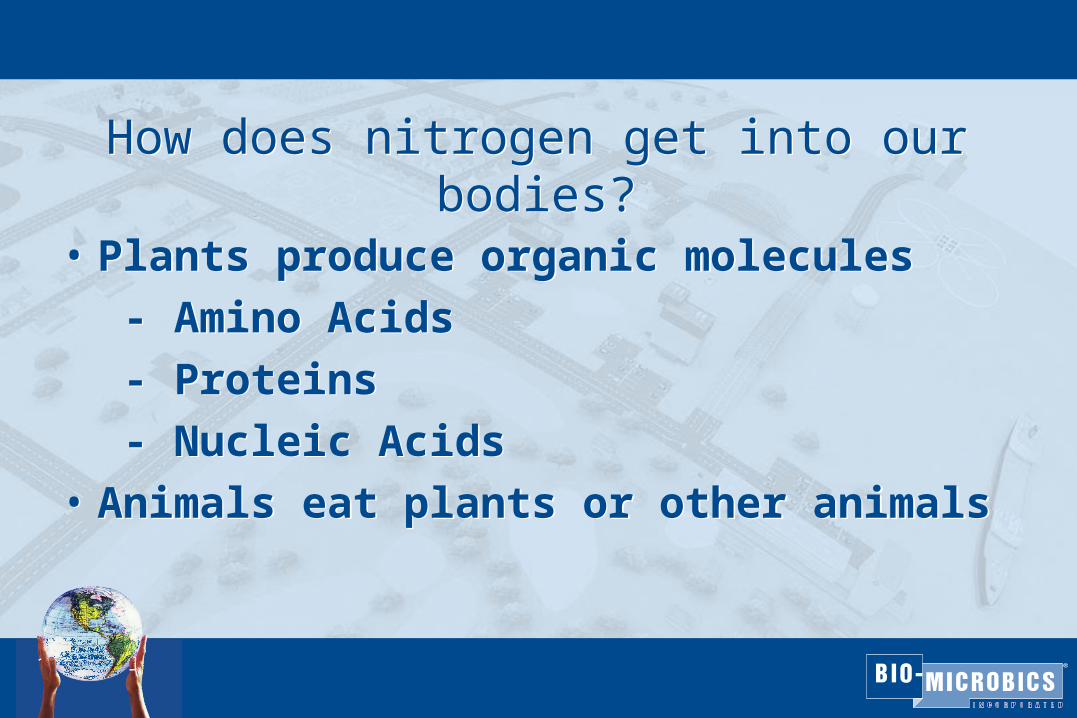
How does nitrogen get into our bodies?How does nitrogen get into our bodies?
• Plants produce organic molecules
- Amino Acids
- Proteins
- Nucleic Acids
• Animals eat plants or other animals
• Plants produce organic molecules
- Amino Acids
- Proteins
- Nucleic Acids
• Animals eat plants or other animals

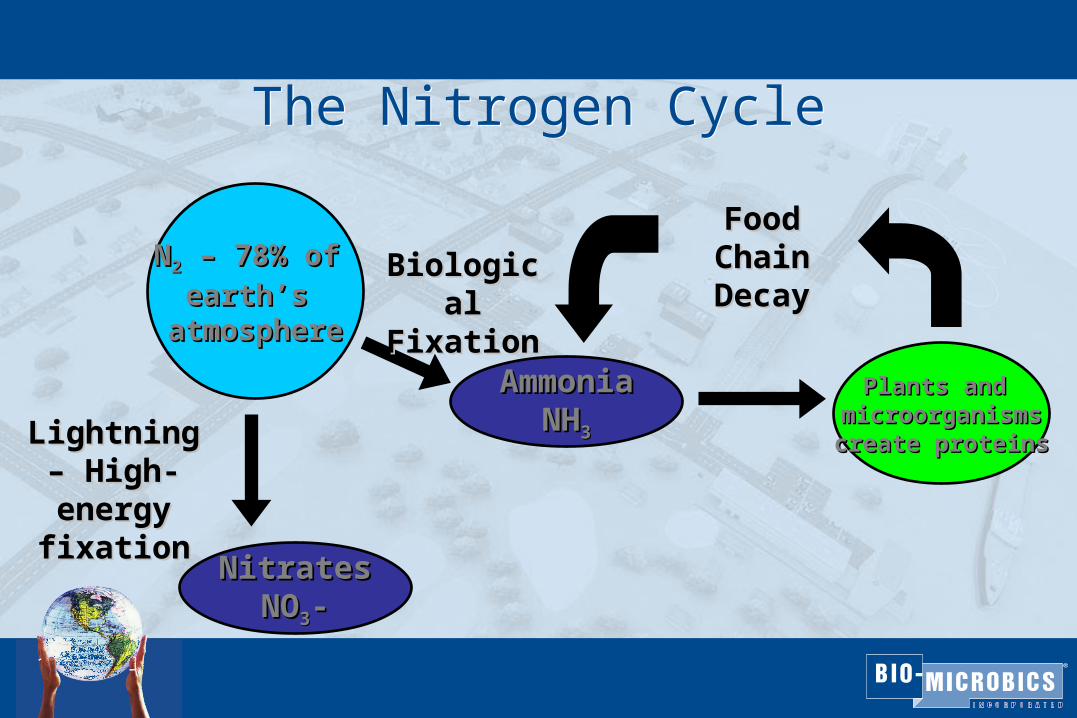
The Nitrogen CycleThe Nitrogen Cycle
NN22 – 78% of – 78% of
earth’s earth’s atmosphereatmosphere
BiologicalBiologicalFixationFixation
Lightning – Lightning – High-energy High-energy
fixationfixation
NitratesNitratesNONO33--
AmmoniaAmmoniaNHNH33
Plants and Plants and microorganismsmicroorganismscreate proteinscreate proteins
Food ChainFood Chain
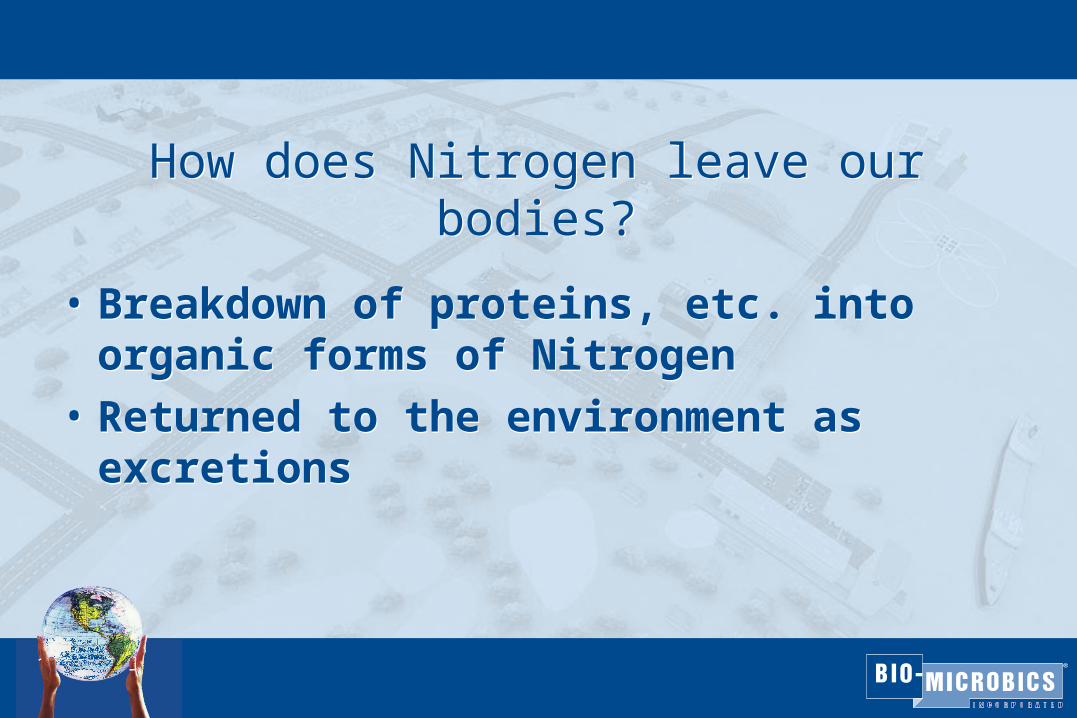
How does Nitrogen leave our bodies?How does Nitrogen leave our bodies?
• Breakdown of proteins, etc. into organic forms of Nitrogen
• Returned to the environment as excretions
• Breakdown of proteins, etc. into organic forms of Nitrogen
• Returned to the environment as excretions
The Nitrogen CycleThe Nitrogen Cycle
NN22 – 78% of – 78% of
earth’s earth’s atmosphereatmosphere
BiologicalBiologicalFixationFixation
Lightning – Lightning – High-energy High-energy
fixationfixation
NitratesNitratesNONO33--
AmmoniaAmmoniaNHNH33
Plants and Plants and microorganismsmicroorganismscreate proteinscreate proteins
Food ChainFood ChainDecayDecay
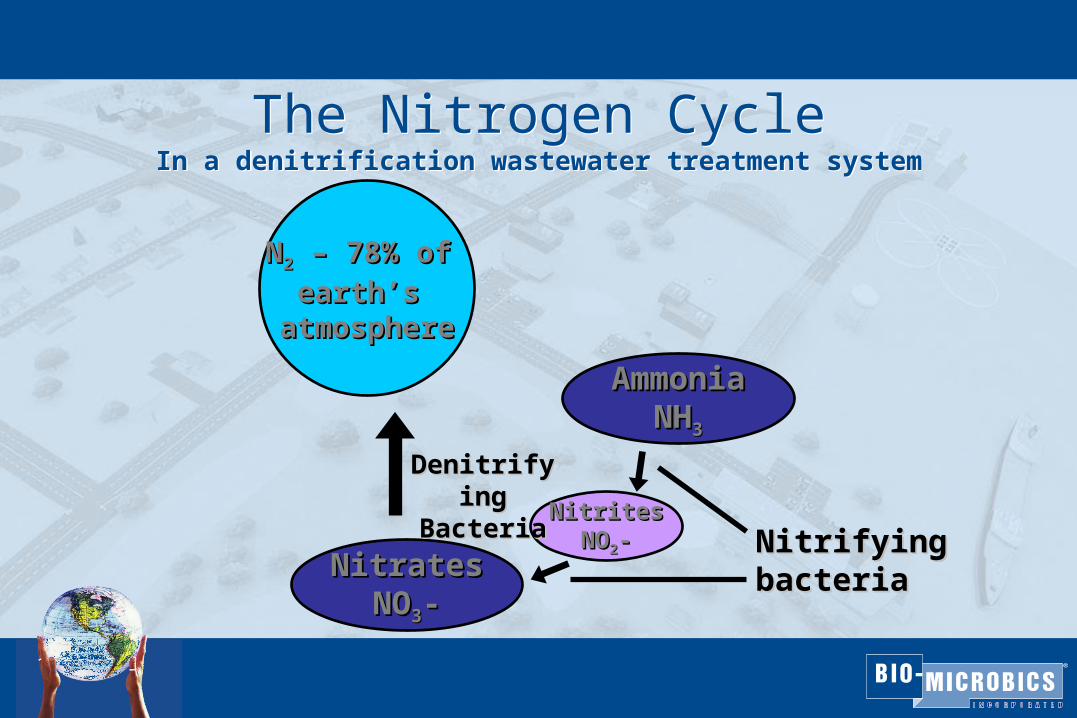
The Nitrogen CycleIn a denitrification wastewater treatment system
The Nitrogen CycleIn a denitrification wastewater treatment system
NN22 – 78% of – 78% of
earth’s earth’s atmosphereatmosphere
NitratesNitratesNONO33--
AmmoniaAmmoniaNHNH33
NitritesNitritesNONO22-- Nitrifying Nitrifying
bacteriabacteria
DenitrifyingDenitrifyingBacteriaBacteria
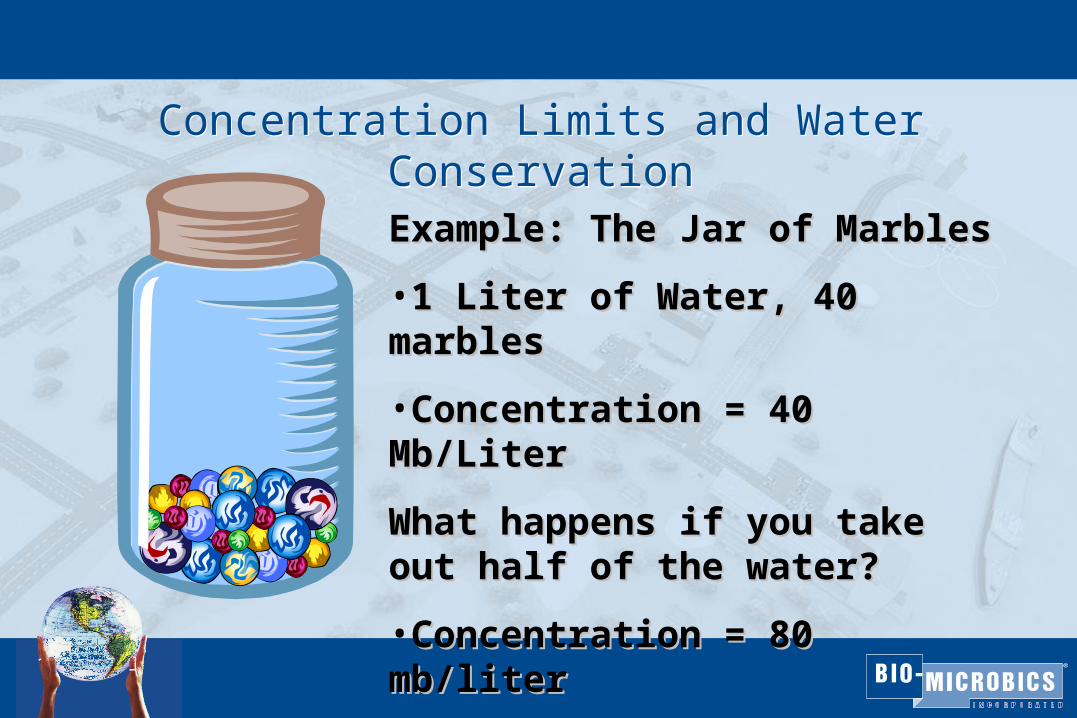
Concentration Limits and Water Conservation
Concentration Limits and Water ConservationExample: The Jar of MarblesExample: The Jar of Marbles
•1 Liter of Water, 40 marbles1 Liter of Water, 40 marbles
•Concentration = 40 Mb/LiterConcentration = 40 Mb/Liter
What happens if you take out half What happens if you take out half of the water?of the water?
•Concentration = 80 mb/literConcentration = 80 mb/liter
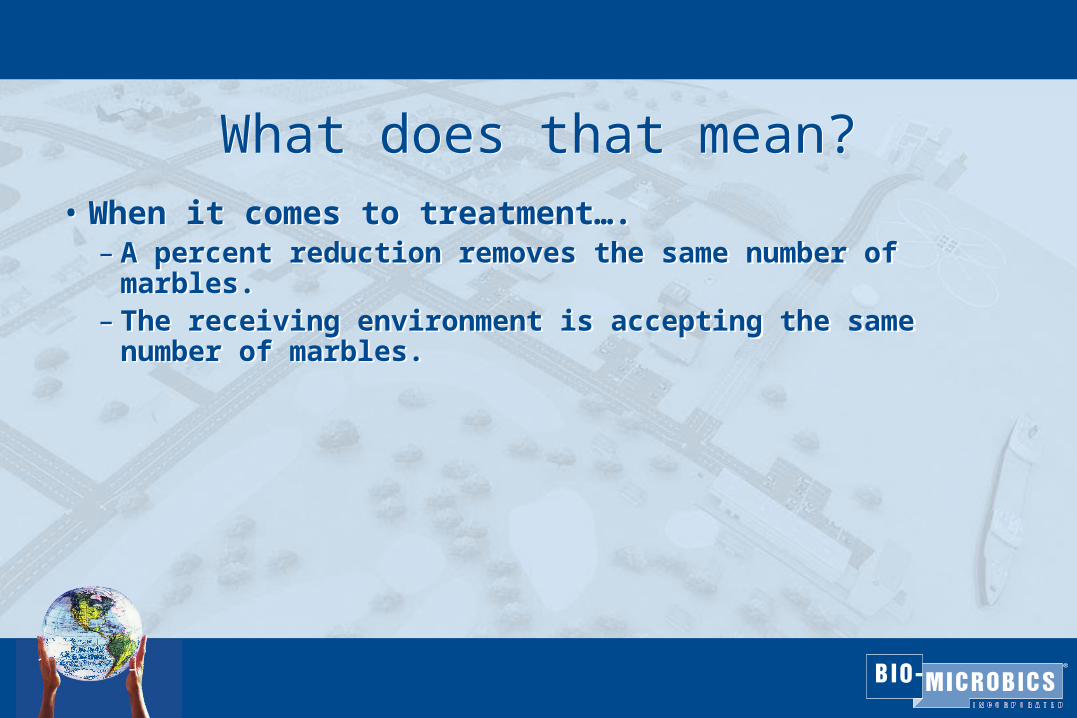
What does that mean?What does that mean?• When it comes to treatment….
– A percent reduction removes the same number of marbles.– The receiving environment is accepting the same number of
marbles.
• When it comes to treatment….– A percent reduction removes the same number of marbles.– The receiving environment is accepting the same number of
marbles.
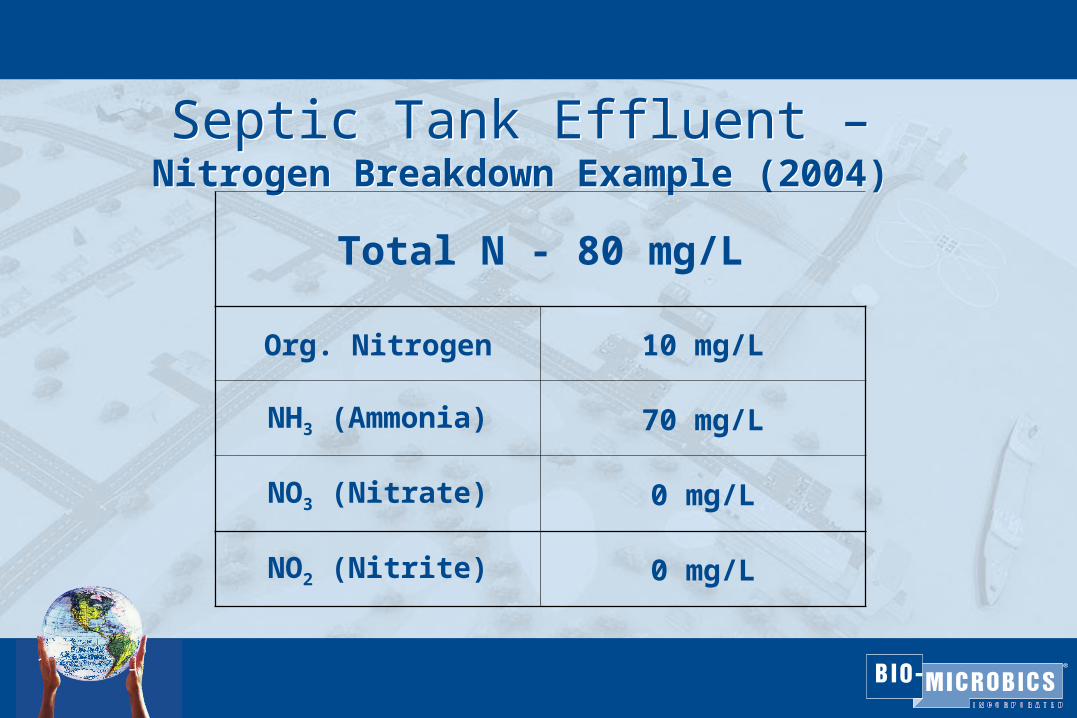
Septic Tank Effluent –Nitrogen Breakdown Example (2004)Septic Tank Effluent –
Nitrogen Breakdown Example (2004)
Total N - 80 mg/L
Org. Nitrogen 10 mg/L
NH3 (Ammonia) 70 mg/L
NO3 (Nitrate) 0 mg/L
NO2 (Nitrite) 0 mg/L

After Treatment –After Treatment –
Total N - 24 mg/L
Org. Nitrogen 5 mg/L
NH3 (Ammonia) 9 mg/L
NO3 (Nitrate) 10 mg/L
NO2 (Nitrite) 0 mg/L

Basic Steps in Nitrogen Removal Systems• Anoxic Zone
Conversion of nitrate to nitrogen gas (denitrification)
BOD removal
• Aerobic Zone BOD removal and nitrification
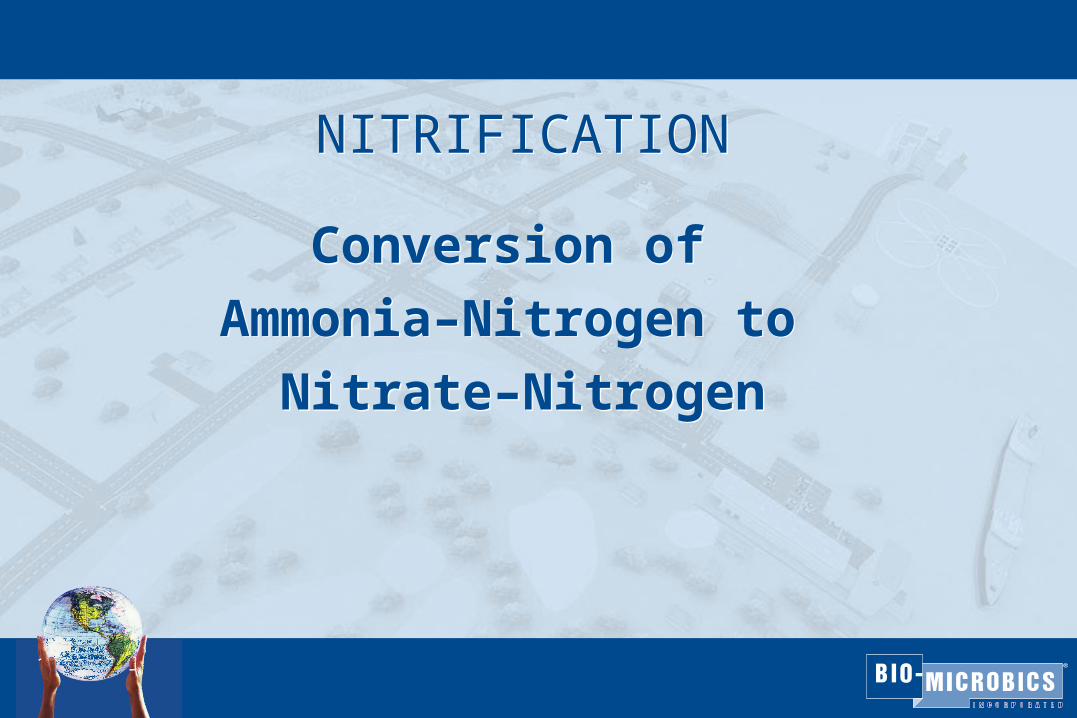
NITRIFICATION NITRIFICATION
Conversion of
Ammonia–Nitrogen to
Nitrate–Nitrogen
Conversion of
Ammonia–Nitrogen to
Nitrate–Nitrogen
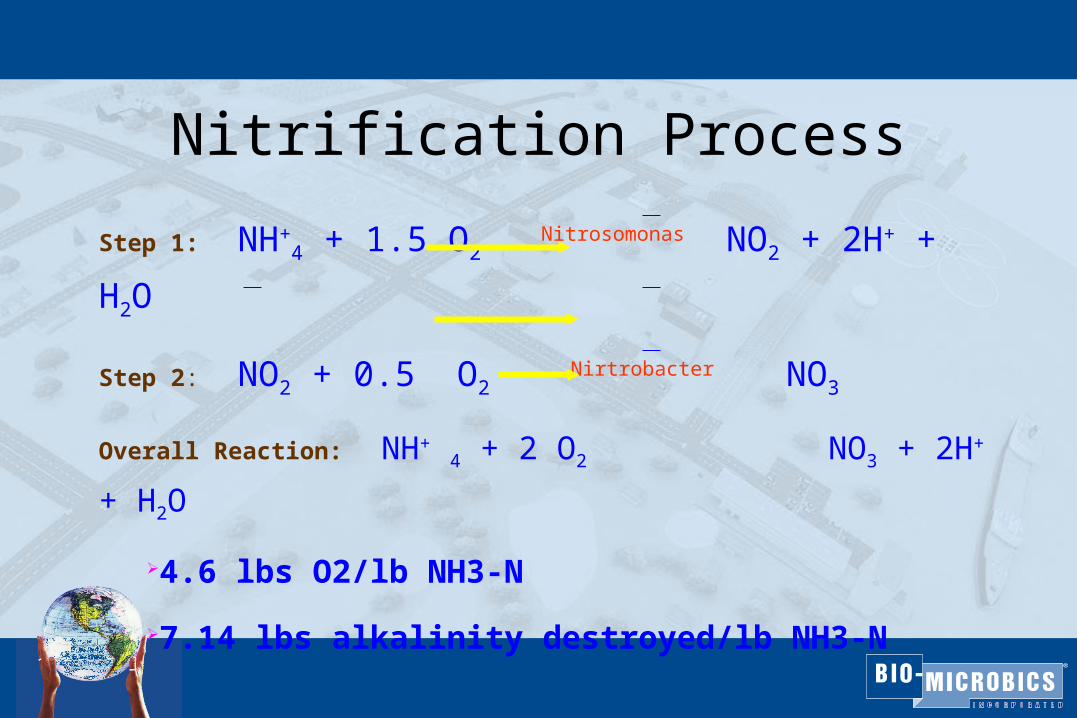
Nitrification Process
Step 1: NH+4 + 1.5 O2
Nitrosomonas NO2 + 2H+ + H2O
Step 2: NO2 + 0.5 O2 Nirtrobacter NO3
Overall Reaction: NH+ 4 + 2 O2 NO3 + 2H+ + H2O
4.6 lbs O2/lb NH3-N
7.14 lbs alkalinity destroyed/lb NH3-N
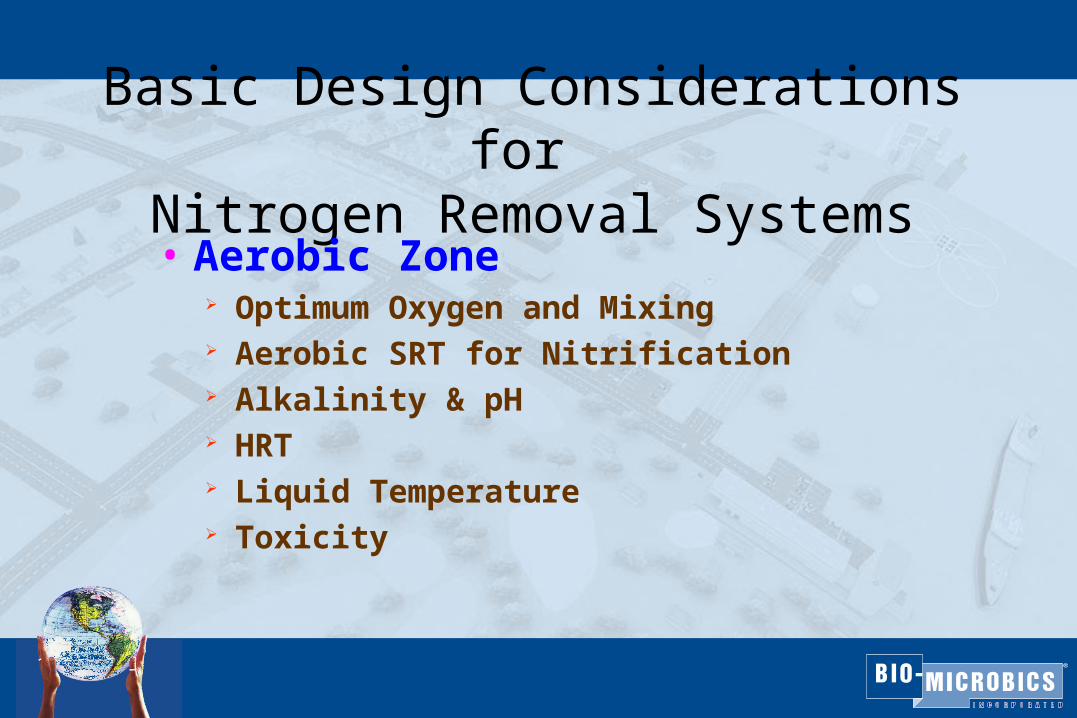
Basic Design Considerations for Nitrogen Removal Systems
• Aerobic Zone Optimum Oxygen and Mixing Aerobic SRT for Nitrification Alkalinity & pH HRT Liquid Temperature Toxicity
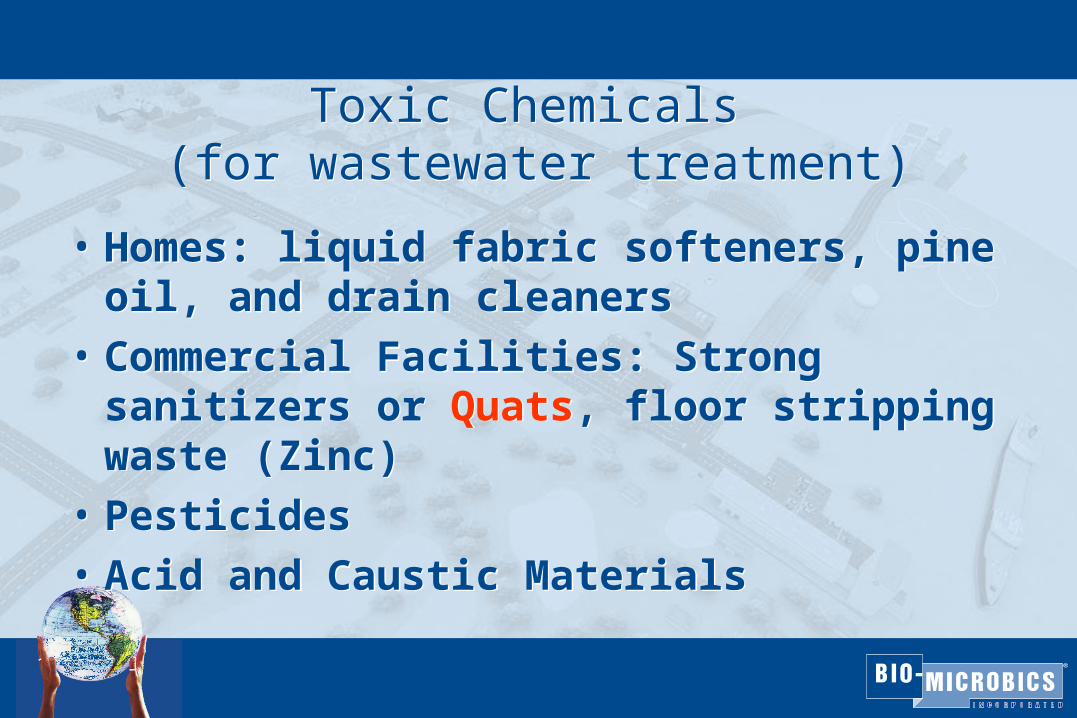
Toxic Chemicals (for wastewater treatment)
Toxic Chemicals (for wastewater treatment)
• Homes: liquid fabric softeners, pine oil, and drain cleaners
• Commercial Facilities: Strong sanitizers or Quats, floor stripping waste (Zinc)
• Pesticides
• Acid and Caustic Materials
• Homes: liquid fabric softeners, pine oil, and drain cleaners
• Commercial Facilities: Strong sanitizers or Quats, floor stripping waste (Zinc)
• Pesticides
• Acid and Caustic Materials
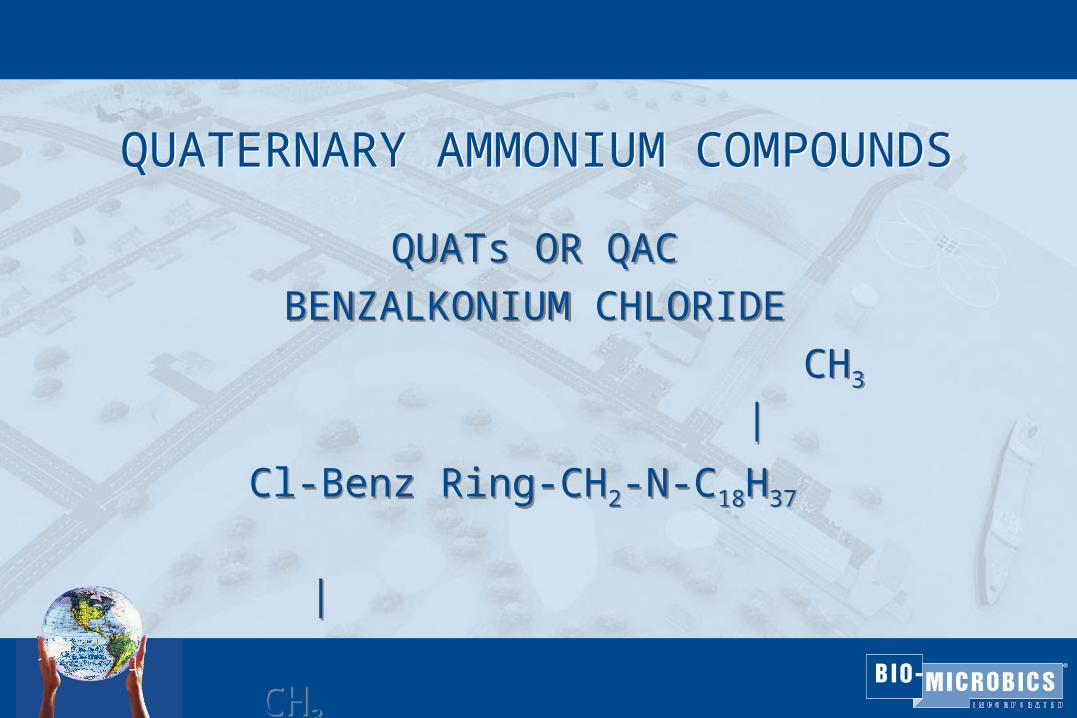
QUATERNARY AMMONIUM COMPOUNDS
QUATERNARY AMMONIUM COMPOUNDSQUATs OR QAC
BENZALKONIUM CHLORIDE
CH3
|
Cl-Benz Ring-CH2-N-C18H37
|
CH3
QUATs OR QAC
BENZALKONIUM CHLORIDE
CH3
|
Cl-Benz Ring-CH2-N-C18H37
|
CH3

Problems with QUATs in Wastewater Treatment
Problems with QUATs in Wastewater Treatment
• Toxic/Inhibitory to Nitrifying Bacteria
- in concentrations <2 mg/l
• Non-biodegradable Organic Nitrogen
• Exponential Increase in Use
• Toxic/Inhibitory to Nitrifying Bacteria
- in concentrations <2 mg/l
• Non-biodegradable Organic Nitrogen
• Exponential Increase in Use
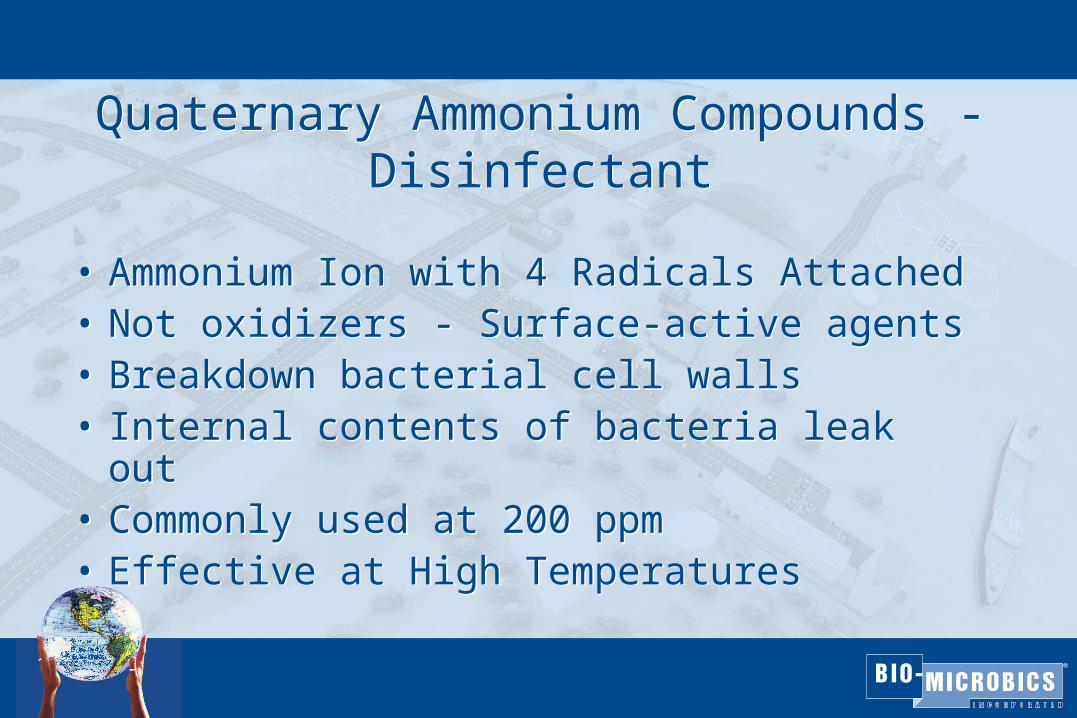
Quaternary Ammonium Compounds - Disinfectant
Quaternary Ammonium Compounds - Disinfectant
• Ammonium Ion with 4 Radicals Attached• Not oxidizers - Surface-active agents• Breakdown bacterial cell walls• Internal contents of bacteria leak out• Commonly used at 200 ppm• Effective at High Temperatures
• Ammonium Ion with 4 Radicals Attached• Not oxidizers - Surface-active agents• Breakdown bacterial cell walls• Internal contents of bacteria leak out• Commonly used at 200 ppm• Effective at High Temperatures
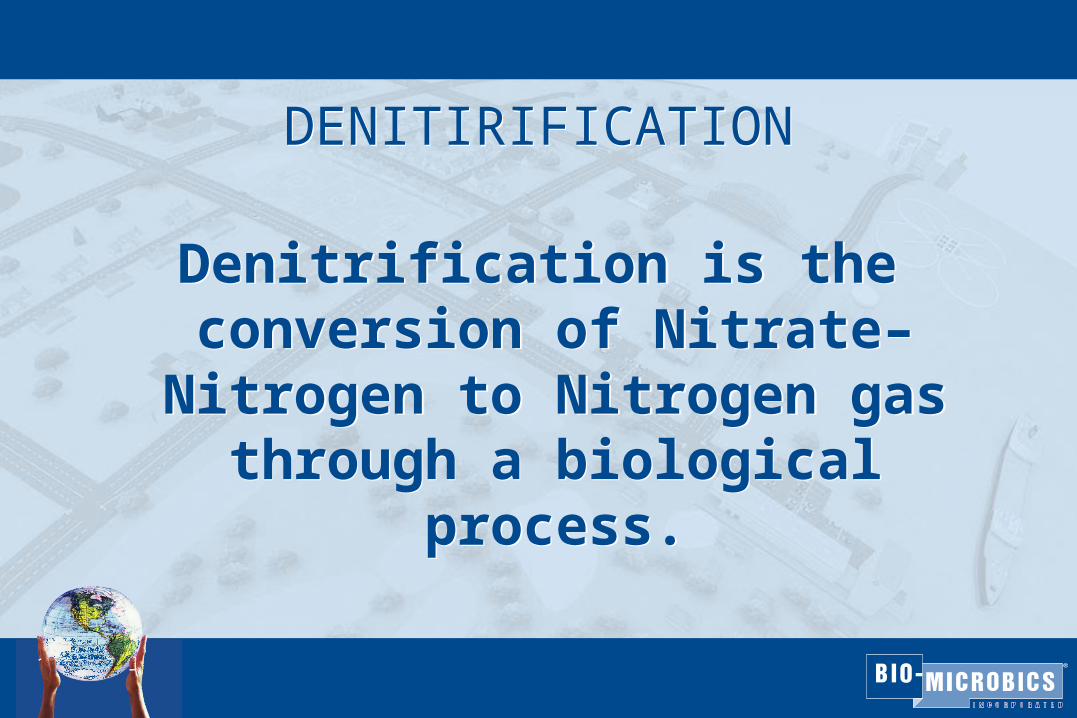
DENITIRIFICATIONDENITIRIFICATION
Denitrification is the conversion of Nitrate–Nitrogen to Nitrogen gas
through a biological process.
Denitrification is the conversion of Nitrate–Nitrogen to Nitrogen gas
through a biological process.
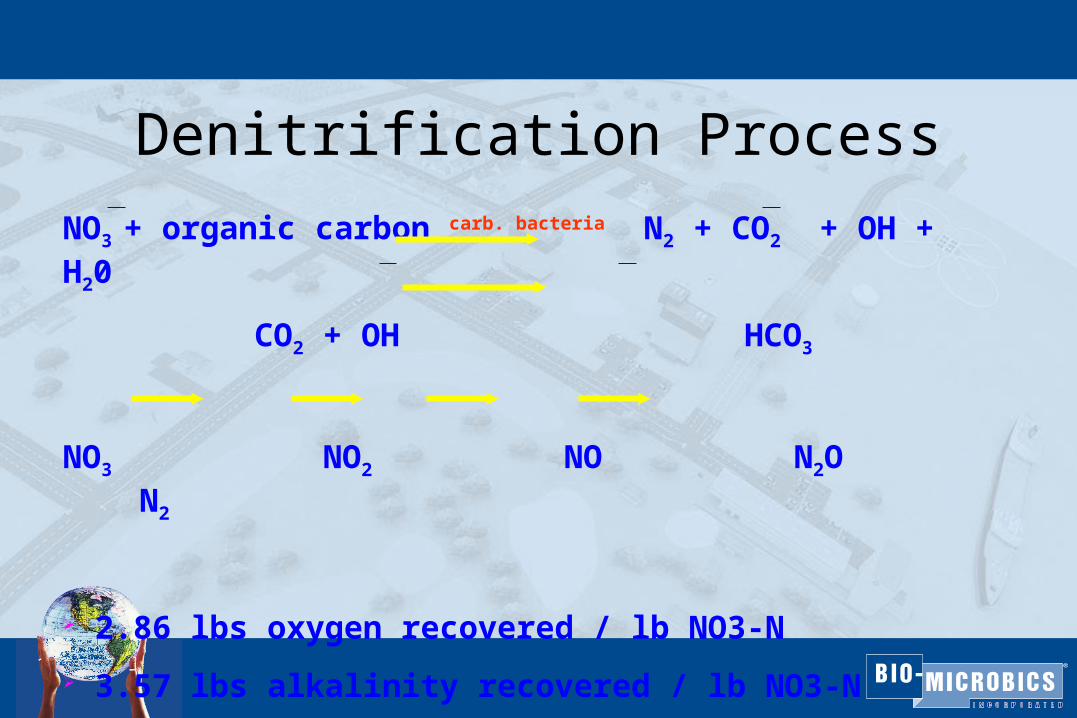
Denitrification Process
NO3 + organic carbon carb. bacteria N2 + CO2 + OH + H20
CO2 + OH HCO3
NO3 NO2 NO N2O N2
2.86 lbs oxygen recovered / lb NO3-N
3.57 lbs alkalinity recovered / lb NO3-N
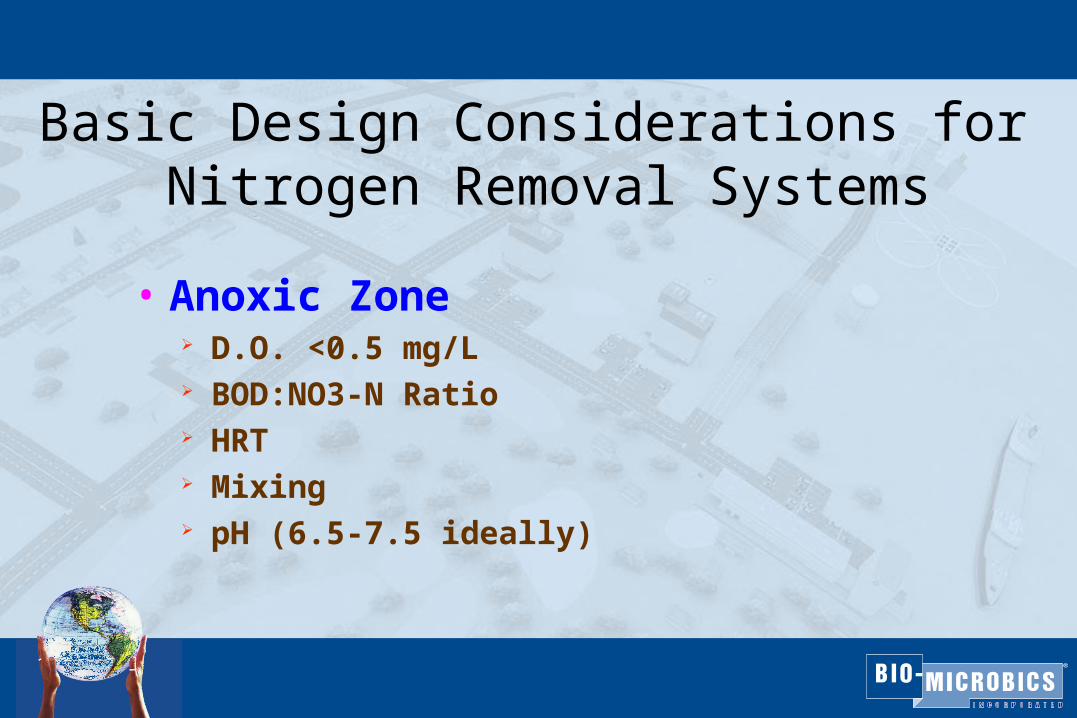
Basic Design Considerations for Nitrogen Removal Systems
• Anoxic Zone D.O. <0.5 mg/L BOD:NO3-N Ratio HRT Mixing pH (6.5-7.5 ideally)
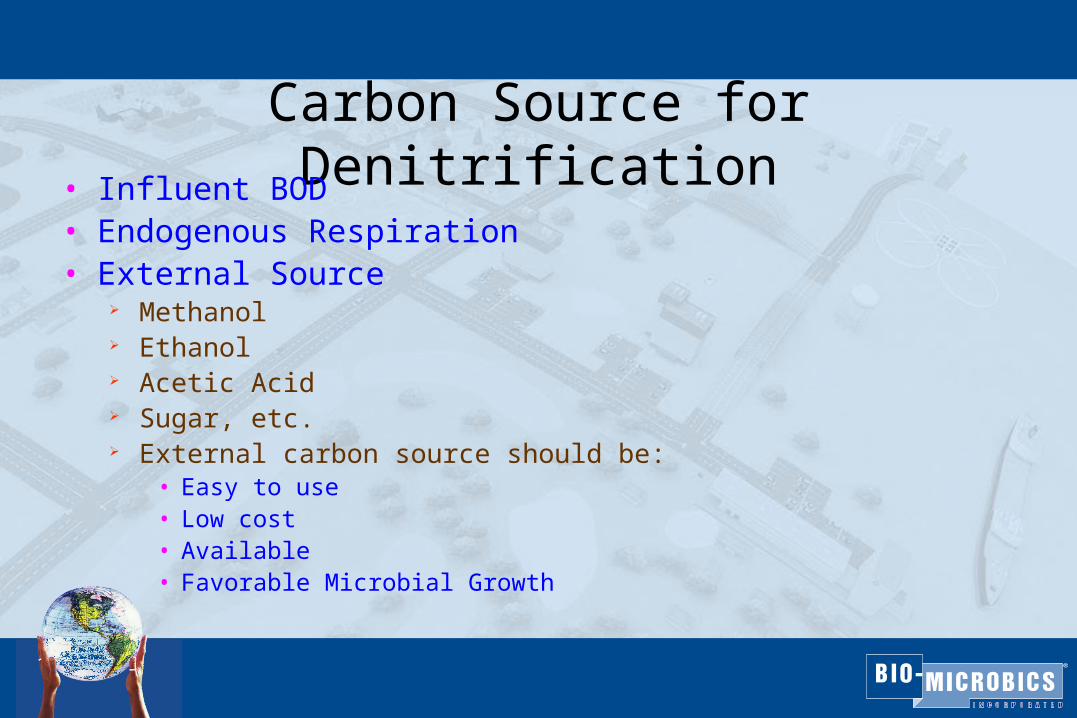
Carbon Source for Denitrification• Influent BOD• Endogenous Respiration• External Source
Methanol Ethanol Acetic Acid Sugar, etc. External carbon source should be:
• Easy to use• Low cost• Available• Favorable Microbial Growth
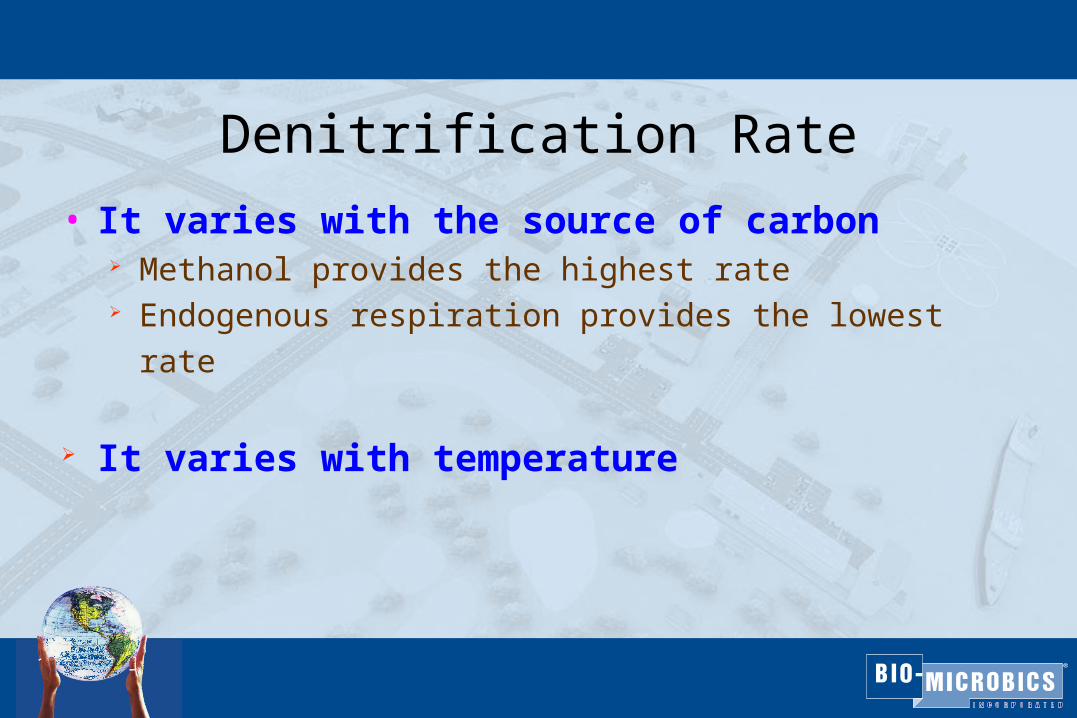
Denitrification Rate
• It varies with the source of carbon Methanol provides the highest rate Endogenous respiration provides the lowest rate
It varies with temperature
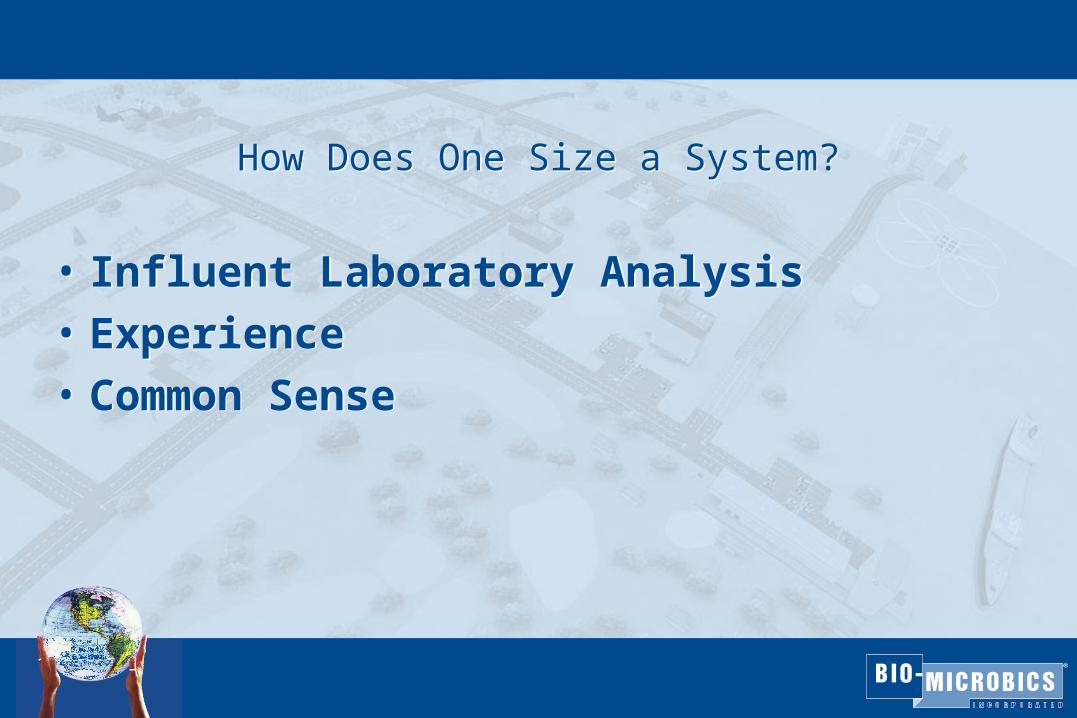
How Does One Size a System?How Does One Size a System?
• Influent Laboratory Analysis
• Experience
• Common Sense
• Influent Laboratory Analysis
• Experience
• Common Sense
Why Should I Worry About It?Why Should I Worry About It?
• “Thou Shalt Not Live By Flow Alone”
• Biological Vs. Hydraulic Loading
• “Thou Shalt Not Live By Flow Alone”
• Biological Vs. Hydraulic Loading

DesignDesign
• Source of the waste• Facility Practices• Flow Patterns (e.g. churches)• Effluent Requirements• Operational/Management Resources
• Source of the waste• Facility Practices• Flow Patterns (e.g. churches)• Effluent Requirements• Operational/Management Resources
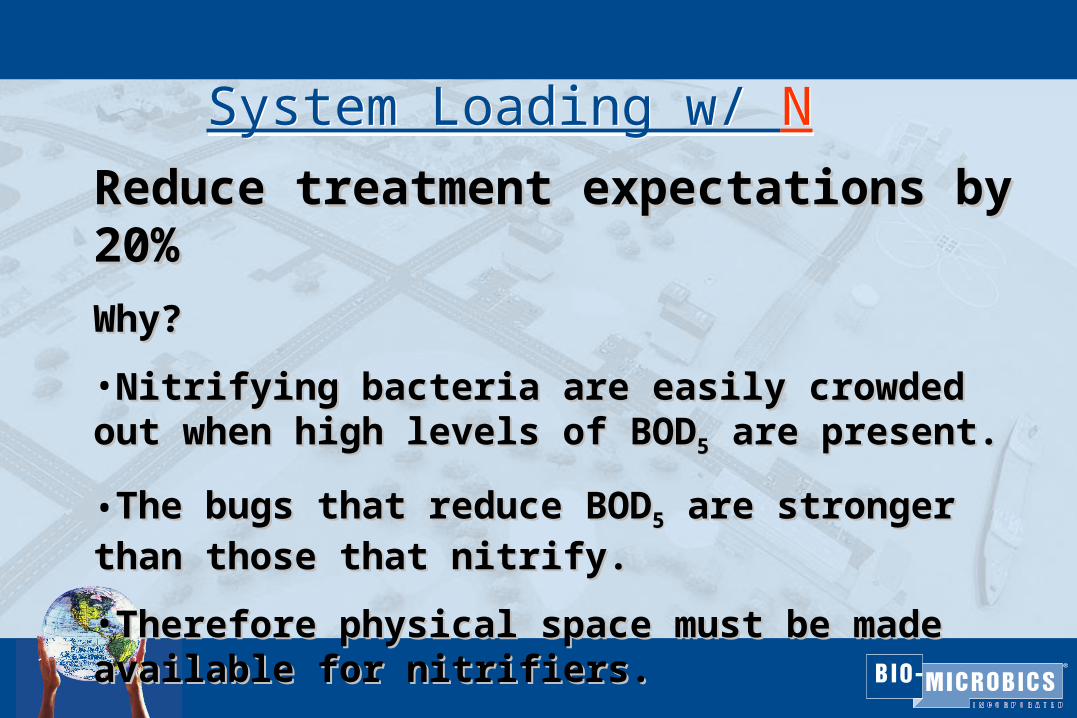
System Loading w/ NSystem Loading w/ N
Reduce treatment expectations by 20%Reduce treatment expectations by 20%
Why? Why?
•Nitrifying bacteria are easily crowded out when Nitrifying bacteria are easily crowded out when high levels of BODhigh levels of BOD55 are present. are present.
•The bugs that reduce BODThe bugs that reduce BOD55 are stronger than those are stronger than those
that nitrify. that nitrify.
•Therefore physical space must be made available Therefore physical space must be made available for nitrifiers.for nitrifiers.
Real World ExamplesReal World Examples
• Restaurant
• Subdivision
• School
• Restaurant
• Subdivision
• School
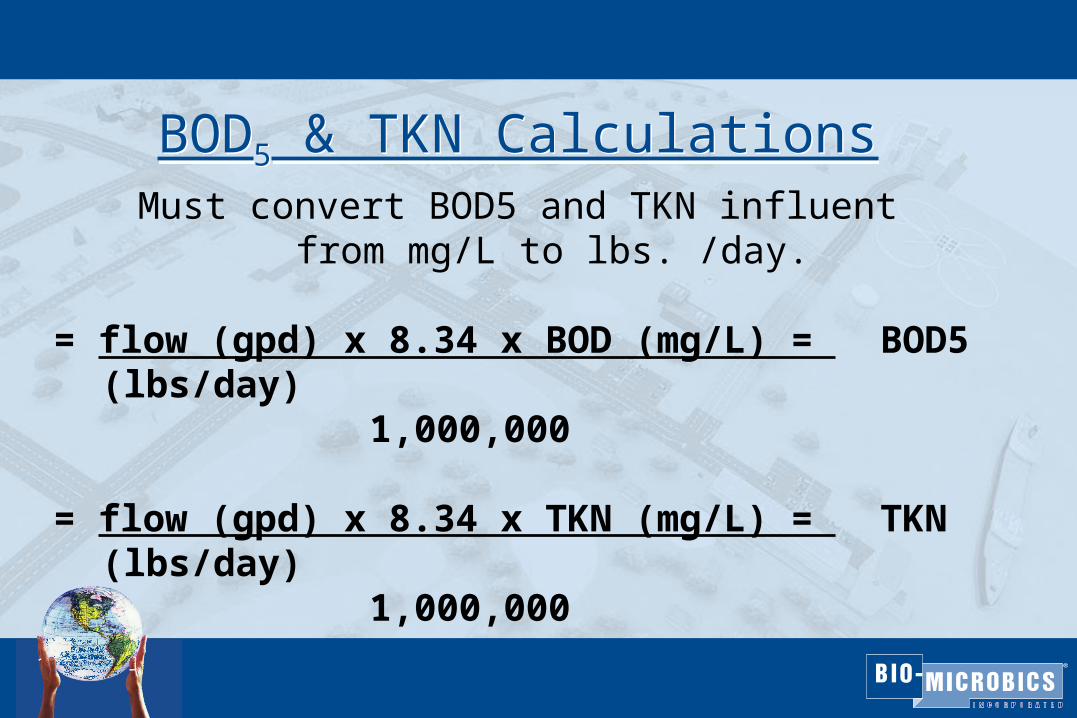
BOD5 & TKN CalculationsBOD5 & TKN CalculationsMust convert BOD5 and TKN influent
from mg/L to lbs. /day.
= flow (gpd) x 8.34 x BOD (mg/L) = BOD5 (lbs/day) 1,000,000
= flow (gpd) x 8.34 x TKN (mg/L) = TKN (lbs/day) 1,000,000
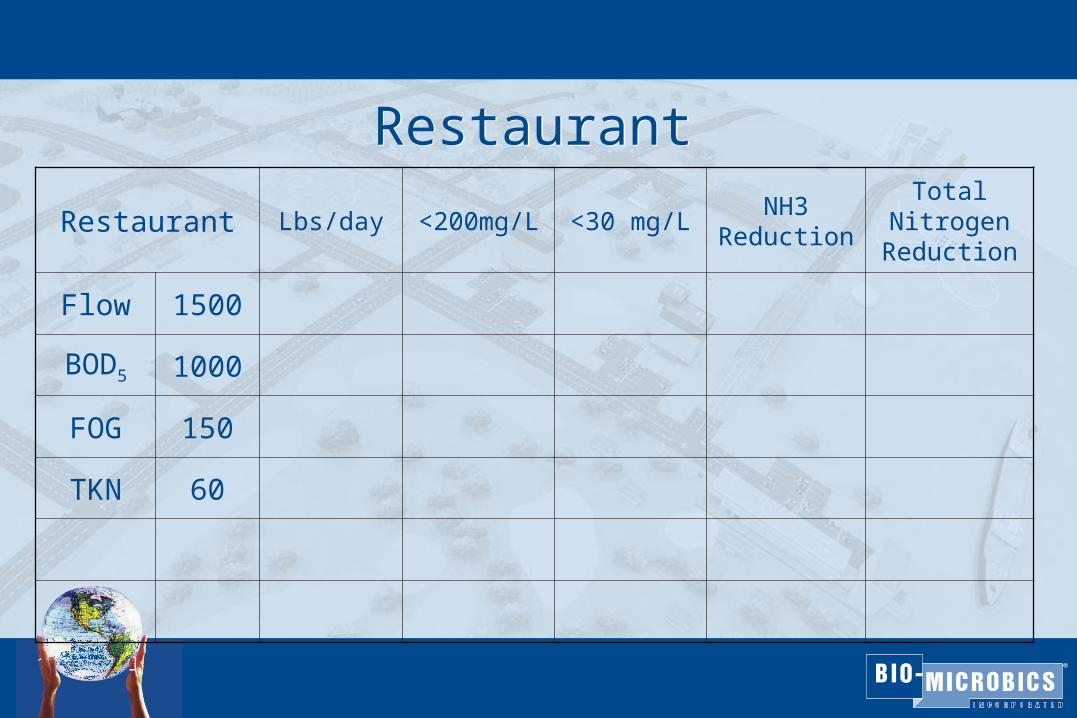
RestaurantRestaurant
Restaurant Lbs/day <200mg/L <30 mg/LNH3
Reduction
Total Nitrogen
Reduction
Flow 1500
BOD5 1000
FOG 150
TKN 60
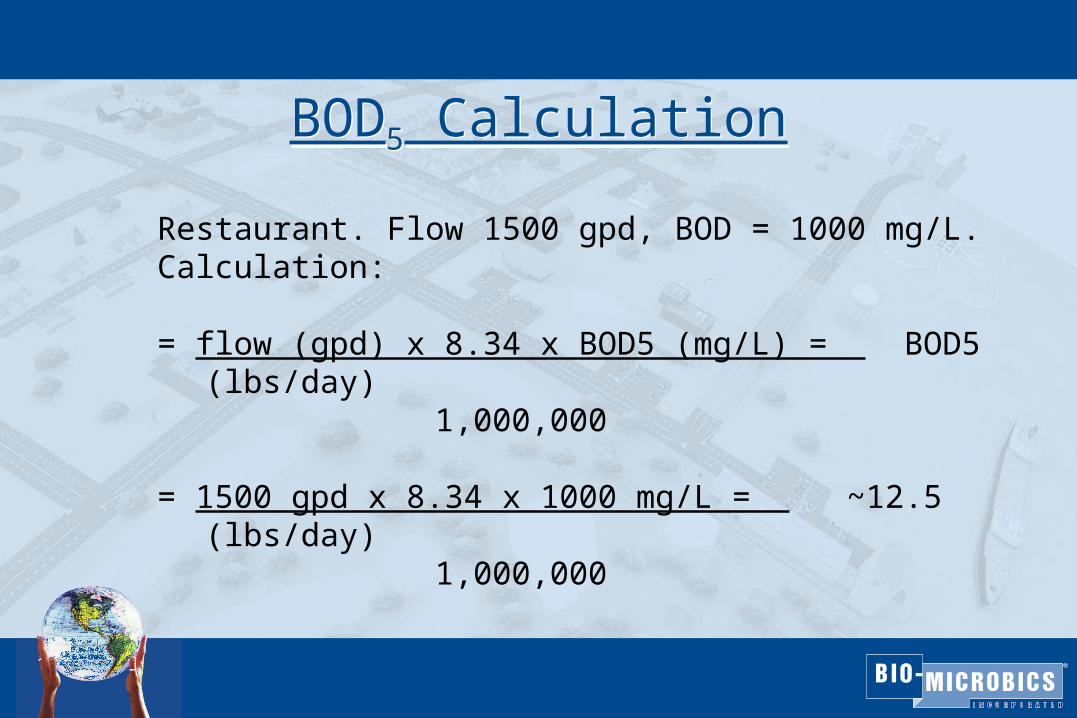
BOD5 CalculationBOD5 Calculation
Restaurant. Flow 1500 gpd, BOD = 1000 mg/L. Calculation:
= flow (gpd) x 8.34 x BOD5 (mg/L) = BOD5 (lbs/day) 1,000,000
= 1500 gpd x 8.34 x 1000 mg/L = ~12.5 (lbs/day) 1,000,000
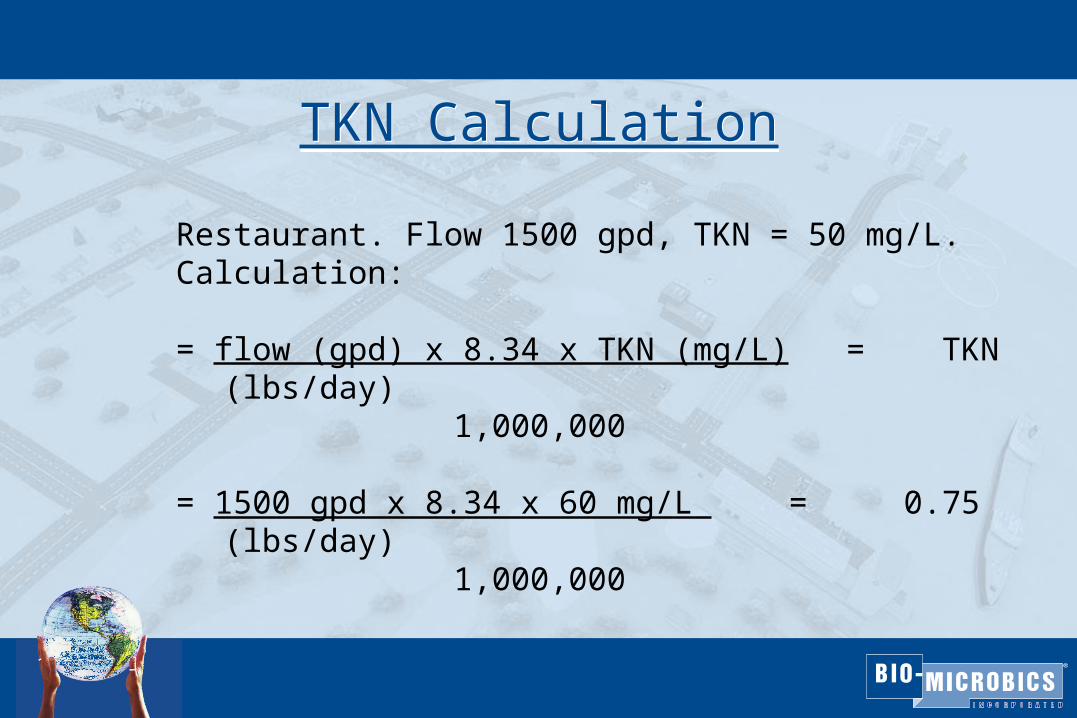
TKN CalculationTKN Calculation
Restaurant. Flow 1500 gpd, TKN = 50 mg/L. Calculation:
= flow (gpd) x 8.34 x TKN (mg/L) = TKN (lbs/day) 1,000,000
= 1500 gpd x 8.34 x 60 mg/L = 0.75 (lbs/day) 1,000,000
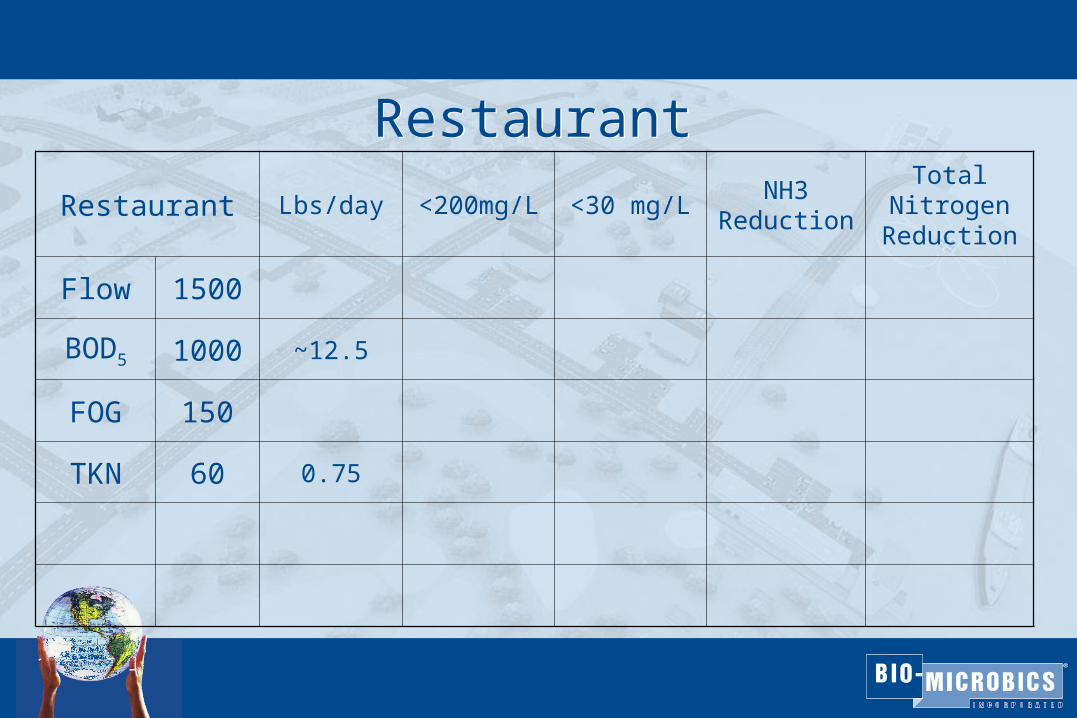
RestaurantRestaurant
Restaurant Lbs/day <200mg/L <30 mg/LNH3
Reduction
Total Nitrogen
Reduction
Flow 1500
BOD5 1000 ~12.5
FOG 150
TKN 60 0.75
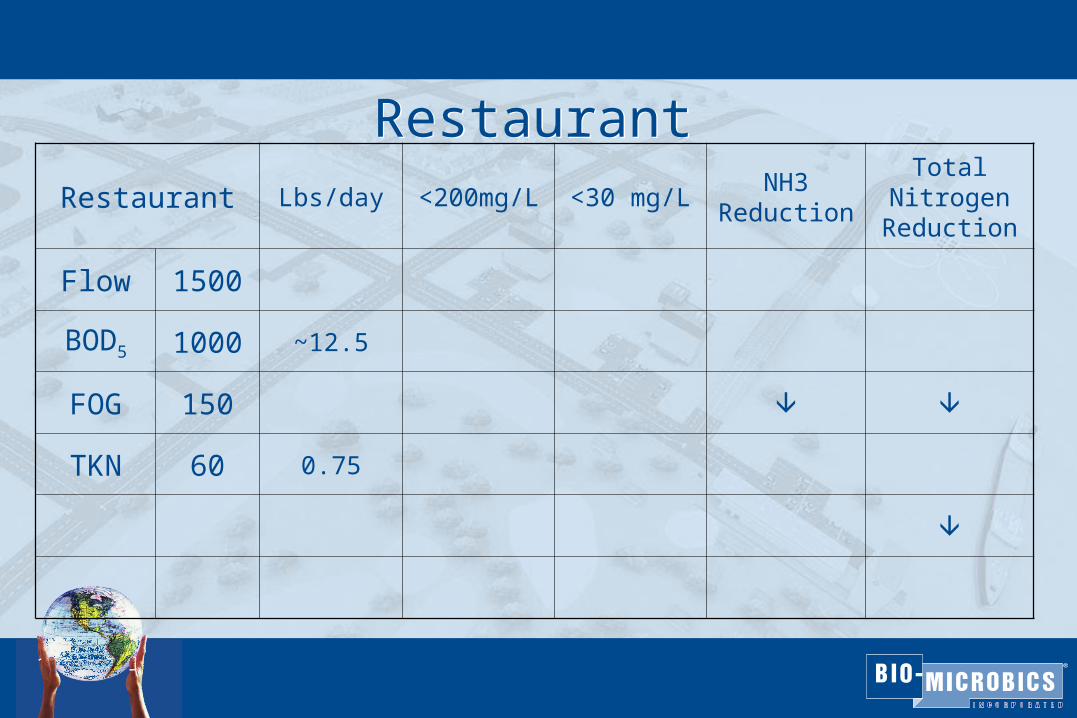
RestaurantRestaurantRestaurant Lbs/day <200mg/L <30 mg/L
NH3 Reduction
Total Nitrogen
Reduction
Flow 1500
BOD5 1000 ~12.5
FOG 150
TKN 60 0.75

SubdivisionSubdivision
Subdivision Lbs/day <200mg/L <30 mg/LNH3
Reduction
Total Nitrogen
Reduction
Flow 1500
BOD5 220
FOG 30
TKN 70
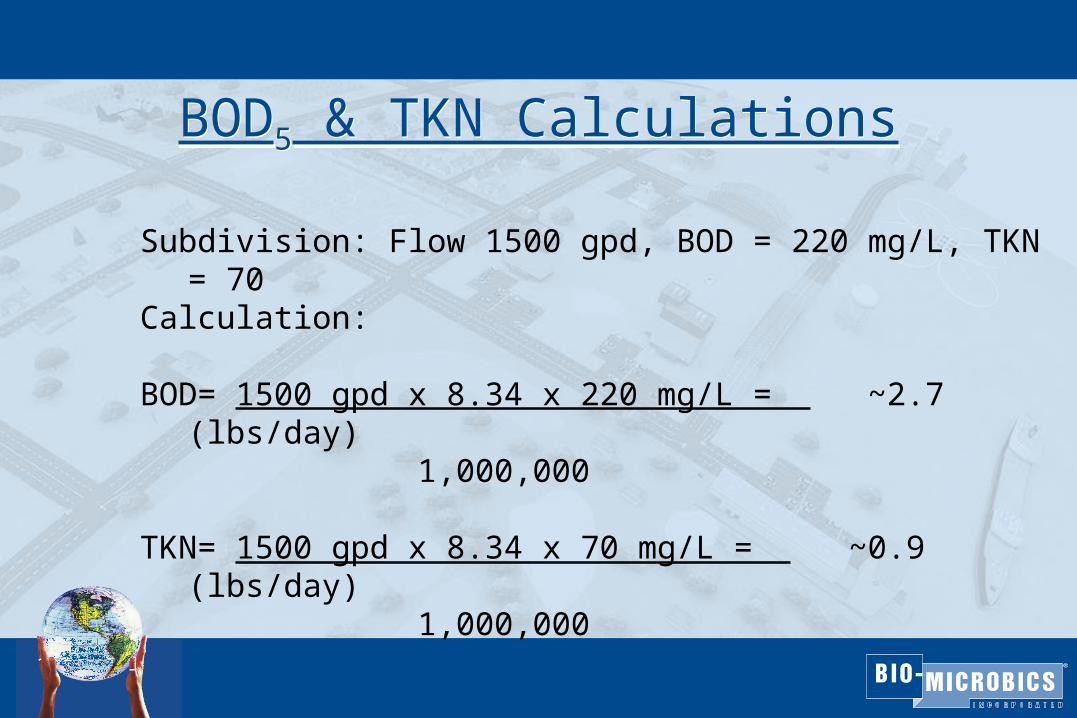
BOD5 & TKN CalculationsBOD5 & TKN Calculations
Subdivision: Flow 1500 gpd, BOD = 220 mg/L, TKN = 70 Calculation:
BOD= 1500 gpd x 8.34 x 220 mg/L = ~2.7 (lbs/day) 1,000,000
TKN= 1500 gpd x 8.34 x 70 mg/L = ~0.9 (lbs/day) 1,000,000
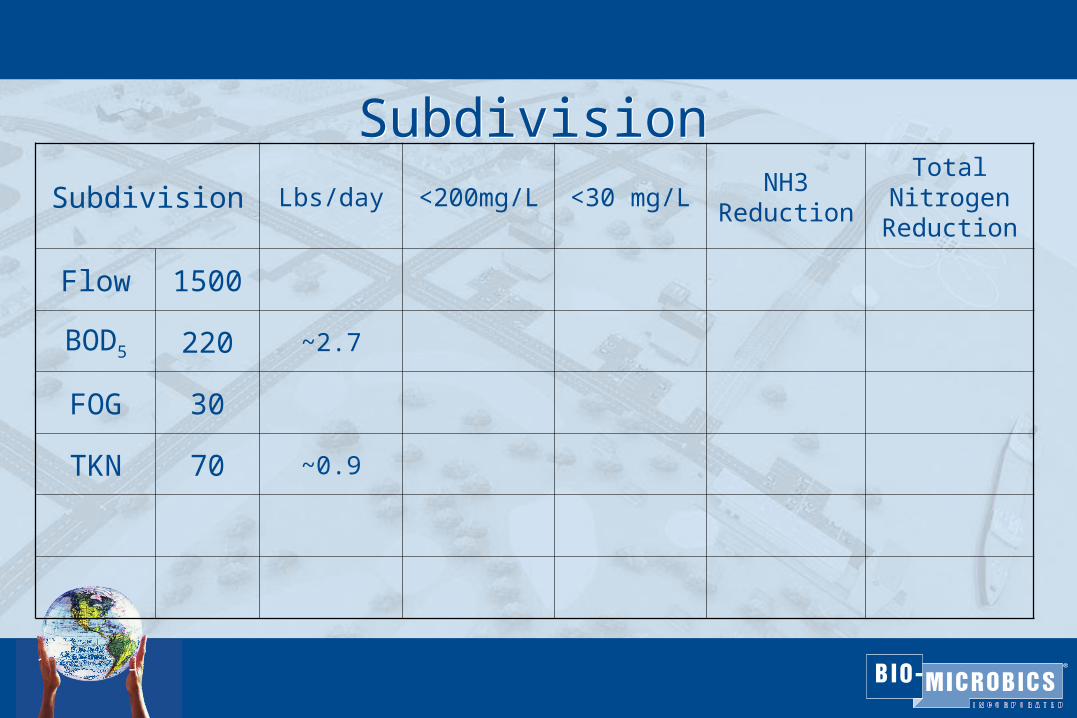
SubdivisionSubdivisionSubdivision Lbs/day <200mg/L <30 mg/L
NH3 Reduction
Total Nitrogen
Reduction
Flow 1500
BOD5 220 ~2.7
FOG 30
TKN 70 ~0.9

SubdivisionSubdivision
Subdivision Lbs/day <200mg/L <30 mg/LNH3
Reduction
Total Nitrogen
Reduction
Flow 1500
BOD5 220 ~2.7
FOG 30
TKN 70 ~0.9

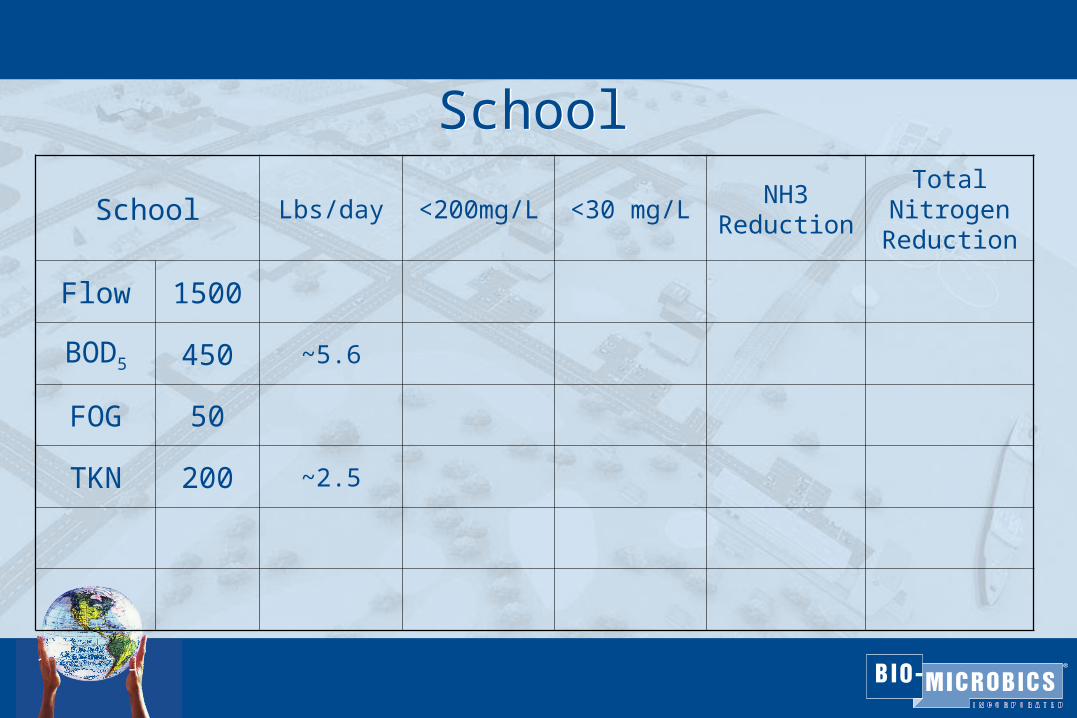
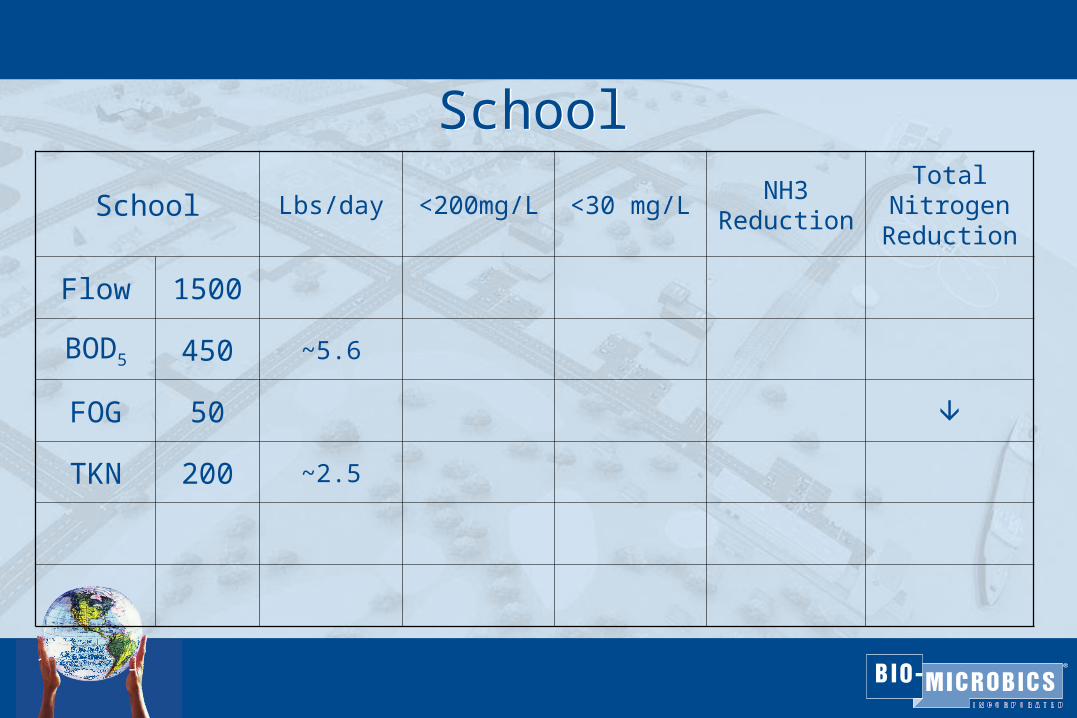
SchoolSchool
School Lbs/day <200mg/L <30 mg/LNH3
Reduction
Total Nitrogen
Reduction
Flow 1500
BOD5 450
FOG 50
TKN 200
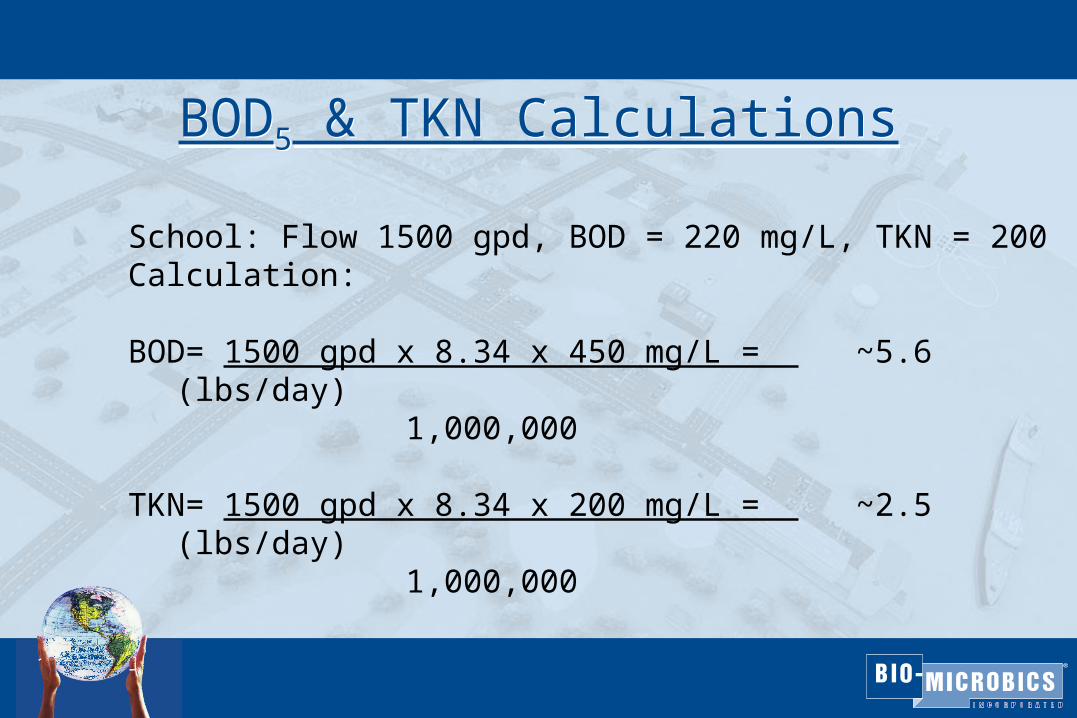
BOD5 & TKN CalculationsBOD5 & TKN Calculations
School: Flow 1500 gpd, BOD = 220 mg/L, TKN = 200 Calculation:
BOD= 1500 gpd x 8.34 x 450 mg/L = ~5.6 (lbs/day) 1,000,000
TKN= 1500 gpd x 8.34 x 200 mg/L = ~2.5 (lbs/day) 1,000,000
SchoolSchool
School Lbs/day <200mg/L <30 mg/LNH3
Reduction
Total Nitrogen
Reduction
Flow 1500
BOD5 450 ~5.6
FOG 50
TKN 200 ~2.5
SchoolSchool
School Lbs/day <200mg/L <30 mg/LNH3
Reduction
Total Nitrogen
Reduction
Flow 1500
BOD5 450 ~5.6
FOG 50
TKN 200 ~2.5
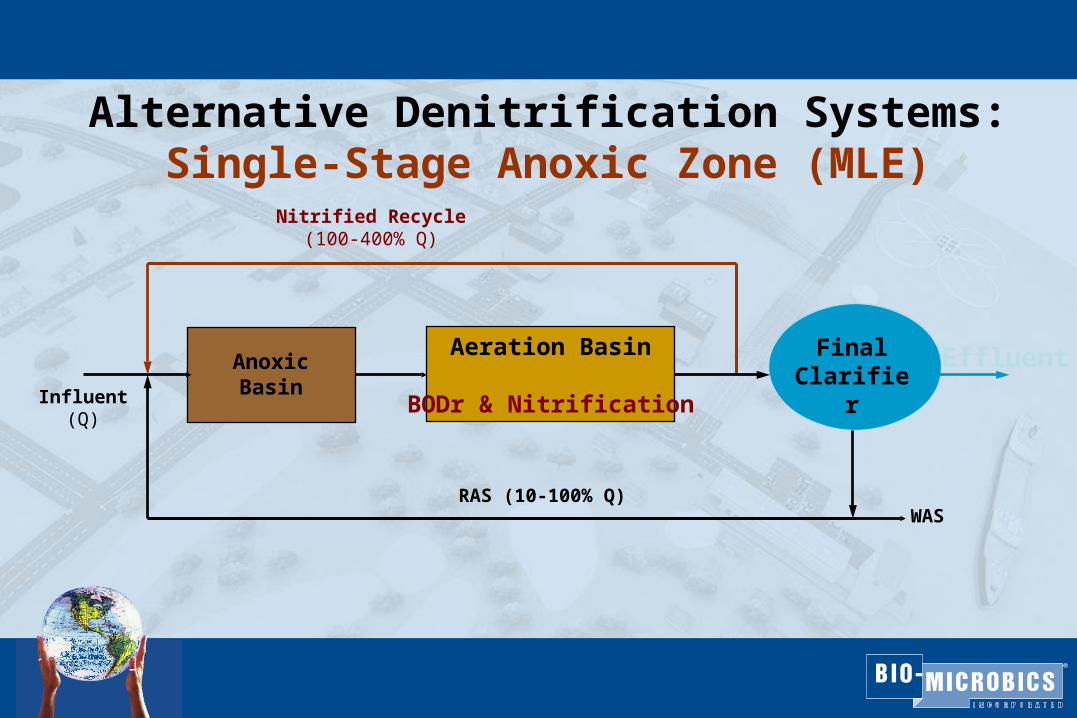
EffluentInfluent
(Q)
FinalClarifier
Nitrified Recycle(100-400% Q)
RAS (10-100% Q)WAS
Alternative Denitrification Systems:Single-Stage Anoxic Zone (MLE)
AnoxicBasin
Aeration Basin
BODr & Nitrification
Alternative Denitrification Systems:Single-Stage Anoxic Zone
• Effluent nitrate of 8-12 mg/L without external carbon source
• Alkalinity and oxygen recovery • Influent WW should have adequate BOD to satisfy the
denitrification needs• Sensitive to the aeration tank DO and the nitrate
recirculation flow rate• Suitable for large plants
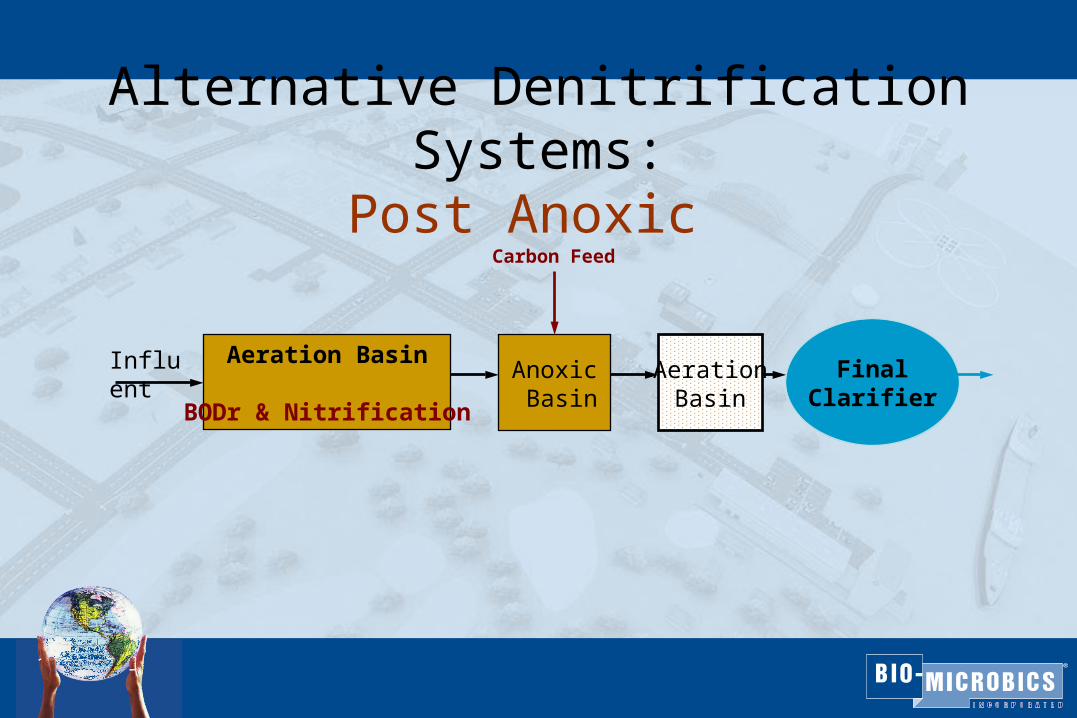
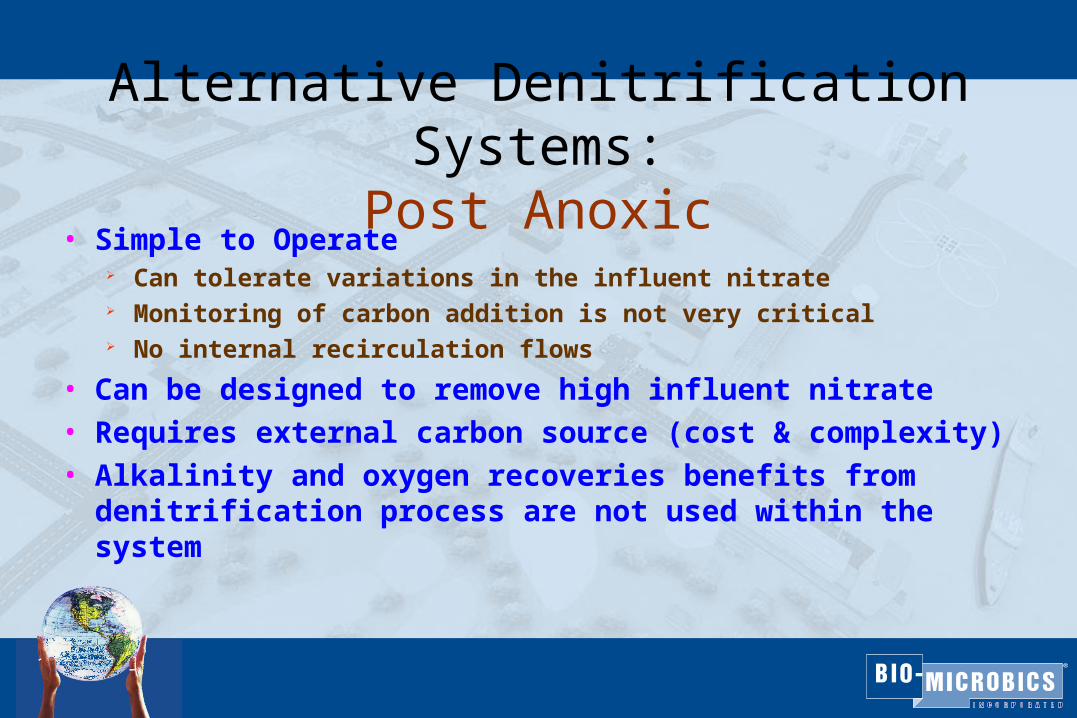
Alternative Denitrification Systems:Post Anoxic
Influent Aeration Basin
BODr & Nitrification
Anoxic Basin
AerationBasin
FinalClarifier
Carbon Feed
Alternative Denitrification Systems:Post Anoxic
• Simple to Operate Can tolerate variations in the influent nitrate Monitoring of carbon addition is not very critical No internal recirculation flows
• Can be designed to remove high influent nitrate• Requires external carbon source (cost & complexity)• Alkalinity and oxygen recoveries benefits from
denitrification process are not used within the system

Challenges of Nitrogen Removal forOn-Site Applications
• Periodic and Non-uniform Influent Flow
• Adverse Impact of High and Low Loading Rates on Nitrogen Removal
• Typically Non-Optimum Influent BOD:TKN for Denitrification Process
• Potential for unexpected toxicity in the Influent

Questions?Questions?

For More Information...For More Information...
Phone: (800) 753-FAST
Fax: (913) 422-0808
E-mail: [email protected]
Web site: www.biomicrobics.com
Phone: (800) 753-FAST
Fax: (913) 422-0808
E-mail: [email protected]
Web site: www.biomicrobics.com
Related Documents


