Comparative transcriptomics within Arabidopsis thaliana accessions and across Brassicaceae species revealevolutionary conserved and lineage-speficic expressionsignatures in pattern triggered immunity
Thomas Maximilian Winkelmüller
Arabidopsis thaliana
Cardamine hirsuta
Capsella rubella
Eutrema salsugineum

Comparative transcriptomics within Arabidopsis thaliana
accessions and across Brassicaceae species reveal
evolutionary conserved and lineage-specific expression
signatures in pattern-triggered immunity
I n a u g u r a l - D i s s e r t a t i o n
zur
Erlangung des Doktorgrades
der Mathematisch-Naturwissenschaftlichen Fakultät
der Universität zu Köln
vorgelegt von
Thomas Maximilian Winkelmüller
aus Leverkusen
Köln, Februar 2018


Die vorliegende Arbeit wurde am Max-Planck-Institut für Pflanzenzüchtungsforschung in Köln
in der Abteilung für Pflanze-Mikroben Interaktionen (Direktor: Prof. Dr. Paul Schulze-Lefert),
in der Arbeitsgruppe von Dr. Kenichi Tsuda angefertigt.
Berichterstatter: Prof. Dr. Paul Schulze-Lefert
Prof. Dr. Stanislav Kopriva
Prüfungsvorsitzender: Prof. Dr. Gunther Döhlemann
Tag der Disputation: 11.04.2018


Publications
Mine, A., Nobori, T., Salazar-Rondon, M.C., Winkelmüller, T.M., Anver, S., Becker, D., and
Tsuda, K. (2017). An incoherent feed-forward loop mediates robustness and tunability in a plant
immune network. EMBO Rep. 18: 464–476.
Mine, A., Berens, M.L., Nobori T., Anver, S., Fukumoto, K., Winkelmüller, T.M., Takeda,
A., Becker, d., and Tsuda, K. (2017). Pathogen exploitation of an abscisic acid- and jasmonate-
inducible MAPK phosphatase and its interception by Arabidopsis immunity. Proc. Natl. Acad.
Sci.114: 7456-7461.
Winkelmüller, T.M., Anver, S., Garrido-Oter, R., Dahms, E., Song, B., Gao., X., Schulze-
Lefert, P., Bednarek, P., and Kenichi Tsuda. Comparative transcriptomics within and between
Brassicacea species reveal evolutionary conserved and lineage-specific expression signatures
in pattern-triggered immunity. In preperation


I
Table of Contents
Publications ..................................................................................................................... I
Table of Contents ............................................................................................................ I
List of figures ................................................................................................................. IV
List of tables.................................................................................................................... V
List of Abbreviations .................................................................................................... VI
Abstract ...................................................................................................................... VIII
Zusammenfassung ........................................................................................................ IX
1.Introduction ................................................................................................................. 11.1.The plant immune system .................................................................................................. 1
1.1.1.Pattern triggered Immunity (PTI) .............................................................................. 21.1.2.Flg22 perception, signalling and control via FLS2 ................................................... 51.1.3.Transcriptional reprogramming during PTI .............................................................. 81.1.4.Conservation and Evolution of PTI ......................................................................... 10
1.2.Comparative transcriptomics and evolution of gene expression ..................................... 111.3.Brassicaceae as a model family for comparative genomics and transcriptomics ............ 151.4.Thesis aims ...................................................................................................................... 16
2.Results ........................................................................................................................ 192.1.MAMP perception and initial signalling components are generally conserved among
Brassicaceae species ............................................................................................................... 192.2.Brassicaceae species respond to flg22 in a conserved manner ........................................ 212.3.Phytohormone levels and their responses to flg22 drastically differ between Brassicaceae
species ..................................................................................................................................... 222.4.Reduction of Pto growth by flg22 varies between species .............................................. 232.5.Flg22 triggers a massive transcriptional reprogramming in tested Brassicaceae ............ 252.6.A core set of genes is conserved for its flg22-responsivness .......................................... 272.7.Transcriptomic responses to flg22 differ in their temporal dynamics between species .. 292.8.SA levels do not explain distinct temporal transcriptome dynamics ............................... 312.9.Analysis of Brassicaceae accessions and sister species revealed no correlation between
sustained gene activation and the flg22 capacity to reduce Pto growth ................................. 322.10.Early flg22 transcriptomic responses diversified qualitatively between Brassicaceae .. 332.11.Flg22 transcriptome responses are highly conserved between genetically and
geographically distinct A. thaliana accessions ....................................................................... 34

II
2.12.Inter-species transcriptome variation exceeds intra-species variation in response to
flg22 ...................................................................................................................................... 372.13.Species-specific flg22-responsive genes are connected to potential diversification of
secondary metabolism ............................................................................................................ 412.14.Species-specific expression signatures are conserved in Brassicaceae accessions and
sister species and can be partially triggered by elf18. ........................................................... 422.15.WRKY TF motifs are highly enriched in commonly induced clusters and present in
some species-specific expression signatures. ......................................................................... 44
2.16.Coding sequence and promoter variation does not correlate with expression variation 462.17.Heat stress-induced transcriptome responses vary among Brassicaceae similarly as
flg22-triggered responses ........................................................................................................ 50
3.Discussion ................................................................................................................... 553.1.Flg22 perception machinery and flg22-triggered early responses are conserved in
Brassicaceae ............................................................................................................................ 553.1.1.Sequence conservation of PTI perception machinery ............................................. 553.1.2.All Brassicaceae tested in this study sensed flg22 .................................................. 57
3.2.Variation in flg22-mediated responses among Brassicaceae ........................................... 583.2.1.Variable effect of flg22 on growth reduction .......................................................... 583.2.2.Variation in hormone levels .................................................................................... 583.2.3.Variation in bacterial growth ................................................................................... 61
3.3.Comparative transcriptomics after a defined stress – a dataset advancing the field of
comparative transcriptomics ................................................................................................... 633.3.1.Massive transcriptional reprogramming shows importance of flg22 induced
transcriptional reprogramming .......................................................................................... 653.3.2.Purifying selection conserved flg22-responsiveness of a core set of genes during
Brassicaceae evolution ...................................................................................................... 673.3.3.Regulatory mechanisms controlling conserved flg22-responsive transcriptional
reprogramming .................................................................................................................. 683.3.4.Factors that might influence detection of species-specific expression signatures ... 703.3.5.Lineage-specific gene expression as a sign of adaptive evolution .......................... 713.3.6.Regulatory mechanisms affecting lineage-specific gene expression ...................... 733.3.7.Potential functions of species-specific expression signatures ................................. 743.3.8.Conservation of flg22-triggered transcriptional responses between A. thaliana
accessions was robust to a diverse geographic distribution and diversified basal immune
levels in certain accessions. .............................................................................................. 763.3.9.Within and between species variation in gene expression – Interspecies variation
exceeds intra species variation .......................................................................................... 783.3.10.Specificity of lineage-specific flg22-responsive transcriptional signatures .......... 79
III
3.4.Connection of sequence and expression variation. .......................................................... 803.5.Concluding remarks and future perspectives ................................................................... 81
4.Material and Methods .............................................................................................. 85
4.1.Materials .......................................................................................................................... 854.1.1.Plant Material .......................................................................................................... 854.1.2.Bacterial Material .................................................................................................... 864.1.3.Primer ...................................................................................................................... 864.1.4.Genes described in this study .................................................................................. 884.1.5.Chemicals, Kits, Enzymes and Buffers ................................................................... 89
4.2.Methods ........................................................................................................................... 904.2.1.Plant Growth ............................................................................................................ 904.2.2.Flg22 and heat-stress treatment ............................................................................... 914.2.3.Seedling growth inhibition assay ............................................................................. 914.2.4.Hormone quantification ........................................................................................... 914.2.5.Bacterial Growth Assays ......................................................................................... 914.2.6.MAP kinase phosphorylation assay ......................................................................... 924.2.7.RNA extraction, cDNA synthesis and RT-qPCR .................................................... 934.2.8.Statistical analysis .................................................................................................... 934.2.9.RNAseq: sequencing, read mapping and read counting .......................................... 944.2.10.Bioinformatics analysis of RNAseq data ............................................................... 95
5.References .................................................................................................................. 98
6.Supplement .............................................................................................................. 113
Acknowledgments ....................................................................................................... 145
Erklärung .................................................................................................................... 146

IV
List of figures
Figure 1: Conservation of MAMP perception components across Brassicaceae species.. ..... 20
Figure 2: All tested Brassicaceae species respond to flg22. ................................................... 22
Figure 3: Distinct accumulation and flg22-responsiveness of phytohormone in Brassicaceae
species. ............................................................................................................................. 24
Figure 4: flg22-triggered bacterial growth inhibition in Brassicaceae species ....................... 25
Figure 5: All tested Brassicaceae species induce massive transcriptional reprogramming
upon flg22 perception ...................................................................................................... 27
Figure 6: Conserved flg22-responsive genes are associated with immune responses. ........... 28
Figure 7: Distinct sustainability of transcriptional response to flg22 in Brassicaceae species
is associated with SA-responsive genes ........................................................................... 30
Figure 8: SID2-mediated SA production is not required for sustained flg22-triggered
transcriptional response in A. thaliana ............................................................................. 32
Figure 9: A large fraction of DEGs exhibited species specific expression signatures ........... 34
Figure 10: flg22 triggered transcriptional responses are highly conserved among A. thaliana
accessions with diverse genetic backgroundst ................................................................. 36
Figure 11: Inter-species variation exceeds intra-species variation in transcriptome response
to flg22 and is incongruent with phylogenetic relationships ........................................... 40
Figure 12: Species-specific expression signatures are preserved in sister species and
Brassicaceae accessions. .................................................................................................. 43
Figure 13: A subset of the species-specific expression changes triggered by flg22 is
conserved after elf-18 treatment ...................................................................................... 43
Figure 14: Enrichment of TF-motifs within the 5´regulatory regions of DEG clusters ......... 47
Figure 15: Gene expression variation does not correlate with coding sequence variation. .... 49
Figure 16: The transcriptome response to heat stress is diversified across Brassicaceae. ...... 51
Supplement Figure 1: Principal component analysis of normalized RNAseq data. ............ 113
Supplement Figure 2: Overlap of DEGs at different time-points. ....................................... 114
Supplement Figure 3: flg22-triggered bacterial suppression does not correlate with marker
gene induction 24 h after flg22 treatment ...................................................................... 115
Supplement Figure 4: Heatmap for all DEGs in Brassicaceae species after flg22 treatment
........................................................................................................................................ 117
Supplement Figure 5: Comparison of two different mapping approaches for A. thaliana
accessions RNAseq reads .............................................................................................. 118

V
Supplement Figure 6: Variation in coding and upstream sequences does not explain lineage–
specific expression signatures in response to flg22 ....................................................... 119
Supplement Figure 7: The size of gene family and basal gene expression levels do not
explain species-specific expression signatures .............................................................. 120
Supplement Figure 8: Some of key secondary metabolism genes are lowly expressed in C.
rubella compared to other Brassicaceae species. ........................................................... 121
Supplement Figure 9: Conserved heat-stress responses in tested Brassicaceae species ..... 121
Supplement Figure 10: Heatmap for all DEGs in Brassicaceae species after heat stress
treatment ........................................................................................................................ 121
List of tables
Table 1: Brassicaceae species and accessions used in this study ............................................ 85
Table 2: A. thaliana accessions used in this study. ................................................................. 85
Table 3: A. thaliana mutants used in this study ...................................................................... 86
Table 4: Primers used in this study ......................................................................................... 86
Table 5: Genes described in this study .................................................................................... 88
Table 6: Chemicals used in this study ..................................................................................... 89
Table 7: Kits used in this study ............................................................................................... 89
Table 8: Enzymes used in this study ....................................................................................... 89
Table 9: Media and Buffers .................................................................................................... 90
Table 10: qPCR Master Mix ................................................................................................... 93
Table 11: qPCR cycling program ............................................................................................ 93
Table 12: Reference genomes used for RNAseq analysis ...................................................... 95
Table 13: Tophat2 parameters used for mapping RNAseq reads ........................................... 95
Table 14: Software and packages used in this study ............................................................... 97
Supplement Table 1: Mapping statistics of RNAseq reads from flg22 RNAseq dataset .... 122
Supplement Table 2: Mapping statistics of RNAseq reads from heat-stress RNAseq dataset
........................................................................................................................................ 122
Supplement Table 3: Overrepresented GO-terms for DEGs expression clusters 1h after flg22
treatment ........................................................................................................................ 122

VI
Supplement Table 4: Known TF-motifs enriched in A. thaliana 5´regulatory regions of DEGs
........................................................................................................................................ 129
Supplement Table 5:Known TF-motifs enriched in C.rubella 5´regulatory regions of DEG
........................................................................................................................................ 134
Supplement Table 6 Known TF-motifs enriched in C. hirsuta 5´regulatory regions of DEGs
........................................................................................................................................ 138
Supplement Table 7: Known TF-motifs enriched in E. salsugineum 5´regulatory regions of
DEGs .............................................................................................................................. 141
List of Abbreviations
AA Amino acid
Aar Aethionema arabicum
ABA Abscisic acid
Aly Arabidopsis lyrata
Ath Arabidopsis thaliana
BrC Brassica rapa chifu
BrF Brassica rapa fast plant
cfu colony forming unit
Cgr Capsella grandiflora
Chi Cardamine hirsuta
Cru Capsella rubella
DAMP damage-associated molecular pattern
DEG differentially expressed genes
dpi days post inoculation
Esa Eutrema salsugineum
ETI effector triggered immunity
FLS2 FLAGELLIN-SENSITIVE 2
FW fresh weight
GO Gene Ontology
Hpa Hyaloperonospora arabidopsidis
hpi hours post inoculation
hpt hours post treatment
VII
JA jasmonic acid
LRR leucine-rich-repeat
MAMP microbe-associated molecular pattern
MAPK mitogen-activated protein kinase
MeJA Methyl Jasmonate
MS Murashige and Skoog�
NLR nucleotide-binding domain leucine rich repeat proteins
OD optical density
PRR pattern recognition receptor
PTI pattern-triggered immunity
Pto Pseudomonas syringae pv. tomato
RLK receptor-like kinase
RLP receptor-like protein
ROS reactive oxygen species
RT-qPCR reverse transcriptase quantitative polymerase chain reaction
SAR systemic acquired resistance
SD standard deviation
SE standard error
SID2 SALICYLIC ACID INDUCTION DEFICIENT 2
Spa Shrenkiella parvula
T3SS type 3 secretion system
TF transcription factor
wt wild type

VIII
Abstract
In nature plants are surrounded by a diverse set of beneficial and harmful microbes.
Plants can recognize these microbes by sensing conserved microbe-associated molecular
patterns (MAMPs) via cell surface-localized receptors, leading to the activation of pattern-
triggered immunity (PTI). PTI protects plants from potential microbial pathogens through
induction of a myriad of defence responses including massive transcriptional reprogramming
in Arabidopsis thaliana. Despite the significance of PTI responses for the plant adaptation to
diverse microbes, we currently do not understand the importance of this massive transcriptional
reprogramming, whether PTI responses are conserved, and how they evolved. Here I used
comparative transcriptomics to analyse the responses of six A. thaliana accessions and three
additional Brassicaceae species to the bacterial MAMP flg22. This analysis revealed that large
parts of the transcriptional response to flg22 are conserved among Brassicaceae species,
suggesting that these are under purifying selection over the Brassicaceae evolution and that
flg22-triggered transcriptional reprogramming during PTI is important. At the same time, I
found that a considerable fraction of flg22-responsive genes showed species-specific
expression signatures. Moreover, variation in flg22-triggered transcriptional reprogramming
was incongruent with the Brassicaceae phylogeny, suggesting that adaptive evolution acts on
subsets of flg22-responsive genes. In contrast, flg22-triggered transcriptional responses among
genetically and geographically diverse A. thaliana accessions were extremely conserved. Thus,
inter-species clearly exceeds intra-species transcriptome variation in response to flg22. This
further suggests the adaptive nature of gene expression evolution and points to a small
contribution of neutral transcriptome evolution during PTI within Brassicaceae. Regulatory
regions of conserved flg22-inducible genes were highly enriched for WRKY transcription
factor (TF)-binding motifs throughout all tested species. Interestingly, regulatory regions of
genes specifically induced in A. thaliana or Capsella rubella were enriched for WRKY-binding
motifs only in A. thaliana or C. rubella, respectively. This indicates that WRKY TFs play an
important role in flg22-triggered gene induction and that the gain of WRKY-binding motifs in
regulatory regions accounts for some species-specific expression changes. Taken together, this
study advances the field of comparative transcriptomics by providing empirical analysis for the
evolution of stress-induced transcriptome changes within and across plant species with a
defined phylogenetic framework.

IX
Zusammenfassung
In der Natur sind Pflanzen von einer Vielzahl verschiedenartiger Mikroorganismen
umgeben. Pflanzen können diese Mikroorganismen anhand von konservierten Mikroben-
Molekülen sogenannten „microbe associated molecular patterns“ (MAMPs) wahrnehmen,
welche von Pflanzenrezeptoren auf der Zelloberfläche erkannt werden. Dies aktiviert das
Pflanzen-Immunsystem, eine sogenannte „pattern triggered immunity“ (PTI) wird in der
Pflanze ausgelöst. PTI schützt die Pflanze vor einer Vielzahl schädlicher Mikroben und löst
zahlreiche Abwehrreaktionen, unter anderem eine heftige Transkriptions-Antwort, aus.
Obwohl PTI ein wichtiger Prozess für die Adaptierung von Pflanzen auf unterschiedliche
Mikroorganismen darstellt, ist unklar wie bedeutend diese massive Transkriptionsantwort ist,
in wieweit diese Reaktion in anderen Pflanzenarten konserviert ist und wie PTI evolviert. Um
diese offenen Fragen zu klären, habe ich die Transkriptionsantworten zwischen drei A. thaliana
verwandten Brassicaceae Spezies sowie von fünf A. thaliana Ökotypen auf das bakterielle
MAMP flg22 untersucht und miteinander vergleichen.
Diese Analyse ergab das große Teile der Transkriptionsantwort auf flg22-indizierte PTI
zwischen den getesteten Brassicaceae Arten, durch stabilisierende Selektion während der
Brassicaceae Evolution, konserviert wurden. Dies verdeutlicht die Bedeutung dieser massiven
Transkriptionsantwort während PTI. Gleichzeitig weisen Arten-spezifische
Transkriptionsmuster, welche inkongruent mit der Brassicaceae Phylogenese sind, darauf hin,
dass adaptive Evolution einige Diversifizierungen der flg22-induzierten
Transkriptionsantworten beeinflusst hat. Im Gegensatz dazu waren flg22-induzierte
Transkriptionsantworten zwischen verschiedenen A. thaliana Ökotypen hoch konserviert. Die
inter-Spezies Variation der Transkriptionsantwort, welche die intra-Spezies Variation weit
übersteigt, zeigt zum einen, dass die die kurze evolutive Zeit innerhalb einer Art nicht
ausreichend ist, um solch eine Diversifizierung zu erzeugen, und andererseits das neutrale
Evolution vermutlich einen geringen Einfluss auf die beobachteten Diversifizierungen
zwischen den Arten gehabt hat. Regulatorische Sequenzen konservierter flg22-induzierter Gene
waren in allen getesteten Arten mit WRKY Transkriptiosfaktor(TF)-Motiven angereichert.
Interessanterweise waren A. thaliana und C. rubella spezifisch induzierten Gene nur in A.
thaliana und C. rubella regulatorischen Sequenzen für WRKY TF Motive angereichert. Dies
deutet darauf hin, dass WRKY TFs eine wichtige Rolle bei der flg22-induzierten Geninduktion
spielen und dass der Gewinn von WRKY-Bindungsmotiven in den regulatorischen Sequenzen
für einige artspezifische Expressionsänderungen verantwortlich ist. Insgesamt treibt diese
Studie das Feld der komparativen Transkriptionsanalyse voran, da hier zum ersten Mal Stress-

X
induzierte Transkriptionsantworten mehrere Ökotypen innerhalb einer Pflanzenart mit denen
zwischen mehreren Pflanzenarten, in einem phylogenetisch definierten Rahmen, verglichen
wurden. Dabei untermauerten evolutiv konservierte Transkriptionsantworten ihre Bedeutung
für das Pflanzenimmunsystem, wohingegen Arten-spezifische Transkriptionsmuster potenziell
adaptive Merkmale hervorhoben.

1. Introduction
1
1. Introduction
1.1. The plant immune system
In nature, plants are surrounded by a myriad of diverse microbes which can be beneficial
or harmful for the plant (Bulgarelli et al., 2013; Agler et al., 2016). In order to stay healthy and
grow, plants must recognize non-self or altered-self and mount the appropriate responses when
sensing microbes in their surroundings (Jones and Dangl, 2006; Couto and Zipfel, 2016). Since
plants lack an adaptive immune system, they rely on an innate immune system enabling plant
cells to recognize pathogens via different types of receptors (Spoel and Dong, 2012). Plants
detect pathogens via cell surface localized pattern recognition receptors (PRRs) by utilizing the
presence of conserved structures, called pathogen- or microbe-associated molecular patterns
(PAMPs or MAMPs) (Jones and Dangl, 2006; Spoel and Dong, 2012; Ranf, 2017). Since
MAMPs are often relevant for the microbial fitness, plants exploit that MAMPs cannot be easily
changed by the microbes (Martin and Kamoun, 2012). MAMP recognition results in pattern-
triggered immunity (PTI), which is effective against the vast majority of potential pathogens
(Zhang and Zhou, 2010; Macho and Zipfel, 2014; Bigeard et al., 2015). Moreover, plants can
activate PTI by sensing plant-derived molecules called damage-associated molecular patterns
(DAMPs) via PRRs (Gust et al., 2017).
To increase virulence, microbes evolved virulence factors called effectors, which are
delivered inside the plant cell to modify the plant's behaviour to the microbe’s benefit; often by
perturbing plant immune responses (Toruño et al., 2016; Varden et al., 2017). As a
countermeasure, plants evolved a second layer of immunity to not only directly recognize
virulence effectors, but also perturbation caused by them via intracellular receptors called
nucleotide-binding domain leucine-rich repeat proteins (NLRs) (Jones and Dangl, 2006; Cui et
al., 2015). In addition, some NLR receptors even present so-called decoy domains which mimic
plant immune components such as WRKY transcription factors that are targeted by effectors
and thus trick the pathogen as it activates the NLR receptor rather than perturbing its intended
target (Le Roux et al., 2015; Sarris et al., 2015). Successful detection of effector actions
activates effector-triggered immunity (ETI), which shares many overlapping features with PTI
but is considered stronger and more robust as compared to PTI (Katagiri and Tsuda, 2010). In
plant cells surrounding the infection site, ETI often leads to a programmed cell death called
1. Introduction
2
hypersensitive response (HR) to limit further pathogen spread. Taken together, PTI and ETI
represent two distinct layers of immunity which help plants to fight against pathogens.
1.1.1. Pattern triggered Immunity (PTI)
In the past three decades, various MAMPs and their cognate PRRs have been identified (Tang
et al., 2017). PRRs belong to either of two large protein families called receptor-like kinases
(RLKs) or receptor-like proteins (RLPs) (Couto and Zipfel, 2016). RLKs are composed of an
ectodomain responsible for specific ligand binding, a transmembrane domain, and an
intracellular kinase domain transducing the signal inside the cell (Ranf, 2017). The kinase
domain is absent in RLPs (Wang et al., 2008). PRRs can be further classified by the nature of
their extracellular ligand-binding domain which can consists of leucine-rich repeat domains
(LRR), lysin motifs (LysM), or lectin-like motifs (Ranf, 2017). These different ectodomain
structures mostly bind to specific ligand classes; peptides, carbohydrates, and lipids are often
recognized by LRR, LysM and lectin-containing PRRs, respectively (Couto and Zipfel, 2016).
The MAMPs recognized by PRRs are conserved structures that are often important for
the microbial fitness. The two best described MAMPs to date are the bacterial oligo-peptides
flg22 and elf18. Flg22 is derived from the bacterial flagellin, hence it is important for motility,
whereas elf18 originates from the bacterial elongation factor Tu, one of the most abundant
bacterial proteins with a major function in protein biosynthesis (Felix et al., 1999; Kunze et al.,
2004). Flg22 and elf18 are detected by the two corresponding LRR-type PRRs FLAGELLIN
SENSING 2 (FLS2) and EF-TU RECEPTOR (EFR), respectively (Gómez-Gómez and Boller,
2000; Kunze et al., 2004; Chinchilla, 2006; Zipfel et al., 2006). Other PTI-triggering structures
sensed by plants include peptidoglycans, forming bacterial cell walls and chitin, the main
component of fungal cell walls (Kaku et al., 2006; Gust et al., 2007). Both MAMPs are
perceived by LysM-PRRs. In A. thaliana, chitin is perceived by a heterodimer consisting of
CHITIN ELICITOR RECEPTOR KINASE 1 (CERK1) and LysM-CONTAINING
RECEPTOR KINASE 5 (Lyk5) (Cao et al., 2014). CERK1 is also associated with the two
redundant RLPs LysM DOMAIN-CONTAINING GPI-ANCHORED PROTEIN 1 (LYM1)
and LYM3, which sense peptidoglycan (PGN), although CERK1 itself does not directly bind
to PGN (Gimenez-Ibanez et al., 2009b; Willmann et al., 2011). Recently an S-lectin-domain
receptor called LIPOOLIGOSACCHARIDE-SPECIFIC REDUCED ELICITATION (LORE)
was found to contribute to immunity in Brassicaceae plants by sensing the lipid A moiety of
bacterial Lipopolysaccharides (LPS) (Ranf et al., 2015). The previously mentioned examples
described PRRs and MAMPs identified in A. thaliana, but several other PRR/MAMP pairs
1. Introduction
3
have been described for other plants species for example: an epitope from bacterial cold-shock
protein (csp22) sensed by the PRRs RECEPTOR-LIKE PROTEIN REQUIRED FOR CSP22
RESPONSIVENESS (NbCSPR) (Saur et al., 2016) and COLD SHOCK PROTEIN
RECEPTOR (CORE) in Nicotiana benthamiana and tomato (Wang et al., 2016), respectively;
a Xanthomonas oryzae protein called RaxX which is perceived by the rice PRR XA21 (Song et
al., 1995; Pruitt et al., 2015); or the fungal MAMP ethylene-inducing xylanase 1 (EIX1) which
is sensed by the tomato PRRs LeEix1 and LeEix2 (Ron and Adi, 2004; Bar et al., 2010). Taken
together, different PRRs can detect a broad spectrum of microbe-derived molecules.
In addition to MAMPs, some PRRs evolved to detect DAMPs. DAMPs are host-derived
molecules originating from presumably damaged plant cells or can be produced by plants after
pathogen recognition (Gust et al., 2017). For example, the two RLKs PEP 1 RECEPTOR 1
(PEPR1) and PEPR2 redundantly perceive a group of small peptides called AtPep1-AtPep6
produced by A. thaliana, to boost PTI (Yamaguchi et al., 2006; Huffaker et al., 2006; Huffaker
and Ryan, 2007; Yamaguchi et al., 2010).
PRRs often form sophisticated heteromeric receptor complexes, through interaction
with co-receptors or signal transducers. For example, BRI1-ASSOCIATED RECEPTOR
KINASE 1 (BAK1), as well as several related SOMATIC EMBRYOGENESIS RECEPTOR
KINASES (SERK) family members, interact with multiple PRRs including FLS2, EFR and
PEPR1, in a ligand-dependent manner and in case of FLS2, BAK1 acts as a co-receptor (Heese
et al., 2007; Chinchilla et al., 2007; Schulze et al., 2010; Roux et al., 2011). Moreover, many
known RLPs lacking an intracellular signalling domain interact with SUPPRESSOR OF BIR1-
1 (SOBIR1) to transduce the signal inside the cell (Zhang et al., 2013a; Liebrand et al., 2014;
Albert et al., 2015). Thus, MAMPs are perceived by receptor complexes rather than by single
PRRs.
After MAMPs are successfully sensed, multiple PTI responses are triggered in a
temporally coordinated manner (Yu et al., 2017). Within minutes after MAMP perception, Ca2+
influx, reactive oxygen species (ROS) burst, and mitogen-activated protein kinase (MAPK)
phosphorylation are triggered (Blume et al., 2000; Asai et al., 2002; Sagi et al., 2006;
Jeworutzki et al., 2010; Yu et al., 2017). These responses are often mediated and coordinated
by receptor-like cytoplasmic kinases (RLCKs) associating with PRR receptor complexes (Tang
et al., 2017). For example, BOTRYTIS-INDUCED KINASE 1 (BIK1) is a RLCK interacting
with multiple PRRs including FLS2, BAK1, EFR, PEPR1, and CERK1 (Tang et al., 2017) and
directly connects MAMP perception with the ROS burst by activating the plasma membrane-
resident NADPH oxidase RESPIRATORY BURST OXIDASE HOMOLOGUE PROTEIN D
1. Introduction
4
(RBOHD) after MAMP perception (Nühse et al., 2007; Li et al., 2014b; Kadota et al., 2014;
Tang et al., 2017).
These early responses are followed by intermediate responses including a massive
transcriptional reprogramming (Li et al., 2016) and increased accumulation of different
phytohormones. Multiple phytohormones such as ethylene, salicylic acid (SA), or jasmonate
(JA) modulate a complex downstream signalling network after MAMP perception (Tsuda et
al., 2008; Pieterse et al., 2012; Anver and Tsuda, 2015). This enables plants to integrate other
processes like growth, development, and abiotic stresses to optimize their responses (Vos et al.,
2013; Berens et al., 2017). Depending on the type of invading microbes, phytohormones
accumulate to different levels and synergistic as well as antagonistic interactions between them
enable plants to fine tune the appropriate defence responses (Pieterse et al., 2012; Berens et al.,
2017). For example, SA-mediated signalling is classically believed to be active against biotroph
or hemibiotroph pathogens whereas JA signalling is important to fight against necrotrophic
pathogens or insect pests (Glazebrook, 2005). Many studies reported an antagonistic crosstalk
between SA and JA responses (Van der Does et al., 2013; Robert-Seilaniantz et al., 2011), but
recent studies also demonstrated positive contributions of either pathway to the other (Liu et
al., 2016; Mine et al., 2017). For instance, we recently demonstrated a positive effect of JA on
SA signalling if PAD4, an important component for SA accumulation, is mutated (Mine et al.,
2017). Importantly, a positive effect of JA on SA is also observed when the PAD4 function is
disturbed by high temperatures reflecting a condition often faced by plants in nature. Thus,
positive interactions of otherwise antagonistically acting phytohormones in perturbed immune
networks illustrate an important mechanism to ensure robust signalling protected from
pathogens or environmental perturbations. Taken together, the SA-JA crosstalk exemplifies
how positive and negative interactions between phytohormone pathways can fine tune and
ensure robust PTI signalling, enabling the plant to integrate multiple information to mount the
appropriate defence responses.
The signalling cascades triggered by MAMPs finally lead to physiological responses
including stomatal closure, callose deposition, plant growth inhibition, and production of
secondary metabolites which function together to limit infections of non-adapted pathogens
(Yu et al., 2017). Although these responses help plants to fight against attackers, they are costly;
hence they need to be tightly controlled to prevent unnecessary resource loss (Belkhadir et al.,
2014; Lozano-Durán and Zipfel, 2015; Couto and Zipfel, 2016). Below, further detailed
mechanisms are described in the context of flg22 perception by FLS2 as an example.

1. Introduction
5
1.1.2. Flg22 perception, signalling and control via FLS2
Nearly 20 years ago, flg22 and its cognate receptor FLS2 were the first discovered
MAMP and PRR pair (Felix et al., 1999; Gómez-Gómez et al., 1999). Today this pair is still
under investigation and likely the best-described PRR/MAMP pair in plants. The flg22 epitope
of the bacterial flagellin can be sensed by many plant species including Brassicaceae species,
tomato, and rice (Gómez-Gómez et al., 1999; Dunning et al., 2007; Robatzek et al., 2007; Takai
et al., 2008). Interestingly, some pathogens managed to evade recognition by FLS2 through
sequence variation in their flagellin (Cai et al., 2011). Vice versa some plants are able to sense
additional flagellin epitopes, for example, tomato sensing flgII-28 by an additional receptor
named FLS3 (Clarke et al., 2013; Hind et al., 2016). These examples demonstrate that MAMP
recognition is influenced by the co-evolution of microbes and plants.
A. thaliana FLS2 is essential to sense flg22 (Gómez-Gómez and Boller, 2000), but the
effective perception of flg22 requires many more components. Upon flg22 binding, FLS2
associates with BAK1 and the crystal structure of this complex revealed that flg22 acts like a
molecular glue to stabilize the FLS2/BAK1 heterodimer (Chinchilla et al., 2007; Sun et al.,
2013). BAK1 serves as a co-receptor, consequently, bak1 mutants are impaired in flg22-
mediated responses and resistance to Pseudomonas syringae (Roux et al., 2011). Upon
heterodimerization, FLS2 and BAK1 rapidly phosphorylate each other (Schulze et al., 2010),
which is required for early flg22 responses (Schwessinger et al., 2011; Cao et al., 2013).
Besides BAK1, recent publications identified other plasma membrane-localized RLKs
interacting with FLS2 to regulate MAMP perception. The LRR-RLK IMPAIRED
OOMYCETE SUSCEPTIBILITY1 (IOS1) not only constitutively interacts with both FLS2 and
BAK1 but also positively regulates their complex formation upon MAMP perception (Yeh et
al., 2016). Furthermore, mutation in IOS1 decreased P. syringae resistance and impaired
multiple PTI responses including MAPK phosphorylation and callose deposition (Yeh et al.,
2016). The second recently identified interactor of FLS2, which is required for effective
immunity, is LORELEI-LIKE GPI-ANCHORED PROTEIN 1 (LLG1). LLG1 interacts with
both FLS2 and EFR and forms complexes with BAK1 in a ligand-dependent manner (Shen et
al., 2017). Interestingly, llg1 mutants compromise the flg22-induced ROS burst but do not
affect other PTI responses such as MAPK phosphorylation or defence marker gene expression.
LLG1 likely mediates ROS burst by regulating flg22-induced phosphorylation of BIK1 (Shen
et al., 2017). Moreover, LLG1 influences accumulation as well as ligand-dependent
degradation of FLS2. The third recently discovered interactor of FLS2 is the malectin-like
receptor kinase FERONIA (FER). FER seems to act as a scaffold to modulate receptor complex

1. Introduction
6
formation by weakly interacting with FLS2 and EFR and by facilitating their ligand induced-
complex formation with BAK1 (Stegmann et al., 2017). Interestingly, overexpression of the
FER ligand RAPID ALKALINIZATION FACTOR 23 (RALF23) reduced not only flg22-
induced BAK1/FLS2 but also elf18-induced BAK1/EFR complex formation, providing a
possible negative regulatory mechanism for PRR complex formation. Together these recent
publications demonstrate that the flg22 perception by FLS2 involves a multicomponent
receptor complex.
Despite aforementioned plasma-membrane localized interactors of FLS2, there are
several intracellular proteins interacting with the FLS2 receptor complex to mediate
downstream signalling. These are often RLCKs like BIK1, which is phosphorylated upon flg22
binding and thereby released from its constitutive interaction with FLS2 to phosphorylate
RBOHD, connecting flg22 perception with the ROS burst (Lu et al., 2010a; Zhang et al., 2010;
Kadota et al., 2014; Li et al., 2014b). BIK1 is the first example of a direct connection between
PRRs and downstream responses, and early PTI signalling converges on BIK1 as a multitude
of PRR complexes described until today interact with BIK1 including FLS2/BAK1, EFR,
PEPR1, CERK1 (Tang et al., 2017). The only other example of a direct connection between
PRRs and downstream signalling is PBS1-LIKE KINASE 27 (PBL27) which connects CERK1
with a downstream MAPK cascade (Shinya et al., 2014; Yamada et al., 2016). However, PBL27
does not interact with FLS2. Hence, the connection between FLS2 and the MAPK cascade
remains elusive. Two other RLCKs interacting with FLS2 and positively regulating PTI are
PTI-COMPROMISED RLCK 1 (PCRK1) and PCRK2 (Sreekanta et al., 2015; Kong et al.,
2016). pcrk1 prck2 double mutants exhibit reduced SA accumulation and increased
susceptibility against bacterial pathogens (Kong et al., 2016). However, mechanistic insights
concerning the connection of these RLCKs to downstream signalling are still obscure. BR-
SIGNALING KINASE 1 (BSK1) is another RLCK interacting with FLS2 (Shi et al., 2013).
BSK1 knock out mutants increase susceptibility to a variety of pathogens and similar to LLG1,
BSK1 is genetically required for ROS burst but not for flg22-induced MAPK phosphorylation
(Shi et al., 2013). Taken together, RLCKs are major components of PRR complexes and play
important roles in signal transduction from the plasma membrane to the cytoplasm after MAMP
perception.
FLS2 complex formation and signalling are tightly controlled in order to mount the
appropriate strength of defence and to save resources from unwanted immune elicitation
(Belkhadir et al., 2014; Lozano-Durán and Zipfel, 2015; Couto and Zipfel, 2016). Recently
several regulatory mechanisms affecting MAMP perception were discovered. Two redundant

1. Introduction
7
ubiquitin E3 ligases of the Plant U-box (PUB) family, PUB12, and PUB13, are phosphorylated
by BAK1 upon flg22 perception and subsequently ubiquitinate FLS2 for proteasomal
degradation (Lu et al., 2011). In contrast to PUB12/13, the alpha-subunit EXTRA- LARGE
GUANINE NUCLEOTIDE-BINDING PROTEIN 2 (XLG2) of a heteromeric G-proteins
complex formed by GUANINE NUCLEOTIDE-BINDING PROTEIN SUBUNIT-β (AGB1)
and GUANINE NUCLEOTIDE-BINDING PROTEIN SUBUNIT-γ1/2 (AGG1/2) interact with
FLS2 and BIK1 to prevent the proteasomal degradation of BIK1, thereby positively affecting
PTI (Liang et al., 2016).
Apart from proteasomal degradation, not only FLS2 but also EFR and PEPR1/2 undergo
BAK1-dependent endocytosis in a ligand-specific manner (Robatzek et al., 2006; Mbengue et
al., 2016). However, it is not yet clear whether this promotes or attenuates flg22 responses
(Khaled et al., 2015).
The phosphorylation status of the FLS2 receptor complex is an important signalling
component and consequently presents a major control mechanism of flg22 perception and
signalling. For instance, the A. thaliana Ser/Thr PHOSPHATASE TYPE 2A (PP2A) negatively
regulates flg22-triggered PTI by controlling BAK1 phosphorylation levels (Segonzac et al.,
2014). Similarly, the Ca2+-dependent protein kinase CPK28 attenuates flg22-activated immune
responses by controlling BIK1 turnover via phosphorylation in both the presence and absence
of flg22 (Monaghan et al., 2014). In contrast, the protein phosphatase PP2C38 negatively
regulates BIK1-mediated signalling by controlling the BIK1 phosphorylation status only in the
absence of flg22 (Couto et al., 2016). This likely prevents auto-activation of FLS2 signalling
in the basal state while allowing effective PTI signalling upon pathogen attack. These recent
publications describing the regulation of BIK1 by heteromeric G protein, CPK28, and PP2C38
indicate a key role of BIK1 in the regulation of FLS2-mediated immune signalling. Taken
together FLS2 activation is tightly controlled by multiple proteasomal degradation and
phosphorylation mechanisms to prevent PTI misfire.
Interestingly, many above described regulatory mechanisms are also targeted by
pathogens. For example, the P. syringae effector AvrPtoB has a dual mode of action acting as
a kinase inhibitor to inactivate BAK1 (Cheng et al., 2011) and encoding a ubiquitin E3 ligase
which promotes proteasome-mediated degradation of targeted PRRs including FLS2, EFR, and
CERK1 (Abramovitch et al., 2006; Göhre et al., 2008; Gimenez-Ibanez et al., 2009a). In
addition, it was recently reported that this effector also targets NPR1, a key signalling
component of SA and systemic acquired resistance, providing evidence that the same effector
can target a multitude of sequence-unrelated immune signalling components at the same time

1. Introduction
8
(Chen et al., 2017). In contrast to ubiquitination-mediated degradation, other effectors directly
cleave its target such as the AvrPphB effector targeting BIK1 (Zhang et al., 2010). Both BAK1
and BIK1 present PTI-hubs targeted by virulence effectors, exemplifying the previous finding
that hubs in immune networks are frequently targeted by pathogen effectors (Mukhtar et al.,
2011). These and many other effectors enable pathogens to circumvent PTI responses and
render the plant susceptible.
1.1.3. Transcriptional reprogramming during PTI
Transcriptional reprogramming is one of the hallmarks of PTI activation and thousands
of genes rapidly change their expression upon MAMP perception within an hour (Zipfel et al.,
2004, 2006; Denoux et al., 2008; Frei dit Frey et al., 2014; Lewis et al., 2015; Li et al., 2016).
Large parts of the transcriptional responses triggered by different MAMPs or DAMPs overlap
with each other. For example, expression changes in response to flg22 or elf-26 in A. thaliana
seedlings are highly similar to each other (Zipfel et al., 2006). Similar overlaps of differentially
expressed genes were observed in comparisons of flg22 with peptidoglycan (PGN)(Gust et al.,
2007), chitin (Wan et al., 2008) or oligogalacturonide (OG) (Denoux et al., 2008) treatments,
indicating a large overlap in transcriptional responses between different MAMPs and DAMPs.
Typical for this early MAMP responsive transcriptomes are overrepresentations of genes
connected to signal perception (many RLK), signal transduction (kinase-
activity/phosphorylation), posttranslational modification (ubiquitination), and transcriptional
regulation (WRKY transcription factors) (Denoux et al., 2008; Navarro et al., 2004; Frei dit
Frey et al., 2014).
Although most previous studies reported no obvious sets, Wan et al. detected some
MAMP specific expression changes. However, they compared transcriptome data from
different studies, potentially introducing experimental biases and distinguished MAMP-
specific DEGs only by Venn-diagrams, which were dependent on subjective significance cut-
offs and thus did not indicate qualitative expression similarity between different treatments. In
contrast, a recent study identified many genes with flg22-specific expression changes compared
to elf18-induced expression changes (Briggs et al., 2017). These results indicate that subsets of
genes could be MAMP-specific regulated at specific time points although the authors noted a
strong correlation between the flg22 and elf18 transcriptome responses.
In contrast to Briggs et al, all previously mentioned studies used microarray technology
and only a few recent studies used RNAseq to capture transcriptional responses upon MAMP
treatment. A recent study compared transcriptional responses induced by short trimer-OGs and

1. Introduction
9
longer OGs. Long OGs altered the expression of approximately 3500 genes 1 h after treatment,
whereas shorter OGs only regulated approximately 650 genes (Davidsson et al., 2017). Two
other recent studies also investigated flg22-triggered transcriptional responses and showed the
importance of a CAMTA TFs (Jacob et al., 2017) and the complex interactions between
different phytohormone signalling sectors on the regulation of flg22-triggered transcriptional
responses (Hillmer et al., 2017).
Transcriptional responses to MAMPs in other species than A. thaliana have not received
much attention yet. In tomato, flgII-28 treatment triggers a massive transcriptional
reprogramming altering expression of over 3500 genes (Rosli et al., 2013). nterestingly,
flagellin-derived MAMPs had the greatest impact on tomato gene expression since most of the
transcriptional responses induced by Pseudomonas syringae pv. tomato DC3000 (Pto DC3000)
was absent in a Pto DfliC mutant, lacking flagellin. To my knowledge, no other studies
investigated transcriptional responses after MAMP treatments in plants other than A. thaliana,
thus a comprehensive knowledge about the conservation of MAMP induced transcriptional
responses is lacking.
The transcriptional regulation after MAMP perception is partly connected to the rapid
Ca2+ signalling and MAPK cascades activated after MAMP perception (Boudsocq et al., 2010;
Frei dit Frey et al., 2014; Li et al., 2016). For example, individual mpk3, mpk4, and mpk6 knock
out mutants affect the expression of about 36% induced and 68% repressed flg22-responsive
genes, despite functional redundancy described for these MAPKs (Frei dit Frey et al., 2014).
Similarly to MAPKs, calcium dependent protein kinases (CPKs) are rapidly activated after
flg22 treatment and cpk5 cpk6 cpk11 triple mutants abolish transcriptional induction of several
flg22-responsive marker genes (Boudsocq et al., 2010). Thus, both MAPKs and CPKs have
important functions in PTI-activated transcriptional responses.
Co-expressed genes often share common cis-regulatory motifs within their 5’-
regulatory regions, connecting specific expression patterns with certain transcriptional
regulators. Different analysis for enriched sequence-motifs within regulatory regions of early
MAMP responsive genes consistently revealed an enrichment for WRKY transcription factor
(TF) binding sites (Navarro et al., 2004; Lewis et al., 2015; Jacob et al., 2017). This is in line
with the fact that expression of many WRKY TFs is upregulated by MAMP treatments
(Navarro et al., 2004; Gust et al., 2007; Wan et al., 2008; Birkenbihl et al., 2017). MPK3 and
MPK6 directly target WRKY33, a key TF regulating many downstream targets during
immunity, suggesting a direct link between MAPK dependent flg22-responsive transcriptional
changes and WRKY mediated transcriptional reprogramming during PTI (Mao et al., 2011; Liu
1. Introduction
10
et al., 2015; Tsuda and Somssich, 2015). Another recent publication identified a large subset of
early responsive PTI genes with overrepresented calmodulin-binding transcriptional activator
(CAMTA) motifs within their cis-regulatory regions (Jacob et al., 2017). Consequently, a
dominant negative camta3-D mutation altered flg22-triggered transcriptional responses. This
provides additional evidence for the importance of Ca2+ signalling during MAMP induced
transcriptional reprogramming.
Besides activation of specific TFs, the general transcriptional machinery itself is
modulated after MAMP perception. A recent study demonstrated targeted phosphorylation of
specific residues in the carboxyl-terminal domain of RNA polymerase II which positively
regulated immune gene induction (Li et al., 2014a). Moreover, multiple mediator subunits,
regulators of transcription interacting with RNA polymerase II, are involved in immune gene
regulation (Zhang et al., 2013b; Lai et al., 2014; Li et al., 2016). Although many studies
investigated the massive transcriptional reprogramming after MAMP perception, there is no
direct evidence that these transcriptional responses are required for an effective PTI. To solve
this question remains a challenging endeavour since transcriptional responses can hardly be
cancelled if they can be blocked at all.
1.1.4. Conservation and Evolution of PTI
Most immunity research has been performed with the model plant A. thaliana as well
as in crop species such as tomato and rice and comparative studies on the evolution of plant
immunity remain scarce. In a recent study addressing the conservation of ETI-mediating NLR
receptors, only 5 out of 528 tested NLR genes were conserved across five tested Brassicaceae
species (Peele et al., 2014), indicating strong variation in the NLR repertoire even within the
Brassicaceae family. In contrast, the perception of MAMPs by PRRs and some early signalling
events seem to be conserved in closely related species and some are conserved among land
plants (Zipfel et al., 2006; Lacombe et al., 2010). For example, the FLS2 receptor is highly
conserved in many plant species including rice, tomato or potato (Boller and Felix, 2009).
Despite its conservation, a recent study indicated that FLS2 orthologs from A. thaliana
accessions and Brassicaceae vary in their flg22 binding capacity (Vetter et al., 2012). Some
Brassicaceae FLS2 orthologs e.g. the C. hirsuta one did not bind flg22 in their assay. Thus, it
appears that sensitivity to specific MAMPs cannot necessarily be inferred from conservation of
their cognate PRR receptors. The perception of elf18 by EFR is restricted to the Brassicaceae
family, although several homologs of EFR with very similar architecture exist in rice or poplar,
suggesting that these might function in MAMP perception as well (Boller and Felix, 2009).
1. Introduction
11
Thus, even highly similar PRRs possibly sense different MAMPs. Interestingly, stable
expression of the A. thaliana EFR receptor in tomato confers elf18 sensitivity and increased
bacterial resistance to tomato, indicating some conservation of downstream signalling between
Brassicaceae and tomato after elf18 perception (Lacombe et al., 2010). Similarly, stable
expression of the A. thaliana RLP23 receptor in potato (Solanum tuberosum) confers sensitivity
to nlp20 and increased resistance to Phytophthora infestans (Albert et al., 2015). Furthermore,
swapping of kinase domains from A. thaliana EFR with the related rice PRR XA21 does not
affect their functions, providing evidence that downstream components directly interacting with
PRRs to transduce the signal are likely conserved, even between dicots and monocots (Holton
et al., 2015). This is coherent with the extraordinarily high conservation of the PTI signalling
hub BAK1 which even has a homolog in the moss Physcomitrella (Boller and Felix, 2009).
Taken together, PTI evolution was mainly addressed on the receptor levels and PRR swapping
experiments indicate some degree of conservation of immediate downstream signalling
components.
However, PTI responses can be affected by many other physiological processes such as
growth and especially by the environment including abiotic stresses (Pieterse et al., 2009; Vos
et al., 2013; Berens et al., 2017). Therefore, it is conceivable that different plants evolved
different PTI responses, which are adaptive to specific environments. For example, long-term
adaptation to specific abiotic stresses or specific pathogen pressures in a given environment can
act as a strong selective force leading to adaptive evolution of the immune system in different
plant species. Nevertheless, we actually don’t know to what extent PTI responses are conserved
in Brassicaceae or any other plant family. Moreover, it is unknown how PTI evolved within a
plant family such as Brassicaceae.
1.2. Comparative transcriptomics and evolution of gene expression
Evolution are the genetic changes over time within heritable traits that lead to the
adaptation of species to certain environments over multiple generations and ultimately
determines the species we face today on our planet. In eukaryotes, the major basis of genome
evolution is genetic variation within populations, which can arise from genetic changes such as
mutations or changes in the genepool of a population; that is changes in the number and
frequencies of alleles for a specific locus within the population.
Mutations can create new alleles whereas different mechanisms such as gene flow and
genetic drift change the frequencies of alleles within a population. The concept of natural
selection describes the forces that act on this genetic variation to create new phenotypes.
1. Introduction
12
Favourable traits arising from natural selection are also called adaptations. Selection of genetic
variation can be positive, selecting for beneficial traits, or purifying (sometimes called negative
selection), selecting against deleterious changes. In contrast to adaptive evolution mediated by
positive or purifying selection, some mutations result in alleles that do not affect fitness, called
selectively neutral alleles, leading to genetic variability within and between species described
as neutral evolution (Kimura, 1983). Over time natural selection can change or stabilize traits
within a population by directional or stabilizing selection. Stabilizing selection generally
reduces genetic variation within a population.
Molecular evolution studies the mechanisms of evolution on macromolecules. By
comparing genomic sequences between closely related species, the mechanisms of evolution
acting on DNA can be determined; hence neutral and adaptive evolution can be distinguished.
If a genomic sequence evolves neutrally, the number of mutations leading to synonymous
(without an effect on amino acid sequence) or non-synonymous (with amino acid changes)
should be approximately equal at a given protein-coding locus; hence their ratio is close to one.
A sequence under positive selection is expected to harbour more non-synonymous than
synonymous mutations, whereas in a sequence under purifying selection the rate of
synonymous exceeds the rate of non-synonymous mutations (Miyata and Yasunaga, 1980;
Yang and Bielawski, 2000; Delport et al., 2009). These analyses help to understand gene
functions as they can identify genomic regions important for the species adaptation, thereby
potentially connecting genetic variation with phenotypic variation.
For many organisms sharing almost identical genetic information, genetic differences
such as mutations in protein-coding genes cannot fully explain phenotypic variation (Haygood
et al., 2010; Harrison et al., 2012). It has been demonstrated that transcriptome variation can be
a key to understand phenotypic variation. The melanisation in Drosophila (Rebeiz et al., 2009)
and camouflage in beach mice (Manceau et al., 2011) are classical examples of phenotypes that
are the result of gene expression changes rather than protein structure changes. However, in
contrast to the latter examples, many complex or condition-dependent phenotypes are
influenced by a myriad of genes and can therefore not be explained by single quantitative trait
loci (QTLs) (Harrison et al., 2012). Here comparative transcriptomics provides great
advantages compared to comparative genomics to identify sets of genes controlling phenotypes
or influencing adaptation. Consequently, comparative transcriptomics have been applied to
many newly established model systems to gain new insights into the respective process under
investigation (Taji et al., 2004; Slotte et al., 2013; Gan et al., 2016). Furthermore, understanding
existing variation in gene expression is important since it may transfer into phenotypic variation
1. Introduction
13
allowing organisms to respond to novel stresses and adapt to a new environment (Alvarez et
al., 2015; Whitehead, 2012).
Already 15 years ago with the rise of the microarray technique, first comparative
transcriptomic studies were conducted. For example, human and closely related ape
transcriptomes were compared revealing species-specific expression patterns especially
pronounced in the brain, suggesting that cognitive differences between these species might be
connected to diversified gene expression in the brain (Enard et al., 2002). In plants, an early
comparative microarray study compared A. thaliana with its metal tolerant relative A. halleri
and found elevated expression of multiple genes associated with metal homeostasis in A. halleri
compared to A. thaliana (Weber et al., 2004).
Together with these first studies comparing transcriptomes from multiple species, a
theory of neutral evolution was proposed to explain gene expression variation. This hypothesis
expected that most expression variation between species arises from selectively neutral
evolution combined with genetic drift rather than from positive selection reflecting adaptive
evolution (Yanai et al., 2004; Khaitovich et al., 2004, 2005). Following this hypothesis,
expression variation should increase with phylogenetic distances between species. However,
this hypothesis is under debate and was criticized for several constraints in sampling as well as
quantifying and normalizing polymorphic genome sequences (Gilad et al., 2006). Moreover,
other studies in the animal field proposed that transcriptional regulation between species is
largely affected by natural selection and that large subsets of gene expression evolved under
stabilizing/purifying selection (Rifkin et al., 2003; Lemos et al., 2005; Whitehead and
Crawford, 2006; Romero et al., 2012). Regarding plants, Broadley and his colleagues found
evidence for a general neutral transcriptome evolution (Broadley et al., 2008). Thus, there is
evidence for and against a theory of neutral evolution of gene expression changes between
species.
In comparison to the existence of powerful evolutionary models to predict adaptive
footprints in DNA sequences (Yang, 2007; Delport et al., 2009), similar models describing gene
expression evolution are still premature (Harrison et al., 2012). Although a neutral evolutionary
model for gene expression evolution was already proposed over ten years ago, the nature of
comparative transcriptomic data makes it challenging to create an appropriate null hypothesis
for neutral evolution; yet there is no consensus on a null model allowing statistical tests for
adaptive signatures of expression changes (Brawand et al., 2011; Harrison et al., 2012).
However, since transcriptional variation arising from a neutral evolutionary process should
increase with phylogenetic distance between species, large transcriptional variation that is

1. Introduction
14
incongruent with phylogenetic relationships can be understood as a sign of adaptive evolution
(Whitehead, 2012). Thus, including multiple species with different phylogenetic relationships
is prerequisite for distinguishing neutral from adaptive variation (Whitehead, 2012).
One problem which complicates these analyses is to distinguish transcriptional variation
resulting from environmental differences from variation with a genetic basis (Romero et al.,
2012). This is especially a problem in the animal field when dead individuals which did not live
under controlled environmental conditions are sampled. Consequently, expression variation
may arise from different diets, disease status, or environmental influences which cannot be
controlled (Harrison et al., 2012; Romero et al., 2012; Voelckel et al., 2017). Here plant science
offers a great advantage as it is considerably easier to minimize variation in environmental
conditions between compared species.
Up to now multiple studies have compared transcriptomes of different plant species,
initially using heterologous microarray hybridisation technology. This technique was
successfully applied to compare A. thaliana with E. salsugineum transcriptomes suggesting
elevated gene expression of abiotic stress-related genes as a potential mechanism of salt stress
adaptation in E. salsugineum (Taji et al., 2004; Gong et al., 2005). ATH1 microarrays, designed
for the A. thaliana accession Col-0, were even used to compare the metal hyperaccumulator
Thlaspi caerulescens with the metal sensitive Thlaspi arvense species revealing candidate
genes involved in Zn hyper-accumulation (Hammond et al., 2006). Despite opening the world
for comparative transcriptomics, microarray-based studies have the disadvantage of using the
same probes for multiple strains or even species which can bias the measured expression levels
due to sequence or splice variation between species (Whittle et al., 2014; Buckley, 2007).
The development of more and more powerful sequencing and omics methods in
combination with decreasing prices facilitates multi species transcriptome comparisons
(Whitehead, 2012; Alvarez et al., 2015). Furthermore, RNAseq eliminates multiple drawbacks
like hybridisation biases immanent to microarray studies. Up to now a variety of studies
compared transcriptomes from multiple plant species with each other investigating
diversification of gene expression in C3 versus C4 photosynthesis (Brautigam et al., 2011),
Poaceae gene expression evolution (Davidson et al., 2012), tomato domestication (Koenig et
al., 2013) or transcriptome conservation among Lolium/Festuca species (Czaban et al., 2015).
Despite these and other studies, RNAseq is still under-utilized for comparative transcriptomic
studies in plants (Voelckel et al., 2017).
Several aspects of comparative transcriptomics have not received much attention up to
now. For example, most studies compared strains rather than different species with a defined
1. Introduction
15
phylogenetic framework. Even fewer studies not only compared inter-species but also included
intra-species expression variation alongside to gain insights into how transcriptional regulation
evolved within and between species. This is important because it can help to distinguish
evolutionary forces acting on expression changes. If expression is highly conserved within and
between species, it likely evolved under purifying selection, whereas conserved expression
within species and large expression variation between species point to adaptive evolution.
Neutral evolution can be indicated by expression variations within as well as between species
(Harrison et al., 2012; Romero et al., 2012). In addition, this comparison helps to assess how
short-term adaptation versus long-term adaptation to different environments affects gene
expression responses. Furthermore, recent studies concentrated predominantly on basal
expression changes between species. Consequently, we lack a comprehensive understanding of
transcriptome responses to environmental perturbations within and between related species and
how these responses might have evolved.
1.3. Brassicaceae as a model family for comparative genomics and
transcriptomics
As discussed in the previous section comparative genomics and transcriptomics are
powerful tools to study the evolution of complex traits by identifying common but also
diversified genes and their regulations, providing a basis for adaptation of species (Touchman,
2010). To compare genomic features and their regulation, orthologous relationships need to be
defined as an underlying framework for comparison (Emms and Kelly, 2015; Tekaia, 2016;
Nichio et al., 2017). Related species facilitate the identification of valuable orthologous
relationships. As indicated previously, including closely as well as more distantly related
species with rich genomic resources facilitates the discovery of evolutionary transitions in the
investigated processes and hold the potential to discriminate neutral from adaptive expression
variation (Evans, 2015; Whitehead, 2012). For these reasons, the Brassicaceae family provides
an excellent framework for comparative studies.
Brassicaceae, alternatively called mustards or Cruciferae based on their cross-like
flower architecture, is a diverse plant family harbouring over 3700 species, which can be found
throughout all temperate zones (Koenig and Weigel, 2015; Franzke et al., 2016). Different
publications date the origin of Brassicaceae between 30 to 100 million years ago but a generally
accepted hypothesis for a temporal framework of the family is still debated (Franzke et al.,
2016). Most recent publications estimated the Brassicaceae origin between 32 and 38 million
1. Introduction
16
years ago (Hohmann et al., 2015; Edger et al., 2015; Huang et al., 2016). Brassicaceae not only
include important crops such as cabbage (Brassica oleracea), canola (Brassica napus, Brassica
rapa), and mustard (Sinapis alba, Brassica nigra) but also the most prominent plant model A.
thaliana. Its superior genome annotation, a multitude of genomic tools, and a large mutant
collection for reverse genetic screens helped to reveal numerous concepts and mechanisms in
nearly every aspect of plant science (Somerville and Koornneef, 2002; Koornneef and Meinke,
2010; Koenig and Weigel, 2015). However, investigations of a single model species cannot
reflect the whole diversity of a plant family not to mention a genus (Koenig and Weigel, 2015).
Moreover, comparative analysis is required to understand evolutionary processes.
Consequently, many other A. thaliana-related Brassicaceae species were recently introduced as
model systems for a variety of traits ranging from development to stress responses.
Model species within the Brassicaceae include the selfing species Capsella rubella and
its outcrossing sister species Capsella grandiflora both used to investigate the transition from
outcrossing to selfing (Slotte et al., 2013). Cardamine hirsuta is another recently established
model species that is analysed for its developmental programs affecting the leaf shape and pot
shattering (Hay et al., 2014) and whose genome was recently sequenced (Gan et al., 2016).
Comparative genomics and transcriptomics with A. thaliana revealed important key genes
whose duplication, loss, changed transcriptional regulation, and neofunctionalisation led to the
complex leaf forms in C. hirsuta (Vlad et al., 2014). Besides developmental processes, abiotic
stress responses have been investigated using multiple salt and drought adapted Brassicaceae
species like Eutrema salsugineum (former Thellungiella halophila or Thellungiella salsuginea;
for more information on pervious names see Koch and German, 2013) or Schrenkiella parvula
(former Thellungiella parvula) to understand adaptation to extreme abiotic stress environments
(Inan et al., 2004; Gong et al., 2005; Dassanayake et al., 2011; Wu et al., 2012). Along with the
development of these model systems, genomes of new model species were sequenced in recent
years, facilitating comparative genomics and transcriptomics (Koenig and Weigel, 2015).
Taken together, rich genomic resources, many model species, and a clear phylogenetic
framework are key advantages of the Brassicaceae family to conduct comparative genomic and
transcriptomic studies.
1.4. Thesis aims
Numerous studies have investigated the molecular mechanisms of MAMP perception,
downstream signalling, and the MAMP-triggered defence responses that increase the pathogen
resistance in A. thaliana. Moreover, A. thaliana PRRs can be transformed to distantly related

1. Introduction
17
crops like tomato or rice to confer increased resistance. Although this indicates that crucial
components for MAMP perception identified in A. thaliana also function in distantly related
species, we still lack a comprehensive understanding to what extent downstream PTI responses
are conserved or diversified and how they evolved. Therefore, the general aim of my PhD thesis
was to use comparative approaches between A. thaliana and related Brassicaceae species to
address the evolution of PTI responses.
Although flg22 perception is generally conserved in angiosperm, recent studies indicate
major variation in flg22 binding and responses within A. thaliana accessions and among closely
related Brassicaceae species (Vetter et al., 2012, 2016). Therefore, the first aim of my thesis
was to establish a system to robustly trigger PTI in Brassicaceae species and compare typical
PTI responses among Brassicaceae species. I used comparative genomics to reveal sequence
conservation of important MAMP perception complexes and compared PTI responses
including MAPK phosphorylation, marker gene expression, phytohormone accumulation, and
seedling growth inhibition in different Brassicaceae species. In addition, I investigated the
effect of flg22 on resistance against the bacterial pathogen P. syringae.
Comparative transcriptomics were often utilized to reveal effects of environmental
perturbation on gene expression only within one species or to investigate gene expression
variation across species in a static environment (Whitehead, 2012). Thus, comparisons of gene
expression across species after environmental perturbation have not received much attention.
Several studies investigated transcriptional reprogramming after MAMP perception in A.
thaliana and tomato, but we still do not know how transcriptional reprogramming during PTI
is conserved in other species. Therefore, the second goal of my thesis was to generate a
comparative transcriptome dataset to compare dynamic transcriptome responses to flg22 among
multiple Brassicaceae species.
The importance of massive transcriptional reprogramming during PTI is obscure since
MAMP-induced transcriptional reprogramming cannot be specifically blocked. Moreover, it is
unknown to what extent other species evolved specific transcriptome responses during PTI.
Consequently, my third aim was to investigate the importance of flg22-triggered transcriptional
reprogramming during Brassicaceae evolution by determining the degree of conservation. At
the same time, I aimed at identifying diversified transcriptome responses to flg22 across
Brassicaceae and within A. thaliana. This allowed me to tackle my fourth aim: to create new
insights into the evolutionary mechanisms affecting PTI responses. On one hand, comparing
intra- with inter-species expression variation in response to flg22 indicated how long-term
compared to short-term evolution drives diversification of flg22-transcriptome responses. On

1. Introduction
18
the other hand, it facilitated to distinguish whether diversifications in the flg22-triggered
transcriptome response evolved under neutral or adaptive evolution.
In summary, this PhD thesis provides new insights into the gene expression evolution
during environmental perturbation by comparative transcriptomics within a species and
between species with a defined phylogenetic framework.
.

2. Results
19
2. Results
To understand the conservation and evolution of PTI responses, I employed
Brassicaceae species including A. thaliana (Ath), Arabidopsis lyrata (Aly), Capsella rubella
(Cru), Cardamine hirsuta (Chi), Eutrema salsugineum (Esa) and Aethionema arabicum (Aar).
These Brassicaceae species offer a defined phylogenetic framework that can be utilized for
comparative analyses; C. rubella represents a close A. thaliana relative, splitting about 9 Mio
years ago from A. thaliana, while the more distantly related E. salsugineum has been evolving
for about 26 Mio years independently from A. thaliana (Figure 2A). Importantly, compared for
instance to the distance between A. thaliana and tomato (approximately 118 Mio years) or rice
(approximately 160 Mio years), these are relatively close phylogenetic relationships. Together
with the rich genomic resources for these Brassicaceae species, this close relationship facilitates
comparative approaches (Koenig and Weigel, 2015). Therefore, the Brassicaceae family
provides an excellent platform to study conservation and diversification of PTI in an
evolutionary framework. A prerequisite for comparative genomics and transcriptomics is solid
orthologous relationships of genes between species. Therefore, I determined 1 to 1 orthologous
genes for each Brassicaceae using best reciprocal blast between A. thaliana and corresponding
Brassicaceae species, building the basis for my subsequent analysis.
2.1. MAMP perception and initial signalling components are
generally conserved among Brassicaceae species
To reveal the sequence conservation of different PRRs as well as interacting
components, I compared Brassicaceae amino acid sequences to their corresponding A. thaliana
sequences. I extracted genes coding for PRRs, co-receptors, and proteins directly interacting
with those receptors from the current literature and extracted corresponding ortholog sequences
from A. lyrata, C. rubella, C. grandiflora, C. hirsuta, Brassica rapa fastplant, Brassica rapa
chifu, and E. salsugineum. The function and mean sequence identity across all analysed
Brassicaceae species compared to A. thaliana is represented by a schematic overview (Figure
1A) and an additional heatmap indicates pairwise conservation of the proteins for each tested
Brassicaceae species compared to A. thaliana (Figure 1B). Overall, most PTI components
exhibited a high sequence identity to their A. thaliana orthologs and their sequence conservation

2. Results
20
was generally congruent with the Brassicaceae phylogeny (Figure 1A, B). The mean amino
acid sequence identities ranged from 68% to nearly 97%.
Figure 1: Conservation of MAMP perception components across Brassicaceae species. A: Schematic representation of known components in PRR complexes. The colour-code of the components indicates the mean amino acid-sequence conservation of A. lyrata, C. rubella, C. grandiflora, C. hirsuta, B. rapa fastplant, B. rapa chifu, and E. salsugineum compared with A. thaliana. B: Heatmap showing conservation of the individual proteins depicted in A in each Brassicaceae species compared to A. thaliana. Names of PRRs are highlighted in red. White colour in the heatmap indicates genes without a clear 1to1 ortholog match in the species compared to A. thaliana. For full names of genes included in this overview please refer to Table 5.
Interestingly, hierarchical clustering of pairwise amino acid sequence identities as well
as the mean sequence identities indicated a generally lower sequence conservation of MAMP
receptors compared to their co-receptors and interacting partners that connecting receptors and
downstream signalling (Figure 1 A, B). Especially RLPs, lacking an intracellular kinase
domain, exhibited a relatively low amino acid sequence identity compared to other proteins.
Thus, in particular PRRs which confer ligand specificity to MAMPs are more diversified than
intracellular signalling components. In line with this, most RLCKs including BIK1, BSK1,
PBL27, and PCRK1/2 are highly conserved with on average over 90% amino acid sequence
identity to A. thaliana orthologs across tested Brassicaceae. Especially, PBL27, which directly
connects chitin perception with a MAPK cascade, was extremely conserved with an average
2. Results
21
conservation of 97%. Although less conserved compared to other tested components PRRs were
still relatively well conserved between Brassicaceae. Altogether, many known MAMP
perception and PTI signalling components of A. thaliana are conserved in Brassicaceae species,
suggesting that tested Brassicaceae species likely respond to MAMPs identified with A.
thaliana. At the same time, the data suggests different selective pressures on sequence variation
of PRRs interacting with microbial ligands and intracellular signalling components connecting
MAMP perception to downstream responses.
2.2. Brassicaceae species respond to flg22 in a conserved manner
Flg22 perception is conserved in many plant species and its receptor, FLS2, is one of
the best studied PRRs to date (Boller and Felix, 2009). To ensure a robust activation of PTI in
the selected Brassicaceae species, I investigated whether flg22 treatment induces
phosphorylation of MPK3 and MPK6, reflecting an early signalling event during PTI (Asai et
al., 2002). Treatment of 12-day-old seedlings with 1 µM flg22 induced a rapid (15 min)
phosphorylation of MPK3 and MPK6 in all tested Brassicaceae species, which was absent in
the A. thaliana fls2 mutant, lacking the flg22 receptor (Figure 2B). To elucidate whether
transcriptional responses are triggered similarly, I analysed expression of a flg22-responsive
transcription factor WRKY29 (Asai et al., 2002), at early (1 h), intermediate (9 h), and late stages
(24 h) of the PTI response. At all time-points, flg22 treatment significantly induced WRKY29
expression in all tested Brassicaceae species except the fls2 mutant (Figure 2C). Thus, flg22 is
sensed to trigger typical PTI responses in all tested Brassicaceae.
Next, I tested whether flg22 treatment results in physiological alterations after initial
signalling events. A typical feature of PTI is the prioritization of defence over growth resulting
in a reduced growth rate (Gómez-Gómez et al., 1999; Huot et al., 2014). Indeed, growing
Brassicaceae seedlings for 12 days in flg22 solution significantly reduced fresh weights of each
species compared to corresponding control samples (Figure 2D). Yet, the flg22-triggered
growth reduction varied among Brassicaceae with a significantly lower impact on E.
salsugineum. This observation might be influenced by lower growth rates of E. salsugineum
compared to the other Brassicaceae, potentially lowering the capacity for flg22-mediated
growth reduction, or reflects a lower impact of flg22 on seedling growth in E. salsugineum.
Taken together these results reveal that all tested Brassicaceae seedlings robustly respond to
flg22 with certain differences. Therefore, treatment of Brassicaceae seedlings with flg22 is a
robust test system for a deeper analysis of PTI responses among the tested Brassicaceae species.
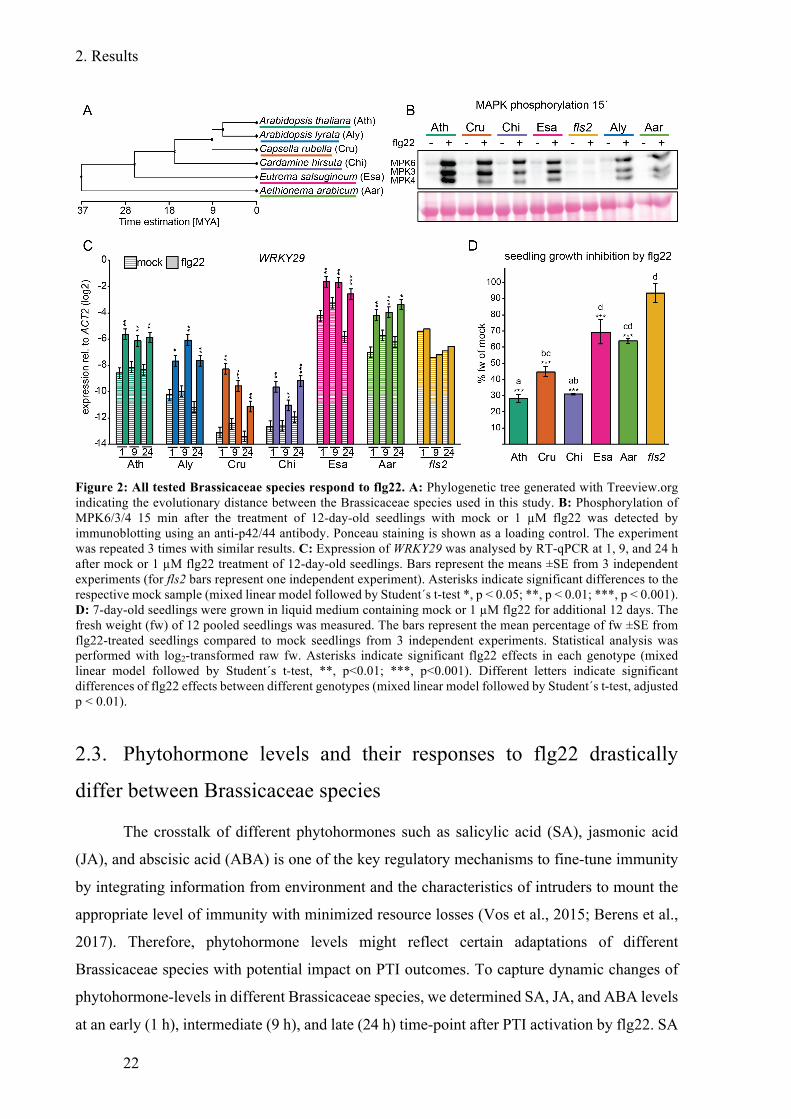
2. Results
22
Figure 2: All tested Brassicaceae species respond to flg22. A: Phylogenetic tree generated with Treeview.org indicating the evolutionary distance between the Brassicaceae species used in this study. B: Phosphorylation of MPK6/3/4 15 min after the treatment of 12-day-old seedlings with mock or 1 µM flg22 was detected by immunoblotting using an anti-p42/44 antibody. Ponceau staining is shown as a loading control. The experiment was repeated 3 times with similar results. C: Expression of WRKY29 was analysed by RT-qPCR at 1, 9, and 24 h after mock or 1 µM flg22 treatment of 12-day-old seedlings. Bars represent the means ±SE from 3 independent experiments (for fls2 bars represent one independent experiment). Asterisks indicate significant differences to the respective mock sample (mixed linear model followed by Student´s t-test *, p < 0.05; **, p < 0.01; ***, p < 0.001). D: 7-day-old seedlings were grown in liquid medium containing mock or 1 µM flg22 for additional 12 days. The fresh weight (fw) of 12 pooled seedlings was measured. The bars represent the mean percentage of fw ±SE from flg22-treated seedlings compared to mock seedlings from 3 independent experiments. Statistical analysis was performed with log2-transformed raw fw. Asterisks indicate significant flg22 effects in each genotype (mixed linear model followed by Student´s t-test, **, p<0.01; ***, p<0.001). Different letters indicate significant differences of flg22 effects between different genotypes (mixed linear model followed by Student´s t-test, adjusted p < 0.01).
2.3. Phytohormone levels and their responses to flg22 drastically
differ between Brassicaceae species
The crosstalk of different phytohormones such as salicylic acid (SA), jasmonic acid
(JA), and abscisic acid (ABA) is one of the key regulatory mechanisms to fine-tune immunity
by integrating information from environment and the characteristics of intruders to mount the
appropriate level of immunity with minimized resource losses (Vos et al., 2015; Berens et al.,
2017). Therefore, phytohormone levels might reflect certain adaptations of different
Brassicaceae species with potential impact on PTI outcomes. To capture dynamic changes of
phytohormone-levels in different Brassicaceae species, we determined SA, JA, and ABA levels
at an early (1 h), intermediate (9 h), and late (24 h) time-point after PTI activation by flg22. SA
2. Results
23
has a major influence on immunity and SA levels increase around 6 hours after flg22 treatment
of A. thaliana (Tsuda et al., 2008). In line with the previous literature, SA accumulation slightly
increased in A. thaliana 9 h after flg22 treatment and was significantly induced after 24 hpt
(Figure 3A). A similar trend was observed for C. hirsuta. However, in C. rubella, SA levels
were significantly increased 1 h after flg22 treatment, but slightly decreased after 9 and 24 h.
(Figure 3). This decreased trend of SA accumulation at 9 and 24 hpt was also observed in E.
salsugineum although SA levels were not affected 1 hpt (Figure 3A).
There was a general trend that flg22 treatment decreased ABA levels of all
Brassicaceae, except C. hirsuta, at all time-points, especially at 1 hpt (Figure 3B). Interestingly,
the basal ABA level of E. salsugineum was significantly elevated at the 9 and 24 hpt compared
to other Brassicaceae. This might be connected to its adaptation to saline environments (Inan
et al., 2004; Gong et al., 2005) and is consistent with the notion that its adaptation might be
mediated by enhanced ABA responses (Taji et al., 2004; Wu et al., 2012).
JA levels significantly increased in C. rubella and E. salsugineum 1 h after flg22
treatment but not later time-points (Figure 3C). In contrast, flg22 treatment did not alter JA-
levels in A. thaliana or C. hirsuta (Figure 3C). Strikingly, basal JA levels were more than a
100-fold higher in A. thaliana compared to other species. In summary, phytohormone levels
can greatly vary between Brassicaceae not only on a basal level, but also in their responsiveness
to flg22. Thus, different hormone levels may affect PTI responses in Brassicaceae species and
may reflect evolutionary adaptation to different environments.
2.4. Reduction of Pto growth by flg22 varies between species
Although flg22 elicited typical PTI responses in all tested Brassicaceae species, the
variable effect on seedling growth-inhibition and phytohormone levels queries whether flg22
treatment can effectively protect different Brassicaceae species against bacterial infection. In
A. thaliana, flg22-triggered PTI significantly reduces growth of the bacterial pathogen
Pseudomonas syringae pv. tomato DC3000 (Pto DC3000) (Tsuda et al., 2009). Therefore, I
tested whether flg22-pretreatment similarly reduces Pto DC3000 growth in other Brassicaceae
species. Flg22-pretreatment of 5-week-old plants greatly reduced Pto DC3000 titres in
A. thaliana, A. lyrata, C. rubella, and A. arabicum compared to mock treated samples (Figure
4A). In contrast, Pto DC3000 titres were only slightly reduced in C. hirsuta and not altered in
E. salsugineum and A. thaliana fls2 mutants. Thus, the robust induction of early PTI responses
by flg22 observed in all tested Brassicaceae (Figure 2B, C, D) does not necessarily lead to
inhibition of Pto DC3000 growth.

2. Results
24
Figure 3: Distinct accumulation and flg22-responsiveness of phytohormone in Brassicaceae species. Phytohormone levels of 12-day-old seedlings were determined via HPLC-MS at the indicated time-points after mock or 1 µM flg22 treatment. A: Free salicylic acid (SA) B: Abscisic acid (ABA) C: Jasmonic acid (JA). Bars represent the means ±SE from 3 independent experiments. A and B Asterisks indicate significant difference to mock (mixed linear model followed by Student´s t-test; *, p<0.05). C The data violated the assumptions to apply a mixed linear model. Therefore, the data was analysed by pairwise Student t-test (flg22 compared to mock treated samples; *, p<0.05).
In mock conditions, Pto DC3000 titres were significantly lower in E. salsugineum
compared to other species (Figure 4A). This suggests an incompatible interaction between Pto
DC3000 and E. salsugineum possibly mediated by effector recognition in E. salsugineum,
leading to ETI activation. Alternatively, Pto DC3000 effectors might be less adapted to E.

2. Results
25
salsugineum targets causing reduced virulence. In any case, this incompatibility might have
masked the flg22 effect on Pto DC3000 growth in E. salsugineum. To test this hypothesis, I
conducted a second experiment using a type-3-secretion system (T3SS) deficient Pto hrcC
mutant. In mock samples, Pto hrcC grew to a similar level in A. thaliana and E. salsugineum,
whereas flg22-pretreatment reduced bacterial titres in A. thaliana but not in E. salsugineum
(Figure 4B). Similar to the Pto DC3000 assays, flg22-pretreatment of C. hirsuta did not affect
Pto hrcC titres. Interestingly, Pto hrcC did not grow in C. rubella, both in mock and flg22
treated leaves. Together these results indicate that flg22-triggered PTI responses in E.
salsugineum were insufficient to lower Pto DC3000 or hrcC titres and that flg22-induced PTI
in C. hirsuta only marginally affected Pto DC3000 growth, which was not confounded by
variation in the effector recognition of these two species.
Figure 4: flg22-triggered bacterial growth inhibition in Brassicaceae species. 5-week-old Brassicaceae plants were syringe-infiltrated with 1 µM flg22 or mock 24 h prior to infiltration with Pto DC3000 (OD600 = 0.0002) (A) or Pto hrcC (OD600 = 0.001) (B). A: The bacterial titer was determined 48 hours after bacterial infiltration by measuring the DNA amount of the Pseudomonas syringae specific OprF gene relative to the plant ACT2 gene by qPCR. Bars represent the means ±SE from 3 independent experiments with each 3 biological replicates (n = 9). B: Bacterial titre was determined 0 and 48 hours after bacterial infiltration by serial dilution and counting colony forming unit on plates. Bars represent the means ±SE from 2 independent experiments with each 12 replicates (n = 24). Different letters indicate statistically significant differences (mixed linear model followed by Student´s t-test; adjusted p < 0.01).
2.5. Flg22 triggers a massive transcriptional reprogramming in tested
Brassicaceae
Phenotypic variation between species is often achieved by diversification of
transcriptional regulation and flg22 is known to activate massive transcriptional reprogramming
in A. thaliana (Navarro et al., 2004; Zipfel et al., 2004; Briggs et al., 2017). However, the
evolutionary conservation of flg22-triggered transcriptional responses is not understood. In
addition, the importance of the massive PTI-induced transcriptional reprogramming remains
obscure because specifically blocking the entire transcriptional reprogramming is challenging
if not unfeasible. Alternatively, the importance of a biological process can be inferred by its

2. Results
26
evolutionary conservation. Therefore, if flg22-triggered transcriptional reprogramming is
conserved, evolutionary theory predicts that it is important.
To investigate temporal dynamics of transcriptional responses, I captured early (1 h),
intermediate (9 h), and late (24 h) transcriptome responses of Brassicaceae seedlings to flg22
using RNA-seq (Figure 5A). Mapping the RNA-seq reads to individual Brassicaceae genomes
resulted in high mapping efficiencies (Supplement Table 1). To further check the quality of the
data, I performed a principle component analysis (PCA) with normalized gene expression
values. In all species, except A. lyrata, mock and flg22-treated samples were clearly separated
and independent replicates were clustered together, indicating the high quality of the dataset
(Supplement Figure 1). I removed A. lyrata transcriptome data from further analysis, due to its
poor reproducibility among biological replicates (Supplement Figure 1F).
For each species and time-point, I determined differentially expressed genes (DEGs)
with a q-value < 0.01 and a minimum fold-change of 2 in response to flg22. Flg22 treatment
triggered a massive transcriptional reprogramming in each species, significantly changing the
expression of 4964 (Ath), 4398 (Cru), 4038 (Chi) and 2861 (Esa) DEGs, suggesting the
importance of flg22-triggered transcriptional responses for Brassicaceae plants (Figure 5B).
The number of upregulated genes at 1 h was similar among species (2000 to 3000), whereas
numbers of downregulated genes varied more drastically; C. rubella downregulated
approximately three times more genes than E. salsugineum. Further, the number of DEGs at
later time-points was different: A. thaliana and C. rubella showed expression changes of about
2000 genes at 24 h, whereas in C. hirsuta and E. salsugineum, only 300 to 500 genes were
affected 24 h after flg22 treatment (Figure 5B).
To compare expression changes between Brassicaceae species, I used a set of 17,857
orthologous genes showing a clear 1 to 1 relationship between A. thaliana and each of the three
Brassicaceae. From a total of 6106 DEGs, 868 DEGs (14.2 %) were shared among all four
Brassicaceae species (Figure 5C). The number of shared DEGs was the highest at 1 hpt,
suggesting that late transcriptome responses diverged among Brassicaceae compared to early
ones (Supplement Figure 2). This was consistent with the variable number of DEGs at later
time-points (Figure 5B) and the stronger conservation of early flg22 responses like MAPK
phosphorylation compared to more variable late responses such as seedling growth inhibition
or Pto growth reduction (Figure 2). Approximately one third of flg22-induced transcriptional
changes (34.6% with Cru, 35.9% with Chi and 31.3% with Esa) were shared between A.
thaliana and each of the other species (Figure 5D).
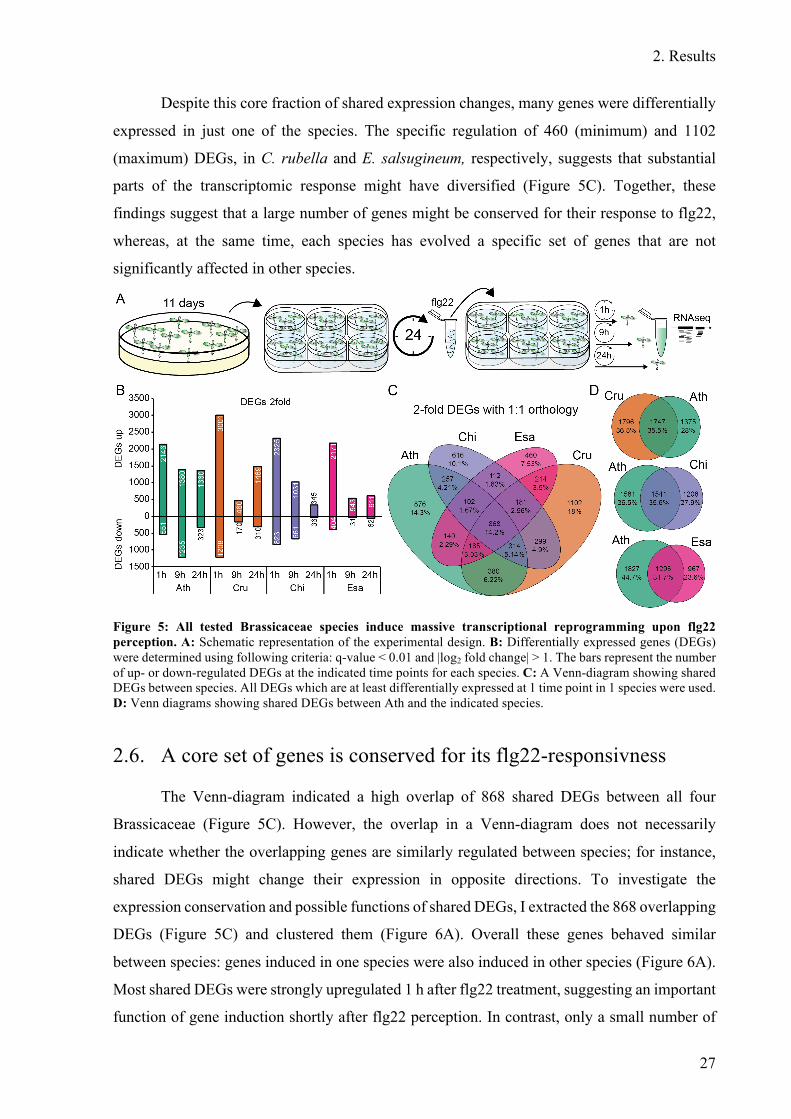
2. Results
27
Despite this core fraction of shared expression changes, many genes were differentially
expressed in just one of the species. The specific regulation of 460 (minimum) and 1102
(maximum) DEGs, in C. rubella and E. salsugineum, respectively, suggests that substantial
parts of the transcriptomic response might have diversified (Figure 5C). Together, these
findings suggest that a large number of genes might be conserved for their response to flg22,
whereas, at the same time, each species has evolved a specific set of genes that are not
significantly affected in other species.
Figure 5: All tested Brassicaceae species induce massive transcriptional reprogramming upon flg22 perception. A: Schematic representation of the experimental design. B: Differentially expressed genes (DEGs) were determined using following criteria: q-value < 0.01 and |log2 fold change| > 1. The bars represent the number of up- or down-regulated DEGs at the indicated time points for each species. C: A Venn-diagram showing shared DEGs between species. All DEGs which are at least differentially expressed at 1 time point in 1 species were used. D: Venn diagrams showing shared DEGs between Ath and the indicated species.
2.6. A core set of genes is conserved for its flg22-responsivness
The Venn-diagram indicated a high overlap of 868 shared DEGs between all four
Brassicaceae (Figure 5C). However, the overlap in a Venn-diagram does not necessarily
indicate whether the overlapping genes are similarly regulated between species; for instance,
shared DEGs might change their expression in opposite directions. To investigate the
expression conservation and possible functions of shared DEGs, I extracted the 868 overlapping
DEGs (Figure 5C) and clustered them (Figure 6A). Overall these genes behaved similar
between species: genes induced in one species were also induced in other species (Figure 6A).
Most shared DEGs were strongly upregulated 1 h after flg22 treatment, suggesting an important
function of gene induction shortly after flg22 perception. In contrast, only a small number of

2. Results
28
DEGs were commonly downregulated, indicating a minor role of transcript reduction during
PTI.
To get additional insights into possible functions of shared DEGs, I visualized their
expression in A. thaliana under a variety of stresses using publicly available datasets from
Genevestigator. The shared DEGs were similarly expressed in MAMP (flg22, elf18, and OGs)
or DAMP (Pep2) treated A. thaliana plants, suggesting that the conserved flg22-responsive
genes in Brassicaceae are involved in various MAMP or DAMPs responses (Figure 6A, right
heatmap). Likewise, many genes were induced after pathogen attack by Pto DC3000 or Botrytis
cinerea and, to a lesser extent, by SA treatment. In contrast, expression of these genes was
barely affected by ABA or MeJA treatment or abiotic stresses, including drought, hypoxia or
heat.
Figure 6: Conserved flg22-responsive genes are associated with immune responses. A: Heatmap of 868 DEGs shared among all tested Brassicaceae species (see Figure 5C). The right heatmap displays expression changes of the 868 DEGs under the indicated stress conditions in publicly available A. thaliana datasets (Genevestigator). B: The most enriched GO terms of 868 genes grouped using ClueGO Cytoscape plugin. The circle sizes represent significance levels. C: Arbitrary selected genes known to be associated with plant immunity. D: Heatmap of top 25 induced genes after flg22 treatment based on the mean induction over all samples. Red indicates DEGs that previously have not been implicated in immune responses.
In line with the highly similar expression changes induced by MAMPs, DAMPs and
pathogen treatments in publicly available datasets, many highly enriched GO terms within
shared DEGs were associated to immune responses or signalling mechanisms, including
“defense response to bacterium”, “defense response by callose deposition”, “response to chitin”
and “protein phosphorylation” (Figure 6B). Moreover, genes connected to SA, JA, and ethylene
responses were significantly enriched. Consistently, many well-known genes responsible for
key processes during immunity including MAMP perception (CERK1, BAK1, BIK1, SOBIR1),

2. Results
29
ROS burst (RBOHD), signal transduction (MKK4, MPK3), SA accumulation and responses
(CBP60G, NPR1, NPR3), and transcriptional reprogramming (WRKY13/33/40/62, ERF6/104,
MYB51/122) are among these conserved flg22-responsive genes (Figure 6C). These results
indicate that the shared DEGs represent a core set of evolutionary conserved PTI components
within Brassicaceae.
Despite the large number of known immunity genes among flg22-responsive conserved
genes, many shared DEGs among Brassicaceae had no annotation or were not previously
described in relation to immunity. For example, half of the top 25 common upregulated genes
were previously not connected to immunity (Figure 6D, red boxes), suggesting that a substantial
number of genes likely playing roles in plant immunity have yet to be characterized.
2.7. Transcriptomic responses to flg22 differ in their temporal
dynamics between species
In contrast to the similar number of genes affected 1 h after flg22 treatment in all
Brassicaceae species, there was a substantial diversification at later time points. The total
number of DEGs substantially drops at 9 hpt in all Brassicaceae except A. thaliana (Figure 7A).
In C. rubella, the sharp drop at 9 hpt is followed by an increase in the number of DEGs, whereas
the number of DEGs in E. salsugineum remained around 500 DEGs at 24 hpt. Similar, to E.
salsugineum, few C. hirsuta genes responded to flg22 at 24 hpt. Thus, C. hirsuta and
E. salsugineum showed a rather transient transcriptional response, in contrast to a sustained
response in A. thaliana and C. rubella. Strikingly, the latter observation was correlated with the
higher efficacy of flg22 treatment to reduce Pto DC3000 growth in A. thaliana and C. rubella
(Figure 4). Notably the total number of expressed genes was very similar among all four species
and thus does not explain variation in expression dynamics between species (Figure 7B).
Likewise to the lower number of DEGs in C. hirsuta and E. salsugineum, the induction
level of many shared DEGs was also lower at later time points (Figure 6A). To understand the
species-specific kinetics of gene expression, I extracted genes initially induced in A. thaliana
and E. salsugineum (log2 induction > 0.6), with sustained induction in A. thaliana (log2
induction > 0.6), but transient induction in E. salsugineum (log2 induction < 0.5), resulting in
187 genes (Figure 7C). To reveal possible functions of this gene set, I determined
overrepresented GO-terms and found an enrichment for SA-responsive genes (Figure 7D). In
line with this, nearly all of these genes are responsive to SA treatment in A. thaliana according
to publicly available data (Figure 7E). This encouraged me to further extract known immune
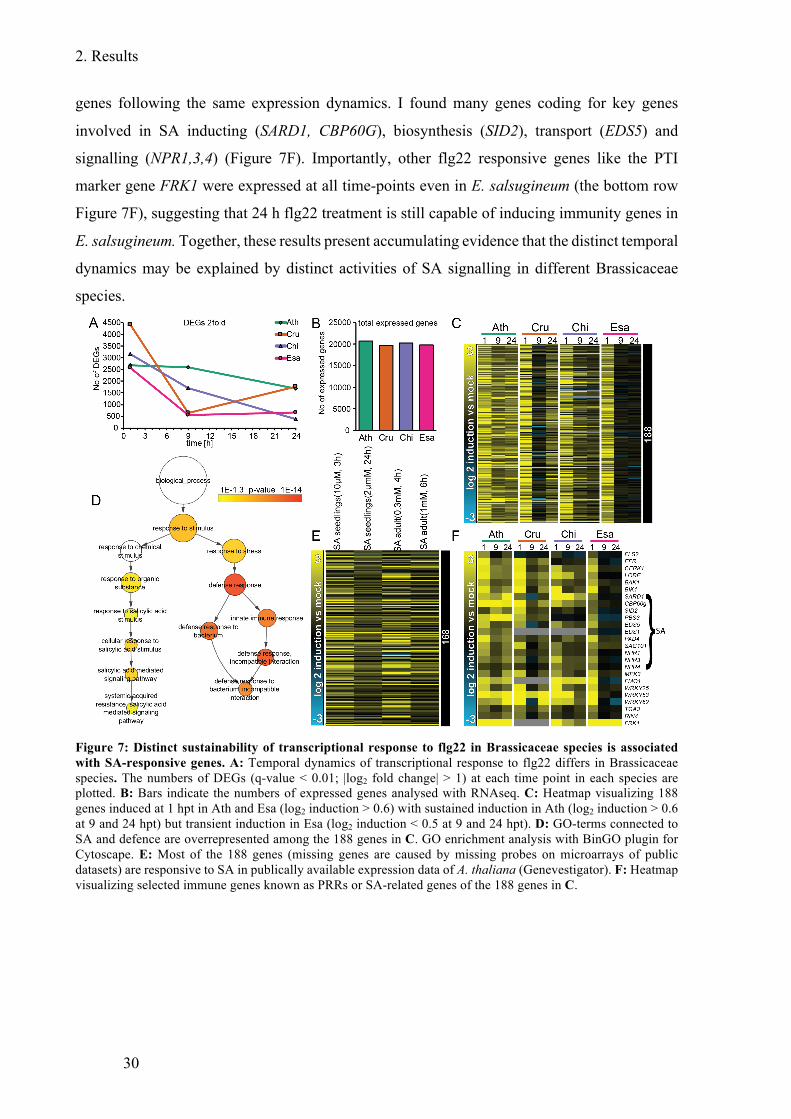
2. Results
30
genes following the same expression dynamics. I found many genes coding for key genes
involved in SA inducting (SARD1, CBP60G), biosynthesis (SID2), transport (EDS5) and
signalling (NPR1,3,4) (Figure 7F). Importantly, other flg22 responsive genes like the PTI
marker gene FRK1 were expressed at all time-points even in E. salsugineum (the bottom row
Figure 7F), suggesting that 24 h flg22 treatment is still capable of inducing immunity genes in
E. salsugineum. Together, these results present accumulating evidence that the distinct temporal
dynamics may be explained by distinct activities of SA signalling in different Brassicaceae
species.
Figure 7: Distinct sustainability of transcriptional response to flg22 in Brassicaceae species is associated with SA-responsive genes. A: Temporal dynamics of transcriptional response to flg22 differs in Brassicaceae species. The numbers of DEGs (q-value < 0.01; |log2 fold change| > 1) at each time point in each species are plotted. B: Bars indicate the numbers of expressed genes analysed with RNAseq. C: Heatmap visualizing 188 genes induced at 1 hpt in Ath and Esa (log2 induction > 0.6) with sustained induction in Ath (log2 induction > 0.6 at 9 and 24 hpt) but transient induction in Esa (log2 induction < 0.5 at 9 and 24 hpt). D: GO-terms connected to SA and defence are overrepresented among the 188 genes in C. GO enrichment analysis with BinGO plugin for Cytoscape. E: Most of the 188 genes (missing genes are caused by missing probes on microarrays of public datasets) are responsive to SA in publically available expression data of A. thaliana (Genevestigator). F: Heatmap visualizing selected immune genes known as PRRs or SA-related genes of the 188 genes in C.
2. Results
31
2.8. SA levels do not explain distinct temporal transcriptome
dynamics
The significant induction of SA levels at 24 hpt in A. thaliana which was absent in
E. salsugineum, is in line with the hypothesis that different temporal transcriptome dynamics
may be connected to SA signalling (Figure 3A). However, the missing induction in C. rubella
at 24 hpt, together with a slight SA induction in C. hirsuta, suggests that SA accumulation at
24 h after flg22 treatment does not fully explain dynamic transcription patterns in these two
species (Figure 3A). To further test the hypothesis that SA signalling dictates distinct temporal
transcriptional dynamics, I selected three maker genes (SARD1, CBP60G, and PBS3) exhibiting
sustained induction in A. thaliana but transient induction in E. salsugineum and tested their
expression in the sid2 mutant of A. thaliana, which lacks the SA-biosynthesis enzyme
(isochorismate synthase 1) responsible for immunity induced SA-biosynthesis (Wildermuth et
al., 2001). In line with our RNA-seq results, expression of SARD1, CBP60G and PBS3 was
induced at 9 and 24 h after flg22 treatment of wild-type A. thaliana and was absent in the fls2
mutant (Figure 8A, B, C). All three genes were similarly induced in the sid2 mutant at 9 and 24
hpt, suggesting that SID2-mediated SA accumulation is dispensable for the sustained induction
of these genes by flg22.
In addition, I checked the induction of 185 out of 187 extracted genes in Figure 7C, in
a previously published RNAseq dataset which quantified flg22-responsive expression in the
sid2 mutant at different time-points (Hillmer et al., 2017). In agreement with the previous RT-
qPCR results, flg22 induced most of the genes shown in Figure 7C in the sid2 mutant after 9 or
18 hpt (Figure 8D). Nevertheless, the induction level in the sid2 mutant was slightly lower at 9
and 18 h after flg22 treatment compared to wildtype; hence, I cannot exclude a minor role of
SA in later transcriptional responses. However, despite the clear link between SA responsive
genes and observed transcriptional patterns, these results indicate that the sustained
transcriptional response in A. thaliana cannot be fully explained by SA accumulation. In line
with these results, flg22 treatment efficiently reduced Pto DC3000 growth in the sid2 mutant
of A. thaliana, but not in the wildtype of C. hirsuta and E. salsugineum (Figure 4A).

2. Results
32
Figure 8: SID2-mediated SA production is not required for sustained flg22-triggered transcriptional response in A. thaliana. 12-day-old seedlings of A. thaliana wt (Ath), fls2, and sid2 were treated with mock or 1µM flg22 for 1, 9, or 24 h. Expression of three marker-genes extracted from the heatmap in Figure 6C namely SARD1 A, PBS3 B, and CBP60g C was quantified via RT-qPCR. Bars represent the means ±SD from 2 independent experiments. D: 185 genes showing transient induction in Esa (Figure 7C) were analysed for their expression induction in 31 to 32 day-old Col-0 and sid2 leaves at the indicated time points compared to 0 h after 1 µM flg22 treatment (Hillmer et al., 2017).
2.9. Analysis of Brassicaceae accessions and sister species revealed
no correlation between sustained gene activation and the flg22 capacity
to reduce Pto growth
Sustained transcriptional induction of flg22-responsive genes correlated well with a
significant growth reduction of Pto DC3000 in flg22-preatreated A. thaliana and C. rubella
plants. In contrast, flg22 had a weak or no effect on Pto DC3000 growth in C. hirsuta and E.
salsugineum which exhibited transient gene induction after flg22 (Figure 4). Interestingly, a
previous study uncovered a mutant with intact early elf18-induced PTI responses but transient
immune-gene expression which was more susceptible to Pto DC3000 compared to the wildtype,
suggesting that early responses were insufficient, whereas late responses might be crucial for
plant-bacterial interaction (Lu et al., 2009). To clarify whether these observations resulted from
coincidence or whether sustained transcriptional responses are correlated to effective flg22-
triggered immunity to Pto DC3000, I performed bacterial growth assays in combination with

2. Results
33
marker gene expression analysis in a set of available Brassicaceae accessions and sister species
of tested Brassicaceae. I included Capsella grandiflora, two additional C. hirsuta accessions
OLI and GR2 (Chi_OLI; Chi_GR2), another E. salsugineum accession YT (Esa_YT), a sister
species of E. salsugineum Thellungiella halophyla (Tha) and Schrenkiella parvula (Spa)
another Brassicaceae closely related to E. salsugineum. Flg22 pre-treatment significantly
reduced Pto DC3000 titres only in A. thaliana, C. hirsuta GR2, and Thellungiella halophyla
(Supplement Figure 3A). However, marker gene expression at 24 hpt was only induced in A.
thaliana and S. parvula, but not in C. hirsuta GR2 or Thellungiella halophyla (Supplement
Figure 1 B, C, D). Consequently, effective flg22-induced growth reduction of Pto DC3000 and
sustained marker gene expression were not correlated, suggesting that sustained flg22-induced
transcriptome responses are insufficient and unnecessary for effective flg22-induced resistance.
2.10. Early flg22 transcriptomic responses diversified qualitatively
between Brassicaceae
A substantial number of DEGs was differentially expressed only in one of the species
(Figure 5C). To determine whether the large number of species-specific DEGs is the
consequence of the stringent cut-off criteria applied or reflects qualitative differences in flg22
responses among these species, I clustered and visualized expression changes of all 6106 DEGs
(Supplement Figure 4). Most DEGs showed qualitatively similar expression changes between
species, particularly for early induced genes, indicating that a large proportion of species-
specific DEGs resulted from quantitative differences. This also suggests that many early flg22-
triggered expression changes evolved under purifying selection, pointing to their importance
for PTI.
However, I also found that four out of 15 clusters exhibited species-specific expression
signatures (Figure 9A). These four clusters contained 1086 genes, representing about 18% of
all DEGs (Figure 9A). To understand their potential functions, I investigated publicly available
expression data and analysed GO term overrepresentation in these clusters. Publicly available
gene expression data of A. thaliana in a variety of conditions did not infer specific functions
associated with these species-specific genes (Figure 9B). Analysis of enriched GO terms among
species-specific expression patterns revealed a weak but significant enrichment of
“phenylpropanoid metablic process” and “lignin metabolic process” in the A. thaliana specific
pattern and “coumarin metabolic process” in the C. hirsuta specific pattern, indicating an
enrichment of genes associated with secondary metabolites, which are known to be involved in

2. Results
34
plant-microbe interactions (Piasecka et al., 2015) (Figure 9C, D). The distinct expression
changes of these genes might affect the production of certain secondary metabolites. I found no
enriched GO term for C. rubella and E. salsugineum specific expression signatures. This may
be due to the fact that GO-term annotations strongly depend on A. thaliana research and other
Brassicaceae species have previously barely been studied in the context of plant immunity.
Hence, poorer GO-term annotation of species-specific flg22-responsive genes might impede
GO-term analysis of these expression clusters. In summary, large parts of the flg22
transcriptional responses are conserved, but some expression changes diversified during the
Brassicaceae evolution, which may be associated to potential adaptations of PTI in different
Brassicaceae species.
Figure 9: A large fraction of DEGs exhibited species specific expression signatures. A: All 6025 DEGs were clustered by k-means and 4 clusters exhibiting species-specific expression signatures are shown (see also supplemental Figure 3). Colored bars with the number of genes indicate Ath (green), Cru (orange), Chi (purple) and Esa (magenta) specific flg22-responsive genes. B: The heatmap displays expression changes of genes within species-specific clusters under indicated stress conditions in publicly available A. thaliana datasets (Geneinvestigator). C and D: Significantly enriched GO terms for Ath specific (C) and Chi specific (D) clusters determined with BinGO plugin of Cytoscape. For Cru and Esa specific clusters no significantly enriched GO-terms could be determined.
2.11. Flg22 transcriptome responses are highly conserved between
genetically and geographically distinct A. thaliana accessions
To understand expression evolution and distinguish neutral from adaptive evolutionary
processes, it is important to also analyse within species variation of gene expression (Harrison
et al., 2012; Romero et al., 2012). Expression under purifying selection is similar within and
between species, whereas selectively neutral expression changes are predicted to show a high
variation both within and between species. In contrast, evolutionary adaptive expression

2. Results
35
changes should vary specifically between species but not within species (Harrison et al., 2012;
Romero et al., 2012). Moreover, regarding the large impact of environmental variation on
immunity, it is unclear whether inter-species transcriptome variation needs long-term evolution
over several Mio years associated with species diversification or whether short-term evolution
within a species can lead to similar degree of variation. To disentangle these possibilities, I
analysed flg22-induced transcriptome responses in a set of genetically and geographically
diverse A. thaliana accessions.
First, I tested the responsiveness of 24 A. thaliana accessions to flg22 using a MAPK
phosphorylation assay. Flg22 treatment induced MAPK phosphorylation in all accessions
except CVI-0, which lacks a functional FLS2 receptor (Dunning et al., 2007), and therefore
serves as a natural negative control (Figure 10A). To avoid underestimation of diversity in flg22
responses within A. thaliana, I further picked 12 accessions that belong to distinct genetic
groups (based on admixture groups from 1001genomes.org) and are geographically distributed
over the USA, Europe and Asia (Figure 10B). To test whether flg22 triggers transcriptional
responses in these accessions, I determined the PROPEP3 expression 1 h after flg22 treatment.
All 12 accessions significantly induced PROPEP3 expression to similar levels (Figure 10C). I
selected five of these accessions to capture their transcriptome 1 h after flg22 treatment using
RNAseq. This included Can-0, Gy-0, Kn-0, Kon and No-0 A. thaliana accessions. Importantly,
these five accessions were collected from geographically distant regions (Figure 10B), are
genetically diverse, and present variable growth phenotypes (Figure 10D).
The transcriptional response of A. thaliana accessions to flg22 treatment was similar in
magnitude compared to the Brassicaceae response, ranging from 2443 (Kn0) to 4372 (Kon)
DEGs (compared to 2861 to 4964 for Brassicaceae) (Figure 10E). However, the overlap of
DEGs between A. thaliana accessions exceeded the overlap between Brassicaceae, as 1232
DEGs, 26% of all DEGs, were shared by all the accessions as compared to 15.7% overlap
between Brassicaceae species at 1 hpt (Figure 10F and Supplement Figure 2A). To detect
accession specific expression signatures, I applied K-mean clustering, with the same parameters
used to analyse Brassicaceae DEGs. Consistent with the high overlap of DEGs between
accessions, expression changes of all 4733 DEGs (being differentially expressed in at least one
accessions) were highly conserved between A. thaliana accessions without obvious accession-
specific expression signatures (Figure 10G). Thus, in contrast to Brassicaceae, diverse A.
thaliana accessions, adapted to different environments, exhibited little variation in their early
transcriptional response to flg22, indicating that short-term adaptation within a species barely
influences diversification of flg22 induced transcriptional reprogramming. In addition, the little
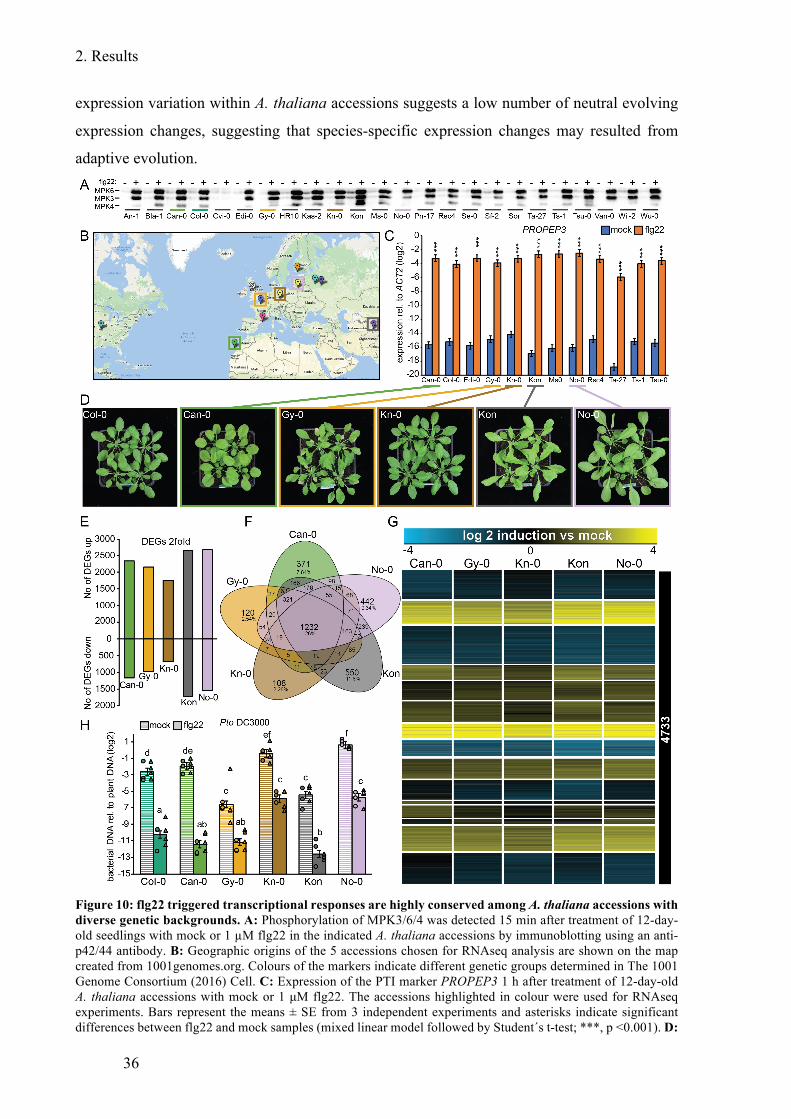
2. Results
36
expression variation within A. thaliana accessions suggests a low number of neutral evolving
expression changes, suggesting that species-specific expression changes may resulted from
adaptive evolution.
Figure 10: flg22 triggered transcriptional responses are highly conserved among A. thaliana accessions with diverse genetic backgrounds. A: Phosphorylation of MPK3/6/4 was detected 15 min after treatment of 12-day-old seedlings with mock or 1 µM flg22 in the indicated A. thaliana accessions by immunoblotting using an anti-p42/44 antibody. B: Geographic origins of the 5 accessions chosen for RNAseq analysis are shown on the map created from 1001genomes.org. Colours of the markers indicate different genetic groups determined in The 1001 Genome Consortium (2016) Cell. C: Expression of the PTI marker PROPEP3 1 h after treatment of 12-day-old A. thaliana accessions with mock or 1 µM flg22. The accessions highlighted in colour were used for RNAseq experiments. Bars represent the means ± SE from 3 independent experiments and asterisks indicate significant differences between flg22 and mock samples (mixed linear model followed by Student´s t-test; ***, p <0.001). D:

2. Results
37
Representative pictures of the 4-week-old A. thaliana accessions, chosen for RNAseq. E, F, G: 12-day-old A. thaliana seedlings were treated with mock or 1 µM flg22 for 1 h and extracted RNA was subjected to RNAseq. The analysis was limited to the list of 17,856 genes showing 1 to 1 orthologs in all tested Brassicaceae species to directly compare inter- and intra-species variation in transcriptome responses. DEGs were defined using following criteria: q-value < 0.01 and |log2 fold change| > 1. E: Bars represent the number of up- or down-regulated DEGs. F: A Venn diagram showing shared DEGs between accessions. G: Heatmap of DEGs in at least 1 accession clustered by k-means. Expression changes are shown. H: 5-week-old plants were syringe-infiltrated with mock or 1 µM flg22 24 h prior to infiltration with Pto DC3000 (OD600 = 0.0002). The bacterial titer was determined 48 h after bacterial infiltration by measuring the DNA amount of the Pseudomonas syringae specific OprF gene relative to the plant ACT2 gene using qPCR. Bars represent the means ±SE from 2 independent experiments with each 3 biological replicates (n = 6). Different letters indicate significant differences (mixed linear model followed by Student´s t-test; adjusted p < 0.01).
Initially, I mapped the RNAseq reads of the five different A. thaliana accessions to the
Col-0 reference (TAIR10) genome. To exclude that less flg22-induced expression variation
between the A. thaliana accessions was biased by this mapping approach, I re-mapped the
RNAseq reads to SNP corrected accession-specific genome sequences. Analysis of the data
mapped to individual accession genomes revealed comparable results (Supplement Figure 5),
indicating that the same conclusion can be drawn regardless of the reference genome used, and
thus I further used the initial mapping result with the Col-0 reference.
In Brassicaceae, flg22 differentially affected in vivo Pto DC3000 growth, which might
be connected to diversification of transcriptional responses during flg22-triggered PTI.
Therefore, I speculated that flg22 pre-treatment of A. thaliana accessions, sharing very similar
transcriptional reprogramming after flg22, might more robustly reduce bacterial titres. Indeed,
flg22 significantly reduced Pto DC3000 titres in all accessions, although the basal growth of
bacteria in mock conditions was variable, with reduced growth in Gy-0 and Kon and enhanced
growth in No-0 compared to the Col-0 reference accession (Figure 10H). The variation of
bacterial growth in mock-treated A. thaliana accessions might be influenced by constitutively
activated immune signalling in Gy-0 (Todesco et al., 2010) and reduced defence gene
expression in No-0, which were previously reported (Gangappa et al., 2017). However, this did
not affect the capability of flg22-pretreatment to reduce Pto DC3000 growth. This data
demonstrates that together with the highly conserved flg22-triggered transcriptome responses,
the capacity of flg22 to reduce Pto D3000 growth was highly conserved between genetically
and geographically distinct A. thaliana accessions.
2.12. Inter-species transcriptome variation exceeds intra-species
variation in response to flg22
Species-specific flg22-responsive genes might reflect neutral evolution driven by
genetic drift or adaptive evolution by natural selection. Generally, selectively neutral variation

2. Results
38
of expression changes should follow the phylogeny, whereas adaptively evolving expression
changes can be incongruent with the phylogeny and can show less variation within a species
(Romero et al., 2012; Harrison et al., 2012). To disentangle these possibilities, I normalized and
analysed the 1 h transcriptome-data of Brassicaceae species together with the A. thaliana
accession data. A principal component analysis (PCA) including all DEGs across Brassicaceae
and A. thaliana accessions, clustered A. thaliana accessions closely together, whereas other
Brassicaceae were clearly separated, mirroring the conserved transcriptional response to flg22
between A. thaliana accessions contrary to the diversified response across Brassicaceae (Figure
11A). This is supported by high Pearson correlation coefficients of flg22-induced fold changes
between A. thaliana accession, ranging from 0.86 to 0.94, which dropped to 0.73 to 0.77
between Brassicaceae and all other samples (Figure 11B). Although the A. thaliana Col-0
accession was handled in the same experimental trials with the other Brassicaceae species, and
the other A. thaliana accessions were handled in independent experimental trials, Col-0 still
clustered together with the other A. thaliana accession. Together, these analyses demonstrate
that inter-species transcriptome variation exceeds intra-species transcriptome variation of
flg22-triggered PTI.
To define and analyse diversified transcriptome responses, I recovered species-specific
expression signatures similar to the clusters obtained from the individual analyses of
Brassicaceae, using K-mean clustering of all DEGs (Figure 11C). In contrast to specific
expression signatures present in each Brassicaceae species, I was unable to identify A. thaliana
accession-specific expression clusters (Supplement Figure 6A). Around 20% of all DEGs
across Brassicaceae and A. thaliana accessions (1295 of 5961 DEGs) exhibited species-specific
expression signatures among Brassicaceae. C. rubella specific DEGs represented the largest
cluster (451 DEGs). Moreover, some genes were less flg22-responsive in A. thaliana compared
to all of the other Brassicaceae species (black cluster Figure 11C).
These species-specific flg22-responsive expression clusters could be potentially biased
by ambiguously selected orthologous relationships. Determining orthologous genes is
especially challenging for genes belonging to a large gene family with many homologs.
Therefore, if misassignments of orthologous genes explain species-specific expression patterns,
species-specific expression clusters should be enriched for genes belonging to larger gene
families compared to other clusters. To test this possibility, I compared gene family sizes in
each cluster. Importantly, the species-specific expression clusters were not enriched for large
gene families, making it unlikely that species-specific expression patterns resulted from
misassignments of orthologous genes (Supplement Figure 7A). Further, the basal expression
2. Results
39
pattern of these genes does not explain their selective induction signature in different
Brassicaceae species (Supplement Figure 7B). Together, these results demonstrate that the
expression variation between Brassicaceae species is not biased by gene-family sizes or basal
expression and clearly exceeds the variation within A. thaliana accessions.
If the transcriptome variation between Brassicaceae arises from neutral evolution,
transcriptome variation should correlate with phylogenetic distance between the species
(Broadley et al., 2008). However, C. rubella, representing the closest relative to A. thaliana
within the tested species, clustered most distantly from A. thaliana compared to the other
Brassicaceae species in the PCA using DEGs (Figure 11A) and presented a much larger number
of specifically regulated genes compared to other Brassicaceae (Figure 11C). Moreover, the
flg22-induced transcriptional changes did not clearly separate C. hirsuta and E. salsugineum
although their ancestor split approximately 25 Mio years ago (Figure 2A). Thus, the
transcriptional variation among Brassicaceae species is incongruent with their phylogeny,
suggesting that differences in transcriptome responses to flg22 may be adaptive traits arisen
from selective pressures during the Brassicaceae evolution.
Clustering flg22-induced expression changes revealed inter-species expression
variation exceeded intra-species expression variation. To further strengthen this observation by
statistics, I fitted a mixed linear model to the expression changes after flg22 treatment to
determine the number of genes that significantly diversified their flg22-response between A.
thaliana accessions or between Brassicaceae species. About 2000 genes responded
significantly differently to flg22 across the Brassicaceae species (Figure 11D). In stark contrast
and in line with the results obtained by clustering, only 131 genes were statistically diversified
in response to flg22 among A. thaliana accessions. Thus, the number of genes with diversified
flg22 responses is more than 15 times higher among Brassicaceae compared to A. thaliana
accessions.
In addition, I determined the number of genes whose expression change by flg22 is
significantly different from all other tested Brassicaceae species or all other A. thaliana
accessions. Only the Can0 accession harbours one gene that was differentially affected
compared to all other accessions. Among Brassicaceae, many genes were specifically regulated
in only one of the species and, in accordance with the large size of the C. rubella specific cluster,
flg22 specifically regulated 262 C. rubella genes compared with all other Brassicaceae (Figure
11E).

2. Results
40
Figure 11: Inter-species variation exceeds intra-species variation in transcriptome response to flg22 and is incongruent with phylogenetic relationships. A to F: Only 1 hour samples were analysed. A: Principal component analysis of 1 to 1 orthologous genes that are differentially expressed (q-value < 0.01; |log2 fold change| > 1) in at least 1 species or accession. B: Correlation plot displaying the Pearson correlation between samples based on the gene-expression of differentially induced genes. C: All 5961 DEGs were clustered using k-means and 5 selected clusters exhibiting lineage-specific expression signatures [Ath (green), non-Ath (black), Cru (orange) Chi (purple), Esa (magenta)] 1 h after 1 µM flg22 treatment are shown. The number of genes within each cluster is represented by colored bars below the clusters. The mean expression changes ±SD of each cluster in C (Visualized with Genesis) are also shown. D: The number of DEGs in flg22 response between Brassicaceae species (Brass) and between A. thaliana accessions (Ath access) in at least one comparison. E: The number of genes responding to flg22 differently in each Brassicaceae species compared to all of the other 3 Brassicaceae species. F: Heatmap showing genes which are significantly induced in 3 species but not in the other. Coloured bars indicate specificity for Ath (green), Cru (orange), Cru (purple) and Esa (magenta).

2. Results
41
Inspection of these specifically affected genes between Brassicaceae additionally
revealed some genes whose expression is significantly less affected by flg22 compared to other
Brassicaceae (Figure 11F). These genes were previously not captured by the clustering and
might as well play a role for diversified outcomes of plan-microbe interactions. The number of
genes which have specifically lost their flg22 responsiveness was much lower compared to
specifically induced genes. This further strengthens that the majority of species-specific flg22-
induced genes are no artefact since this should result in comparable numbers of specifically
induction gain and loss. These specific losses of gene induction in individual Brassicaceae
species provide another example how different Brassicaceae adapted their flg22-triggered PTI
responses.
2.13. Species-specific flg22-responsive genes are connected to
potential diversification of secondary metabolism
If the large amounts of species-specific expressed genes confer an adaptive advantage
during evolution, certain biological processes within species-specific genes might be enriched.
Unfortunately, I could not detect significant enrichment of specific GO terms within the clusters
presented in Figure 11 (Supplement Table 3). Thus, it is likely that the potential adaptive
advantage conferred by the species-specific expression signatures is not relying on few
important functions but is rather mediated by smaller distinct functions that might additively
help adaptation to certain environments.
Despite the absence of significantly enriched biological processes, certain GO-terms
were slightly enriched. Some of these GO-terms were associated with secondary metabolism
once more, including: “secondary metabolic process” and “glucosinolate biosyntethis process”,
“phenylpropanoid metabolic process” and “phenylpropanoid biosynthetic process” enriched
within A. thaliana, C. rubella and E. salsugineum specific expression clusters, respectively
(Supplement Table 3). As secondary metabolites can have direct influence on the interactions
of plants with pathogens, these genes are potentially interesting candidates that might influence
the outcome of plant-pathogen interactions. Therefore, I focussed my analysis on genes known
to be involved in the secondary metabolism.
Interestingly, a number of genes connected to tryptophan and indole glucosinolate
metabolism showed significantly larger induction upon flg22 treatment in C. rubella compared
with other Brassicaceae. These genes include ASB1, TSA1, TSB1, CYP79B2/B3, MYB51, PEN3,
and IGMT5 (For full names refer to Table 5). This is surprising giving the finding that C. rubella
2. Results
42
does likely not produce indole glucosinolates at detectable amounts (Bednarek et al., 2011). I
hypothesized that these genes might be significantly higher induced in C. rubella since they are
lowly expressed in the basal state. Indeed, extraction of the normalized basal expression levels
of corresponding genes revealed that most of these genes, except of the tryptophan biosynthetic
genes, exhibited extremely low basal expression levels compared to their orthologous genes in
other Brassicaceae (Supplement Figure 8). For example, the expression level of IGMT5 in
control samples was at least 250 times lower in C. rubella compared to the other Brassicaceae
(Supplement Figure 8). This reduced basal expression might explain the undetectable indole
glucosinolates in C. rubella and might reflect potential adaptations of C. rubella to certain
microbial interactions. Furthermore, the conserved high flg22-responsivness of these genes
may suggest additional functions during immunity.
2.14. Species-specific expression signatures are conserved in
Brassicaceae accessions and sister species and can be partially triggered
by elf18.
To investigate whether the species-specific expression signatures present novel
innovations just within one species or accession, or whether they are conserved in accessions
or sister species, I tested selected marker genes via RT-qPCR for species-specific expression
signatures in Capsella grandiflora (Cgr, sister species of Cru), two additional C. hirsuta
accessions (OLI and GR2), one additional E. salsugineum accession (YT) and Thellungiella
halophyla (Tha, Esa sister species). I selected PR4, CYP79B2 and NAC32 as C. rubella-specific
markers. All three genes were significantly induced in C. rubella and as well in its sister species
C. grandiflora (Figure 12). PR4 and NAC32 were specifically induced in these two species
whereas CYP79B2 was significantly induced in A. thaliana as well (Figure 12). The two C.
hirsuta-specific marker genes RAC7 and “AT3G60966” (as there is no common name for
“AT3G60966” I used the AGI code of this gene to designate its orthologs in other Brassicaceae
which refer to Carubv10018513m; Cagra.0239s0006; Thhalv10006444m; CARHR170490.1)
were specifically induced in all three C. hirsuta accessions, with exception of a specific
“AT3G60966” induction in C. grandiflora. Finally, all three E. salsugineum specific marker
genes (APK4; bZipTF an unknown bZip domain transcription factor; CYP77A4) were
specifically induced in the Shandong and Yukon accessions as well as in its sister species T.
halophyla (Figure 12). Together, these findings confirm our RNAseq results and indicate that
the genes specifically regulated in the tested Brassicaceae are also responsive to flg22 in sister
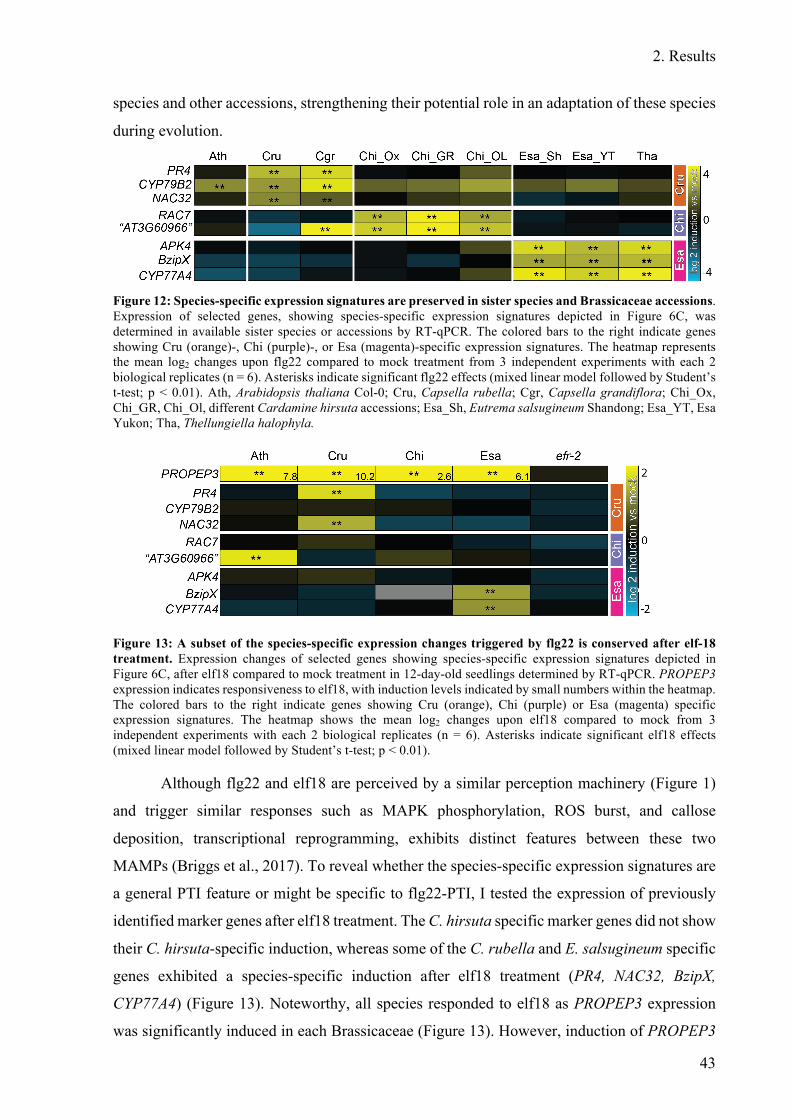
2. Results
43
species and other accessions, strengthening their potential role in an adaptation of these species
during evolution.
Figure 12: Species-specific expression signatures are preserved in sister species and Brassicaceae accessions. Expression of selected genes, showing species-specific expression signatures depicted in Figure 6C, was determined in available sister species or accessions by RT-qPCR. The colored bars to the right indicate genes showing Cru (orange)-, Chi (purple)-, or Esa (magenta)-specific expression signatures. The heatmap represents the mean log2 changes upon flg22 compared to mock treatment from 3 independent experiments with each 2 biological replicates (n = 6). Asterisks indicate significant flg22 effects (mixed linear model followed by Student’s t-test; p < 0.01). Ath, Arabidopsis thaliana Col-0; Cru, Capsella rubella; Cgr, Capsella grandiflora; Chi_Ox, Chi_GR, Chi_Ol, different Cardamine hirsuta accessions; Esa_Sh, Eutrema salsugineum Shandong; Esa_YT, Esa Yukon; Tha, Thellungiella halophyla.
Figure 13: A subset of the species-specific expression changes triggered by flg22 is conserved after elf-18 treatment. Expression changes of selected genes showing species-specific expression signatures depicted in Figure 6C, after elf18 compared to mock treatment in 12-day-old seedlings determined by RT-qPCR. PROPEP3 expression indicates responsiveness to elf18, with induction levels indicated by small numbers within the heatmap. The colored bars to the right indicate genes showing Cru (orange), Chi (purple) or Esa (magenta) specific expression signatures. The heatmap shows the mean log2 changes upon elf18 compared to mock from 3 independent experiments with each 2 biological replicates (n = 6). Asterisks indicate significant elf18 effects (mixed linear model followed by Student’s t-test; p < 0.01).
Although flg22 and elf18 are perceived by a similar perception machinery (Figure 1)
and trigger similar responses such as MAPK phosphorylation, ROS burst, and callose
deposition, transcriptional reprogramming, exhibits distinct features between these two
MAMPs (Briggs et al., 2017). To reveal whether the species-specific expression signatures are
a general PTI feature or might be specific to flg22-PTI, I tested the expression of previously
identified marker genes after elf18 treatment. The C. hirsuta specific marker genes did not show
their C. hirsuta-specific induction, whereas some of the C. rubella and E. salsugineum specific
genes exhibited a species-specific induction after elf18 treatment (PR4, NAC32, BzipX,
CYP77A4) (Figure 13). Noteworthy, all species responded to elf18 as PROPEP3 expression
was significantly induced in each Brassicaceae (Figure 13). However, induction of PROPEP3

2. Results
44
was lower in C. hirsuta (2.6 log2-fold change) compared to other Brassicaceae (6.1 to 10.2 log2-
fold change). This suggests a lower sensitivity of C. hirsuta towards elf18 which might explain
why C. hirsuta specific marker genes were not induced by elf18. Taken together, these findings
suggest that parts of the species-specific expression signatures are a general feature of PTI,
while some may be specific for flg22-triggered PTI.
2.15. WRKY TF motifs are highly enriched in commonly induced
clusters and present in some species-specific expression signatures.
Transcriptional regulation is often mediated by TF binding to specific motifs in the 5´-
regulatory regions, near the transcriptional start site (also called cis-regulatory region), to
activate or repress transcription. Consequently, similar expression patterns of flg22-responsive
genes might be associated with the conservation of similar cis-regulatory motifs controlling the
transcription of these genes. Vice versa, species-specific expression signatures might be
achieved by gaining or losing specific cis-regulatory motifs. To test this hypothesis, I screened
the 5´regulatory regions of genes within each expression cluster for enrichment of known TF-
motifs. Regulatory regions of commonly flg22-induced genes were highly enriched for WRKY
TF motifs in all four Brassicaceae species (Figure 14A, Supplement Table 4-7). The WRKY
TF-family is one of the largest with over 70 members in A. thaliana plants and WRKYs are key
players during plant immune responses (Pandey and Somssich, 2009; Tsuda and Somssich,
2015; Birkenbihl et al., 2017). Especially, clusters 4, 13 and 14 are strongly enriched for many
WRKY TF motifs in all four Brassicaceae species (Figure 14A, Supplement Figure 6,
Supplement Table 4-7), suggesting that regulation by WRKY TFs is a conserved feature of
transcriptional induction during Brassicaceae PTI.
In addition, A. thaliana, C. rubella and C. hirsuta regulatory sequences were also
significantly enriched for several CAMTA TFs in clusters 13, 6, 14, respectively (Supplement
Table 4-7). A recent study suggested an important role of CAMTA motifs during the early
transcriptional immune response and showed that genetic perturbation of CAMTA3 influences
ETI and PTI transcriptome responses (Jacob et al., 2017). Only in clusters 6 and 12, no
significantly enriched WRKY motif was detected within E. salsugineum and C. rubella
regulatory sequences. This might be connected to the only moderate expression induction of
genes within these two clusters. Overall most flg22-responsive expression changes conserved
within A. thaliana and across Brassicaceae are connected to WRKY TF regulation.
2. Results
45
Regulatory regions of flg22-downregulated genes were enriched for different ATHB TF
motifs in each Brassicaceae and AHL TF (AT-hook motif nuclear-localized proteins) in A.
thaliana and C. hirsuta (Figure 14B). In particular, cluster 8 with moderately downregulated
genes exhibited multiple enriched TF binding motifs in each Brassicaceae. In contrast, the
largest cluster 15 was not enriched for any known TF-motif in neither of the species. Although
ATHB TF motifs were commonly found in each of the Brassicaceae, much less common motifs
were detected for downregulated genes, suggesting less conservation in transcriptional
regulatory mechanisms of flg22-downregulated compared to flg22-upregulated genes.
Interestingly, 5´regulatory regions of some species-specific expression signatures were
specifically enriched for certain TF-binding motifs only in the species showing species-specific
expression. Whereas C. hirsuta specific expression signatures were not enriched for TF-motifs,
5´-regulatory regions of A. thaliana and E. salsugineum specific flg22-responsive genes were
significantly enriched for WRKY TF-motifs (Figure 14C). This was especially pronounced in
E. salsugineum specific expression signatures (Supplemental table 5, cluster 10). In addition,
5´-regulatory regions of genes with a lower induction in all A. thaliana accessions compared to
the other three Brassicaceae species were enriched for WRKY3 and WRKY33 motifs in C.
rubella. This is in line with higher induction of these genes in C. rubella compared to other
species. The C. rubella specific expression signatures were linked to enrichment of AHL12 and
AHL25 TF-motifs (Figure 14C). Taken together, WRKY TFs were not only associated with
conserved flg22-responsive expression signatures, but also with some of the species-specific
flg22-responsive expression signatures, highlighting the importance of WRKYs TF for PTI and
suggesting that gain of WRKY TF might be associated with the gain of species-specific flg22-
responsive expression changes.

2. Results
46
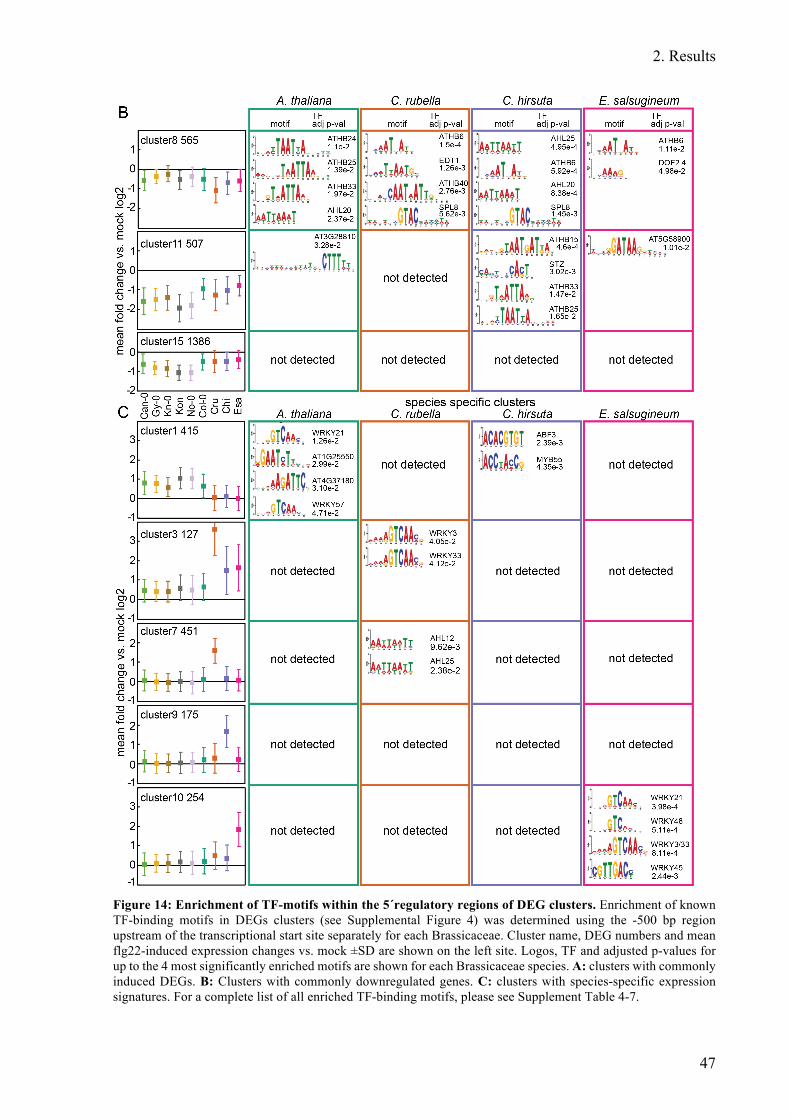
2. Results
47
Figure 14: Enrichment of TF-motifs within the 5´regulatory regions of DEG clusters. Enrichment of known TF-binding motifs in DEGs clusters (see Supplemental Figure 4) was determined using the -500 bp region upstream of the transcriptional start site separately for each Brassicaceae. Cluster name, DEG numbers and mean flg22-induced expression changes vs. mock ±SD are shown on the left site. Logos, TF and adjusted p-values for up to the 4 most significantly enriched motifs are shown for each Brassicaceae species. A: clusters with commonly induced DEGs. B: Clusters with commonly downregulated genes. C: clusters with species-specific expression signatures. For a complete list of all enriched TF-binding motifs, please see Supplement Table 4-7.

2. Results
48
2.16. Coding sequence and promoter variation does not correlate with
expression variation
Some previous comparative transcriptome studies connected transcriptome variation to
amino acid sequence variation between species (Hunt et al., 2013; Whittle et al., 2014; Necsulea
and Kaessmann, 2014). Since these studies focussed on basal expression levels, the relationship
of stress-responsive expression changes and sequence conservation between species has not
been investigated. Therefore, I tested whether the amino acid sequence-identity correlates with
variation of flg22-induced expression changes between Brassicaceae species. I divided the SD
of basal expression values by their means across the four Brassicaceae species as a measure of
expression variation. The SD/mean of basal gene expression did not correlated with the
sequence variation, suggesting that amino acid sequence diversification is not connected to the
diversification of expression changes between the tested Brassicaceae species (Figure 15A).
Thus, the results obtained here are not in line with a previous publication reporting a correlation
between basal expression variation and amino acid sequence conservation (Broadley et al.,
2008).
Similarly, plotting the SD/mean of flg22-induced expression changes against mean
amino acid sequence identities did not result in a clear correlation (Figure 15B) and limiting
the analysis to DEGs (all DEGs in the combined analysis of Brassicaceae and A. thaliana
accession) resulted in a similar result (Figure 15C). This suggests that diversification of flg22-
induced expression changes is not correlated to coding sequence evolution.
Furthermore, I tested whether pairwise differences of flg22-induced expression between
A. thaliana and individual Brassicaceae were linked to AA sequences diversification. Separate
analysis including all expressed genes or only DEGs both indicated that flg22-induced
expression changes were not coupled to sequence divergence in any of the pairwise
comparisons (Figure 15D-I). Together, this data indicates that the basal expression variation as
well as the flg22-responsive expression variation between Brassicaceae species did not
correlate with coding-sequence variation.
Moreover, I was interested whether species-specific or core flg22-responsive genes
show altered sequence variation compared to other genes. I plotted percentages of amino acid
identities from pairwise comparisons of each Brassicaceae with A. thaliana next to the k-mean
expression clusters determined previously (Supplement Figure 6). Neither species-specific
expression clusters nor the core flg22-responsive genes exhibited a clear pattern of sequence
variation diverging from other expression clusters, except of cluster 5 which exhibited a lower

2. Results
49
amino-acid sequence conservation in each Brassicaceae compared to other clusters. Cluster 5
contained 70 highly induced and conserved DEGs. This may indicate that highly induced genes
faced a stronger selective pressure to diversify their sequence compared to other flg22-
responsive genes.
Figure 15: Gene expression variation does not correlate with coding sequence variation. A: mean amino acid (AA) sequence identities of C. rubella, C. hirsuta and E. salsugineum to A. thaliana (y axis) was plotted against the SD/mean of the expression values in mock samples of all four Brassicaceae plants for all expressed genes (x axis). B, C: mean AA identities of C. rubella, C. hirsute, and E. salsugineum to A. thaliana were plotted against the SD/mean of flg22-induced expression changes in all four Brassicaceae plants for all expressed genes with 1to1 orthologs (16100 genes) (A) or 5961 DEGs (B). D - I: Pairwise AA sequence identity of C. rubella (D, G), C. hirsuta (E, H) and E. salsugineum (F, I) to A. thaliana was plotted against the flg22-induced expression changes between the compared species for all expressed genes (D-F) or DEGs (G-I).
Diversified expression changes between species may be mediated by changes in cis-
regulatory sequences which can influence gene expression levels. To test a potential influence
of cis-regulatory variation on species-specific expression signatures, I extracted -500 bp 5´-
2. Results
50
regulatory sequences and plotted their identities next to the K-mean clusters of all DEGs
between Brassicaceae and A. thaliana accessions (Supplement Figure 6C). In line with previous
observation of amino acid sequence variation, there was no clear correlation between
expression variation and promoter sequence variation, except for cluster 5. Interestingly and in
contrast to the amino acid sequence identity, the promoter sequence identity was higher in
cluster 5 compared to that of the other clusters. Thus the 70 conserved and highly flg22-
responsive genes seem to have a more conserved 5´regulatory region compared to other flg22-
responsive genes but a lower coding sequence conservation. Expression variation between
species within other clusters might be either mediated by trans-acting regulatory sequences or
by small differences in TF binding sites that are masked by the high sequence variation in 5´-
regulatory regions. For example, the gain of WRKY TF in some of the species-specific flg22-
responsive genes might have affected their expression without a strong impact on the overall
variation of the 5´-regulatory regions. Taken together coding and promoter sequence
conservation were not clearly correlated with conservation of flg22-responsive expression
signatures.
2.17. Heat stress-induced transcriptome responses vary among
Brassicaceae similarly as flg22-triggered responses
The considerable variation of flg22-responsive expression changes between
Brassicaceae species might be a unique feature of PTI or alternatively a more general
phenomenon which similarly applies to other stress-induced transcriptome responses. To
resolve this question, I captured the transcriptomic changes after a strong heat stress, since a
similar comparative-transcriptomic study with a defined input stress is lacking. I placed 12-
day-old seedlings for 1 h at 22°C or 38°C. This stress significantly induced the heat-stress
marker genes HEAT STRESS PROTEINs 70 and 90.1 (HSP70 and HSP90.1) in all tested
Brassicaceae species (Supplement Figure 9). The subsequent RNAseq analysis revealed a high,
but slightly lower number of heat-stress affected DEGs compared to the flg22-induced
transcriptional response, with 3249, 3889, 2271 and 4563 DEGs in A. thaliana, C. rubella, C.
hirsuta and E. salsugineum, respectively (Figure 16A). In stark contrast to the flg22-induced
transcriptome, heat-stress downregulated a much higher number of genes in each species. These
results demonstrate, that despite generally similar extent of expression changes, transcript
reduction seems to play a more important role in heat- compared to flg22-triggered
transcriptional reprogramming.
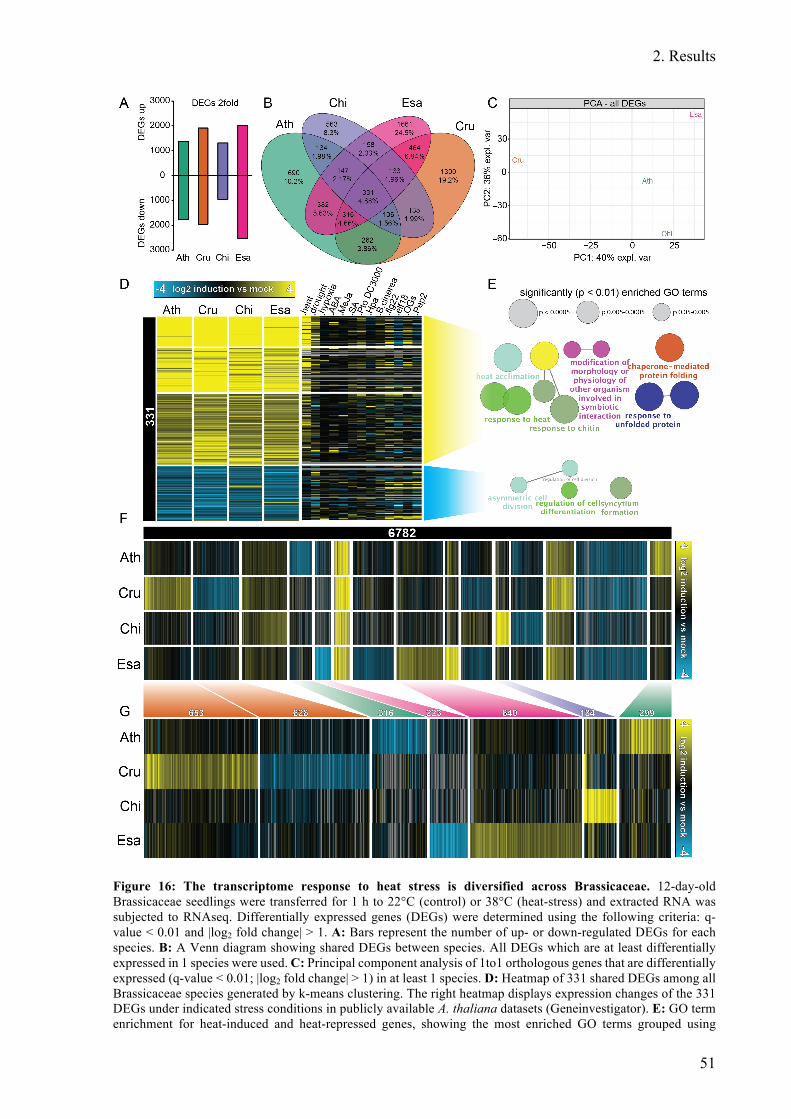
2. Results
51
Figure 16: The transcriptome response to heat stress is diversified across Brassicaceae. 12-day-old Brassicaceae seedlings were transferred for 1 h to 22°C (control) or 38°C (heat-stress) and extracted RNA was subjected to RNAseq. Differentially expressed genes (DEGs) were determined using the following criteria: q-value < 0.01 and |log2 fold change| > 1. A: Bars represent the number of up- or down-regulated DEGs for each species. B: A Venn diagram showing shared DEGs between species. All DEGs which are at least differentially expressed in 1 species were used. C: Principal component analysis of 1to1 orthologous genes that are differentially expressed (q-value < 0.01; |log2 fold change| > 1) in at least 1 species. D: Heatmap of 331 shared DEGs among all Brassicaceae species generated by k-means clustering. The right heatmap displays expression changes of the 331 DEGs under indicated stress conditions in publicly available A. thaliana datasets (Geneinvestigator). E: GO term enrichment for heat-induced and heat-repressed genes, showing the most enriched GO terms grouped using

2. Results
52
ClueGO Cytoscape plugin. The circle sizes represent significance levels. F: Heatmap showing expression changes of all 6782 DEGs, generated using k-means clustering. G: Enlarged clusters showing species-specific expression signatures observed in F.
Only 331 DEGs were overlapped in all Brassicaceae species, which is a small fraction
of 4.88% compared to 15.7% overlap of DEGs after flg22 treatment (Figure 16B, Supplement
Figure 2A). A PCA based on all DEGs that were expressed in each species (5256) clearly
separated the four species from each other. The transcriptional response of C. rubella was most
diversified from the other Brassicaceae (Figure 16C), which was in agreement with previous
observations for the flg22-induced transcriptome changes. Thus, as observed for flg22-induced
expression changes, the variation in heat-stress induced transcriptional responses is incongruent
with the phylogenetic relationship between the tested Brassicaceae species.
The 331 shared DEGs between the Brassicaceae species were similarly regulated not
only in each species, but also in two previous heat- or drought-stress studies conducted in
A. thaliana (Figure 16D). Moreover, upregulated genes were significantly enriched for the GO
terms “heat acclimation”, “response to heat” and “chaperone-mediated protein folding”,
whereas downregulated genes were enriched for “regulation of cell differentiation”, presenting
typical processes connected to heat-stress (Figure 16E). The GO-term “response to chitin” was
as well among the overrepresented GO terms of upregulated genes. This was in line with the
observation that many of these genes were similarly upregulated in publically available flg22
and oligogalacturonides (OG) induced A. thaliana transcriptomes and suggests that certain
heat-stress responsive expression changes overlap with MAMP induced expression changes
(Figure 16D, E). In summary, the DEGs conserved for their responsiveness to heat-stress
overlap to a certain degree with MAMP responsive genes but present typical genes previously
associated to heat-stress.
To resolve whether the large diversification of transcriptional responses to heat-stress,
indicated by the small overlap DEGs among Brassicaceae and the large variance visualized in
the PCA of DEGs (Figure 16B, C), results in species-specific expression signatures I clustered
all DEGs using K-mean clustering. Indeed, large parts of the species-specific DEGs translate
to expression clusters with species-specific expression signatures (Figure 16 F). Extracting only
the most obvious of these clusters results in nearly 3000 genes exhibiting species-specific
expression changes after heat-stress (Figure 16 G). C. rubella, closely followed by E.
salsugineum, specifically regulated the largest number of DEGs. To exclude that the substantial
amount of species-specific expressed genes was biased by not or lowly expressed genes in
individual species, I re-analysed the data, based on the 17,857 1 to 1 orthologous genes and
excluded lowly expressed genes. This analysis revealed a comparable amount of species-

2. Results
53
specific expression signatures, suggesting that the considerable number of species-specific
regulated genes was not explained by lowly expressed genes (Supplement Figure 10). Taken
together, compared to the species-specific responses induced by flg22, heat-stress
transcriptional responses diversified even more drastically between Brassicaceae species and
were incongruent with phylogeny. This suggests that major diversifications of transcriptional
responses during both biotic and abiotic stresses may play an important role during adaptation.

3. Discussion
55
3. Discussion
3.1. Flg22 perception machinery and flg22-triggered early responses
are conserved in Brassicaceae
3.1.1. Sequence conservation of PTI perception machinery
PTI is activated after the perception of MAMPs by plasma membrane-localized PRRs.
Comparing amino acid sequences of PRRs as well as interacting proteins revealed in general a
high conservation of these components among tested Brassicaceae species. The high sequence
conservation emphasises the importance of these components across the Brassicaceae family.
This is in general congruent with the literature describing conservation of elf18 or nlp20
perception across Brassicaceae and flg22 perception in multiple other plant families (Zipfel et
al., 2006; Takai et al., 2008; Boller and Felix, 2009; Böhm et al., 2014). However, even within
a species, individual receptors can lose their function as observed for the A. thaliana accessions
WS-0 and CVI-0, which harbour premature stop codons in their FLS2 sequences (Gómez-
Gómez et al., 1999; Dunning et al., 2007; Vetter et al., 2016). Interestingly, for some A. thaliana
accessions, the loss of flg22-responsiveness was associated with lower protein abundance or
changes in catalytic sites rather than the complete loss of the FLS2 gene (Vetter et al., 2016).
This opens up the question why these accessions do not lose the FLS2 receptor completely. One
possible explanation is that those receptors, impaired in flg22 perception, might recognize other
flagellin epitopes than flg22. Alternatively, even catalytically impaired PRRs might conserve
their interaction with other RLKs which might be important to control and fine-tune various
other functions mediated by RLKs. In recent years, it was noticed that many RLKs work in
bigger complexes at the plasma membrane (Macho and Zipfel, 2014; Ranf, 2017). For example,
BAK1 not only interacts with FLS2 but also many other RLKs involved in immunity and
brassinosteroid signalling (Nam and Li, 2002; Li et al., 2002; Yasuda et al., 2017; Lozano-
Durán and Zipfel, 2015). Thus, the interaction of FLS2 with BAK1 could potentially influence
other processes as well for example by modulating available BAK1 levels.
Interestingly, protein sequences of PRRs seem to be less conserved than those of
intracellular components connecting ligand perception to subsequent signalling cascades. This
lower sequence conservation of PRRs among Brassicaceae species might reflect a functional
diversification in ligand recognition specificities of the PRRs. Different plant species or

3. Discussion
56
accessions evolving in diverse environments were conceivably exposed to distinct microbes
possessing different MAMPs. Thus, changes in receptor recognition specificities may provide
evolutionary advantages to plants. For example, it is known that Agrobacterium tumefaciens
has an altered FliC sequence thereby escaping from flg22 and flgII-28 perception by A. thaliana
and tomato plants, respectively (Felix et al., 1999; Rosli et al., 2013). Hence, it would be
beneficial for plants to evolve flagellin receptors with different ligand specificities.
Alternatively, plants may evolve additional PRRs to sense different epitopes of the same
microbial molecule like tomato which senses multiple flagellin epitopes by an additional PRR
called FLS3 sensing flgII-28 (Hind et al., 2016). It is conceivable that sequence variation among
PRRs, especially in the extracellular domain, might help the plant to adapt to invading
pathogens. In line with this idea, the RLP23 and RLP30 which lack an intracellular kinase
domain, exhibit the lowest conservation of all tested PRRs over Brassicaceae (Figure 1A).
Interestingly, for the intracellular NLR receptors, multiple studies indicated that the NB-ARC
domain, important for ATP binding, is generally more conserved by purifying selection among
NLR genes within and between species, whereas positive diversifying selection acts in regions
encoding LRR domains responsible for effector binding (Mondragón-Palomino et al., 2002;
Ashfield et al., 2012; Jacob et al., 2013). Further studies comparing sequence conservation of
different PRR domains will help to understand whether different RLK domains evolve under
different selection pressures similarly to NLRs.
Apart from keeping up with pathogenic microbes, changing ligand perception
specificity might also help plants differentiate between pathogenic and beneficial microbes.
Additional investigations concerning the relationship of sequence variation to ligand
recognition specificity in PRRs among different species would advance our understanding of
co-evolution between plants and microbes. The natural diversity in extracellular PRR domains
might enable plants to recognize additional MAMPs, which paves the ways to broadening
pathogen resistance and fine-tuning microbiota assembly of crop species. This could provide
substantial advantages as it might allow tailoring PRRs by combining desired extracellular and
intracellular PRR domains which have increased recognition specificity and are resilient to
pathogen perturbation, respectively.
In contrast to PRRs, cofactors like BAK1 which interact with various different PRRs
were highly conserved among Brassicaceae species. BAK1 is even conserved in the moss
Physcomitrella patens (Boller and Felix, 2009). A possible explanation for this might be that
BAK1 is not only a key player in immunity but also crucial for developmental processes by
modulating brassinosteroid signalling (Nam and Li, 2002; Li et al., 2002; Chinchilla et al.,

3. Discussion
57
2009; Yasuda et al., 2017). However, PBL27 is not known to be involved in other processes
besides chitin-induced PTI responses but is still highly conserved. Hence, components
interacting with PRRs downstream of MAMP perception might be more conserved as they do
not confer ligand specificity and might be consequently less affected by selection pressure
arising from MAMP evolution on the microbial side. Moreover, the general conservation of
components acting directly downstream of MAMP perception is in line with recent findings
that the transfer of PRRs such as EFR or RLP23 to plants lacking these receptors is functional
and confers additional resistance (Lacombe et al., 2010; Albert et al., 2015).
3.1.2. All Brassicaceae tested in this study sensed flg22
Previously it was shown that FLS2 orthologs from different C. hirsuta accessions,
including the Oxford, GR2 and OLI accessions that were used in this study, did not bind flg22
(Vetter et al., 2012). However, in my hands, all tested Brassicaceae species sensed flg22 and
induced early PTI responses like MPK3/6 phosphorylation or marker gene expression after
flg22 treatment (Figure 2, Figure 12), which was in line with the generally high sequence
conservation of FLS2 and its interacting partners (Figure 1). Vetter and colleges used in vitro
assays in which the competitive binding of radioactively labelled flg22 epitopes was recorded
(Vetter et al., 2012). Flg22 binding to C. hirsuta FLS2 orthologs was not detected by this
method, but no further downstream responses were analysed in this study. In contrast, I
specifically investigated flg22-induced responses. One possibility is that the C. hirsuta FLS2
ortholog senses flg22 but the method used by Vetter et al. was not sensitive enough to detect
this binding. For example, C. hirsuta might sense flg22 by a more transient flg22 binding.
Another possibility is that indeed the C. hirsuta FLS2 ortholog does not sense flg22, but another
C. hirsuta receptor is capable of sensing flg22 and triggering downstream responses. A way to
distinguish these two possibilities is to create a fls2 knock-out mutant in C. hirsuta for example
by using CRISPR-Cas9 and subsequently test its flg22-responsiveness. If a C. hirsuta fls2
mutant still responds to flg22, it would be very interesting to investigate which PRR might have
taken over this function. The data presented here clearly demonstrate that all three C. hirsuta
accessions sense flg22. Whether this is indeed mediated by their FLS2 orthologs remains to be
addressed.

3. Discussion
58
3.2. Variation in flg22-mediated responses among Brassicaceae
3.2.1. Variable effect of flg22 on growth reduction
All tested Brassicaceae responded to flg22 treatment, demonstrated by MPK3/6
phosphorylation, marker gene expression, and seedling growth inhibition (Figure 2). However,
the effect of flg22 on seedling growth varied between Brassicaceae species. These differences
might be in part influenced by diversified growth rates between these species; e. g. E.
salsugineum grows relatively slow compared to C. hirsuta. Thus, the relative fresh weight
differences between mock- and flg22-treated seedlings of fast-growing Brassicaceae species
might be larger if flg22 treatment leads to a nearly complete stop of seedling growth.
Differences might be as well explained by other factors influencing growth defence
crosstalk. The growth-immunity trade-off might be beneficial for the plant as it can prioritize
between growth and defence in order to regulate its resource allocation accordingly (Yang et
al., 2012; Meldau et al., 2012; Belkhadir et al., 2014). It is known that even within A. thaliana
there can be substantial variation in flg22-induced seedling growth inhibition between
accessions (Vetter et al., 2016). This might be mediated by variations in flg22-sensitivity but
could be also explained by diversifications of the growth-immunity trade-off across accessions.
For example, BAK1 not only acts as a co-receptor for FLS2 but also for the brassinosteroid
receptor BRASSINOSTEROID INSENSITIVE 1 (BRI1) (Nam and Li, 2002; Li et al., 2002).
Brassinosteroids are phytohormones involved in many developmental processes including cell
expansion (Kim and Wang, 2010). Thus, it has been suggested that BAK1 might play an
important role in integrating growth signals with immunity by preferentially interacting with
BRI1 or FLS2 to induce growth or immunity (Belkhadir et al., 2012; Wang, 2012).
Environmental factors may have a strong impact on this crosstalk as species that face high
pathogen pressure might adapt this crosstalk in favour of defence, whereas species whose
fitness relies on high growth rates might favour growth instead. Consequently, alterations in
the growth-defence trade-off might differentially affect flg22-mediated seedling growth
inhibition in different Brassicaceae.
3.2.2. Variation in hormone levels
SA, JA, and ABA levels not only responded differently after flg22 treatment but also
differed in mock-treated samples among tested Brassicaceae (Figure 3). Phytohormones are
involved in the regulation of various processes such as growth, development, abiotic and biotic

3. Discussion
59
stress responses and build up a complex network with synergistic as well as antagonistic
relationships (Pieterse et al., 2009). Hence, phytohormone levels can be affected by multiple
signals and might need to be adjusted according to the lifestyle of an individual species or even
accession. Indeed, basal phytohormone levels were recently measured in 17 A. thaliana
accessions and substantial variation in gibberellin and SA levels were detected in some of the
accessions (Nam et al., 2017). For example, the SA levels in the C24 accession were
approximately ten times higher compared to Col-0 SA-levels. Another study investigated
variation in phytohormone levels in roots of 13 A. thaliana accessions and noted high variation
in some cytokinins and gibberellin levels across the tested accessions (Lee et al., 2018). Yet, to
my knowledge, there are no studies comparing phytohormone levels between species in a
controlled environment. However, the two previously mentioned studies demonstrated
considerable variation in basal phytohormone levels even within a species. Thus, it is
conceivable, that the substantial variation in basal phytohormone levels between Brassicaceae
species observed here, might be a more general phenomenon between plant species, which may
reflect adaptations to different environments.
Interestingly, E. salsugineum accumulated ABA at higher levels compared to other
Brassicaceae species (Figure 3B). Plants increase ABA levels in response to abiotic stresses
like drought or salt stress and ABA is important for the tolerance to these stresses (Qin et al.,
2011). E. salsugineum was isolated from saline environments and is extremely tolerant to
drought and salt stress (Zhu, 2001; Taji et al., 2004; Inan et al., 2004; Gong et al., 2005). Indeed,
it was suggested that the high salt stress tolerance of E. salsugineum might be achieved by a
gene number expansion within gene families involved in ABA biosynthesis pathways,
combined with a higher sensitisation for abiotic stresses (Taji et al., 2004; Wu et al., 2012).
However, despite pointing out the potential role of ABA in the stress adaptation of E.
salsugineum, this hypothesis has not been tested up to now and ABA levels in E. salsugineum
in comparison to other plant species have not been reported. The higher ABA levels in E.
salsugineum compared to other Brassicaceae species observed here indeed point to an important
role of ABA in the extreme abiotic stress tolerance of E. salsugineum. However, to clarify the
role of ABA in this process genetic perturbation of ABA biosynthesis or ABA signalling is
needed to create causal links between salt stress adaptation and ABA. In A. thaliana ABA2
encodes a key enzyme in the ABA biosynthesis pathway and aba2 knockout mutants have
reduced ABA levels (Koornneef et al., 1998; Gonzalez-Guzman et al., 2002; Adie et al., 2007;
Finkelstein, 2013). Therefore, I currently use CRISPR-Cas9 targeted genome editing to create
aba2 mutants in E. salsugineum. If aba2 mutations in E. salsugineum lead to reduced ABA
3. Discussion
60
levels, these mutants will be an important future resource to test the involvement of ABA on
abiotic stress tolerance of E. salsugineum.
SA and ABA have been shown to act antagonistically with each other (Robert-
Seilaniantz et al., 2011). Numerous studies demonstrated that abiotic stress or ABA application
negatively affects resistance against pathogens which are sensitive to SA-mediated immunity
(Yasuda et al., 2008; Fan et al., 2009; De Torres Zabala et al., 2009; Pye et al., 2013; Ueno et
al., 2015; Liu et al., 2015). For example, ABA application not only reduces SA accumulation
by inhibiting expression of the SA biosynthesis gene ISOCHORISMATE SYNTHASE 1 (ICS1;
also named SID2) (De Torres Zabala et al., 2009), but also blocks SA signalling by initiating
proteasome degradation of the key SA regulator NONEXPRESSER OF PR GENES 1 (NPR1)
(Ding et al., 2016). This crosstalk might be beneficial under individual stress situations by
prioritizing the appropriate stress response (Asselbergh et al., 2008; Vos et al., 2015; Ueno et
al., 2015). Consequently, E. salsugineum might prioritize abiotic stress responses by higher
ABA levels which may negatively affect PTI responses. This assumption is consistent with the
relatively transient flg22-induced transcriptome responses in E. salsugineum compared to the
other Brassicaceae species (Figure 7C) and with the inability of flg22 to trigger growth
reduction of Pto DC3000 and Pto hrcC in E. salsugineum compared to A. thaliana (Figure 4).
However, until we can gain a genetic proof, e.g. by mutation of ABA synthesis, it remains
speculation whether elevated ABA levels are connected to an inefficient flg22-triggered PTI in
E. salsugineum. Thus, the previously mentioned aba2 mutants created by CRISPR-Cas9 might
help to clarify the role of ABA not only for abiotic stress tolerance of E. salsugineum but also
for its impact on PTI responses. Since E. salsugineum responds to flg22, can be infected with
Pto and has a sequenced genome it is an excellent model to study the evolutionary trade-off
between abiotic and biotic stress responses.
Phytohormone measurements further revealed strongly elevated JA levels in A. thaliana
that were up to 100-fold higher compared to other Brassicaceae species. These high JA levels
seem to be generally conserved in A. thaliana accession as a recent study measured comparable
JA levels in various A. thaliana accessions (Nam et al., 2017). This suggests that the
exceptionally high JA levels in A. thaliana compared to other Brassicaceae species are
stabilized over evolution and thus presumably present an important adaptive trait of A. thaliana.
Moreover, JA levels strongly increased 1 h after flg22 treatment in C. rubella and in E.
salsugineum but not in A. thaliana and C. hirsuta (Figure 3C). Contrasting this observation, a
recent publication detected elevated JA levels in A. thaliana 1 h after flg22 treatment (Hillmer
et al., 2017). Major differences in the experimental setup might account for this discrepancy.

3. Discussion
61
Hillmer et al. infiltrated flg22-solution in leaves of four-week-old plants. Water-infiltration into
leaves can trigger wound responses in A. thaliana, for example MPK3 activation (Kohler et al.,
2002; Beckers et al., 2009). JA normally accumulates after wounding and during interactions
with necrotrophic pathogens as well as upon herbivore attack (De Vos et al., 2005; Glauser et
al., 2008; Koo et al., 2009; Campos et al., 2014). Since Hillmer et al. compared the JA levels
to a 0 h time-point rather than to mock infiltrated leaves, the early increase in JA levels might
be confounded by an infiltration elicited wound-response. Usually, JA signalling antagonizes
SA signalling (Robert-Seilaniantz et al., 2011; Thaler et al., 2012; Van der Does et al., 2013).
This crosstalk is often exploited by pathogens like Pto DC3000 producing the JA-isoleucine
mimic coronatine, which can bind to the JA-receptor COI1 and activate JA-signalling (Katsir
et al., 2008). This JA-signalling activation suppresses SA signalling which is effective against
hemibiotroph pathogens (Glazebrook, 2005; Brooks et al., 2005; Zheng et al., 2012). Hence it
seems counterintuitive that plants increase JA levels upon treatment with flg22, a MAMP
present in hemibiotroph Pto DC3000. However, JA is important for the immune responses
against necrotrophic pathogens and it is conceivable that certain necrotrophic pathogens as well
have flg22 epitopes (Mengiste, 2012). Thus, different plant species might modulate the
phytohormone accumulation downstream of MAMP perception based on the pathogen pressure
in their native environments.
3.2.3. Variation in bacterial growth
Flg22 treatment reduced Pto DC3000 growth in all tested Brassicaceae except
E. salsugineum. Moreover, in C. hirsuta the reduction was much lower compared to other
Brassicaceae (Figure 4). This might be explained by a better adaptation of Pto DC3000 to C.
hirsuta and E. salsugineum enabling a more efficient inhibition of PTI responses. It was
previously proposed that the failure of effectors to find their appropriate host targets might be
positively associated with non-host resistance (Schulze-Lefert and Panstruga, 2011). Indeed, it
was recently shown that Phytophthora infestans effectors targeting proteases in potato are
specifically tailored to potato proteases and fail to target orthologous proteases of the potato
relative Mirabilis jalapa, rendering P. infestans non-virulent on Mirabilis jalapa (Dong et al.,
2014). Hence, a more efficient inhibition of flg22-triggered PTI responses in specific
Brassicaceae is in principle possible. However, in E. salsugineum and C. hirsuta, flg22
treatment did not inhibit growth of Pto hrcC, lacking the functional delivery of pathogen
effectors (Figure 4 B). Thus, the inability of flg22 to reduce Pto DC3000 growth in E.

3. Discussion
62
salsugineum and C. hirsuta is not explained by the possibility that Pto DC3000 effectors can
effectively suppress pre-activated PTI in E. salsugineum and C. hirsuta.
Pto DC3000 titres were also lower in E. salsugineum compared to the other
Brassicaceae species (Figure 4A). The repertoire of NLR genes to detect pathogen effectors
varies greatly across Brassicaceae species with only a few conserved NLRs among A. thaliana,
A. lyrata, C. rubella and E. salsugineum (Peele et al., 2014). In contrast to A. thaliana, Pto
DC3000 triggers ETI in several tomato strains which can recognize the Pto DC3000 effector
AvrPto by a receptor complex comprised of the protein kinase Pto and the NLR Prf (Salmeron
et al., 1996; Tang et al., 1996; Gutierrez et al., 2010). Thus, the lower Pto DC3000 growth in
E. salsugineum may result from recognition of Pto DC3000 effectors which are not recognized
by the other Brassicaceae. An effective ETI response in E. salsugineum might preclude further
reduction of bacterial titres by flg22 treatment. However, this is very unlikely since flg22-
treatment did not reduce Pto hrcC which grew to comparative levels in untreated A. thaliana
and E. salsugineum. Furthermore, bacterial titres in flg22 treated A. lyrata and A. arabicum
were much lower compared to E. salsugineum (Figure 4A), indicating that further reduction of
bacterial titres is in principle possible. A previous publication reported lower Pto DC3000
growth in E. salsugineum compared to A. thaliana and bacterial titres were further reduced in
ETI triggering Pto AvrRpt2 and AvrRps4 strains (Yeo et al., 2015). However, inoculation levels
between different Pto strains were already significantly different at 0 hpi and consequently later
differences in the bacterial titres may arise from different starting inocula. Thus, it is unclear
whether the bacterial titres in E. salsugineum can be further reduced by additional ETI
responses.
The most obvious explanation for the observed inefficiency of flg22 to reduce Pto titres
in C. hirsuta and E. salsugineum might be that flg22 induced a less potent PTI in these species.
This is in line with the lower amplitude of transcriptional regulation at 24 h observed in C.
hirsuta and E. salsugineum compared to the other species (Figure 7A). However, marker gene
expression combined with Pto DC3000 growth assays in several Brassicaceae accessions and
sister species indicated that the latter correlation is not generally applicable and was likely
observed by chance (Supplement Figure 3). Moreover, SA was ruled out as a regulator of
sustained transcriptional responses in A. thaliana compared to E. salsugineum, since the sid2
mutant exhibits nearly unaltered transcriptional responses 18 h after flg22 treatment (Figure 8).
However, it cannot be ruled out that the lower transcriptional induction of many SA-responsive
genes observed in E salsugineum (Figure 7F) might influence the efficacy flg22-mediated
bacterial growth reduction.
3. Discussion
63
In C. rubella Pto hrcC was not able to grow, whereas Pto DC3000 grew normally in
mock condition. This might be explained by DC3000 effectors that modulate the apoplastic
space to make it habitable for the bacteria, e.g. by modifying the water status of the apoplast or
releasing nutrients from the plant, whereas Pto hrcC which lacks these functions might face an
unfavourable environment in the C. rubella apoplast that impedes its growth. For example, the
apoplastic water status is critical for Pto DC3000 proliferation and is actively modulated by the
two Pto DC3000 effectors HopM1 and AvrE1 which cause water soaking (Xin et al., 2016).
Thus, a lower water content in the C. rubella apoplast compared to the other Brassicaceae
species might be one possibility why Pto hrcC did not grow in C. rubella. In addition, multiple
results indicated that C. rubella might trigger a very strong PTI response since it induced SA
accumulation and exhibited the largest transcriptome changes early after flg22 treatment.
Moreover C. rubella might recognize additional MAMPs from Pto hrcC. Consequently, C.
rubella might trigger strong PTI responses upon Pto hrcC infection, that are sufficient to inhibit
Pto hrcC growth, in the absence flg22 pre-treatment.
3.3. Comparative transcriptomics after a defined stress – a dataset
advancing the field of comparative transcriptomics
In this thesis, I compared transcriptome responses of four Brassicaceae species during
flg22-triggered PTI. This enabled me to identify not only core genes, which conserved their
flg22-responsiveness during Brassicaceae evolution, but also species-specific expression
patterns. Since the rise of microarray technology, comparative transcriptomics between species
have been commonly used to reveal candidate genes regulating important traits or investigate
the correlation of expression changes to phenotypic differences, by defining conserved and
diversified gene regulations (Whitehead, 2012; Romero et al., 2012). Yet, this study extends
previous studies in various aspects.
Many studies compared gene expression levels in different species at the “basal” state
(Weber et al., 2004; Hammond et al., 2006; Davidson et al., 2012; Perry et al., 2012; Koenig et
al., 2013; Hunt et al., 2013; Whittle et al., 2014; Czaban et al., 2015; Morandin et al., 2016).
Some comparative transcriptome studies noted that biotic and abiotic stresses are main drivers
of expression variation between and within species (Koenig et al., 2013; Kawakatsu et al.,
2016). However, a comprehensive understanding how stress-induced transcriptomes differ
between species is lacking. The comparison of flg22-triggered transcriptional responses among
four Brassicaceae species addresses this previously unanswered question.

3. Discussion
64
Moreover, my experimental approach overcomes multiple concerns which complicate
interpretation of many previous comparative transcriptomic studies. Especially in animal
studies, multiple problems may introduce noise to gene expression variation which cannot be
distinguished from heritable variation (Romero et al., 2012). Usually, samples need to be taken
from dead organisms which did not live in the same controlled environments. It is conceivable
that a variety of uncontrollable factors including diet, disease and other environmental
influences, will introduce gene expression variation between species (Romero et al., 2012;
Breschi et al., 2017). I excluded these biases by growing the Brassicaceae species under the
same controlled environments, minimizing potential noise in gene-expression introduced by
environmental factors. Furthermore, by sampling all species at the same time of the day, I
excluded biases arising from circadian and diurnal gene regulations. These controlled
environmental conditions are important to measure gene expression differences with a genetic
basis (Voelckel et al., 2017). Thus, the substantial inter-species variation in gene induction that
I observed likely reflects genetically encoded variation across species.
Only a few studies compared transcriptional responses towards a stress between
different strains, ecotypes or species. For instance, transcriptome responses of different E.
salsugineum accessions during salt stress were characterized to find candidates genes mediating
salt-stress tolerance (Taji et al., 2004). Another study compared transcriptome responses of
different tomato varieties towards salt stress (Sun et al., 2010). However, in contrast to the four-
species comparison I used, the previous mentioned and many other studies used binary systems
comparing only two species or compared strains within a species (Mangelsen et al., 2011;
Lenka et al., 2011; Schroder et al., 2012; Zhang et al., 2014; Lindlöf et al., 2015; Yang et al.,
2015; Amrine et al., 2015; Clauw et al., 2015; Gleason and Burton, 2015; Van Veen et al.,
2016; Zhang et al., 2016; Mondragón-Palomino et al., 2017). Two species comparisons are
valuable to identify candidate genes mediating increased stress resistance, but cannot
distinguish neutral from adaptive expression evolution (Evans, 2015). In other words, it cannot
be interpreted whether expression changes are selectively neutral or of adaptive advantage for
these species. I compared stress-responsive transcriptome responses between four Brassicaceae
with a defined phylogenetic framework to fill this previously neglected knowledge gap in the
field of comparative transcriptomics.
A handful of studies compared stress-responsive expression changes in more than two
species. For example, cold-stress induced transcriptome responses of two Solanum species with
variable cold stress tolerance were compared to A. thaliana, identifying conserved cold stress
responses (Carvallo et al., 2011). Another study compared salt stress-responsive gene

3. Discussion
65
expression changes of six Lotus species differing in their salt tolerance and found only very few
conserved transcriptional responses, indicating a highly variable Lotus response to salt stress
(Sanchez et al., 2011). The conservation of low-oxygen stress induced transcriptomes was even
compared across four different kingdoms including plant, fungi, animal and bacterial
expression datasets (Mustroph et al., 2010). However, the first two studies both lack a clear
phylogenetic framework comparing either very distantly related species such as A. thaliana and
tomato or only very closely related species, whereas the third study compared only publicly
available datasets impeding comparability between different samples due to differences in
experimental conditions between samples. Thus, up to now there is no study comparing stress-
responsive transcriptomes across multiple species that include both closely- and distantly-
related species in the same experimental setup. Therefore, this dataset opens up the door for
more in-depth analysis regarding gene expression evolution among related species during stress
responses. For example, the data produced here can be further used to build up co-expression
networks and interfere ancestral gene regulatory networks of PTI.
3.3.1. Massive transcriptional reprogramming shows importance of flg22 induced
transcriptional reprogramming
Despite variation in hormone levels and flg22-triggered Pto DC3000 growth reduction,
flg22 treatment induced a massive early transcriptional reprogramming in all tested
Brassicaceae changing the expression of 2575 to 4209 DEGs (Figure 5). Most previous
publications investigating flg22-triggered transcriptional changes detected a smaller, but still
substantial number of DEGs ranging from approximately 1000 to 2500 DEGs at a single time-
point within the first hour after flg22 treatment (Zipfel et al., 2004; Denoux et al., 2008; Frei
dit Frey et al., 2014). In contrast, two more recent studies detected approximately 8500 or 7000
DEGs one or two hours after flg22 treatment and over 5800 DEGs one hour after elf18 treatment
of A. thaliana seedlings (Briggs et al., 2017; Birkenbihl et al., 2017). The large quantitative
differences between these studies are likely explained by a combination of different statistical
methods to determine DEGs and newer microarray or RNAseq technologies with higher
detection sensitivity. Similarly, the higher number of flg22-responsive genes here compared to
older microarray-based studies is likely explained by a higher detection sensitivity of the
RNAseq approach combined with the powerful statistical framework used in my analysis.
Previous flg22 transcriptome studies exclusively investigated transcriptional responses
within the first hours after treatment; hence a comparative dataset investigating later time-points
is lacking. However, RT-qPCR analysis in another study indicated that marker gene expression

3. Discussion
66
returns to basal expression levels about 24 h after flg22 treatment (Denoux et al., 2008). In
contrast, I still detected not only marker gene expression (Figure 8A, B, C) but also many DEGs
24 h after flg22 treatment (Figure 5B). A recent study investigated transcriptional responses to
elf18 or pep2 treatment 10 hpt and detected around 1100 DEGs or 400 DEGs, respectively
(Ross et al., 2014) This is within the same range as transcriptional responses detected at 9 h
after flg22 treatment here (Figure 5B). In contrast to previous studies I could show here that
especially in A. thaliana and C. rubella, there are still many genes differentially expressed at 9
and 24 h after flg22 treatment (Figure 5B). Importantly the number of DEGs as well as their
induction levels varied between different Brassicaceae suggesting that different temporal
dynamics in different species might play an important role in the adaptation of PTI responses
in different species. Although transcriptomic data for later time-points are missing for most
MAMPs, transcriptional responses of A. thaliana to Pto hrpA infection have been investigated
over an extensive time course (Lewis et al., 2015). Since Pto hrpA lacks functional effector
delivery, it resembles a PTI transcriptional response. This study revealed that some
transcriptional responses towards Pto hrpa are still sustained 17.5 h after inoculation but on the
other hand stated that from 11 h on no novel transcripts are regulated anymore. However, it is
difficult to compare this data with MAMP triggered transcriptome studies since we do not know
which MAMPs at which concentrations are present in the bacteria.
Interestingly, E. salsugineum induced a massive transcriptional reprogramming in
response to flg22, although flg22 did not trigger effective resistance against Pto DC3000 and
Pto hrcC. This opens up the question what selective pressures forced E. salsugineum to keep
this massive transcriptional response if it does not result in increased resistance against
pathogens. One possibility is that flg22-triggered transcriptional reprogramming does not lead
to inhibition of Pto growth but effectively limits the growth of other bacterial species. E.
salsugineum colonizes saline environments (Zhu, 2001; Inan et al., 2004; Wu et al., 2012). It is
conceivable that different types of microbial pathogens colonize these extreme environmental
conditions and consequently E. salsugineum adapted its defence responses downstream of
transcriptional reprogramming to these specific environments. For example, it was shown that
different sets of defence secondary metabolites are produced in E. salsugineum compared to A.
thaliana (Pedras and Adio, 2008; Pedras et al., 2010; Pedras and Zheng, 2010; Bednarek et al.,
2011), which might differentially affect interactions with bacterial pathogens.
Alternatively, pathogen pressure may be low in these extreme environments and
therefore E. salsugineum can afford a weaker defence against pathogens. The soil microbiome
composition varies with salinity and salt-stress was associated to shifts in the microbial

3. Discussion
67
communities of plants (Canfora et al., 2014; Yaish et al., 2016; Yang et al., 2016). Moreover,
it has been hypothesized that the plant microbiome plays important role in the salt-stress
adaptation of plants growing in saline environments (Ruppel et al., 2013; Qin et al., 2016).
Thus, conserved flg22 transcriptional responses in E. salsugineum might be required for
recruiting specific microbiota members. Consistently, several studies implicated a role of the
plant immune system to coordinate the establishment of microbiota (Hacquard et al., 2017). For
example, production of tryptophan-derived secondary metabolites in A. thaliana affects the
colonisation by beneficial fungal microbiota (Kei Hiruma et al., 2016). However, the role of
MAMP perception and PTI responses in the microbiota establishment is not well understood.
Future research will be required to understand the link between MAMP-triggered massive
transcriptional reprogramming and the establishment of functional microbiota.
3.3.2. Purifying selection conserved flg22-responsiveness of a core set of genes
during Brassicaceae evolution
Many studies investigated the massive transcriptional reprogramming triggered during
PTI (Navarro et al., 2004; Zipfel et al., 2004, 2006; Gust et al., 2007; Denoux et al., 2008; Rosli
et al., 2013; Lewis et al., 2015; Jacob et al., 2017; Briggs et al., 2017; Birkenbihl et al., 2017).
Nevertheless, we do not understand how essential and important these massive transcriptional
responses are for PTI. Genetically removing flg22-induced transcriptional reprogramming
would be desirable to test its relevance for plant-microbe interactions. However, flg22-induced
transcriptional reprogramming cannot be easily cancelled without severe side effects. Yet,
another way to test the importance of transcriptional responses during PTI is to investigate
whether they are precious enough to be conserved during evolution.
Indeed, over 800 genes conserved their flg22-responsiveness across the four tested
Brassicaceae indicating that a large part of the flg22-responsive transcriptome evolved under
purifying selection. In addition to the 868 genes which are differentially expressed after flg22
treatment in all species, many genes show qualitatively similar expression patterns between
species (Supplement Figure 4). The species-specific appearance of these genes in the Venn-
diagram (Figure 5C) is likely caused by the stringed cut-off criteria I applied. This strong
conservation of transcriptional responses over approximately 30 Mio years of Brassicaceae
evolution suggests that these transcriptional responses are essential for their fitness.
Many previous publications stated that large parts of expression patterns between
species are conserved by purifying selection (Rifkin et al., 2003; Lemos et al., 2005; Gilad et
al., 2006; Whitehead and Crawford, 2006; Romero et al., 2012). However, these publications
3. Discussion
68
compared expression variation between unstressed organisms. Thus, information about the
number of genes that are likely under purifying selection for their regulation during particular
stress responses is so far unknown. Unfortunately, many studies comparing stress responsive
transcriptomes between multiple species only used Venn-diagrams to compare the overlap of
DEGs and determine species-specific gene regulations (Carvallo et al., 2011; Sanchez et al.,
2011; Zhang et al., 2014). However, as it largely depends on significance cut-offs this approach
excludes important information on the similarity of gene expression changes between species.
Thus, in my view, it is not sufficient to solely rely on Venn-diagrams as justification to define
conserved or distinct gene expression across species. Therefore, this study provides the first
evidence that the regulation of many genes between related Brassicaceae during a complex
stress-response like PTI is stabilized by evolution and therefore likely crucial during their
evolution.
3.3.3. Regulatory mechanisms controlling conserved flg22-responsive
transcriptional reprogramming
Co-expressed genes are often regulated by similar mechanisms. Indeed, 5´regulatory
regions of conserved flg22-responsive genes were highly enriched for WRKY TF motifs
(Figure 14A, Supplement Table 4-7). Multiple previous publications found WRKY TF motifs
enriched in the 5´regulatory regions of MAMP responsive genes (Navarro et al., 2004; Zipfel
et al., 2004; Lewis et al., 2015; Jacob et al., 2017) and it is known that WRKY TF are key
regulators of plant immune transcriptional reprogramming (Pandey and Somssich, 2009; Tsuda
and Somssich, 2015; Li et al., 2016; Birkenbihl et al., 2017).
A recent study suggested that the fast and massive transcriptional response during PTI
might be partly mediated by de-repression (Jacob et al., 2017). Since treatment with the protein
synthesis inhibitor cycloheximide trigger very similar transcriptional changes as MAMP
treatments, the authors speculated that a block in the continuous protein synthesis of short-lived
transcriptional repressors might cause these similar cycloheximide and MAMP induced
transcription responses. Yet it is unclear what TFs or motifs might be connected to this potential
de-repression. A recent study investigating genome-wide binding sites of WKRY18, WRKY33
and WRKY40 by Chip-Seq experiments noted that WKRY33 and WRKY40 binding is
dependent on flg22 treatment, whereas WRKY18 binding was also detected in untreated A.
thaliana seedlings (Birkenbihl et al., 2017). However, the authors noted that this was likely
mediated by higher protein levels in their complementation lines and that flg22 treatment
increased binding of WRKY18 at previously bound sites. This suggests that these induced
3. Discussion
69
WRKY TFs are not bound to targets in the resting state but mainly bind upon MAMP elicitation.
However, the authors as well found several constitutively expressed WRKY TF that are bound
to target genes in untreated samples (personal communication with Imre Somssich). These
constitutively bound WRKYs seem to be replaced by induced WRKYs upon flg22 treatment.
Therefore, WRKY TFs might regulate PTI transcriptional responses by de-repression coupled
with activation, mediated by distinct WRKYs.
Just recently a calmodulin-binding transcriptional activator called CAMTA3 was
proposed to be involved in the early transcriptional reprogramming during PTI and ETI (Jacob
et al., 2017). However, although CAMTA motifs were overrepresented within the promoters of
immediate response genes not all of these genes exhibited this motif. Here, CAMTA TF-motifs
were as well slightly enriched in the regulatory regions of A. thaliana, C. rubella and C. hirsuta
in certain flg22-induced expression clusters (Supplement Table 4, 5, 6). Thus, CAMTA TF-
motifs seem to participate in the early transcriptional regulation of multiple Brassicaceae. In A.
thaliana, this was genetically proven by alterations of the flg22-induced transcriptional
responses in a dominant camta3-D mutant (Jacob et al., 2017). However, many flg22-
responsive genes lack a CAMTA motif and the enrichment of CAMTA motifs compared to
WRKY-motifs was comparably weak. Therefore, the exact role of CAMTA TFs in PTI needs
further experimentation.
Other regulatory mechanisms that mediate flg22-triggered transcriptional
reprogramming await their discoveries. The evolutionary conserved core set of flg22-
responsive genes provide an excellent resource to mine regulatory regions to discover
additional regulatory mechanisms. For instance, phylogenetic shadowing might help to identify
evolutionary conserved non-coding DNA regions in conserved flg22-responsive genes. When
non-coding gene regulatory DNA sequences, often in the proximity of transcriptional start sites,
show signs of purifying selection, they are likely important for gene regulation (Schranz et al.,
2007; Davies et al., 2015; Van de Velde et al., 2016). Identifying these conserved non-coding
DNA sequences will allow me to test whether they are required and/or sufficient for gene
regulation by, for instance, transient reporter assays or genetic manipulation analysis. These
analyses should provide new mechanistic insights how gene expression is regulated during PTI
and how gene regulatory mechanisms evolved in plants.
3. Discussion
70
3.3.4. Factors that might influence detection of species-specific expression
signatures
In contrast to the majority of DEGs whose flg22-responsive expression changes were
conserved by purifying selection across Brassicaceae, many genes exhibited species or lineage-
specific expression patterns (Figure 9, Figure 11). As described in previous sections, my
approach overcame several problematic issues faced by previous studies comparing multiple
species. However, there are still factors which can influence the results of comparative
transcriptomics and which should be considered when interpreting the data.
To compare transcriptomic responses generated by RNAseq between species,
orthologous genes need to be defined, which is not trivial (Li et al., 2003; Emms and Kelly,
2015; Tekaia, 2016; Nichio et al., 2017). In this study, we used the best reciprocal blast to define
1to1 orthologous genes among the Brassicaceae species. Although we carefully assigned 1to1
orthologs, we cannot fully exclude the possibility that some orthologous relationships were
misassigned. Especially for large gene families in which many genes share similar sequences,
wrong assignment of 1to1 orthologs could have been introduced. For instance, gene A and B
have similar sequences, yet only gene A is flg22-responsive. If gene A of species 1 and gene B
of species 2 are assigned as an orthologous pair, these genes show species-specific expression
patterns. However, my analysis showed that the size of gene families does not explain species-
specific expression patterns. I compared the size of gene families for each gene within each of
the 15 k-mean clusters determined for all DEGs (Supplement Figure 7). This analysis suggested
that the gene-family sizes of species-specific clusters did not differ from those clusters
exhibiting conserved flg22-responsive expression pattern and from all DEGs. Furthermore,
much less species-specific loss of gene regulation compared to the species-specific gain of gene
regulation suggests that the large numbers of species-specific gene regulation that I observed
are very unlikely artefacts. Thus, although individual misassignments cannot be fully excluded,
the majority of species-specific gene regulations is a true feature of the flg22 transcriptional
response among Brassicaceae species.
Another factor potentially affecting gene expression patterns in different species is
distinct developmental stages. Comparing species at the same age, one cannot fully exclude
that different developmental stages between species influence variation in gene expression
among those species. Hence, I used seedlings to minimize the effects of developmental
variation on transcriptome responses as proposed by another comparative transcriptome study
in plants (Koenig et al., 2013). Moreover, I focussed my analysis on relative expression changes
3. Discussion
71
between mock- and flg22-treated samples which further minimizes biases introduced by
variation in developmental stages. In addition, the comparison between A. thaliana accessions
revealed almost no accession-specific regulated genes although developmental differences
between these accessions are macroscopically visible (Figure 10D). Together these findings
make it unlikely that the substantial number of species-specific flg22-responsive genes is based
on developmental differences between seedlings. However, to fully exclude this possibility
additional experiments are needed to compare transcriptome responses at different
developmental stages e.g. on different days after germination and investigate whether similar
species-specific regulated genes can be detected independently of the developmental stage.
Species-specific expression signatures might reflect qualitative differences in the
transcriptome response to flg22 across Brassicaceae species. However, since I only took a
snapshot of the transcriptional response at 1 hpt I cannot exclude that diversified temporal
dynamics between the Brassicaceae species led to the detection of species-specific expression
changes at 1 hpt. To exclude this possibility a more stringent time-course experiment would be
needed, detecting transcriptome responses at multiple time-points around 1 hpt. However not
only qualitative differences in the transcriptional response, but also differences in the
transcriptional dynamics between Brassicaceae species might reflect adaptive processes during
Brassicaceae evolution.
3.3.5. Lineage-specific gene expression as a sign of adaptive evolution
Variation in gene expression between species might have arisen from two different
evolutionary processes. On one hand, gene expression changes between species might be
selectively neutral and accumulate with genetic drift over evolution. On the other hand, gene
expression changes might be adaptive. Indeed, expression changes between species have
previously been associated to adaptive advantages (López-maury et al., 2008; De Nadal et al.,
2011). Concerning sequence evolution, robust null models for neutral evolution exist to
adequately identify sequences affected by adaptive evolution (Yang and Bielawski, 2000;
Delport et al., 2009). However, there is still no consensus for an appropriate null hypothesis of
neutral gene expression evolution (Harrison et al., 2012; DeBiasse and Kelly, 2016).
The nature of current transcriptome data introduces multiple problems that complicate
the design of appropriate models. For example, expression data is largely affected by
environmental conditions (Romero et al., 2012). Therefore, especially when samples are taken
from different environments in nature, observed gene expression variation between species may
simply result from different environmental factors but not genetic differences (Romero et al.,

3. Discussion
72
2012; Voelckel et al., 2017). If this is not properly accounted for, gene expression variation that
is classed as heritable would be overestimated (Harrison et al., 2012). Thus, minimizing
environmental variation is crucial to model gene expression evolution. In this study, I
performed the experiments in the same experimental setup. Hence my dataset, as opposed to
ecological studies, provides a basis to analyse heritable gene expression variation between
species.
However, a major remaining problem for modelling gene expression evolution is the
relationship between genetic changes and expression changes. Whereas for coding sequence
evolution, it can be predicted which DNA mutations lead to altered protein sequences, which
is an important assumption for modelling coding sequence evolution (Gilad et al., 2006), it is
challenging to link genetic changes with gene expression (Harrison et al., 2012; Hodgins-Davis
et al., 2015). For example, changes in regulatory regions, alternative splicing, RNA stability,
or DNA methylation can have substantial influences on gene expression (De Nadal et al., 2011;
Romero et al., 2012; Voss and Hager, 2014). Consequently, these mechanisms would need to
be considered in appropriate models. Given these problems, it is not surprising that different
modelling approaches lead to a contrasting interpretation of gene expression evolution. For
example, Khaitovich et al. interpreted most expression changes between human and primates
as selectively neutral, whereas Gilad et al. proposed that most expression changes between
human and primates evolved under purifying selection (Khaitovich et al., 2004; Gilad et al.,
2006). For these reasons, I decided not to model gene expression evolution since these
modelling approaches are premature to robustly conclude gene expression evolution.
One alternative way to understand gene expression evolution is to assume that the
degree of expression variation should correlate with phylogenetic distance if expression
changes are neutral (Gilad et al., 2006; Romero et al., 2012; Harrison et al., 2012). When the
variation in expression changes is larger than expected from the phylogenetic distance, this
implies that some of these expression changes evolved under positive selection and are adaptive
(Romero et al., 2012; Harrison et al., 2012). Based on phylogeny, C. rubella is the closest
relative of A. thaliana among the Brassicaceae species included in this study. Therefore, we
would expect less variation in flg22-induced expression changes between C. rubella and A.
thaliana than those between A. thaliana and the other two Brassicaceae species if most
expression changes are neutral. However, flg22-induced expression changes in C. rubella are
most different from A. thaliana compared to the other Brassicaceae species (Figure 11A); hence
flg22-triggered expression changes in these species is incongruent with phylogeny. This
suggests that a large part of variation in flg22-triggered transcriptional reprogramming of

3. Discussion
73
Brassicaceae does not reflect neutral but adaptive evolution. Consequently, the lineage-specific
expression signatures observed in this study likely arose from directional selection and possibly
reflect adaptive evolutionary processes. These presumably adaptive gene expression changes
might be important for the individual Brassicaceae species to effectively deal with the diverse
microbial environments that they faced over million years of evolution.
3.3.6. Regulatory mechanisms affecting lineage-specific gene expression
To elucidate potential mechanisms regulating the lineage-specific expression changes,
I searched within the -500 bp 5´-regulatory regions of lineage-specific expression patterns for
an enrichment of known TF-motifs. Interestingly, A. thaliana specific expression signatures
were specifically enriched for WRKY TF binding motifs in A. thaliana regulatory regions but
not in regulatory regions of other Brassicaceae (Figure 14C). Similarly, genes specifically
induced by flg22 in E. salsugineum were highly enriched for WRKY TF motifs only in E.
salsugineum regulatory regions but not in other Brassicaceae species. In addition, C. rubella
regulatory regions were enriched for WRKY TF motifs only in genes which were specifically
highly induced in C. rubella (Figure 14C). Considering that WRKY TF motifs are commonly
enriched in the regulatory regions of all species (cluster 2,4,5) for evolutionary conserved flg22-
inducible genes, it is conceivable that at least some of the species-specific expression patterns
are mediated by the gain of WRKY TF-binding motif(s) within 500 bp 5’-regulatory regions of
these genes. Similarly, for the C. rubella-specific expression gene cluster, AHL12 and AHL25
binding sites were enriched only in C. rubella promoters but not in the other Brassicaceae
promoters. AHL TFs are conserved in land plants and have been mostly linked to plant
development (Zhao et al., 2013; Lou et al., 2014; Zhao et al., 2014). However, some AHL TFs
were shown to inhibit MAMP-induced gene expression. For instance, overexpression of AHL20
negatively regulated defence responses in A. thaliana (Lu et al., 2010b). In addition, our group
has recently found that multiple AHL TF-motifs are enriched in the promoters of immune-
upregulated genes and that expression of multiple AHL genes was repressed during immunity.
Together, these data suggest that repression of AHL TF might be coupled to upregulation of
MAMP responsive genes. This mechanism may explain C. rubella-specific regulation of flg22-
responsive genes.
However, by far not all species-specific expression changes can be explained by these
motifs. For example, for C. hirsuta specific expression changes, no enriched cis-regulatory
motifs were identified. This might have been caused by various reasons. My analysis was based
on enrichment of known motifs and therefore would not identify cis-regulatory motifs with low

3. Discussion
74
frequency in a set of regulatory sequences (multiple different mechanisms account for
individual gene expression) or novel regulatory motifs. In addition, I focussed my analysis on
regulatory regions, 500 bp upstream of transcriptional start sites, since previous studies
indicated that this region is generally conserved across related species and that functional cis-
regulatory motifs are often found within this region (Baxter et al., 2012; Korkuc et al., 2014;
Van de Velde et al., 2016; Yu et al., 2016). For example, many WRKY binding sites are found
within the first -400 bp from the transcriptional start site (Birkenbihl et al., 2017). Nevertheless,
this does not exclude that additional motifs, important for the species-specific flg22-responsive
expression regulation, are located outside this – 500 bp region. A more precise definition of
regions enriched for potential TF motifs might be advantageous to search for additional TF
motifs. This could be achieved by determining conserved non-coding regions in regulatory
sequences of DEGs among Brassicaceae species. Determination of conserved non-coding
regions in individual genes (sometimes called phylogenetic shadowing) has proven helpful to
elucidate regulatory motifs controlling gene expression (Herrero et al., 2012; Baxter et al.,
2012; Van de Velde et al., 2016). Unfortunately, the tools to determine conserved non-coding
regulatory regions have been designed to determine these regions in individual genes across
multiple species and are not yet designed to be applied to analysis of expression clusters
containing hundreds of DEGs.
Besides cis-regulatory motifs, other transcriptional regulatory mechanisms might affect
the species-specific expression patterns observed. Trans-regulatory mechanisms such as distant
enhancers or chromatin structure and modifications can have strong impacts on gene expression
(Tirosh et al., 2009; Field et al., 2009; Tsankov et al., 2010; Shi et al., 2012). Moreover,
differential RNA stability might affect species-specific expression patterns (Dori-Bachash et
al., 2011; Staiger et al., 2013). Taken together species-specific expression signatures are
probably regulated by a combination of different expression regulatory mechanisms and it is
conceivable that individual genes are not regulated by the same mechanisms. Nevertheless, the
gain of WRKY TF motifs in some of the species-specific flg22-responsive genes likely
contributes to their specific expression regulation.
3.3.7. Potential functions of species-specific expression signatures
My results indicated that at least some of the species-specific expression changes in
response to flg22 are a consequence of adaptive evolution. Therefore, some of these specific
gene inductions should provide fitness advantages in the specific environments where these
Brassicaceae species evolved. The functions of species-specific flg22-responsive genes might

3. Discussion
75
point to potential processes involved in this adaptation. However, in stark contrast to the
conserved flg22-responsive genes, only a few weakly overrepresented GO-terms could be
determined for A. thaliana and C. hirsuta specific expression signatures (when Brassicaceae
were analysed separately, Figure 9C, D) and no GO-terms were significantly enriched within
the species-specific expression signatures determined in the combined analysis of Brassicaceae
with A. thaliana accessions (Supplement Table 3). This suggests that potential adaptation
resulting from expression changes is not explained by a small number of dominant biological
processes but rather by a multitude of diverse biological processes. Alternatively, biological
functions of genes important for the adaptation of other Brassicaceae species might be still
unknown. Thus GO-terms of species-specific flg22-responsive genes might be poorly
annotated, since GO-term annotations heavily rely on A. thaliana research.
Identifying causal relationships between gene expression and phenotypes is a major
problem of comparative transcriptomics (Evans, 2015; Voelckel et al., 2017). One difficulty is
that complex and conditional phenotypes like PTI are often regulated by multitudes of genes,
each of which often fulfils a small contribution to the investigated phenotype (Feder and
Walser, 2005; MacKay et al., 2009), a phenomenon described “marginal benefit” hypothesis
(Thatcher et al., 1998). This may be one reason why I did not observe enrichment of a particular
biological process within the species-specific expression signatures. In addition, these
contributions might be detected only under certain circumstances e.g. when pathogens perturb
other components or in certain environmental conditions, known as the “contingent function”
hypothesis (Feder and Walser, 2005; Thatcher et al., 1998). Consequently, the function of these
genes for the investigated phenotype may not be uncovered in laboratory conditions. Thus,
functions for some of the species-specific flg22-responsive genes may be difficult to reveal
with genetic perturbation. For example, in yeast, it is known that perturbation of genes
upregulated by a certain stress often do not change the response to this stress (López-maury et
al., 2008; Giaever et al., 2014). Yet, the observation that some of the tested species-specific
expression responses are conserved within species or in sister species (Figure 12) suggests that
these are unlikely random observations but truly adaptive in nature.
Despite the absence of significantly enriched GO-terms, some genes in A. thaliana, C.
rubella and E. salsugineum specific expression clusters were connected to defence secondary
metabolism (Supplement Table 3). It is known that Brassicaceae plants are capable of
synthesizing a diverse set of often antimicrobial secondary metabolites that can function as
phytoanticipins or phytoalexins to protect plants from pathogen infection (Bednarek et al.,
2011; Piasecka et al., 2015). For example, 4-methoxy indol-3-ylmethylglucosinolate (4MI3G)

3. Discussion
76
or camalexin are two tryptophan-derived secondary metabolites which are important for A.
thaliana immunity (Thomma et al., 1999; Bednarek et al., 2009; Clay et al., 2009). 4MI3G
belongs to the group of tryptophan-derived indole-glucosinolates, which have been well
described in different Brassicaceae and whose pathway genes are activated by flg22 treatment
(Clay et al., 2009; Bednarek et al., 2011). Although indole-glucosinolates can be detected in
many Brassicaceae, a recent study did not detect any indole-glucosinolates in C. rubella
(Bednarek et al., 2011). Interestingly, several genes involved in indole-glucosinolate
metabolism are significantly stronger induced in C. rubella upon flg22 treatment but they are
very lowly expressed compared to the other Brassicaceae species in mock samples (Supplement
Figure 8). This is exemplified by the expression profile of MYB51 which encodes a major
transcriptional regulator of camalexin and indole-glucosinolate pathway genes (Gigolashvili et
al., 2007; Frerigmann et al., 2016). The low basal expression is in line with the previously
undetected indole glucosinolates, but why are these genes still induced by flg22 in C. rubella?
One explanation might be that the level of indole glucosinolates that are still produced by these
components in C. rubella are below the detection limit and that these components were
previously not detected does not allow the conclusion that these are not produced at all in C.
rubella. Another explanation is that some of these components might have diversified their
function to participate in the biosynthesis of new, potentially unknown, secondary metabolites.
It is known that these secondary metabolites can have a strong impact not only on defence
against pathogenic microbes (Bednarek et al., 2009; Rajniak et al., 2015; Piasecka et al., 2015)
but also on the recruitment of beneficial microbes potentially influencing the microbiome
composition (Kei Hiruma et al., 2016; Hacquard et al., 2017). Thus, gene expression evolution
for secondary metabolite genes suggests new innovations in secondary metabolite metabolisms
that might directly affect plant-microbe interactions thereby providing adaptive advantages.
3.3.8. Conservation of flg22-triggered transcriptional responses between A.
thaliana accessions was robust to a diverse geographic distribution and diversified
basal immune levels in certain accessions.
Despite variation in geographical distribution, genetic background and morphological
phenotype, the transcriptional responses 1 h after flg22 treatment are extremely conserved
among the five A. thaliana accessions (Figure 10F, G; Figure 11A, B). As discussed earlier
environment can have a strong impact on immunity e.g. abiotic stresses can sometimes supress
immune responses. However, my results indicate that adaptations of these A. thaliana
accessions, to the different environments, did not strongly associate with changes in the early

3. Discussion
77
transcriptional responses upon flg22 treatment. This is not obvious since some of the chosen
accessions exhibit very specific variation in immunity-related traits. For example, not only
expression of defence marker genes, but also resistance against Pto DC3000 is significantly
reduced in the No-0 accession compared to Col-0 (Gangappa et al., 2017). Moreover,
transcriptome profiling revealed that downregulated genes in No-0 compared to Col-0 are
enriched for defence-related GO terms. This is in agreement with the significantly increased
Pto DC3000 growth in No-0 compared to most other accessions (Figure 10H). Gy-0 constitutes
another accession with altered basal immunity since it carries a hyperactive ACD6 allele,
originally identified in the Est-1 accession. In Est-1, this allele leads to increased basal
immunity with the cost of negatively influencing growth and producing spontaneous necrosis
on fully developed leaves (Todesco et al., 2010). Consistently, I observed that adult Gy-0 plants
developed similar lesions and were significantly more resistant against Pto DC3000 compared
to Col-0 plants. Interestingly, these differences among A. thaliana accessions seem to be
uncoupled from flg22-induced inhibition of Pto DC3000 growth and early transcriptional
responses.
The high conservation of flg22-induced transcriptional responses among diverse A.
thaliana accessions might be specific for PTI or common for stress-induced transcriptome
responses. Two recent studies comparing transcriptomic responses after flooding stress or mild-
drought stress showed a similar degree of conservation to my study (Van Veen et al., 2016;
Clauw et al., 2015). Van Veen et al. investigated transcriptional responses to flooding stress
between eight A. thaliana accessions from diverse geographic regions. The magnitude of
transcriptome response to flg22 and to flooding stress was similar (2443 to 4372 DEGs affected
by flg22 and 2356 to 3102 DEGs affected by flooding, depending on accession). Although the
authors noted that the transcriptional response to flooding and darkness was very similar
between the eight A. thaliana accessions, 562 genes exhibited significant variation in their
response among the accessions. In comparison, I found 131 DEGs across the five tested A.
thaliana accessions in response to flg22 (Figure 11D). However, it is conceivable that the more
stringed significance cut-off applied in this study (padj < 0.01 compared to padj < 0.05) and the
different numbers of accessions included (five compared with eight) presumably explain the
different numbers of DEGs detected in these two studies. Thus, the degree of variation between
stress-induced transcriptomes compared across different A. thaliana accessions seems to be
moderate as well for flooding and darkness stress. Similarly, a recent study investigated
transcriptional variation in response to mild drought stress among six A. thaliana accessions
(Clauw et al., 2015). The authors detected 60 accession specific DEGs out of 439 DEGs in

3. Discussion
78
response to mild drought-stress. However, the authors noted that in pairwise tests between
accessions, none of the 60 accession-specific genes responded significantly different from all
other five accessions. This is in agreement to my analysis that identified only one gene in the
Can-0 accession with significantly different response to flg22 compared to all other four
accessions. These results indicate that the stress-responsive transcriptional reprogramming is
highly conserved between A. thaliana accessions.
3.3.9. Within and between species variation in gene expression – Interspecies
variation exceeds intra species variation
An important observation of this work was that inter-species transcriptome variation
exceeds intra-species variation in response to flg22. This suggests that short-term adaptation to
diverse environments within a species is not sufficient to diversify early transcriptional
responses during PTI and that longer evolutionary times between species led to increased flg22-
responsive transcriptome variation which reflects adaptive processes during Brassicaceae
evolution.
Research investigating transcriptome conservations within and between species is
currently scarce. Early studies in the animal field investigated transcriptome conservation
within and between species to identify genes evolving under neutral, purifying or positive
(adaptive) evolution (Oleksiak et al., 2002; Rifkin et al., 2003). Genes with little variation
within and between species are likely under purifying selection, whereas genes with little
variation within species but large variation between species evolved presumably under positive
selection. Genes with variable expression within and across species are probably affected by
neutral evolution and genetic drift (Harrison et al., 2012; Romero et al., 2012). Using this
assumption, a study on Drosophila noted that the majority of expression changes likely evolved
under purifying selection, while at the same time substantial number of expression changes
showed signs of positive evolution and a smaller subset was associated with neutral evolution
(Rifkin et al., 2003). In contrast, a study on killifish determined much more expression variation
within compared to between species suggesting that these expression changes evolved under
neutral evolution (Oleksiak et al., 2002). These opposing conclusions might be affected by the
effect of environment on gene expression noise discussed earlier. Alternatively, different modes
of gene expression evolution may exist in different species.
More recent studies found less expression variation between species in the same organ
than expression variation in different organs within species (Brawand et al., 2011; Gilad and
Mizrahi-Man, 2015; Uebbing et al., 2016). However, these studies investigated basal
3. Discussion
79
expression levels and it is not clear whether stress-induced expression changes show a high
organ specificity. Unfortunately, there are yet no transcriptome studies investigating expression
changes within and between plant species. Therefore, future studies will be required to
understand whether inter-species transcriptional variation exceeding intra-species
transcriptional variation is a general phenomenon for other species and whether it is restricted
to certain plant tissues or stress responses.
3.3.10. Specificity of lineage-specific flg22-responsive transcriptional
signatures
Expression profiles of selected genes showing species-specific expression signatures in
available accessions and sister species of the four tested Brassicaceae revealed that species-
specific expression signatures are mostly conserved among tested accessions and sister species
(Figure 12). These results strengthened my RNAseq analysis of species-specific innovations
and extended them to closely-related species in the case of C. rubella and E. salsugineum. This
suggests that some specific flg22-resposnsice expression changes might be lineage-specific
rather than species-specific. However, the C. hirsuta specific marker gene, orthologous to
AT3G60966, was also significantly induced in C. grandiflora. This suggests that a species-
specific innovation might occur independently in multiple species. Investigating transcriptome
responses of a larger set of sister species and accessions would certainly define the range of
conservation of species-specific innovations. Nevertheless, my study clearly showed that
species-specific expression signatures detected in the RNAseq are not peculiar phenotypes of
the accession that I picked but conserved features within species or related species. This is in
line with the high conservation of flg22-responsive transcriptome changes among A. thaliana
accessions.
Elf18 specifically triggered two out of three marker genes tested for C. rubella and E.
salsugineum, whereas the two C. hirsuta specific marker genes did not respond to elf18
treatment. This indicates that parts of the lineage-specific expression changes triggered by flg22
are common for elf18-induced PTI. A recent study indicated that despite strong correlation of
flg22 and elf18 activated transcriptome responses, a large number of genes exhibit a flg22-
specific response which was absent in elf18-treated seedlings (Briggs et al., 2017). Vice versa
much fewer genes were specifically responsive to elf18. Given these recent insights, it is not
surprising that only a subset of lineage-specific flg22-responsive genes was activated by elf18
in C. rubella and E. salsugineum. In the perspective of plant adaptation, diversified responses
to different MAMPs might be used by plants to fine tune their immunity depending on different

3. Discussion
80
ratios of MAMPs in microbial communities. It was recently hypothesized that the repertoire of
PRRs that can sense different MAMPs might be a driving factor of local adaptation to specific
microbial communities (Hacquard et al., 2017). Moreover, flg22 and elf18 have presumably
different accessibility for the host plant as flagellin is on the outside of bacterial cells, whereas
Ef-Tu is one of the most abundant proteins inside bacterial cells. Hence in a natural infection
context, it is likely that such MAMPs might be perceived in temporally distinct manner and
consequently trigger some specific responses that help the plant to distinguish the current state
of infection. These are potential reasons why species-specific flg22-specific transcriptome
responses might only be partly conserved for other MAMP triggered transcriptional responses.
It would be interesting to see whether similar species-specific responses can be also detected in
PTI triggered by different for example fungal-derived MAMPs like chitin.
Furthermore, an additional transcriptome analysis after heat-stress suggested that the
large transcriptome variation in flg22-response among Brassicaceae species is not specific for
PTI but can be rather a general phenomenon in early stress responsive transcriptomes.
Compared to the variation of flg22-induced transcriptome changes among Brassicaceae, the
heat-induced transcriptional changes were even more variable among the tested species with
large numbers of species-specific heat-responsive genes (Figure 16F, G). However, these heat-
stress RNAseq results must be analysed with caution since the mapping quality in some samples
was inferior compared to the flg22 dataset, potentially affected by lower RNA integrity
(Supplement Table 2). This probably lowered the number of reliably expressed genes, which
might have inflated the number species-specific expressed genes. Consequently, I re-analysed
the heat-stress data, normalizing expression data of all species together and excluding lowly
expressed genes. Excluding lowly expressed genes still resulted in a substantial number species-
specific heat stress-responsive expression changes (Supplement Figure 10). Thus, it is unlikely
that variation solely arose from RNA quality issues and therefore indicates that large variations
in early stress-responsive transcriptomes between different species are a more general
phenomenon. Since both biotic, as well as abiotic stress responses, are heavily affected by each
other and environmental conditions it is conceivable that these variations reflect genetically
encoded long-term adaptations to different environments which are still visible under controlled
growth conditions.
3.4. Connection of sequence and expression variation.
Several previous studies connected the variation at the expression level with the
diversification of DNA sequences (Hunt et al., 2013; Whittle et al., 2014; Necsulea and

3. Discussion
81
Kaessmann, 2014). In this study, we did not detect a clear correlation between them (Figure
16), suggesting that gene expression variation is uncoupled with protein coding sequence
divergence. In contrast, protein sequence evolution was associated with gene expression
variation between and within different fire ant species (Hunt et al., 2013). Another study
compared expression variation of sexual and vegetative tissues between the model fungal
species Neurospora crassa and Neurospora tetrasperma (Whittle et al., 2014). Comparison of
sexual tissues revealed a correlation between transcriptome and genome evolution, whereas in
vegetative tissues, expression variation was not connected with sequence variation between the
Neurospora species. This suggests that the positive relationship between expression and
sequence evolution is tissue dependent in some cases. Therefore, sampling whole seedlings
including different organs might have precluded the detection of a clear correlation between
expression variation and protein sequence variation. Separating different tissues like root and
shoot tissue might help future studies investigating this phenomenon in plants. Nevertheless,
several studies in the animal field did not detect a correlation of gene expression variation with
sequence variation (Renaut et al., 2012; Uebbing et al., 2016). Thus, it is still under debate
whether protein coding sequence evolution is correlated with gene expression evolution.
Another possible explanation why expression and coding sequence divergence did not
correlate might be that adaptive changes in sequences or expression present alternative routes
in response to selection pressure since expression changes might prevent negative pleiotropic
effects when sequences are constraint and vice versa (Shapiro et al., 2004; Harrison et al., 2012).
Consequently, expression evolution would allow plasticity for genes that are constraint for
sequence evolution. If this would be the case expression evolution and sequence evolution
would likely not be correlated with each other. Further studies investigating the relationship of
sequence evolution and expression evolution, on one hand, should incorporate more species
along a phylogenetic relationship and resolve the sampling for different organs and on the other
hand specifically investigate how expression behaves in genes with a constraint sequence
evolution.
3.5. Concluding remarks and future perspectives
Although PTI is crucial for plants to deal with pathogens surrounding them, the
conservation and evolution of PTI responses between species is poorly understood. In this
thesis, I investigated flg22-induced responses within A. thaliana and across multiple
Brassicaceae species with a defined phylogenetic framework.

3. Discussion
82
I found that all tested Brassicaceae species sensed flg22 and activated typical PTI
responses including MPK3/6 activation and seedling growth inhibition. Comparisons of
phytohormone levels between the Brassicaceae species showed substantial variation not only
on the basal level but also in their flg22-responsivness. Moreover, the flg22-induced reduction
of Pto growth was variable among Brassicaceae species. Investigating how flg22-treatment
affects interactions of Brassicaceae species with other pathogens, such as necrotrophic
pathogens, might clarify whether flg22 pre-treatment of E. salsugineum and C. hirsuta
effectively reduces pathogen growth or whether flg22 treatment elicits a weaker PTI response
in these species compared to the other Brassicaceae species. Moreover, elevated ABA levels in
E. salsugineum compared to other species might be connected to its extreme salt stress tolerance
and could affect PTI responses. Future experiments with aba2 mutants of E. salsugineum,
generated by CRISPR-Cas9 technology, will help to understand the role of ABA in the abiotic
stress tolerance as well as the potential influence on PTI responses in E. salsugineum.
It was previously unknown to what extent MAMP-responsive and more generally
stress-responsive transcriptional changes are conserved within and between species and how
gene expression evolved. Here I showed that most flg22-induced expression changes are
advantageous enough to be conserved over approximately 30 Mio years of evolution, since
speciation between the tested Brassicaceae occurred. This conservation indicates the
importance of this massive transcriptional reprogramming during PTI and suggests a pivotal
role of purifying selection on flg22-triggered transcriptomic responses. In addition, a
substantial number of genes exhibited a species/lineage-specific expression signature in the
early response to flg22. These specific expression patterns were absent in geographically and
genetically distinct A. thaliana accessions. Thus, inter-species exceeded intra-species
expression variation. Importantly, the expression variation between Brassicaceae was
incongruent with their phylogeny. In addition to the extremely conserved transcriptome
responses within A. thaliana this indicates that parts of the species-specific expression
signatures evolved adaptively. Moreover, heat stress also induced considerable expression
variation between species, suggesting that substantial inter-species variation might be a
common phenomenon of stress-induced transcriptomic responses. This thesis revealed
unprecedented insights into the evolution of flg22-triggered transcriptomic reprogramming and
provides the first dataset comparing stress-induced transcriptomes within and between species
with a defined phylogenetic framework in plants. This dataset can be utilized for subsequent
analyses such as the implementation of co-expression networks to infer ancestral expression
networks of PTI.
3. Discussion
83
The complex and conditional nature of PTI probably precluded the determination of
specific processes which might mediate the adaptive advantage of these specific expression
signatures, but diversification of secondary metabolism might be a possibility. An in-depth
analysis of secondary metabolites produced during PTI in different Brassicaceae might help to
connect expression changes with diversification in secondary metabolite synthesis.
Analysis of 5´regulatory regions indicated an important role of WRKY TF motifs, not
only in the regulation of conserved flg22-induced genes, but also in the gain of certain species-
specific expression changes. Determining conserved non-coding regions across Brassicaceae
species in regulatory sequences of conserved as well as species-specific flg22-responsive genes
will help to reveal additional regulatory mechanisms associated with conserved and species-
specific flg22-responsive genes.
To reach a comprehensive understanding of how plants interact with microbes in their
environment, we need to understand which of the plant responses to microbial invasion are
evolutionary conserved and how diversification of responses enables plants to adapt their
immune system to new environments. If we understand how plant responses are modified in
order to adapt and which responses are essential, we can apply this knowledge to tackle
upcoming challenges like climate change and improvement of crop production. However, we
are just beginning to understand how transcriptome responses evolve within and between plant
species and what impact diversifications might have on complex phenotypes such as PTI. This
study paves the way for future studies investigating consequences and molecular mechanisms
for gene expression evolution in the interaction of plants with microbes.

4. Material and Methods
84

4. Material and Methods
85
4. Material and Methods
4.1. Materials
4.1.1. Plant Material
Table 1: Brassicaceae species and accessions used in this study Bold entries indicate species used for RNAseq.
Species Accession Abbreviation Source Arabidopsis thaliana Col-0 Ath Kenichi Tsuda lab Arabidopsis lyrata MN47 Aly Hu et al., 2011 Capsella rubella N22697 Cru Slotte et al., 2013 Capsella grandiflora unknown Cgr Slotte et al., 2014 Cardamine hirsuta Oxford Chi Tsiantis/Janne Lempe Cardamine hirsuta OLI OLI Tsiantis/Janne Lempe Cardamine hirsuta GR2 GR2 Tsiantis/Janne Lempe Eutrema salsugineum Shandong Esa Tsiantis/Janne Lempe Eutrema salsugineum Yukon Eyt Tsiantis/Janne Lempe Thellungiella halophyla unknown Tha Shrenkiella parvula unknown Spa Dassanayake et al., 2011 Aethionema arabicum unknown Aar Haudry et al., 2013
Table 2: A. thaliana accessions used in this study Bold entries indicate accessions used for RNAseq.
Accession Cs number Country Admixture group1 Source An-1 CS76435 BEL admixed Jane Parker lab (MPIPZ) Bla-1 CS76451 ESP spain Jane Parker lab (MPIPZ) Can-0 CS76740 ESP relict Eric Kemen lab (MPIPZ) Col-0 CS76778 USA germany Eric Kemen lab (MPIPZ) CVI-0 CS76789 CPV relict Eric Kemen lab (MPIPZ) Edi-0 CS76831 UK admixed Eric Kemen lab (MPIPZ) Gy-0 CS78901 FRA western europe Jane Parker lab (MPIPZ) HR10 CS76940 UK western_europe Eric Kemen lab (MPIPZ) Kas-2 CS78905 IND asia Jane Parker lab (MPIPZ) Kn-0 CS76969 LTU central_europe Jane Parker lab (MPIPZ) Kondara CS76532 TJK asia Jane Parker lab (MPIPZ) Ms-0 CS76555 RUS asia Jane Parker lab (MPIPZ) No-0 CS77128 GER central_europe Eric Kemen lab (MPIPZ) Pna-17 CS76575 USA germany Eric Kemen lab (MPIPZ) Rsch4 CS77222 RUS germany Eric Kemen lab (MPIPZ) Se-0 CS76597 ESP spain Eric Kemen lab (MPIPZ) Sf-2 CS77247 ESP spain Eric Kemen lab (MPIPZ)
1 Admixture group based on 1001 genomes consortium Cell, 2016

4. Material and Methods
86
Accession Cs number Country Admixture group1 Source Sorbo CS78917 TJK asia Jane Parker lab (MPIPZ) Tamm-27 CS77341 FIN north_sweden Jane Parker lab (MPIPZ) Ts-1 CS76615 ESP spain Eric Kemen lab (MPIPZ) Tsu-0 CS77389 JPN admixed Eric Kemen lab (MPIPZ) Van-0 CS76623 CAN western_europe Eric Kemen lab (MPIPZ) Wil-2 CS78856 LTU central_europe Eric Kemen lab (MPIPZ) Wu-0 CS78858 GER germany Eric Kemen lab (MPIPZ)
Table 3: A. thaliana mutants used in this study
Species Mutant allele Locus Source Arabidopsis thaliana sid2-2 AT1G74710 Tsuda et al., 2008 Arabidopsis thaliana fls2 (SAIL_691C4) AT5G46330 Zipfel et al., 2004
4.1.2. Bacterial Material
Pseudomonas syringae pv. tomato DC3000 (Pto DC3000) and a Pto DC3000 mutant
lacking hrcC gene (Pto hrcC) were grown on NYGA agar plates for three days at 28°C. For
infection, the bacteria were transferred to liquid NYGA medium and incubated overnight at
28°C and 200 rpm until they reached an OD600 between 0.8 and 1.
4.1.3. Primer
All nucleotides in the table below were ordered from Sigma-Aldrich (Steinheim,
Germany)
Table 4: Primers used in this study
Name Locus Sequence (5'-3') qP_Br_ACT2_fw AT3G18780; Carubv10013961m;
CARHR094190.1; Thhalv10020949 TAAGGTCGTTGCACCACCTG
qP_Br_ACT2_rv AT3G18780; Carubv10013961m; CARHR094190.1; Thhalv10020949
GCTGGAATGTGCTGAGGGAA
qP_Br_WRKY29_fw AT4G23550, Carubv1000515, CARHR230930, Thhalv10025799
TCAAGAGCTGATCATATCCGAAT
qP_Br_WRKY29_rv AT4G23550, Carubv1000515, CARHR230930, Thhalv10025799
GCGTCCGACAACAGATTCTC
qP_At_PROPEP3_fw AT5G64905 CTTGCGATCTTTCGTCATCA qP_At_PROPEP3_rv AT5G64905 GTTCTTCCCTCTCGCTTTGA qP_Cr_PROPEP3_fw Carubv10027429 TCTTCATCTCACAGCGAGGA qP_Cr_PROPEP3_rv Carubv10027429 TGGGCCTACTCTTCTGCAAC qP_Es_PROPEP3_fw Thhalv10005182 CGACCGTTGAAATCACAGAG qP_Es_PROPEP3_rv Thhalv10005182 TTTTGCCTCCTTTTCCTGAG qP_Ch_PROPEP3_fw CARHR278940.1 TGAGGAAGATGAGGGTATGGTT qP_Ch_PROPEP3_rv CARHR278940.1 GTTTTCCTGTGCTTGGTGGT qP_AtCg_PR4_fw AT3G04720.1; Cagra.9490s0001.1 TAGTGGACCAATGCAGCAAC qP_AtCg_PR4_rv AT3G04720.1; Cagra.9490s0001.1 AGATGGCCTTGTTGATAGCC
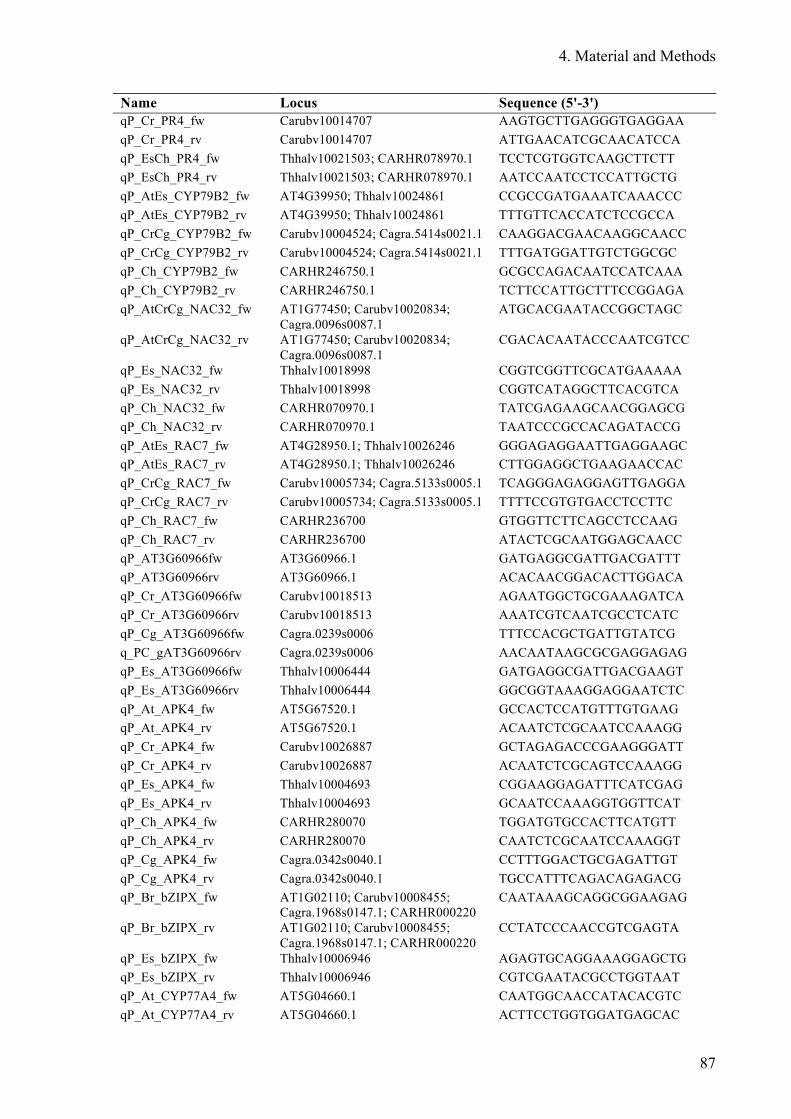
4. Material and Methods
87
Name Locus Sequence (5'-3') qP_Cr_PR4_fw Carubv10014707 AAGTGCTTGAGGGTGAGGAA qP_Cr_PR4_rv Carubv10014707 ATTGAACATCGCAACATCCA qP_EsCh_PR4_fw Thhalv10021503; CARHR078970.1 TCCTCGTGGTCAAGCTTCTT qP_EsCh_PR4_rv Thhalv10021503; CARHR078970.1 AATCCAATCCTCCATTGCTG qP_AtEs_CYP79B2_fw AT4G39950; Thhalv10024861 CCGCCGATGAAATCAAACCC qP_AtEs_CYP79B2_rv AT4G39950; Thhalv10024861 TTTGTTCACCATCTCCGCCA qP_CrCg_CYP79B2_fw Carubv10004524; Cagra.5414s0021.1 CAAGGACGAACAAGGCAACC qP_CrCg_CYP79B2_rv Carubv10004524; Cagra.5414s0021.1 TTTGATGGATTGTCTGGCGC qP_Ch_CYP79B2_fw CARHR246750.1 GCGCCAGACAATCCATCAAA qP_Ch_CYP79B2_rv CARHR246750.1 TCTTCCATTGCTTTCCGGAGA qP_AtCrCg_NAC32_fw AT1G77450; Carubv10020834;
Cagra.0096s0087.1 ATGCACGAATACCGGCTAGC
qP_AtCrCg_NAC32_rv AT1G77450; Carubv10020834; Cagra.0096s0087.1
CGACACAATACCCAATCGTCC
qP_Es_NAC32_fw Thhalv10018998 CGGTCGGTTCGCATGAAAAA qP_Es_NAC32_rv Thhalv10018998 CGGTCATAGGCTTCACGTCA qP_Ch_NAC32_fw CARHR070970.1 TATCGAGAAGCAACGGAGCG qP_Ch_NAC32_rv CARHR070970.1 TAATCCCGCCACAGATACCG qP_AtEs_RAC7_fw AT4G28950.1; Thhalv10026246 GGGAGAGGAATTGAGGAAGC qP_AtEs_RAC7_rv AT4G28950.1; Thhalv10026246 CTTGGAGGCTGAAGAACCAC qP_CrCg_RAC7_fw Carubv10005734; Cagra.5133s0005.1 TCAGGGAGAGGAGTTGAGGA qP_CrCg_RAC7_rv Carubv10005734; Cagra.5133s0005.1 TTTTCCGTGTGACCTCCTTC qP_Ch_RAC7_fw CARHR236700 GTGGTTCTTCAGCCTCCAAG qP_Ch_RAC7_rv CARHR236700 ATACTCGCAATGGAGCAACC qP_AT3G60966fw AT3G60966.1 GATGAGGCGATTGACGATTT qP_AT3G60966rv AT3G60966.1 ACACAACGGACACTTGGACA qP_Cr_AT3G60966fw Carubv10018513 AGAATGGCTGCGAAAGATCA qP_Cr_AT3G60966rv Carubv10018513 AAATCGTCAATCGCCTCATC qP_Cg_AT3G60966fw Cagra.0239s0006 TTTCCACGCTGATTGTATCG q_PC_gAT3G60966rv Cagra.0239s0006 AACAATAAGCGCGAGGAGAG qP_Es_AT3G60966fw Thhalv10006444 GATGAGGCGATTGACGAAGT qP_Es_AT3G60966rv Thhalv10006444 GGCGGTAAAGGAGGAATCTC qP_At_APK4_fw AT5G67520.1 GCCACTCCATGTTTGTGAAG qP_At_APK4_rv AT5G67520.1 ACAATCTCGCAATCCAAAGG qP_Cr_APK4_fw Carubv10026887 GCTAGAGACCCGAAGGGATT qP_Cr_APK4_rv Carubv10026887 ACAATCTCGCAGTCCAAAGG qP_Es_APK4_fw Thhalv10004693 CGGAAGGAGATTTCATCGAG qP_Es_APK4_rv Thhalv10004693 GCAATCCAAAGGTGGTTCAT qP_Ch_APK4_fw CARHR280070 TGGATGTGCCACTTCATGTT qP_Ch_APK4_rv CARHR280070 CAATCTCGCAATCCAAAGGT qP_Cg_APK4_fw Cagra.0342s0040.1 CCTTTGGACTGCGAGATTGT qP_Cg_APK4_rv Cagra.0342s0040.1 TGCCATTTCAGACAGAGACG qP_Br_bZIPX_fw AT1G02110; Carubv10008455;
Cagra.1968s0147.1; CARHR000220 CAATAAAGCAGGCGGAAGAG
qP_Br_bZIPX_rv AT1G02110; Carubv10008455; Cagra.1968s0147.1; CARHR000220
CCTATCCCAACCGTCGAGTA
qP_Es_bZIPX_fw Thhalv10006946 AGAGTGCAGGAAAGGAGCTG qP_Es_bZIPX_rv Thhalv10006946 CGTCGAATACGCCTGGTAAT qP_At_CYP77A4_fw AT5G04660.1 CAATGGCAACCATACACGTC qP_At_CYP77A4_rv AT5G04660.1 ACTTCCTGGTGGATGAGCAC

4. Material and Methods
88
Name Locus Sequence (5'-3') qP_CrCg_CYP77A4_fw Carubv10003366 GATCTGTCCAGGGCTTACGA qP_CrCg_CYP77A4_rv Carubv10003366 CGGCGAAATCAATCTCACTT qP_Es_CYP77A4_fw Thhalv10016078 GGTTCAGGAGTTCGAGTGGA qP_Es_CYP77A4_rv Thhalv10016078 AACGGGTTCTTCATCACCAC qP_Ch_CYP77A4_fw CARHR208640.1 GTGTTGGCCGTAGGATCTGT qP_Ch_CYP77A4_rv CARHR208640.1 ATACGCGCTCCACTCAAACT Pto_OPRF_fw NC_004578.1 AACTGAAAAACACCTTGGGC Pto_OPRF_rv NC_004578.1 CCTGGGTTGTTGAAGTGGTA
4.1.4. Genes described in this study
Table 5: Genes described in this study
Abbreviation Full name AGI AGB1 GTP BINDING PROTEIN BETA 1 AT4G34460 AGG1 GGAMMA-SUBUNIT 1 AT3G63420 APK4 ADENOSINE-5-PHOSPHOSULFATE KINASE 4 AT5G67520 ASB1 ANTHRANILATE SYNTHASE BETA SUBUNIT 1 AT1G25220 BAK1 BRI1-ASSOCIATED RECEPTOR KINASE AT4G33430 BIK1 BOTRYTIS-INDUCED KINASE1 AT2G39660 BSK1 BRASSINOSTEROID-SIGNALING KINASE 1 AT4G35230 CAD1 CADMIUM SENSITIVE 1 AT5G44070 CBP60g CAM-BINDING PROTEIN 60-LIKE G AT5G26920 CERK1 CHITIN ELICITOR RECEPTOR KINASE 1 AT3G21630 CPK28 CALCIUM-DEPENDENT PROTEIN KINASE 28 AT5G66210 CYP77A4 CYTOCHROM P450 FAMILY PROTEIN 77A4 AT5G04660 CYP79B2 CYTOCHROM P450 FAMILY PROTEIN 79B2 AT4G39950 DORN1 DOES NOT RESPOND TO NUCLEOTIDES 1 AT5G60300 EFR EF-TU RECEPTOR AT5G20480 FER FERONIA AT3G51550 FLS2 FLAGELLIN-SENSITIVE 2 AT5G46330 IGMT5 INDOLE GLUCOSINOLATE O-METHYLTRANSFERASE 5 AT1G76790 IOS1 IMPAIRED OOMYCETE SUSCEPTIBILITY 1 AT1G51800 LLG1 LORELEI-LIKE-GPI-ANCHORED PROTEIN 1 AT5G56170 LORE IPOOLIGOSACCHARIDE-SPECIFIC REDUCED ELICITATION AT1G61380 LYK5 LYSM-CONTAINING RECEPTOR-LIKE KINASE 5 AT2G33580 LYM1 LYSM DOMAIN GPI-ANCHORED PROTEIN 1 PRECURSOR AT1G21880 LYM3 LYSIN-MOTIF DOMAIN PROTEIN 3 AT1G77630 MKKK7 MITOGEN-ACTIVATED PROTEIN KINASE KINASE KINASE 7 AT3G13530 MYB51 MYB DOMAIN PROTEIN 51 AT1G18570 NAC32 NAC DOMAIN CONTAINING PROTEIN 32 AT1G77450 NPR1 NONEXPRESSER OF PR GENES 1 AT1G64280 PBL27 PBS1-LIKE KINASE 27 AT5G18610 PBS3 AVRPPHB SUSCEPTIBLE 3 AT5G13320 PCRK1 PTI COMPROMISED RECEPTOR-LIKE CYTOPLASMIC KINASE 1 AT3G09830 PCRK2 PTI COMPROMISED RECEPTOR-LIKE CYTOPLASMIC KINASE 2 AT5G03320 PEN3 PENETRATION 3 AT1G59870 PEPR1 PEP1 RECEPTOR 1 AT1G73080

4. Material and Methods
89
Abbreviation Full name AGI PEPR2 PEP1 RECEPTOR 2 AT1G17750 PP2A SERINE/THREONINE PROTEIN PHOSPHATASE 2A AT1G69960 PP2C38 PROTEIN PHOSPHATASE 2C 38 AT3G12620 PR4 PATHOGENESIS-RELATED 4 AT3G04720 PUB12 PLANT U-BOX 12 AT2G28830 PUB13 PLANT U-BOX 13 AT3G46510 RAC7 RAC-LIKE GTPASE 7 AT4G28950 RLP23 RECEPTOR LIKE PROTEIN 23 AT2G32680 RLP30 RECEPTOR LIKE PROTEIN 30 AT3G05360 RPOPEP3 ELICITOR PEPTIDE 3 PRECURSOR AT5G64905 SARD1 SAR DEFICIENT 1 AT1G73805 SOBIR1 SUPPRESSOR OF BIR1 AT2G31880 TSA1 TRYPTOPHAN SYNTHASE ALPHA CHAIN 1 AT3G54640 TSB1 TRYPTOPHAN SYNTHASE BETA-SUBUNIT 1 AT5G54810 WRKY29 AT4G23550 XLG2 EXTRA-LARGE GTP-BINDING PROTEIN 2 AT4G34390
ASB1, TSA1, TSB1, CYP79B2/B3, MYB51, PEN3, and IGMT5
4.1.5. Chemicals, Kits, Enzymes and Buffers
Table 6: Chemicals used in this study
Chemical Company Rifampicin Duchefa (Haarlem, Netherlands) Salicylic acid (SA) Duchefa (Haarlem, Netherlands) Abscisic acid (ABA) Sigma-Aldrich (St. Louis, USA) Tween 20 Sigma-Aldrich (St. Louis, USA) TritonX Sigma-Aldrich (St. Louis, USA) NaClO Sigma-Aldrich (St. Louis, USA) flg22 EZBiolab Inc. (Westfield, USA) elf18 EZBiolab Inc. (Westfield, USA) peqGOLD TriFastTM Peqlab (Darmstadt, Germany) L-012 Wako Chemicals (Neuss, Germany) EvaGreen DNA Dye Biotium (Hayward, USA)
Table 7: Kits used in this study
Kit Company FastDNATM Spin Kit for Soil MP Biomedicals (USA, Santa Ana) Coomassie Protein assay Biorad (Hercules, USA)
Table 8: Enzymes used in this study
Enzyme Company SuperScript II Reverse Transcriptase ThermoFischer Scientific (USA, Waltham) SuperScript IV Reverse Transcriptase ThermoFischer Scientific (USA, Waltham) T7 Endonuclease I NewEnglandBiolabs (USA, Ipswich)

4. Material and Methods
90
Enzyme Company RNAse OUT Thermo Scientific (USA, Waltham) DNaseI Roche (Mannheim, Germany)
Table 9: Media and Buffers
Name Components NYGA (pH 7.0) 2% (v/v) glycerol
0.5% (w/v) Bactopeptone 0.3% (w/v) yeast extract (1% (w/v) bacto agar)
Murashige and Skoog Medium (MS) Agar 2.45 g/L M&S Medium (Duchefa, Netherlands) 1% Sucrose 0.5% Plant Agar (Duchefa, Netherlands) pH 5.8
MAPK Extraction Buffer
50 mM Tris-HCL [pH 7.5] 5 mM EDTA 5 mM EGTA 2 mM DTT 10 mM NaF 50 mM b-glycerolphosphate 10% glycerol Complete proteinase inhibitor (Roche, Germany) Phosstop phosphatase inhibitor (Roche, Germany)
PAGE Buffer 25 mM Tris 190 mM Glycin 0.1% (w/v) SDS
Blotting Buffer 3.03 g/L Tris 14.41 g/L Glycin 800 ml milipore water 200 ml methanol
TBS (10x) 23.23 g/L Tris 80.6 g/L NaCl adjusted pH to 7.6 with HCL
TBST 100 ml 10xTBS 900 ml Milipore water 1 ml Tween20
PCR Buffer (10x) 200 mM tris-HCL (pH 8.8) 100 mM KCl 100 mM (NH4)2SO4
20 mM MgCl2 10% Triton X100
4.2. Methods
4.2.1. Plant Growth
Seeds were sterilized by vortexing in 70% ethanol for 5 min and then 6% NaClO for 10
min, washed 5 times with sterile water and stratified in sterile water for five to seven days.
Sterilized seeds were grown on ½ Murashige and Skoog (MS)-Agar plates and grown in
Percival growth chamber (CU-36LX5D, Percival, USA) at 22 °C, 10 h L/D for eleven days if
not stated otherwise. Eleven-day-old seedlings were transferred to liquid ½ MS-Medium (same

4. Material and Methods
91
composition as MS-Agar) one day before chemical treatments. Alternatively, 12-day-old
seedlings were transferred to commercial soil (Stender, Schermbeck Germany) and grown at
23 °C/20 °C with 10 h/14 h (light/dark) and 60% relative humidity. Soil-grown-plants were
transferred to another chamber at 22 °C with a 12 h photoperiod and 60% relative humidity
three days before bacterial inoculation.
4.2.2. Flg22 and heat-stress treatment
Eleven-day-old seedlings were transferred from ½ MS-Agar to 24-well plates each with
1.6 ml of ½ MS-Medium 24 h prior to treatments. If not otherwise stated, five to ten seedlings
per sample were transferred to each well. For the flg22 treatment, 800 µl of 3 µM flg22 solution
was added to the medium containing the seedlings resulting in a final concentration of 1 µM
flg22. For the heat treatment, the whole 24-well plate was transferred for one hour to another
growth chamber at 22°C (control) or 38°C without light. Three wells were combined for one
sample to reduce experimental variance when the seedlings were harvested in liquid nitrogen
at indicated time points. The samples were stored at –80°C until use.
4.2.3. Seedling growth inhibition assay
Seven-day-old seedlings grown on ½ MS-Agar were transferred to 1.6 ml of ½-MS-
Medium with and without 1 µM flg22 and grown for another 12 days in these solutions. Then,
the fresh weight of 12 pooled seedlings was measured. The experiment was independently
repeated three times and statistics were calculated with log2-transformed fresh weight values.
This experiment was performed by Shajahan Anver.
4.2.4. Hormone quantification
Phytohormone extraction and quantification was performed in the lab of
Hitoshi Sakakibara at the Riken institute Japan as previously described (Kojima and
Sakakibara, 2012).
4.2.5. Bacterial Growth Assays
For preparation of bacterial inoculum, Pseudomonas syringae pv. tomato DC3000 (Pto
DC3000) or the T3SS deficient Pto DC3000 mutant Pto hrcC was grown on NYGA agar
containing 25 µg/ml rifampicin for 3 days at 28°C. Then, bacterial strains were transferred to
liquid NYGA medium containing 25 µg/ml rifampicin and incubated over night at 28°C with
4. Material and Methods
92
shaking at 200 rpm to a final OD600 between 0.8 and 1. The bacteria were pelleted by
centrifugation at 5000 rpm and washed twice with sterile 5 mM MgSO4 before diluting the
bacteria to an OD600 of 0.0002 or 0.001 for Pto DC3000 and Pto hrcC, respectively.
Four to five-week-old plants were used. Two leaves per plant were infiltrated with 1
µM flg22 or sterile water (mock) using a needleless syringe. One day later, leaves treated with
flg22 or mock solution were infiltrated at early afternoon with the bacterial suspension. Two
days after bacterial infiltration, two leaf disks (0.565 cm2) per sample from two leaves were
crushed in 400 µl sterile MgSO4 using a Retsch mixer mill. Dilution series were made and
streaked on NYGY agar plates containing 25 µg/ml rifampicin. The plates were incubated for
two days at 28°C before colony forming units (cfu) were counted.
Alternatively, bacterial growth was quantified using a qPCR based method as
previously described (Ross and Somssich, 2016). In brief, DNA of Pto infiltrated leaves was
extracted using a FastDNATM Spin Kit from (MP biomedicals). Extracted DNA was quantified
and adjusted to 8.75 µg/µl to achieve a final concentration of 35 µg DNA in a qPCR reaction.
Bacterial DNA was quantified using the Pto specific OPRF gene relative to plant ACTIN2
(ACT2) DNA. ∆Ct values were calculated subtracting the target gene expression from ACT2
expression and statistics were calculated using these ∆Ct values which correspond to log2
expression values of a gene of interest relative to ACTIN2.
4.2.6. MAP kinase phosphorylation assay
MAPK3/4/6 phosphorylation assay was performed as previously described (Tsuda et
al., 2009). In short, 12-day-old seedlings were treated with 1 µM flg22 or mock for 15 min,
frozen in liquid nitrogen and ground with four metal beads in a Retsch MM 400 mixing mill
(Retsch, Germany). Then 150 µl of MAPK extraction buffer was added to the sample and
protein was extracted by centrifugation at 4°C and 12000 rpm. Protein concentrations were
determined by Coomassie Protein Assay Kit with an albumin starndard curve (both
ThermoFisher Scientific, USA) and 25 µg of protein was separated by SDS-PAGE for one hour
at 100V. MAPK phosphorylation was detected via Immunoblotting using an antiphospho-
p44/42 MAPK antibody (dilution 1:5000 in TBST, Cell Signaling Technology, USA) as first
and HRP-conjugated anti-rabbit IgG (1:10000 in TBST, Sigma-Aldrich, USA) as second
antibody. Luminescence was detected using supersignal west femto chemiluminescent reagent
(Thermo Fisher Scientific) and a ChemiDoc MP imaging system (Biorad, USA).

4. Material and Methods
93
4.2.7. RNA extraction, cDNA synthesis and RT-qPCR
Seedling samples were ground in 2 mL Eppendorf reaction tubes with 4 metal beads
using a Retsch MM 400 mixing mill (Retsch, Germany). RNA was extracted using peqGOLD
TriFastTM with an additional DNA digestion step using DNase I (Roche, Germany). Further,
RNA was precipitated overnight at 4°C in 100% ethanol containing 115 mM Na-Ac (pH 5.2;
Sigma Aldrich, Germany) to further clean up and increase RNA yield. RNA quality and
quantity was determined using a NanoDrop photometer (Thermo Fisher Scientific).
Subsequently cDNA was synthesized from 4000 ng DNAse-treated total RNA using oligo
dT(20) primers and Superscript II or IV reverse transcriptase according to manufactures
instructions. The 20 µl cDNA yielded were further diluted with RNAse free water to 200 µl.
For the qPCR, 4 µl of diluted cDNA was used with the master mix described in table 8. qPCR
was performed on a CFX Connect Real-Time PCR Detection System (Biorad, USA) using
EvaGreen. The qPCR cycle program is depicted in table 9. The target gene was quantified
relative to the expression of ACTIN2 (ACT2) from Arabidopsis or other Brassicaceae. ∆Ct
values were calculated subtracting the Ct value for the target from that for ACT2 expression.
These ∆Ct values, which correspond to log2 expression values of a gene of interest relative to
ACTIN2, were further used for statistical analysis.
Table 10: qPCR Master Mix
Compound Volume 10x PCR buffer 2.5 µl 10 mM dNTPs 0.5 µl EvaGreen DNA Dye 1.25 µl 2.5 µM primer forward 2 µl 2.5 µM primer reverse 2 µl Hommade Taq polymerase 0.5 µl
Table 11: qPCR cycling program
PCR step Time Temperature Initial denaturation 3 min 95 °C Denaturation Annealing x40 Elongation
15 sec 95 °C 30 sec 60 °C 30 sec 72 °C
Final elongation 1 min 55 °C Melting curve 10 sec/step 55 – 95 °C in 0.5 °C steps
4.2.8. Statistical analysis
Statistical analysis of RT-qPCR, bacterial growth assays and seedlings growth
inhibition was performed using a mixed linear model function lmer implemented in the lme4
4. Material and Methods
94
package within the R environment. To meet assumptions of the mixed linear model, we log
transformed raw data when needed. The following model was fit to the data:
measurementgyr = GYgy + Rr + egyr, where GY equals the genotype:treatment interaction, R
equals independent replicate and e equals a residual factor. The p-values obtained from the
mixed linear model were corrected for multiple testing calculating the false discovery rate using
the qvalue (v.2.4.2) package. The obtained q-values were used to assign significant differences
to the mean estimate values using the multcompLetters function of the multcompView package
(v.0.1-0) with a q-value threshold <0.01 if not otherwise stated.
4.2.9. RNAseq: sequencing, read mapping and read counting
The RNA quality was checked with a capillary electrophoresis method using an Agilent
2100 Bioanalyzer or Caliper LabChip GX device. Library preparation, including polyA
enrichment of total RNA samples, was performed by the Max Planck Genome Centre (Cologne,
Germany). The libraries were sequenced with single 100 bp (A. thaliana Col-0, C. rubella, C.
hirsuta, E. salsugineum) or 150 bp reads (A. thaliana accessions except Col-0) using Illumina
HiSeq2500 or HiSeq3000 platform, respectively. After quality control, raw sequencing reads
were mapped to respective reference genomes (Table 12) using TopHat2 (v2.1.1) with default
parameters except from parameters described in (Table 13). The resulting .bam files were used
to count the number of reads per gene using HtSeq (v 0.6.0) software with default parameters.
To exclude biases caused by mapping sequence reads of different A. thaliana accessions to the
Col-0 genome, mapping genome files for each A. thaliana accession were created by correcting
the Col-0 reference genome with SNP data available for these accessions. The variants table
for each accession was downloaded from the website of 1001 Genomes Project
intersection_snp_short_indel_vcf V3.1 dataset. The pseudo-genome sequence of each
accession was inferred by replacing the reference allele with the corresponding alternative allele
using the getGenomeSequence function implemented in software AnnotationLiftOver
(https://github.com/baoxingsong/AnnotationLiftOver). Further general feature format files
(GFF) were created by projecting the coordinates of the TAIR10 gene annotations to the
coordinates of each accession with the function gffCoordinateLiftOver of AnnotationLiftOver.
The SNP corrected genome files and GFF files were created by Baoxing Song. With these files,
a second mapping was performed. As these two mapping methods had only marginal effects on
gene expression patterns (Supplemental Figure 8), the further analyses were performed using
data mapped to the Col-0 reference genome for A. thaliana accessions.

4. Material and Methods
95
Table 12: Reference genomes used for RNAseq analysis
Species Reference genome publication Source Arabidopsis thaliana TAIR 10 Lamesch et al., 2012 Phytozome 10 Ath accessions TAIR 10 Lamesch et al., 2012 Phytozome 10 Ath accessions SNP corrected TAIR10 This study Capsella rubella v1.0 Slotte et al., 2013 Phytozome 10 Cardamine hirsuta v1.0 Gan et al., 2016 Miltos Tsiantis Eutrema salsugineum v1.0 Yang et al., 2013 Phytozome 10
Table 13: Tophat2 parameters used for mapping RNAseq reads
TopHat2 parameter Value --read mismatches 10 -- read-gap-length 10 -- read-edit-dist 20 --min-anchor-length 5 --splice-mismatches 2 --min-intron-length 30 --max-intron-length 1000 --max-insertion-length 20 --max-deletion-length 20 --max-multihits 10 --segment-mismatches 3 --min-coverage-intron 30 --max-coverage-intron 10000 --library-type fr-firstrand --b2 very sensitive
4.2.10. Bioinformatics analysis of RNAseq data
The readcounts determined by Htseq were analysed in the R environment (v.3.3.1) using
the edgeR (version 3.14.0) and limma (version 3.28.14) packages. Lowly expressed genes were
excluded from analysis by filtering out genes with a mean readcount below 10 counts per
sample. Then reads were normalized using TMM normalization embedded in the edge R
package and the data was log2 transformed using voom function within the limma package
resulting in log2-counts per million. For individual analysis of Brassicaceae species and
A. thaliana accession data, a linear model was fit to each gene using the lmFit function of limma
with the following terms: Sgyr = GYgy + Rr + ɛgyr, where S, log2 expression value, GY,
genotype:treatment interaction, and random factors; R, biological replicate; ɛ, residual. For the
combined analysis of Brassicaceae species and A. thaliana accession data the replicate effect
was removed from the linear model resulting in the following terms: Sgy = GYgy + ɛgy.
For variance shrinkage of calculated p-values, eBayes function of limma was used. The
resulting p-values were corrected for multiple testing by calculating the false discovery rate (or

4. Material and Methods
96
q-value) using the qvalue (v.2.4.2) package. Genes with a q-value < 0.01 and fold change >2
compared to control samples were defined as differentially expressed genes (DEGs).
Normalization and determination of DEGs were performed separately for each
Brassicaceae species and each A. thaliana accession. To compare expression changes mediated
by flg22 between Brassicaceae species, Best Reciprocal Blast was used to determine genes
having a 1to1 ortholog to a corresponding A. thaliana gene and genes which have a 1to1
ortholog in all Brassicaceae species were kept. This resulted in a set of 17857 1to1 ortholog
genes. The analysis of A. thaliana accessions was restricted to the same set of 17857 genes to
enable a direct comparison of results obtained from Brassicaceae species and A. thaliana
accessions analysis (E.g. comparing numbers of overlapping genes in Venn Diagrams of Figure
2C and 5F). To directly compare Brassicaceae species with A. thaliana accessions, the set of
17857 ortholog genes was used to normalize and determine DEGs for all 1 h samples together..
This approach enables us as well to compare basal expression levels between Brassicaceae
species and A. thaliana accessions.
The R-packages and software used for further analysis of the sequencing data are listed
in Table 14. The expression clusters of DEGs determined for the combined RNAseq analysis
of A. thaliana accessions together with Brassicaceae species were investigated for enrichment
of GO-terms corresponding to biological processes using BinGO plugin within the Cytoscape
environment. GO-term enrichment was calculated using a Hypergeometric test followed by a
Benjamini and Hochberg False Discovery Rate correction implemented in the BinGO plugin.
The whole annotation was used as a background.
Known TF-motifs enriched in individual expression clusters of DEGs determined for
the combined RNAseq analysis of A. thaliana accessions together with Brassicaceae species
were determined using the AME tool within the MEME suite. Therefore 5’-regulory-regions -
500 bp upstream of the transcription start site were extracted for each tested Brassicaceae
species. Enrichment of TF-motifs was determined in each of the 15 k-mean clusters for all
tested Brassicaceae species using 500 bp 5’regulatory-regions of all expressed genes having a
clear 1to1 ortholog (16100) as background. Known TF-motifs were retrieved from the Jaspar
core plants (2018) database that is implemented in AME.
To compare amino acid sequence conservation with expression variation, all amino acid
sequences of expressed genes with 1to1 orthologs in all species were extracted for each
Brassicaceae species. The sequences were aligned using Clustal Omega and percent identity
matrices were extracted. The amino acid sequence identity output of Clustal Omega was used
to calculate the mean amino acid identity across C. rubella, C. hirsuta and E. salsugineum
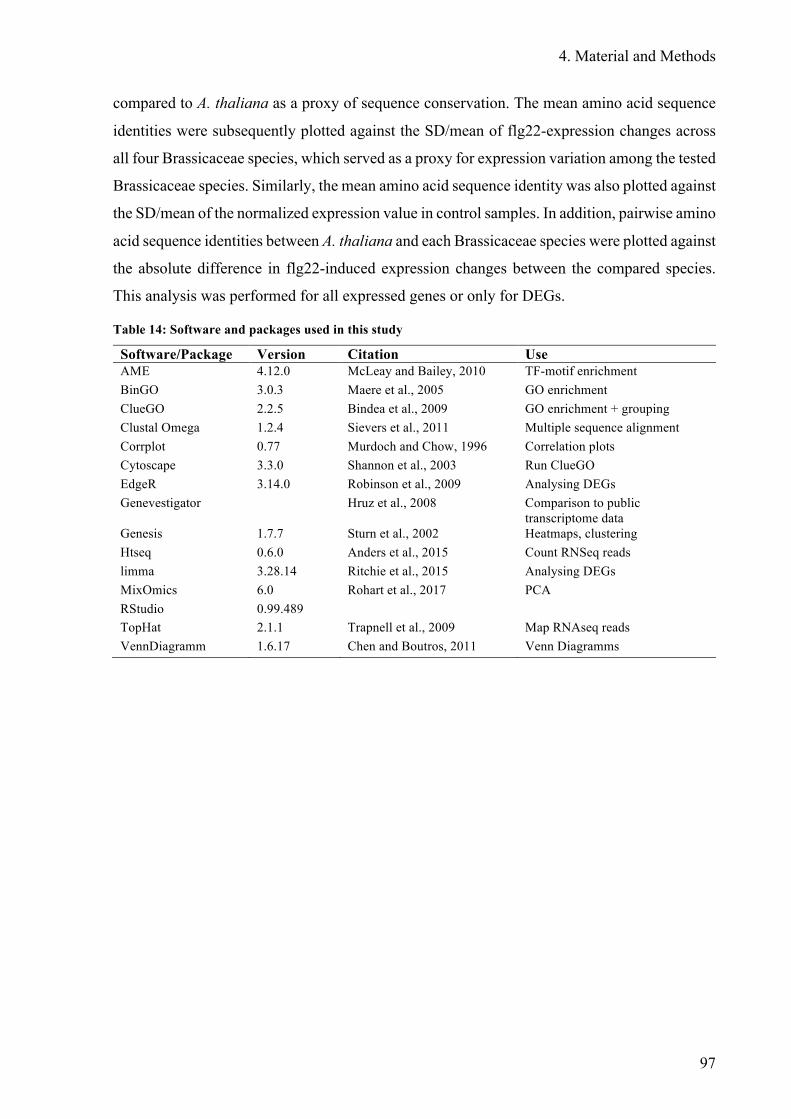
4. Material and Methods
97
compared to A. thaliana as a proxy of sequence conservation. The mean amino acid sequence
identities were subsequently plotted against the SD/mean of flg22-expression changes across
all four Brassicaceae species, which served as a proxy for expression variation among the tested
Brassicaceae species. Similarly, the mean amino acid sequence identity was also plotted against
the SD/mean of the normalized expression value in control samples. In addition, pairwise amino
acid sequence identities between A. thaliana and each Brassicaceae species were plotted against
the absolute difference in flg22-induced expression changes between the compared species.
This analysis was performed for all expressed genes or only for DEGs.
Table 14: Software and packages used in this study
Software/Package Version Citation Use AME 4.12.0 McLeay and Bailey, 2010 TF-motif enrichment BinGO 3.0.3 Maere et al., 2005 GO enrichment ClueGO 2.2.5 Bindea et al., 2009 GO enrichment + grouping Clustal Omega 1.2.4 Sievers et al., 2011 Multiple sequence alignment Corrplot 0.77 Murdoch and Chow, 1996 Correlation plots Cytoscape 3.3.0 Shannon et al., 2003 Run ClueGO EdgeR 3.14.0 Robinson et al., 2009 Analysing DEGs Genevestigator Hruz et al., 2008 Comparison to public
transcriptome data Genesis 1.7.7 Sturn et al., 2002 Heatmaps, clustering Htseq 0.6.0 Anders et al., 2015 Count RNSeq reads limma 3.28.14 Ritchie et al., 2015 Analysing DEGs MixOmics 6.0 Rohart et al., 2017 PCA RStudio 0.99.489 TopHat 2.1.1 Trapnell et al., 2009 Map RNAseq reads VennDiagramm 1.6.17 Chen and Boutros, 2011 Venn Diagramms

5. References
98
5. References
Abramovitch, R.B., Janjusevic, R., Stebbins, C.E., and Martin, G.B. (2006). Type III effector AvrPtoB requires intrinsic E3 ubiquitin ligase activity to suppress plant cell death and immunity. Proc. Natl. Acad. Sci. 103: 2851–2856.
Adie, B.A.T., Perez-Perez, J., Perez-Perez, M.M., Godoy, M., Sanchez-Serrano, J.-J., Schmelz, E.A., and Solano, R. (2007). ABA Is an Essential Signal for Plant Resistance to Pathogens Affecting JA Biosynthesis and the Activation of Defenses in Arabidopsis. Plant Cell 19: 1665–1681.
Agler, M.T., Ruhe, J., Kroll, S., Morhenn, C., Kim, S.T., Weigel, D., and Kemen, E.M. (2016). Microbial Hub Taxa Link Host and Abiotic Factors to Plant Microbiome Variation. PLoS Biol. 14: e1002352.
Albert, I. et al. (2015). An RLP23-SOBIR1-BAK1 complex mediates NLP-triggered immunity. Nat. Plants 1: 15140.
Alvarez, M., Schrey, A.W., and Richards, C.L. (2015). Ten years of transcriptomics in wild populations: what have we learned about their ecology and evolution? Mol. Ecol. 24: 710–725.
Amrine, K.C.H., Blanco-Ulate, B., Riaz, S., Pap, D., Jones, L., Figueroa-Balderas, R., Walker, M.A., and Cantu, D. (2015). Comparative transcriptomics of Central Asian Vitis vinifera accessions reveals distinct defense strategies against powdery mildew. Hortic. Res. 2: 15037.
Anders, S., Pyl, P.T., and Huber, W. (2015). HTSeq-A Python framework to work with high-throughput sequencing data. Bioinformatics 31: 166–169.
Anver, S. and Tsuda, K. (2015). Ethylene and Plant Immunity. In Ethylene in Plants (Springer Netherlands: Dordrecht), pp. 205–221.
Asai, T., Tena, G., Plotnikova, J., Willmann, M.R., Chiu, W.-L., Gomez-Gomez, L., Boller, T., Ausubel, F.M., and Sheen, J. (2002). MAP kinase signalling cascade in Arabidopsis innate immunity. Nature 415: 977–983.
Ashfield, T. et al. (2012). Evolution of a Complex Disease Resistance Gene Cluster in Diploid Phaseolus and Tetraploid Glycine. PLANT Physiol. 159: 336–354.
Asselbergh, B., Vleesschauwer, D. De, and Höfte, M.M. (2008). Global Switches and Fine-Tuning-ABA modulates Plant Pathogen Defense. Mol. Plant. Microbe. Interact. 21: 709–719.
Bar, M., Sharfman, M., Ron, M., and Avni, A. (2010). BAK1 is required for the attenuation of ethylene-inducing xylanase (Eix)-induced defense responses by the decoy receptor LeEix1. Plant J. 63: 791–800.
Baxter, L., Jironkin, A., Hickman, R., Moore, J., Barrington, C., Krusche, P., Dyer, N.P., Buchanan-Wollaston, V., Tiskin, A., Beynon, J., Denby, K., and Ott, S. (2012). Conserved Noncoding Sequences Highlight Shared Components of Regulatory Networks in Dicotyledonous Plants. Plant Cell 24: 3949–3965.
Beckers, G.J.M., Jaskiewicz, M., Liu, Y., Underwood, W.R., He, S.Y., Zhang, S., and Conrath, U. (2009). Mitogen-Activated Protein Kinases 3 and 6 Are Required for Full Priming of Stress Responses in Arabidopsis thaliana. Plant Cell 21: 944–953.
Bednarek, P., Piślewska-Bednarek, M., Ver Loren van Themaat, E., Maddula, R.K., Svatoš, A., and Schulze-Lefert, P. (2011). Conservation and clade-specific diversification of pathogen-inducible tryptophan and indole glucosinolate metabolism in Arabidopsis thaliana relatives. New Phytol. 192: 713–26.
Bednarek, P., Piślewska-Bednarek, M., Svatoš, A., Schneider, B., Doubský, J., Mansurova, M., Humphry, M., Consonni, C., Panstruga, R., Sanchez-Vallet, A., Molina, A., and Schulze-Lefert, P. (2009). A glucosinolate metabolism pathway in living plant cells mediates broad-spectrum antifungal defense. Science 323: 101–106.
Belkhadir, Y., Jaillais, Y., Epple, P., Balsemao-Pires, E., Dangl, J.L., and Chory, J. (2012). Brassinosteroids modulate the efficiency of plant immune responses to microbe-associated molecular patterns. Proc. Natl. Acad. Sci. 109: 297–302.
Belkhadir, Y., Yang, L., Hetzel, J., Dangl, J.L., and Chory, J. (2014). The growth-defense pivot: Crisis management in plants mediated by LRR-RK surface receptors. Trends Biochem. Sci. 39:

5. References
99
447–456. Berens, M.L., Berry, H.M., Mine, A., Argueso, C.T., and Tsuda, K. (2017). Evolution of Hormone
Signaling Networks in Plant Defense. Annu. Rev. Phytopathol 55: 401–25. Bigeard, J., Colcombet, J., and Hirt, H. (2015). Signaling mechanisms in pattern-triggered immunity
(PTI). Mol. Plant 8: 521–39. Bindea, G., Mlecnik, B., Hackl, H., Charoentong, P., Tosolini, M., Kirilovsky, A., Fridman, W.H.,
Pagès, F., Trajanoski, Z., and Galon, J. (2009). ClueGO: A Cytoscape plug-in to decipher functionally grouped gene ontology and pathway annotation networks. Bioinformatics 25: 1091–1093.
Birkenbihl, R.P., Kracher, B., and Somssich, I.E. (2017). Induced Genome-Wide Binding of Three Arabidopsis WRKY Transcription Factors during Early MAMP-Triggered Immunity. Plant Cell 29: 20–38.
Blume, B., Nürnberger, T., Nass, N., and Scheel, D. (2000). Receptor-Mediated Increase in Cytoplasmic Free Calcium Required for Activation of Pathogen Defense in Parsley. Plant Cell 12: 1425–1440.
Böhm, H., Albert, I., Oome, S., Raaymakers, T.M., Van den Ackerveken, G., and Nürnberger, T. (2014). A Conserved Peptide Pattern from a Widespread Microbial Virulence Factor Triggers Pattern-Induced Immunity in Arabidopsis. PLoS Pathog. 10: e1004491.
Boller, T. and Felix, G. (2009). A Renaissance of Elicitors: Perception of Microbe-Associated Molecular Patterns and Danger Signals by Pattern-Recognition Receptors. Annu. Rev. Plant Biol. 60: 379–406.
Boudsocq, M., Willmann, M.R., McCormack, M., Lee, H., Shan, L., He, P., Bush, J., Cheng, S.-H., and Sheen, J. (2010). Differential innate immune signalling via Ca2+ sensor protein kinases. Nature 464: 418–422.
Brautigam, A. et al. (2011). An mRNA Blueprint for C4 Photosynthesis Derived from Comparative Transcriptomics of Closely Related C3 and C4 Species. PLANT Physiol. 155: 142–156.
Brawand, D. et al. (2011). The evolution of gene expression levels in mammalian organs. Nature 478: 343–348.
Breschi, A., Gingeras, T.R., and Guigó, R. (2017). Comparative transcriptomics in human and mouse. Nat. Rev. Genet. 18: 425–440.
Briggs, A.G., Adams-Phillips, L.C., Keppler, B.D., Zebell, S.G., Arend, K.C., Apfelbaum, A.A., Smith, J.A., and Bent, A.F. (2017). A transcriptomics approach uncovers novel roles for poly(ADP-ribosyl)ation in the basal defense response in Arabidopsis thaliana. PLoS One 12: e0190268.
Broadley, M.R., White, P.J., Hammond, J.P., Graham, N.S., Bowen, H.C., Emmerson, Z.F., Fray, R.G., Iannetta, P.P.M., McNicol, J.W., and May, S.T. (2008). Evidence of neutral transcriptome evolution in plants. New Phytol. 180: 587–593.
Brooks, D.M., Bender, C.L., and Kunkel, B.N. (2005). The Pseudomonas syringae phytotoxin coronatine promotes virulence by overcoming salicylic acid-dependent defences in Arabidopsis thaliana. Mol. Plant Pathol. 6: 629–39.
Buckley, B.A. (2007). Comparative environmental genomics in non-model species: using heterologous hybridization to DNA-based microarrays. J. Exp. Biol. 210: 1602–1606.
Bulgarelli, D., Schlaeppi, K., Spaepen, S., van Themaat, E.V.L., and Schulze-Lefert, P. (2013). Structure and Functions of the Bacterial Microbiota of Plants. Annu. Rev. Plant Biol. 64: 807–838.
Cai, R. et al. (2011). The plant pathogen pseudomonas syringae pv. tomato is genetically monomorphic and under strong selection to evade tomato immunity. PLoS Pathog. 7: e1002130.
Campos, M.L., Kang, J.H., and Howe, G.A. (2014). Jasmonate-Triggered Plant Immunity. J. Chem. Ecol. 40: 657–675.
Canfora, L., Bacci, G., Pinzari, F., Lo Papa, G., Dazzi, C., and Benedetti, A. (2014). Salinity and Bacterial Diversity: To What Extent Does the Concentration of Salt Affect the Bacterial Community in a Saline Soil? PLoS One 9: e106662.
Cao, Y., Aceti, D.J., Sabat, G., Song, J., Makino, S. ichi, Fox, B.G., and Bent, A.F. (2013). Mutations in FLS2 Ser-938 Dissect Signaling Activation in FLS2-Mediated Arabidopsis Immunity. PLoS Pathog. 9: e1003313.
Cao, Y., Liang, Y., Tanaka, K., Nguyen, C.T., Jedrzejczak, R.P., Joachimiak, A., and Stacey, G. (2014). The kinase LYK5 is a major chitin receptor in Arabidopsis and forms a chitin-induced

5. References
100
complex with related kinase CERK1. Elife 3: e03766. Carvallo, M.A., Pino, M.-T., Jeknic, Z., Zou, C., Doherty, C.J., Shiu, S.-H., Chen, T.H.H., and
Thomashow, M.F. (2011). A comparison of the low temperature transcriptomes and CBF regulons of three plant species that differ in freezing tolerance: Solanum commersonii, Solanum tuberosum, and Arabidopsis thaliana. J. Exp. Bot. 62: 3807–19.
Chen, H. et al. (2017). A Bacterial Type III Effector Targets the Master Regulator of Salicylic Acid Signaling, NPR1, to Subvert Plant Immunity. Cell Host Microbe 22: 1–12.
Chen, H. and Boutros, P.C. (2011). VennDiagram: A package for the generation of highly-customizable Venn and Euler diagrams in R. BMC Bioinformatics 12: 35.
Cheng, W., Munkvold, K.R., Gao, H., Mathieu, J., Schwizer, S., Wang, S., Yan, Y. Bin, Wang, J., Martin, G.B., and Chai, J. (2011). Structural analysis of pseudomonas syringae AvrPtoB bound to host BAK1 reveals two similar kinase-interacting domains in a type III effector. Cell Host Microbe 10: 616–626.
Chinchilla, D. (2006). The Arabidopsis Receptor Kinase FLS2 Binds flg22 and Determines the Specificity of Flagellin Perception. PLANT CELL ONLINE 18: 465–476.
Chinchilla, D., Shan, L., He, P., de Vries, S., and Kemmerling, B. (2009). One for all: the receptor-associated kinase BAK1. Trends Plant Sci. 14: 535–541.
Chinchilla, D., Zipfel, C., Robatzek, S., Kemmerling, B., Nürnberger, T., Jones, J.D.G., Felix, G., and Boller, T. (2007). A flagellin-induced complex of the receptor FLS2 and BAK1 initiates plant defence. Nature 448: 497–500.
Clarke, C.R., Chinchilla, D., Hind, S.R., Taguchi, F., Miki, R., Ichinose, Y., Martin, G.B., Leman, S., Felix, G., and Vinatzer, B.A. (2013). Allelic variation in two distinct Pseudomonas syringae flagellin epitopes modulates the strength of plant immune responses but not bacterial motility. New Phytol. 200: 847–860.
Clauw, P., Coppens, F., De Beuf, K., Dhondt, S., Van Daele, T., Maleux, K., Storme, V., Clement, L., Gonzalez, N., and Inzé, D. (2015). Leaf Responses to Mild Drought Stress in Natural Variants of Arabidopsis. Plant Physiol. 167: 800–816.
Clay, N.K., Adio, A.M., Denoux, C., Jander, G., and Ausubel, F.M. (2009). Glucosinolate metabolites required for an Arabidopsis innate immune response. Science 323: 95–101.
Couto, D. et al. (2016). The Arabidopsis Protein Phosphatase PP2C38 Negatively Regulates the Central Immune Kinase BIK1. PLoS Pathog. 12: e1005811.
Couto, D. and Zipfel, C. (2016). Regulation of pattern recognition receptor signalling in plants. Nat. Rev. Immunol. 16: 537–552.
Cui, H., Tsuda, K., and Parker, J.E. (2015). Effector-Triggered Immunity: From Pathogen Perception to Robust Defense. Annu. Rev. Plant Biol. 66: 487–511.
Czaban, A., Sharma, S., Byrne, S.L., Spannagl, M., Mayer, K.F.X., and Asp, T. (2015). Comparative transcriptome analysis within the Lolium/Festuca species complex reveals high sequence conservation. BMC Genomics 16: 249.
Dassanayake, M., Oh, D.-H., Haas, J.S., Hernandez, A., Hong, H., Ali, S., Yun, D.-J., Bressan, R. a, Zhu, J.-K., Bohnert, H.J., and Cheeseman, J.M. (2011). The genome of the extremophile crucifer Thellungiella parvula. Nat. Genet. 43: 913–8.
Davidson, R.M., Gowda, M., Moghe, G., Lin, H., Vaillancourt, B., Shiu, S.-H., Jiang, N., and Robin Buell, C. (2012). Comparative transcriptomics of three Poaceae species reveals patterns of gene expression evolution. Plant J. 71: 492–502.
Davidsson, P., Broberg, M., Kariola, T., Sipari, N., Pirhonen, M., and Palva, E.T. (2017). Short oligogalacturonides induce pathogen resistance-associated gene expression in Arabidopsis thaliana. BMC Plant Biol. 17: 1–19.
Davies, N.J., Krusche, P., Tauber, E., and Ott, S. (2015). Analysis of 5’ gene regions reveals extraordinary conservation of novel non-coding sequences in a wide range of animals. BMC Evol. Biol. 15: 227.
DeBiasse, M.B. and Kelly, M.W. (2016). Plastic and Evolved Responses to Global Change: What Can We Learn from Comparative Transcriptomics?: Table 1. J. Hered. 107: 71–81.
Delport, W., Scheffler, K., and Seoighe, C. (2009). Models of coding sequence evolution. Brief. Bioinform. 10: 97–109.
Denoux, C., Galletti, R., Mammarella, N., Gopalan, S., Werck, D., De Lorenzo, G., Ferrari, S., Ausubel, F.M., and Dewdney, J. (2008). Activation of defense response pathways by OGs and

5. References
101
Flg22 elicitors in Arabidopsis seedlings. Mol. Plant 1: 423–445. Ding, Y., Dommel, M., and Mou, Z. (2016). Abscisic acid promotes proteasome-mediated degradation
of the transcription coactivator NPR1 in Arabidopsis thaliana. Plant J. 86: 20–34. Van der Does, D., Leon-Reyes, A., Koornneef, A., Van Verk, M.C., Rodenburg, N., Pauwels, L.,
Goossens, A., Körbes, A.P., Memelink, J., Ritsema, T., Van Wees, S.C.M., and Pieterse, C.M.J. (2013). Salicylic acid suppresses jasmonic acid signaling downstream of SCFCOI1-JAZ by targeting GCC promoter motifs via transcription factor ORA59. Plant Cell 25: 744–61.
Dong, S. et al. (2014). Effector Specialization in a Lineage of the Irish Potato Famine Pathogen. Science 343: 552–555.
Dori-Bachash, M., Shema, E., and Tirosh, I. (2011). Coupled evolution of transcription and mRNA degradation. PLoS Biol. 9: e1001106.
Dunning, F.M., Sun, W., Jansen, K.L., Helft, L., and Bent, A.F. (2007). Identification and Mutational Analysis of Arabidopsis FLS2 Leucine-Rich Repeat Domain Residues That Contribute to Flagellin Perception. Plant Cell 19: 3297–3313.
Edger, P.P. et al. (2015). The butterfly plant arms-race escalated by gene and genome duplications. Proc. Natl. Acad. Sci. 112: 8362–8366.
Emms, D.M. and Kelly, S. (2015). OrthoFinder: solving fundamental biases in whole genome comparisons dramatically improves orthogroup inference accuracy. Genome Biol. 16: 157.
Enard, W. et al. (2002). Intra- and interspecific variation in primate gene expression patterns. Science 296: 340–343.
Evans, T.G. (2015). Considerations for the use of transcriptomics in identifying the “genes that matter” for environmental adaptation. J. Exp. Biol. 218: 1925–1935.
Fan, J., Hill, L., Crooks, C., Doerner, P., and Lamb, C. (2009). Abscisic Acid Has a Key Role in Modulating Diverse Plant-Pathogen Interactions. PLANT Physiol. 150: 1750–1761.
Feder, M.E. and Walser, J.-C. (2005). The biological limitations of transcriptomics in elucidating stress and stress responses. J. Evol. Biol. 18: 901–910.
Felix, G., Duran, J.D., Volko, S., and Boller, T. (1999). Plants have a sensitive perception system for the most conserved domain of bacterial flagellin. Plant J. 18: 265–276.
Field, Y., Fondufe-Mittendorf, Y., Moore, I.K., Mieczkowski, P., Kaplan, N., Lubling, Y., Lieb, J.D., Widom, J., and Segal, E. (2009). Gene expression divergence in yeast is coupled to evolution of DNA-encoded nucleosome organization. Nat. Genet. 41: 438–445.
Finkelstein, R. (2013). Abscisic Acid synthesis and response. Arabidopsis Book 11: e0166. Franzke, A., Koch, M.A., and Mummenhoff, K. (2016). Turnip Time Travels: Age Estimates in
Brassicaceae. Trends Plant Sci. 21: 554–561. Frei dit Frey, N. et al. (2014). Functional analysis of Arabidopsis immune-related MAPKs uncovers a
role for MPK3 as negative regulator of inducible defences. Genome Biol. 15: R87. Frerigmann, H., Piślewska-Bednarek, M., Sánchez-Vallet, A., Molina, A., Glawischnig, E.,
Gigolashvili, T., and Bednarek, P. (2016). Regulation of Pathogen-Triggered Tryptophan Metabolism in Arabidopsis thaliana by MYB Transcription Factors and Indole Glucosinolate Conversion Products. Mol. Plant 9: 682–695.
Gan, X. et al. (2016). The Cardamine hirsuta genome offers insight into the evolution of morphological diversity. Nat. Plants 2: 16167.
Gangappa, S.N., Berriri, S., and Kumar, S.V. (2017). PIF4 Coordinates Thermosensory Growth and Immunity in Arabidopsis. Curr. Biol. 27: 243–249.
Giaever, G. et al. (2014). The yeast deletion collection: a decade of functional genomics. Genetics 197: 451–65.
Gigolashvili, T., Berger, B., Mock, H.P., Müller, C., Weisshaar, B., and Flügge, U.I. (2007). The transcription factor HIG1/MYB51 regulates indolic glucosinolate biosynthesis in Arabidopsis thaliana. Plant J. 50: 886–901.
Gilad, Y. and Mizrahi-Man, O. (2015). A reanalysis of mouse ENCODE comparative gene expression data. F1000Research 4.
Gilad, Y., Oshlack, A., and Rifkin, S.A. (2006). Natural selection on gene expression. Trends Genet. 22: 456–461.
Gimenez-Ibanez, S., Hann, D.R., Ntoukakis, V., Petutschnig, E., Lipka, V., and Rathjen, J.P. (2009a). AvrPtoB Targets the LysM Receptor Kinase CERK1 to Promote Bacterial Virulence on Plants. Curr. Biol. 19: 423–429.

5. References
102
Gimenez-Ibanez, S., Ntoukakis, V., and Rathjen, J.P. (2009b). The LysM receptor kinase CERK1 mediates bacterial perception in Arabidopsis. Plant Signal. Behav. 4: 539–541.
Glauser, G., Grata, E., Dubugnon, L., Rudaz, S., Farmer, E.E., and Wolfender, J.L. (2008). Spatial and temporal dynamics of jasmonate synthesis and accumulation in Arabidopsis in response to wounding. J. Biol. Chem. 283: 16400–16407.
Glazebrook, J. (2005). Contrasting Mechanisms of Defense Against Biotrophic and Necrotrophic Pathogens. Annu. Rev. Phytopathol. 43: 205–227.
Gleason, L.U. and Burton, R.S. (2015). RNA-seq reveals regional differences in transcriptome response to heat stress in the marine snail Chlorostoma funebralis. Mol. Ecol. 24: 610–627.
Göhre, V., Spallek, T., Häweker, H., Mersmann, S., Mentzel, T., Boller, T., de Torres, M., Mansfield, J.W., and Robatzek, S. (2008). Plant Pattern-Recognition Receptor FLS2 Is Directed for Degradation by the Bacterial Ubiquitin Ligase AvrPtoB. Curr. Biol. 18: 1824–1832.
Gómez-Gómez, L. and Boller, T. (2000). FLS2: An LRR Receptor-like Kinase Involved in the Perception of the Bacterial Elicitor Flagellin in Arabidopsis. Mol. Cell 5: 1003–1011.
Gómez-Gómez, L., Felix, G., and Boller, T. (1999). A single locus determines sensitivity to bacterial flagellin in Arabidopsis thaliana. Plant J. 18: 277–284.
Gong, Q., Li, P., Ma, S., Indu Rupassara, S., and Bohnert, H.J. (2005). Salinity stress adaptation competence in the extremophile Thellungiella halophila in comparison with its relative Arabidopsis thaliana. Plant J. 44: 826–39.
Gonzalez-Guzman, M., Apostolova, N., Belles, J.M., Barrero, J.M., Piqueras, P., Ponce, M.R., Micol, J.L., Serrano, R., and Rodriguez, P.L. (2002). The Short-Chain Alcohol Dehydrogenase ABA2 Catalyzes the Conversion of Xanthoxin to Abscisic Aldehyde. Plant Cell 14: 1833–1846.
Gust, A.A., Biswas, R., Lenz, H.D., Rauhut, T., Ranf, S., Kemmerling, B., Götz, F., Glawischnig, E., Lee, J., Felix, G., and Nürnberger, T. (2007). Bacteria-derived peptidoglycans constitute pathogen-associated molecular patterns triggering innate immunity in Arabidopsis. J. Biol. Chem. 282: 32338–32348.
Gust, A.A., Pruitt, R., and Nürnberger, T. (2017). Sensing Danger: Key to Activating Plant Immunity. Trends Plant Sci. 22: 779–791.
Gutierrez, J.R., Balmuth, A.L., Ntoukakis, V., Mucyn, T.S., Gimenez-Ibanez, S., Jones, A.M.E., and Rathjen, J.P. (2010). Prf immune complexes of tomato are oligomeric and contain multiple Pto-like kinases that diversify effector recognition. Plant J. 61: 507–518.
Hacquard, S., Spaepen, S., Garrido-Oter, R., and Schulze-Lefert, P. (2017). Interplay Between Innate Immunity and the Plant Microbiota. Annu. Rev. Phytopathol. 55: 565–589.
Hammond, J.P., Bowen, H.C., White, P.J., Mills, V., Pyke, K.A., Baker, A.J.M., Whiting, S.N., May, S.T., and Broadley, M.R. (2006). A comparison of the Thlaspi caerulescens and Thlaspi arvense shoot transcriptomes. New Phytol. 170: 239–260.
Harrison, P.W., Wright, A.E., and Mank, J.E. (2012). The evolution of gene expression and the transcriptome–phenotype relationship. Semin. Cell Dev. Biol. 23: 222–229.
Hay, A.S. et al. (2014). Cardamine hirsuta: a versatile genetic system for comparative studies. Plant J. 78: 1–15.
Haygood, R., Babbitt, C.C., Fedrigo, O., and Wray, G.A. (2010). Contrasts between adaptive coding and noncoding changes during human evolution. Proc. Natl. Acad. Sci. 107: 7853–7857.
Heese, A., Hann, D.R., Gimenez-Ibanez, S., Jones, A.M.E., He, K., Li, J., Schroeder, J.I., Peck, S.C., and Rathjen, J.P. (2007). The receptor-like kinase SERK3/BAK1 is a central regulator of innate immunity in plants. Proc. Natl. Acad. Sci. 104: 12217–22.
Herrero, E. et al. (2012). EARLY FLOWERING4 recruitment of EARLY FLOWERING3 in the nucleus sustains the Arabidopsis circadian clock. Plant Cell 24: 428–43.
Hillmer, R.A., Tsuda, K., Rallapalli, G., Asai, S., Truman, W., Papke, M.D., Sakakibara, H., Jones, J.D.G., Myers, C.L., and Katagiri, F. (2017). The highly buffered Arabidopsis immune signaling network conceals the functions of its components. PLoS Genet. 13: e1006639.
Hind, S.R. et al. (2016). Tomato receptor FLAGELLIN-SENSING 3 binds flgII-28 and activates the plant immune system. Nat. Plants 2: 1–8.
Hodgins-Davis, A., Rice, D.P., Townsend, J.P., and Novembre, J. (2015). Gene expression evolves under a house-of-cards model of stabilizing selection. Mol. Biol. Evol. 32: 2130–2140.
Hohmann, N., Wolf, E.M., Lysak, M.A., and Koch, M.A. (2015). A Time-Calibrated Road Map of Brassicaceae Species Radiation and Evolutionary History. Plant Cell 27: 2770–84.
5. References
103
Holton, N., Nekrasov, V., Ronald, P.C., and Zipfel, C. (2015). The phylogenetically-related pattern recognition receptors EFR and XA21 recruit similar immune signaling components in monocots and dicots. PLoS Pathog. 11: e1004602.
Hruz, T., Laule, O., Szabo, G., Wessendorp, F., Bleuler, S., Oertle, L., Widmayer, P., Gruissem, W., and Zimmermann, P. (2008). Genevestigator V3: A Reference Expression Database for the Meta-Analysis of Transcriptomes. Adv. Bioinformatics 2008: 1–5.
Huang, C. et al. (2016). Resolution of Brassicaceae Phylogeny Using Nuclear Genes Uncovers Nested Radiations and Supports Convergent Morphological Evolution. Mol. Biol. Evol. 33: 394–412.
Huffaker, A., Pearce, G., and Ryan, C.A. (2006). An endogenous peptide signal in Arabidopsis activates components of the innate immune response. Proc. Natl. Acad. Sci. 103: 10098–10103.
Huffaker, A. and Ryan, C.A. (2007). Endogenous peptide defense signals in Arabidopsis differentially amplify signaling for the innate immune response. Proc. Natl. Acad. Sci. 104: 10732–10736.
Hunt, B.G., Ometto, L., Keller, L., and Goodisman, M.A.D. (2013). Evolution at Two Levels in Fire Ants: The Relationship between Patterns of Gene Expression and Protein Sequence Evolution. Mol. Biol. Evol. 30: 263–271.
Huot, B., Yao, J., Montgomery, B.L., and He, S.Y. (2014). Growth-Defense Tradeoffs in Plants: A Balancing Act to Optimize Fitness. Mol. Plant 7: 1267–1287.
Inan, G. et al. (2004). Salt cress. A halophyte and cryophyte Arabidopsis relative model system and its applicability to molecular genetic analyses of growth and development of extremophiles. Plant Physiol. 135: 1718–37.
Jacob, F., Kracher, B., Mine, A., Seyfferth, C., Blanvillain-Baufumé, S., Parker, J.E., Tsuda, K., Schulze-Lefert, P., and Maekawa, T. (2017). A dominant-interfering camta3 mutation compromises primary transcriptional outputs mediated by both cell surface and intracellular immune receptors in Arabidopsis thaliana. New Phytol.
Jacob, F., Vernaldi, S., and Maekawa, T. (2013). Evolution and Conservation of Plant NLR Functions. Front. Immunol. 4: 297.
Jeworutzki, E., Roelfsema, M.R.G., Anschütz, U., Krol, E., Elzenga, J.T.M., Felix, G., Boller, T., Hedrich, R., and Becker, D. (2010). Early signaling through the arabidopsis pattern recognition receptors FLS2 and EFR involves Ca2+-associated opening of plasma membrane anion channels. Plant J. 62: 367–378.
Jones, J.D.G. and Dangl, J.L. (2006). The plant immune system. Nature 444: 323–9. Kadota, Y., Sklenar, J., Derbyshire, P., Stransfeld, L., Asai, S., Ntoukakis, V., Jones, J.D., Shirasu,
K., Menke, F., Jones, A., and Zipfel, C. (2014). Direct Regulation of the NADPH Oxidase RBOHD by the PRR-Associated Kinase BIK1 during Plant Immunity. Mol. Cell 54: 43–55.
Kaku, H., Nishizawa, Y., Ishii-Minami, N., Akimoto-Tomiyama, C., Dohmae, N., Takio, K., Minami, E., and Shibuya, N. (2006). Plant cells recognize chitin fragments for defense signaling through a plasma membrane receptor. Proc. Natl. Acad. Sci. 103: 11086–11091.
Katagiri, F. and Tsuda, K. (2010). Understanding the plant immune system. Mol. Plant. Microbe. Interact. 23: 1531–6.
Katsir, L., Schilmiller, A.L., Staswick, P.E., He, S.Y., and Howe, G.A. (2008). COI1 is a critical component of a receptor for jasmonate and the bacterial virulence factor coronatine. Proc. Natl. Acad. Sci. U. S. A. 105: 7100–5.
Kawakatsu, T. et al. (2016). Epigenomic Diversity in a Global Collection of Arabidopsis thaliana Accessions. Cell 166: 492–505.
Kei Hiruma, A., Gerlach, N., Sacristá, S., Bucher, M., O, R.J., and Schulze-Lefert Correspondence, P. (2016). Root Endophyte Colletotrichum tofieldiae Confers Plant Fitness Benefits that Are Phosphate Status Dependent. Cell 165: 464–474.
Khaitovich, P., Pääbo, S., and Weiss, G. (2005). Toward a neutral evolutionary model of gene expression. Genetics 170: 929–939.
Khaitovich, P., Weiss, G., Lachmann, M., Hellmann, I., Enard, W., Muetzel, B., Wirkner, U., Ansorge, W., and Pääbo, S. (2004). A neutral model of transcriptome evolution. PLoS Biol. 2: e132.
Khaled, S. Ben, Postma, J., and Robatzek, S. (2015). A Moving View: Subcellular Trafficking Processes in Pattern Recognition Receptor– Triggered Plant Immunity. Annu. Rev. Phytopathol 53: 379–402.
Kim, T.-W. and Wang, Z.-Y. (2010). Brassinosteroid Signal Transduction from Receptor Kinases to

5. References
104
Transcription Factors. Annu. Rev. Plant Biol. 61: 681–704. Kimura, M. (1983). The Neutral Theory of Molecular Evolution (Cambridge University Press). Koch, M.A. and German, D.A. (2013). Taxonomy and systematics are key to biological information:
Arabidopsis, Eutrema (Thellungiella), Noccaea and Schrenkiella (Brassicaceae) as examples. Front. Plant Sci. 4: 267.
Koenig, D. et al. (2013). Comparative transcriptomics reveals patterns of selection in domesticated and wild tomato. Proc. Natl. Acad. Sci. 110: E2655-62.
Koenig, D. and Weigel, D. (2015). Beyond the thale: comparative genomics and genetics of Arabidopsis relatives. Nat. Rev. Genet. 16: 285–298.
Kohler, A., Schwindling, S., and Conrath, U. (2002). Benzothiadiazole-induced priming for potentiated responses to pathogen infection, wounding, and infiltration of water into leaves requires the NPR1/NIM1 gene in Arabidopsis. Plant Physiol. 128: 1046–1056.
Kojima, M. and Sakakibara, H. (2012). Highly sensitive high-throughput profiling of six phytohormones using MS-probe modification and liquid chromatography-tandem mass spectrometry. Methods Mol. Biol. 918: 151–164.
Kong, Q., Sun, T., Qu, N., Ma, J., Li, M., Cheng, Y., Zhang, Q., Wu, D., Zhang, Z., and Zhang, Y. (2016). Two redundant receptor-like cytoplasmic kinases function downstream of pattern recognition receptors to regulate activation of SA biosynthesis in Arabidopsis. Plant Physiol. 171: 1344–1354.
Koo, A.J.K., Gao, X., Daniel Jones, A., and Howe, G.A. (2009). A rapid wound signal activates the systemic synthesis of bioactive jasmonates in Arabidopsis. Plant J. 59: 974–986.
Koornneef, M., Léon-Kloosterziel, K.M., Schwartz, S.H., and Zeevaart, J.A.D. (1998). The genetic and molecular dissection of abscisic acid biosynthesis and signal transduction in Arabidopsis. Plant Physiol. Biochem. 36: 83–89.
Koornneef, M. and Meinke, D. (2010). The development of Arabidopsis as a model plant. Plant J. 61: 909–921.
Korkuc, P., Schippers, J.H.M., and Walther, D. (2014). Characterization and Identification of cis-Regulatory Elements in Arabidopsis Based on Single-Nucleotide Polymorphism Information. PLANT Physiol. 164: 181–200.
Kunze, G., Zipfel, C., Robatzek, S., Niehaus, K., Boller, T., and Felix, G. (2004). The N Terminus of Bacterial Elongation Factor Tu Elicits Innate Immunity in Arabidopsis Plants. Plant Cell 16: 3496–3507.
Lacombe, S., Rougon-Cardoso, A., Sherwood, E., Peeters, N., Dahlbeck, D., van Esse, H.P., Smoker, M., Rallapalli, G., Thomma, B.P.H.J., Staskawicz, B., Jones, J.D.G., and Zipfel, C. (2010). Interfamily transfer of a plant pattern-recognition receptor confers broad-spectrum bacterial resistance. Nat. Biotechnol. 28: 365–369.
Lai, Z., Schluttenhofer, C.M., Bhide, K., Shreve, J., Thimmapuram, J., Lee, S.Y., Yun, D.J., and Mengiste, T. (2014). MED18 interaction with distinct transcription factors regulates multiple plant functions. Nat. Commun. 5: 3064.
Lamesch, P. et al. (2012). The Arabidopsis Information Resource (TAIR): Improved gene annotation and new tools. Nucleic Acids Res. 40: D1202–D1210.
Le Roux, C. et al. (2015). A Receptor Pair with an Integrated Decoy Converts Pathogen Disabling of Transcription Factors to Immunity. Cell 161: 1074–1088.
Lee, S., I. Sergeeva, L., and Vreugdenhil, D. (2018). Natural variation of hormone levels in Arabidopsis roots and correlations with complex root architecture. J. Integr. Plant Biol.
Lemos, B., Meiklejohn, C.D., Cáceres, M., and Hartl, D.L. (2005). Rates of divergence in gene expression profiles of primates, mice, and flies: stabilizing selection and variability among functional categories. Evolution (N. Y). 59: 126–37.
Lenka, S.K., Katiyar, A., Chinnusamy, V., and Bansal, K.C. (2011). Comparative analysis of drought-responsive transcriptome in Indica rice genotypes with contrasting drought tolerance. Plant Biotechnol. J. 9: 315–327.
Lewis, L.A. et al. (2015). Transcriptional Dynamics Driving MAMP-Triggered Immunity and Pathogen Effector-Mediated Immunosuppression in Arabidopsis Leaves Following Infection with Pseudomonas syringae pv tomato DC3000. Plant Cell 27: 3038–3064.
Li, B., Meng, X., Shan, L., and He, P. (2016). Transcriptional Regulation of Pattern-Triggered Immunity in Plants. Cell Host Microbe 19: 641–650.

5. References
105
Li, F. et al. (2014a). Modulation of RNA Polymerase II Phosphorylation Downstream of Pathogen Perception Orchestrates Plant Immunity. Cell Host Microbe 16: 748–758.
Li, J., Wen, J., Lease, K.A., Doke, J.T., Tax, F.E., and Walker, J.C. (2002). BAK1, an Arabidopsis LRR receptor-like protein kinase, interacts with BRI1 and modulates brassinosteroid signaling. Cell 110: 213–222.
Li, L., Li, M., Yu, L., Zhou, Z., Liang, X., Liu, Z., Cai, G., Gao, L., Zhang, X., Wang, Y., Chen, S., and Zhou, J.M. (2014b). The FLS2-associated kinase BIK1 directly phosphorylates the NADPH oxidase RbohD to control plant immunity. Cell Host Microbe 15: 329–338.
Li, L., Stoeckert, C.J., and Roos, D.S. (2003). OrthoMCL: identification of ortholog groups for eukaryotic genomes. Genome Res. 13: 2178–89.
Liang, X., Ding, P., Lian, K., Wang, J., Ma, M., Li, L., Li, L., Li, M., Zhang, X., Chen, S., Zhang, Y., and Zhou, J.M. (2016). Arabidopsis heterotrimeric G proteins regulate immunity by directly coupling to the FLS2 receptor. Elife 5: e13568.
Liebrand, T.W.H., van den Burg, H.A., and Joosten, M.H.A.J. (2014). Two for all: receptor-associated kinases SOBIR1 and BAK1. Trends Plant Sci. 19: 123–32.
Lindlöf, A. et al. (2015). Comparative Transcriptomics of Sijung and Jumli Marshi Rice during Early Chilling Stress Imply Multiple Protective Mechanisms. PLoS One 10: e0125385.
Liu, L., Sonbol, F.-M., Huot, B., Gu, Y., Withers, J., Mwimba, M., Yao, J., He, S.Y., and Dong, X. (2016). Salicylic acid receptors activate jasmonic acid signalling through a non-canonical pathway to promote effector-triggered immunity. Nat. Commun. 7: 13099.
Liu, S., Kracher, B., Ziegler, J., Birkenbihl, R.P., and Somssich, I.E. (2015). Negative regulation of ABA Signaling By WRKY33 is critical for Arabidopsis immunity towards Botrytis cinerea 2100. Elife 4: e07295.
López-maury, L., Marguerat, S., and Bähler, J. (2008). Tuning gene expression to changing to evolutionary adaptation. Nat. Rev. Genet. 9: 583–593.
Lou, Y., Xu, X.F., Zhu, J., Gu, J.N., Blackmore, S., and Yang, Z.N. (2014). The tapetal AHL family protein TEK determines nexine formation in the pollen wall. Nat. Commun. 5: 3855.
Lozano-Durán, R. and Zipfel, C. (2015). Trade-off between growth and immunity: role of brassinosteroids. Trends Plant Sci. 20: 12–9.
Lu, D., Lin, W., Gao, X., Wu, S., Cheng, C., Avila, J., Heese, A., Devarenne, T.P., He, P., and Shan, L. (2011). Direct Ubiquitination of Pattern Recognition Receptor FLS2 Attenuates Plant Innate Immunity. Science 332: 1439–1442.
Lu, D., Wu, S., Gao, X., Zhang, Y., Shan, L., and He, P. (2010a). A receptor-like cytoplasmic kinase, BIK1, associates with a flagellin receptor complex to initiate plant innate immunity. Proc. Natl. Acad. Sci. 107: 496–501.
Lu, H., Zou, Y., and Feng, N. (2010b). Overexpression of AHL20 negatively regulates defenses in arabidopsis. J. Integr. Plant Biol. 52: 801–808.
Lu, X., Tintor, N., Mentzel, T., Kombrink, E., Boller, T., Robatzek, S., Schulze-Lefert, P., and Saijo, Y. (2009). Uncoupling of sustained MAMP receptor signaling from early outputs in an Arabidopsis endoplasmic reticulum glucosidase II allele. Proc. Natl. Acad. Sci. 106: 22522–22527.
Macho, A.P. and Zipfel, C. (2014). Plant PRRs and the Activation of Innate Immune Signaling. Mol. Cell 54: 263–272.
MacKay, T.F.C., Stone, E.A., and Ayroles, J.F. (2009). The genetics of quantitative traits: Challenges and prospects. Nat. Rev. Genet. 10: 565–577.
Maere, S., Heymans, K., and Kuiper, M. (2005). BiNGO: A Cytoscape plugin to assess overrepresentation of Gene Ontology categories in Biological Networks. Bioinformatics 21: 3448–3449.
Manceau, M., Domingues, V.S., Mallarino, R., and Hoekstra, H.E. (2011). The Developmental Role of Agouti in Color Pattern Evolution. Science 331: 1062–1065.
Mangelsen, E., Kilian, J., Harter, K., Jansson, C., Wanke, D., and Sundberg, E. (2011). Transcriptome analysis of high-temperature stress in developing barley caryopses: Early stress responses and effects on storage compound biosynthesis. Mol. Plant 4: 97–115.
Mao, G., Meng, X., Liu, Y., Zheng, Z., Chen, Z., and Zhang, S. (2011). Phosphorylation of a WRKY Transcription Factor by Two Pathogen-Responsive MAPKs Drives Phytoalexin Biosynthesis in Arabidopsis. Plant Cell 23: 1639–1653.
Martin, F. and Kamoun, S. (2012). Effectors in plant-microbe interactions (Wiley-Blackwell).

5. References
106
Mbengue, M., Bourdais, G., Gervasi, F., Beck, M., Zhou, J., Spallek, T., Bartels, S., Boller, T., Ueda, T., Kuhn, H., and Robatzek, S. (2016). Clathrin-dependent endocytosis is required for immunity mediated by pattern recognition receptor kinases. Proc. Natl. Acad. Sci. 113: 11034–11039.
McLeay, R.C. and Bailey, T.L. (2010). Motif Enrichment Analysis: A unified framework and an evaluation on ChIP data. BMC Bioinformatics 11: 165.
Meldau, S., Erb, M., and Baldwin, I.T. (2012). Defence on demand: mechanisms behind optimal defence patterns. Ann. Bot. 110: 1503–1514.
Mengiste, T. (2012). Plant Immunity to Necrotrophs. Annu. Rev. Phytopathol. 50: 267–294. Mine, A., Nobori, T., Salazar-Rondon, M.C., Winkelmüller, T.M., Anver, S., Becker, D., and
Tsuda, K. (2017). An incoherent feed-forward loop mediates robustness and tunability in a plant immune network. EMBO Rep. 18: 464–476.
Miyata, T. and Yasunaga, T. (1980). Molecular evolution of mRNA: A method for estimating evolutionary rates of synonymous and amino acid substitutions from homologous nucleotide sequences and its application. J. Mol. Evol. 16: 23–36.
Monaghan, J., Matschi, S., Shorinola, O., Rovenich, H., Matei, A., Segonzac, C., Malinovsky, F.G., Rathjen, J.P., MacLean, D., Romeis, T., and Zipfel, C. (2014). The Calcium-Dependent Protein Kinase CPK28 Buffers Plant Immunity and Regulates BIK1 Turnover. Cell Host Microbe 16: 605–615.
Mondragón-Palomino, M., John-Arputharaj, A., Pallmann, M., and Dresselhaus, T. (2017). Similarities between Reproductive and Immune Pistil Transcriptomes of Arabidopsis Species. Plant Physiol. 174: 1559–1575.
Mondragón-Palomino, M., Meyers, B.C., Michelmore, R.W., and Gaut, B.S. (2002). Patterns of positive selection in the complete NBS-LRR gene family of Arabidopsis thaliana. Genome Res. 12: 1305–15.
Morandin, C., Tin, M.M.Y., Abril, S., Gómez, C., Pontieri, L., Schiøtt, M., Sundström, L., Tsuji, K., Pedersen, J.S., Helanterä, H., and Mikheyev, A.S. (2016). Comparative transcriptomics reveals the conserved building blocks involved in parallel evolution of diverse phenotypic traits in ants. Genome Biol. 17: 43.
Mukhtar, M.S. et al. (2011). Independently evolved virulence effectors converge onto hubs in a plant immune system network. Science 333: 596–601.
Murdoch, D.J. and Chow, E.D. (1996). A Graphical Display of Large Correlation Matrices. Am. Stat. 50: 178–180.
Mustroph, A., Lee, S.C., Oosumi, T., Zanetti, M.E., Yang, H., Ma, K., Yaghoubi-Masihi, A., Fukao, T., and Bailey-Serres, J. (2010). Cross-kingdom comparison of transcriptomic adjustments to low-oxygen stress highlights conserved and plant-specific responses. Plant Physiol. 152: 1484–500.
De Nadal, E., Ammerer, G., and Posas, F. (2011). Controlling gene expression in response to stress. Nat. Rev. Genet. 12: 833–845.
Nam, K.H. and Li, J. (2002). BRI1/BAK1, a receptor kinase pair mediating brassinosteroid signaling. Cell 110: 203–212.
Nam, Y.-J. et al. (2017). Natural Variation of Molecular and Morphological Gibberellin Responses. Plant Physiol. 173: 703–714.
Navarro, L., Zipfel, C., Rowland, O., Keller, I., Robatzek, S., Boller, T., and Jones, J.D.G. (2004). The Transcriptional Innate Immune Response to flg22. Interplay and Overlap with Avr Gene-Dependent Defense Responses and Bacterial Pathogenesis. PLANT Physiol. 135: 1113–1128.
Necsulea, A. and Kaessmann, H. (2014). Evolutionary dynamics of coding and non-coding transcriptomes. Nat. Rev. Genet. 15: 734–748.
Nichio, B.T.L., Marchaukoski, J.N., and Raittz, R.T. (2017). New tools in orthology analysis: A brief review of promising perspectives. Front. Genet. 8: 165.
Nühse, T.S., Bottrill, A.R., Jones, A.M.E., and Peck, S.C. (2007). Quantitative phosphoproteomic analysis of plasma membrane proteins reveals regulatory mechanisms of plant innate immune responses. Plant J. 51: 931–940.
Oleksiak, M.F., Churchill, G.A., and Crawford, D.L. (2002). Variation in gene expression within and among natural populations. Nat. Genet. 32: 261–266.
Pandey, S.P. and Somssich, I.E. (2009). The role of WRKY transcription factors in plant immunity.

5. References
107
Plant Physiol. 150: 1648–1655. Pedras, M.S.C. and Adio, A.M. (2008). Phytoalexins and phytoanticipins from the wild crucifers
Thellungiella halophila and Arabidopsis thaliana: Rapalexin A, wasalexins and camalexin. Phytochemistry 69: 889–893.
Pedras, M.S.C., Yaya, E.E., and Hossain, S. (2010). Unveiling the phytoalexin biosynthetic puzzle in salt cress: unprecedented incorporation of glucobrassicin into wasalexins A and B. Org. Biomol. Chem. 8: 5150–5158.
Pedras, M.S.C. and Zheng, Q.-A. (2010). Metabolic responses of Thellungiella halophila/salsuginea to biotic and abiotic stresses: metabolite profiles and quantitative analyses. Phytochemistry 71: 581–9.
Peele, H.M., Guan, N., Fogelqvist, J., and Dixelius, C. (2014). Loss and retention of resistance genes in five species of the Brassicaceae family. BMC Plant Biol. 14: 298.
Perry, G.H., Melsted, P., Marioni, J.C., Wang, Y., Bainer, R., Pickrell, J.K., Michelini, K., Zehr, S., Yoder, A.D., Stephens, M., Pritchard, J.K., and Gilad, Y. (2012). Comparative RNA sequencing reveals substantial genetic variation in endangered primates. Genome Res. 22: 602–610.
Piasecka, A., Jedrzejczak-Rey, N., and Bednarek, P. (2015). Secondary metabolites in plant innate immunity: Conserved function of divergent chemicals. New Phytol. 206: 948–964.
Pieterse, C.M.J., Van der Does, D., Zamioudis, C., Leon-Reyes, A., and Van Wees, S.C.M. (2012). Hormonal modulation of plant immunity. Annu. Rev. Cell Dev. Biol. 28: 489–521.
Pieterse, C.M.J., Leon-Reyes, A., Van der Ent, S., and Van Wees, S.C.M. (2009). Networking by small-molecule hormones in plant immunity. Nat. Chem. Biol. 5: 308–16.
Pruitt, R.N. et al. (2015). The rice immune receptor XA21 recognizes a tyrosine-sulfated protein from a Gram-negative bacterium. Sci. Adv. 1: e1500245.
Pye, M.F., Hakuno, F., MacDonald, J.D., and Bostock, R.M. (2013). Induced resistance in tomato by SAR activators during predisposing salinity stress. Front. Plant Sci. 4: 1431–1434.
Qin, F., Shinozaki, K., and Yamaguchi-Shinozaki, K. (2011). Achievements and challenges in understanding plant abiotic stress responses and tolerance. Plant Cell Physiol. 52: 1569–1582.
Qin, Y., Druzhinina, I.S., Pan, X., and Yuan, Z. (2016). Microbially Mediated Plant Salt Tolerance and Microbiome-based Solutions for Saline Agriculture. Biotechnol. Adv. 34: 1245–1259.
Rajniak, J., Barco, B., Clay, N.K., and Sattely, E.S. (2015). A new cyanogenic metabolite in Arabidopsis required for inducible pathogen defence. Nature 525: 376–379.
Ranf, S. (2017). Sensing of molecular patterns through cell surface immune receptors. Curr. Opin. Plant Biol. 38: 68–77.
Ranf, S., Gisch, N., Schäffer, M., Illig, T., Westphal, L., Knirel, Y.A., Sánchez-Carballo, P.M., Zähringer, U., Hückelhoven, R., Lee, J., and Scheel, D. (2015). A lectin S-domain receptor kinase mediates lipopolysaccharide sensing in Arabidopsis thaliana. Nat. Immunol. 16: 426–433.
Rebeiz, M., Pool, J.E., Kassner, V.A., Aquadro, C.F., and Carroll, S.B. (2009). Stepwise modification of a modular enhancer underlies adaptation in a Drosophila population. Science 326: 1663–1667.
Renaut, S., Maillet, N., Normandeau, E., Sauvage, C., Derome, N., Rogers, S.M., and Bernatchez, L. (2012). Genome-wide patterns of divergence during speciation: the lake whitefish case study. Philos. Trans. R. Soc. B Biol. Sci. 367: 354–363.
Rifkin, S.A., Kim, J., and White, K.P. (2003). Evolution of gene expression in the Drosophila melanogaster subgroup. Nat. Genet. 33: 138–144.
Ritchie, M.E., Phipson, B., Wu, D., Hu, Y., Law, C.W., Shi, W., and Smyth, G.K. (2015). limma powers differential expression analyses for RNA-sequencing and microarray studies. Nucleic Acids Res. 43: e47.
Robatzek, S., Bittel, P., Chinchilla, D., Köchner, P., Felix, G., Shiu, S.H., and Boller, T. (2007). Molecular identification and characterization of the tomato flagellin receptor LeFLS2, an orthologue of Arabidopsis FLS2 exhibiting characteristically different perception specificities. Plant Mol. Biol. 64: 539–547.
Robatzek, S., Chinchilla, D., and Boller, T. (2006). Ligand-induced endocytosis of the pattern recognition receptor FLS2 in Arabidopsis. Genes Dev. 20: 537–42.
Robert-Seilaniantz, A., Grant, M., and Jones, J.D.G. (2011). Hormone crosstalk in plant disease and defense: more than just jasmonate-salicylate antagonism. Annu. Rev. Phytopathol. 49: 317–43.

5. References
108
Robinson, M.D., McCarthy, D.J., and Smyth, G.K. (2009). edgeR: A Bioconductor package for differential expression analysis of digital gene expression data. Bioinformatics 26: 139–140.
Rohart, F., Gautier, B., Singh, A., and Lê Cao, K.-A. (2017). mixOmics: An R package for ‘omics feature selection and multiple data integration. PLOS Comput. Biol. 13: e1005752.
Romero, I.G., Ruvinsky, I., and Gilad, Y. (2012). Comparative studies of gene expression and the evolution of gene regulation. Nat. Rev. Genet. 13: 505–516.
Ron, M. and Adi, A. (2004). The Receptor for the Fungal Elicitor Ethylene-Inducing Xylanase Is a Member of a Resistance-Like Gene Family in Tomato. Plant Cell 16: 1604–1615.
Rosli, H.G., Zheng, Y., Pombo, M.A., Zhong, S., Bombarely, A., Fei, Z., Collmer, A., and Martin, G.B. (2013). Transcriptomics-based screen for genes induced by flagellin and repressed by pathogen effectors identifies a cell wall-associated kinase involved in plant immunity. Genome Biol. 14: R139.
Ross, A. and Somssich, I.E. (2016). A DNA-based real-time PCR assay for robust growth quantification of the bacterial pathogen Pseudomonas syringae on Arabidopsis thaliana. Plant Methods 12: 48.
Ross, A., Yamada, K., Hiruma, K., Yamashita-Yamada, M., Lu, X., Takano, Y., Tsuda, K., and Saijo, Y. (2014). The Arabidopsis PEPR pathway couples local and systemic plant immunity. EMBO J. 33: 62–75.
Roux, M., Schwessinger, B., Albrecht, C., Chinchilla, D., Jones, A., Holton, N., Malinovsky, F.G., Tör, M., de Vries, S., and Zipfel, C. (2011). The Arabidopsis leucine-rich repeat receptor-like kinases BAK1/SERK3 and BKK1/SERK4 are required for innate immunity to hemibiotrophic and biotrophic pathogens. Plant Cell 23: 2440–55.
Ruppel, S., Franken, P., and Witzel, K. (2013). Properties of the halophyte microbiome and their implications for plant salt tolerance. In Functional Plant Biology (CSIRO PUBLISHING), pp. 940–951.
Sagi, M., Fluhr, R., and Dangl, J.L. (2006). Superoxide Production by Plant Homologues of the gp91phox NADPH Oxidase. Modulation of Activity by Calcium and by Tobacco Mosaic Virus Infection. PLANT Physiol. 141: 373–378.
Salmeron, J.M., Oldroyd, G.E., Rommens, C.M., Scofield, S.R., Kim, H.S., Lavelle, D.T., Dahlbeck, D., and Staskawicz, B.J. (1996). Tomato Prf is a member of the leucine-rich repeat class of plant disease resistance genes and lies embedded within the Pto kinase gene cluster. Cell 86: 123–33.
Sanchez, D.H., Pieckenstain, F.L., Szymanski, J., Erban, A., Bromke, M., Hannah, M.A., Kraemer, U., Kopka, J., and Udvardi, M.K. (2011). Comparative Functional Genomics of Salt Stress in Related Model and Cultivated Plants Identifies and Overcomes Limitations to Translational Genomics. PLoS One 6: e17094.
Sarris, P.F. et al. (2015). A Plant Immune Receptor Detects Pathogen Effectors that Target WRKY Transcription Factors. Cell 161: 1089–1100.
Saur, I.M.L., Kadota, Y., Sklenar, J., Holton, N.J., Smakowska, E., Belkhadir, Y., Zipfel, C., and Rathjen, J.P. (2016). NbCSPR underlies age-dependent immune responses to bacterial cold shock protein in Nicotiana benthamiana. Proc. Natl. Acad. Sci. 113: 3389–3394.
Schranz, M.E., Song, B.-H., Windsor, A.J., and Mitchell-Olds, T. (2007). Comparative genomics in the Brassicaceae: a family-wide perspective. Curr. Opin. Plant Biol. 10: 168–75.
Schroder, K. et al. (2012). Conservation and divergence in Toll-like receptor 4-regulated gene expression in primary human versus mouse macrophages. Proc. Natl. Acad. Sci. 109: E944–E953.
Schulze-Lefert, P. and Panstruga, R. (2011). A molecular evolutionary concept connecting nonhost resistance, pathogen host range, and pathogen speciation. Trends Plant Sci. 16: 117–125.
Schulze, B., Mentzel, T., Jehle, A.K., Mueller, K., Beeler, S., Boller, T., Felix, G., and Chinchilla, D. (2010). Rapid heteromerization and phosphorylation of ligand-activated plant transmembrane receptors and their associated kinase BAK1. J. Biol. Chem. 285: 9444–9451.
Schwessinger, B., Roux, M., Kadota, Y., Ntoukakis, V., Sklenar, J., Jones, A., and Zipfel, C. (2011). Phosphorylation-dependent differential regulation of plant growth, cell death, and innate immunity by the regulatory receptor-like kinase BAK1. PLoS Genet. 7: e1002046.
Segonzac, C., Macho, A.P., Sanmartin, M., Ntoukakis, V., Sanchez-Serrano, J.J., and Zipfel, C. (2014). Negative control of BAK1 by protein phosphatase 2A during plant innate immunity. EMBO J. 33: 2069–2079.

5. References
109
Shannon, P., Markiel, A., Ozier, O., Baliga, N.S., Wang, J.T., Ramage, D., Amin, N., Schwikowski, B., and Ideker, T. (2003). Cytoscape: A software Environment for integrated models of biomolecular interaction networks. Genome Res. 13: 2498–2504.
Shapiro, M.D., Marks, M.E., Peichel, C.L., Blackman, B.K., Nereng, K.S., Jónsson, B., Schluter, D., and Kingsley, D.M. (2004). Genetic and developmental basis of evolutionary pelvic reduction in threespine sticklebacks. Nature 428: 717–723.
Shen, Q., Bourdais, G., Pan, H., Robatzek, S., and Tang, D. (2017). Arabidopsis glycosylphosphatidylinositol-anchored protein LLG1 associates with and modulates FLS2 to regulate innate immunity. Proc. Natl. Acad. Sci. 114: 5749–5754.
Shi, H., Shen, Q., Qi, Y., Yan, H., Nie, H., Chen, Y., Zhao, T., Katagiri, F., and Tang, D. (2013). BR-SIGNALING KINASE1 Physically Associates with FLAGELLIN SENSING2 and Regulates Plant Innate Immunity in Arabidopsis. Plant Cell 25: 1143–1157.
Shi, X., Ng, D.W.K., Zhang, C., Comai, L., Ye, W., and Jeffrey Chen, Z. (2012). Cis- and trans-regulatory divergence between progenitor species determines gene-expression novelty in Arabidopsis allopolyploids. Nat. Commun. 3: 950.
Shinya, T. et al. (2014). Selective regulation of the chitin-induced defense response by the Arabidopsis receptor-like cytoplasmic kinase PBL27. Plant J. 79: 56–66.
Sievers, F., Wilm, A., Dineen, D., Gibson, T.J., Karplus, K., Li, W., Lopez, R., McWilliam, H., Remmert, M., Söding, J., Thompson, J.D., and Higgins, D.G. (2011). Fast, scalable generation of high-quality protein multiple sequence alignments using Clustal Omega. Mol. Syst. Biol. 7: 539.
Slotte, T. et al. (2013). The Capsella rubella genome and the genomic consequences of rapid mating system evolution. Nat. Genet. 45: 831–5.
Somerville, C. and Koornneef, M. (2002). A fortunate choice: the history of Arabidopsis as a model plant. Nat. Rev. Genet. 3: 883–889.
Song, W.-Y., Wang, G.-L., Chen, L.-L., Kim, H.-S., Pi, L.-Y., Holsten, T., Gardner, J., Wang, B., Zhai, W.-X., Zhu, L.-H., Fauquet, C., and Ronald, P. (1995). A Receptor Kinase-Like Protein Encoded by the Rice Disease Resistance Gene, Xa21. Science (80-. ). 270: 1804–1806.
Spoel, S.H. and Dong, X. (2012). How do plants achieve immunity? Defence without specialized immune cells. Nat. Rev. Immunol. 12: 89–100.
Sreekanta, S., Bethke, G., Hatsugai, N., Tsuda, K., Thao, A., Wang, L., Katagiri, F., and Glazebrook, J. (2015). The receptor-like cytoplasmic kinase PCRK1 contributes to pattern-triggered immunity against Pseudomonas syringae in Arabidopsis thaliana. New Phytol. 207: 78–90.
Staiger, D., Korneli, C., Lummer, M., and Navarro, L. (2013). Emerging role for RNA-based regulation in plant immunity. New Phytol. 197: 394–404.
Stegmann, M., Monaghan, J., Smakowska-Luzan, E., Rovenich, H., Lehner, A., Holton, N., Belkhadir, Y., and Zipfel, C. (2017). The receptor kinase FER is a RALF-regulated scaffold controlling plant immune signaling. Science 355: 287–289.
Sturn, A., Quackenbush, J., and Trajanoski, Z. (2002). Genesis: cluster analysis of microarray data. Bioinformatics 18: 207–8.
Sun, W., Xu, X., Zhu, H., Liu, A., Liu, L., Li, J., and Hua, X. (2010). Comparative transcriptomic profiling of a salt-tolerant wild tomato species and a salt-sensitive tomato cultivar. Plant Cell Physiol. 51: 997–1006.
Sun, Y., Li, L., Macho, A.P., Han, Z., Hu, Z., Zipfel, C., Zhou, J.-M., and Chai, J. (2013). Structural Basis for flg22-Induced Activation of the Arabidopsis FLS-BAK1 Immune Complex. Science 342: 624–628.
Taji, T., Seki, M., Satou, M., Sakurai, T., Kobayashi, M., Ishiyama, K., Narusaka, Y., Narusaka, M., Zhu, J.-K., and Shinozaki, K. (2004). Comparative genomics in salt tolerance between Arabidopsis and aRabidopsis-related halophyte salt cress using Arabidopsis microarray. Plant Physiol. 135: 1697–709.
Takai, R., Isogai, A., Takayama, S., and Che, F.-S. (2008). Analysis of Flagellin Perception Mediated by flg22 Receptor OsFLS2 in Rice. Mol. Plant-Microbe Interact. 21: 1635–1642.
Tang, D., Wang, G., and Zhou, J.-M. (2017). Receptor Kinases in Plant-Pathogen Interactions: More Than Pattern Recognition. Plant Cell 29: 618–637.
Tang, X., Frederick, R.D., Zhou, J., Halterman, D.A., Jia, Y., and Martin, G.B. (1996). Initiation of Plant Disease Resistance by Physical Interaction of AvrPto and Pto Kinase. Science 274: 2060–
5. References
110
2063. Tekaia, F. (2016). Inferring orthologs: Open questions and perspectives. Genomics Insights 9: 17–28. Thaler, J.S., Humphrey, P.T., and Whiteman, N.K. (2012). Evolution of jasmonate and salicylate
signal crosstalk. Trends Plant Sci. 17: 260–270. Thatcher, J.W., Shaw, J.M., and Dickinson, W.J. (1998). Marginal fitness contributions of
nonessential genes in yeast. Proc. Natl. Acad. Sci. 95: 253–7. Thomma, B.P.H.J., Nelissen, I., Eggermont, K., and Broekaert, W.F. (1999). Deficiency in
phytoalexin production causes enhanced susceptibility of Arabidopsis thaliana to the fungus Alternaria brassicicola. Plant J. 19: 163–171.
Tirosh, I., Reikhav, S., Levy, A.A., and Barkai, N. (2009). A Yeast Hybrid Provides Insight into the Evolution of Gene Expression Regulation. Science 324: 659–662.
Todesco, M. et al. (2010). Natural allelic variation underlying a major fitness trade-off in Arabidopsis thaliana. Nature 465: 632–636.
De Torres Zabala, M., Bennett, M.H., Truman, W.H., and Grant, M.R. (2009). Antagonism between salicylic and abscisic acid reflects early host-pathogen conflict and moulds plant defence responses. Plant J. 59: 375–386.
Toruño, T.Y., Stergiopoulos, I., and Coaker, G. (2016). Plant-Pathogen Effectors: Cellular Probes Interfering with Plant Defenses in Spatial and Temporal Manners. Annu. Rev. Phytopathol. 54: 419–441.
Touchman, J. (2010). Comparative Genomics. Nat. Educ. Knowl. 3: 13. Trapnell, C., Pachter, L., and Salzberg, S.L. (2009). TopHat: Discovering splice junctions with RNA-
Seq. Bioinformatics 25: 1105–1111. Tsankov, A.M., Thompson, D.A., Socha, A., Regev, A., and Rando, O.J. (2010). The Role of
Nucleosome Positioning in the Evolution of Gene Regulation. PLoS Biol. 8: e1000414. Tsuda, K., Sato, M., Glazebrook, J., Cohen, J.D., and Katagiri, F. (2008). Interplay between
MAMP-triggered and SA-mediated defense responses. Plant J. 53: 763–75. Tsuda, K., Sato, M., Stoddard, T., Glazebrook, J., and Katagiri, F. (2009). Network properties of
robust immunity in plants. PLoS Genet. 5: e1000772. Tsuda, K. and Somssich, I.E. (2015). Transcriptional networks in plant immunity. New Phytol. 206:
932–947. Uebbing, S. et al. (2016). Divergence in gene expression within and between two closely related
flycatcher species. Mol. Ecol. 25: 2015–2028. Ueno, Y., Yoshida, R., Kishi-Kaboshi, M., Matsushita, A., Jiang, C.-J., Goto, S., Takahashi, A.,
Hirochika, H., and Takatsuji, H. (2015). Abiotic Stresses Antagonize the Rice Defence Pathway through the Tyrosine-Dephosphorylation of OsMPK6. PLoS Pathog. 11: e1005231.
Varden, F.A., De la Concepcion, J.C., Maidment, J.H., and Banfield, M.J. (2017). Taking the stage: effectors in the spotlight. Curr. Opin. Plant Biol. 38: 25–33.
Van Veen, H. et al. (2016). Transcriptomes of eight Arabidopsis thaliana accessions reveal core conserved, genotype- and organ-specific responses to flooding stress. Plant Physiol. 172: pp.00472.2016.
Van de Velde, J., Van Bel, M., Van Eechoutte, D., and Vandepoele, K. (2016). A Collection of Conserved Non-Coding Sequences to Study Gene Regulation in Flowering Plants. Plant Physiol. 171: pp.00821.2016.
Vetter, M., Karasov, T.L., and Bergelson, J. (2016). Differentiation between MAMP Triggered Defenses in Arabidopsis thaliana. PLOS Genet. 12: e1006068.
Vetter, M.M., Kronholm, I., He, F., Häweker, H., Reymond, M., Bergelson, J., Robatzek, S., and de Meaux, J. (2012). Flagellin perception varies quantitatively in Arabidopsis thaliana and its relatives. Mol. Biol. Evol. 29: 1655–67.
Vlad, D. et al. (2014). Leaf Shape Evolution Through Duplication, Regulatory Diversification, and Loss of a Homeobox Gene. Science 343: 780–783.
Voelckel, C., Gruenheit, N., and Lockhart, P. (2017). Evolutionary Transcriptomics and Proteomics: Insight into Plant Adaptation. Trends Plant Sci. 22: 462–471.
Vos, I.A., Moritz, L., Pieterse, C.M.J., and Van Wees, S.C.M. (2015). Impact of hormonal crosstalk on plant resistance and fitness under multi-attacker conditions. Front. Plant Sci. 6: 639.
Vos, I.A., Pieterse, C.M.J., and Van Wees, S.C.M. (2013). Costs and benefits of hormone-regulated plant defences. Plant Pathol. 62: 43–55.
5. References
111
De Vos, M., Van Oosten, V.R., Van Poecke, R.M.P., Van Pelt, J.A., Pozo, M.J., Mueller, M.J., Buchala, A.J., Métraux, J.-P., Van Loon, L.C., Dicke, M., and Pieterse, C.M.J. (2005). Signal Signature and Transcriptome Changes of Arabidopsis During Pathogen and Insect Attack. Mol. Plant-Microbe Interact. 18: 923–937.
Voss, T.C. and Hager, G.L. (2014). Dynamic regulation of transcriptional states by chromatin and transcription factors. Nat. Rev. Genet. 15: 69–81.
Wan, J., Zhang, X.-C., Neece, D., Ramonell, K.M., Clough, S., Kim, S. -y., Stacey, M.G., and Stacey, G. (2008). A LysM Receptor-Like Kinase Plays a Critical Role in Chitin Signaling and Fungal Resistance in Arabidopsis. Plant Cell 20: 471–481.
Wang, G. et al. (2008). A Genome-Wide Functional Investigation into the Roles of Receptor-Like Proteins in Arabidopsis. PLANT Physiol. 147: 503–517.
Wang, L., Albert, M., Einig, E., Fürst, U., Krust, D., and Felix, G. (2016). The pattern-recognition receptor CORE of Solanaceae detects bacterial cold-shock protein. Nat. Plants 2: 16185.
Wang, Z.-Y. (2012). Brassinosteroids modulate plant immunity at multiple levels. Proc. Natl. Acad. Sci. 109: 7–8.
Weber, M., Harada, E., Vess, C., Roepenack-Lahaye, E. v., and Clemens, S. (2004). Comparative microarray analysis of Arabidopsis thaliana and Arabidopsis halleri roots identifies nicotianamine synthase, a ZIP transporter and other genes as potential metal hyperaccumulation factors. Plant J. 37: 269–281.
Whitehead, A. (2012). Comparative genomics in ecological physiology: toward a more nuanced understanding of acclimation and adaptation. J. Exp. Biol. 215: 884–891.
Whitehead, A. and Crawford, D.L. (2006). Neutral and adaptive variation in gene expression. Proc. Natl. Acad. Sci. 103: 5425–5430.
Whittle, C.A., Sun, Y., and Johannesson, H. (2014). Dynamics of transcriptome evolution in the model eukaryote Neurospora. J. Evol. Biol. 27: 1125–1135.
Wildermuth, M.C., Dewdney, J., Wu, G., and Ausubel, F.M. (2001). Isochorismate synthase is required to synthesize salicylic acid for plant defence. Nature 414: 562–5.
Willmann, R. et al. (2011). Arabidopsis lysin-motif proteins LYM1 LYM3 CERK1 mediate bacterial peptidoglycan sensing and immunity to bacterial infection. Proc. Natl. Acad. Sci. 108: 19824–9.
Wu, H.-J. et al. (2012). Insights into salt tolerance from the genome of Thellungiella salsuginea. Proc. Natl. Acad. Sci. 109: 12219–24.
Xin, X.-F., Nomura, K., Aung, K., Velásquez, A.C., Yao, J., Boutrot, F., Chang, J.H., Zipfel, C., and He, S.Y. (2016). Bacteria establish an aqueous living space in plants crucial for virulence. Nature 539: 524–529.
Yaish, M.W., Al-Lawati, A., Jana, G.A., Patankar, H.V., and Glick, B.R. (2016). Impact of soil salinity on the structure of the bacterial endophytic community identified from the roots of caliph medic (Medicago truncatula). PLoS One 11: e0159007.
Yamada, K. et al. (2016). The Arabidopsis CERK1-associated kinase PBL27 connects chitin perception to MAPK activation. EMBO J. 35: 2468–2483.
Yamaguchi, Y., Huffaker, A., Bryan, A.C., Tax, F.E., and Ryan, C.A. (2010). PEPR2 is a second receptor for the Pep1 and Pep2 peptides and contributes to defense responses in Arabidopsis. Plant Cell 22: 508–22.
Yamaguchi, Y., Pearce, G., and Ryan, C.A. (2006). The cell surface leucine-rich repeat receptor for AtPep1, an endogenous peptide elicitor in Arabidopsis, is functional in transgenic tobacco cells. Proc. Natl. Acad. Sci. 103: 10104–10109.
Yanai, I., Graur, D., and Ophir, R. (2004). Incongruent Expression Profiles between Human and Mouse Orthologous Genes Suggest Widespread Neutral Evolution of Transcription Control. Omi. A J. Integr. Biol. 8.
Yang, D.-L. et al. (2012). Plant hormone jasmonate prioritizes defense over growth by interfering with gibberellin signaling cascade. Proc. Natl. Acad. Sci. 109: E1192–E1200.
Yang, H., Hu, J., Long, X., Liu, Z., and Rengel, Z. (2016). Salinity altered root distribution and increased diversity of bacterial communities in the rhizosphere soil of Jerusalem artichoke. Sci. Rep. 6: 20687.
Yang, Q.S., Gao, J., He, W. Di, Dou, T.X., Ding, L.J., Wu, J.H., Li, C.Y., Peng, X.X., Zhang, S., and Yi, G.J. (2015). Comparative transcriptomics analysis reveals difference of key gene expression between banana and plantain in response to cold stress. BMC Genomics 16: 446.

5. References
112
Yang, R. et al. (2013). The Reference Genome of the Halophytic Plant Eutrema salsugineum. Front. Plant Sci. 4: 46.
Yang, Z. (2007). PAML 4: Phylogenetic analysis by maximum likelihood. Mol. Biol. Evol. 24: 1586–1591.
Yang, Z. and Bielawski, J.R. (2000). Statistical methods for detecting molecular adaptation. Trends Ecol. Evol. 15: 496–503.
Yasuda, M., Ishikawa, A., Jikumaru, Y., Seki, M., Umezawa, T., Asami, T., Maruyama-Nakashita, A., Kudo, T., Shinozaki, K., Yoshida, S., and Nakashita, H. (2008). Antagonistic interaction between systemic acquired resistance and the abscisic acid-mediated abiotic stress response in Arabidopsis. Plant Cell 20: 1678–92.
Yasuda, S., Okada, K., and Saijo, Y. (2017). A look at plant immunity through the window of the multitasking coreceptor BAK1. Curr. Opin. Plant Biol. 38: 10–18.
Yeh, Y.-H., Panzeri, D., Kadota, Y., Huang, Y.-C., Huang, P.-Y., Tao, C.-N., Roux, M., Chien, H.-C., Chin, T.-C., Chu, P.-W., Zipfel, C., and Zimmerli, L. (2016). The Arabidopsis Malectin-Like/LRR-RLK IOS1 is Critical for BAK1-Dependent and BAK1-Independent Pattern-Triggered Immunity. Plant Cell 28: 1701–1721.
Yeo, M.T.S., Carella, P., Fletcher, J., Champigny, M.J., Weretilnyk, E.A., and Cameron, R.K. (2015). Development of a Pseudomonas syringae-Eutrema salsugineum pathosystem to investigate disease resistance in a stress tolerant extremophile model plant. Plant Pathol. 64: 297–306.
Yu, C.-P., Lin, J.-J., and Li, W.-H. (2016). Positional distribution of transcription factor binding sites in Arabidopsis thaliana. Sci. Rep. 6: 25164.
Yu, X., Feng, B., He, P., and Shan, L. (2017). From Chaos to Harmony: Responses and Signaling Upon Microbial Pattern Recognition. Annu. Rev. Phytopathol 55: 1–529.
Zhang, J. et al. (2010). Receptor-like cytoplasmic kinases integrate signaling from multiple plant immune receptors and are targeted by a Pseudomonas syringae effector. Cell Host Microbe 7: 290–301.
Zhang, J., Feng, J., Lu, J., Yang, Y., Zhang, X., Wan, D., and Liu, J. (2014). Transcriptome differences between two sister desert poplar species under salt stress. BMC Genomics 15: 337.
Zhang, J. and Zhou, J.-M. (2010). Plant Immunity Triggered by Microbial Molecular Signatures. Mol. Plant 3: 783–793.
Zhang, W., Fraiture, M., Kolb, D., Löffelhardt, B., Desaki, Y., Boutrot, F.F.G., Tör, M., Zipfel, C., Gust, A.A., and Brunner, F. (2013a). Arabidopsis receptor-like protein30 and receptor-like kinase suppressor of BIR1-1/EVERSHED mediate innate immunity to necrotrophic fungi. Plant Cell 25: 4227–41.
Zhang, X., Yao, J., Zhang, Y., Sun, Y., and Mou, Z. (2013b). The Arabidopsis Mediator complex subunits MED14/SWP and MED16/SFR6/IEN1 differentially regulate defense gene expression in plant immune responses. Plant J. 75: 484–497.
Zhang, Z.F., Li, Y.Y., and Xiao, B.Z. (2016). Comparative transcriptome analysis highlights the crucial roles of photosynthetic system in drought stress adaptation in upland rice. Sci. Rep. 6: 19349.
Zhao, J., Favero, D.S., Peng, H., and Neff, M.M. (2013). Arabidopsis thaliana AHL family modulates hypocotyl growth redundantly by interacting with each other via the PPC/DUF296 domain. Proc. Natl. Acad. Sci. 110: E4688–E4697.
Zhao, J., Favero, D.S., Qiu, J., Roalson, E.H., and Neff, M.M. (2014). Insights into the evolution and diversification of the AT-hook Motif Nuclear Localized gene family in land plants. BMC Plant Biol. 14: 266.
Zheng, X.-Y., Spivey, N.W., Zeng, W., Liu, P.-P., Fu, Z.Q., Klessig, D.F., He, S.Y., and Dong, X. (2012). Coronatine promotes Pseudomonas syringae virulence in plants by activating a signaling cascade that inhibits salicylic acid accumulation. Cell Host Microbe 11: 587–96.
Zhu, J.-K. (2001). Plant salt tolerance. Trends Plant Sci. 6: 66–71. Zipfel, C., Kunze, G., Chinchilla, D., Caniard, A., Jones, J.D.G., Boller, T., and Felix, G. (2006).
Perception of the bacterial PAMP EF-Tu by the receptor EFR restricts Agrobacterium-mediated transformation. Cell 125: 749–60.
Zipfel, C., Robatzek, S., Navarro, L., Oakeley, E.J., Jones, J.D.G., Felix, G., and Boller, T. (2004). Bacterial disease resistance in Arabidopsis through flagellin perception. Nature 428: 764–767.
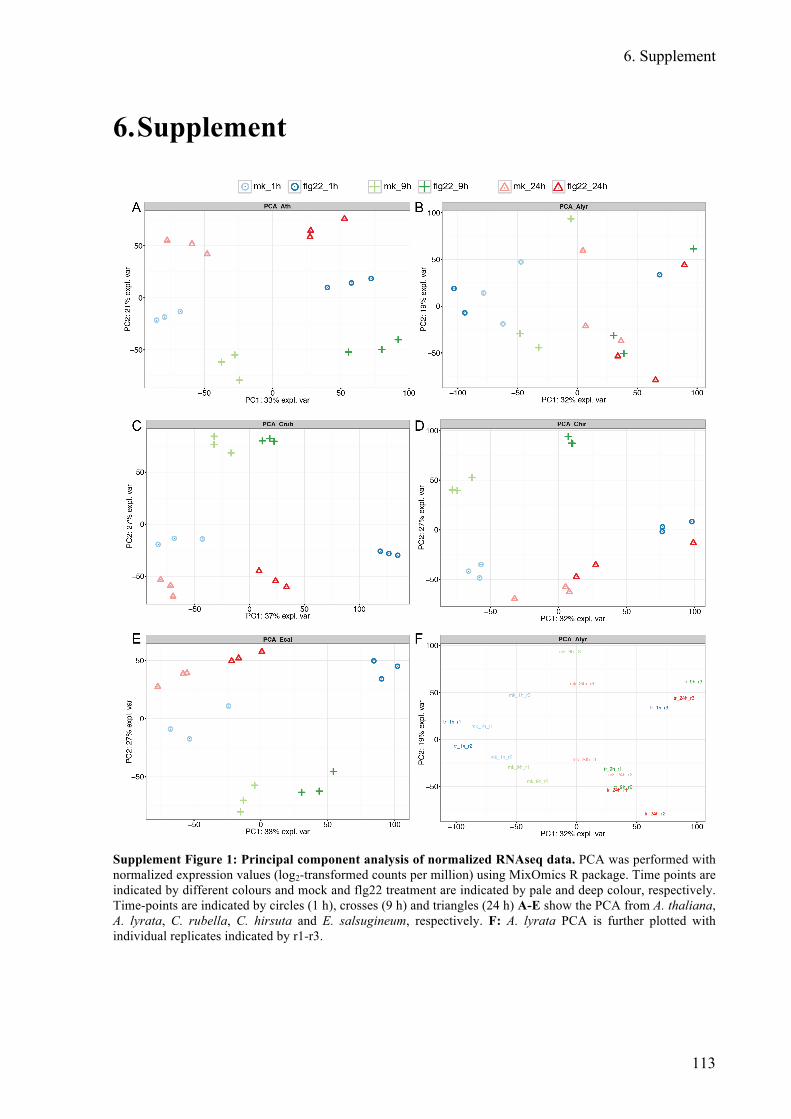
6. Supplement
113
6. Supplement
Supplement Figure 1: Principal component analysis of normalized RNAseq data. PCA was performed with normalized expression values (log2-transformed counts per million) using MixOmics R package. Time points are indicated by different colours and mock and flg22 treatment are indicated by pale and deep colour, respectively. Time-points are indicated by circles (1 h), crosses (9 h) and triangles (24 h) A-E show the PCA from A. thaliana, A. lyrata, C. rubella, C. hirsuta and E. salsugineum, respectively. F: A. lyrata PCA is further plotted with individual replicates indicated by r1-r3.

6. Supplement
114
Supplement Figure 2: Overlap of DEGs at different time-points. Venn diagrams showing shared DEGs between species at 1 h (A), 9 h (B), and 24 h (C) after flg22-treatment. All DEGs which are differentially expressed in at least 1 species at the respective time points were used.

6. Supplement
115
Supplement Figure 3: flg22-triggered bacterial suppression does not correlate with marker gene induction 24 h after flg22 treatment. A: 5-week-old Brassicaceae plants were syringe-infiltrated with 1 µM flg22 or mock 24 h prior to infiltration with Pto DC3000 (OD600 = 0.0002). The bacterial titer was determined 48 h after bacterial infiltration by measuring the DNA amount of the Pseudomonas syringae specific OprF gene relative to the plant ACT2 gene by qPCR. Bars represent the means ±SE from 2 independent experiments with each 3 biological replicates (n = 6). Different letters indicate statistically significant differences (mixed linear model followed by

6. Supplement
116
Student´s t-test; adjusted p < 0.01). B, C, D: 12-day-old Brassicaceae seedlings grown on 1⁄2 MS-medium were treated with 1⁄2 MS media (mock) or 1 µM flg22 for 1, 9 or 24 h. Expression of three marker-genes extracted from the heatmap in Figure 7C namely SARD1 C, CBP60g C and PBS3 D was quantified via RT-qPCR. Bars represent the means ±SE from 2 independent experiments and asterisks indicate significant differences between flg22 and mock samples (mixed linear model followed by Student´s t-test; **, p <0.01) Ath, Arabidopsis thaliana Col-0; Cru, Capsella rubella; Cgr, Capsella grandiflora; Chi_Ox, Chi_GR, Chi_Ol, different Cardamina hirsuta accessions; Esa_Sh, Eutrema salsugineum Shandong; Esa_YT, Esa Yukon; Tha, Thellungiella halophila.

6. Supplement
117
Supplement Figure 4: Heatmap for all DEGs in Brassicaceae species after flg22 treatment. Heatmap of all 6106 DEGs in all Brassicaceae species generated using k-means clustering. All DEGs which are at least differentially expressed at 1 time point in 1 species were used. Expression changes are shown. Species-specific expression signatures shown in Figure 9A are indicated by coloured bars on the right side.

6. Supplement
118
Supplement Figure 5: Comparison of two different mapping approaches for A. thaliana accessions RNAseq reads. RNAseq reads were mapped to the Col-0 (TAIR10) reference genome (left) or to individual A. thaliana accession genomes generated in this study using SNP data (right). This comparison was made to test whether highly similar transcriptome responses were caused by mapping RNAseq reads of different accessions onto the single Col-0 genome. Since both mapping methods yielded similar results, the data mapped to the Col-0 reference genome was used throughout this study.

6. Supplement
119
Supplement Figure 6: Variation in coding and upstream sequences does not explain lineage –specific expression signatures in response to flg22. A: Brassicaceae and A. thaliana accession expression changes 1 h after flg22 treatment were normalized and analysed together. All 5961 DEGs were clustered using k-mean clustering and lineage-specific expression signatures are highlighted by coloured bars on the right side of the heatmap as shown in Figure 6A. B, C: Coloured lines represent the mean % identity of amino acid sequences (B) and 500 bp sequences upstream of the transcription start site (C) for each cluster in each species compared to A. thaliana Col-0.
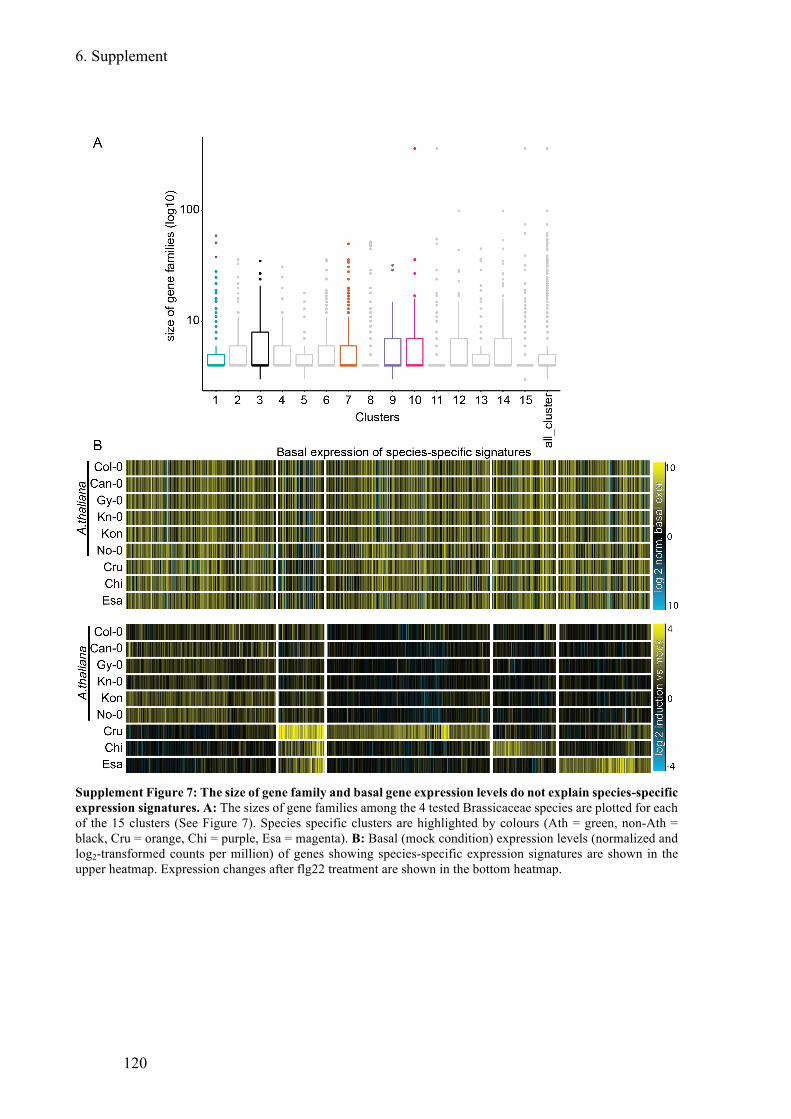
6. Supplement
120
Supplement Figure 7: The size of gene family and basal gene expression levels do not explain species-specific expression signatures. A: The sizes of gene families among the 4 tested Brassicaceae species are plotted for each of the 15 clusters (See Figure 7). Species specific clusters are highlighted by colours (Ath = green, non-Ath = black, Cru = orange, Chi = purple, Esa = magenta). B: Basal (mock condition) expression levels (normalized and log2-transformed counts per million) of genes showing species-specific expression signatures are shown in the upper heatmap. Expression changes after flg22 treatment are shown in the bottom heatmap.

6. Supplement
121
Supplement Figure 8: Some of key secondary metabolism genes are lowly expressed in C. rubella compared to other Brassicaceae species. Mean expression values ± SE (log2-transformed counts per million) of mock and flg22-treated samples in RNAseq for genes exhibiting significantly different flg22-triggered expression changes in C. rubella compared to other Brassicaceae species were plotted.
Supplement Figure 9: Conserved heat-stress responses in tested Brassicaceae species. 12-day-old Brassicaceae seedlings were transferred for 1 h to 22°C (control) or 38°C (heat-stress) and expression of heat-responsive marker genes HSP70 and HSP90.1 was quantified using RT-qPCR. Bars represent the means ±SE from 3 independent experiments (n = 3). Different letters indicate significant differences (mixed linear model followed by Student´s t-test; adjusted p < 0.01).
Supplement Figure 10: Heatmap for all DEGs in Brassicaceae species after heat stress treatment. Heatmap visualizing expression changes of all 5186 DEGs after 1 h heat stress in all tested Brassicaceae species generated using k-means clustering. In contrast to Figure 16, the RNAseq data depicted here was normalized and analyzed together for all four Brassicaceae, excluding genes with low expression in specific species.

6. Supplement
122
Supplement Table 1: Mapping statistics of RNAseq reads from flg22 RNAseq dataset
Species reference genome mean No reads [Mio] % mapped reads % counted Ath (Col-0) Col-0 (TAIR10) 33.63 98.27 85.07 Cru v1.0 33.53 94.72 87.44 Chi v1.0 33.76 98.09 83.42 Esa v1.0 32.23 96.88 87.87 Can-0 Col-0 (TAIR10) 20.40 97.66 92.02 Gy-0 Col-0 (TAIR10) 23.59 98.03 92.59 Kn-0 Col-0 (TAIR10) 21.43 98.08 92.30 Kondora Col-0 (TAIR10) 21.27 97.94 92.37 No-0 Col-0 (TAIR10) 20.85 97.94 92.12 Can-0 Ca0 20.40 96.78 92.01 Gy-0 Gy0 23.59 96.90 91.13 Kn-0 Kn0 21.43 97.18 92.26 Kondora Kon 21.27 97.16 92.35 No-0 No0 20.85 96.77 91.98
Supplement Table 2: Mapping statistics of RNAseq reads from heat-stress RNAseq dataset
Species reference genome mean No reads [Mio] % mapped reads % counted Ath (Col-0) Col-0 (TAIR10) 21.86 98.67 91.25 Cru v1.0 20.78 95.96 83.46 Chi v1.0 19.71 90.96 73.08 Esa v1.0 21.37 92.63 83.35
Supplement Table 3: Overrepresented GO-terms for DEGs expression clusters 1h after flg22 treatment. The top 30 most significantly enriched biological processes were determined for each expression cluster depicted in Supplemental Figure 4. Grey terms have a adjusted p-value over 0.05 and are not considered significantly enriched.
Cluster adj. p-value GO_ID No. Genes Description 1 7.70E-02 50896 73 response to stimulus 1 2.33E-01 6790 9 sulfur metabolic process 1 2.33E-01 9733 12 response to auxin stimulus 1 2.33E-01 9719 24 response to endogenous stimulus 1 2.33E-01 44272 6 sulfur compound biosynthetic process 1 2.33E-01 44281 32 small molecule metabolic process 1 2.33E-01 44283 19 small molecule biosynthetic process 1 2.33E-01 9611 7 response to wounding 1 2.33E-01 6950 42 response to stress 1 2.33E-01 9725 21 response to hormone stimulus 1 2.33E-01 42221 38 response to chemical stimulus 1 2.33E-01 44242 4 cellular lipid catabolic process 1 2.33E-01 16559 2 peroxisome fission 1 2.33E-01 42762 2 regulation of sulfur metabolic process 1 2.33E-01 19758 3 glycosinolate biosynthetic process 1 2.33E-01 19761 3 glucosinolate biosynthetic process 1 2.33E-01 16144 3 S-glycoside biosynthetic process 1 2.33E-01 19748 11 secondary metabolic process 1 2.33E-01 96 4 sulfur amino acid metabolic process 1 2.33E-01 44282 7 small molecule catabolic process 1 2.33E-01 43289 2 apocarotenoid biosynthetic process 1 2.33E-01 9688 2 abscisic acid biosynthetic process 1 2.33E-01 50794 50 regulation of cellular process 1 2.33E-01 10033 25 response to organic substance 1 2.33E-01 16042 4 lipid catabolic process 1 2.33E-01 31668 6 cellular response to extracellular stimulus 1 2.33E-01 42545 6 cell wall modification 1 2.33E-01 71496 6 cellular response to external stimulus 1 2.33E-01 724 2 double-strand break repair via homologous recombination 1 2.33E-01 725 2 recombinational repair 2 3.56E-18 10200 19 response to chitin 2 3.15E-15 9743 20 response to carbohydrate stimulus 2 5.78E-13 42221 48 response to chemical stimulus 2 5.30E-12 10033 36 response to organic substance 2 2.95E-10 50896 62 response to stimulus

6. Supplement
123
Cluster adj. p-value GO_ID No. Genes Description 2 7.93E-10 50832 13 defense response to fungus 2 1.96E-09 9620 14 response to fungus 2 2.56E-09 6952 25 defense response 2 7.54E-08 51707 21 response to other organism 2 1.40E-07 9607 21 response to biotic stimulus 2 3.09E-07 51704 23 multi-organism process 2 4.79E-06 6950 37 response to stress 2 1.74E-05 2376 13 immune system process 2 1.79E-05 43687 26 post-translational protein modification 2 2.54E-05 16998 5 cell wall macromolecule catabolic process 2 2.68E-05 31347 7 regulation of defense response 2 2.68E-05 6468 22 protein amino acid phosphorylation 2 4.57E-05 6464 27 protein modification process 2 4.92E-05 6955 12 immune response 2 4.92E-05 2679 3 respiratory burst involved in defense response 2 4.92E-05 51865 3 protein autoubiquitination 2 4.92E-05 10185 3 regulation of cellular defense response 2 6.68E-05 80134 7 regulation of response to stress 2 6.77E-05 16310 22 phosphorylation 2 7.10E-05 42742 10 defense response to bacterium 2 7.60E-05 60548 4 negative regulation of cell death 2 9.96E-05 45730 3 respiratory burst 2 1.33E-04 10941 5 regulation of cell death 2 1.76E-04 6796 22 phosphate metabolic process 2 1.76E-04 6793 22 phosphorus metabolic process 3 7.36E-02 6468 12 protein amino acid phosphorylation 3 7.36E-02 16310 12 phosphorylation 3 7.36E-02 9901 2 anther dehiscence 3 7.36E-02 6796 12 phosphate metabolic process 3 7.36E-02 6793 12 phosphorus metabolic process 3 8.33E-02 9900 2 dehiscence 3 8.33E-02 8219 5 cell death 3 8.33E-02 16265 5 death 3 8.33E-02 6950 17 response to stress 3 8.33E-02 43687 12 post-translational protein modification 3 8.33E-02 6464 13 protein modification process 3 1.11E-01 1561 1 fatty acid alpha-oxidation 3 1.26E-01 50896 24 response to stimulus 3 1.28E-01 70882 3 cellular cell wall organization or biogenesis 3 1.28E-01 6952 8 defense response 3 1.28E-01 43412 13 macromolecule modification 3 1.28E-01 5975 9 carbohydrate metabolic process 3 1.28E-01 12501 4 programmed cell death 3 1.40E-01 45490 1 pectin catabolic process 3 1.47E-01 48653 2 anther development 3 1.47E-01 44262 6 cellular carbohydrate metabolic process 3 1.47E-01 9830 1 cell wall modification involved in abscission 3 1.47E-01 43650 1 dicarboxylic acid biosynthetic process 3 1.47E-01 9423 1 chorismate biosynthetic process 3 1.47E-01 44277 1 cell wall disassembly 3 1.47E-01 15700 1 arsenite transport 3 1.47E-01 60871 1 cellular cell wall disassembly 3 1.76E-01 6915 3 apoptosis 3 1.76E-01 46713 1 boron transport 3 1.76E-01 6094 1 gluconeogenesis 4 3.89E-07 10033 24 response to organic substance 4 4.69E-07 50896 43 response to stimulus 4 5.78E-07 10200 9 response to chitin 4 5.78E-07 9607 17 response to biotic stimulus 4 1.79E-06 51707 16 response to other organism 4 2.73E-06 9743 10 response to carbohydrate stimulus 4 2.84E-06 6952 17 defense response 4 1.21E-05 42221 27 response to chemical stimulus 4 1.50E-05 6950 28 response to stress 4 3.63E-05 51704 16 multi-organism process 4 2.03E-03 9867 4 jasmonic acid mediated signaling pathway 4 2.03E-03 71395 4 cellular response to jasmonic acid stimulus 4 3.58E-03 6955 8 immune response 4 3.64E-03 31348 3 negative regulation of defense response 4 3.95E-03 2376 8 immune system process 4 3.95E-03 9753 6 response to jasmonic acid stimulus 4 6.50E-03 9814 5 defense response, incompatible interaction 4 6.99E-03 2238 2 response to molecule of fungal origin 4 7.24E-03 9617 7 response to bacterium 4 7.53E-03 23052 15 signaling

6. Supplement
124
Cluster adj. p-value GO_ID No. Genes Description 4 8.55E-03 31347 4 regulation of defense response 4 8.55E-03 9697 2 salicylic acid biosynthetic process 4 8.80E-03 45087 7 innate immune response 4 9.06E-03 23033 11 signaling pathway 4 1.03E-02 42742 6 defense response to bacterium 4 1.03E-02 23046 10 signaling process 4 1.03E-02 23060 10 signal transmission 4 1.28E-02 80134 4 regulation of response to stress 4 1.88E-02 42762 2 regulation of sulfur metabolic process 4 1.88E-02 35556 4 intracellular signal transduction 5 1.46E-06 10200 7 response to chitin 5 2.85E-05 9743 7 response to carbohydrate stimulus 5 2.37E-03 45449 13 regulation of transcription 5 2.37E-03 10556 13 regulation of macromolecule biosynthetic process 5 2.37E-03 19219 13 regulation of nucleobase, nucleoside, nucleotide and nucleic
acid metabolic process 5 2.37E-03 31326 13 regulation of cellular biosynthetic process 5 2.37E-03 9889 13 regulation of biosynthetic process 5 2.37E-03 51171 13 regulation of nitrogen compound metabolic process 5 3.07E-03 80090 13 regulation of primary metabolic process 5 3.48E-03 10468 13 regulation of gene expression 5 3.50E-03 31323 13 regulation of cellular metabolic process 5 3.50E-03 60255 13 regulation of macromolecule metabolic process 5 3.50E-03 10033 10 response to organic substance 5 3.71E-03 42221 13 response to chemical stimulus 5 6.47E-03 19222 13 regulation of metabolic process 5 2.22E-02 50896 17 response to stimulus 5 2.43E-02 46864 1 isoprenoid transport 5 2.43E-02 46865 1 terpenoid transport 5 3.63E-02 9723 3 response to ethylene stimulus 5 3.68E-02 6355 7 regulation of transcription, DNA-dependent 5 3.68E-02 51252 7 regulation of RNA metabolic process 5 6.02E-02 50794 13 regulation of cellular process 5 7.57E-02 15692 1 lead ion transport 5 1.52E-01 50789 13 regulation of biological process 5 1.73E-01 6979 3 response to oxidative stress 5 2.04E-01 65007 14 biological regulation 5 2.23E-01 6536 1 glutamate metabolic process 5 2.57E-01 43562 1 cellular response to nitrogen levels 5 2.57E-01 9725 5 response to hormone stimulus 5 2.57E-01 9751 2 response to salicylic acid stimulus 6 7.27E-07 42221 87 response to chemical stimulus 6 1.06E-05 10033 58 response to organic substance 6 1.06E-05 50896 131 response to stimulus 6 2.71E-05 35466 14 regulation of signaling pathway 6 2.71E-05 9607 37 response to biotic stimulus 6 2.00E-04 51707 34 response to other organism 6 2.22E-04 10646 13 regulation of cell communication 6 2.80E-04 51704 40 multi-organism process 6 3.38E-04 70887 26 cellular response to chemical stimulus 6 3.53E-04 48583 16 regulation of response to stimulus 6 4.40E-04 65007 123 biological regulation 6 9.70E-04 6950 78 response to stress 6 9.70E-04 70297 5 regulation of two-component signal transduction system
(phosphorelay) 6 9.70E-04 10104 5 regulation of ethylene mediated signaling pathway 6 1.21E-03 6464 57 protein modification process 6 1.21E-03 9787 7 regulation of abscisic acid mediated signaling pathway 6 1.55E-03 9651 24 response to salt stress 6 1.69E-03 6970 25 response to osmotic stress 6 1.69E-03 50794 95 regulation of cellular process 6 1.71E-03 9719 42 response to endogenous stimulus 6 1.92E-03 23033 34 signaling pathway 6 1.95E-03 35467 7 negative regulation of signaling pathway 6 2.17E-03 10648 7 negative regulation of cell communication 6 2.17E-03 9725 39 response to hormone stimulus 6 3.67E-03 43067 6 regulation of programmed cell death 6 4.32E-03 22622 17 root system development 6 4.32E-03 48364 17 root development 6 4.67E-03 70298 4 negative regulation of two-component signal transduction
system (phosphorelay) 6 4.67E-03 42631 4 cellular response to water deprivation 6 4.67E-03 10105 4 negative regulation of ethylene mediated signaling pathway 7 2.00E-01 42219 4 cellular amino acid derivative catabolic process 7 2.00E-01 9861 3 jasmonic acid and ethylene-dependent systemic resistance

6. Supplement
125
Cluster adj. p-value GO_ID No. Genes Description 7 2.00E-01 15893 4 drug transport 7 2.00E-01 42493 4 response to drug 7 2.50E-01 48468 9 cell development 7 2.50E-01 9888 11 tissue development 7 2.50E-01 19439 3 aromatic compound catabolic process 7 2.50E-01 22622 10 root system development 7 2.50E-01 48364 10 root development 7 2.50E-01 6575 10 cellular amino acid derivative metabolic process 7 2.50E-01 38 3 very long-chain fatty acid metabolic process 7 2.50E-01 44281 32 small molecule metabolic process 7 2.50E-01 9698 7 phenylpropanoid metabolic process 7 2.50E-01 16126 3 sterol biosynthetic process 7 2.50E-01 9719 23 response to endogenous stimulus 7 2.50E-01 6725 11 cellular aromatic compound metabolic process 7 2.50E-01 272 3 polysaccharide catabolic process 7 2.50E-01 6855 3 drug transmembrane transport 7 2.50E-01 9653 16 anatomical structure morphogenesis 7 2.50E-01 6810 36 transport 7 2.50E-01 44262 14 cellular carbohydrate metabolic process 7 2.50E-01 32989 10 cellular component morphogenesis 7 2.50E-01 16125 3 sterol metabolic process 7 2.50E-01 50896 67 response to stimulus 7 2.50E-01 51179 37 localization 7 2.50E-01 51234 36 establishment of localization 7 2.50E-01 904 6 cell morphogenesis involved in differentiation 7 2.50E-01 6913 4 nucleocytoplasmic transport 7 2.50E-01 51169 4 nuclear transport 7 2.50E-01 9734 3 auxin mediated signaling pathway 8 2.89E-04 65007 105 biological regulation 8 2.02E-03 50794 81 regulation of cellular process 8 2.91E-03 50789 88 regulation of biological process 8 6.79E-03 19219 54 regulation of nucleobase, nucleoside, nucleotide and nucleic
acid metabolic process 8 6.79E-03 10556 53 regulation of macromolecule biosynthetic process 8 6.79E-03 45449 52 regulation of transcription 8 6.79E-03 51171 54 regulation of nitrogen compound metabolic process 8 8.56E-03 31326 53 regulation of cellular biosynthetic process 8 8.56E-03 9889 53 regulation of biosynthetic process 8 8.56E-03 7389 10 pattern specification process 8 8.56E-03 31323 56 regulation of cellular metabolic process 8 1.00E-02 80090 54 regulation of primary metabolic process 8 1.00E-02 60255 56 regulation of macromolecule metabolic process 8 1.22E-02 9719 33 response to endogenous stimulus 8 1.49E-02 10468 54 regulation of gene expression 8 1.96E-02 19222 58 regulation of metabolic process 8 2.19E-02 9938 3 negative regulation of gibberellic acid mediated signaling
pathway 8 2.29E-02 6869 10 lipid transport 8 2.50E-02 48878 9 chemical homeostasis 8 2.56E-02 3002 8 regionalization 8 3.27E-02 42592 12 homeostatic process 8 3.36E-02 6833 3 water transport 8 3.36E-02 42044 3 fluid transport 8 3.46E-02 9725 29 response to hormone stimulus 8 3.89E-02 10876 10 lipid localization 8 4.07E-02 51457 2 maintenance of protein location in nucleus 8 6.33E-02 9937 3 regulation of gibberellic acid mediated signaling pathway 8 6.33E-02 50896 87 response to stimulus 8 6.33E-02 10033 35 response to organic substance 8 9.77E-02 45165 4 cell fate commitment 9 5.12E-02 9926 4 auxin polar transport 9 5.12E-02 60918 4 auxin transport 9 5.12E-02 9914 4 hormone transport 9 8.70E-02 10540 2 basipetal auxin transport 9 8.70E-02 6820 4 anion transport 9 1.85E-01 6817 2 phosphate transport 9 1.85E-01 15698 3 inorganic anion transport 9 1.85E-01 65008 10 regulation of biological quality 9 1.85E-01 43086 3 negative regulation of catalytic activity 9 1.85E-01 51346 1 negative regulation of hydrolase activity 9 1.85E-01 43666 1 regulation of phosphoprotein phosphatase activity 9 1.85E-01 10921 1 regulation of phosphatase activity 9 1.85E-01 10923 1 negative regulation of phosphatase activity 9 1.85E-01 32515 1 negative regulation of phosphoprotein phosphatase activity 9 1.85E-01 60191 1 regulation of lipase activity
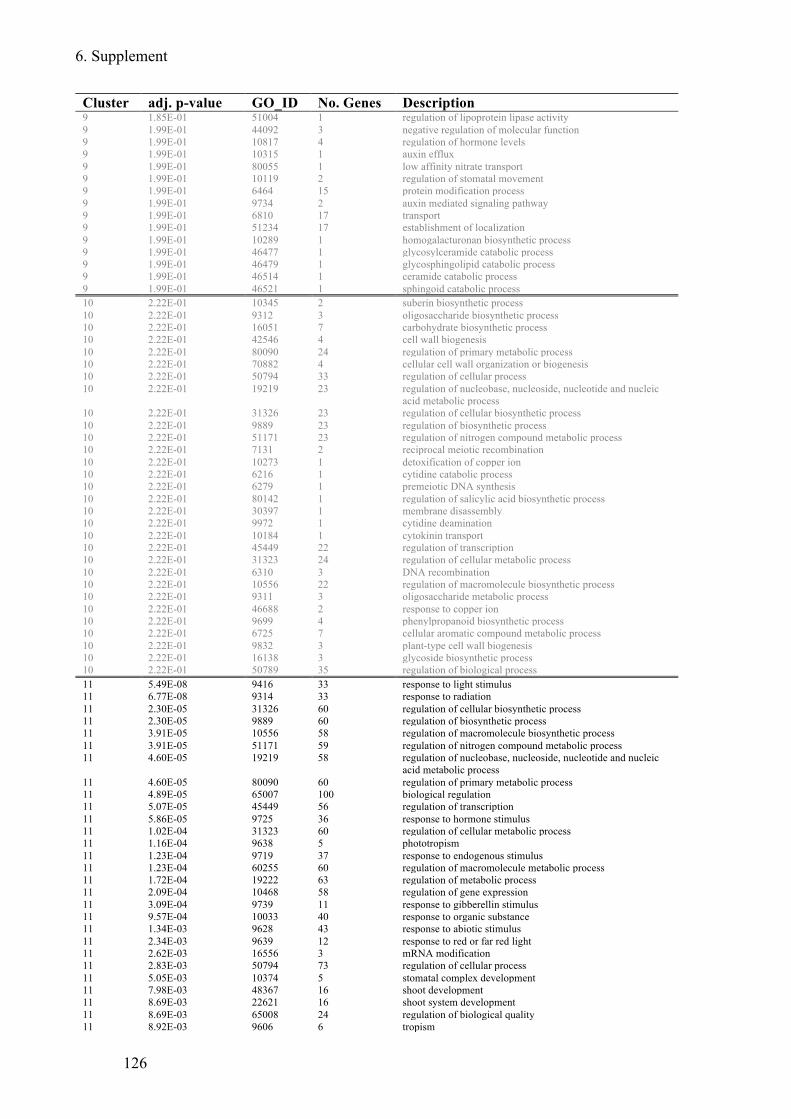
6. Supplement
126
Cluster adj. p-value GO_ID No. Genes Description 9 1.85E-01 51004 1 regulation of lipoprotein lipase activity 9 1.99E-01 44092 3 negative regulation of molecular function 9 1.99E-01 10817 4 regulation of hormone levels 9 1.99E-01 10315 1 auxin efflux 9 1.99E-01 80055 1 low affinity nitrate transport 9 1.99E-01 10119 2 regulation of stomatal movement 9 1.99E-01 6464 15 protein modification process 9 1.99E-01 9734 2 auxin mediated signaling pathway 9 1.99E-01 6810 17 transport 9 1.99E-01 51234 17 establishment of localization 9 1.99E-01 10289 1 homogalacturonan biosynthetic process 9 1.99E-01 46477 1 glycosylceramide catabolic process 9 1.99E-01 46479 1 glycosphingolipid catabolic process 9 1.99E-01 46514 1 ceramide catabolic process 9 1.99E-01 46521 1 sphingoid catabolic process 10 2.22E-01 10345 2 suberin biosynthetic process 10 2.22E-01 9312 3 oligosaccharide biosynthetic process 10 2.22E-01 16051 7 carbohydrate biosynthetic process 10 2.22E-01 42546 4 cell wall biogenesis 10 2.22E-01 80090 24 regulation of primary metabolic process 10 2.22E-01 70882 4 cellular cell wall organization or biogenesis 10 2.22E-01 50794 33 regulation of cellular process 10 2.22E-01 19219 23 regulation of nucleobase, nucleoside, nucleotide and nucleic
acid metabolic process 10 2.22E-01 31326 23 regulation of cellular biosynthetic process 10 2.22E-01 9889 23 regulation of biosynthetic process 10 2.22E-01 51171 23 regulation of nitrogen compound metabolic process 10 2.22E-01 7131 2 reciprocal meiotic recombination 10 2.22E-01 10273 1 detoxification of copper ion 10 2.22E-01 6216 1 cytidine catabolic process 10 2.22E-01 6279 1 premeiotic DNA synthesis 10 2.22E-01 80142 1 regulation of salicylic acid biosynthetic process 10 2.22E-01 30397 1 membrane disassembly 10 2.22E-01 9972 1 cytidine deamination 10 2.22E-01 10184 1 cytokinin transport 10 2.22E-01 45449 22 regulation of transcription 10 2.22E-01 31323 24 regulation of cellular metabolic process 10 2.22E-01 6310 3 DNA recombination 10 2.22E-01 10556 22 regulation of macromolecule biosynthetic process 10 2.22E-01 9311 3 oligosaccharide metabolic process 10 2.22E-01 46688 2 response to copper ion 10 2.22E-01 9699 4 phenylpropanoid biosynthetic process 10 2.22E-01 6725 7 cellular aromatic compound metabolic process 10 2.22E-01 9832 3 plant-type cell wall biogenesis 10 2.22E-01 16138 3 glycoside biosynthetic process 10 2.22E-01 50789 35 regulation of biological process 11 5.49E-08 9416 33 response to light stimulus 11 6.77E-08 9314 33 response to radiation 11 2.30E-05 31326 60 regulation of cellular biosynthetic process 11 2.30E-05 9889 60 regulation of biosynthetic process 11 3.91E-05 10556 58 regulation of macromolecule biosynthetic process 11 3.91E-05 51171 59 regulation of nitrogen compound metabolic process 11 4.60E-05 19219 58 regulation of nucleobase, nucleoside, nucleotide and nucleic
acid metabolic process 11 4.60E-05 80090 60 regulation of primary metabolic process 11 4.89E-05 65007 100 biological regulation 11 5.07E-05 45449 56 regulation of transcription 11 5.86E-05 9725 36 response to hormone stimulus 11 1.02E-04 31323 60 regulation of cellular metabolic process 11 1.16E-04 9638 5 phototropism 11 1.23E-04 9719 37 response to endogenous stimulus 11 1.23E-04 60255 60 regulation of macromolecule metabolic process 11 1.72E-04 19222 63 regulation of metabolic process 11 2.09E-04 10468 58 regulation of gene expression 11 3.09E-04 9739 11 response to gibberellin stimulus 11 9.57E-04 10033 40 response to organic substance 11 1.34E-03 9628 43 response to abiotic stimulus 11 2.34E-03 9639 12 response to red or far red light 11 2.62E-03 16556 3 mRNA modification 11 2.83E-03 50794 73 regulation of cellular process 11 5.05E-03 10374 5 stomatal complex development 11 7.98E-03 48367 16 shoot development 11 8.69E-03 22621 16 shoot system development 11 8.69E-03 65008 24 regulation of biological quality 11 8.92E-03 9606 6 tropism
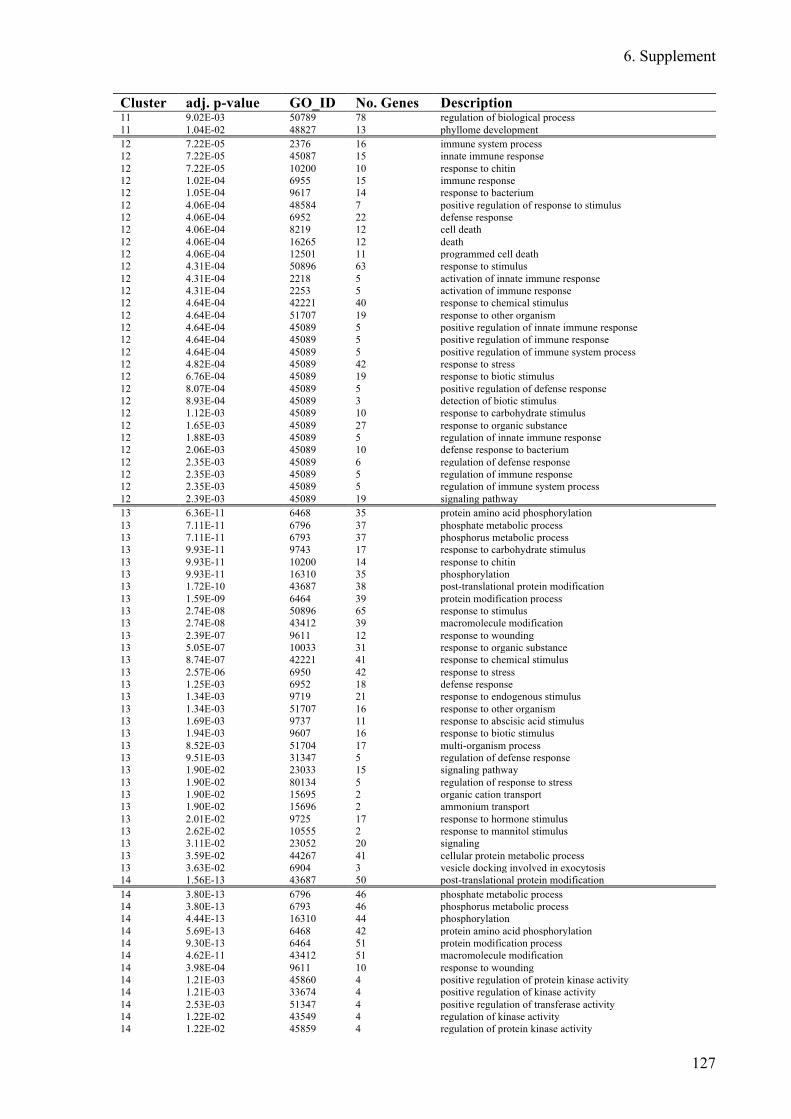
6. Supplement
127
Cluster adj. p-value GO_ID No. Genes Description 11 9.02E-03 50789 78 regulation of biological process 11 1.04E-02 48827 13 phyllome development 12 7.22E-05 2376 16 immune system process 12 7.22E-05 45087 15 innate immune response 12 7.22E-05 10200 10 response to chitin 12 1.02E-04 6955 15 immune response 12 1.05E-04 9617 14 response to bacterium 12 4.06E-04 48584 7 positive regulation of response to stimulus 12 4.06E-04 6952 22 defense response 12 4.06E-04 8219 12 cell death 12 4.06E-04 16265 12 death 12 4.06E-04 12501 11 programmed cell death 12 4.31E-04 50896 63 response to stimulus 12 4.31E-04 2218 5 activation of innate immune response 12 4.31E-04 2253 5 activation of immune response 12 4.64E-04 42221 40 response to chemical stimulus 12 4.64E-04 51707 19 response to other organism 12 4.64E-04 45089 5 positive regulation of innate immune response 12 4.64E-04 45089 5 positive regulation of immune response 12 4.64E-04 45089 5 positive regulation of immune system process 12 4.82E-04 45089 42 response to stress 12 6.76E-04 45089 19 response to biotic stimulus 12 8.07E-04 45089 5 positive regulation of defense response 12 8.93E-04 45089 3 detection of biotic stimulus 12 1.12E-03 45089 10 response to carbohydrate stimulus 12 1.65E-03 45089 27 response to organic substance 12 1.88E-03 45089 5 regulation of innate immune response 12 2.06E-03 45089 10 defense response to bacterium 12 2.35E-03 45089 6 regulation of defense response 12 2.35E-03 45089 5 regulation of immune response 12 2.35E-03 45089 5 regulation of immune system process 12 2.39E-03 45089 19 signaling pathway 13 6.36E-11 6468 35 protein amino acid phosphorylation 13 7.11E-11 6796 37 phosphate metabolic process 13 7.11E-11 6793 37 phosphorus metabolic process 13 9.93E-11 9743 17 response to carbohydrate stimulus 13 9.93E-11 10200 14 response to chitin 13 9.93E-11 16310 35 phosphorylation 13 1.72E-10 43687 38 post-translational protein modification 13 1.59E-09 6464 39 protein modification process 13 2.74E-08 50896 65 response to stimulus 13 2.74E-08 43412 39 macromolecule modification 13 2.39E-07 9611 12 response to wounding 13 5.05E-07 10033 31 response to organic substance 13 8.74E-07 42221 41 response to chemical stimulus 13 2.57E-06 6950 42 response to stress 13 1.25E-03 6952 18 defense response 13 1.34E-03 9719 21 response to endogenous stimulus 13 1.34E-03 51707 16 response to other organism 13 1.69E-03 9737 11 response to abscisic acid stimulus 13 1.94E-03 9607 16 response to biotic stimulus 13 8.52E-03 51704 17 multi-organism process 13 9.51E-03 31347 5 regulation of defense response 13 1.90E-02 23033 15 signaling pathway 13 1.90E-02 80134 5 regulation of response to stress 13 1.90E-02 15695 2 organic cation transport 13 1.90E-02 15696 2 ammonium transport 13 2.01E-02 9725 17 response to hormone stimulus 13 2.62E-02 10555 2 response to mannitol stimulus 13 3.11E-02 23052 20 signaling 13 3.59E-02 44267 41 cellular protein metabolic process 13 3.63E-02 6904 3 vesicle docking involved in exocytosis 14 1.56E-13 43687 50 post-translational protein modification 14 3.80E-13 6796 46 phosphate metabolic process 14 3.80E-13 6793 46 phosphorus metabolic process 14 4.44E-13 16310 44 phosphorylation 14 5.69E-13 6468 42 protein amino acid phosphorylation 14 9.30E-13 6464 51 protein modification process 14 4.62E-11 43412 51 macromolecule modification 14 3.98E-04 9611 10 response to wounding 14 1.21E-03 45860 4 positive regulation of protein kinase activity 14 1.21E-03 33674 4 positive regulation of kinase activity 14 2.53E-03 51347 4 positive regulation of transferase activity 14 1.22E-02 43549 4 regulation of kinase activity 14 1.22E-02 45859 4 regulation of protein kinase activity

6. Supplement
128
Cluster adj. p-value GO_ID No. Genes Description 14 1.22E-02 50896 60 response to stimulus 14 1.55E-02 44267 53 cellular protein metabolic process 14 1.55E-02 51338 4 regulation of transferase activity 14 1.55E-02 6950 39 response to stress 14 1.55E-02 48317 2 seed morphogenesis 14 1.61E-02 43085 4 positive regulation of catalytic activity 14 1.61E-02 42325 4 regulation of phosphorylation 14 1.74E-02 44093 4 positive regulation of molecular function 14 1.82E-02 9620 8 response to fungus 14 1.86E-02 19220 4 regulation of phosphate metabolic process 14 1.86E-02 51174 4 regulation of phosphorus metabolic process 14 1.86E-02 42221 36 response to chemical stimulus 14 1.86E-02 6952 18 defense response 14 2.59E-02 9607 16 response to biotic stimulus 14 3.23E-02 9743 8 response to carbohydrate stimulus 14 3.30E-02 19538 56 protein metabolic process 14 3.50E-02 10200 6 response to chitin 15 1.11E-10 90304 97 nucleic acid metabolic process 15 5.45E-09 6139 109 nucleobase, nucleoside, nucleotide and nucleic acid metabolic
process 15 6.21E-09 6259 47 DNA metabolic process 15 8.61E-08 34641 130 cellular nitrogen compound metabolic process 15 1.49E-07 6807 133 nitrogen compound metabolic process 15 2.26E-06 32501 140 multicellular organismal process 15 8.59E-06 6974 27 response to DNA damage stimulus 15 8.95E-06 6281 26 DNA repair 15 9.22E-06 7275 132 multicellular organismal development 15 1.36E-05 48608 71 reproductive structure development 15 1.49E-05 9791 81 post-embryonic development 15 2.06E-05 6260 19 DNA replication 15 2.10E-05 32502 140 developmental process 15 2.15E-05 9314 51 response to radiation 15 4.01E-05 9416 49 response to light stimulus 15 4.01E-05 7167 19 enzyme linked receptor protein signaling pathway 15 4.01E-05 7169 19 transmembrane receptor protein tyrosine kinase signaling
pathway 15 5.82E-05 48856 111 anatomical structure development 15 1.10E-04 7018 12 microtubule-based movement 15 1.37E-04 48316 46 seed development 15 1.46E-04 3006 73 reproductive developmental process 15 1.56E-04 7166 20 cell surface receptor linked signaling pathway 15 1.79E-04 8033 11 tRNA processing 15 1.92E-04 9658 14 chloroplast organization 15 2.00E-04 6298 7 mismatch repair 15 2.75E-04 9793 40 embryonic development ending in seed dormancy 15 3.11E-04 9790 44 embryonic development 15 3.42E-04 10154 46 fruit development 15 5.16E-04 7017 17 microtubule-based process 15 5.32E-04 3 77 reproduction

6. Supplement
129
Supplement Table 4: Known TF-motifs enriched in A. thaliana 5´regulatory regions of DEGs. Known TF-motifs were determined using AME for the -500 bp region upstream of the transcriptional start site. The motifs were determined separately for each expression clusters depicted in Supplemental Figure 4.
Cluster Motif ID Binding TF Motif p-val adj. p-val 1 MA1079.1 WRKY21 (NNRGTCAACG) 2.59E-05 0.01256 1 MA1386.1 AT1G25550 (RGAATMTTCND) 6.21E-05 0.02992 1 MA1164.1 AT4G37180 (HARAAGATTCY) 6.45E-05 0.03103 1 MA1089.1 WRKY57 (DWRGTCAAMN) 9.86E-05 0.04706 2 MA1094.1 WRKY8 (NRGTCAAMN) 3.99E-11 1.95E-08 2 MA1089.1 WRKY57 (DWRGTCAAMN) 6.77E-11 3.31E-08 2 MA1088.1 WRKY48 (NNRGTCAAMN) 8.45E-11 4.13E-08 2 MA1317.1 WRKY50 (YKTTGACTTTTTH) 5.57E-10 2.72E-07 2 MA1079.1 WRKY21 (NNRGTCAACG) 1.91E-09 9.33E-07 2 MA1086.1 WRKY43 (HRGTCAAMVN) 2.37E-09 1.16E-06 2 MA1076.1 WRKY15 (NRGTCAACSN) 2.41E-09 1.18E-06 2 MA1085.2 WRKY40 (HWAGTCAANN) 3.91E-09 1.91E-06 2 MA1311.1 WRKY28 (DDCGTTGACTTTT) 9.95E-09 4.87E-06 2 MA1077.1 WRKY18 (NHRGTCAAVV) 1.42E-08 6.95E-06 2 MA1316.1 WRKY71 (AAAAGTCAACG) 2.51E-08 1.23E-05 2 MA1304.1 WRKY59 (HAAAAGTCAAMN) 3.14E-08 1.54E-05 2 MA1315.1 WRKY24 (NCGTTGACTTTTTW) 6.31E-08 3.09E-05 2 MA1295.1 WRKY20 (DNCGTTGACYWDD) 7.89E-08 3.86E-05 2 MA1298.1 WRKY29 (AAAAGTCAACK) 8.81E-08 4.31E-05 2 MA1302.1 WRKY65 (AAAAGTCAACG) 9.02E-08 4.41E-05 2 MA1313.1 WRKY7 (DNCGTTGACTTTTT) 1.88E-07 9.19E-05 2 MA1310.1 WRKY42 (BWTDMHHHNNCGTTGACTWWD) 1.99E-07 9.74E-05 2 MA1305.1 WRKY55 (DNCGTTGACTTT) 2.49E-07 0.0001215 2 MA1303.1 WRKY22 (AAAAGTCAACKNH) 2.55E-07 0.0001244 2 MA1314.1 WRKY14 (AAAAGTCAACGNH) 2.66E-07 0.0001298 2 MA1306.1 WRKY11 (DNCGTTGACTTTTD) 3.70E-07 0.0001808 2 MA1083.1 WRKY30 (RGTCAACGNN) 3.70E-07 0.000181 2 MA1309.1 WRKY3 (AAAAGTCAACG) 5.85E-07 0.0002859 2 MA1301.1 WRKY33 (AAAAGTCAACG) 6.49E-07 0.0003174 2 MA1093.1 WRKY75 (HRGTCAAC) 7.69E-07 0.0003758 2 MA1078.1 WRKY2 (BGGTCAAM) 8.59E-07 0.00042 2 MA1308.1 WRKY70 (DNCGTTGACTTTT) 1.17E-06 0.0005722 2 MA1090.1 WRKY60 (NYGGTCAACSN) 2.33E-06 0.001137 2 MA1081.1 WRKY25 (YGGTCAAC) 2.93E-06 0.001434 2 MA1300.1 WRKY6 (CGTTGACTWWDDYWDWNHH) 4.33E-06 0.002113 2 MA1092.1 WRKY63 (HGGTCAAC) 5.03E-06 0.002458 2 MA1318.1 WRKY27 (ANCGTTGACTTTT) 5.25E-06 0.002562 2 MA1299.1 WRKY17 (AAAAAGTCAACGNH) 6.76E-06 0.003298 2 MA1091.1 WRKY62 (TGGTCAAC) 9.18E-06 0.004479 2 MA1080.1 WRKY23 (AGTCAACG) 9.57E-06 0.004668 2 MA1084.1 WRKY38 (CGTTGACC) 1.05E-05 0.005098 2 MA1087.1 WRKY45 (CGTTGACY) 1.77E-05 0.008601 2 MA1297.1 WRKY26 (AAAAGTCAACGNY) 1.95E-05 0.009502 2 MA1307.1 WRKY31 (DDNNHWRHHAAAGTCAACG) 2.52E-05 0.01226 2 MA1075.1 WRKY12 (CGTTGACC) 2.67E-05 0.01297 2 MA1162.1 TCX2 (WTTYAAAATTYAAAW) 3.17E-05 0.0154 4 MA1089.1 WRKY57 (DWRGTCAAMN) 7.95E-08 3.89E-05 4 MA1088.1 WRKY48 (NNRGTCAAMN) 8.06E-08 3.94E-05 4 MA1077.1 WRKY18 (NHRGTCAAVV) 9.98E-08 4.88E-05 4 MA1094.1 WRKY8 (NRGTCAAMN) 1.39E-07 6.78E-05 4 MA1315.1 WRKY24 (NCGTTGACTTTTTW) 2.50E-07 0.0001224 4 MA1079.1 WRKY21 (NNRGTCAACG) 3.32E-07 0.0001625 4 MA1318.1 WRKY27 (ANCGTTGACTTTT) 3.87E-07 0.0001894 4 MA1083.1 WRKY30 (RGTCAACGNN) 4.37E-07 0.0002138 4 MA1305.1 WRKY55 (DNCGTTGACTTT) 4.96E-07 0.0002425 4 MA1076.1 WRKY15 (NRGTCAACSN) 5.72E-07 0.0002797 4 MA1317.1 WRKY50 (YKTTGACTTTTTH) 7.91E-07 0.0003869 4 MA1295.1 WRKY20 (DNCGTTGACYWDD) 8.22E-07 0.0004018 4 MA1086.1 WRKY43 (HRGTCAAMVN) 9.17E-07 0.0004481 4 MA1087.1 WRKY45 (CGTTGACY) 1.08E-06 0.0005285 4 MA1080.1 WRKY23 (AGTCAACG) 1.21E-06 0.0005895 4 MA1309.1 WRKY3 (AAAAGTCAACG) 1.34E-06 0.0006524 4 MA1085.2 WRKY40 (HWAGTCAANN) 1.46E-06 0.0007128 4 MA1316.1 WRKY71 (AAAAGTCAACG) 1.73E-06 0.0008437 4 MA1308.1 WRKY70 (DNCGTTGACTTTT) 1.78E-06 0.0008701 4 MA1311.1 WRKY28 (DDCGTTGACTTTT) 1.97E-06 0.0009624 4 MA1093.1 WRKY75 (HRGTCAAC) 2.23E-06 0.00109 4 MA1306.1 WRKY11 (DNCGTTGACTTTTD) 2.69E-06 0.001314 4 MA1304.1 WRKY59 (HAAAAGTCAAMN) 2.89E-06 0.001414 4 MA1091.1 WRKY62 (TGGTCAAC) 3.23E-06 0.001576 4 MA1084.1 WRKY38 (CGTTGACC) 3.28E-06 0.001601

6. Supplement
130
Cluster Motif ID Binding TF Motif p-val adj. p-val 4 MA1303.1 WRKY22 (AAAAGTCAACKNH) 3.30E-06 0.001613 4 MA1300.1 WRKY6 (CGTTGACTWWDDYWDWNHH) 3.49E-06 0.001707 4 MA1301.1 WRKY33 (AAAAGTCAACG) 3.95E-06 0.001932 4 MA1314.1 WRKY14 (AAAAGTCAACGNH) 3.97E-06 0.00194 4 MA1092.1 WRKY63 (HGGTCAAC) 4.05E-06 0.001979 4 MA1081.1 WRKY25 (YGGTCAAC) 5.62E-06 0.002745 4 MA1313.1 WRKY7 (DNCGTTGACTTTTT) 7.10E-06 0.003465 4 MA1299.1 WRKY17 (AAAAAGTCAACGNH) 7.43E-06 0.003625 4 MA1090.1 WRKY60 (NYGGTCAACSN) 7.52E-06 0.00367 4 MA1075.1 WRKY12 (CGTTGACC) 9.60E-06 0.004681 4 MA1298.1 WRKY29 (AAAAGTCAACK) 1.43E-05 0.00695 4 MA1302.1 WRKY65 (AAAAGTCAACG) 1.74E-05 0.008489 4 MA1078.1 WRKY2 (BGGTCAAM) 2.20E-05 0.01068 4 MA1307.1 WRKY31 (DDNNHWRHHAAAGTCAACG) 3.63E-05 0.01758 4 MA1312.1 WRKY47 (MYYKNCGTTGACYW) 6.11E-05 0.02943 4 MA1297.1 WRKY26 (AAAAGTCAACGNY) 6.77E-05 0.03256 4 MA1036.1 MYB111 (GKTAGGTR) 7.75E-05 0.03718 4 MA1040.1 MYB46 (GKTAGGTR) 9.06E-05 0.04335 4 MA1310.1 WRKY42 (BWTDMHHHNNCGTTGACTWWD) 0.0001007 0.04806 5 MA1081.1 WRKY25 (YGGTCAAC) 2.10E-12 1.03E-09 5 MA1078.1 WRKY2 (BGGTCAAM) 3.37E-11 1.65E-08 5 MA1092.1 WRKY63 (HGGTCAAC) 3.96E-11 1.94E-08 5 MA1088.1 WRKY48 (NNRGTCAAMN) 1.22E-10 5.94E-08 5 MA1090.1 WRKY60 (NYGGTCAACSN) 3.06E-09 1.50E-06 5 MA1077.1 WRKY18 (NHRGTCAAVV) 3.44E-09 1.68E-06 5 MA1094.1 WRKY8 (NRGTCAAMN) 3.56E-09 1.74E-06 5 MA1295.1 WRKY20 (DNCGTTGACYWDD) 1.40E-08 6.83E-06 5 MA1076.1 WRKY15 (NRGTCAACSN) 1.43E-08 7.00E-06 5 MA1091.1 WRKY62 (TGGTCAAC) 2.25E-08 1.10E-05 5 MA1093.1 WRKY75 (HRGTCAAC) 5.42E-08 2.65E-05 5 MA1086.1 WRKY43 (HRGTCAAMVN) 6.21E-08 3.04E-05 5 MA1084.1 WRKY38 (CGTTGACC) 1.07E-07 5.21E-05 5 MA1089.1 WRKY57 (DWRGTCAAMN) 1.30E-07 6.37E-05 5 MA1079.1 WRKY21 (NNRGTCAACG) 3.39E-07 0.0001659 5 MA1310.1 WRKY42 (BWTDMHHHNNCGTTGACTWWD) 7.01E-07 0.0003428 5 MA1075.1 WRKY12 (CGTTGACC) 7.95E-07 0.0003886 5 MA1300.1 WRKY6 (CGTTGACTWWDDYWDWNHH) 8.20E-07 0.0004008 5 MA1309.1 WRKY3 (AAAAGTCAACG) 1.09E-06 0.0005348 5 MA1301.1 WRKY33 (AAAAGTCAACG) 1.32E-06 0.0006439 5 MA1304.1 WRKY59 (HAAAAGTCAAMN) 1.53E-06 0.0007458 5 MA1083.1 WRKY30 (RGTCAACGNN) 1.59E-06 0.0007766 5 MA1087.1 WRKY45 (CGTTGACY) 2.72E-06 0.001327 5 MA1307.1 WRKY31 (DDNNHWRHHAAAGTCAACG) 2.83E-06 0.001382 5 MA1305.1 WRKY55 (DNCGTTGACTTT) 3.38E-06 0.001652 5 MA1311.1 WRKY28 (DDCGTTGACTTTT) 4.84E-06 0.002363 5 MA0589.1 ZAP1 (TTGACCGAGYY) 7.44E-06 0.003633 5 MA1080.1 WRKY23 (AGTCAACG) 1.02E-05 0.004985 5 MA1315.1 WRKY24 (NCGTTGACTTTTTW) 1.11E-05 0.005413 5 MA1302.1 WRKY65 (AAAAGTCAACG) 1.12E-05 0.005449 5 MA1314.1 WRKY14 (AAAAGTCAACGNH) 1.49E-05 0.007257 5 MA1298.1 WRKY29 (AAAAGTCAACK) 1.80E-05 0.008759 5 MA1317.1 WRKY50 (YKTTGACTTTTTH) 1.92E-05 0.009337 5 MA1297.1 WRKY26 (AAAAGTCAACGNY) 3.71E-05 0.01798 5 MA1303.1 WRKY22 (AAAAGTCAACKNH) 5.98E-05 0.02884 5 MA1316.1 WRKY71 (AAAAGTCAACG) 6.14E-05 0.0296 5 MA1306.1 WRKY11 (DNCGTTGACTTTTD) 7.93E-05 0.03805 5 MA0930.1 ABF3 (ACACGTGT) 9.59E-05 0.04581 6 MA1089.1 WRKY57 (DWRGTCAAMN) 9.53E-10 4.66E-07 6 MA1094.1 WRKY8 (NRGTCAAMN) 1.67E-09 8.14E-07 6 MA1090.1 WRKY60 (NYGGTCAACSN) 1.05E-08 5.15E-06 6 MA1086.1 WRKY43 (HRGTCAAMVN) 1.34E-08 6.53E-06 6 MA1079.1 WRKY21 (NNRGTCAACG) 1.93E-08 9.44E-06 6 MA1304.1 WRKY59 (HAAAAGTCAAMN) 2.65E-08 1.30E-05 6 MA1076.1 WRKY15 (NRGTCAACSN) 2.69E-08 1.32E-05 6 MA1077.1 WRKY18 (NHRGTCAAVV) 3.14E-08 1.54E-05 6 MA1311.1 WRKY28 (DDCGTTGACTTTT) 4.69E-08 2.30E-05 6 MA1302.1 WRKY65 (AAAAGTCAACG) 5.61E-08 2.75E-05 6 MA1088.1 WRKY48 (NNRGTCAAMN) 7.53E-08 3.68E-05 6 MA1316.1 WRKY71 (AAAAGTCAACG) 7.80E-08 3.82E-05 6 MA1091.1 WRKY62 (TGGTCAAC) 7.88E-08 3.85E-05 6 MA1314.1 WRKY14 (AAAAGTCAACGNH) 7.93E-08 3.88E-05 6 MA1087.1 WRKY45 (CGTTGACY) 9.30E-08 4.55E-05 6 MA1295.1 WRKY20 (DNCGTTGACYWDD) 1.15E-07 5.65E-05 6 MA1310.1 WRKY42 (BWTDMHHHNNCGTTGACTWWD) 1.92E-07 9.40E-05 6 MA1305.1 WRKY55 (DNCGTTGACTTT) 1.97E-07 9.64E-05 6 MA1298.1 WRKY29 (AAAAGTCAACK) 2.04E-07 9.96E-05

6. Supplement
131
Cluster Motif ID Binding TF Motif p-val adj. p-val 6 MA1301.1 WRKY33 (AAAAGTCAACG) 2.80E-07 0.0001371 6 MA1303.1 WRKY22 (AAAAGTCAACKNH) 3.06E-07 0.0001497 6 MA1309.1 WRKY3 (AAAAGTCAACG) 5.84E-07 0.0002857 6 MA1315.1 WRKY24 (NCGTTGACTTTTTW) 8.02E-07 0.0003919 6 MA1081.1 WRKY25 (YGGTCAAC) 8.60E-07 0.0004203 6 MA1306.1 WRKY11 (DNCGTTGACTTTTD) 1.08E-06 0.0005298 6 MA1093.1 WRKY75 (HRGTCAAC) 1.09E-06 0.0005322 6 MA1083.1 WRKY30 (RGTCAACGNN) 1.91E-06 0.0009341 6 MA1080.1 WRKY23 (AGTCAACG) 2.47E-06 0.001208 6 MA1308.1 WRKY70 (DNCGTTGACTTTT) 3.05E-06 0.001488 6 MA1092.1 WRKY63 (HGGTCAAC) 3.49E-06 0.001706 6 MA1075.1 WRKY12 (CGTTGACC) 3.50E-06 0.001708 6 MA1084.1 WRKY38 (CGTTGACC) 5.90E-06 0.00288 6 MA1312.1 WRKY47 (MYYKNCGTTGACYW) 6.42E-06 0.003135 6 MA1078.1 WRKY2 (BGGTCAAM) 8.40E-06 0.004097 6 MA1300.1 WRKY6 (CGTTGACTWWDDYWDWNHH) 1.29E-05 0.006281 6 MA1318.1 WRKY27 (ANCGTTGACTTTT) 3.14E-05 0.01524 6 MA1297.1 WRKY26 (AAAAGTCAACGNY) 3.40E-05 0.01648 6 MA1317.1 WRKY50 (YKTTGACTTTTTH) 5.00E-05 0.02414 8 MA1329.1 ATHB25 (THAYTAATTAHNHWW) 2.27E-05 0.01102 8 MA1330.1 ATHB24 (AAWHRTAATTAAKDW) 2.87E-05 0.01395 8 MA1326.1 ATHB33 (NHGTRATTARB) 4.06E-05 0.01968 8 MA0933.1 AHL20 (AATTAAWT) 4.91E-05 0.0237 8 MA0934.1 AHL25 (AWTTAAWT) 4.98E-05 0.02404 11 MA1272.1 AT2G28810 (TTYTTTTTTTTTWACTTTTTB) 6.81E-05 0.03276 12 MA1094.1 WRKY8 (NRGTCAAMN) 1.59E-13 7.75E-11 12 MA1076.1 WRKY15 (NRGTCAACSN) 9.01E-13 4.40E-10 12 MA1079.1 WRKY21 (NNRGTCAACG) 9.19E-13 4.50E-10 12 MA1080.1 WRKY23 (AGTCAACG) 1.09E-12 5.34E-10 12 MA1088.1 WRKY48 (NNRGTCAAMN) 1.25E-12 6.13E-10 12 MA1086.1 WRKY43 (HRGTCAAMVN) 1.84E-12 9.02E-10 12 MA1077.1 WRKY18 (NHRGTCAAVV) 2.61E-12 1.28E-09 12 MA1093.1 WRKY75 (HRGTCAAC) 2.88E-12 1.41E-09 12 MA1295.1 WRKY20 (DNCGTTGACYWDD) 2.96E-12 1.45E-09 12 MA1087.1 WRKY45 (CGTTGACY) 4.56E-12 2.23E-09 12 MA1089.1 WRKY57 (DWRGTCAAMN) 1.18E-11 5.76E-09 12 MA1091.1 WRKY62 (TGGTCAAC) 5.48E-11 2.68E-08 12 MA1305.1 WRKY55 (DNCGTTGACTTT) 8.87E-11 4.34E-08 12 MA1301.1 WRKY33 (AAAAGTCAACG) 9.00E-11 4.40E-08 12 MA1300.1 WRKY6 (CGTTGACTWWDDYWDWNHH) 9.05E-11 4.43E-08 12 MA1084.1 WRKY38 (CGTTGACC) 1.71E-10 8.37E-08 12 MA1081.1 WRKY25 (YGGTCAAC) 2.03E-10 9.94E-08 12 MA1083.1 WRKY30 (RGTCAACGNN) 2.16E-10 1.05E-07 12 MA1078.1 WRKY2 (BGGTCAAM) 2.34E-10 1.15E-07 12 MA1298.1 WRKY29 (AAAAGTCAACK) 3.73E-10 1.83E-07 12 MA1090.1 WRKY60 (NYGGTCAACSN) 4.68E-10 2.29E-07 12 MA1314.1 WRKY14 (AAAAGTCAACGNH) 5.66E-10 2.77E-07 12 MA1307.1 WRKY31 (DDNNHWRHHAAAGTCAACG) 6.45E-10 3.15E-07 12 MA1315.1 WRKY24 (NCGTTGACTTTTTW) 6.47E-10 3.16E-07 12 MA1309.1 WRKY3 (AAAAGTCAACG) 1.20E-09 5.85E-07 12 MA1311.1 WRKY28 (DDCGTTGACTTTT) 1.43E-09 7.01E-07 12 MA1075.1 WRKY12 (CGTTGACC) 2.24E-09 1.09E-06 12 MA1302.1 WRKY65 (AAAAGTCAACG) 3.08E-09 1.51E-06 12 MA1308.1 WRKY70 (DNCGTTGACTTTT) 4.02E-09 1.97E-06 12 MA1303.1 WRKY22 (AAAAGTCAACKNH) 8.02E-09 3.92E-06 12 MA1306.1 WRKY11 (DNCGTTGACTTTTD) 9.53E-09 4.66E-06 12 MA1310.1 WRKY42 (BWTDMHHHNNCGTTGACTWWD) 1.18E-08 5.75E-06 12 MA1316.1 WRKY71 (AAAAGTCAACG) 1.82E-08 8.90E-06 12 MA1092.1 WRKY63 (HGGTCAAC) 2.29E-08 1.12E-05 12 MA1297.1 WRKY26 (AAAAGTCAACGNY) 4.50E-08 2.20E-05 12 MA1304.1 WRKY59 (HAAAAGTCAAMN) 4.77E-08 2.33E-05 12 MA1085.2 WRKY40 (HWAGTCAANN) 2.85E-07 0.0001394 12 MA1312.1 WRKY47 (MYYKNCGTTGACYW) 4.88E-07 0.0002386 12 MA1299.1 WRKY17 (AAAAAGTCAACGNH) 4.98E-06 0.002432 12 MA1318.1 WRKY27 (ANCGTTGACTTTT) 9.37E-06 0.004573 12 MA0589.1 ZAP1 (TTGACCGAGYY) 1.35E-05 0.00656 12 MA1317.1 WRKY50 (YKTTGACTTTTTH) 3.24E-05 0.01572 13 MA1088.1 WRKY48 (NNRGTCAAMN) 1.30E-13 6.36E-11 13 MA1094.1 WRKY8 (NRGTCAAMN) 1.44E-13 7.03E-11 13 MA1076.1 WRKY15 (NRGTCAACSN) 2.14E-12 1.05E-09 13 MA1086.1 WRKY43 (HRGTCAAMVN) 1.63E-11 7.96E-09 13 MA1089.1 WRKY57 (DWRGTCAAMN) 1.93E-11 9.46E-09 13 MA1093.1 WRKY75 (HRGTCAAC) 1.13E-10 5.53E-08 13 MA1079.1 WRKY21 (NNRGTCAACG) 1.44E-10 7.04E-08 13 MA1077.1 WRKY18 (NHRGTCAAVV) 1.46E-10 7.11E-08 13 MA1090.1 WRKY60 (NYGGTCAACSN) 1.82E-10 8.89E-08

6. Supplement
132
Cluster Motif ID Binding TF Motif p-val adj. p-val 13 MA1083.1 WRKY30 (RGTCAACGNN) 3.01E-10 1.47E-07 13 MA1075.1 WRKY12 (CGTTGACC) 4.88E-10 2.39E-07 13 MA1078.1 WRKY2 (BGGTCAAM) 9.69E-10 4.74E-07 13 MA1311.1 WRKY28 (DDCGTTGACTTTT) 2.02E-09 9.85E-07 13 MA1084.1 WRKY38 (CGTTGACC) 2.03E-09 9.90E-07 13 MA1305.1 WRKY55 (DNCGTTGACTTT) 2.60E-09 1.27E-06 13 MA1092.1 WRKY63 (HGGTCAAC) 5.89E-09 2.88E-06 13 MA1315.1 WRKY24 (NCGTTGACTTTTTW) 1.18E-08 5.75E-06 13 MA1300.1 WRKY6 (CGTTGACTWWDDYWDWNHH) 1.37E-08 6.71E-06 13 MA1091.1 WRKY62 (TGGTCAAC) 1.65E-08 8.06E-06 13 MA1309.1 WRKY3 (AAAAGTCAACG) 3.11E-08 1.52E-05 13 MA1295.1 WRKY20 (DNCGTTGACYWDD) 3.22E-08 1.58E-05 13 MA1299.1 WRKY17 (AAAAAGTCAACGNH) 4.05E-08 1.98E-05 13 MA1314.1 WRKY14 (AAAAGTCAACGNH) 4.27E-08 2.09E-05 13 MA1081.1 WRKY25 (YGGTCAAC) 4.52E-08 2.21E-05 13 MA1313.1 WRKY7 (DNCGTTGACTTTTT) 5.56E-08 2.72E-05 13 MA1087.1 WRKY45 (CGTTGACY) 5.79E-08 2.83E-05 13 MA1308.1 WRKY70 (DNCGTTGACTTTT) 7.20E-08 3.52E-05 13 MA1302.1 WRKY65 (AAAAGTCAACG) 7.83E-08 3.83E-05 13 MA1301.1 WRKY33 (AAAAGTCAACG) 8.65E-08 4.23E-05 13 MA1303.1 WRKY22 (AAAAGTCAACKNH) 9.26E-08 4.53E-05 13 MA1316.1 WRKY71 (AAAAGTCAACG) 9.98E-08 4.88E-05 13 MA0589.1 ZAP1 (TTGACCGAGYY) 1.18E-07 5.79E-05 13 MA1310.1 WRKY42 (BWTDMHHHNNCGTTGACTWWD) 1.77E-07 8.68E-05 13 MA1298.1 WRKY29 (AAAAGTCAACK) 1.82E-07 8.87E-05 13 MA1312.1 WRKY47 (MYYKNCGTTGACYW) 2.04E-07 9.97E-05 13 MA1085.2 WRKY40 (HWAGTCAANN) 2.32E-07 0.0001136 13 MA1318.1 WRKY27 (ANCGTTGACTTTT) 2.35E-07 0.0001151 13 MA1317.1 WRKY50 (YKTTGACTTTTTH) 2.58E-07 0.0001261 13 MA1304.1 WRKY59 (HAAAAGTCAAMN) 4.10E-07 0.0002002 13 MA1307.1 WRKY31 (DDNNHWRHHAAAGTCAACG) 5.98E-07 0.0002921 13 MA1306.1 WRKY11 (DNCGTTGACTTTTD) 7.23E-07 0.0003537 13 MA1297.1 WRKY26 (AAAAGTCAACGNY) 8.58E-07 0.0004196 13 MA1197.1 CAMTA1 (AAARCGCGTGDD) 1.47E-06 0.0007161 13 MA0970.1 CMTA3 (CCGCGTNNN) 2.05E-06 0.001002 13 MA1080.1 WRKY23 (AGTCAACG) 3.19E-06 0.001557 13 MA0969.1 CMTA2 (NNDVCGCGT) 4.04E-06 0.001972 13 MA1296.1 WRKY46 (CGTTGACTTTK) 3.40E-05 0.01647 14 MA1316.1 WRKY71 (AAAAGTCAACG) 2.81E-10 1.37E-07 14 MA1306.1 WRKY11 (DNCGTTGACTTTTD) 5.16E-10 2.52E-07 14 MA1089.1 WRKY57 (DWRGTCAAMN) 8.13E-10 3.98E-07 14 MA1298.1 WRKY29 (AAAAGTCAACK) 8.89E-10 4.35E-07 14 MA1311.1 WRKY28 (DDCGTTGACTTTT) 1.19E-09 5.82E-07 14 MA1317.1 WRKY50 (YKTTGACTTTTTH) 2.62E-09 1.28E-06 14 MA1094.1 WRKY8 (NRGTCAAMN) 2.73E-09 1.33E-06 14 MA1303.1 WRKY22 (AAAAGTCAACKNH) 2.85E-09 1.40E-06 14 MA1299.1 WRKY17 (AAAAAGTCAACGNH) 5.70E-09 2.79E-06 14 MA1088.1 WRKY48 (NNRGTCAAMN) 6.12E-09 2.99E-06 14 MA1304.1 WRKY59 (HAAAAGTCAAMN) 6.16E-09 3.01E-06 14 MA1314.1 WRKY14 (AAAAGTCAACGNH) 1.59E-08 7.78E-06 14 MA1301.1 WRKY33 (AAAAGTCAACG) 1.94E-08 9.47E-06 14 MA1076.1 WRKY15 (NRGTCAACSN) 2.00E-08 9.77E-06 14 MA1318.1 WRKY27 (ANCGTTGACTTTT) 3.36E-08 1.64E-05 14 MA1309.1 WRKY3 (AAAAGTCAACG) 3.75E-08 1.84E-05 14 MA1315.1 WRKY24 (NCGTTGACTTTTTW) 4.57E-08 2.23E-05 14 MA1310.1 WRKY42 (BWTDMHHHNNCGTTGACTWWD) 1.60E-07 7.81E-05 14 MA1297.1 WRKY26 (AAAAGTCAACGNY) 1.68E-07 8.19E-05 14 MA1086.1 WRKY43 (HRGTCAAMVN) 1.81E-07 8.84E-05 14 MA1093.1 WRKY75 (HRGTCAAC) 1.88E-07 9.20E-05 14 MA1079.1 WRKY21 (NNRGTCAACG) 1.90E-07 9.31E-05 14 MA1302.1 WRKY65 (AAAAGTCAACG) 2.14E-07 0.0001047 14 MA1313.1 WRKY7 (DNCGTTGACTTTTT) 2.89E-07 0.0001414 14 MA1300.1 WRKY6 (CGTTGACTWWDDYWDWNHH) 7.11E-07 0.0003477 14 MA1077.1 WRKY18 (NHRGTCAAVV) 9.78E-07 0.000478 14 MA1307.1 WRKY31 (DDNNHWRHHAAAGTCAACG) 1.07E-06 0.0005205 14 MA1295.1 WRKY20 (DNCGTTGACYWDD) 1.32E-06 0.0006472 14 MA1083.1 WRKY30 (RGTCAACGNN) 3.25E-06 0.00159 14 MA1305.1 WRKY55 (DNCGTTGACTTT) 4.95E-06 0.002418 14 MA1091.1 WRKY62 (TGGTCAAC) 9.88E-06 0.004819 14 MA1308.1 WRKY70 (DNCGTTGACTTTT) 1.10E-05 0.00538 14 MA0937.1 NAC055 (ACACGTAA) 1.16E-05 0.005662 14 MA1078.1 WRKY2 (BGGTCAAM) 1.18E-05 0.00577 14 MA1085.2 WRKY40 (HWAGTCAANN) 1.31E-05 0.006386 14 MA1296.1 WRKY46 (CGTTGACTTTK) 1.45E-05 0.007077 14 MA1090.1 WRKY60 (NYGGTCAACSN) 1.58E-05 0.007689 14 MA1087.1 WRKY45 (CGTTGACY) 1.71E-05 0.008343

6. Supplement
133
Cluster Motif ID Binding TF Motif p-val adj. p-val 14 MA1383.1 KAN2 (HTHRGAATATTCTTT) 4.82E-05 0.02328 14 MA0982.1 DOF2.4 (DWAAAGB) 6.16E-05 0.02965 14 MA1075.1 WRKY12 (CGTTGACC) 8.89E-05 0.04253

6. Supplement
134
Supplement Table 5: Known TF-motifs enriched in C.rubella 5´regulatory regions of DEGs. Known TF-motifs were determined using AME for the -500 bp region upstream of the transcriptional start site. The motifs were determined separately for each expression clusters depicted in Supplemental Figure 4.
Cluster Motif ID Binding TF Motif p-val adj. p-val 2 MA1089.1 WRKY57 (DWRGTCAAMN) 1.23E-16 5.99E-14 2 MA1298.1 WRKY29 (AAAAGTCAACK) 1.50E-16 7.36E-14 2 MA1302.1 WRKY65 (AAAAGTCAACG) 3.61E-16 1.76E-13 2 MA1303.1 WRKY22 (AAAAGTCAACKNH) 5.38E-16 2.63E-13 2 MA1314.1 WRKY14 (AAAAGTCAACGNH) 6.21E-16 3.04E-13 2 MA1308.1 WRKY70 (DNCGTTGACTTTT) 1.02E-15 4.98E-13 2 MA1311.1 WRKY28 (DDCGTTGACTTTT) 1.08E-15 5.29E-13 2 MA1306.1 WRKY11 (DNCGTTGACTTTTD) 2.01E-15 9.80E-13 2 MA1094.1 WRKY8 (NRGTCAAMN) 3.01E-15 1.47E-12 2 MA1318.1 WRKY27 (ANCGTTGACTTTT) 5.53E-15 2.70E-12 2 MA1310.1 WRKY42 (BWTDMHHHNNCGTTGACTWWD) 1.50E-14 7.35E-12 2 MA1316.1 WRKY71 (AAAAGTCAACG) 1.63E-14 7.97E-12 2 MA1086.1 WRKY43 (HRGTCAAMVN) 1.82E-14 8.90E-12 2 MA1305.1 WRKY55 (DNCGTTGACTTT) 2.33E-14 1.14E-11 2 MA1079.1 WRKY21 (NNRGTCAACG) 3.47E-14 1.70E-11 2 MA1304.1 WRKY59 (HAAAAGTCAAMN) 7.32E-14 3.58E-11 2 MA1301.1 WRKY33 (AAAAGTCAACG) 8.30E-14 4.06E-11 2 MA1088.1 WRKY48 (NNRGTCAAMN) 1.01E-13 4.92E-11 2 MA1076.1 WRKY15 (NRGTCAACSN) 2.25E-13 1.10E-10 2 MA1077.1 WRKY18 (NHRGTCAAVV) 2.34E-13 1.14E-10 2 MA1317.1 WRKY50 (YKTTGACTTTTTH) 2.38E-13 1.16E-10 2 MA1093.1 WRKY75 (HRGTCAAC) 3.17E-13 1.55E-10 2 MA1309.1 WRKY3 (AAAAGTCAACG) 4.38E-13 2.14E-10 2 MA1085.2 WRKY40 (HWAGTCAANN) 4.47E-13 2.18E-10 2 MA1295.1 WRKY20 (DNCGTTGACYWDD) 5.17E-13 2.53E-10 2 MA1300.1 WRKY6 (CGTTGACTWWDDYWDWNHH) 6.02E-13 2.94E-10 2 MA1297.1 WRKY26 (AAAAGTCAACGNY) 7.27E-13 3.56E-10 2 MA1315.1 WRKY24 (NCGTTGACTTTTTW) 7.37E-13 3.60E-10 2 MA1313.1 WRKY7 (DNCGTTGACTTTTT) 2.06E-12 1.01E-09 2 MA1083.1 WRKY30 (RGTCAACGNN) 5.33E-12 2.61E-09 2 MA1307.1 WRKY31 (DDNNHWRHHAAAGTCAACG) 5.44E-12 2.66E-09 2 MA1087.1 WRKY45 (CGTTGACY) 1.25E-11 6.09E-09 2 MA1299.1 WRKY17 (AAAAAGTCAACGNH) 3.17E-11 1.55E-08 2 MA1090.1 WRKY60 (NYGGTCAACSN) 2.32E-10 1.14E-07 2 MA1078.1 WRKY2 (BGGTCAAM) 2.45E-10 1.20E-07 2 MA1091.1 WRKY62 (TGGTCAAC) 2.74E-10 1.34E-07 2 MA1092.1 WRKY63 (HGGTCAAC) 5.76E-10 2.82E-07 2 MA1296.1 WRKY46 (CGTTGACTTTK) 1.25E-09 6.12E-07 2 MA1081.1 WRKY25 (YGGTCAAC) 1.44E-09 7.02E-07 2 MA1080.1 WRKY23 (AGTCAACG) 2.21E-09 1.08E-06 2 MA1075.1 WRKY12 (CGTTGACC) 3.06E-09 1.49E-06 2 MA1084.1 WRKY38 (CGTTGACC) 5.81E-09 2.84E-06 2 MA1312.1 WRKY47 (MYYKNCGTTGACYW) 9.30E-09 4.55E-06 2 MA1027.1 KAN1 (RNWTATTC) 1.53E-08 7.50E-06 2 MA0982.1 DOF2.4 (DWAAAGB) 1.52E-06 0.0007441 2 MA1385.1 AT2G40260 (TWWWAAHATTCTYTT) 8.20E-06 0.004001 2 MA0082.1 squamosa (MCAWAWATRGWAAN) 1.51E-05 0.007333 2 MA1167.1 AT2G03500 (RGAATATTCND) 1.78E-05 0.00867 2 MA0932.1 AHL12 (AAWWWWTT) 1.82E-05 0.008853 2 MA1383.1 KAN2 (HTHRGAATATTCTTT) 2.11E-05 0.01025 2 MA0934.1 AHL25 (AWTTAAWT) 3.75E-05 0.01819 2 MA0933.1 AHL20 (AATTAAWT) 3.85E-05 0.01865 2 MA0981.1 DOF1.8 (NNWAAAGBNN) 4.05E-05 0.01959 2 MA1071.1 DOF5.3 (NNWAAMG) 4.47E-05 0.02162 2 MA1389.1 AT5G29000 (AARGAATATTCBNWW) 5.56E-05 0.02684 2 MA1166.1 AT3G12730 (AAARRGAATATTCY) 9.77E-05 0.04667 2 MA0953.1 ATHB-6 (NCAATHATD) 9.94E-05 0.04744 3 MA1309.1 WRKY3 (AAAAGTCAACG) 8.46E-05 0.04054 3 MA1301.1 WRKY33 (AAAAGTCAACG) 8.61E-05 0.04122 4 MA1303.1 WRKY22 (AAAAGTCAACKNH) 3.40E-05 0.01646 4 MA1308.1 WRKY70 (DNCGTTGACTTTT) 3.54E-05 0.01716 4 MA1298.1 WRKY29 (AAAAGTCAACK) 6.83E-05 0.03284 4 MA1306.1 WRKY11 (DNCGTTGACTTTTD) 7.88E-05 0.0378 4 MA1302.1 WRKY65 (AAAAGTCAACG) 7.96E-05 0.03817 4 MA1314.1 WRKY14 (AAAAGTCAACGNH) 9.70E-05 0.04633 5 MA1091.1 WRKY62 (TGGTCAAC) 1.53E-08 7.48E-06 5 MA1295.1 WRKY20 (DNCGTTGACYWDD) 3.60E-08 1.76E-05 5 MA1077.1 WRKY18 (NHRGTCAAVV) 7.31E-08 3.57E-05 5 MA1088.1 WRKY48 (NNRGTCAAMN) 7.79E-08 3.81E-05 5 MA1094.1 WRKY8 (NRGTCAAMN) 1.23E-07 6.00E-05 5 MA1090.1 WRKY60 (NYGGTCAACSN) 1.39E-07 6.78E-05

6. Supplement
135
Cluster Motif ID Binding TF Motif p-val adj. p-val 5 MA1081.1 WRKY25 (YGGTCAAC) 1.54E-07 7.54E-05 5 MA1093.1 WRKY75 (HRGTCAAC) 2.20E-07 0.0001077 5 MA1078.1 WRKY2 (BGGTCAAM) 2.52E-07 0.0001232 5 MA1076.1 WRKY15 (NRGTCAACSN) 3.67E-07 0.0001796 5 MA1086.1 WRKY43 (HRGTCAAMVN) 6.30E-07 0.000308 5 MA1089.1 WRKY57 (DWRGTCAAMN) 1.87E-06 0.0009134 5 MA1092.1 WRKY63 (HGGTCAAC) 2.11E-06 0.00103 5 MA0589.1 ZAP1 (TTGACCGAGYY) 5.00E-06 0.002443 5 MA1309.1 WRKY3 (AAAAGTCAACG) 5.18E-06 0.002532 5 MA1300.1 WRKY6 (CGTTGACTWWDDYWDWNHH) 6.30E-06 0.003074 5 MA1311.1 WRKY28 (DDCGTTGACTTTT) 6.41E-06 0.003129 5 MA1079.1 WRKY21 (NNRGTCAACG) 9.32E-06 0.004545 5 MA1304.1 WRKY59 (HAAAAGTCAAMN) 1.15E-05 0.005615 5 MA1301.1 WRKY33 (AAAAGTCAACG) 1.19E-05 0.005805 5 MA1315.1 WRKY24 (NCGTTGACTTTTTW) 1.30E-05 0.006359 5 MA1087.1 WRKY45 (CGTTGACY) 2.27E-05 0.01103 5 MA1305.1 WRKY55 (DNCGTTGACTTT) 2.52E-05 0.01224 5 MA1080.1 WRKY23 (AGTCAACG) 3.11E-05 0.01511 5 MA1314.1 WRKY14 (AAAAGTCAACGNH) 4.27E-05 0.02064 5 MA1083.1 WRKY30 (RGTCAACGNN) 4.45E-05 0.02154 5 MA1084.1 WRKY38 (CGTTGACC) 4.76E-05 0.023 5 MA1310.1 WRKY42 (BWTDMHHHNNCGTTGACTWWD) 4.80E-05 0.0232 5 MA1075.1 WRKY12 (CGTTGACC) 6.12E-05 0.02947 5 MA1302.1 WRKY65 (AAAAGTCAACG) 8.91E-05 0.04263 5 MA1316.1 WRKY71 (AAAAGTCAACG) 9.49E-05 0.04533 6 MA1090.1 WRKY60 (NYGGTCAACSN) 1.40E-08 6.86E-06 6 MA1087.1 WRKY45 (CGTTGACY) 3.60E-08 1.76E-05 6 MA1094.1 WRKY8 (NRGTCAAMN) 4.26E-08 2.08E-05 6 MA1086.1 WRKY43 (HRGTCAAMVN) 5.25E-08 2.57E-05 6 MA1080.1 WRKY23 (AGTCAACG) 5.42E-08 2.65E-05 6 MA1076.1 WRKY15 (NRGTCAACSN) 5.56E-08 2.72E-05 6 MA1083.1 WRKY30 (RGTCAACGNN) 7.25E-08 3.54E-05 6 MA1078.1 WRKY2 (BGGTCAAM) 7.48E-08 3.66E-05 6 MA1077.1 WRKY18 (NHRGTCAAVV) 7.51E-08 3.67E-05 6 MA1305.1 WRKY55 (DNCGTTGACTTT) 9.70E-08 4.74E-05 6 MA1084.1 WRKY38 (CGTTGACC) 1.36E-07 6.64E-05 6 MA1295.1 WRKY20 (DNCGTTGACYWDD) 1.52E-07 7.44E-05 6 MA1088.1 WRKY48 (NNRGTCAAMN) 1.54E-07 7.53E-05 6 MA1092.1 WRKY63 (HGGTCAAC) 2.24E-07 0.0001097 6 MA1081.1 WRKY25 (YGGTCAAC) 2.33E-07 0.0001139 6 MA1075.1 WRKY12 (CGTTGACC) 2.39E-07 0.0001166 6 MA1302.1 WRKY65 (AAAAGTCAACG) 3.35E-07 0.0001636 6 MA1079.1 WRKY21 (NNRGTCAACG) 3.40E-07 0.000166 6 MA1316.1 WRKY71 (AAAAGTCAACG) 4.76E-07 0.0002325 6 MA1093.1 WRKY75 (HRGTCAAC) 6.22E-07 0.0003043 6 MA1089.1 WRKY57 (DWRGTCAAMN) 6.65E-07 0.000325 6 MA1315.1 WRKY24 (NCGTTGACTTTTTW) 7.19E-07 0.0003517 6 MA0589.1 ZAP1 (TTGACCGAGYY) 7.52E-07 0.0003674 6 MA1310.1 WRKY42 (BWTDMHHHNNCGTTGACTWWD) 1.34E-06 0.0006568 6 MA1311.1 WRKY28 (DDCGTTGACTTTT) 1.36E-06 0.0006621 6 MA1314.1 WRKY14 (AAAAGTCAACGNH) 1.37E-06 0.0006718 6 MA1301.1 WRKY33 (AAAAGTCAACG) 1.40E-06 0.000683 6 MA1309.1 WRKY3 (AAAAGTCAACG) 3.13E-06 0.001529 6 MA1304.1 WRKY59 (HAAAAGTCAAMN) 3.76E-06 0.001836 6 MA1297.1 WRKY26 (AAAAGTCAACGNY) 7.94E-06 0.003873 6 MA1303.1 WRKY22 (AAAAGTCAACKNH) 8.93E-06 0.004356 6 MA1312.1 WRKY47 (MYYKNCGTTGACYW) 9.34E-06 0.004555 6 MA1298.1 WRKY29 (AAAAGTCAACK) 1.06E-05 0.005163 6 MA1091.1 WRKY62 (TGGTCAAC) 1.08E-05 0.005258 6 MA1317.1 WRKY50 (YKTTGACTTTTTH) 1.15E-05 0.0056 6 MA1197.1 CAMTA1 (AAARCGCGTGDD) 1.70E-05 0.008297 6 MA1306.1 WRKY11 (DNCGTTGACTTTTD) 1.84E-05 0.008952 6 MA1300.1 WRKY6 (CGTTGACTWWDDYWDWNHH) 1.85E-05 0.009001 6 MA1308.1 WRKY70 (DNCGTTGACTTTT) 2.31E-05 0.01121 6 MA0969.1 CMTA2 (NNDVCGCGT) 3.36E-05 0.01631 6 MA0045.1 HMG-I/Y (VWAVAAAHRVMRAMAY) 4.47E-05 0.02163 6 MA1307.1 WRKY31 (DDNNHWRHHAAAGTCAACG) 6.43E-05 0.03093 6 MA1299.1 WRKY17 (AAAAAGTCAACGNH) 7.82E-05 0.03752 6 MA0984.1 DOF5.7 (DAAARRKB) 7.87E-05 0.03773 6 MA0970.1 CMTA3 (CCGCGTNNN) 8.73E-05 0.04181 6 MA0559.1 PI (CCAAAARWRGAAAR) 0.0001001 0.04777 7 MA0932.1 AHL12 (AAWWWWTT) 1.98E-05 0.00962 7 MA0934.1 AHL25 (AWTTAAWT) 4.93E-05 0.0238 8 MA0953.1 ATHB-6 (NCAATHATD) 3.06E-07 0.0001497 8 MA0990.1 EDT1 (HAWTWAATGC) 2.59E-06 0.001265 8 MA1214.1 ATHB40 (DHACCAATAATTGDDNHHWWW) 5.65E-06 0.002757
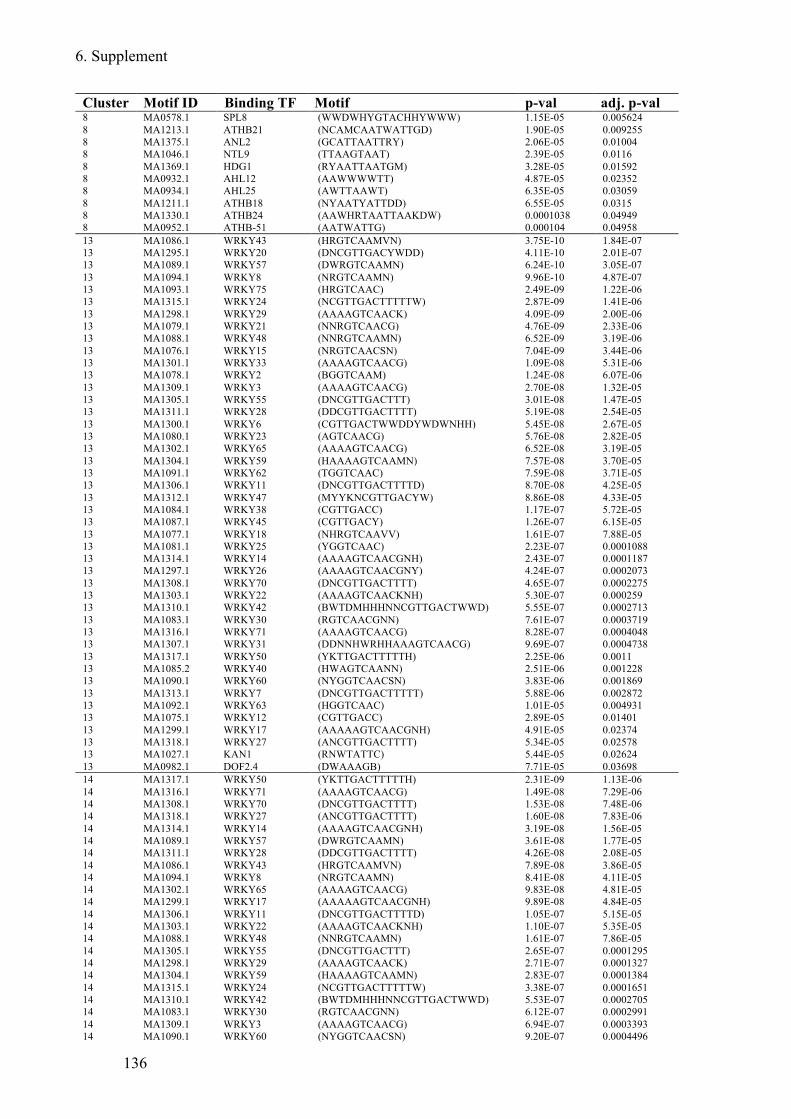
6. Supplement
136
Cluster Motif ID Binding TF Motif p-val adj. p-val 8 MA0578.1 SPL8 (WWDWHYGTACHHYWWW) 1.15E-05 0.005624 8 MA1213.1 ATHB21 (NCAMCAATWATTGD) 1.90E-05 0.009255 8 MA1375.1 ANL2 (GCATTAATTRY) 2.06E-05 0.01004 8 MA1046.1 NTL9 (TTAAGTAAT) 2.39E-05 0.0116 8 MA1369.1 HDG1 (RYAATTAATGM) 3.28E-05 0.01592 8 MA0932.1 AHL12 (AAWWWWTT) 4.87E-05 0.02352 8 MA0934.1 AHL25 (AWTTAAWT) 6.35E-05 0.03059 8 MA1211.1 ATHB18 (NYAATYATTDD) 6.55E-05 0.0315 8 MA1330.1 ATHB24 (AAWHRTAATTAAKDW) 0.0001038 0.04949 8 MA0952.1 ATHB-51 (AATWATTG) 0.000104 0.04958 13 MA1086.1 WRKY43 (HRGTCAAMVN) 3.75E-10 1.84E-07 13 MA1295.1 WRKY20 (DNCGTTGACYWDD) 4.11E-10 2.01E-07 13 MA1089.1 WRKY57 (DWRGTCAAMN) 6.24E-10 3.05E-07 13 MA1094.1 WRKY8 (NRGTCAAMN) 9.96E-10 4.87E-07 13 MA1093.1 WRKY75 (HRGTCAAC) 2.49E-09 1.22E-06 13 MA1315.1 WRKY24 (NCGTTGACTTTTTW) 2.87E-09 1.41E-06 13 MA1298.1 WRKY29 (AAAAGTCAACK) 4.09E-09 2.00E-06 13 MA1079.1 WRKY21 (NNRGTCAACG) 4.76E-09 2.33E-06 13 MA1088.1 WRKY48 (NNRGTCAAMN) 6.52E-09 3.19E-06 13 MA1076.1 WRKY15 (NRGTCAACSN) 7.04E-09 3.44E-06 13 MA1301.1 WRKY33 (AAAAGTCAACG) 1.09E-08 5.31E-06 13 MA1078.1 WRKY2 (BGGTCAAM) 1.24E-08 6.07E-06 13 MA1309.1 WRKY3 (AAAAGTCAACG) 2.70E-08 1.32E-05 13 MA1305.1 WRKY55 (DNCGTTGACTTT) 3.01E-08 1.47E-05 13 MA1311.1 WRKY28 (DDCGTTGACTTTT) 5.19E-08 2.54E-05 13 MA1300.1 WRKY6 (CGTTGACTWWDDYWDWNHH) 5.45E-08 2.67E-05 13 MA1080.1 WRKY23 (AGTCAACG) 5.76E-08 2.82E-05 13 MA1302.1 WRKY65 (AAAAGTCAACG) 6.52E-08 3.19E-05 13 MA1304.1 WRKY59 (HAAAAGTCAAMN) 7.57E-08 3.70E-05 13 MA1091.1 WRKY62 (TGGTCAAC) 7.59E-08 3.71E-05 13 MA1306.1 WRKY11 (DNCGTTGACTTTTD) 8.70E-08 4.25E-05 13 MA1312.1 WRKY47 (MYYKNCGTTGACYW) 8.86E-08 4.33E-05 13 MA1084.1 WRKY38 (CGTTGACC) 1.17E-07 5.72E-05 13 MA1087.1 WRKY45 (CGTTGACY) 1.26E-07 6.15E-05 13 MA1077.1 WRKY18 (NHRGTCAAVV) 1.61E-07 7.88E-05 13 MA1081.1 WRKY25 (YGGTCAAC) 2.23E-07 0.0001088 13 MA1314.1 WRKY14 (AAAAGTCAACGNH) 2.43E-07 0.0001187 13 MA1297.1 WRKY26 (AAAAGTCAACGNY) 4.24E-07 0.0002073 13 MA1308.1 WRKY70 (DNCGTTGACTTTT) 4.65E-07 0.0002275 13 MA1303.1 WRKY22 (AAAAGTCAACKNH) 5.30E-07 0.000259 13 MA1310.1 WRKY42 (BWTDMHHHNNCGTTGACTWWD) 5.55E-07 0.0002713 13 MA1083.1 WRKY30 (RGTCAACGNN) 7.61E-07 0.0003719 13 MA1316.1 WRKY71 (AAAAGTCAACG) 8.28E-07 0.0004048 13 MA1307.1 WRKY31 (DDNNHWRHHAAAGTCAACG) 9.69E-07 0.0004738 13 MA1317.1 WRKY50 (YKTTGACTTTTTH) 2.25E-06 0.0011 13 MA1085.2 WRKY40 (HWAGTCAANN) 2.51E-06 0.001228 13 MA1090.1 WRKY60 (NYGGTCAACSN) 3.83E-06 0.001869 13 MA1313.1 WRKY7 (DNCGTTGACTTTTT) 5.88E-06 0.002872 13 MA1092.1 WRKY63 (HGGTCAAC) 1.01E-05 0.004931 13 MA1075.1 WRKY12 (CGTTGACC) 2.89E-05 0.01401 13 MA1299.1 WRKY17 (AAAAAGTCAACGNH) 4.91E-05 0.02374 13 MA1318.1 WRKY27 (ANCGTTGACTTTT) 5.34E-05 0.02578 13 MA1027.1 KAN1 (RNWTATTC) 5.44E-05 0.02624 13 MA0982.1 DOF2.4 (DWAAAGB) 7.71E-05 0.03698 14 MA1317.1 WRKY50 (YKTTGACTTTTTH) 2.31E-09 1.13E-06 14 MA1316.1 WRKY71 (AAAAGTCAACG) 1.49E-08 7.29E-06 14 MA1308.1 WRKY70 (DNCGTTGACTTTT) 1.53E-08 7.48E-06 14 MA1318.1 WRKY27 (ANCGTTGACTTTT) 1.60E-08 7.83E-06 14 MA1314.1 WRKY14 (AAAAGTCAACGNH) 3.19E-08 1.56E-05 14 MA1089.1 WRKY57 (DWRGTCAAMN) 3.61E-08 1.77E-05 14 MA1311.1 WRKY28 (DDCGTTGACTTTT) 4.26E-08 2.08E-05 14 MA1086.1 WRKY43 (HRGTCAAMVN) 7.89E-08 3.86E-05 14 MA1094.1 WRKY8 (NRGTCAAMN) 8.41E-08 4.11E-05 14 MA1302.1 WRKY65 (AAAAGTCAACG) 9.83E-08 4.81E-05 14 MA1299.1 WRKY17 (AAAAAGTCAACGNH) 9.89E-08 4.84E-05 14 MA1306.1 WRKY11 (DNCGTTGACTTTTD) 1.05E-07 5.15E-05 14 MA1303.1 WRKY22 (AAAAGTCAACKNH) 1.10E-07 5.35E-05 14 MA1088.1 WRKY48 (NNRGTCAAMN) 1.61E-07 7.86E-05 14 MA1305.1 WRKY55 (DNCGTTGACTTT) 2.65E-07 0.0001295 14 MA1298.1 WRKY29 (AAAAGTCAACK) 2.71E-07 0.0001327 14 MA1304.1 WRKY59 (HAAAAGTCAAMN) 2.83E-07 0.0001384 14 MA1315.1 WRKY24 (NCGTTGACTTTTTW) 3.38E-07 0.0001651 14 MA1310.1 WRKY42 (BWTDMHHHNNCGTTGACTWWD) 5.53E-07 0.0002705 14 MA1083.1 WRKY30 (RGTCAACGNN) 6.12E-07 0.0002991 14 MA1309.1 WRKY3 (AAAAGTCAACG) 6.94E-07 0.0003393 14 MA1090.1 WRKY60 (NYGGTCAACSN) 9.20E-07 0.0004496

6. Supplement
137
Cluster Motif ID Binding TF Motif p-val adj. p-val 14 MA1079.1 WRKY21 (NNRGTCAACG) 9.40E-07 0.0004596 14 MA1076.1 WRKY15 (NRGTCAACSN) 1.04E-06 0.0005086 14 MA1301.1 WRKY33 (AAAAGTCAACG) 1.13E-06 0.0005516 14 MA1077.1 WRKY18 (NHRGTCAAVV) 1.71E-06 0.0008361 14 MA1297.1 WRKY26 (AAAAGTCAACGNY) 1.98E-06 0.0009663 14 MA1085.2 WRKY40 (HWAGTCAANN) 2.76E-06 0.001347 14 MA1300.1 WRKY6 (CGTTGACTWWDDYWDWNHH) 5.66E-06 0.002763 14 MA1296.1 WRKY46 (CGTTGACTTTK) 6.59E-06 0.003215 14 MA1313.1 WRKY7 (DNCGTTGACTTTTT) 7.13E-06 0.003478 14 MA1084.1 WRKY38 (CGTTGACC) 1.78E-05 0.008663 14 MA1093.1 WRKY75 (HRGTCAAC) 1.91E-05 0.009277 14 MA1295.1 WRKY20 (DNCGTTGACYWDD) 3.93E-05 0.01905 14 MA1075.1 WRKY12 (CGTTGACC) 4.38E-05 0.02118 14 MA1307.1 WRKY31 (DDNNHWRHHAAAGTCAACG) 7.37E-05 0.03542 14 MA1087.1 WRKY45 (CGTTGACY) 8.32E-05 0.03987 14 MA1092.1 WRKY63 (HGGTCAAC) 9.26E-05 0.04425 14 MA0951.1 ATHB-16 (TAATMATT) 9.93E-05 0.04739
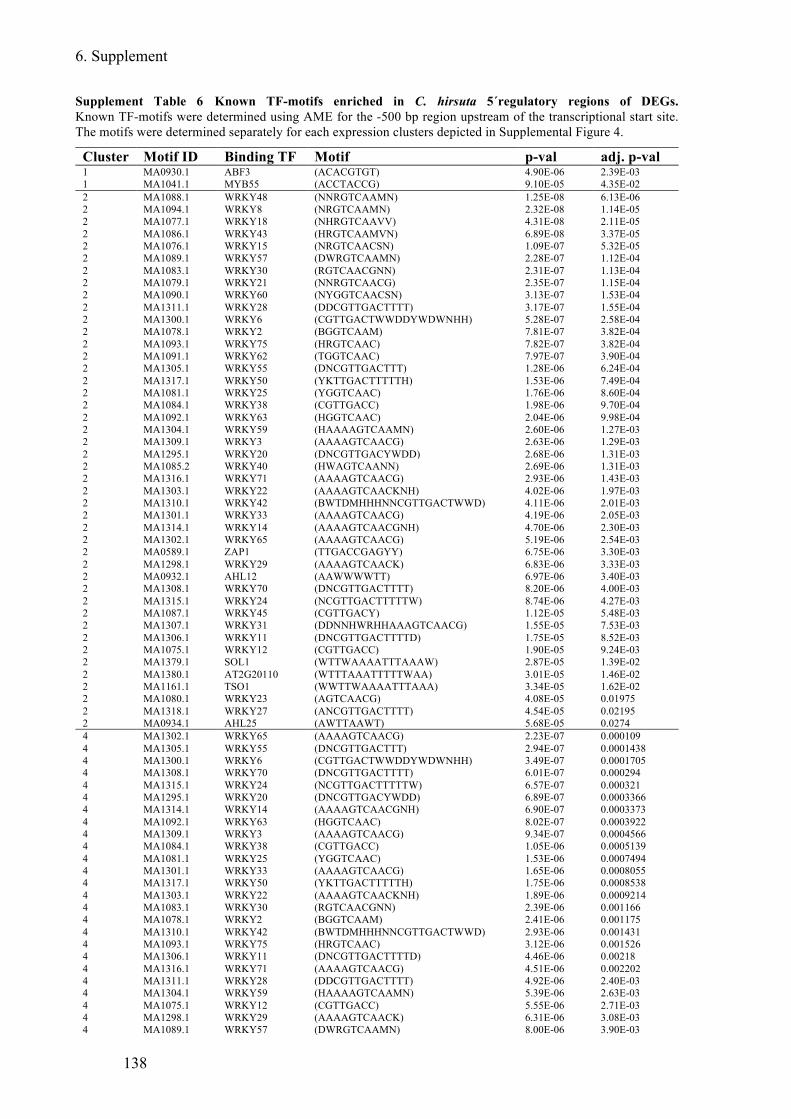
6. Supplement
138
Supplement Table 6 Known TF-motifs enriched in C. hirsuta 5´regulatory regions of DEGs. Known TF-motifs were determined using AME for the -500 bp region upstream of the transcriptional start site. The motifs were determined separately for each expression clusters depicted in Supplemental Figure 4.
Cluster Motif ID Binding TF Motif p-val adj. p-val 1 MA0930.1 ABF3 (ACACGTGT) 4.90E-06 2.39E-03 1 MA1041.1 MYB55 (ACCTACCG) 9.10E-05 4.35E-02 2 MA1088.1 WRKY48 (NNRGTCAAMN) 1.25E-08 6.13E-06 2 MA1094.1 WRKY8 (NRGTCAAMN) 2.32E-08 1.14E-05 2 MA1077.1 WRKY18 (NHRGTCAAVV) 4.31E-08 2.11E-05 2 MA1086.1 WRKY43 (HRGTCAAMVN) 6.89E-08 3.37E-05 2 MA1076.1 WRKY15 (NRGTCAACSN) 1.09E-07 5.32E-05 2 MA1089.1 WRKY57 (DWRGTCAAMN) 2.28E-07 1.12E-04 2 MA1083.1 WRKY30 (RGTCAACGNN) 2.31E-07 1.13E-04 2 MA1079.1 WRKY21 (NNRGTCAACG) 2.35E-07 1.15E-04 2 MA1090.1 WRKY60 (NYGGTCAACSN) 3.13E-07 1.53E-04 2 MA1311.1 WRKY28 (DDCGTTGACTTTT) 3.17E-07 1.55E-04 2 MA1300.1 WRKY6 (CGTTGACTWWDDYWDWNHH) 5.28E-07 2.58E-04 2 MA1078.1 WRKY2 (BGGTCAAM) 7.81E-07 3.82E-04 2 MA1093.1 WRKY75 (HRGTCAAC) 7.82E-07 3.82E-04 2 MA1091.1 WRKY62 (TGGTCAAC) 7.97E-07 3.90E-04 2 MA1305.1 WRKY55 (DNCGTTGACTTT) 1.28E-06 6.24E-04 2 MA1317.1 WRKY50 (YKTTGACTTTTTH) 1.53E-06 7.49E-04 2 MA1081.1 WRKY25 (YGGTCAAC) 1.76E-06 8.60E-04 2 MA1084.1 WRKY38 (CGTTGACC) 1.98E-06 9.70E-04 2 MA1092.1 WRKY63 (HGGTCAAC) 2.04E-06 9.98E-04 2 MA1304.1 WRKY59 (HAAAAGTCAAMN) 2.60E-06 1.27E-03 2 MA1309.1 WRKY3 (AAAAGTCAACG) 2.63E-06 1.29E-03 2 MA1295.1 WRKY20 (DNCGTTGACYWDD) 2.68E-06 1.31E-03 2 MA1085.2 WRKY40 (HWAGTCAANN) 2.69E-06 1.31E-03 2 MA1316.1 WRKY71 (AAAAGTCAACG) 2.93E-06 1.43E-03 2 MA1303.1 WRKY22 (AAAAGTCAACKNH) 4.02E-06 1.97E-03 2 MA1310.1 WRKY42 (BWTDMHHHNNCGTTGACTWWD) 4.11E-06 2.01E-03 2 MA1301.1 WRKY33 (AAAAGTCAACG) 4.19E-06 2.05E-03 2 MA1314.1 WRKY14 (AAAAGTCAACGNH) 4.70E-06 2.30E-03 2 MA1302.1 WRKY65 (AAAAGTCAACG) 5.19E-06 2.54E-03 2 MA0589.1 ZAP1 (TTGACCGAGYY) 6.75E-06 3.30E-03 2 MA1298.1 WRKY29 (AAAAGTCAACK) 6.83E-06 3.33E-03 2 MA0932.1 AHL12 (AAWWWWTT) 6.97E-06 3.40E-03 2 MA1308.1 WRKY70 (DNCGTTGACTTTT) 8.20E-06 4.00E-03 2 MA1315.1 WRKY24 (NCGTTGACTTTTTW) 8.74E-06 4.27E-03 2 MA1087.1 WRKY45 (CGTTGACY) 1.12E-05 5.48E-03 2 MA1307.1 WRKY31 (DDNNHWRHHAAAGTCAACG) 1.55E-05 7.53E-03 2 MA1306.1 WRKY11 (DNCGTTGACTTTTD) 1.75E-05 8.52E-03 2 MA1075.1 WRKY12 (CGTTGACC) 1.90E-05 9.24E-03 2 MA1379.1 SOL1 (WTTWAAAATTTAAAW) 2.87E-05 1.39E-02 2 MA1380.1 AT2G20110 (WTTTAAATTTTTWAA) 3.01E-05 1.46E-02 2 MA1161.1 TSO1 (WWTTWAAAATTTAAA) 3.34E-05 1.62E-02 2 MA1080.1 WRKY23 (AGTCAACG) 4.08E-05 0.01975 2 MA1318.1 WRKY27 (ANCGTTGACTTTT) 4.54E-05 0.02195 2 MA0934.1 AHL25 (AWTTAAWT) 5.68E-05 0.0274 4 MA1302.1 WRKY65 (AAAAGTCAACG) 2.23E-07 0.000109 4 MA1305.1 WRKY55 (DNCGTTGACTTT) 2.94E-07 0.0001438 4 MA1300.1 WRKY6 (CGTTGACTWWDDYWDWNHH) 3.49E-07 0.0001705 4 MA1308.1 WRKY70 (DNCGTTGACTTTT) 6.01E-07 0.000294 4 MA1315.1 WRKY24 (NCGTTGACTTTTTW) 6.57E-07 0.000321 4 MA1295.1 WRKY20 (DNCGTTGACYWDD) 6.89E-07 0.0003366 4 MA1314.1 WRKY14 (AAAAGTCAACGNH) 6.90E-07 0.0003373 4 MA1092.1 WRKY63 (HGGTCAAC) 8.02E-07 0.0003922 4 MA1309.1 WRKY3 (AAAAGTCAACG) 9.34E-07 0.0004566 4 MA1084.1 WRKY38 (CGTTGACC) 1.05E-06 0.0005139 4 MA1081.1 WRKY25 (YGGTCAAC) 1.53E-06 0.0007494 4 MA1301.1 WRKY33 (AAAAGTCAACG) 1.65E-06 0.0008055 4 MA1317.1 WRKY50 (YKTTGACTTTTTH) 1.75E-06 0.0008538 4 MA1303.1 WRKY22 (AAAAGTCAACKNH) 1.89E-06 0.0009214 4 MA1083.1 WRKY30 (RGTCAACGNN) 2.39E-06 0.001166 4 MA1078.1 WRKY2 (BGGTCAAM) 2.41E-06 0.001175 4 MA1310.1 WRKY42 (BWTDMHHHNNCGTTGACTWWD) 2.93E-06 0.001431 4 MA1093.1 WRKY75 (HRGTCAAC) 3.12E-06 0.001526 4 MA1306.1 WRKY11 (DNCGTTGACTTTTD) 4.46E-06 0.00218 4 MA1316.1 WRKY71 (AAAAGTCAACG) 4.51E-06 0.002202 4 MA1311.1 WRKY28 (DDCGTTGACTTTT) 4.92E-06 2.40E-03 4 MA1304.1 WRKY59 (HAAAAGTCAAMN) 5.39E-06 2.63E-03 4 MA1075.1 WRKY12 (CGTTGACC) 5.55E-06 2.71E-03 4 MA1298.1 WRKY29 (AAAAGTCAACK) 6.31E-06 3.08E-03 4 MA1089.1 WRKY57 (DWRGTCAAMN) 8.00E-06 3.90E-03

6. Supplement
139
Cluster Motif ID Binding TF Motif p-val adj. p-val 4 MA1077.1 WRKY18 (NHRGTCAAVV) 8.89E-06 4.34E-03 4 MA1318.1 WRKY27 (ANCGTTGACTTTT) 9.53E-06 4.65E-03 4 MA1087.1 WRKY45 (CGTTGACY) 1.02E-05 0.004997 4 MA1313.1 WRKY7 (DNCGTTGACTTTTT) 2.06E-05 0.01004 4 MA1299.1 WRKY17 (AAAAAGTCAACGNH) 2.14E-05 0.01042 4 MA1307.1 WRKY31 (DDNNHWRHHAAAGTCAACG) 2.18E-05 0.01062 4 MA1079.1 WRKY21 (NNRGTCAACG) 2.67E-05 0.01299 4 MA1086.1 WRKY43 (HRGTCAAMVN) 2.99E-05 0.01449 4 MA1076.1 WRKY15 (NRGTCAACSN) 5.60E-05 0.02703 4 MA1090.1 WRKY60 (NYGGTCAACSN) 5.77E-05 0.02781 4 MA1094.1 WRKY8 (NRGTCAAMN) 7.14E-05 0.03432 4 MA1297.1 WRKY26 (AAAAGTCAACGNY) 9.34E-05 0.04466 5 MA1092.1 WRKY63 (HGGTCAAC) 5.98E-05 0.02881 5 MA1088.1 WRKY48 (NNRGTCAAMN) 9.01E-05 0.04309 6 MA1086.1 WRKY43 (HRGTCAAMVN) 3.25E-06 0.001586 6 MA1079.1 WRKY21 (NNRGTCAACG) 3.44E-06 0.001678 6 MA1094.1 WRKY8 (NRGTCAAMN) 3.69E-06 0.001801 6 MA1093.1 WRKY75 (HRGTCAAC) 4.02E-06 0.001963 6 MA1089.1 WRKY57 (DWRGTCAAMN) 6.23E-06 0.00304 6 MA1088.1 WRKY48 (NNRGTCAAMN) 7.45E-06 0.003634 6 MA1087.1 WRKY45 (CGTTGACY) 1.72E-05 0.008387 6 MA1076.1 WRKY15 (NRGTCAACSN) 2.29E-05 0.01111 6 MA1091.1 WRKY62 (TGGTCAAC) 3.43E-05 0.01662 6 MA1310.1 WRKY42 (BWTDMHHHNNCGTTGACTWWD) 3.89E-05 0.01886 6 MA1302.1 WRKY65 (AAAAGTCAACG) 5.79E-05 0.02793 6 MA1080.1 WRKY23 (AGTCAACG) 7.94E-05 3.81E-02 6 MA1314.1 WRKY14 (AAAAGTCAACGNH) 8.12E-05 3.89E-02 8 MA0934.1 AHL25 (AWTTAAWT) 1.01E-06 4.95E-04 8 MA0953.1 ATHB-6 (NCAATHATD) 1.21E-06 5.92E-04 8 MA0933.1 AHL20 (AATTAAWT) 1.72E-06 8.38E-04 8 MA0578.1 SPL8 (WWDWHYGTACHHYWWW) 2.97E-06 1.45E-03 8 MA0952.1 ATHB-51 (AATWATTG) 9.53E-06 4.65E-03 8 MA0990.1 EDT1 (HAWTWAATGC) 1.17E-05 5.70E-03 8 MA1215.1 ATHB53 (HCAATAATTGD) 1.40E-05 6.82E-03 8 MA1212.1 ATHB13 (HYAATAATTDW) 1.71E-05 8.30E-03 8 MA1209.1 ATHB20 (HYAATAATTRA) 4.88E-05 2.36E-02 8 MA1274.1 OBP3 (TTTWCTTTTTHHYTTTTTTTT) 5.83E-05 2.81E-02 8 MA0932.1 AHL12 (AAWWWWTT) 7.12E-05 0.03422 8 MA1211.1 ATHB18 (NYAATYATTDD) 7.66E-05 0.03675 8 MA1268.1 AT1G69570 (TTTTYACTTTTTYTTTTTTTTTTTTTW) 8.10E-05 0.03885 8 MA1213.1 ATHB21 (NCAMCAATWATTGD) 9.18E-05 0.04391 11 MA1026.2 ATHB15 (RAWDRTAATGATKAY) 9.41E-07 0.0004599 11 MA1372.1 STZ (CACTNHCACTN) 6.18E-06 0.00302 11 MA1326.1 ATHB33 (NHGTRATTARB) 3.02E-05 0.01466 11 MA1329.1 ATHB25 (THAYTAATTAHNHWW) 3.40E-05 0.0165 11 MA1369.1 HDG1 (RYAATTAATGM) 5.89E-05 0.0284 11 MA1405.1 SIZF2 (BACTGACAGT) 7.56E-05 0.03627 11 MA1375.1 ANL2 (GCATTAATTRY) 8.19E-05 0.03924 11 MA0990.1 EDT1 (HAWTWAATGC) 8.69E-05 0.0416 12 MA1079.1 WRKY21 (NNRGTCAACG) 1.11E-05 0.005421 12 MA1094.1 WRKY8 (NRGTCAAMN) 1.49E-05 0.007279 12 MA1089.1 WRKY57 (DWRGTCAAMN) 1.51E-05 0.007378 12 MA1370.1 IDD5 (TTTTTGTCGTTTWSTG) 1.97E-05 0.009564 12 MA1086.1 WRKY43 (HRGTCAAMVN) 2.48E-05 0.01207 12 MA1088.1 WRKY48 (NNRGTCAAMN) 2.84E-05 0.01377 12 MA1160.1 AT1G14580 (WWWWTTTTTGTCGTTTTSTK) 5.30E-05 0.02557 12 MA1371.1 IDD4 (MASAAAAMGACAAAAAW) 6.25E-05 0.03012 13 MA1086.1 WRKY43 (HRGTCAAMVN) 4.33E-12 2.12E-09 13 MA1094.1 WRKY8 (NRGTCAAMN) 1.15E-11 5.62E-09 13 MA1077.1 WRKY18 (NHRGTCAAVV) 2.55E-11 1.25E-08 13 MA1089.1 WRKY57 (DWRGTCAAMN) 7.35E-11 3.60E-08 13 MA1088.1 WRKY48 (NNRGTCAAMN) 1.33E-10 6.52E-08 13 MA1079.1 WRKY21 (NNRGTCAACG) 1.49E-10 7.29E-08 13 MA1076.1 WRKY15 (NRGTCAACSN) 1.82E-10 8.89E-08 13 MA1300.1 WRKY6 (CGTTGACTWWDDYWDWNHH) 7.38E-10 3.61E-07 13 MA1301.1 WRKY33 (AAAAGTCAACG) 8.09E-10 3.96E-07 13 MA1315.1 WRKY24 (NCGTTGACTTTTTW) 9.34E-10 4.57E-07 13 MA1295.1 WRKY20 (DNCGTTGACYWDD) 1.08E-09 5.30E-07 13 MA1093.1 WRKY75 (HRGTCAAC) 2.53E-09 1.24E-06 13 MA1309.1 WRKY3 (AAAAGTCAACG) 2.74E-09 1.34E-06 13 MA1078.1 WRKY2 (BGGTCAAM) 2.78E-09 1.36E-06 13 MA1305.1 WRKY55 (DNCGTTGACTTT) 3.82E-09 1.87E-06 13 MA1092.1 WRKY63 (HGGTCAAC) 6.04E-09 2.95E-06 13 MA1081.1 WRKY25 (YGGTCAAC) 8.97E-09 4.39E-06 13 MA1090.1 WRKY60 (NYGGTCAACSN) 1.93E-08 9.45E-06

6. Supplement
140
Cluster Motif ID Binding TF Motif p-val adj. p-val 13 MA1307.1 WRKY31 (DDNNHWRHHAAAGTCAACG) 2.88E-08 1.41E-05 13 MA1311.1 WRKY28 (DDCGTTGACTTTT) 3.01E-08 1.47E-05 13 MA1304.1 WRKY59 (HAAAAGTCAAMN) 4.78E-08 2.34E-05 13 MA1087.1 WRKY45 (CGTTGACY) 5.44E-08 2.66E-05 13 MA1298.1 WRKY29 (AAAAGTCAACK) 6.98E-08 3.42E-05 13 MA1080.1 WRKY23 (AGTCAACG) 7.08E-08 3.46E-05 13 MA1302.1 WRKY65 (AAAAGTCAACG) 7.16E-08 3.50E-05 13 MA1084.1 WRKY38 (CGTTGACC) 1.11E-07 5.43E-05 13 MA1316.1 WRKY71 (AAAAGTCAACG) 1.26E-07 6.14E-05 13 MA1314.1 WRKY14 (AAAAGTCAACGNH) 1.50E-07 7.32E-05 13 MA1091.1 WRKY62 (TGGTCAAC) 1.79E-07 8.77E-05 13 MA1303.1 WRKY22 (AAAAGTCAACKNH) 5.80E-07 2.84E-04 13 MA1310.1 WRKY42 (BWTDMHHHNNCGTTGACTWWD) 7.75E-07 3.79E-04 13 MA1083.1 WRKY30 (RGTCAACGNN) 8.11E-07 3.96E-04 13 MA1306.1 WRKY11 (DNCGTTGACTTTTD) 8.85E-07 4.33E-04 13 MA1075.1 WRKY12 (CGTTGACC) 1.22E-06 5.94E-04 13 MA1317.1 WRKY50 (YKTTGACTTTTTH) 2.38E-06 1.16E-03 13 MA1312.1 WRKY47 (MYYKNCGTTGACYW) 2.60E-06 1.27E-03 13 MA1085.2 WRKY40 (HWAGTCAANN) 4.17E-06 2.04E-03 13 MA1308.1 WRKY70 (DNCGTTGACTTTT) 4.29E-06 2.10E-03 13 MA1297.1 WRKY26 (AAAAGTCAACGNY) 5.81E-06 2.84E-03 13 MA1318.1 WRKY27 (ANCGTTGACTTTT) 6.55E-06 3.20E-03 13 MA0982.1 DOF2.4 (DWAAAGB) 7.83E-06 3.82E-03 13 MA1299.1 WRKY17 (AAAAAGTCAACGNH) 9.76E-06 4.76E-03 13 MA1071.1 DOF5.3 (NNWAAMG) 1.97E-05 9.60E-03 13 MA1313.1 WRKY7 (DNCGTTGACTTTTT) 6.24E-05 3.00E-02 14 MA1089.1 WRKY57 (DWRGTCAAMN) 1.18E-12 5.79E-10 14 MA1306.1 WRKY11 (DNCGTTGACTTTTD) 8.42E-12 4.12E-09 14 MA1308.1 WRKY70 (DNCGTTGACTTTT) 1.01E-11 4.92E-09 14 MA1303.1 WRKY22 (AAAAGTCAACKNH) 1.93E-11 9.44E-09 14 MA1316.1 WRKY71 (AAAAGTCAACG) 3.70E-11 1.81E-08 14 MA1086.1 WRKY43 (HRGTCAAMVN) 4.17E-11 2.04E-08 14 MA1094.1 WRKY8 (NRGTCAAMN) 4.83E-11 2.36E-08 14 MA1302.1 WRKY65 (AAAAGTCAACG) 4.89E-11 2.39E-08 14 MA1314.1 WRKY14 (AAAAGTCAACGNH) 6.58E-11 3.22E-08 14 MA1315.1 WRKY24 (NCGTTGACTTTTTW) 8.52E-11 4.16E-08 14 MA1305.1 WRKY55 (DNCGTTGACTTT) 1.14E-10 5.60E-08 14 MA1311.1 WRKY28 (DDCGTTGACTTTT) 1.46E-10 7.15E-08 14 MA1299.1 WRKY17 (AAAAAGTCAACGNH) 2.51E-10 1.23E-07 14 MA1304.1 WRKY59 (HAAAAGTCAAMN) 2.66E-10 1.30E-07 14 MA1077.1 WRKY18 (NHRGTCAAVV) 3.11E-10 1.52E-07 14 MA1088.1 WRKY48 (NNRGTCAAMN) 3.95E-10 1.93E-07 14 MA1298.1 WRKY29 (AAAAGTCAACK) 4.43E-10 2.17E-07 14 MA1313.1 WRKY7 (DNCGTTGACTTTTT) 5.73E-10 2.80E-07 14 MA1079.1 WRKY21 (NNRGTCAACG) 1.21E-09 5.93E-07 14 MA1317.1 WRKY50 (YKTTGACTTTTTH) 1.55E-09 7.57E-07 14 MA1295.1 WRKY20 (DNCGTTGACYWDD) 2.24E-09 1.10E-06 14 MA1076.1 WRKY15 (NRGTCAACSN) 2.30E-09 1.13E-06 14 MA1318.1 WRKY27 (ANCGTTGACTTTT) 2.35E-09 1.15E-06 14 MA1301.1 WRKY33 (AAAAGTCAACG) 3.26E-09 1.60E-06 14 MA1083.1 WRKY30 (RGTCAACGNN) 3.42E-09 1.67E-06 14 MA1310.1 WRKY42 (BWTDMHHHNNCGTTGACTWWD) 3.88E-09 1.90E-06 14 MA1309.1 WRKY3 (AAAAGTCAACG) 4.88E-09 2.39E-06 14 MA1093.1 WRKY75 (HRGTCAAC) 1.16E-08 5.66E-06 14 MA1085.2 WRKY40 (HWAGTCAANN) 1.36E-08 6.66E-06 14 MA1090.1 WRKY60 (NYGGTCAACSN) 2.21E-08 1.08E-05 14 MA1300.1 WRKY6 (CGTTGACTWWDDYWDWNHH) 5.57E-08 2.72E-05 14 MA1084.1 WRKY38 (CGTTGACC) 7.08E-08 3.46E-05 14 MA1297.1 WRKY26 (AAAAGTCAACGNY) 7.65E-08 3.74E-05 14 MA1092.1 WRKY63 (HGGTCAAC) 8.55E-08 4.18E-05 14 MA1312.1 WRKY47 (MYYKNCGTTGACYW) 2.01E-07 9.84E-05 14 MA1087.1 WRKY45 (CGTTGACY) 5.16E-07 2.52E-04 14 MA1091.1 WRKY62 (TGGTCAAC) 6.43E-07 3.14E-04 14 MA1080.1 WRKY23 (AGTCAACG) 7.03E-07 3.44E-04 14 MA1307.1 WRKY31 (DDNNHWRHHAAAGTCAACG) 2.65E-06 1.29E-03 14 MA1075.1 WRKY12 (CGTTGACC) 3.04E-06 1.49E-03 14 MA1078.1 WRKY2 (BGGTCAAM) 8.25E-06 4.02E-03 14 MA1081.1 WRKY25 (YGGTCAAC) 1.43E-05 6.97E-03 14 MA0990.1 EDT1 (HAWTWAATGC) 4.45E-05 0.02152 14 MA0969.1 CMTA2 (NNDVCGCGT) 5.94E-05 0.02863 14 MA1296.1 WRKY46 (CGTTGACTTTK) 7.77E-05 0.0373

6. Supplement
141
Supplement Table 7: Known TF-motifs enriched in E. salsugineum 5´regulatory regions of DEGs. Known TF-motifs were determined using AME for the -500 bp region upstream of the transcriptional start site. The motifs were determined separately for each expression clusters depicted in Supplemental Figure 4.
Cluster Motif ID Binding TF Motif p-val adj. p-val 2 MA1089.1 WRKY57 (DWRGTCAAMN) 1.76E-13 8.58E-11 2 MA1094.1 WRKY8 (NRGTCAAMN) 3.27E-13 1.60E-10 2 MA1088.1 WRKY48 (NNRGTCAAMN) 5.93E-12 2.90E-09 2 MA1079.1 WRKY21 (NNRGTCAACG) 7.82E-12 3.82E-09 2 MA1308.1 WRKY70 (DNCGTTGACTTTT) 1.45E-11 7.10E-09 2 MA1083.1 WRKY30 (RGTCAACGNN) 2.64E-11 1.29E-08 2 MA1076.1 WRKY15 (NRGTCAACSN) 3.48E-11 1.70E-08 2 MA1086.1 WRKY43 (HRGTCAAMVN) 4.57E-11 2.24E-08 2 MA1306.1 WRKY11 (DNCGTTGACTTTTD) 4.86E-11 2.38E-08 2 MA1297.1 WRKY26 (AAAAGTCAACGNY) 6.76E-11 3.31E-08 2 MA1314.1 WRKY14 (AAAAGTCAACGNH) 7.45E-11 3.64E-08 2 MA1302.1 WRKY65 (AAAAGTCAACG) 8.14E-11 3.98E-08 2 MA1313.1 WRKY7 (DNCGTTGACTTTTT) 1.53E-10 7.46E-08 2 MA1318.1 WRKY27 (ANCGTTGACTTTT) 1.88E-10 9.21E-08 2 MA1305.1 WRKY55 (DNCGTTGACTTT) 2.31E-10 1.13E-07 2 MA1075.1 WRKY12 (CGTTGACC) 2.56E-10 1.25E-07 2 MA1315.1 WRKY24 (NCGTTGACTTTTTW) 3.21E-10 1.57E-07 2 MA1310.1 WRKY42 (BWTDMHHHNNCGTTGACTWWD) 5.42E-10 2.65E-07 2 MA1317.1 WRKY50 (YKTTGACTTTTTH) 5.54E-10 2.71E-07 2 MA1303.1 WRKY22 (AAAAGTCAACKNH) 6.27E-10 3.07E-07 2 MA1295.1 WRKY20 (DNCGTTGACYWDD) 6.64E-10 3.25E-07 2 MA1077.1 WRKY18 (NHRGTCAAVV) 7.21E-10 3.53E-07 2 MA1311.1 WRKY28 (DDCGTTGACTTTT) 7.33E-10 3.58E-07 2 MA1298.1 WRKY29 (AAAAGTCAACK) 8.83E-10 4.32E-07 2 MA1087.1 WRKY45 (CGTTGACY) 1.22E-09 5.95E-07 2 MA1085.2 WRKY40 (HWAGTCAANN) 1.26E-09 6.18E-07 2 MA1304.1 WRKY59 (HAAAAGTCAAMN) 1.50E-09 7.32E-07 2 MA1084.1 WRKY38 (CGTTGACC) 1.54E-09 7.52E-07 2 MA1316.1 WRKY71 (AAAAGTCAACG) 1.82E-09 8.91E-07 2 MA1300.1 WRKY6 (CGTTGACTWWDDYWDWNHH) 1.85E-09 9.07E-07 2 MA1307.1 WRKY31 (DDNNHWRHHAAAGTCAACG) 1.94E-09 9.50E-07 2 MA1093.1 WRKY75 (HRGTCAAC) 2.37E-09 1.16E-06 2 MA1312.1 WRKY47 (MYYKNCGTTGACYW) 4.35E-09 2.13E-06 2 MA1301.1 WRKY33 (AAAAGTCAACG) 5.25E-09 2.57E-06 2 MA1299.1 WRKY17 (AAAAAGTCAACGNH) 6.60E-09 3.23E-06 2 MA1080.1 WRKY23 (AGTCAACG) 9.06E-09 4.43E-06 2 MA1309.1 WRKY3 (AAAAGTCAACG) 2.03E-08 9.93E-06 2 MA1090.1 WRKY60 (NYGGTCAACSN) 3.64E-08 1.78E-05 2 MA1091.1 WRKY62 (TGGTCAAC) 1.92E-06 0.0009393 2 MA1383.1 KAN2 (HTHRGAATATTCTTT) 2.57E-06 0.001254 2 MA1078.1 WRKY2 (BGGTCAAM) 3.73E-06 0.001822 2 MA1092.1 WRKY63 (HGGTCAAC) 7.83E-06 0.003821 2 MA0933.1 AHL20 (AATTAAWT) 1.14E-05 0.005559 2 MA1296.1 WRKY46 (CGTTGACTTTK) 1.20E-05 0.005838 2 MA1081.1 WRKY25 (YGGTCAAC) 1.65E-05 0.008037 2 MA0934.1 AHL25 (AWTTAAWT) 2.39E-05 0.0116 2 MA1027.1 KAN1 (RNWTATTC) 3.20E-05 0.01552 2 MA0953.1 ATHB-6 (NCAATHATD) 3.52E-05 0.01708 2 MA0127.1 PEND (AYTTCTTATK) 4.38E-05 0.02117 2 MA0932.1 AHL12 (AAWWWWTT) 4.38E-05 0.02121 2 MA1162.1 TCX2 (WTTYAAAATTYAAAW) 4.99E-05 0.0241 2 MA0990.1 EDT1 (HAWTWAATGC) 5.52E-05 0.02662 2 MA1214.1 ATHB40 (DHACCAATAATTGDDNHHWWW) 9.58E-05 0.04576 4 MA1093.1 WRKY75 (HRGTCAAC) 5.60E-05 0.02703 5 MA1307.1 WRKY31 (DDNNHWRHHAAAGTCAACG) 1.02E-06 0.0004962 5 MA1309.1 WRKY3 (AAAAGTCAACG) 1.58E-06 0.0007709 5 MA1310.1 WRKY42 (BWTDMHHHNNCGTTGACTWWD) 2.00E-06 0.000977 5 MA1300.1 WRKY6 (CGTTGACTWWDDYWDWNHH) 2.20E-06 0.001077 5 MA1302.1 WRKY65 (AAAAGTCAACG) 2.21E-06 0.001078 5 MA1305.1 WRKY55 (DNCGTTGACTTT) 2.54E-06 0.001239 5 MA1077.1 WRKY18 (NHRGTCAAVV) 3.85E-06 0.00188 5 MA1301.1 WRKY33 (AAAAGTCAACG) 5.06E-06 0.002472 5 MA1085.2 WRKY40 (HWAGTCAANN) 5.25E-06 0.002565 5 MA1297.1 WRKY26 (AAAAGTCAACGNY) 5.36E-06 0.002618 5 MA1089.1 WRKY57 (DWRGTCAAMN) 5.85E-06 0.002857 5 MA1314.1 WRKY14 (AAAAGTCAACGNH) 6.53E-06 0.003187 5 MA1094.1 WRKY8 (NRGTCAAMN) 6.85E-06 0.003343 5 MA1315.1 WRKY24 (NCGTTGACTTTTTW) 9.15E-06 0.004463 5 MA1308.1 WRKY70 (DNCGTTGACTTTT) 1.02E-05 0.004956 5 MA1316.1 WRKY71 (AAAAGTCAACG) 1.09E-05 0.00529 5 MA1295.1 WRKY20 (DNCGTTGACYWDD) 1.30E-05 0.006328

6. Supplement
142
Cluster Motif ID Binding TF Motif p-val adj. p-val 5 MA1076.1 WRKY15 (NRGTCAACSN) 1.95E-05 0.009473 5 MA1093.1 WRKY75 (HRGTCAAC) 2.11E-05 0.01028 5 MA1087.1 WRKY45 (CGTTGACY) 3.49E-05 0.0169 5 MA1086.1 WRKY43 (HRGTCAAMVN) 3.61E-05 0.01748 5 MA1083.1 WRKY30 (RGTCAACGNN) 3.78E-05 0.01832 5 MA1080.1 WRKY23 (AGTCAACG) 4.04E-05 0.01956 5 MA1088.1 WRKY48 (NNRGTCAAMN) 5.54E-05 0.02675 5 MA1311.1 WRKY28 (DDCGTTGACTTTT) 5.69E-05 0.02745 5 MA1318.1 WRKY27 (ANCGTTGACTTTT) 6.37E-05 0.03067 5 MA1303.1 WRKY22 (AAAAGTCAACKNH) 6.64E-05 0.03196 5 MA1296.1 WRKY46 (CGTTGACTTTK) 7.82E-05 0.0375 5 MA1079.1 WRKY21 (NNRGTCAACG) 9.13E-05 0.04365 5 MA1091.1 WRKY62 (TGGTCAAC) 0.0001023 0.0488 6 MA0932.1 AHL12 (AAWWWWTT) 3.50E-05 0.01694 8 MA0953.1 ATHB-6 (NCAATHATD) 2.29E-05 0.01112 8 MA0982.1 DOF2.4 (DWAAAGB) 0.0001044 0.04976 10 MA1079.1 WRKY21 (NNRGTCAACG) 8.14E-07 0.0003981 10 MA1088.1 WRKY48 (NNRGTCAAMN) 1.05E-06 0.0005108 10 MA1309.1 WRKY3 (AAAAGTCAACG) 1.66E-06 0.0008112 10 MA1086.1 WRKY43 (HRGTCAAMVN) 1.83E-06 0.0008953 10 MA1076.1 WRKY15 (NRGTCAACSN) 1.97E-06 0.0009648 10 MA1301.1 WRKY33 (AAAAGTCAACG) 3.18E-06 0.001555 10 MA1310.1 WRKY42 (BWTDMHHHNNCGTTGACTWWD) 3.44E-06 0.001683 10 MA1094.1 WRKY8 (NRGTCAAMN) 3.47E-06 0.001696 10 MA1300.1 WRKY6 (CGTTGACTWWDDYWDWNHH) 3.59E-06 0.001756 10 MA1316.1 WRKY71 (AAAAGTCAACG) 3.70E-06 0.001809 10 MA1089.1 WRKY57 (DWRGTCAAMN) 3.95E-06 0.00193 10 MA1087.1 WRKY45 (CGTTGACY) 4.99E-06 0.002438 10 MA1093.1 WRKY75 (HRGTCAAC) 6.61E-06 0.003229 10 MA1080.1 WRKY23 (AGTCAACG) 7.19E-06 0.00351 10 MA1083.1 WRKY30 (RGTCAACGNN) 7.21E-06 0.003519 10 MA1091.1 WRKY62 (TGGTCAAC) 9.75E-06 0.004756 10 MA1078.1 WRKY2 (BGGTCAAM) 1.12E-05 0.005439 10 MA1314.1 WRKY14 (AAAAGTCAACGNH) 1.15E-05 0.005584 10 MA1295.1 WRKY20 (DNCGTTGACYWDD) 1.21E-05 0.005899 10 MA1311.1 WRKY28 (DDCGTTGACTTTT) 1.41E-05 0.006872 10 MA1305.1 WRKY55 (DNCGTTGACTTT) 1.65E-05 0.008013 10 MA1081.1 WRKY25 (YGGTCAAC) 1.79E-05 0.008727 10 MA1307.1 WRKY31 (DDNNHWRHHAAAGTCAACG) 2.37E-05 0.01152 10 MA1303.1 WRKY22 (AAAAGTCAACKNH) 3.16E-05 0.01531 10 MA1297.1 WRKY26 (AAAAGTCAACGNY) 3.92E-05 0.01898 10 MA1298.1 WRKY29 (AAAAGTCAACK) 4.74E-05 0.02293 10 MA1302.1 WRKY65 (AAAAGTCAACG) 4.99E-05 0.02409 10 MA1304.1 WRKY59 (HAAAAGTCAAMN) 5.16E-05 0.02494 10 MA1308.1 WRKY70 (DNCGTTGACTTTT) 6.12E-05 0.02947 10 MA1317.1 WRKY50 (YKTTGACTTTTTH) 6.66E-05 0.03202 10 MA1090.1 WRKY60 (NYGGTCAACSN) 6.77E-05 0.03255 11 MA1192.1 At5g58900 (WDWRGATAAGRTTWD) 2.07E-05 0.01007 12 MA1311.1 WRKY28 (DDCGTTGACTTTT) 1.13E-06 0.0005509 12 MA1327.1 ATHB23 (AWWNWTAATTAATDAWWWAWTW) 2.82E-06 0.001378 12 MA1314.1 WRKY14 (AAAAGTCAACGNH) 4.25E-06 0.002076 12 MA1089.1 WRKY57 (DWRGTCAAMN) 4.67E-06 0.002279 12 MA1316.1 WRKY71 (AAAAGTCAACG) 8.90E-06 0.004341 12 MA1305.1 WRKY55 (DNCGTTGACTTT) 1.13E-05 0.00549 12 MA1302.1 WRKY65 (AAAAGTCAACG) 1.33E-05 0.006499 12 MA1306.1 WRKY11 (DNCGTTGACTTTTD) 1.85E-05 0.009018 12 MA1301.1 WRKY33 (AAAAGTCAACG) 2.37E-05 0.01153 12 MA1298.1 WRKY29 (AAAAGTCAACK) 2.83E-05 0.01374 12 MA1317.1 WRKY50 (YKTTGACTTTTTH) 3.30E-05 0.016 12 MA1093.1 WRKY75 (HRGTCAAC) 3.35E-05 0.01624 12 MA1080.1 WRKY23 (AGTCAACG) 3.71E-05 0.01798 12 MA1076.1 WRKY15 (NRGTCAACSN) 3.85E-05 0.01865 12 MA1308.1 WRKY70 (DNCGTTGACTTTT) 3.98E-05 0.01926 12 MA1094.1 WRKY8 (NRGTCAAMN) 4.10E-05 0.01983 12 MA1297.1 WRKY26 (AAAAGTCAACGNY) 4.35E-05 0.02106 12 MA1309.1 WRKY3 (AAAAGTCAACG) 4.39E-05 0.02122 12 MA1079.1 WRKY21 (NNRGTCAACG) 4.82E-05 0.02331 12 MA1303.1 WRKY22 (AAAAGTCAACKNH) 5.55E-05 0.02678 12 MA1304.1 WRKY59 (HAAAAGTCAAMN) 6.02E-05 0.02899 12 MA1315.1 WRKY24 (NCGTTGACTTTTTW) 6.21E-05 0.02991 12 MA1086.1 WRKY43 (HRGTCAAMVN) 6.95E-05 0.03343 12 MA0953.1 ATHB-6 (NCAATHATD) 7.10E-05 0.0341 12 MA1077.1 WRKY18 (NHRGTCAAVV) 8.24E-05 0.03951 12 MA1300.1 WRKY6 (CGTTGACTWWDDYWDWNHH) 8.75E-05 0.04189 12 MA1083.1 WRKY30 (RGTCAACGNN) 9.95E-05 0.04749

6. Supplement
143
Cluster Motif ID Binding TF Motif p-val adj. p-val 12 MA1295.1 WRKY20 (DNCGTTGACYWDD) 0.0001033 0.04925 13 MA1089.1 WRKY57 (DWRGTCAAMN) 5.49E-12 2.69E-09 13 MA1086.1 WRKY43 (HRGTCAAMVN) 2.09E-11 1.02E-08 13 MA1094.1 WRKY8 (NRGTCAAMN) 7.27E-11 3.55E-08 13 MA1088.1 WRKY48 (NNRGTCAAMN) 7.34E-11 3.59E-08 13 MA1079.1 WRKY21 (NNRGTCAACG) 4.45E-10 2.18E-07 13 MA1093.1 WRKY75 (HRGTCAAC) 6.07E-10 2.97E-07 13 MA1301.1 WRKY33 (AAAAGTCAACG) 1.29E-09 6.29E-07 13 MA1309.1 WRKY3 (AAAAGTCAACG) 1.59E-09 7.79E-07 13 MA1076.1 WRKY15 (NRGTCAACSN) 1.64E-09 8.04E-07 13 MA1077.1 WRKY18 (NHRGTCAAVV) 2.08E-09 1.02E-06 13 MA1317.1 WRKY50 (YKTTGACTTTTTH) 2.17E-09 1.06E-06 13 MA1315.1 WRKY24 (NCGTTGACTTTTTW) 2.42E-09 1.18E-06 13 MA1300.1 WRKY6 (CGTTGACTWWDDYWDWNHH) 5.57E-09 2.72E-06 13 MA1316.1 WRKY71 (AAAAGTCAACG) 6.62E-09 3.24E-06 13 MA1314.1 WRKY14 (AAAAGTCAACGNH) 1.01E-08 4.96E-06 13 MA1302.1 WRKY65 (AAAAGTCAACG) 1.03E-08 5.04E-06 13 MA1305.1 WRKY55 (DNCGTTGACTTT) 1.36E-08 6.65E-06 13 MA1303.1 WRKY22 (AAAAGTCAACKNH) 1.49E-08 7.29E-06 13 MA1308.1 WRKY70 (DNCGTTGACTTTT) 1.87E-08 9.13E-06 13 MA1091.1 WRKY62 (TGGTCAAC) 3.27E-08 1.60E-05 13 MA1311.1 WRKY28 (DDCGTTGACTTTT) 3.53E-08 1.72E-05 13 MA1084.1 WRKY38 (CGTTGACC) 3.73E-08 1.82E-05 13 MA1092.1 WRKY63 (HGGTCAAC) 4.70E-08 2.30E-05 13 MA1075.1 WRKY12 (CGTTGACC) 5.95E-08 2.91E-05 13 MA1087.1 WRKY45 (CGTTGACY) 6.26E-08 3.06E-05 13 MA1306.1 WRKY11 (DNCGTTGACTTTTD) 7.13E-08 3.48E-05 13 MA1295.1 WRKY20 (DNCGTTGACYWDD) 8.22E-08 4.02E-05 13 MA1298.1 WRKY29 (AAAAGTCAACK) 8.52E-08 4.17E-05 13 MA1304.1 WRKY59 (HAAAAGTCAAMN) 8.54E-08 4.17E-05 13 MA1297.1 WRKY26 (AAAAGTCAACGNY) 9.84E-08 4.81E-05 13 MA1083.1 WRKY30 (RGTCAACGNN) 1.09E-07 5.34E-05 13 MA1299.1 WRKY17 (AAAAAGTCAACGNH) 1.28E-07 6.26E-05 13 MA1318.1 WRKY27 (ANCGTTGACTTTT) 1.41E-07 6.88E-05 13 MA1080.1 WRKY23 (AGTCAACG) 2.70E-07 0.0001322 13 MA1307.1 WRKY31 (DDNNHWRHHAAAGTCAACG) 3.68E-07 0.0001798 13 MA1085.2 WRKY40 (HWAGTCAANN) 5.71E-07 0.0002793 13 MA1310.1 WRKY42 (BWTDMHHHNNCGTTGACTWWD) 7.39E-07 0.0003613 13 MA1090.1 WRKY60 (NYGGTCAACSN) 7.69E-07 0.0003758 13 MA1081.1 WRKY25 (YGGTCAAC) 9.26E-07 0.0004525 13 MA1313.1 WRKY7 (DNCGTTGACTTTTT) 9.37E-07 0.000458 13 MA1078.1 WRKY2 (BGGTCAAM) 1.12E-06 0.0005471 13 MA0982.1 DOF2.4 (DWAAAGB) 9.70E-05 0.04633 14 MA1088.1 WRKY48 (NNRGTCAAMN) 6.33E-12 3.10E-09 14 MA1094.1 WRKY8 (NRGTCAAMN) 7.79E-12 3.81E-09 14 MA1076.1 WRKY15 (NRGTCAACSN) 4.85E-11 2.37E-08 14 MA1090.1 WRKY60 (NYGGTCAACSN) 1.49E-10 7.27E-08 14 MA1089.1 WRKY57 (DWRGTCAAMN) 1.57E-10 7.67E-08 14 MA1079.1 WRKY21 (NNRGTCAACG) 1.74E-10 8.50E-08 14 MA1083.1 WRKY30 (RGTCAACGNN) 2.82E-10 1.38E-07 14 MA1298.1 WRKY29 (AAAAGTCAACK) 2.91E-10 1.42E-07 14 MA1077.1 WRKY18 (NHRGTCAAVV) 3.18E-10 1.56E-07 14 MA1300.1 WRKY6 (CGTTGACTWWDDYWDWNHH) 4.04E-10 1.98E-07 14 MA1302.1 WRKY65 (AAAAGTCAACG) 1.45E-09 7.09E-07 14 MA1078.1 WRKY2 (BGGTCAAM) 1.83E-09 8.95E-07 14 MA1314.1 WRKY14 (AAAAGTCAACGNH) 1.83E-09 8.95E-07 14 MA1092.1 WRKY63 (HGGTCAAC) 2.19E-09 1.07E-06 14 MA1093.1 WRKY75 (HRGTCAAC) 2.90E-09 1.42E-06 14 MA1081.1 WRKY25 (YGGTCAAC) 3.08E-09 1.51E-06 14 MA1303.1 WRKY22 (AAAAGTCAACKNH) 3.55E-09 1.74E-06 14 MA1307.1 WRKY31 (DDNNHWRHHAAAGTCAACG) 3.62E-09 1.77E-06 14 MA1316.1 WRKY71 (AAAAGTCAACG) 4.59E-09 2.24E-06 14 MA1311.1 WRKY28 (DDCGTTGACTTTT) 4.84E-09 2.37E-06 14 MA1309.1 WRKY3 (AAAAGTCAACG) 5.83E-09 2.85E-06 14 MA1086.1 WRKY43 (HRGTCAAMVN) 5.91E-09 2.89E-06 14 MA1306.1 WRKY11 (DNCGTTGACTTTTD) 7.31E-09 3.57E-06 14 MA1301.1 WRKY33 (AAAAGTCAACG) 8.81E-09 4.31E-06 14 MA1305.1 WRKY55 (DNCGTTGACTTT) 1.00E-08 4.90E-06 14 MA1295.1 WRKY20 (DNCGTTGACYWDD) 1.12E-08 5.47E-06 14 MA1304.1 WRKY59 (HAAAAGTCAAMN) 1.15E-08 5.64E-06 14 MA1075.1 WRKY12 (CGTTGACC) 1.31E-08 6.41E-06 14 MA1087.1 WRKY45 (CGTTGACY) 1.84E-08 9.01E-06 14 MA1308.1 WRKY70 (DNCGTTGACTTTT) 2.11E-08 1.03E-05 14 MA1084.1 WRKY38 (CGTTGACC) 3.12E-08 1.52E-05 14 MA1310.1 WRKY42 (BWTDMHHHNNCGTTGACTWWD) 3.72E-08 1.82E-05 14 MA1318.1 WRKY27 (ANCGTTGACTTTT) 4.03E-08 1.97E-05

6. Supplement
144
Cluster Motif ID Binding TF Motif p-val adj. p-val 14 MA1315.1 WRKY24 (NCGTTGACTTTTTW) 6.03E-08 2.95E-05 14 MA1313.1 WRKY7 (DNCGTTGACTTTTT) 3.49E-07 0.0001707 14 MA1296.1 WRKY46 (CGTTGACTTTK) 4.22E-07 0.0002065 14 MA1091.1 WRKY62 (TGGTCAAC) 5.19E-07 0.0002536 14 MA1299.1 WRKY17 (AAAAAGTCAACGNH) 5.87E-07 0.0002868 14 MA1317.1 WRKY50 (YKTTGACTTTTTH) 7.17E-07 0.0003505 14 MA1297.1 WRKY26 (AAAAGTCAACGNY) 1.12E-06 0.0005466 14 MA1080.1 WRKY23 (AGTCAACG) 1.69E-06 0.0008239 14 MA1312.1 WRKY47 (MYYKNCGTTGACYW) 2.58E-06 0.001259 14 MA0589.1 ZAP1 (TTGACCGAGYY) 2.56E-05 0.01243 14 MA1085.2 WRKY40 (HWAGTCAANN) 7.08E-05 0.03404

145
Acknowledgments
First of all, I want to thank Ken for the great supervision and encouragement throughout
the last years. I highly appreciate that your office door was always open and that you always
took time for discussions and any potential problems. I am thankful for your patience and for
the tremendous constructive input that helped me to successfully finish my PhD and develop
myself.
I also want to thank Prof. Dr. Paul Schulze-Lefert for many fruitful discussions during
my TAC meetings and for taking over the position as first examiner of my thesis. It was very
helpful that you tried to be the devil’s advocate and thereby advanced my critical thinking.
Many thanks also to Dr. Eric Kemen for his constructive inputs during my TAC meetings.
Moreover, I want to thank Prof. Dr. Stanislav Kopriva for joining my thesis committee
as a second examiner. Special thanks to Prof. Dr. Gunther Döhlemann for chairing my thesis
committee and to Dr. Imre Somssich for taking over the “Beisitz” during my PhD defence.
The last years at the MPIPZ were so enjoyable because of the great colleagues and
friends I met along my way. A great thanks to all Tsuda lab members: Matthias, Caro, Maria,
Sayan, Tatsi, Kaori, Kasia, Dieter, Ping, Yiming and Akira for your great support and especially
Shajahan for the practical supervision in the beginning of my project. A special thanks to Besen
aka Harry for your awesome support throughout the last years, I especially enjoyed our
stimulating coffee breaks. Maria, I want to thank you for our awesome dance sessions in the
lab! You are by far the best lab mate I could have hoped for and a great friend. Moreover, it
was a great pleasure to spend time with Alfredo and the awesome pals angels Sam, Paul and
Jonny. I had a great time with all of you in and outside of the institute and you made my PhD a
truly unforgettable time!
Der größte Dank gilt meinen Eltern und Larissa. Eure Unterstützung gibt mir stets den
nötigen Rückhalt und ihr habt immer an mich geglaubt. Ich kann mich jederzeit auf euch
verlassen und ihr schafft es stets mich wieder aufzumuntern, wenn es mal nicht so läuft. Dafür
möchte ich euch von Herzen danken!

146
Erklärung
Ich versichere, dass ich die von mir vorgelegte Dissertation selbständig angefertigt, die
benutzten Quellen und Hilfsmittel vollständig angegeben und die Stellen der Arbeit − einschließlich
Tabellen, Karten und Abbildungen − , die anderen Werken im Wortlaut oder dem Sinn nach entnommen
sind, in jedem Einzelfall als Entlehnung kenntlich gemacht habe; dass diese Dissertation noch keiner
anderen Fakultät oder Universität zur Prüfung vorgelegen hat; dass sie − abgesehen von unten
angegebenen Teilpublikationen − noch nicht veröffentlicht worden ist, sowie, dass ich eine solche
Veröffentlichung vor Abschluss des Promotionsverfahrens nicht vornehmen werde.
Die Bestimmungen der Promotionsordnung sind mir bekannt. Die von mir vorgelegte
Dissertation ist von Prof. Dr. Paul Schulze-Lefert betreut worden.
Ich versichere, dass ich alle Angaben wahrheitsgemäß nach bestem Wissen und Gewissen
gemacht habe und verpflichte mich, jedmögliche, die obigen Angaben betreffenden Veränderungen,
dem Dekanat unverzüglich mitzuteilen
Köln, 19.02.2018
Thomas Winkelmüller