This article appeared in a journal published by Elsevier. The attachedcopy is furnished to the author for internal non-commercial researchand education use, including for instruction at the authors institution
and sharing with colleagues.
Other uses, including reproduction and distribution, or selling orlicensing copies, or posting to personal, institutional or third party
websites are prohibited.
In most cases authors are permitted to post their version of thearticle (e.g. in Word or Tex form) to their personal website orinstitutional repository. Authors requiring further information
regarding Elsevier’s archiving and manuscript policies areencouraged to visit:
http://www.elsevier.com/authorsrights
Author's personal copy
Comparative study of artificial intelligencetechniques for sizing of a hydrogen-basedstand-alone photovoltaic/wind hybrid system
Akbar Maleki, Alireza Askarzadeh*
Department of Energy Management and Optimization, Institute of Science and High Technology and Environmental
Sciences, Graduate University of Advanced Technology, Kerman, Iran
a r t i c l e i n f o
Article history:
Received 30 November 2013
Received in revised form
19 April 2014
Accepted 21 April 2014
Available online 20 May 2014
Keywords:
Hybrid systems
PV/wind/fuel cell
Optimal sizing
Artificial intelligence
a b s t r a c t
As non-polluting reliable energy sources, stand-alone photovoltaic/wind/fuel cell (PV/
wind/FC) hybrid systems are being studied from various aspects in recent years. In such
systems, optimum sizing is the main issue for having a cost-effective system. This paper
evaluates the performance of different artificial intelligence (AI) techniques for optimum
sizing of a PV/wind/FC hybrid system to continuously satisfy the load demand with the
minimal total annual cost. For this aim, the sizing problem is formulated and four well-
known heuristic algorithms, namely, particle swarm optimization (PSO), tabu search
(TS), simulated annealing (SA), and harmony search (HS), are applied to the system and the
results are compared in terms of the total annual cost. It can be seen that not only average
results produced by PSO are more promising than those of the other algorithms but also
PSO has the most robustness. As another investigation, the sizing is also performed for a
PV/wind/battery hybrid system and the results are compared with those of the PV/wind/FC
system.
Copyright ª 2014, Hydrogen Energy Publications, LLC. Published by Elsevier Ltd. All rights
reserved.
Introduction
Photovoltaic (PV) systems and wind turbines (WTs) are being
used worldwide to contribute in meeting the electrical power
demand. The most important challenge of the single-
renewable energy systems is their dependency to the envi-
ronmental conditions (solar radiation and wind speed). As a
solution, renewable energy sources are combined with each
other (hybrid system) to provide more continuous electrical
power. Therefore, hybrid systems have more reliability than
single-renewable energy systems.
For a PV/wind hybrid system, it is necessary to provide an
energy storage device. The storage system meets the
remaining demand when the renewable sources have low
energy. The storage device can be a battery bank, super
capacitor bank, superconducting magnetic energy storage
(SMES), or an FC/electrolyzer system. Conventionally, deep-
cycle lead acid batteries are used for energy storage. Never-
theless, the associated environmental concerns limit the
application of PV/wind/battery-based systems. Recent re-
searches have focused on using FC/electrolyzer as the storage
device [1e17]. Using PV/wind/FC system leads to having a
non-polluting reliable energy source. In such system,
* Corresponding author. Tel./fax: þ98 342 6233176.E-mail addresses: [email protected] (A. Maleki), [email protected], [email protected] (A. Askarzadeh).
Available online at www.sciencedirect.com
ScienceDirect
journal homepage: www.elsevier .com/locate/he
i n t e r n a t i o n a l j o u r n a l o f h y d r o g e n en e r g y 3 9 ( 2 0 1 4 ) 9 9 7 3e9 9 8 4
http://dx.doi.org/10.1016/j.ijhydene.2014.04.1470360-3199/Copyright ª 2014, Hydrogen Energy Publications, LLC. Published by Elsevier Ltd. All rights reserved.
Author's personal copy
electrolyzer produces hydrogen by the excess electrical energy
of the PV and wind sources. The hydrogen can then be used to
supply an FCwhich is considered as a secondary power source
when the demand is high.
For the better understanding of the different aspects of
hydrogen-based hybrid systems, thereby to efficiently utilize
PV/wind/FC systems, various investigations have been
developed. In hybrid systems, appropriate sizing is one of the
most important issues that results in having a cost-effective
energy system. Literature study indicates that there are
many attempts based on probabilistic, analytical and heuristic
methods for optimal sizing of hybrid systems. Diaf et al. [18]
have optimized hybrid system size based on loss of power
supply probability (LPSP) and the levelized cost of energy
(LCE). Borowy and Salameh [19] have introduced loss of load
probability (LLP) concept for finding the optimal size of the PV/
wind hybrid system. Shrestha and Goel [20] have presented a
methodology for optimal sizing based on energy generation
simulation. Maghraby et al. [21] have used the desired system
performance level (SPL) requirement to select the number of
PVs and batteries. Energy balance has been used for design of
hybrid PV/wind systems [22]. Prasad and Natarajan [23] have
presented a methodology for optimization of PV/wind system
based on deficiency of power supply probability (DPSP), rela-
tive excess power generated (REPG), unutilized energy proba-
bility (UEP), life cycle cost (LCC), levelized energy cost (LEC)
and life cycle unit cost (LUC) of power generation with battery
bank. Nonlinear programming [24] and HOMER [25] are other
algorithms used for optimal design of hybrid systems. Heu-
ristic algorithms such as genetic algorithm (GA) [26,27],
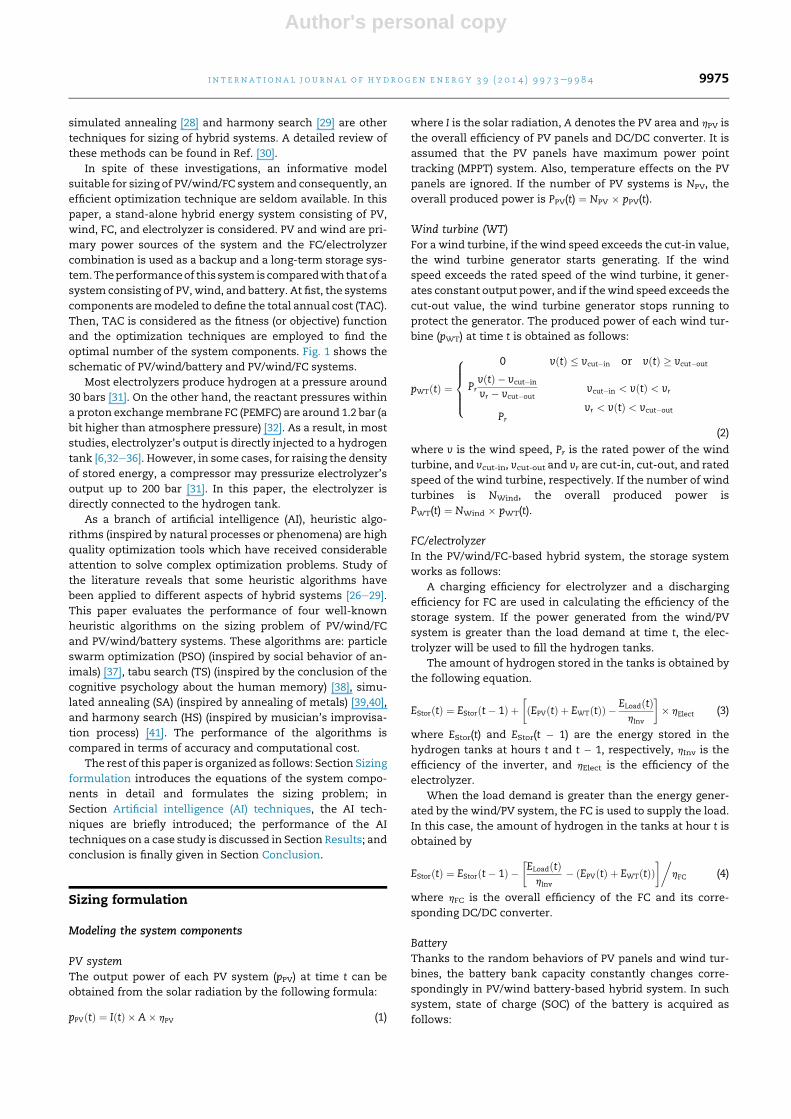
(a)Wind Generator
PV Panel
Battery
+
DC/DC
Load
DC bus
DC/DC
AC/DC
DC/AC
(b)Wind Generator
PV Panel
Fuel cell
+
DC/DC
Load
DC bus
DC/DC
AC/DC
DC/AC
H2 Tanks
Electrolyzer
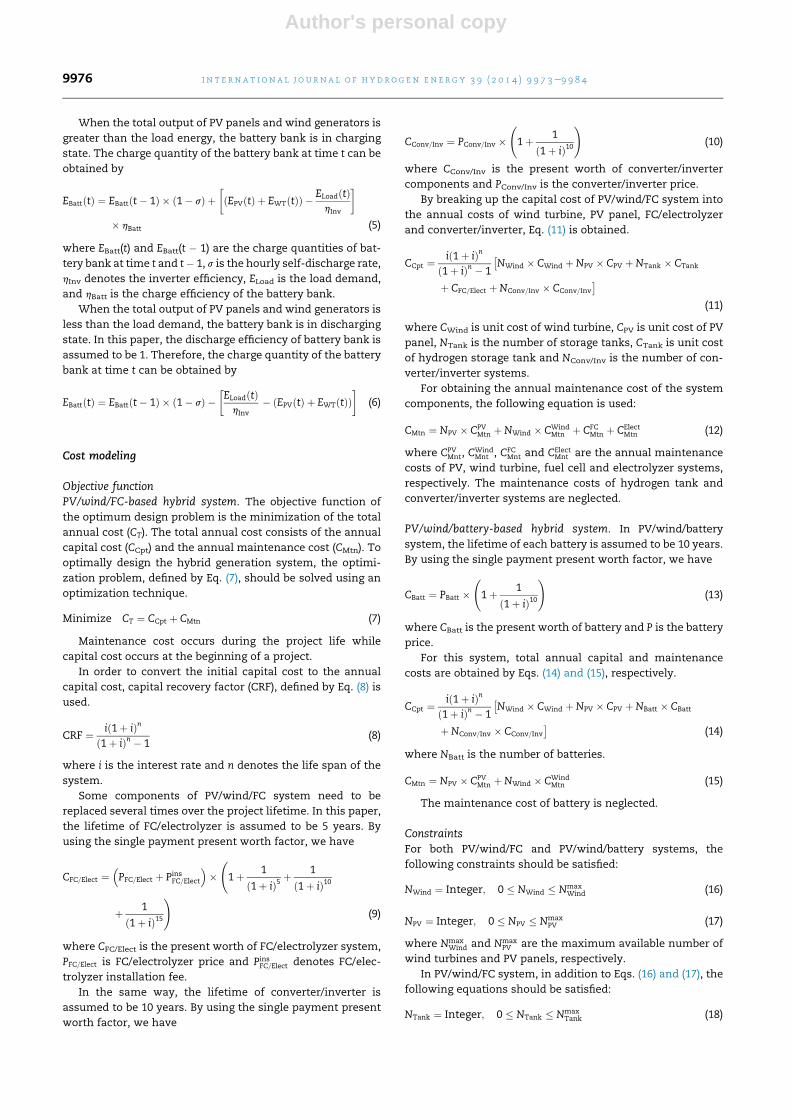
Fig. 1 e Schematic of the hybrid systems. (a) PV/wind/battery-based hybrid system and (b) PV/wind/FC-based hybrid
system.
i n t e rn a t i o n a l j o u r n a l o f h y d r o g e n en e r g y 3 9 ( 2 0 1 4 ) 9 9 7 3e9 9 8 49974
Author's personal copy
simulated annealing [28] and harmony search [29] are other
techniques for sizing of hybrid systems. A detailed review of
these methods can be found in Ref. [30].
In spite of these investigations, an informative model
suitable for sizing of PV/wind/FC system and consequently, an
efficient optimization technique are seldom available. In this
paper, a stand-alone hybrid energy system consisting of PV,
wind, FC, and electrolyzer is considered. PV and wind are pri-
mary power sources of the system and the FC/electrolyzer
combination is used as a backup and a long-term storage sys-
tem.Theperformanceof this system is comparedwith thatof a
system consisting of PV, wind, and battery. At fist, the systems
components aremodeled to define the total annual cost (TAC).
Then, TAC is considered as the fitness (or objective) function
and the optimization techniques are employed to find the
optimal number of the system components. Fig. 1 shows the
schematic of PV/wind/battery and PV/wind/FC systems.
Most electrolyzers produce hydrogen at a pressure around
30 bars [31]. On the other hand, the reactant pressures within
a proton exchangemembrane FC (PEMFC) are around 1.2 bar (a
bit higher than atmosphere pressure) [32]. As a result, in most
studies, electrolyzer’s output is directly injected to a hydrogen
tank [6,32e36]. However, in some cases, for raising the density
of stored energy, a compressor may pressurize electrolyzer’s
output up to 200 bar [31]. In this paper, the electrolyzer is
directly connected to the hydrogen tank.
As a branch of artificial intelligence (AI), heuristic algo-
rithms (inspired by natural processes or phenomena) are high
quality optimization tools which have received considerable
attention to solve complex optimization problems. Study of
the literature reveals that some heuristic algorithms have
been applied to different aspects of hybrid systems [26e29].
This paper evaluates the performance of four well-known
heuristic algorithms on the sizing problem of PV/wind/FC
and PV/wind/battery systems. These algorithms are: particle
swarm optimization (PSO) (inspired by social behavior of an-
imals) [37], tabu search (TS) (inspired by the conclusion of the
cognitive psychology about the human memory) [38], simu-
lated annealing (SA) (inspired by annealing of metals) [39,40],
and harmony search (HS) (inspired by musician’s improvisa-
tion process) [41]. The performance of the algorithms is
compared in terms of accuracy and computational cost.
The rest of this paper is organized as follows: Section Sizing
formulation introduces the equations of the system compo-
nents in detail and formulates the sizing problem; in
Section Artificial intelligence (AI) techniques, the AI tech-
niques are briefly introduced; the performance of the AI
techniques on a case study is discussed in Section Results; and
conclusion is finally given in Section Conclusion.
Sizing formulation
Modeling the system components
PV systemThe output power of each PV system (pPV) at time t can be
obtained from the solar radiation by the following formula:
pPVðtÞ ¼ IðtÞ � A� hPV (1)
where I is the solar radiation, A denotes the PV area and hPV is
the overall efficiency of PV panels and DC/DC converter. It is
assumed that the PV panels have maximum power point
tracking (MPPT) system. Also, temperature effects on the PV
panels are ignored. If the number of PV systems is NPV, the
overall produced power is PPV(t) ¼ NPV � pPV(t).
Wind turbine (WT)For a wind turbine, if the wind speed exceeds the cut-in value,
the wind turbine generator starts generating. If the wind
speed exceeds the rated speed of the wind turbine, it gener-
ates constant output power, and if thewind speed exceeds the
cut-out value, the wind turbine generator stops running to
protect the generator. The produced power of each wind tur-
bine (pWT) at time t is obtained as follows:
pWTðtÞ ¼
8>>><>>>:
0 vðtÞ � vcut�in or vðtÞ � vcut�out
PrvðtÞ � vcut�in
vr � vcut�out
Pr
vcut�in < vðtÞ < vr
vr < vðtÞ < vcut�out
(2)
where v is the wind speed, Pr is the rated power of the wind
turbine, and vcut-in, vcut-out and vr are cut-in, cut-out, and rated
speed of the wind turbine, respectively. If the number of wind
turbines is NWind, the overall produced power is
PWT(t) ¼ NWind � pWT(t).
FC/electrolyzerIn the PV/wind/FC-based hybrid system, the storage system
works as follows:
A charging efficiency for electrolyzer and a discharging
efficiency for FC are used in calculating the efficiency of the
storage system. If the power generated from the wind/PV
system is greater than the load demand at time t, the elec-
trolyzer will be used to fill the hydrogen tanks.
The amount of hydrogen stored in the tanks is obtained by
the following equation.
EStorðtÞ ¼ EStorðt� 1Þ þ�ðEPVðtÞ þ EWTðtÞÞ � ELoadðtÞ
hInv
�� hElect (3)
where EStor(t) and EStor(t � 1) are the energy stored in the
hydrogen tanks at hours t and t � 1, respectively, hInv is the
efficiency of the inverter, and hElect is the efficiency of the
electrolyzer.
When the load demand is greater than the energy gener-
ated by the wind/PV system, the FC is used to supply the load.
In this case, the amount of hydrogen in the tanks at hour t is
obtained by
EStorðtÞ ¼ EStorðt� 1Þ ��ELoadðtÞhInv
� ðEPVðtÞ þ EWTðtÞÞ��
hFC (4)
where hFC is the overall efficiency of the FC and its corre-
sponding DC/DC converter.
BatteryThanks to the random behaviors of PV panels and wind tur-
bines, the battery bank capacity constantly changes corre-
spondingly in PV/wind battery-based hybrid system. In such
system, state of charge (SOC) of the battery is acquired as
follows:
i n t e r n a t i o n a l j o u r n a l o f h y d r o g e n en e r g y 3 9 ( 2 0 1 4 ) 9 9 7 3e9 9 8 4 9975
Author's personal copy
When the total output of PV panels and wind generators is
greater than the load energy, the battery bank is in charging
state. The charge quantity of the battery bank at time t can be
obtained by
EBattðtÞ ¼ EBattðt� 1Þ � ð1� sÞ þ�ðEPVðtÞ þ EWTðtÞÞ � ELoadðtÞ
hInv
�� hBatt (5)
where EBatt(t) and EBatt(t � 1) are the charge quantities of bat-
tery bank at time t and t� 1, s is the hourly self-discharge rate,
hInv denotes the inverter efficiency, ELoad is the load demand,
and hBatt is the charge efficiency of the battery bank.
When the total output of PV panels and wind generators is
less than the load demand, the battery bank is in discharging
state. In this paper, the discharge efficiency of battery bank is
assumed to be 1. Therefore, the charge quantity of the battery
bank at time t can be obtained by
EBattðtÞ ¼ EBattðt� 1Þ � ð1� sÞ ��ELoadðtÞhInv
� ðEPVðtÞ þ EWTðtÞÞ�
(6)
Cost modeling
Objective functionPV/wind/FC-based hybrid system. The objective function of
the optimum design problem is the minimization of the total
annual cost (CT). The total annual cost consists of the annual
capital cost (CCpt) and the annual maintenance cost (CMtn). To
optimally design the hybrid generation system, the optimi-
zation problem, defined by Eq. (7), should be solved using an
optimization technique.
Minimize CT ¼ CCpt þ CMtn (7)
Maintenance cost occurs during the project life while
capital cost occurs at the beginning of a project.
In order to convert the initial capital cost to the annual
capital cost, capital recovery factor (CRF), defined by Eq. (8) is
used.
CRF ¼ ið1þ iÞnð1þ iÞn � 1
(8)
where i is the interest rate and n denotes the life span of the
system.
Some components of PV/wind/FC system need to be
replaced several times over the project lifetime. In this paper,
the lifetime of FC/electrolyzer is assumed to be 5 years. By
using the single payment present worth factor, we have
CFC=Elect ¼�PFC=Elect þ Pins
FC=Elect
�� 1þ 1
ð1þ iÞ5 þ1
ð1þ iÞ10
þ 1
ð1þ iÞ15!
(9)
where CFC/Elect is the present worth of FC/electrolyzer system,
PFC=Elect is FC/electrolyzer price and PinsFC=Elect denotes FC/elec-
trolyzer installation fee.
In the same way, the lifetime of converter/inverter is
assumed to be 10 years. By using the single payment present
worth factor, we have
CConv=Inv ¼ PConv=Inv � 1þ 1
ð1þ iÞ10!
(10)
where CConv/Inv is the present worth of converter/inverter
components and PConv/Inv is the converter/inverter price.
By breaking up the capital cost of PV/wind/FC system into
the annual costs of wind turbine, PV panel, FC/electrolyzer
and converter/inverter, Eq. (11) is obtained.
CCpt ¼ ið1þ iÞnð1þ iÞn � 1
�NWind � CWind þNPV � CPV þNTank � CTank
þ CFC=Elect þNConv=Inv � CConv=Inv
�(11)
where CWind is unit cost of wind turbine, CPV is unit cost of PV
panel, NTank is the number of storage tanks, CTank is unit cost
of hydrogen storage tank and NConv/Inv is the number of con-
verter/inverter systems.
For obtaining the annual maintenance cost of the system
components, the following equation is used:
CMtn ¼ NPV � CPVMtn þNWind � CWind
Mtn þ CFCMtn þ CElect
Mtn (12)
where CPVMnt, C
WindMnt , CFC
Mnt and CElectMnt are the annual maintenance
costs of PV, wind turbine, fuel cell and electrolyzer systems,
respectively. The maintenance costs of hydrogen tank and
converter/inverter systems are neglected.
PV/wind/battery-based hybrid system. In PV/wind/battery
system, the lifetime of each battery is assumed to be 10 years.
By using the single payment present worth factor, we have
CBatt ¼ PBatt � 1þ 1
ð1þ iÞ10!
(13)
where CBatt is the present worth of battery and P is the battery
price.
For this system, total annual capital and maintenance
costs are obtained by Eqs. (14) and (15), respectively.
CCpt ¼ ið1þ iÞnð1þ iÞn � 1
�NWind � CWind þNPV � CPV þNBatt � CBatt
þNConv=Inv � CConv=Inv
�(14)
where NBatt is the number of batteries.
CMtn ¼ NPV � CPVMtn þNWind � CWind
Mtn (15)
The maintenance cost of battery is neglected.
ConstraintsFor both PV/wind/FC and PV/wind/battery systems, the
following constraints should be satisfied:
NWind ¼ Integer; 0 � NWind � NmaxWind (16)
NPV ¼ Integer; 0 � NPV � NmaxPV (17)
where NmaxWind and Nmax
PV are the maximum available number of
wind turbines and PV panels, respectively.
In PV/wind/FC system, in addition to Eqs. (16) and (17), the
following equations should be satisfied:
NTank ¼ Integer; 0 � NTank � NmaxTank (18)
i n t e rn a t i o n a l j o u r n a l o f h y d r o g e n en e r g y 3 9 ( 2 0 1 4 ) 9 9 7 3e9 9 8 49976
Author's personal copy
EminStor � EStor � Emax
Stor (19)
where NmaxTank is maximum number of hydrogen tanks and Emin
Stor
(assumed to be 0 in this study) and EmaxStor denote the minimum
and maximum storage capacity of the hydrogen tanks,
respectively.
For PV/wind/battery system, in addition to Eqs. (16) and
(17), the number of storage batteries should satisfy
NBatt ¼ Integer; 0 � NBatt � NmaxBatt . Moreover, at any time, the
charge quantity of battery bank should satisfy the constraint
of EminBatt � Et
Batt � EmaxBatt . The maximum charge quantity of bat-
tery bank ðEmaxBatt Þ takes the value of nominal capacity of battery
bank (SBatt) and the minimum charge quantity of the battery
bank ðEminBattÞ is obtained by maximum depth of discharge
(DOD).
EminBatt ¼ ð1�DODÞ � SBatt (20)
Artificial intelligence (AI) techniques
Particle swarm optimization algorithm (PSO)
Originally invented by Kennedy and Eberhart in 1995 [37], PSO
is a population-based metaheuristic algorithm attempting to
discover the global solution of an optimization problem by
simulating the animals social behavior such as fish schooling,
bird flocking, etc. PSO has been one of the most popular
optimization algorithms because it has simple concept, is easy
to implement and can quickly find a reasonably good solution.
In PSO algorithm, each feasible solution of the problem is
called a particle which is specified by a vector containing the
problem variables. At the beginning of the algorithm, a group
of particles is randomly initialized in the search space. Each
particle makes use of its memory and flies through the search
space for obtaining a better position than its current one. In its
memory a particle memorizes the best experience found by
itself (pbest) as well as the group’s best experience (gbest). The
updating pattern of a particle in each iteration (iter) is as
follows:
vkðiterþ 1Þ ¼ wðiterÞ � vkðiterÞ þ c1 � r1ðpbestkðiterÞ � xkðiterÞÞþ c2 � r2ðgbestðiterÞ � xkðiterÞÞ
(21)
xkðiterþ 1Þ ¼ vkðiterþ 1Þ þ xkðiterÞ ðiter ¼ 1;2;.; itermaxÞ (22)
where xk denotes the particle’s position, k ¼ 1,2,.,Np is the
particle’s index, Np is the size of population (number of par-
ticles), vk denotes the particle’s velocity, r1 and r2 are uniform
random numbers between 0 and 1 which are generated
independently for each particle in each update, c1 and c2 are
learning factors which control the importance of the best so-
lution ever found by kth particle and the best solution found
by the swarm, respectively, itermax denotes the maximum
iteration times and w is known as inertia weight which is
started from a positive initial value (w0) and is decreased
during the iterations by w(iter þ 1) ¼ b � w(iter).
The steps of the PSO algorithm can be expressed as follows:
Step 1) A population is randomly generated in the search
space.
Step 2) The initial velocity of each particle is randomly
generated.
Step 3) Objective function value for each particle is
calculated.
Step 4) The initial position of each particle is selected as its
pbest and the best particle among the population is chosen
as gbest.
Step 5) Particles move to new positions based on Eqs. (21)
and (22).
Step 6) If a particle exceeds the allowed range it is replaced
by its previous position.
Step 7) Objective function value for each particle is
calculated.
Step 8) pbest and gbest are updated.
Step 9) The stopping criterion is checked. If it is satisfied
the algorithm is terminated and gbest is selected as the
optimal solution. Otherwise, Steps 5 to 8 are repeated.
Tabu search (TS)
Originally proposed by Glover [38], TS is an iterative procedure
that starts from a random initial solution and tries to find a
better solution. In TS, tabu list and aspiration criterion play
important roles for escaping local optima. TS can be repre-
sented by the following steps [42]:
Step 1: iteration index (iter) is set to 0 and an initial solution
(xinitial) is randomly generated. This solution is set as the
current solution as well as the best solution, xbest (i.e.,
xinitial ¼ xcurrent ¼ xbest).
Step 2: a set of trial solutions (ntrial), at the vicinity of the
current solution are produced. Each trial solution (xtrial) is
put into the objective function and its quality is calculated.
The trial solutions are sorted based on their objective
function values in ascending order. Let us define xjtrial as the
jth trial solution in the sorted setwhere 1� j� ntrial. So, x1trialrepresents the best trial solution in terms of the objective
function value.
Step 3: j is set to 1. If CTðxjtrialÞ > CTðxbestÞ, we go to Step 4,
else we set xbest ¼ xjtrial xbest ¼ xjtrial and go to Step 4.
Step 4: the tabu status of xjtrial is checked. If it is not in the
tabu list, then it is put in the tabu list, we set xcurrent ¼ xjtrialand go to Step 7. If it is in tabu list, we go to Step 5.
Step 5: the aspiration criterion of xjtrial is checked. If it is
satisfied, then the tabu restrictions are overrided, the
aspiration level is updated, xcurrent ¼ xjtrial, andwe go to Step
7. If not, j ¼ j þ 1 and we go to Step 6.
Step 6: If j > ntrial, we go to Step 7, else we go back to Step 4.
Step 7: the stopping criterion is checked.
Simulated annealing algorithm (SA)
The name and inspiration of SA originates from annealing in
metallurgy, a process involving heating and controlled cooling
of a metal to increase the size of its crystals and reduce its
i n t e r n a t i o n a l j o u r n a l o f h y d r o g e n en e r g y 3 9 ( 2 0 1 4 ) 9 9 7 3e9 9 8 4 9977
Author's personal copy
defects. SA starts its search by a large enough temperature (T)
to search a broad region of the space and terminates it by a
small temperature tomove downhill according to the steepest
descent heuristic. In SA, as the iterations progress, the tem-
perature is gradually reduced.
The SA used in this study is same as that proposed in Ref.
[28] which is a discrete SA (DSA). At any iteration (iter), the
current solution is x(iter) and the corresponding objective
function value is defined by f(x(iter)). The probability of the
next solution, x(iter þ 1), being at xnew (a random solution
near-by x(iter)) depends both on the difference between the
corresponding fitness values, DF ¼ f(xnew) � f(x(iter)), and also
on the temperature. As a result, the position of the next so-
lution is determined as follows:
xðiterþ 1Þ ¼
xnew if expð�DF=TÞ > rxðiterÞ o:w:
(23)
where r is an uniform random number in [0, 1].
As can be seen, if DF� 0, xnew is always accepted. There is a
probability of selecting xnew as x(iter þ 1) even though the
function value at xnew is worse than that at x(iter). This prob-
ability depends on DF and T values. The process of producing
new solutions continues until maximum number of itera-
tions, itermax, is met. In DSA, xnew and T change by the
following formulas during the iterations:
xnew ¼ xðiterÞ þWF (24)
Tðiterþ 1Þ ¼ s� TðiterÞ (25)
where WF is a vector with the elements randomly distributed
between [�wf wf] and s is the step size. The algorithm is
started by an initial temperature (T0).
Harmony search (HS)
HS is a heuristic algorithm which attempts to mimic the
musicians’ improvisation process. The HS used in this study is
same as that proposed in Ref. [29] which is a discrete HS (DHS).
The key parameters which play important role in the
convergence of the HS algorithm are harmony memory
considering rate (HMCR), pitch adjusting rate (PAR), and
bandwidth of generation (bw). These parameters can be
potentially useful in adjusting convergence rate of the algo-
rithm to the optimal solution. The HMCR varying between
0 and 1 is the rate of choosing one value from the HM. PAR and
bw are defined as follows:
PARðtÞ ¼ PARmin þ PARmax � PARmin
itermax� iter (26)
bwðtÞ ¼ bwmax expðc� iterÞ (27)
c ¼ Lnðbwmin=bwmaxÞitermax
(28)
where PARmax and PARmin are the maximum and minimum
pitch adjusting rates, respectively, and bwmax, bwmin are the
maximum and minimum bandwidths, respectively. In HS, a
new harmony is produced by the following pseudocode:
where xnew is the improvised harmony and r1 as well as r2 are
uniformly distributed random numbers between 0 and 1. The
parameter rw is obtained as follows:
rw ¼
1 r3 < 0:5�1 otherwise
(29)
where r3 is a uniformly distributed random number between
0 and 1.
Table 1 e The parameters of the system components.
i 5%
n 20 years
Wind turbine
Pr 1 kW
Vcut-in 2.5 m/s
Vcut-out 13 m/s
Vr 11 m/s
CWind 3200$
CWindMnt 100$
PV panel
Prs 120 W
CPV 614$
CPVMnt 0$
Area 1.07 m2
Efficiency 12%
Fuel cell
Rated power 3 kW
hfuel-cell 50%
Life span 5 years
CFC 20,000$
CFCMnt 1400$
Electrolyzer
Rated power 3 kW
helect 74%
Life span 5 years
Celect 20,000$
CelectMnt 1400$
CT-tanks 2000$
Nominal capacity of hydrogen tank 0.3 kWh
Power converter/inverter
Rated power 3 kW
hInv 95%
Life span 10 years
CInv 2000$
Battery
Voltage 12 V
SBatt 1.35 kWh
hBC 85%
CBatt 130$
Life span 5 years
DOD 0.8
s 0.0002
i n t e rn a t i o n a l j o u r n a l o f h y d r o g e n en e r g y 3 9 ( 2 0 1 4 ) 9 9 7 3e9 9 8 49978
Author's personal copy
Results
In order to evaluate the performance of the heuristic tech-
niques for optimum sizing of a real system, the solar insola-
tion and wind speed information collected from Rafsanjan
(latitude 30.40� N), Iran are used. Table 1 lists the parameters
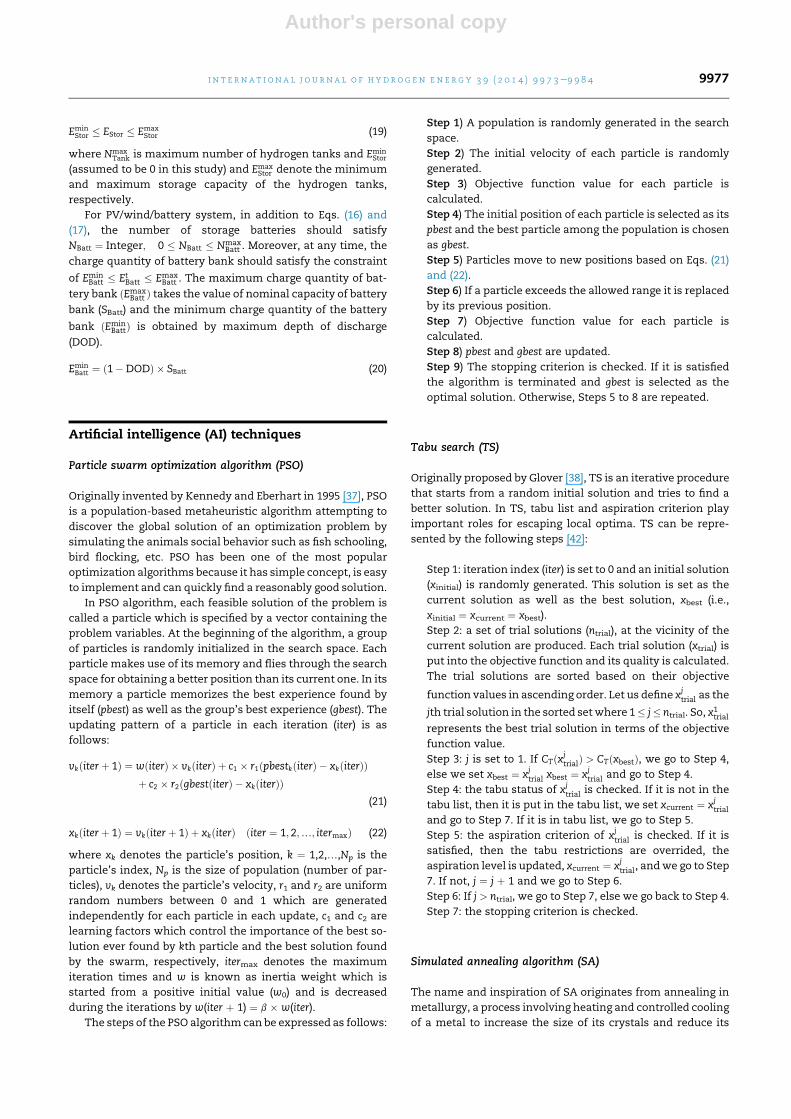
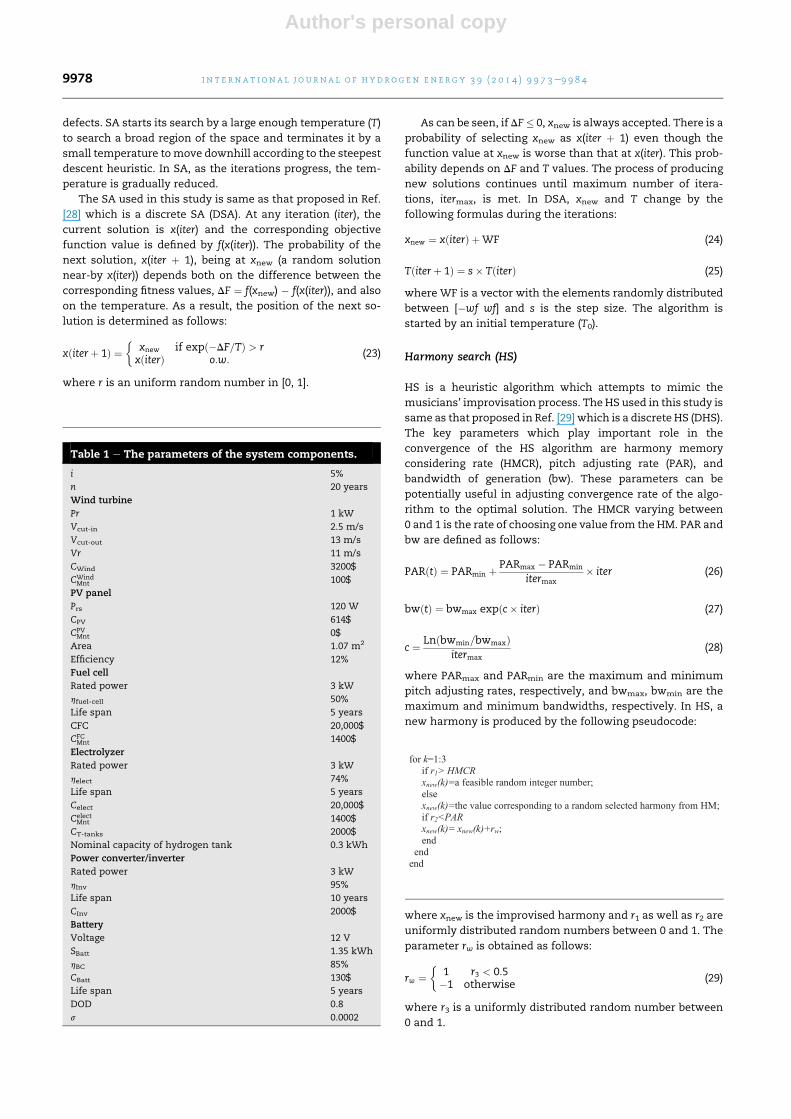
of the components. The average hourly insolation and wind
speed profiles and the corresponding produced powers (ob-
tained from Eqs. (1) and (2)) are illustrated in Figs. 2 and 3,
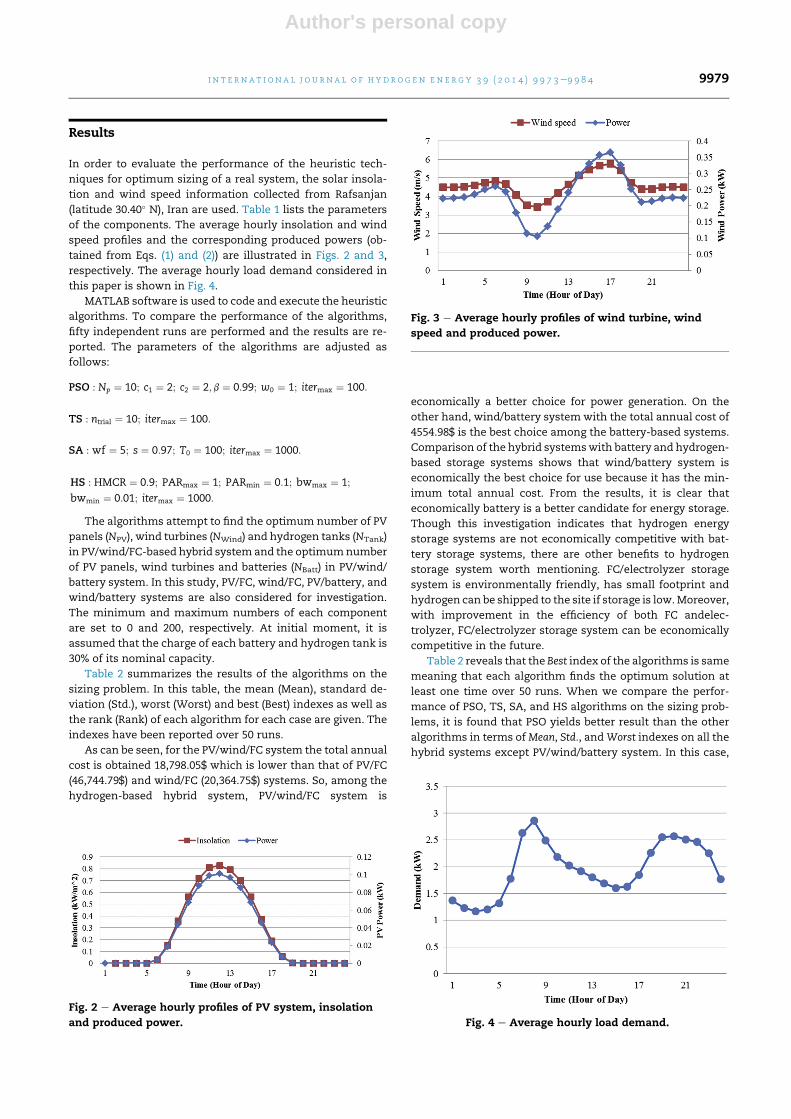
respectively. The average hourly load demand considered in
this paper is shown in Fig. 4.
MATLAB software is used to code and execute the heuristic
algorithms. To compare the performance of the algorithms,
fifty independent runs are performed and the results are re-
ported. The parameters of the algorithms are adjusted as
follows:
PSO : Np ¼ 10; c1 ¼ 2; c2 ¼ 2;b ¼ 0:99; w0 ¼ 1; itermax ¼ 100:
TS : ntrial ¼ 10; itermax ¼ 100:
SA : wf ¼ 5; s ¼ 0:97; T0 ¼ 100; itermax ¼ 1000:
HS : HMCR ¼ 0:9; PARmax ¼ 1; PARmin ¼ 0:1; bwmax ¼ 1;
bwmin ¼ 0:01; itermax ¼ 1000:
The algorithms attempt to find the optimum number of PV
panels (NPV), wind turbines (NWind) and hydrogen tanks (NTank)
in PV/wind/FC-based hybrid system and the optimumnumber
of PV panels, wind turbines and batteries (NBatt) in PV/wind/
battery system. In this study, PV/FC, wind/FC, PV/battery, and
wind/battery systems are also considered for investigation.
The minimum and maximum numbers of each component
are set to 0 and 200, respectively. At initial moment, it is
assumed that the charge of each battery and hydrogen tank is
30% of its nominal capacity.
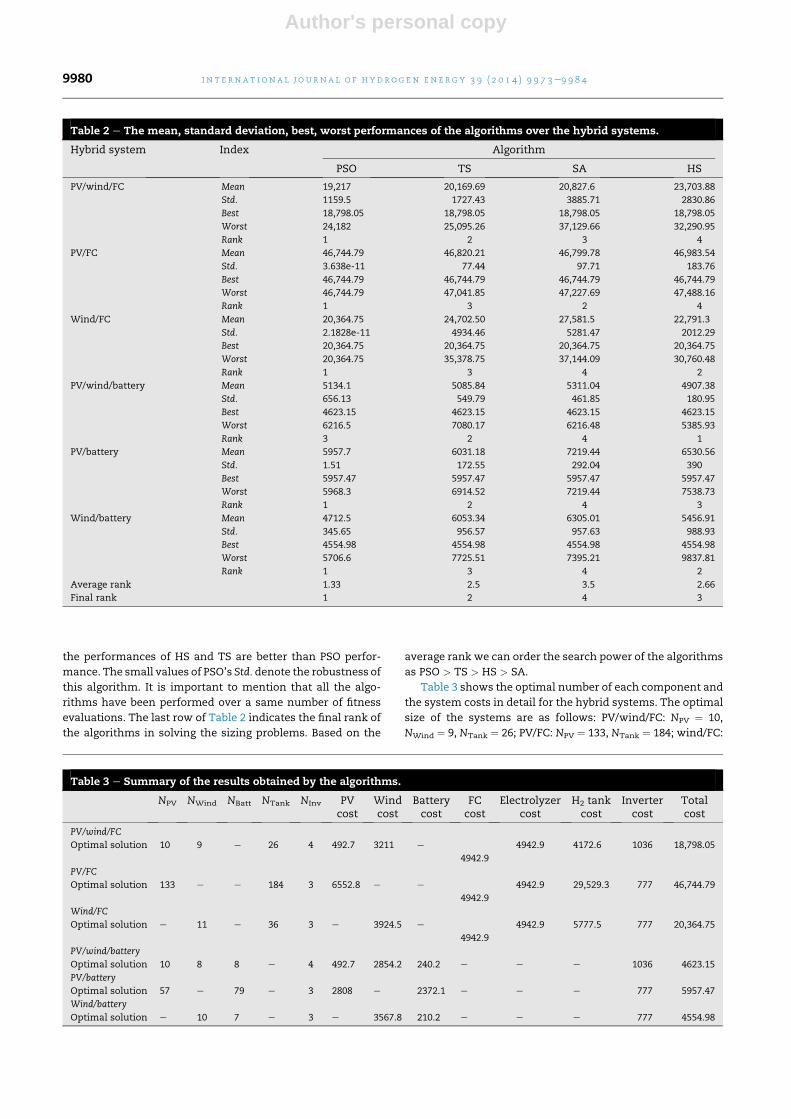
Table 2 summarizes the results of the algorithms on the
sizing problem. In this table, the mean (Mean), standard de-
viation (Std.), worst (Worst) and best (Best) indexes as well as
the rank (Rank) of each algorithm for each case are given. The
indexes have been reported over 50 runs.
As can be seen, for the PV/wind/FC system the total annual
cost is obtained 18,798.05$ which is lower than that of PV/FC
(46,744.79$) and wind/FC (20,364.75$) systems. So, among the
hydrogen-based hybrid system, PV/wind/FC system is
economically a better choice for power generation. On the
other hand, wind/battery systemwith the total annual cost of
4554.98$ is the best choice among the battery-based systems.
Comparison of the hybrid systemswith battery and hydrogen-
based storage systems shows that wind/battery system is
economically the best choice for use because it has the min-
imum total annual cost. From the results, it is clear that
economically battery is a better candidate for energy storage.
Though this investigation indicates that hydrogen energy
storage systems are not economically competitive with bat-
tery storage systems, there are other benefits to hydrogen
storage system worth mentioning. FC/electrolyzer storage
system is environmentally friendly, has small footprint and
hydrogen can be shipped to the site if storage is low.Moreover,
with improvement in the efficiency of both FC andelec-
trolyzer, FC/electrolyzer storage system can be economically
competitive in the future.
Table 2 reveals that the Best index of the algorithms is same
meaning that each algorithm finds the optimum solution at
least one time over 50 runs. When we compare the perfor-
mance of PSO, TS, SA, and HS algorithms on the sizing prob-
lems, it is found that PSO yields better result than the other
algorithms in terms ofMean, Std., andWorst indexes on all the
hybrid systems except PV/wind/battery system. In this case,
Fig. 2 e Average hourly profiles of PV system, insolation
and produced power.
Fig. 3 e Average hourly profiles of wind turbine, wind
speed and produced power.
Fig. 4 e Average hourly load demand.
i n t e r n a t i o n a l j o u r n a l o f h y d r o g e n en e r g y 3 9 ( 2 0 1 4 ) 9 9 7 3e9 9 8 4 9979
Author's personal copy
the performances of HS and TS are better than PSO perfor-
mance. The small values of PSO’s Std. denote the robustness of
this algorithm. It is important to mention that all the algo-
rithms have been performed over a same number of fitness
evaluations. The last row of Table 2 indicates the final rank of
the algorithms in solving the sizing problems. Based on the
average rank we can order the search power of the algorithms
as PSO > TS > HS > SA.
Table 3 shows the optimal number of each component and
the system costs in detail for the hybrid systems. The optimal
size of the systems are as follows: PV/wind/FC: NPV ¼ 10,
NWind ¼ 9, NTank ¼ 26; PV/FC: NPV ¼ 133, NTank ¼ 184; wind/FC:
Table 2 e The mean, standard deviation, best, worst performances of the algorithms over the hybrid systems.
Hybrid system Index Algorithm
PSO TS SA HS
PV/wind/FC Mean 19,217 20,169.69 20,827.6 23,703.88
Std. 1159.5 1727.43 3885.71 2830.86
Best 18,798.05 18,798.05 18,798.05 18,798.05
Worst 24,182 25,095.26 37,129.66 32,290.95
Rank 1 2 3 4
PV/FC Mean 46,744.79 46,820.21 46,799.78 46,983.54
Std. 3.638e-11 77.44 97.71 183.76
Best 46,744.79 46,744.79 46,744.79 46,744.79
Worst 46,744.79 47,041.85 47,227.69 47,488.16
Rank 1 3 2 4
Wind/FC Mean 20,364.75 24,702.50 27,581.5 22,791.3
Std. 2.1828e-11 4934.46 5281.47 2012.29
Best 20,364.75 20,364.75 20,364.75 20,364.75
Worst 20,364.75 35,378.75 37,144.09 30,760.48
Rank 1 3 4 2
PV/wind/battery Mean 5134.1 5085.84 5311.04 4907.38
Std. 656.13 549.79 461.85 180.95
Best 4623.15 4623.15 4623.15 4623.15
Worst 6216.5 7080.17 6216.48 5385.93
Rank 3 2 4 1
PV/battery Mean 5957.7 6031.18 7219.44 6530.56
Std. 1.51 172.55 292.04 390
Best 5957.47 5957.47 5957.47 5957.47
Worst 5968.3 6914.52 7219.44 7538.73
Rank 1 2 4 3
Wind/battery Mean 4712.5 6053.34 6305.01 5456.91
Std. 345.65 956.57 957.63 988.93
Best 4554.98 4554.98 4554.98 4554.98
Worst 5706.6 7725.51 7395.21 9837.81
Rank 1 3 4 2
Average rank 1.33 2.5 3.5 2.66
Final rank 1 2 4 3
Table 3 e Summary of the results obtained by the algorithms.
NPV NWind NBatt NTank NInv PVcost
Windcost
Batterycost
FCcost
Electrolyzercost
H2 tankcost
Invertercost
Totalcost
PV/wind/FC
Optimal solution 10 9 e 26 4 492.7 3211 e
4942.9
4942.9 4172.6 1036 18,798.05
PV/FC
Optimal solution 133 e e 184 3 6552.8 e e
4942.9
4942.9 29,529.3 777 46,744.79
Wind/FC
Optimal solution e 11 e 36 3 e 3924.5 e
4942.9
4942.9 5777.5 777 20,364.75
PV/wind/battery
Optimal solution 10 8 8 e 4 492.7 2854.2 240.2 e e e 1036 4623.15
PV/battery
Optimal solution 57 e 79 e 3 2808 e 2372.1 e e e 777 5957.47
Wind/battery
Optimal solution e 10 7 e 3 e 3567.8 210.2 e e e 777 4554.98
i n t e rn a t i o n a l j o u r n a l o f h y d r o g e n en e r g y 3 9 ( 2 0 1 4 ) 9 9 7 3e9 9 8 49980
Author's personal copy
NWind ¼ 11, NTank ¼ 36; PV/wind/battery NPV ¼ 10, NWind ¼ 8,
NBatt ¼ 8; PV/battery: NPV ¼ 57, NBatt ¼ 79; wind/battery
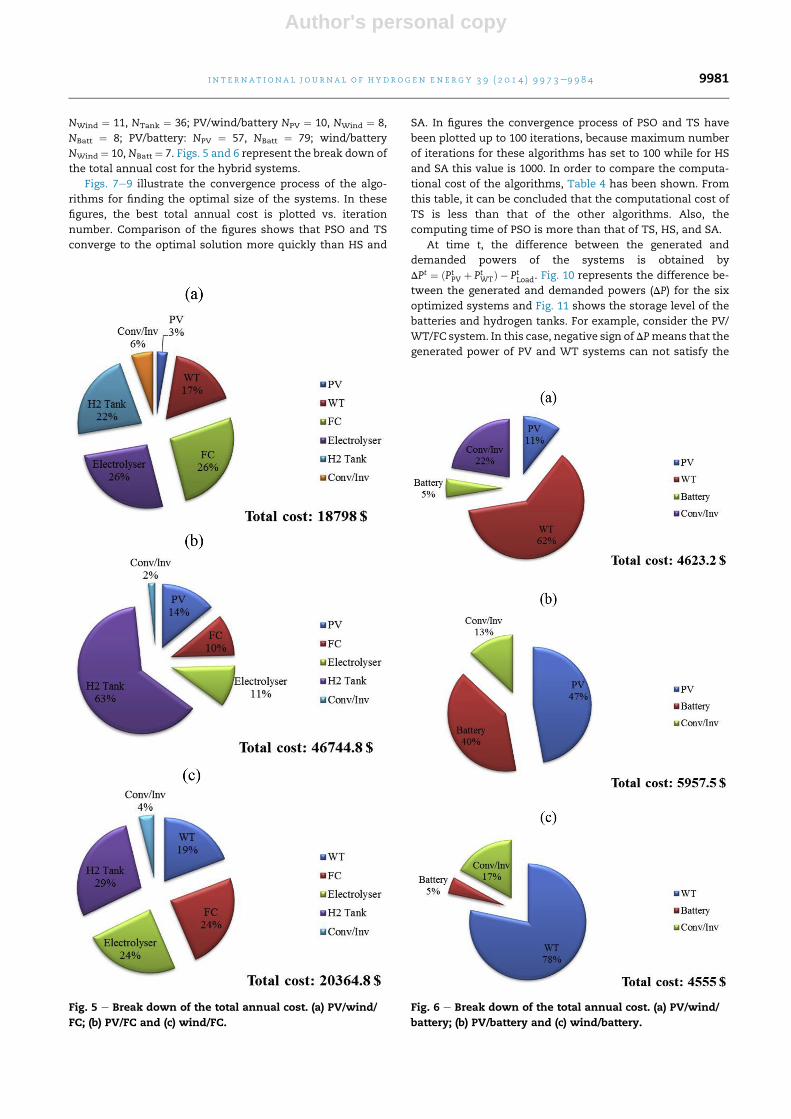
NWind ¼ 10, NBatt ¼ 7. Figs. 5 and 6 represent the break down of
the total annual cost for the hybrid systems.
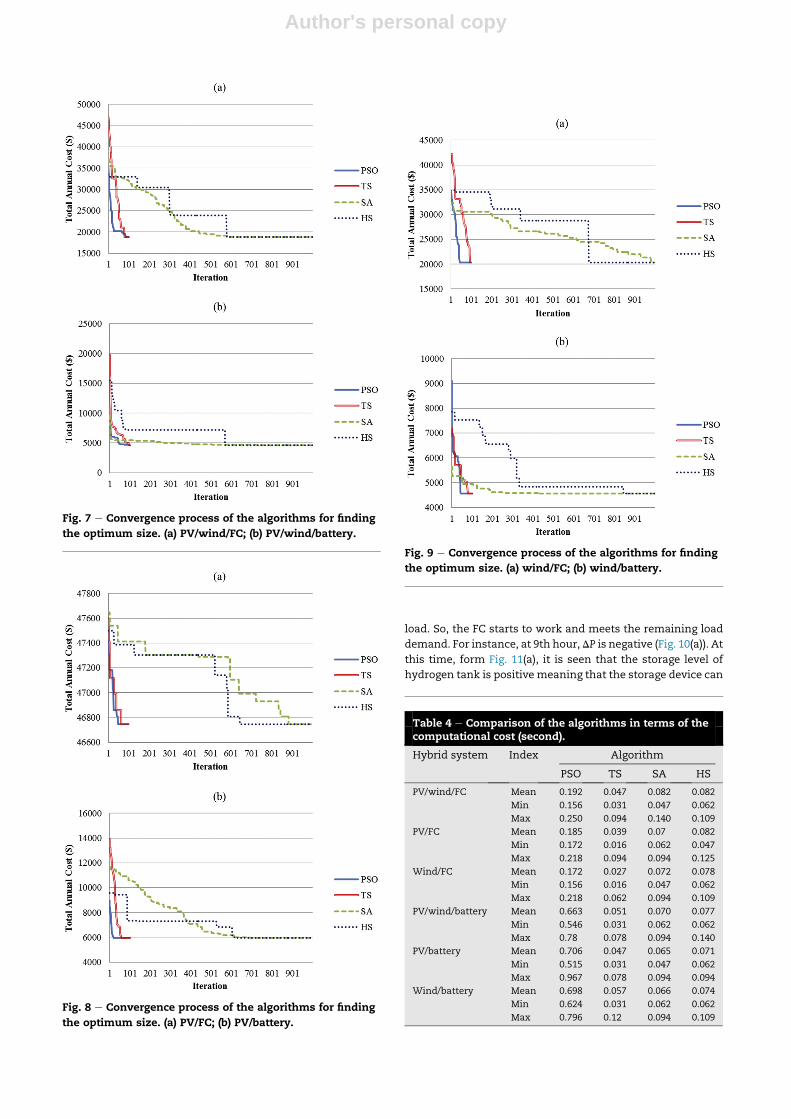
Figs. 7e9 illustrate the convergence process of the algo-
rithms for finding the optimal size of the systems. In these
figures, the best total annual cost is plotted vs. iteration
number. Comparison of the figures shows that PSO and TS
converge to the optimal solution more quickly than HS and
SA. In figures the convergence process of PSO and TS have
been plotted up to 100 iterations, because maximum number
of iterations for these algorithms has set to 100 while for HS
and SA this value is 1000. In order to compare the computa-
tional cost of the algorithms, Table 4 has been shown. From
this table, it can be concluded that the computational cost of
TS is less than that of the other algorithms. Also, the
computing time of PSO is more than that of TS, HS, and SA.
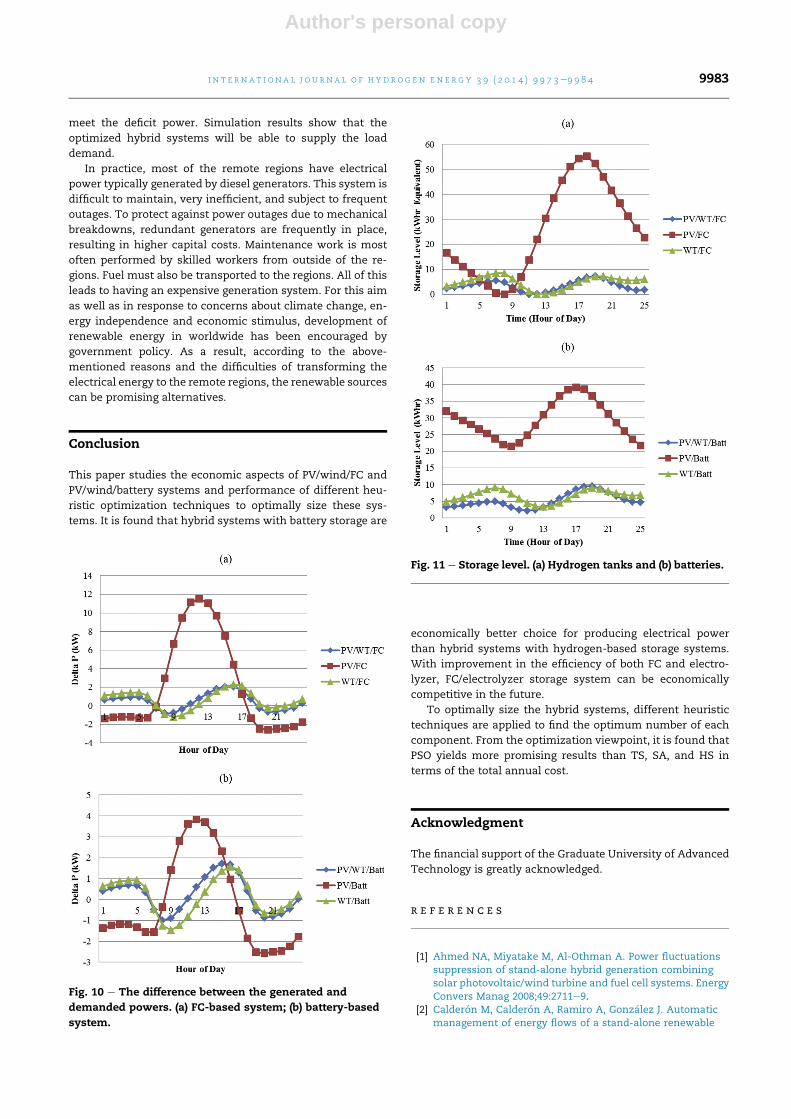
At time t, the difference between the generated and
demanded powers of the systems is obtained by
DPt ¼ ðPtPV þ PtWTÞ � PtLoad. Fig. 10 represents the difference be-
tween the generated and demanded powers (DP) for the six
optimized systems and Fig. 11 shows the storage level of the
batteries and hydrogen tanks. For example, consider the PV/
WT/FC system. In this case, negative sign of DPmeans that the
generated power of PV and WT systems can not satisfy the
Fig. 5 e Break down of the total annual cost. (a) PV/wind/
FC; (b) PV/FC and (c) wind/FC.
Fig. 6 e Break down of the total annual cost. (a) PV/wind/
battery; (b) PV/battery and (c) wind/battery.
i n t e r n a t i o n a l j o u r n a l o f h y d r o g e n en e r g y 3 9 ( 2 0 1 4 ) 9 9 7 3e9 9 8 4 9981
Author's personal copy
load. So, the FC starts to work and meets the remaining load
demand. For instance, at 9th hour,DP is negative (Fig. 10(a)). At
this time, form Fig. 11(a), it is seen that the storage level of
hydrogen tank is positive meaning that the storage device can
Fig. 7 e Convergence process of the algorithms for finding
the optimum size. (a) PV/wind/FC; (b) PV/wind/battery.
Fig. 8 e Convergence process of the algorithms for finding
the optimum size. (a) PV/FC; (b) PV/battery.
Fig. 9 e Convergence process of the algorithms for finding
the optimum size. (a) wind/FC; (b) wind/battery.
Table 4 e Comparison of the algorithms in terms of thecomputational cost (second).
Hybrid system Index Algorithm
PSO TS SA HS
PV/wind/FC Mean 0.192 0.047 0.082 0.082
Min 0.156 0.031 0.047 0.062
Max 0.250 0.094 0.140 0.109
PV/FC Mean 0.185 0.039 0.07 0.082
Min 0.172 0.016 0.062 0.047
Max 0.218 0.094 0.094 0.125
Wind/FC Mean 0.172 0.027 0.072 0.078
Min 0.156 0.016 0.047 0.062
Max 0.218 0.062 0.094 0.109
PV/wind/battery Mean 0.663 0.051 0.070 0.077
Min 0.546 0.031 0.062 0.062
Max 0.78 0.078 0.094 0.140
PV/battery Mean 0.706 0.047 0.065 0.071
Min 0.515 0.031 0.047 0.062
Max 0.967 0.078 0.094 0.094
Wind/battery Mean 0.698 0.057 0.066 0.074
Min 0.624 0.031 0.062 0.062
Max 0.796 0.12 0.094 0.109
Author's personal copy
meet the deficit power. Simulation results show that the
optimized hybrid systems will be able to supply the load
demand.
In practice, most of the remote regions have electrical
power typically generated by diesel generators. This system is
difficult to maintain, very inefficient, and subject to frequent
outages. To protect against power outages due to mechanical
breakdowns, redundant generators are frequently in place,
resulting in higher capital costs. Maintenance work is most
often performed by skilled workers from outside of the re-
gions. Fuel must also be transported to the regions. All of this
leads to having an expensive generation system. For this aim
as well as in response to concerns about climate change, en-
ergy independence and economic stimulus, development of
renewable energy in worldwide has been encouraged by
government policy. As a result, according to the above-
mentioned reasons and the difficulties of transforming the
electrical energy to the remote regions, the renewable sources
can be promising alternatives.
Conclusion
This paper studies the economic aspects of PV/wind/FC and
PV/wind/battery systems and performance of different heu-
ristic optimization techniques to optimally size these sys-
tems. It is found that hybrid systems with battery storage are
economically better choice for producing electrical power
than hybrid systems with hydrogen-based storage systems.
With improvement in the efficiency of both FC and electro-
lyzer, FC/electrolyzer storage system can be economically
competitive in the future.
To optimally size the hybrid systems, different heuristic
techniques are applied to find the optimum number of each
component. From the optimization viewpoint, it is found that
PSO yields more promising results than TS, SA, and HS in
terms of the total annual cost.
Acknowledgment
The financial support of the Graduate University of Advanced
Technology is greatly acknowledged.
r e f e r e n c e s
[1] Ahmed NA, Miyatake M, Al-Othman A. Power fluctuationssuppression of stand-alone hybrid generation combiningsolar photovoltaic/wind turbine and fuel cell systems. EnergyConvers Manag 2008;49:2711e9.
[2] Calderon M, Calderon A, Ramiro A, Gonzalez J. Automaticmanagement of energy flows of a stand-alone renewable
Fig. 10 e The difference between the generated and
demanded powers. (a) FC-based system; (b) battery-based
system.
Fig. 11 e Storage level. (a) Hydrogen tanks and (b) batteries.
i n t e r n a t i o n a l j o u r n a l o f h y d r o g e n en e r g y 3 9 ( 2 0 1 4 ) 9 9 7 3e9 9 8 4 9983
Author's personal copy
energy supply with hydrogen support. Int J Hydrogen Energy2010;35:2226e35.
[3] Lagorse J, Simoes MG, Miraoui A, Costerg P. Energy costanalysis of a solar-hydrogen hybrid energy system for stand-alone applications. Int J Hydrogen Energy 2008;33:2871e9.
[4] Mohamed FA, Koivo HN. System modelling and onlineoptimal management of microGrid using mesh adaptivedirect search. Int J Electr Power Energy Syst 2010;32:398e407.
[5] Nehrir MH, Wang C. Modeling and control of fuel cells:distributed generation applications, vol. 41. John Wiley &Sons; 2009.
[6] Nelson D, Nehrir M, Wang C. Unit sizing and cost analysis ofstand-alone hybrid wind/PV/fuel cell power generationsystems. Renew Energy 2006;31:1641e56.
[7] Onar O, Uzunoglu M, Alam M. Modeling, control andsimulation of an autonomous wind turbine/photovoltaic/fuelcell/ultra-capacitor hybrid power system. J Power Sources2008;185:1273e83.
[8] Uzunoglu M, Onar O, Alam M. Modeling, control andsimulation of a PV/FC/UC based hybrid power generationsystem for stand-alone applications. Renew Energy2009;34:509e20.
[9] Valdes R, Rodrıguez L, Lucio J. Procedure for optimal designof hydrogen production plants with reserve storage and astand-alone photovoltaic power system. Int J HydrogenEnergy 2012;37:4018e25.
[10] Zervas P, Sarimveis H, Palyvos J, Markatos N. Model-basedoptimal control of a hybrid power generation systemconsisting of photovoltaic arrays and fuel cells. J PowerSources 2008;181:327e38.
[11] Gopalakrishnan K, Khaitan SK, Kalogirou S. Soft computingin green and renewable energy systems, vol. 269. Springer-Verlag New York Inc; 2011.
[12] Khaitan SK, Raju M. Dynamics of hydrogen powered CAESbased gas turbine plant using sodium alanate storagesystem. Int J Hydrogen Energy 2012;37(24):18904e14.
[13] Khaitan SK, Raju M. Discharge dynamics of coupled fuel celland metal hydride hydrogen storage bed for small windhybrid systems. Int J Hydrogen Energy 2012;37(3):2344e52.
[14] Raju M, Khaitan S. Charging dynamics of metal hydridehydrogen storage bed for small wind hybrid systems. Int JHydrogen Energy 2011;36(17):10797e807.
[15] Raju M, Khaitan SK. System simulation of compressedhydrogen storage based residential wind hybrid powersystems. J Power Sources 2012;210:303e20.
[16] Gopalakrishnan K, Khaitan SK. Use of hydrogen fromrenewable energy source for powering hot-mix asphaltplant. Int J Traffic Transp Eng 2012;2(1):30e43.
[17] Chavez-Ramırez A, Vallejo-Becerra V, Cruz J, Ornelas R,Orozco G, Munoz-Guerrero R, et al. A hybrid power plant(SolareWindeHydrogen) model based in artificialintelligence for a remote-housing application in Mexico. Int JHydrogen Energy 2013;38:2641e55.
[18] Diaf S, Diaf D, Belhamel M, Haddadi M, Louche A. Amethodology for optimal sizing of autonomous hybrid PV/wind system. Energy Policy 2007;35:5708e18.
[19] Borowy BS, Salameh ZM. Methodology for optimally sizingthe combination of a battery bank and PV array in a wind/PVhybrid system. Energy Convers IEEE Transac 1996;11:367e75.
[20] Shrestha G, Goel L. A study on optimal sizing of stand-alonephotovoltaic stations. Energy Convers IEEE Transac1998;13:373e8.
[21] Maghraby H, Shwehdi M, Al-Bassam GK. Probabilisticassessment of photovoltaic (PV) generation systems. PowerSyst IEEE Transac 2002;17:205e8.
[22] Kellogg W, Nehrir M, Venkataramanan G, Gerez V.Generation unit sizing and cost analysis for stand-alone
wind, photovoltaic, and hybrid wind/PV systems. EnergyConvers IEEE Transac 1998;13:70e5.
[23] Prasad AR, Natarajan E. Optimization of integratedphotovoltaicewind power generation systems with batterystorage. Energy 2006;31:1943e54.
[24] Roy S. Optimal planning of wind energy conversion systemsover an energy scenario. Energy Convers IEEE Transac1997;12:248e54.
[25] Rohani A, Mazlumi K, Kord H. Modeling of a hybrid powersystem for economic analysis and environmental impact inHOMER. In: Electrical engineering (ICEE), 2010 18th Iranianconference on; 2010. pp. 819e23.
[26] Koutroulis E, Kolokotsa D, Potirakis A, Kalaitzakis K.Methodology for optimal sizing of stand-alone photovoltaic/wind-generator systems using genetic algorithms. Sol Energy2006;80:1072e88.
[27] Zhang B, Yang Y, Gan L. Dynamic control of wind/photovoltaic hybrid power systems based on anadvanced particle swarm optimization. In: Industrialtechnology, 2008. ICIT 2008. IEEE international conferenceon; 2008. pp. 1e6.
[28] Askarzadeh A. A discrete chaotic harmony search-basedsimulated annealing algorithm for optimum design of PV/wind hybrid system. Sol Energy 2013;97:93e101.
[29] Askarzadeh A. Developing a discrete harmony searchalgorithm for size optimization of windephotovoltaic hybridenergy system. Sol Energy 2013;98:190e5.
[30] Luna-Rubio R, Trejo-Perea M, Vargas-Vazquez D, Rıos-Moreno G. Optimal sizing of renewable hybrids energysystems: a review of methodologies. Sol Energy2012;86:1077e88.
[31] Garcia RS, Weisser D. A windediesel system with hydrogenstorage: joint optimisation of design and dispatch. RenewEnergy 2006;31:2296e320.
[32] El-Shatter TF, Eskander MN, El-Hagry MT. Energy flow andmanagement of a hybrid wind/PV/fuel cell generationsystem. Energy Convers Manag 2006;47:1264e80.
[33] Khan M, Iqbal M. Dynamic modeling and simulation of asmall windefuel cell hybrid energy system. Renew Energy2005;30:421e39.
[34] Khan M, Iqbal M. Pre-feasibility study of stand-alone hybridenergy systems for applications in Newfoundland. RenewEnergy 2005;30:835e54.
[35] Hakimi S, Tafreshi SM, Kashefi A. Unit sizing of a stand-alone hybrid power system using particle swarmoptimization (PSO). In: Automation and logistics, 2007 IEEEinternational conference on; 2007. pp. 3107e12.
[36] Hakimi S, Moghaddas-Tafreshi S. Optimal sizing of a stand-alone hybrid power system via particle swarm optimizationfor Kahnouj area in south-east of Iran. Renew Energy2009;34:1855e62.
[37] Eberhart R, Kennedy J. A new optimizer using particle swarmtheory. In: Micro machine and human science, 1995. MHS’95,Proc sixth int symposium; 1995. pp. 39e43.
[38] Glover F. Future paths for integer programming and links toartificial intelligence. Comput Oper Res 1986;13:533e49.
[39] Kirkpatrick S, Vecchi M. Optimization by simulatedannealing. Science 1983;220:671e80.
[40] �Cerny V. Thermodynamical approach to the travelingsalesman problem: an efficient simulation algorithm. JOptim Theory Appl 1985;45:41e51.
[41] Geem ZW, Kim JH, Loganathan G. A new heuristicoptimization algorithm: harmony search. Simulation2001;76:60e8.
[42] Abido M. Optimal power flow using tabu search algorithm.Electr Power Comp Syst 2002;30:469e83.
i n t e rn a t i o n a l j o u r n a l o f h y d r o g e n en e r g y 3 9 ( 2 0 1 4 ) 9 9 7 3e9 9 8 49984