Climate Change, Biofuels, andLand Use Legacy:
Trusting Computer Models to Guide Water Resources Management Trajectories
Anthony KendallGeological Sciences, Michigan State University
Collaborators: David Hyndman (MSU), Bryan Pijanowski (Purdue), Deepak Ray (Purdue)

Source: PijanowskiSources: USCB and USDA
Central question
• In response to:– Climate change– Land use change– Land use
intensification– Agricultural demand
shifts (e.g. biofuels)
How will Great Lakes water resources change during this century?
Miscanthus at Great Lakes Bioenergy Research Center
Source: IPCC AR4
Summer 2100 (A1B)

We need models to answer this question
• Temperature and precipitation changes: – Regional and global climate models
• Soil moisture, streamflow, lake level changes:– Hydrologic and crop models
• Land use changes:– Land transformation and economic models
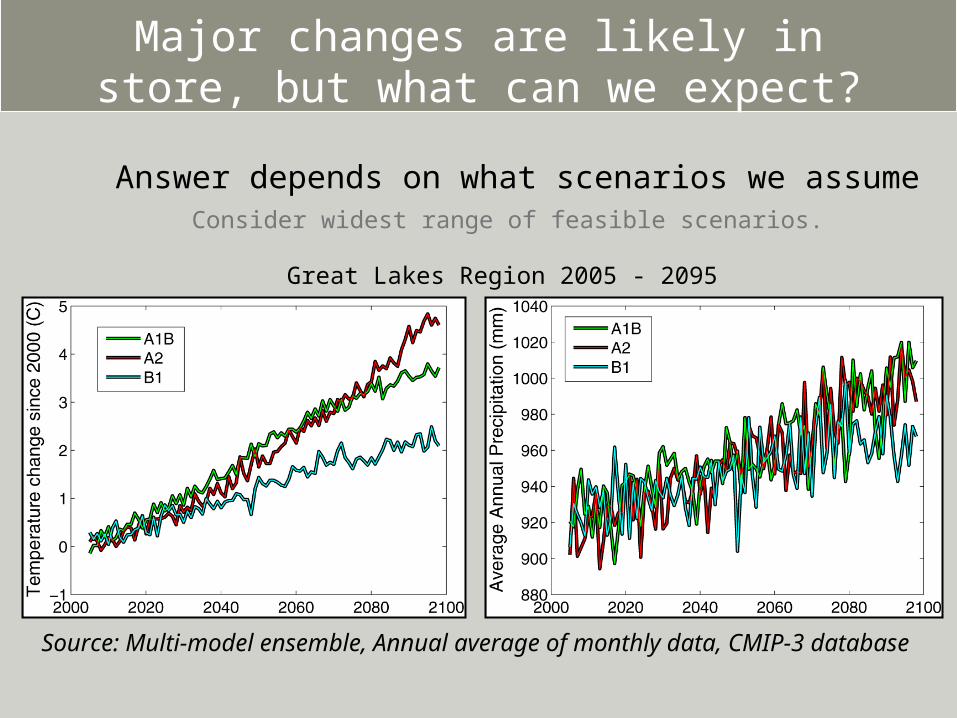
Major changes are likely in store, but what can we expect?
Answer depends on what scenarios we assume
Source: Multi-model ensemble, Annual average of monthly data, CMIP-3 database
Great Lakes Region 2005 - 2095
Consider widest range of feasible scenarios.

Which model do we choose?
Source: Multi-model ensemble average and standard deviation, annual average of monthly data, A1B scenario, CMIP-3 database
Great Lakes Region 2005 - 2095
One solution: multi-model ensemble averages

Annual temperatures forecast to rise significantly
Source: Multi-model ensemble, Monthly data, A1B scenario, CMIP-3 database

Precipitation forecast to increase
Source: Multi-model ensemble, Monthly data, A1B scenario, CMIP-3 database

No significant changes forecast for summer rainfall
Source: Multi-model ensemble, Monthly data, A1B scenario, CMIP-3 database
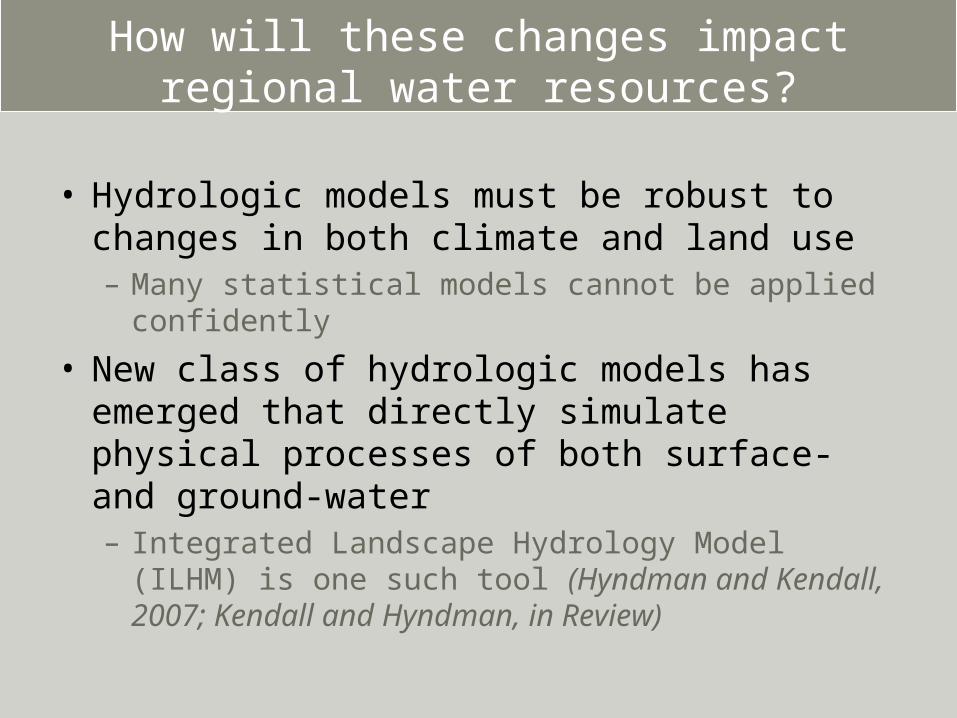
How will these changes impact regional water resources?
• Hydrologic models must be robust to changes in both climate and land use– Many statistical models cannot be applied confidently
• New class of hydrologic models has emerged that directly simulate physical processes of both surface- and ground-water– Integrated Landscape Hydrology Model (ILHM) is one
such tool (Hyndman and Kendall, 2007; Kendall and Hyndman, in Review)

Integrated Landscape Hydrology Model (ILHM)
• Simulates nearly complete terrestrial water cycle• Hourly water fluxes calculated within each model
cell

Select ILHM fluxes

Climate and land use forecasts
• For Muskegon River Watershed (MRW) in central lower Michigan
• Average of 24 GCM outputs
• Three emissions scenarios (A1B shown)

Land use change scenarios (MRW)
• Forecast land use using the Land Tranformation Model (Pijanowski)
• Three change scenarios for 2050 (above) and 2095
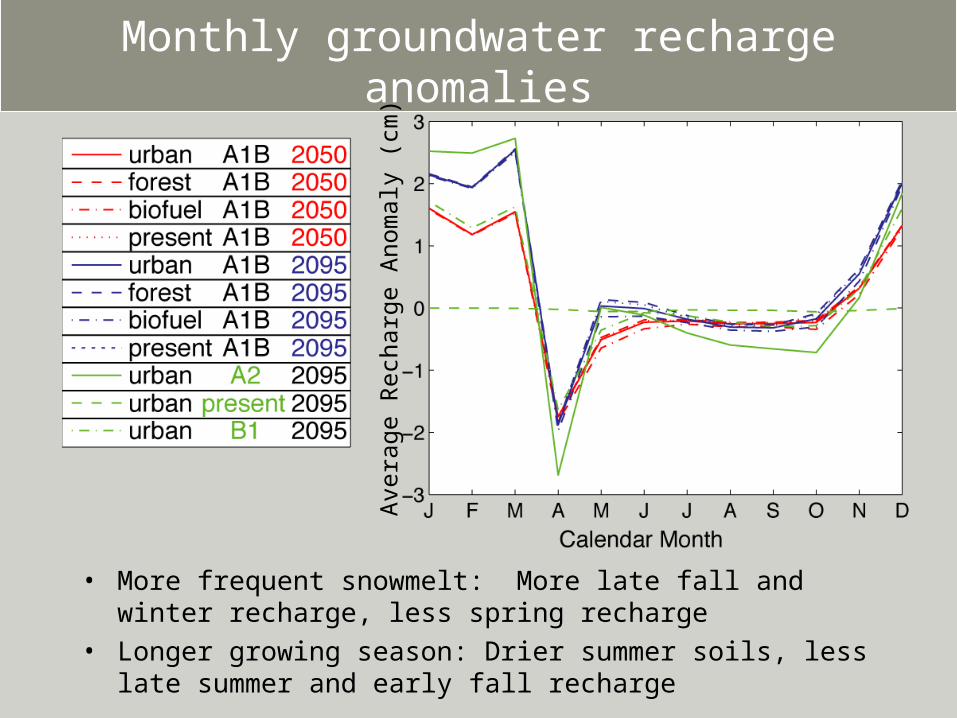
Monthly groundwater recharge anomalies
• More frequent snowmelt: More late fall and winter recharge, less spring recharge
• Longer growing season: Drier summer soils, less late summer and early fall recharge
Ave
rage
Rec
harg
e A
nom
aly
(cm
)

Implications of simulated groundwater recharge changes
• More winter recharge– Higher early spring water table– Higher peak flows during spring
• Less spring recharge– Earlier decline of water table– Lower baseflow levels, longer low-flow period in
streams• Overall increased groundwater resource
– Altered seasonal availability• Agree with regional summaries
– i.e. IPCC AR4, USGCRP National Assessment

Important water quality impacts
• Increased sediment transport– Higher peak and mean flows
• Increased threat of sewer overflows– Extreme precipitation event increases
• Warmer water temperatures– Warmer air temperatures– Lower summer baseflows– Mitigated by groundwater response?
• Changes to groundwater transport of nutrients and contaminants
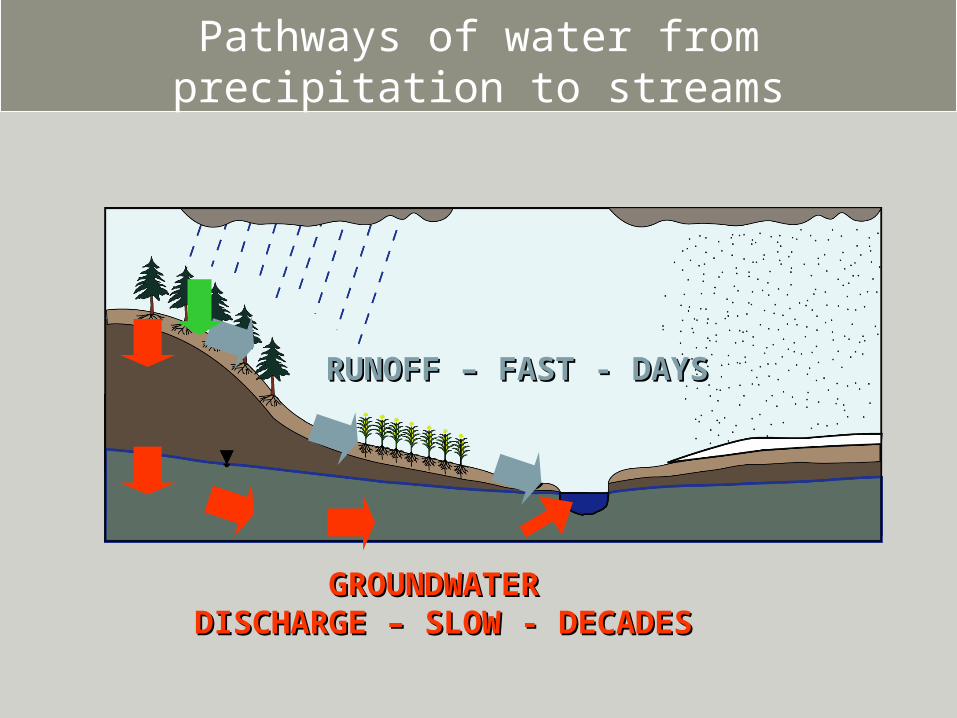
RUNOFF – FAST - DAYSRUNOFF – FAST - DAYS
GROUNDWATER GROUNDWATER DISCHARGE – SLOW - DECADESDISCHARGE – SLOW - DECADES
Pathways of water from precipitation to streams
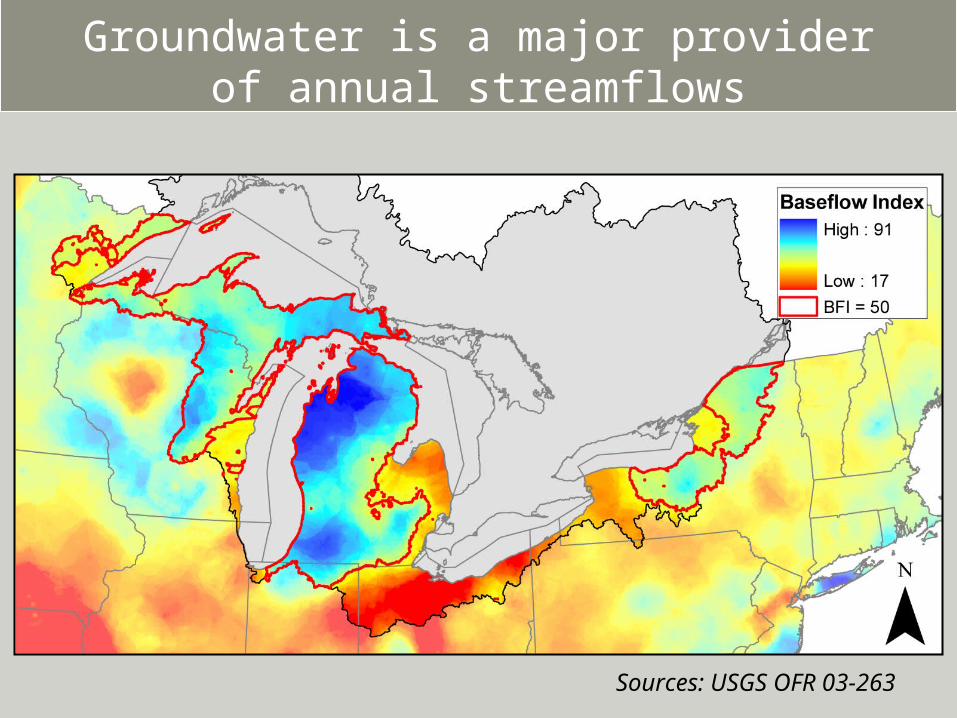
Groundwater is a major provider of annual streamflows
Sources: USGS OFR 03-263

Surface Watershed
Travel Times (years)
0 - 10
11 - 15
16 - 25
26 - 50
51 - 100
101 - 200
201 - 500
0 25 5012.5 Kilometers
±
Travel times of water in groundwater aquifers can be very long
• Full impacts of land use change on stream water quality can take decades to even centuries
• Predominantly in areas with thick saturated aquifers and deep water tables
Source: Pijanowski et al. (2007, E&S)

To what land use is current water quality responding?
• How different is this from today’s land use?– Land Use Legacy
• Land use legacy maps combine groundwater travel times with historical land use change information – In practice: need models for both

Surface Watershed
Travel Times (years)
0 - 10
11 - 15
16 - 25
26 - 50
51 - 100
101 - 200
201 - 500
0 25 5012.5 Kilometers
±
Groundwater travel time model
• Can be simulated with a variety of existing models
Source: Pijanowski et al. (2007, E&S)

Backcast land use change model
Source: Ray and Pijanowski (2009)

Comparison of legacy and current maps (MRW)
10%
20%
75%
Source: Ray and Pijanowski (2009)
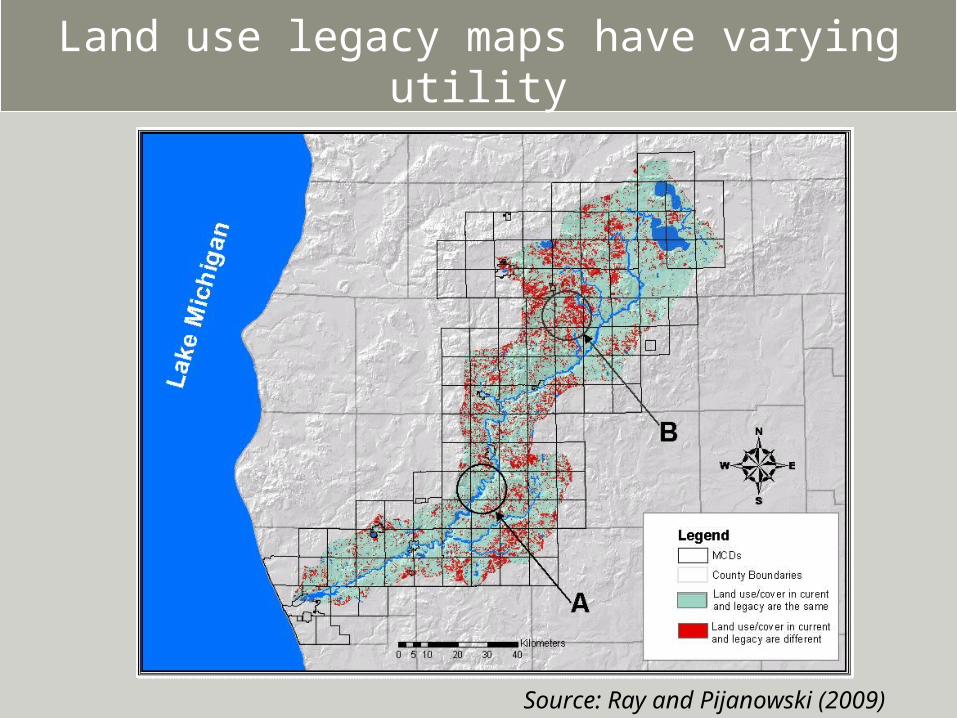
Land use legacy maps have varying utility
Source: Ray and Pijanowski (2009)

Multi-decadal forces and system responses
• Climate change: Changes occurring over many decades that may inexorably alter water quantity and quality
• Land use change: Shifts in population, global economic demand, and agricultural production will place new stresses on water resources
• Land use legacy: Water quality may still be responding to land uses from decades prior– Similarly, management actions taken today may take
decades to be fully realized

Bringing long-term modeling into the management loop
• Managers have long relied on steady-state or short term system models
• Long-term drivers, and long-term responses, require new and different approaches– Uncertainties expand and multiply, and must be
explicitly addressed– Multi-model ensembles, multiple scenarios can help
to identify range of model predictions
• Promote cooperation between universities and water managers

Thank you!
• Please submit questions to the hosts
• Feel free to contact me:– kendal30 at msu.edu
• Funding Acknowledgements: