FAST 2017, Santa Clara
Chronix: Long Term Storage and Retrieval Technologyfor Anomaly Detection in Operational Data
Florian Lautenschlager, Michael Philippsen, Andreas Kumlehn, and Josef Adersberger
flolaut
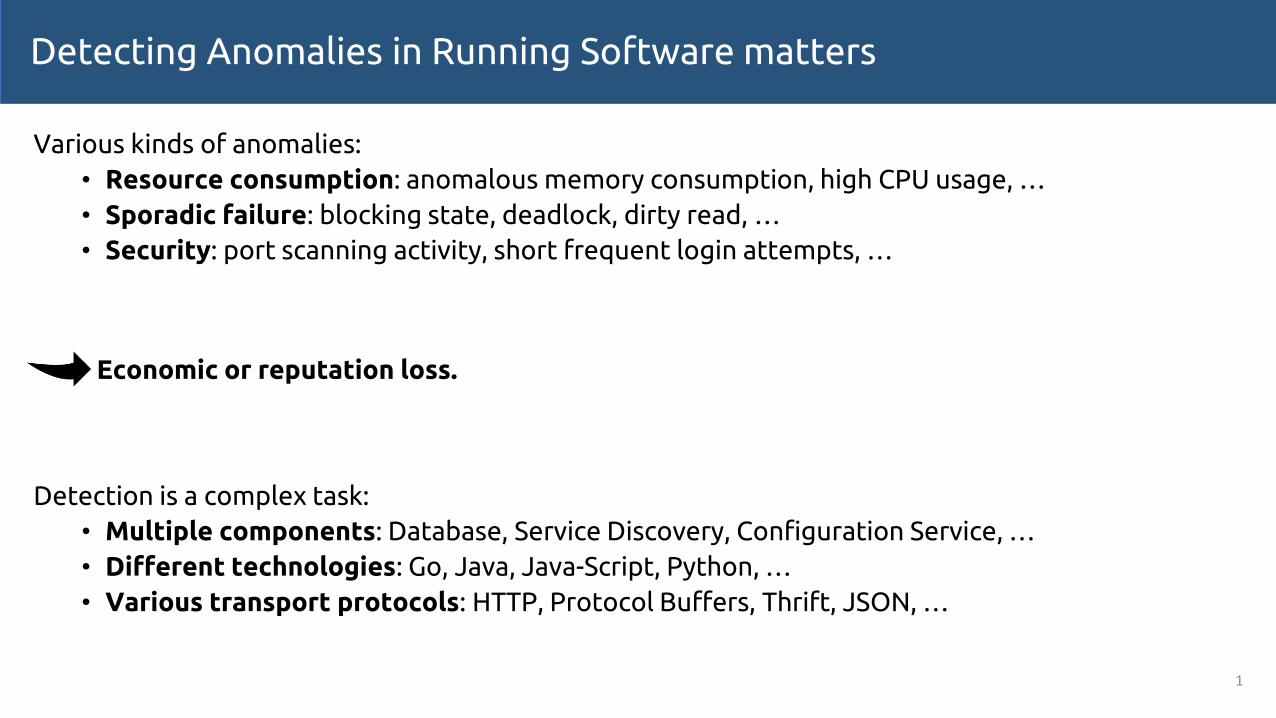
Detecting Anomalies in Running Software matters
Various kinds of anomalies:
• Resource consumption: anomalous memory consumption, high CPU usage, …
• Sporadic failure: blocking state, deadlock, dirty read, …
• Security: port scanning activity, short frequent login attempts, …
Economic or reputation loss.
Detection is a complex task:
• Multiple components: Database, Service Discovery, Configuration Service, …
• Different technologies: Go, Java, Java-Script, Python, …
• Various transport protocols: HTTP, Protocol Buffers, Thrift, JSON, …
1

Anomaly Detection Tool Chain for Operational Data
Types of operational data:
• Metrics: scalar values, e.g., rates, runtimes, total hits, counters, …
• Events: single occurrences, e.g., a user’s login, product order, …
• Traces: sequences within a software system, e.g., the called methods, …
2
Operational Data
Application
Collection Framework
Analysis Framework
Time Series Database
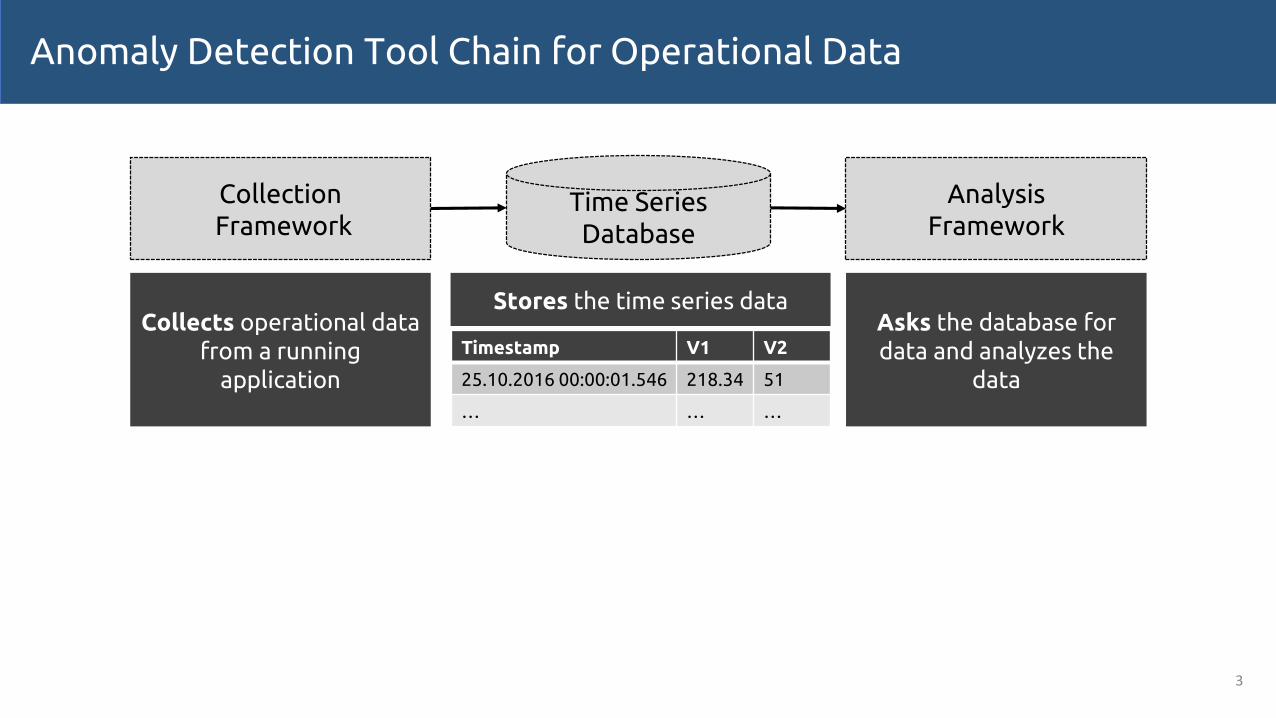
Anomaly Detection Tool Chain for Operational Data
3
CollectionFramework
Analysis Framework
Time Series Database
Timestamp V1 V2
25.10.2016 00:00:01.546 218.34 51
… … …
Collects operational data from a running
application
Asks the database for data and analyzes the
data
Stores the time series data

Anomaly Detection Tool Chain for Operational Data
3
General-Purpose TSDB
• Brake shoe• Resource hog
• Productivity obstacle
Domain specific sensors and adaptors
Domain specific analysis algorithms and tools
CollectionFramework
Analysis Framework
Time Series Database
Chronix:Domain specific TSDB
Domain specific sensors and adaptors
Domain specific analysis algorithms and tools
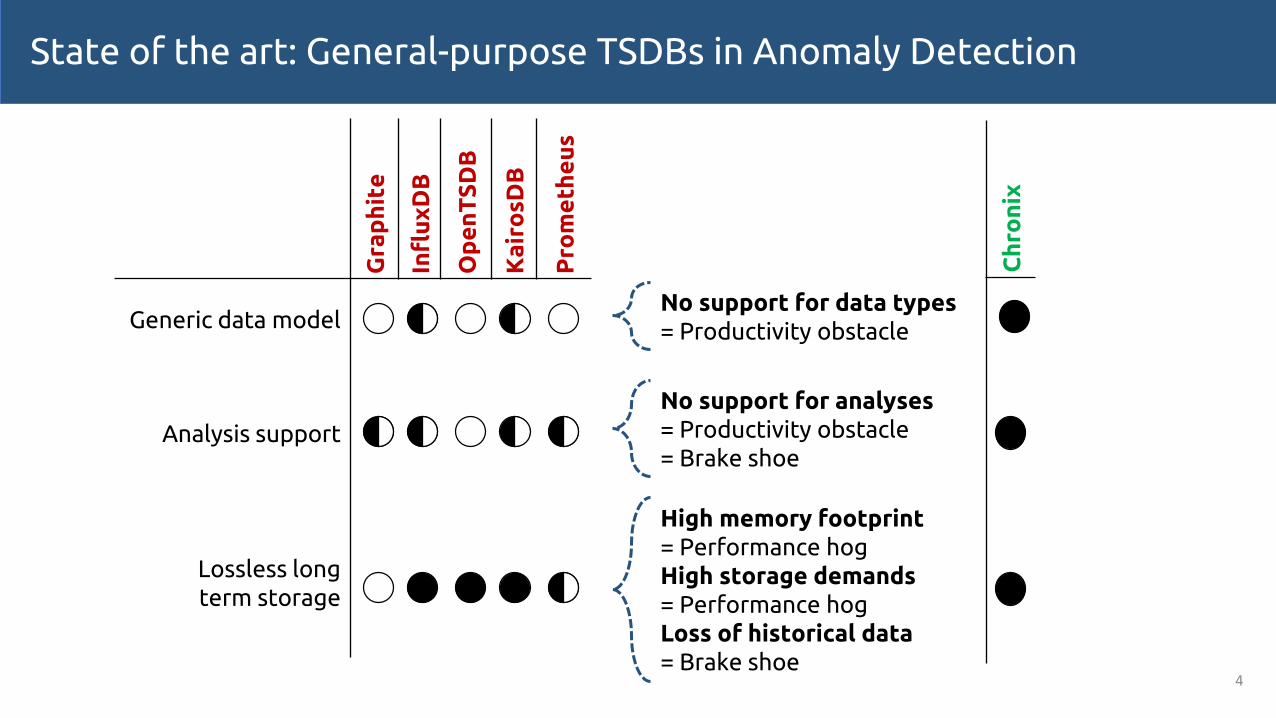
State of the art: General-purpose TSDBs in Anomaly Detection
4
Gra
ph
ite
Infl
ux
DB
Op
en
TS
DB
Ka
iro
sD
B
Pro
me
the
us
Generic data model
Analysis support
Lossless longterm storage
Ch
ron
ix
High memory footprint= Performance hogHigh storage demands= Performance hogLoss of historical data= Brake shoe
No support for analyses= Productivity obstacle= Brake shoe
No support for data types= Productivity obstacle
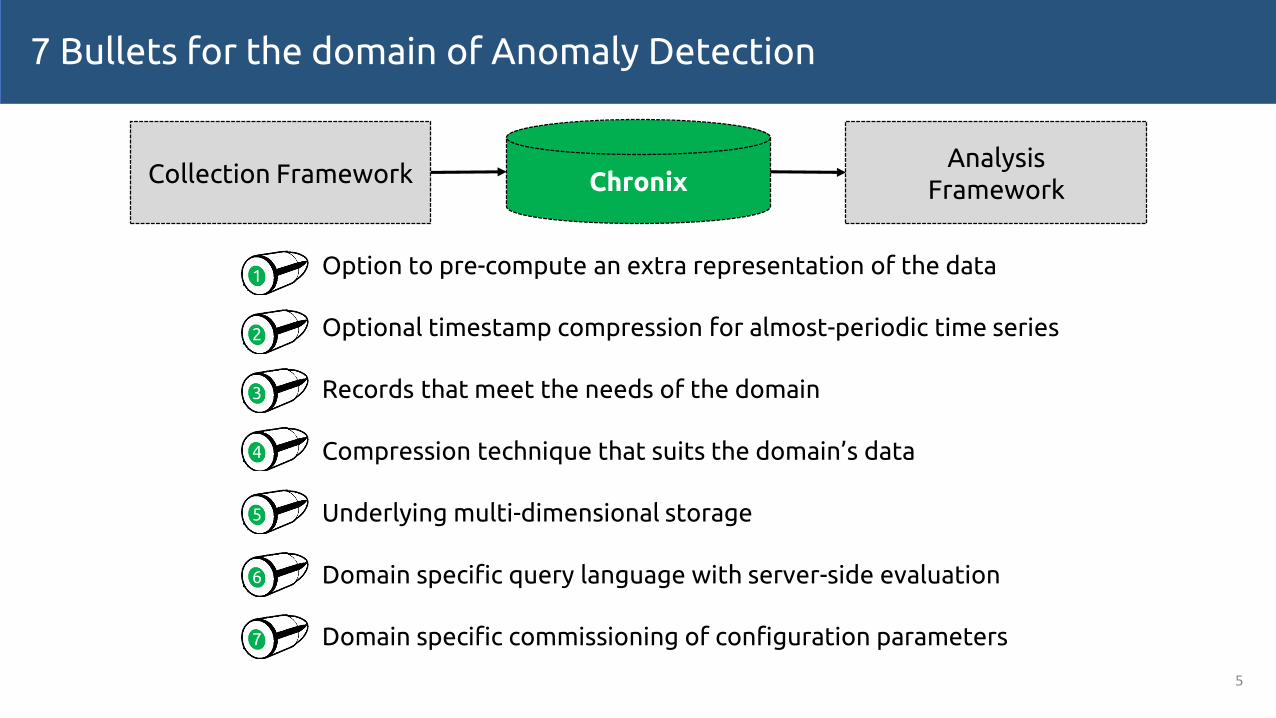
7 Bullets for the domain of Anomaly Detection
Option to pre-compute an extra representation of the data
Optional timestamp compression for almost-periodic time series
Records that meet the needs of the domain
Compression technique that suits the domain’s data
Underlying multi-dimensional storage
Domain specific query language with server-side evaluation
Domain specific commissioning of configuration parameters
5
Collection FrameworkAnalysis
FrameworkChronix
1
2
3
4
5
6
7

Running Example: Almost-periodic time series with operational data
Timestamp Value Metric Process Host
25.10.2016 00:00:01.546 218.34 ingester\time SmartHub QAMUC
25.10.2016 00:00:06.718 218.37 ingester\time SmartHub QAMUC
25.10.2016 00:00:11.891 218.49 ingester\time SmartHub QAMUC
25.10.2016 00:00:16.964 218.52 ingester\time SmartHub QAMUC
… … … … …
… … … … …
6
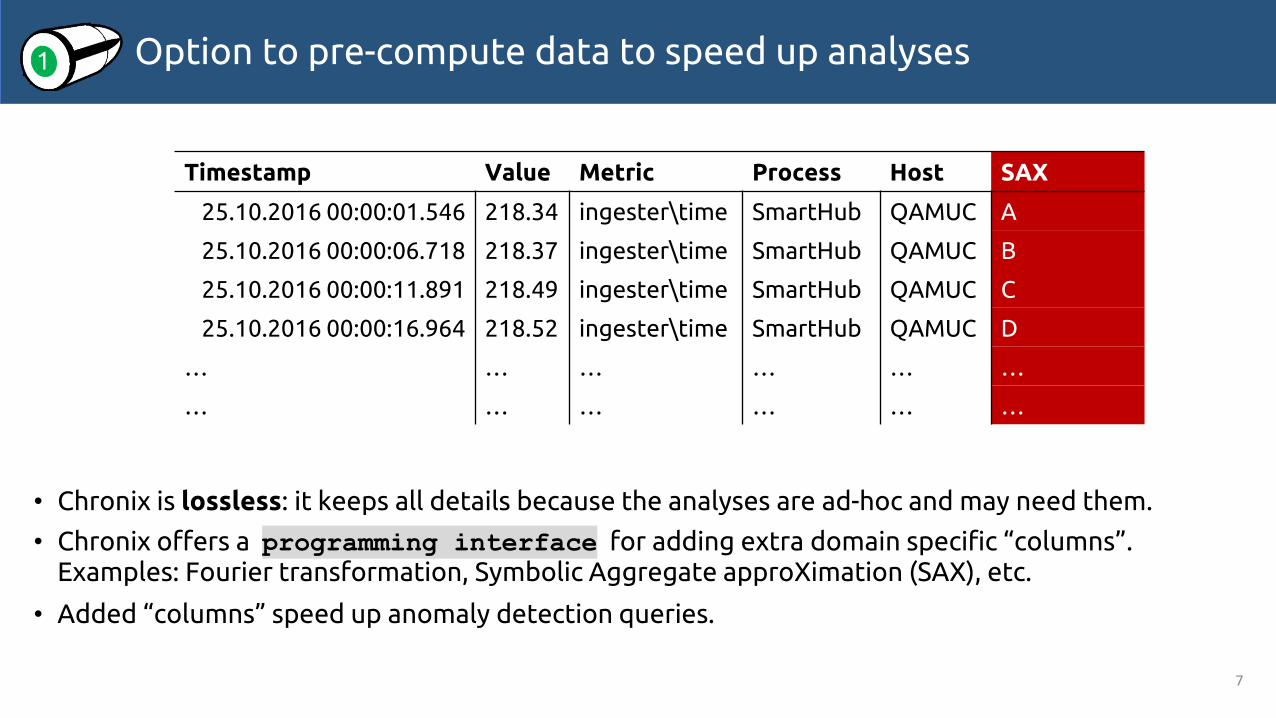
Option to pre-compute data to speed up analyses
• Chronix is lossless: it keeps all details because the analyses are ad-hoc and may need them.
• Chronix offers a programming interface for adding extra domain specific “columns”. Examples: Fourier transformation, Symbolic Aggregate approXimation (SAX), etc.
• Added “columns” speed up anomaly detection queries.
7
Timestamp Value Metric Process Host SAX
25.10.2016 00:00:01.546 218.34 ingester\time SmartHub QAMUC A
25.10.2016 00:00:06.718 218.37 ingester\time SmartHub QAMUC B
25.10.2016 00:00:11.891 218.49 ingester\time SmartHub QAMUC C
25.10.2016 00:00:16.964 218.52 ingester\time SmartHub QAMUC D
… … … … … …
… … … … … …
1

Optional timestamp compaction
• It suffices to be able to reconstruct approximate timestamps for almost-periodic time series.
• Date-Delta-Compaction
• Chronix is functionally lossless as it keeps all relevant details.
• The tolerable degree of inaccuracy is a
8
Timestamp Value Metric Process Host SAX
25.10.2016 00:00:01.546 218.34 ingester\time SmartHub QAMUC A
5.172 218.37 ingester\time SmartHub QAMUC B
- 218.49 ingester\time SmartHub QAMUC C
- 218.52 ingester\time SmartHub QAMUC D
… … … … …
… … … … …
2
Configuration Parameter of 7
Space saved

Date-Delta-Compaction
9
Timestamp
25.10.2016 00:00:01.546
25.10.2016 00:00:06.718
25.10.2016 00:00:11.891
25.10.2016 00:00:16.964
…
…
Timestamp
25.10 … :01.546
5.172
5.173
5.073
…
…
Timestamp
25.10 … :01.546
5.172
0.001
0.1
…
…
Timestamp
25.10 … :01.546
5.172
-
-
…
…
Calculate deltas
Compute diffs
between them
Drop diffs below
threshold
If accumulated drift > threshold
store delta.(Upper bound on inaccuracy)
Timestamp
25.10 … :01.546
5.172
-
-
…
…
space saved
space saved

Domain specific data characteristics
10
Timestamp Value Metric Process Host SAX
25.10.2016 00:00:01.546 218.34 ingester\time SmartHub QAMUC A
5.172 218.37 ingester\time SmartHub QAMUC B
- 218.49 ingester\time SmartHub QAMUC C
- 218.52 ingester\time SmartHub QAMUC D
… … … … … …
… … … … … …
Many anomaly detection tasks
need blocks of data rather than “lines”.
Repetitive values.
Repetitive values.
“Columns” with repetitive
values.
Some compression techniques work
better than others.

Records that meet the needs of the domain
Therefore:
Record := Attributes + Start + End + Type + Data Chunk
• Chronix offers a programming interface to implement time series specific records.
• Chronix exploits repetitiveness and bundles “lines” into data chunks.
• The chunk size is a
11
Timestamp Value Metric Process Host SAX
25.10.2016 00:00:01.546 218.34 ingester\time SmartHub QAMUC A
5.172 218.37 ingester\time SmartHub QAMUC B
- 218.49 ingester\time SmartHub QAMUC C
- 218.52 ingester\time SmartHub QAMUC D
… … … … … …
… … … … … …
1 2 1
3
Configuration Parameter of 7
Recordmetric: ingester\time
process: SmartHubhost: QAMUC
start: 25.10.2016 00:00:01.546end: …
type: metricdata: Timestamp Value SAX
25.10.2016 00:00:01.546 218.34 A
5.172 218.37 B
- 218.49 C
- 218.52 D
2
1
chunk & convert
2 21
BLOB

Compression technique that suits the domain’s data
• Chronix exploits that domain data often has small increments, recurring patterns, etc.
• Chronix uses a lossless compression technique that minimizes (record sizes + index sizes).
• The choice of compression technique is a
12
Recordmetric: ingester\time
process: SmartHubhost: QAMUCstart: 25.10.2016 00:00:01.546
end: …type: metricdata: 00105e0 e6b0 343b 9c74 080
7bc 0804 e7d5 0804 00105f0
4
Configuration Parameter of 7
Recordmetric: ingester\time
process: SmartHubhost: QAMUCstart: 25.10.2016 00:00:01.546
end: …type: metricdata: Timestamp Value SAX
25.10.2016 00:00:01.546 218.34 A
5.172 218.37 B
- 218.49 C
- 218.52 D Compressed BLOB
serialize & compress

Underlying multi-dimensional storage
By using a multi-dimensional storage …
• … Chronix supports explorative analyses.
• Attributes are visible to the storage and indexed.
• Users can use any combination to find a record.
• … Chronix supports correlating analyses.
• Every type of data can be stored.
• Queries can use and combine types.
13
q=host:QAMUC AND metric:ingester*
AND type:[metric OR trace]
AND end:NOW-7MONTH
5
Recordmetric: ingester\time
process: SmartHubhost: QAMUC
start: 25.10.2016 00:00:01.546end: …type: metricdata: 00105e0 e6b0 343b 9c74 080
7bc 0804 e7d5 0804 00105f0
Recordmetric: ingester\methods
process: SmartHubhost: QAMUC
start: 25.10.2016 00:00:01.546end: …type: tracedata: d65fa01 7ab2 433c 7c8e f123
2ca 0713 a8f5 926b 01006e1
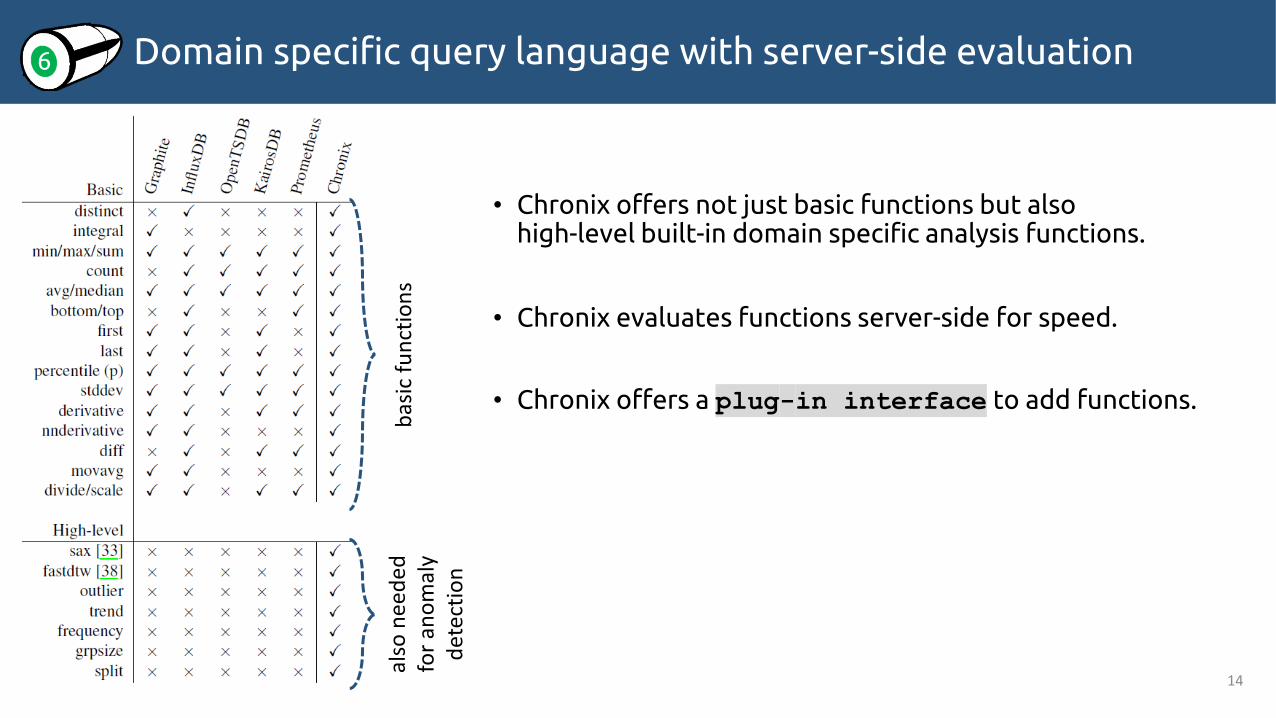
Domain specific query language with server-side evaluation
• Chronix offers not just basic functions but also high-level built-in domain specific analysis functions.
• Chronix evaluates functions server-side for speed.
• Chronix offers a plug-in interface to add functions.
14
bas
ic f
un
ctio
ns
also
ne
eded
fo
r an
om
aly
det
ecti
on
6

Domain specific query language with server-side evaluation
• Chronix achieves more programming comfort & fast results.
15
6
Chronix
Query 1:
q=metric:ingester\time
& cf=outlier
General-Purpose Time Series Database
query 1
Query 1:
select q(0.25,time),q(0.75,time) from ingester
Calculate threshold
Query 2:
select time from ingester where time >= threshold
high-level function
query 1
read
result process
read
result process
read
processresult
query 2extra code1x query
1x latency
2x queryextra code2x latency
extra codeextra code

Operational data of 5 industry projects
16
DescriptionInterval
(sec)
Pairs(mio)
Time series
P1 Application for searching car maintenance and repair instructions.(8 app sever, 20 search server)
30 2,4 1,080
P2 Retail application for orders, billing, and customer relations. (1 database, 2 app server)
60 331.4 8,567
P3 Sales application of a car manufacturer. (1 database, 2 app servers)
30 162.6 4,538
P4 Service application for modern cars (music streaming)
1 metric 3.9 lsof 0.4 strace 12.1
500
P5 Manage the compatibility of software components in a car.
60 3,762.3 24,055
Total 4,275.1 38,740
used for the Evaluation
7used for

Best threshold for the Date-Delta-Compaction
17
DDC = 200
7

Operational data of 3 (of 5) industry projects
18
DescriptionInterval
(sec)
Pairs(mio)
Time series r q
P1 Application for searching car maintenance and repair
instructions.(8 app sever, 20 search server)
30 2,4 1,080
P2 Retail application for orders, billing, and customer relations. (1 database, 2 app server)
60 331.4 8,567
P3 Sales application of a car manufacturer. (1 database, 2 app servers)
30 162.6 4,538
P4 … … … …
P5 … … … …
Total 4,275.1 38,740
91 2
56 1
28 3
21 5
7 30
1 30
0.5 15
… …
… …
Query Mixr = range (days)q= # of queries
7

Best compression technique & Best chunk size for query mix
19
C= 128 KB, t= gzip
7

Operational data of 2 of (5) industry projects Evaluation
20
DescriptionInterval
(sec)
Pairs(mio)
Time series r q b h
P1 … … … …
P2 … … … …
P3 … … … …
P4 Service application for modern cars (music streaming)
1 metric 3.9 lsof 0.4 strace 12.1
500
P5 Manage the compatibility of software components in a car.
60 3,762.3 24,055
Total 4,275.1 38,740
18
0
2 2 0
91 2 1 2
56 1 4 3
28 5 4 6
21
12 2 6
14 8 7 8
7 15 5 10
1 11 6 6
0.5 1 1 2
… … … …
… … … …
… … … …
Query Mixr = range (days)q= # of queriesb= # of basisqueriesh= # of high-level queries

TSDBs under test Comparisons
Quantitative comparison
21
General-Purpose TSDB
• Productivity obstacles• Brake shoe
• Resource hog
Time Series Database
Chronix:Domain specific TSDB
InfluxDBOpenTSDBKairosDB
Chronix
a) Memory footprintb) Storage demandc) Data retrieval timesd) Query mix runtimes

a) Memory footprint
Memory footprint of the databases (in MB)
22
Chronix has a 34% – 69% smaller memory footprint.
InfluxDB OpenTSDB KairosDB Chronix
Initially after startup (processes up and running) 33 2,726 8,763 446
Maximal memory usage during import 10,336 10,111 18,905 7,002
Maximal memory usage during query 8,269 9,712 11,230 4,792

b) Storage demand
23
Chronix saves 20% – 68% of the storage space.
Storage demand (in GB)
Raw data InfluxDB OpenTSDB KairosDB Chronix
Project 4 1.2 0.2 0.2 0.3 0.1
Project 5 107.0 10.7 16.9 26.5 8.6
total 108.2 10.9 17.1 26.8 8.7

Data retrieval times for 20 ∙ 58 queries (in s)
c) Data retrieval times
24
r q InfluxDB OpenTSDB KairosDB Chronix
0.5 2 4.3 2.8 4.4 0.9
1 11 5.5 5.6 6.6 5.3
7 15 34.1 17.4 26.8 7.0
14 8 36.2 14.2 25.5 4.0
21 12 76.5 29.8 55.0 6.0
28 5 7.9 3.9 5.6 0.5
56 1 35.4 12.4 24.1 1.2
91 2 47.5 15.5 33.8 1.1
180 2 96.7 36.7 66.6 1.1
total 343.8 138.3 248.4 27.1
Chronix saves 80% – 92% on data retrieval times.
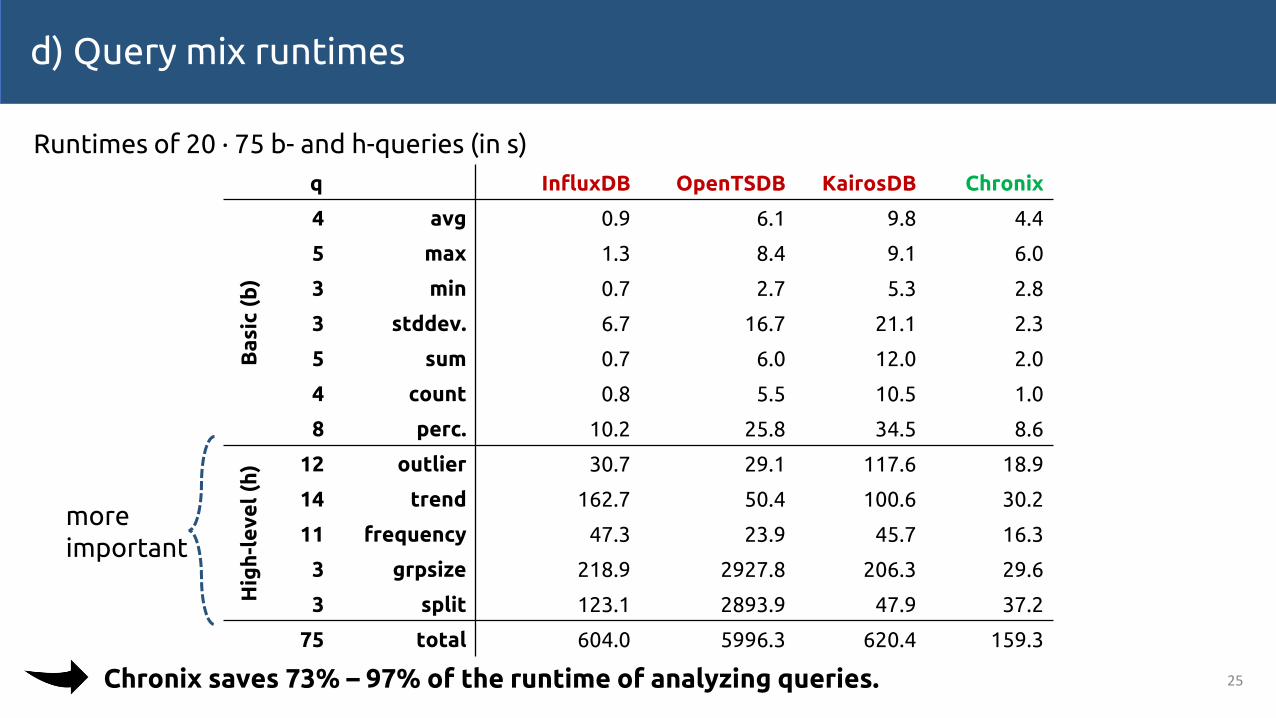
d) Query mix runtimes
Runtimes of 20 ∙ 75 b- and h-queries (in s)
25
q InfluxDB OpenTSDB KairosDB Chronix
Ba
sic
(b
)
4 avg 0.9 6.1 9.8 4.4
5 max 1.3 8.4 9.1 6.0
3 min 0.7 2.7 5.3 2.8
3 stddev. 6.7 16.7 21.1 2.3
5 sum 0.7 6.0 12.0 2.0
4 count 0.8 5.5 10.5 1.0
8 perc. 10.2 25.8 34.5 8.6
Hig
h-l
ev
el
(h) 12 outlier 30.7 29.1 117.6 18.9
14 trend 162.7 50.4 100.6 30.2
11 frequency 47.3 23.9 45.7 16.3
3 grpsize 218.9 2927.8 206.3 29.6
3 split 123.1 2893.9 47.9 37.2
75 total 604.0 5996.3 620.4 159.3
Chronix saves 73% – 97% of the runtime of analyzing queries.
more important

Chronix unleashes Anomaly Detection tasks
7 domain specific levers to unleash Anomaly Detection
1. Option to pre-compute an extra representation of the data
2. Optional timestamp compression for almost-periodic time series
3. Records that meet the needs of the domain
4. Compression technique that suits the domain’s data
5. Underlying multi-dimensional storage
6. Domain specific query language with server-side evaluation
7. Domain specific commissioning of configuration parameters
4 beneficial performance effects
• Chronix has a 34% – 69% smaller memory footprint.
• Chronix saves 20% – 68% of the storage space.
• Chronix saves 80% – 92% on data retrieval time.
• Chronix saves 73% – 97% of the runtime of analyzing queries.26
www.chronix.ioopen source