Charts and Graphs in Excel
SCLS BrainSnack
April 25, 2008

Why Statistics?Statistics are powerful tools to:
– Report to your board– Support budget requests– Assist with building/space planning– Document library’s importance in community– Review staffing patterns– Compare yourself to other libraries (
http://dpi.wi.gov/pld/dm-lib-stat.html)
– Other?

Info Desk—Daily Statistics—Week of Sept. 14-20 Day: _____________
Date: _____________
Type of Ques. 9am-11am 11am-1pm 1pm-3pm 3pm-6pm 6pm-9pm
Reference
Directional
Online Catalog
Equipment
Assistance
Instruction

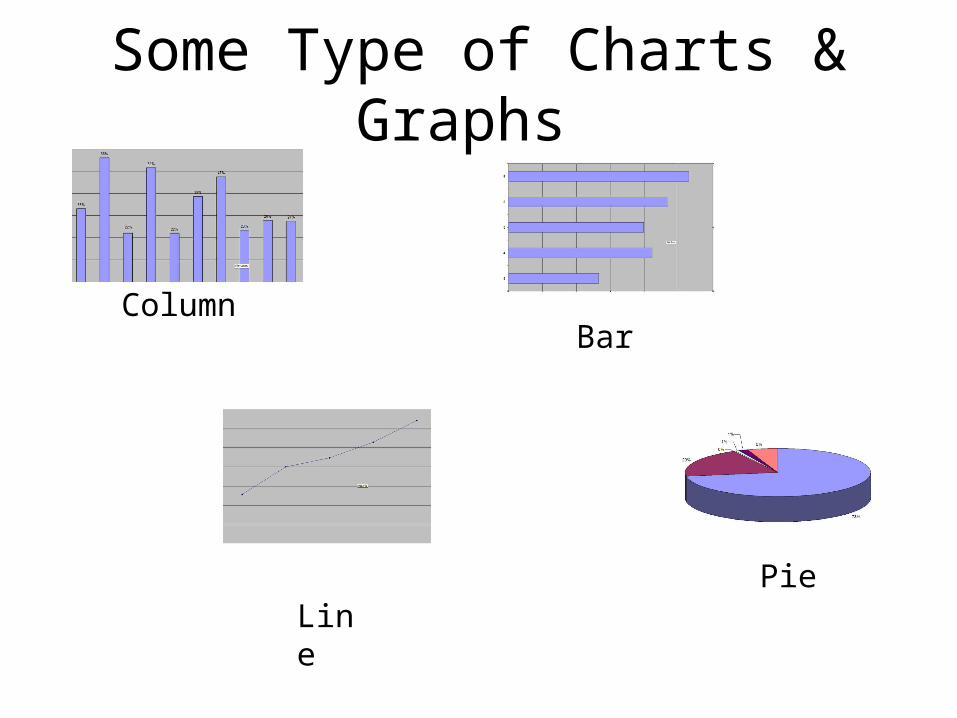
Some Type of Charts & Graphs
ColumnBar
LinePie

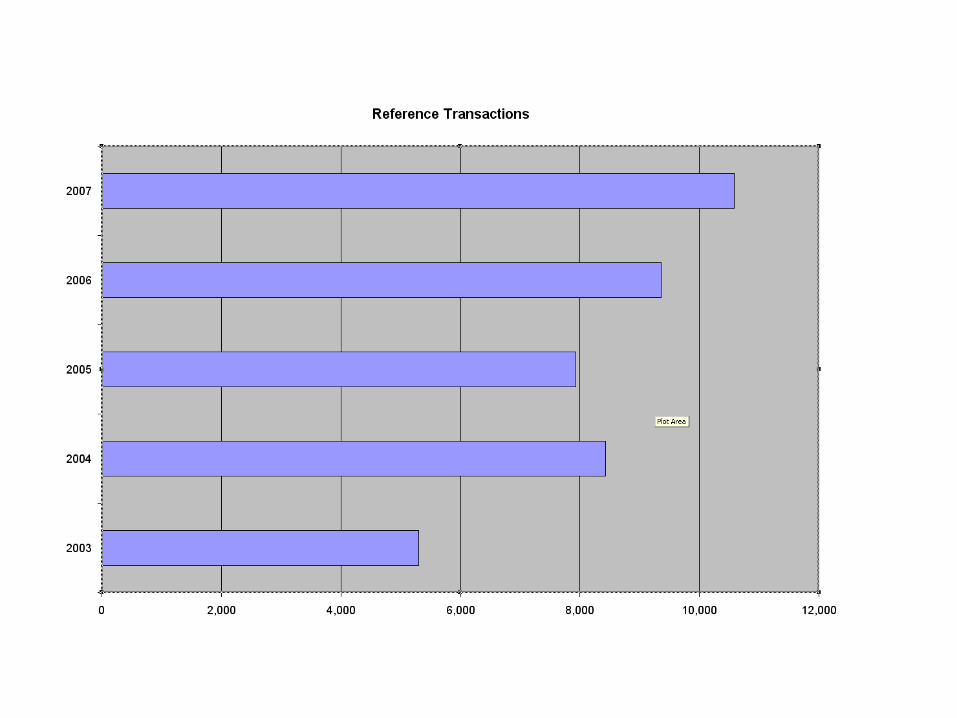
Column and Bar• Present data about 2 variables
• Rank size or importance of something over time
• A single data element over time
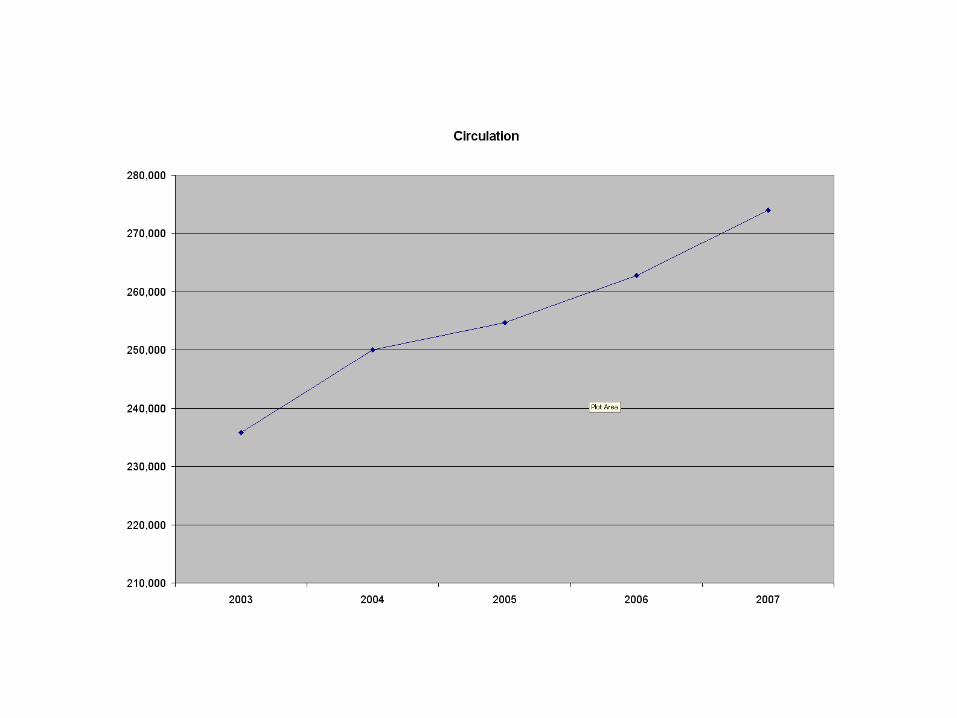
• Examples: – Circulation and year– Program attendance and year

Line
• Series of points, connected by a line
• Best suited for showing trends in multiple data elements over time
• Example:– Circulation by type of media over time

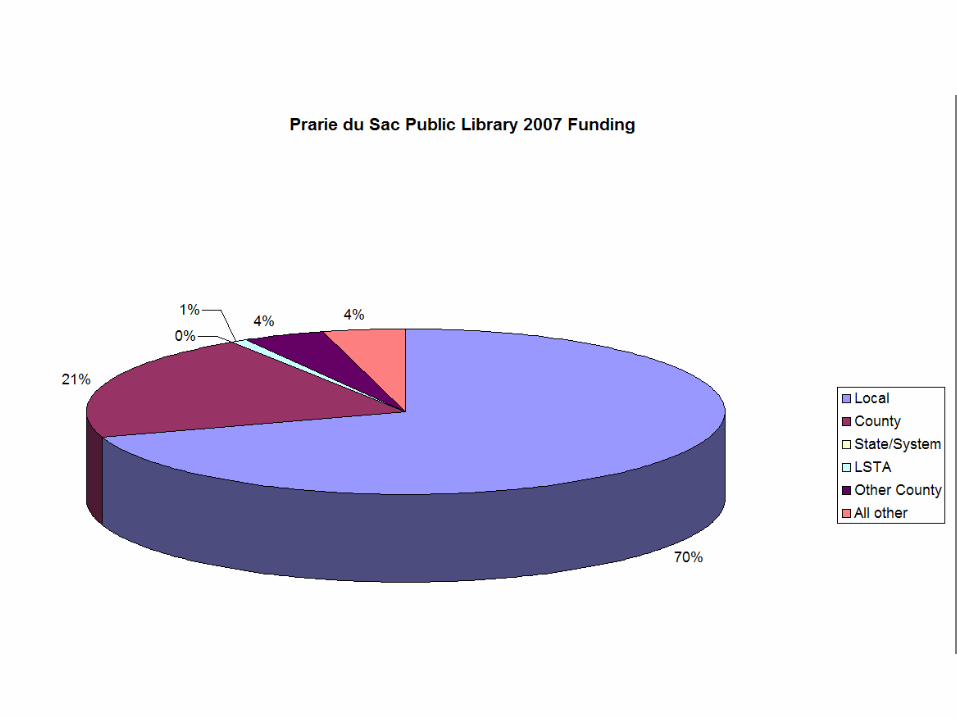
Pie
• Shows percentage values of one group of data as slices of pie.
• Examples: – Circulation to different types of patrons– Sources of funding


What chart when?
• There are many other types of charts!
• For more info see: – Wikipedia article (http://en.wikipedia.org/wiki/Chart)
– “Chart types” (from IBM) (http://tinyurl.com/5bcxx4)
– Strategic Planning for Results

Good Example of a Bad Chart
Source: http://lilt.ilstu.edu/gmklass/pos138/datadisplay/badchart.htm

Let’s Create a Chart
• Create a spreadsheet (or open an existing one)
• Formatting is key!– Especially with dates
• Be flexible
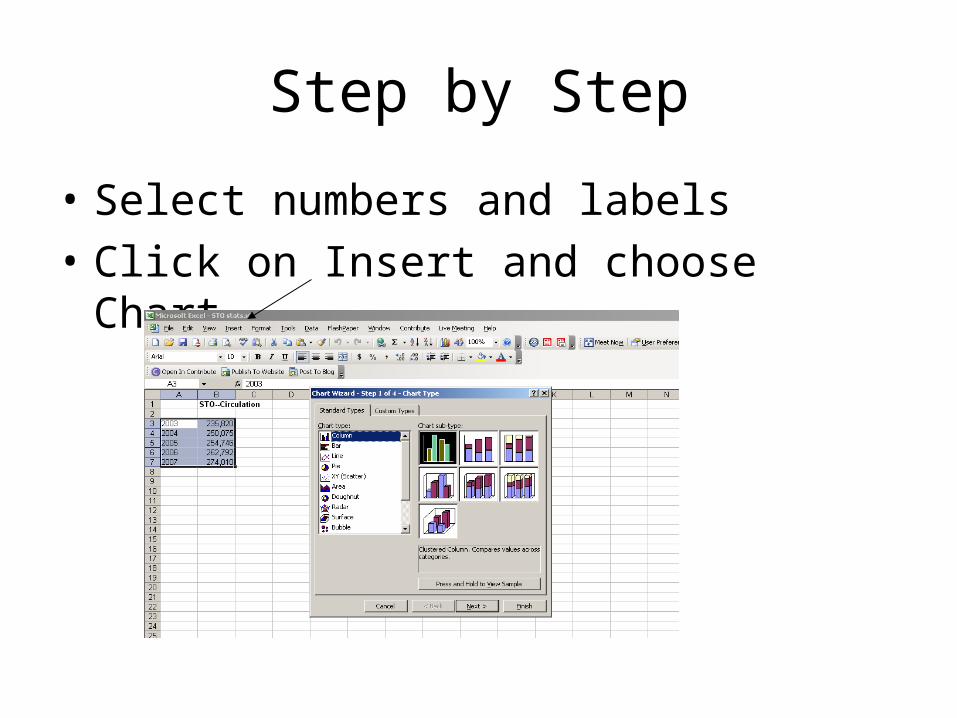
Step by Step
• Select numbers and labels
• Click on Insert and choose Chart

Step by Step
• Chart Wizard will guide you through the process
• Make sure Standard Types tab is selected
• Click the type of chart or graph – feel free to explore the various types
• To see a sample of your chart, click on the “Press and Hold to View Sample” button

Step by Step

Step by Step
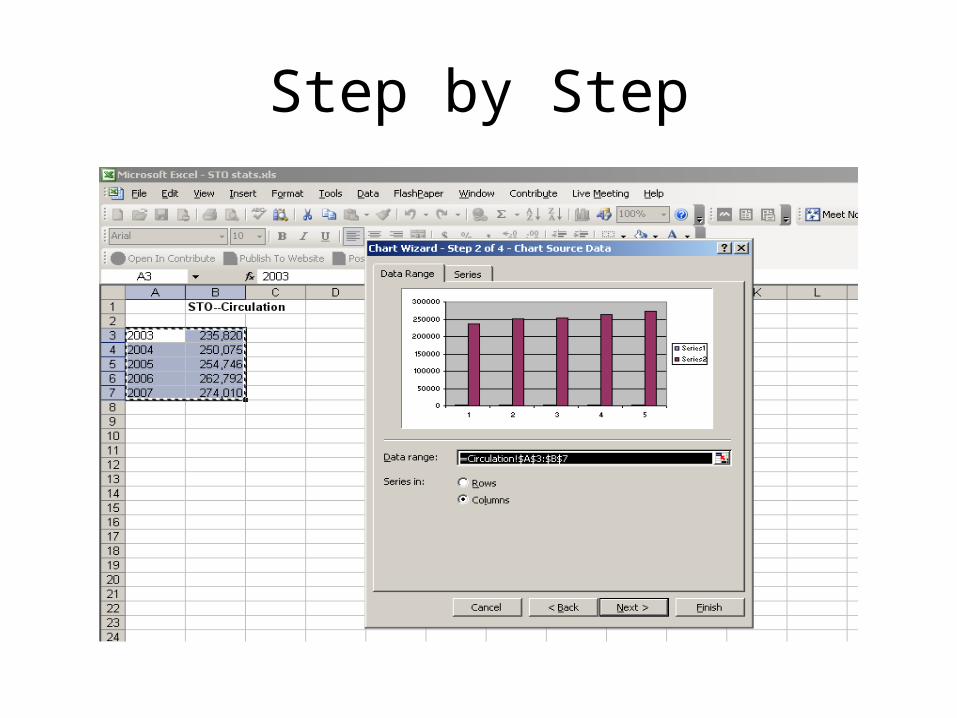
• Once you’ve chosen a type of chart, click on Next
• Data Range should appear with your data source in the box
• Make sure the button in front of columns is marked – if needed for your chart
• Click on Next
Step by Step
Step by Step
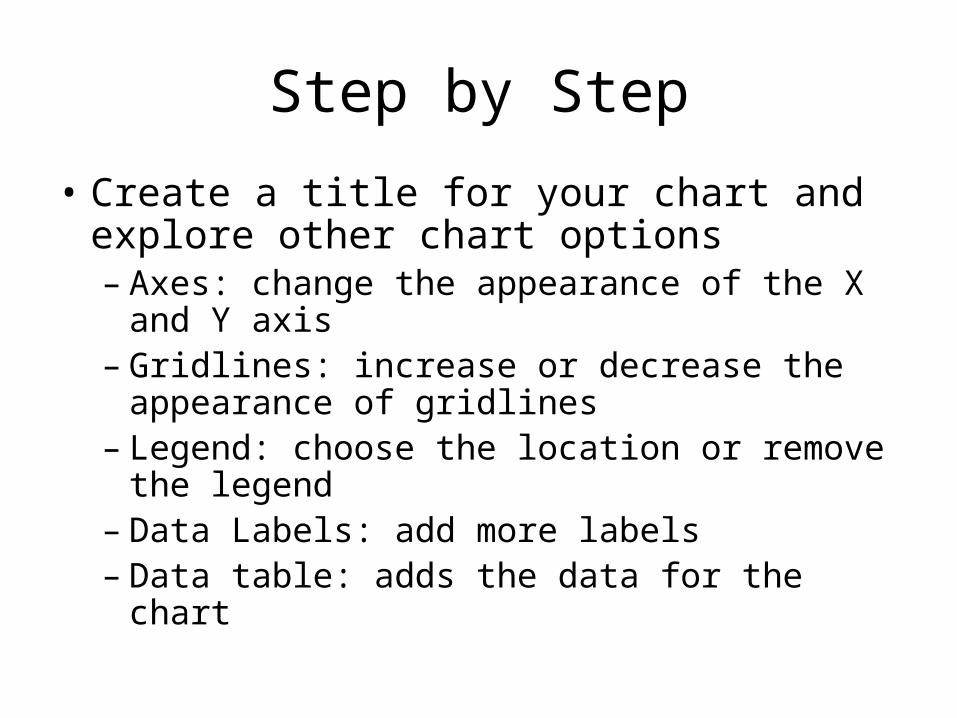
• Create a title for your chart and explore other chart options– Axes: change the appearance of the X and Y
axis– Gridlines: increase or decrease the
appearance of gridlines– Legend: choose the location or remove the
legend– Data Labels: add more labels– Data table: adds the data for the chart

Step by Step

Step by Step
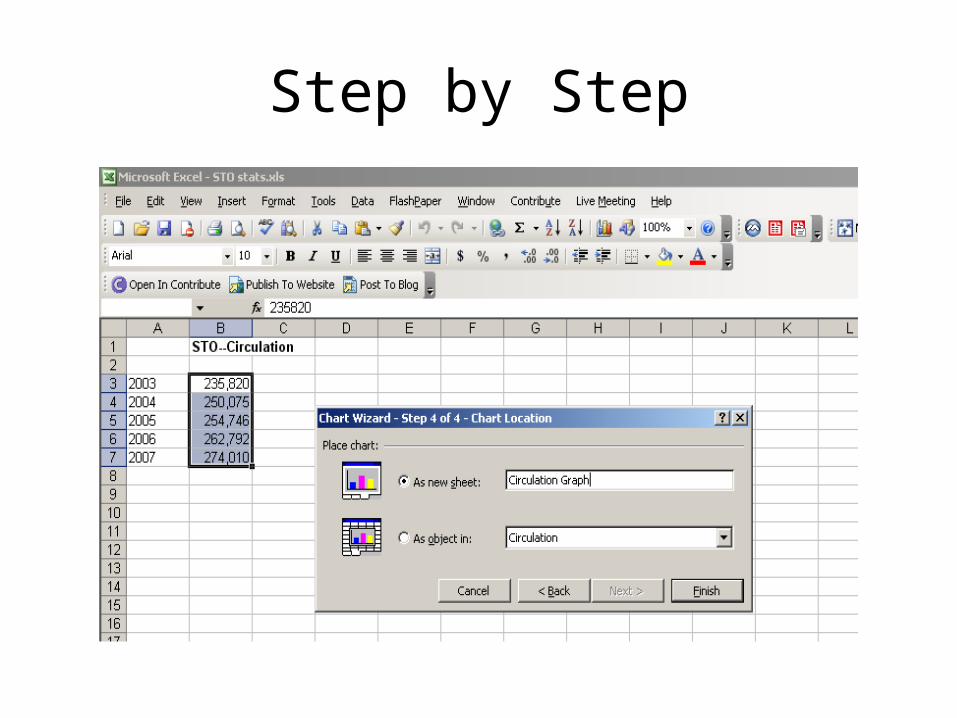
• Click on Next
• Select “As New Sheet” for your chart
• Give your chart a name
• Click on Finish
• Your graph or chart will appear on a separate worksheet within your spreadsheet
Step by Step

Step by Step

Step by Step

Want to know more?
• Ed2Go Courses– http://www.slis.wisc.edu/continueed/ed2go.html
• WebJunction Courses– www.webjunction.org
• Excel Help – right in the program• Books on Excel
– Some available through NetLibrary
• Microsoft Online Help– http://office.microsoft.com