Chapter Three Copyright 2009 Pearson Education, Inc. Publishing as Prentice Hall.
1
Chapter 3
Supply andDemand
Chapter Three Copyright 2009 Pearson Education, Inc. Publishing as Prentice Hall.
2
OverviewMarket demandMarket supplyMarket equilibriumComparative statics analysisshort-run analysis, long-runanalysisSupply, demand, and price
Chapter Three Copyright 2009 Pearson Education, Inc. Publishing as Prentice Hall.
3
Learning objectives
define supply, demand, and equilibrium price
identify non-price determinants of supply and demand
distinguish between short-run rationing function and long-run guiding function of price
Chapter Three Copyright 2009 Pearson Education, Inc. Publishing as Prentice Hall.
4
Learning objectives
illustrate how supply and demand can be used to improve management decisions
use supply and demand diagrams to determine price in the short and long run
Chapter Three Copyright 2009 Pearson Education, Inc. Publishing as Prentice Hall.
5
Market demand Demand for a good or service is defined as quantities that people are ready (willing and able) to buy at various prices within some given time period
Other factors besides price are held constant
Chapter Three Copyright 2009 Pearson Education, Inc. Publishing as Prentice Hall.
6
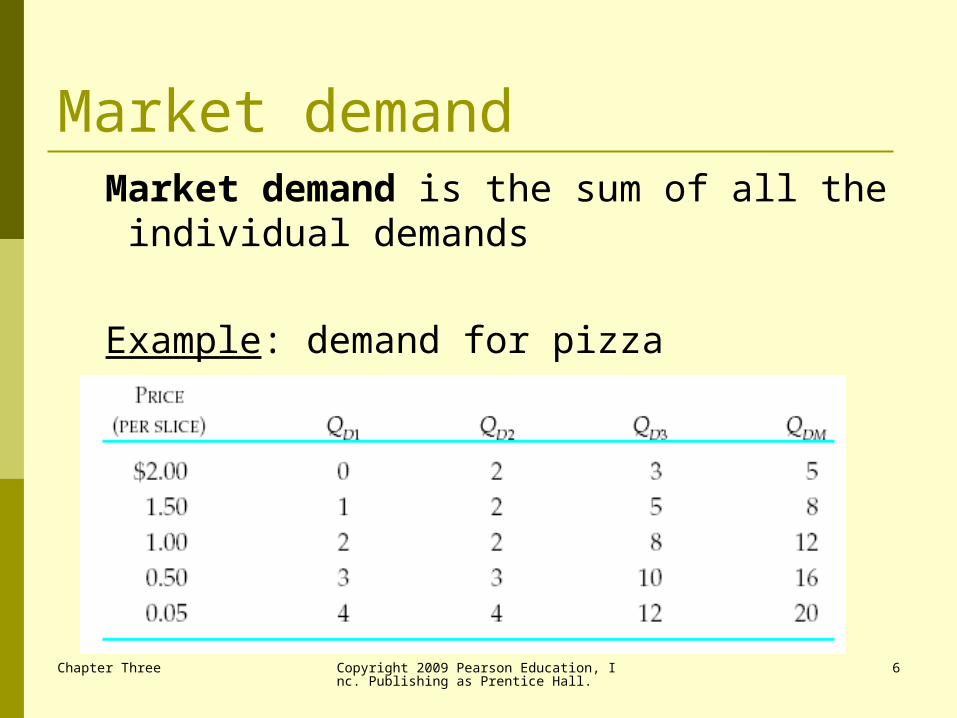
Market demandMarket demand is the sum of all the individual demands
Example: demand for pizza
Chapter Three Copyright 2009 Pearson Education, Inc. Publishing as Prentice Hall.
7
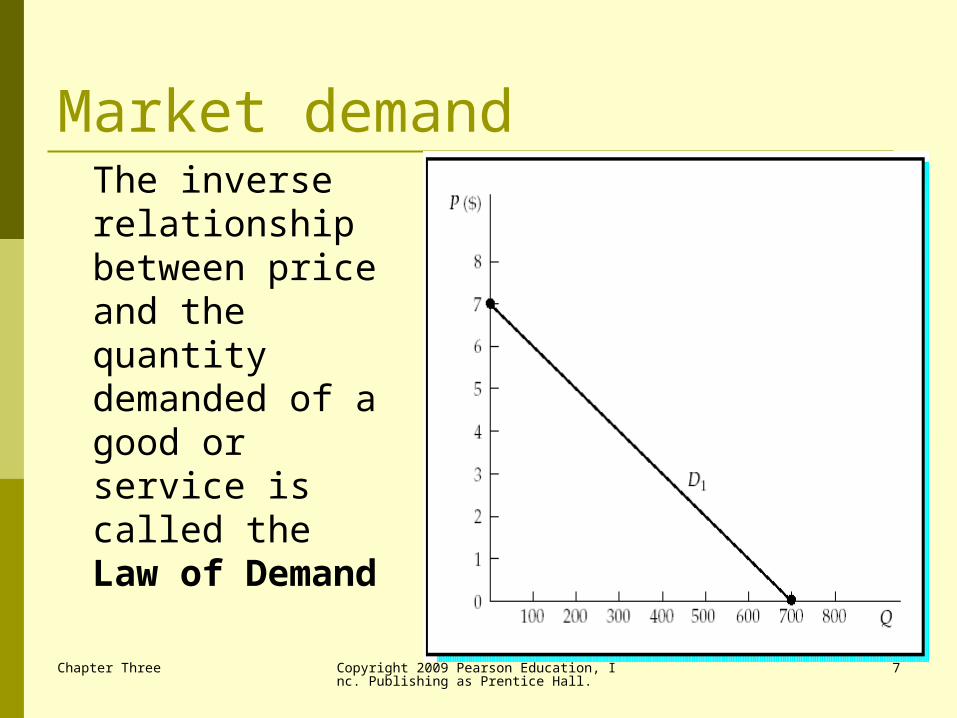
Market demandThe inverse relationship between price and the quantity demanded of a good or service is called the Law of Demand
Chapter Three Copyright 2009 Pearson Education, Inc. Publishing as Prentice Hall.
8
Market demand Changes in price result in changes in the
quantity demanded This is shown as movement along the
demand curve
Changes in non-price factors result in changes in demand This is shown as a shift in the demand
curve
Chapter Three Copyright 2009 Pearson Education, Inc. Publishing as Prentice Hall.
9
Market demand Nonprice determinants of demand
tastes and preferences income prices of related products future expectations number of buyers
Chapter Three Copyright 2009 Pearson Education, Inc. Publishing as Prentice Hall.
10
Market supply
The supply of a good or service is defined as quantities that people are ready to sell at various prices within some given time period
Other factors besides price held constant
Chapter Three Copyright 2009 Pearson Education, Inc. Publishing as Prentice Hall.
11
Market supply Changes in price result in changes in the
quantity supplied shown as movement along the supply
curve
Changes in non-price determinants result in changes in supply
shown as a shift in the supply curve
Chapter Three Copyright 2009 Pearson Education, Inc. Publishing as Prentice Hall.
12
Market supply Nonprice determinants of supply
costs and technology prices of other goods or services offered
by the seller future expectations number of sellers weather conditions
Chapter Three Copyright 2009 Pearson Education, Inc. Publishing as Prentice Hall.
13
Market equilibrium
Equilibrium price: the price that equates the quantity demanded with the quantity supplied
Equilibrium quantity: the amount that people are willing to buy and sellers are willing to offer at the equilibrium price level
Chapter Three Copyright 2009 Pearson Education, Inc. Publishing as Prentice Hall.
14
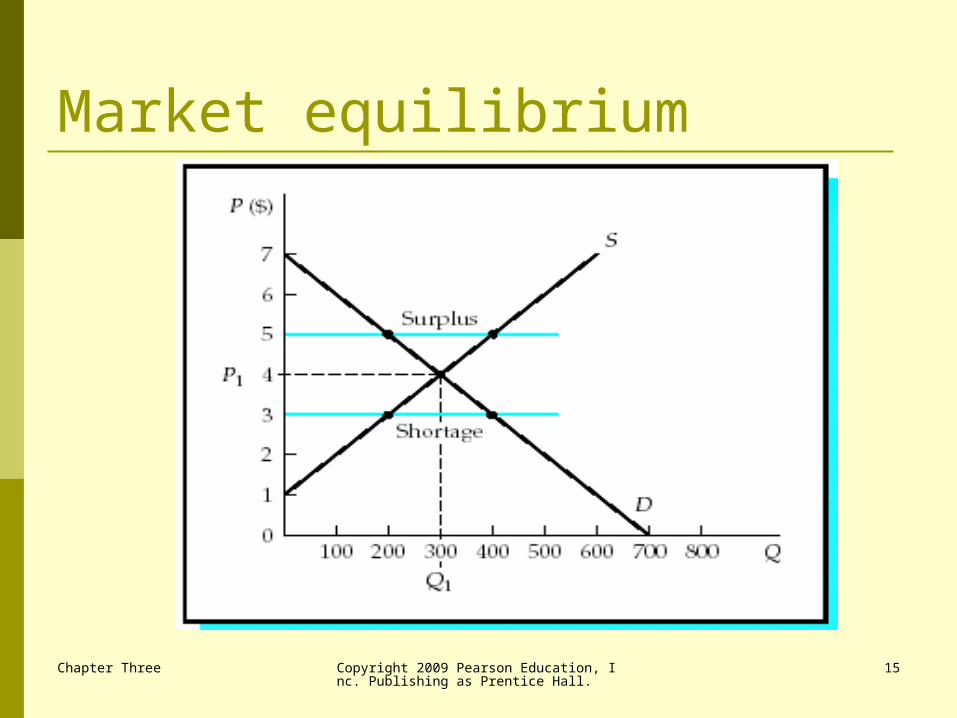
Market equilibrium Shortage: a market situation in which the
quantity demanded exceeds the quantity supplied shortage occurs at a price below the
equilibrium level
Surplus: a market situation in which the quantity supplied exceeds the quantity demanded surplus occurs at a price above the
equilibrium level
Chapter Three Copyright 2009 Pearson Education, Inc. Publishing as Prentice Hall.
15
Market equilibrium
Chapter Three Copyright 2009 Pearson Education, Inc. Publishing as Prentice Hall.
16
Comparative statics analysis
Comparative statics is a form of sensitivity (or what-if) analysis
Commonly used method in economic
analysis
Chapter Three Copyright 2009 Pearson Education, Inc. Publishing as Prentice Hall.
17
Comparative statics analysis Process of comparative statics analysis:
state all the assumptions needed to construct the model
begin by assuming that the model is in equilibrium
introduce a change in the model, so a condition of disequilibrium is created
find the new point of equilibrium compare the new equilibrium point with
the original one
Chapter Three Copyright 2009 Pearson Education, Inc. Publishing as Prentice Hall.
18
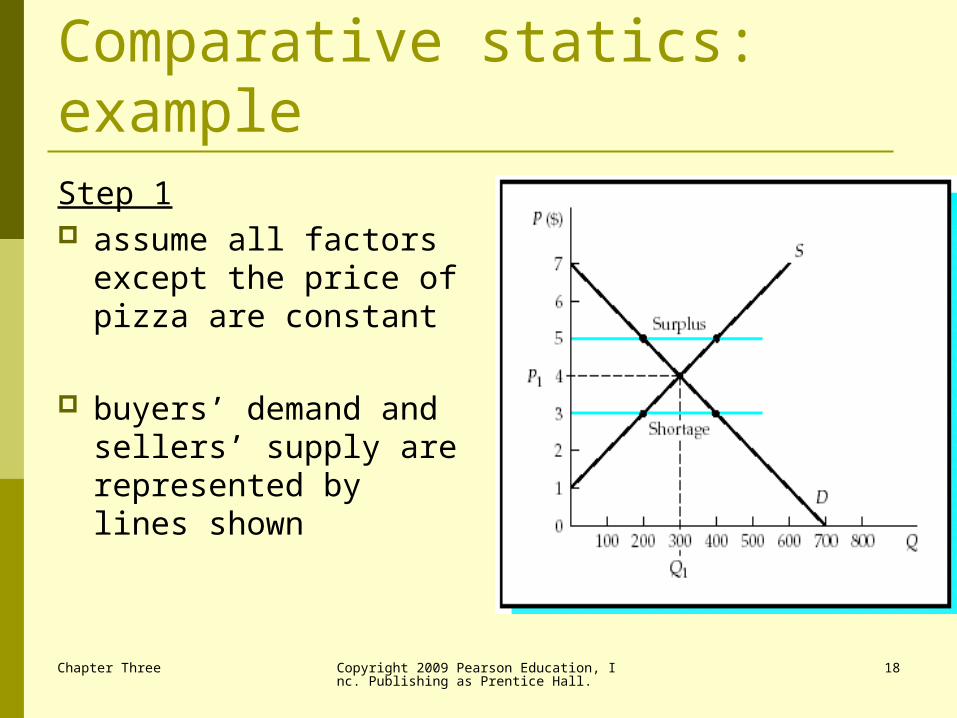
Comparative statics: exampleStep 1 assume all factors
except the price of pizza are constant
buyers’ demand and sellers’ supply are represented by lines shown
Chapter Three Copyright 2009 Pearson Education, Inc. Publishing as Prentice Hall.
19
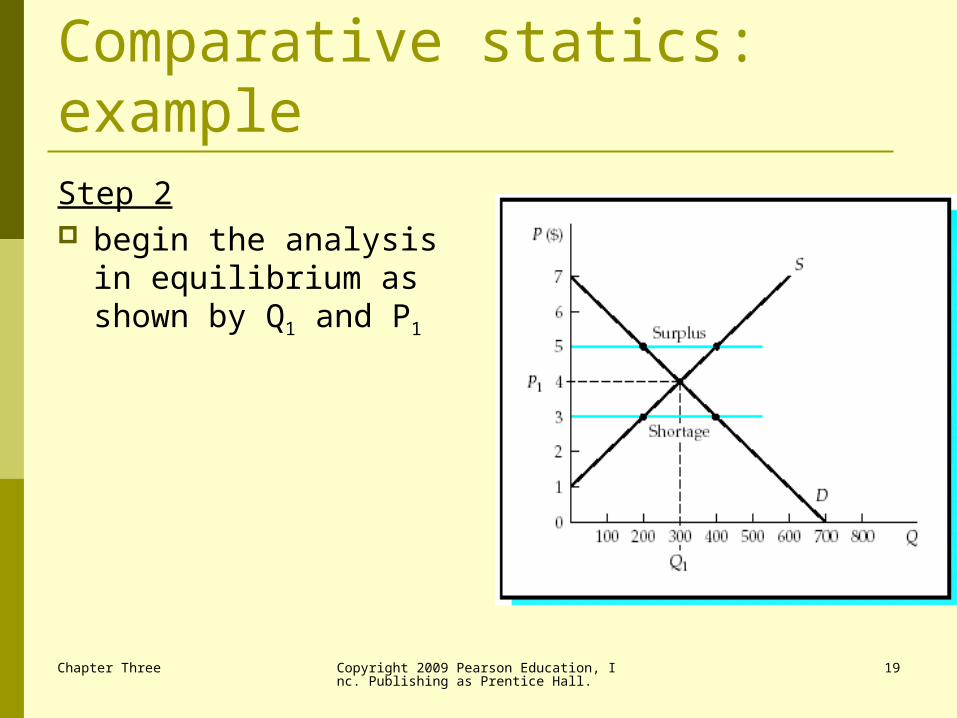
Comparative statics: exampleStep 2 begin the analysis in
equilibrium as shown by Q1 and P1
Chapter Three Copyright 2009 Pearson Education, Inc. Publishing as Prentice Hall.
20
Comparative statics: example
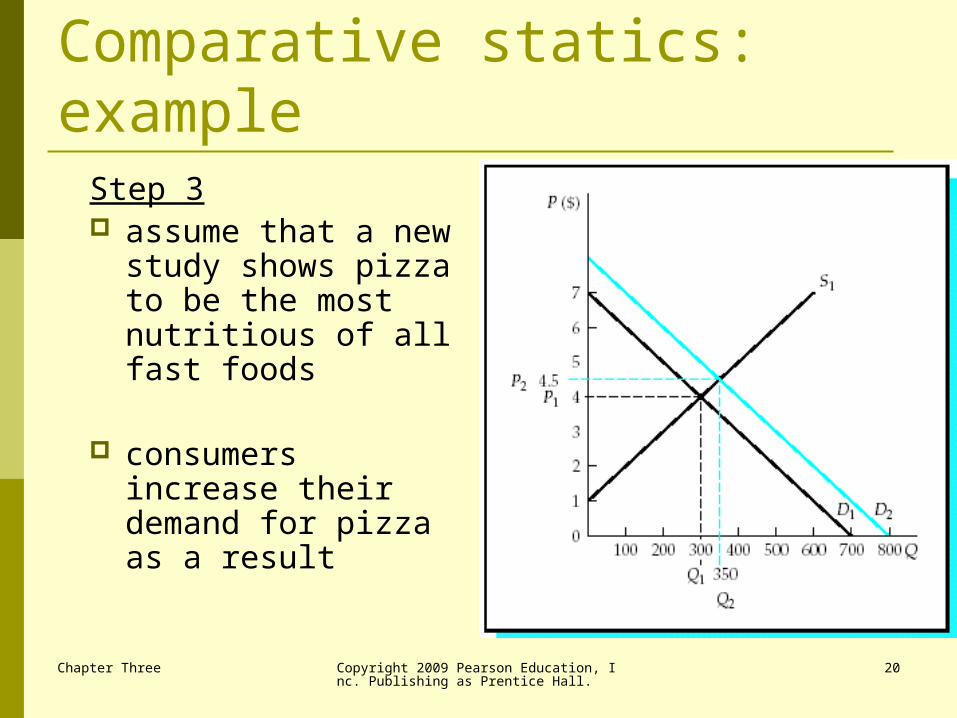
Step 3 assume that a new
study shows pizza to be the most nutritious of all fast foods
consumers increase their demand for pizza as a result
Chapter Three Copyright 2009 Pearson Education, Inc. Publishing as Prentice Hall.
21
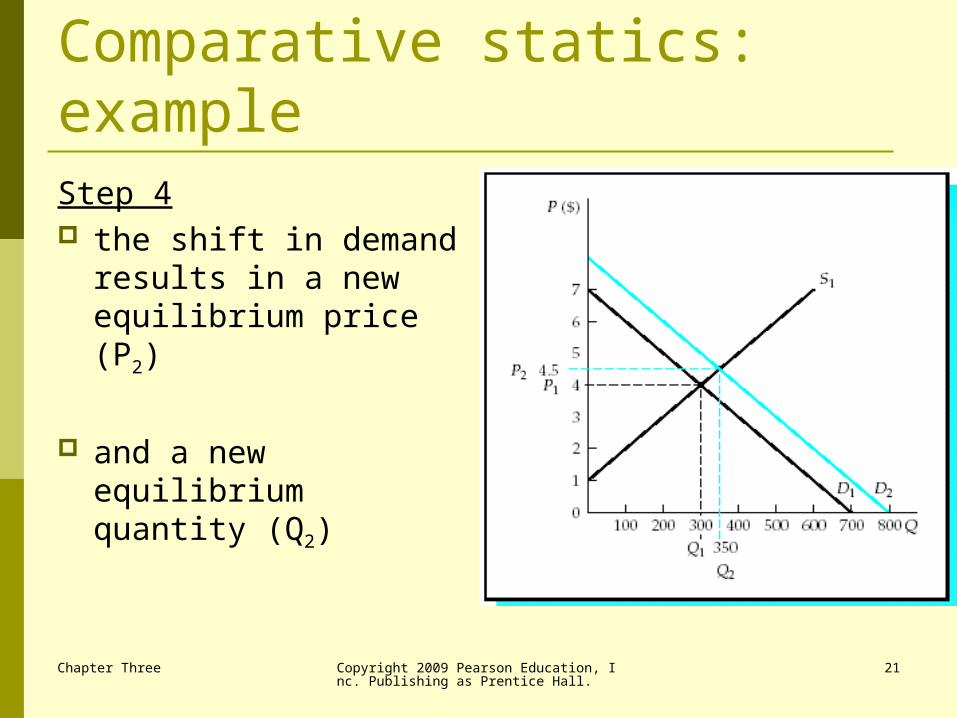
Comparative statics: exampleStep 4 the shift in demand
results in a new equilibrium price (P2)
and a new equilibrium quantity (Q2)
Chapter Three Copyright 2009 Pearson Education, Inc. Publishing as Prentice Hall.
22
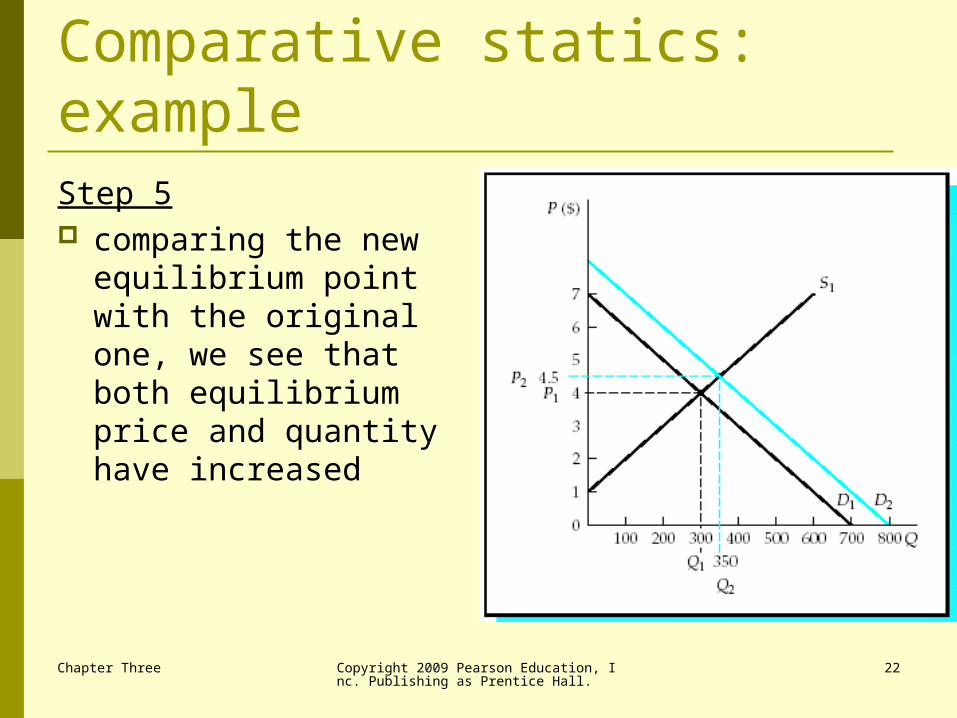
Comparative statics: exampleStep 5 comparing the new
equilibrium point with the original one, we see that both equilibrium price and quantity have increased
Chapter Three Copyright 2009 Pearson Education, Inc. Publishing as Prentice Hall.
23
Comparative statics analysis
The short run is the period of time in which:
sellers already in the market respond to a change in equilibrium price by adjusting variable inputs
buyers already in the market respond to changes in equilibrium price by adjusting the quantity demanded for the good or service
Chapter Three Copyright 2009 Pearson Education, Inc. Publishing as Prentice Hall.
24
Comparative statics analysis Short run changes show the rationing
function of price
The rationing function of price is the change in market price to eliminate the imbalance between quantities supplied and demanded is the change in market price to eliminate the imbalance between quantities supplied and demanded
Chapter Three Copyright 2009 Pearson Education, Inc. Publishing as Prentice Hall.
25
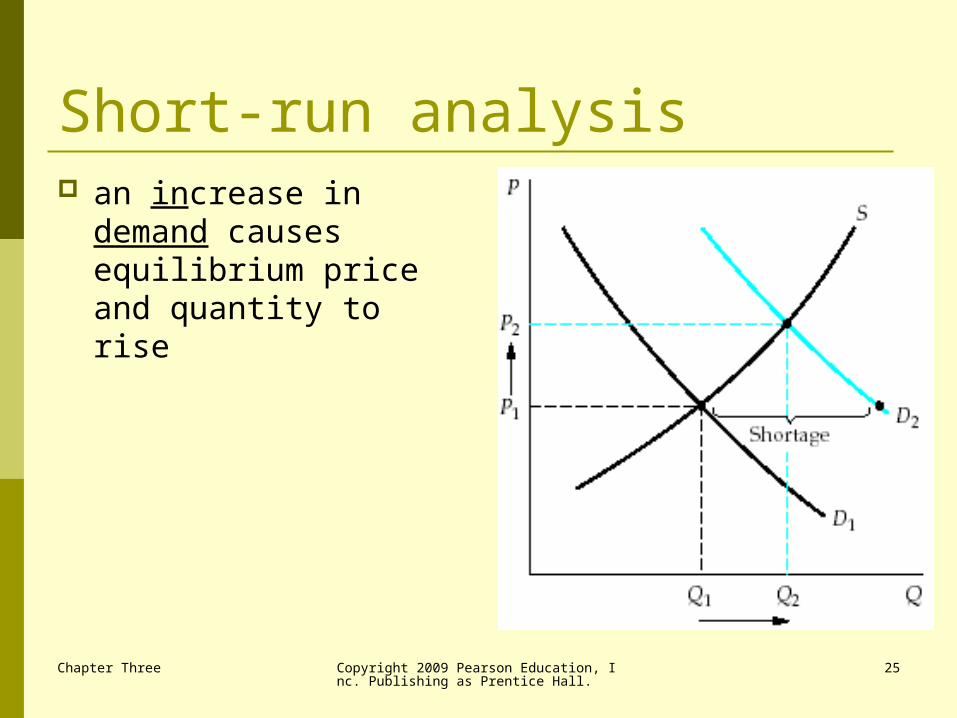
Short-run analysis an increase in demand
causes equilibrium price and quantity to rise
Chapter Three Copyright 2009 Pearson Education, Inc. Publishing as Prentice Hall.
26
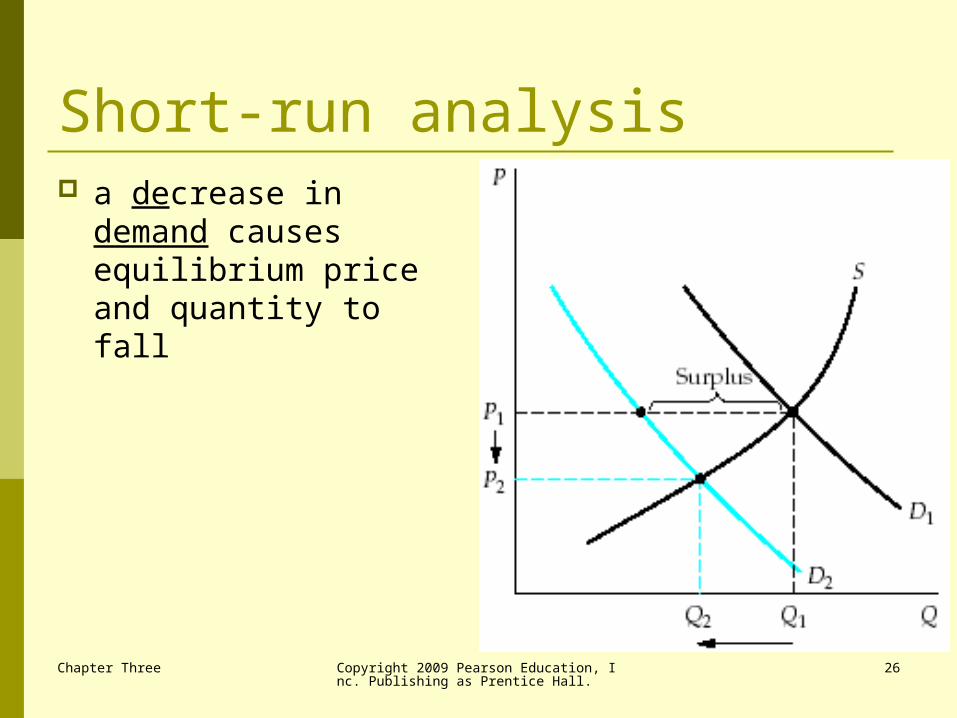
Short-run analysis a decrease in demand
causes equilibrium price and quantity to fall
Chapter Three Copyright 2009 Pearson Education, Inc. Publishing as Prentice Hall.
27
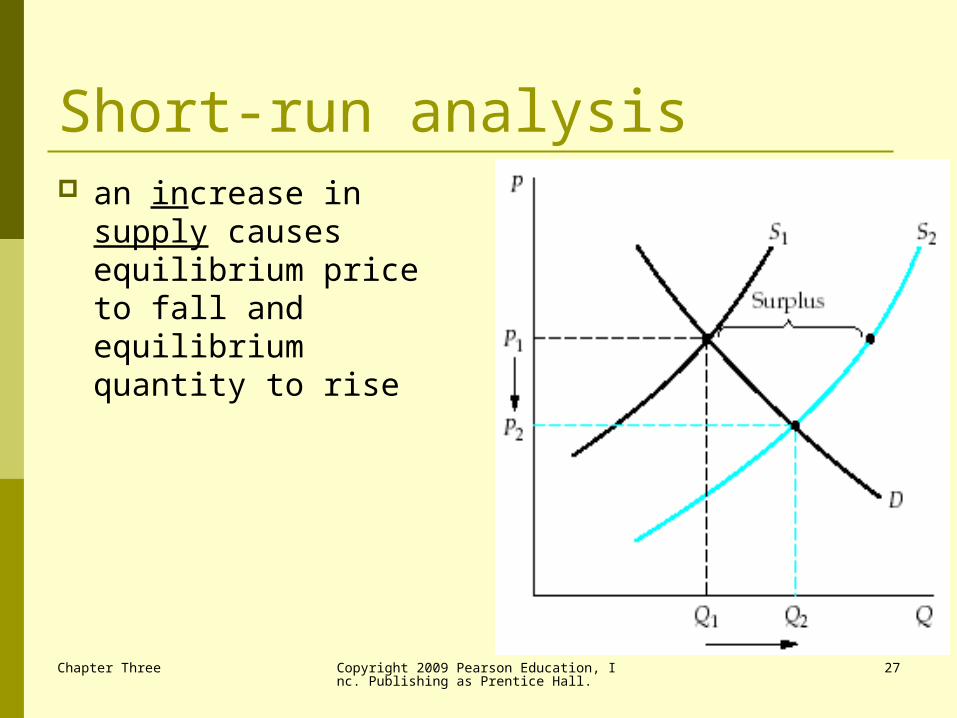
Short-run analysis an increase in supply
causes equilibrium price to fall and equilibrium quantity to rise
Chapter Three Copyright 2009 Pearson Education, Inc. Publishing as Prentice Hall.
28
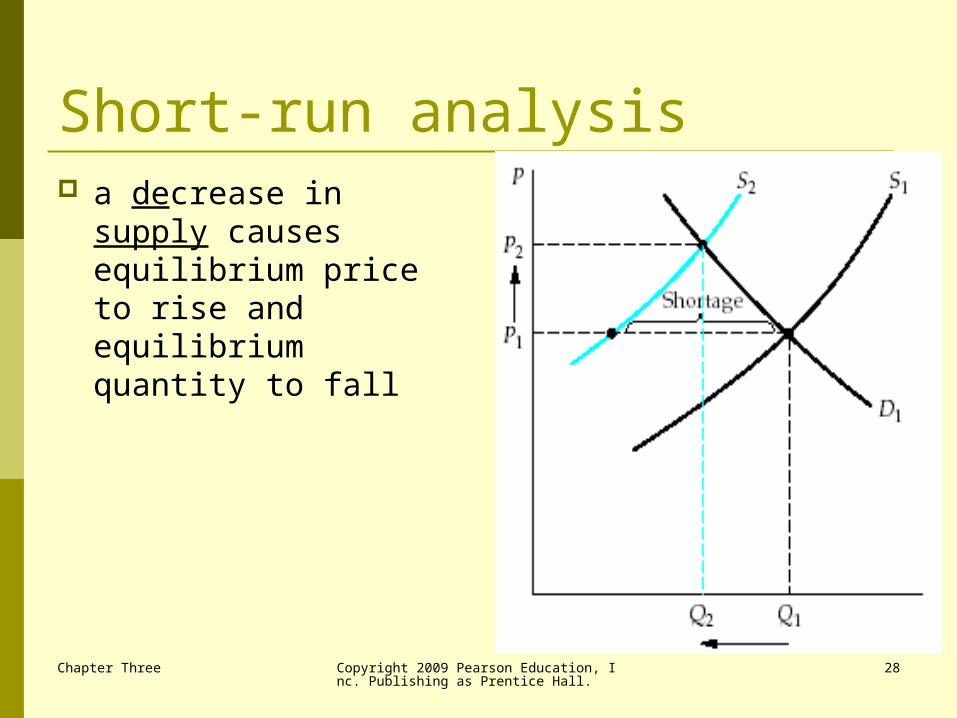
Short-run analysis a decrease in supply
causes equilibrium price to rise and equilibrium quantity to fall
Chapter Three Copyright 2009 Pearson Education, Inc. Publishing as Prentice Hall.
29
Long run analysis The long run is the period of time in
which: new sellers may enter a market existing sellers may exit from a market existing sellers may adjust fixed factors
of production buyers may react to a change in
equilibrium price by changing their tastes and preferences
Chapter Three Copyright 2009 Pearson Education, Inc. Publishing as Prentice Hall.
30
Long run analysis Long run changes show the allocating
function of price
The guiding or allocating function of price is the movement of resources into or out of markets in response to a change in the equilibrium price
Chapter Three Copyright 2009 Pearson Education, Inc. Publishing as Prentice Hall.
31
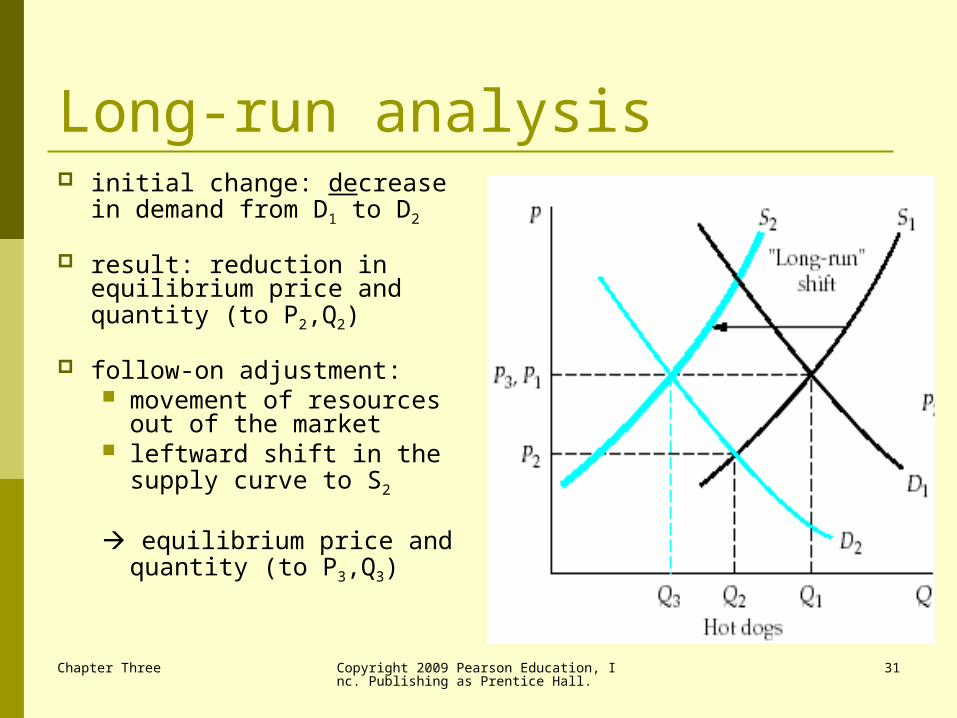
Long-run analysis initial change: decrease in
demand from D1 to D2
result: reduction in equilibrium price and quantity (to P2,Q2)
follow-on adjustment: movement of resources
out of the market leftward shift in the
supply curve to S2
equilibrium price and quantity (to P3,Q3)
Chapter Three Copyright 2009 Pearson Education, Inc. Publishing as Prentice Hall.
32
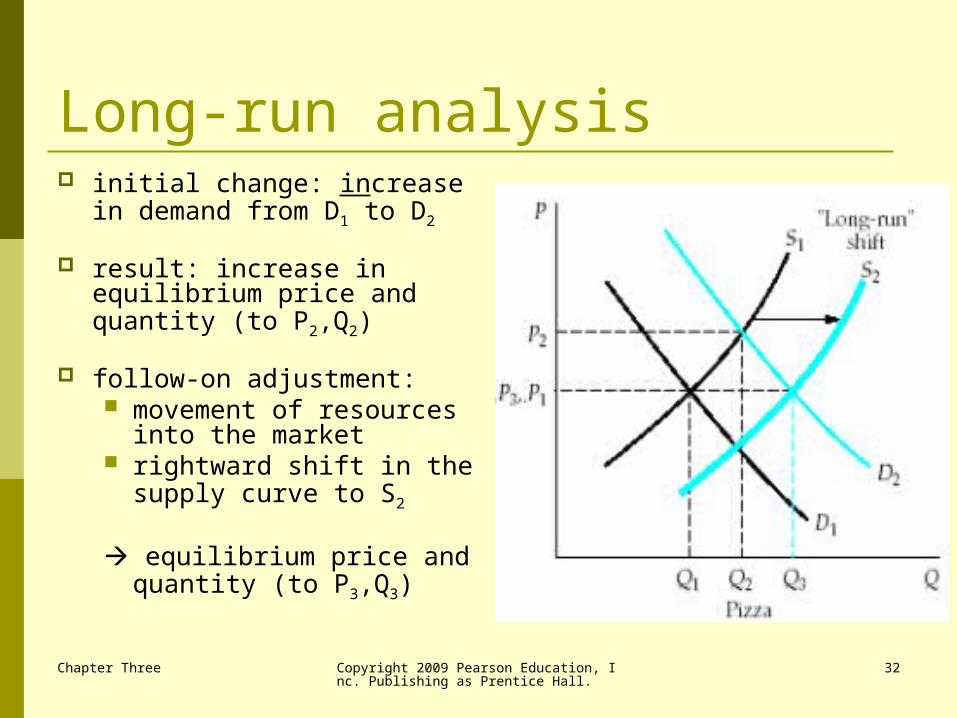
Long-run analysis initial change: increase in
demand from D1 to D2
result: increase in equilibrium price and quantity (to P2,Q2)
follow-on adjustment: movement of resources
into the market rightward shift in the
supply curve to S2
equilibrium price and quantity (to P3,Q3)
Chapter Three Copyright 2009 Pearson Education, Inc. Publishing as Prentice Hall.
33
Supply, demand, and price:the managerial challenge in the extreme case, the forces of supply
and demand are the sole determinants of the market price, not any single firm this type of market is ‘perfect
competition’
in many cases, individual firms can exert market power over price because of their: dominant size ability to differentiate their product
through advertising, brand name, features, or services
Chapter Three Copyright 2009 Pearson Education, Inc. Publishing as Prentice Hall.
34
Supply, demand, and price:the managerial challenge
Example: coffee
‘buy low, sell high’ 2000: overproduction led to price
falls 2004: prices moved up again Starbucks effects
Chapter Three Copyright 2009 Pearson Education, Inc. Publishing as Prentice Hall.
35
Supply, demand, and price:the managerial challenge Example: air travel
‘buy high, sell low’ industry deregulated in late 1970s tight competition post 9/11, a low-cost structure is
needed
Chapter Three Copyright 2009 Pearson Education, Inc. Publishing as Prentice Hall.
36
Global application Example: the market for cobalt
rare metal produced as a by-product strategic item prices rising