96
CHAPTER 6
SUSTAINABILITY OF MILK SUPPLY CHAIN AND
PERFORMANCE EVALUATION OF SELECTED
SAMPLE SOCIETIES
6. 1 INTRODUCTION
In this chapter sustainability of milk supply chain and network of
routes are reconstructed to transport maximum capacity with shortest distance
than existing. Sustainability of milk supply chain analyzed based on the
certain indicators and by using flow base algorithm with the basic logic of
Transshipment Method five sample milk routes from hill terrain and milk
routes from normal surface terrain were taken for constructing shortest routes
with maximum capacity transportation. This chapter is divided into two
sections. The first section discusses about the sustainability and the second
section covers SWOT analysis used to study the factors affecting the milk
transportation, vehicles used for transporting milk, factors affecting
transportation of milk, number of milk routes, number of nodes and the
maximum capacity transportation with shortest route through Network
diagram along with distance covered in kilometers.
6.2 SUSTAINABILITY OF AAVIN MILK SUPPLY CHAIN
Individual consumers are demanding higher quality goods in
greater variety, delivered with short lead times at a reasonable cost. These
changes in customer characteristics, combined with the external challenges of
97
constrained energy and natural resources pose an emerging set of challenges
to the modern supply chain.
6.2.1 Supply Chain Outputs
Some supply chain output traditionally classified as waste, will be
newly-classified as residuals. Formally this type of process would tend to
close the loop between supply chain output and inputs, ultimately moving
from type 1 systems to type 2 and type 3 systems as shown in the figure.
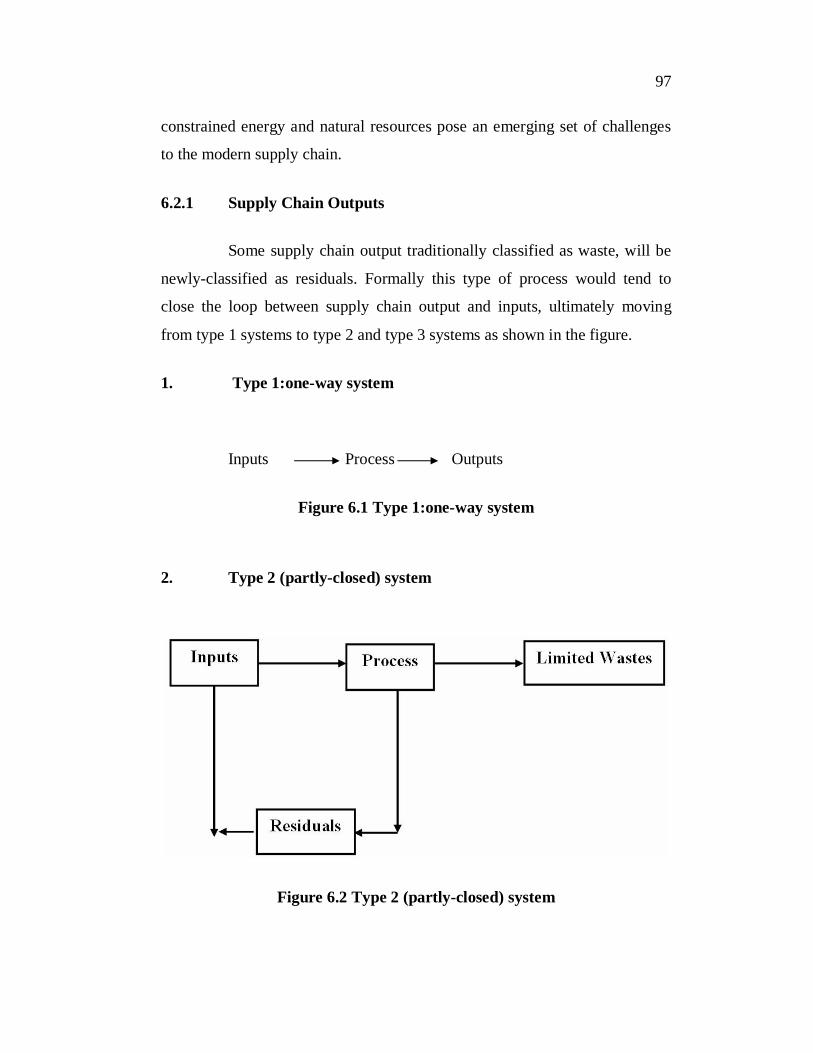
1. Type 1:one-way system
Inputs Process Outputs
Figure 6.1 Type 1:one-way system
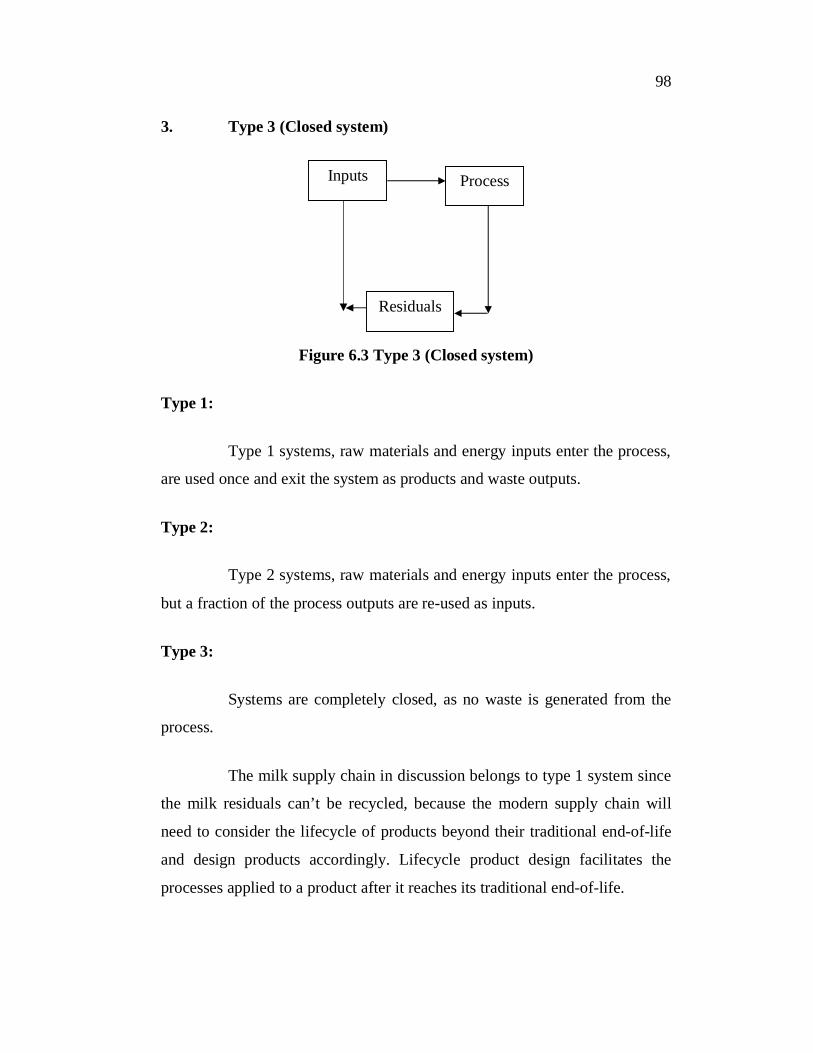
2. Type 2 (partly-closed) system
Figure 6.2 Type 2 (partly-closed) system
98
Inputs Process
Residuals
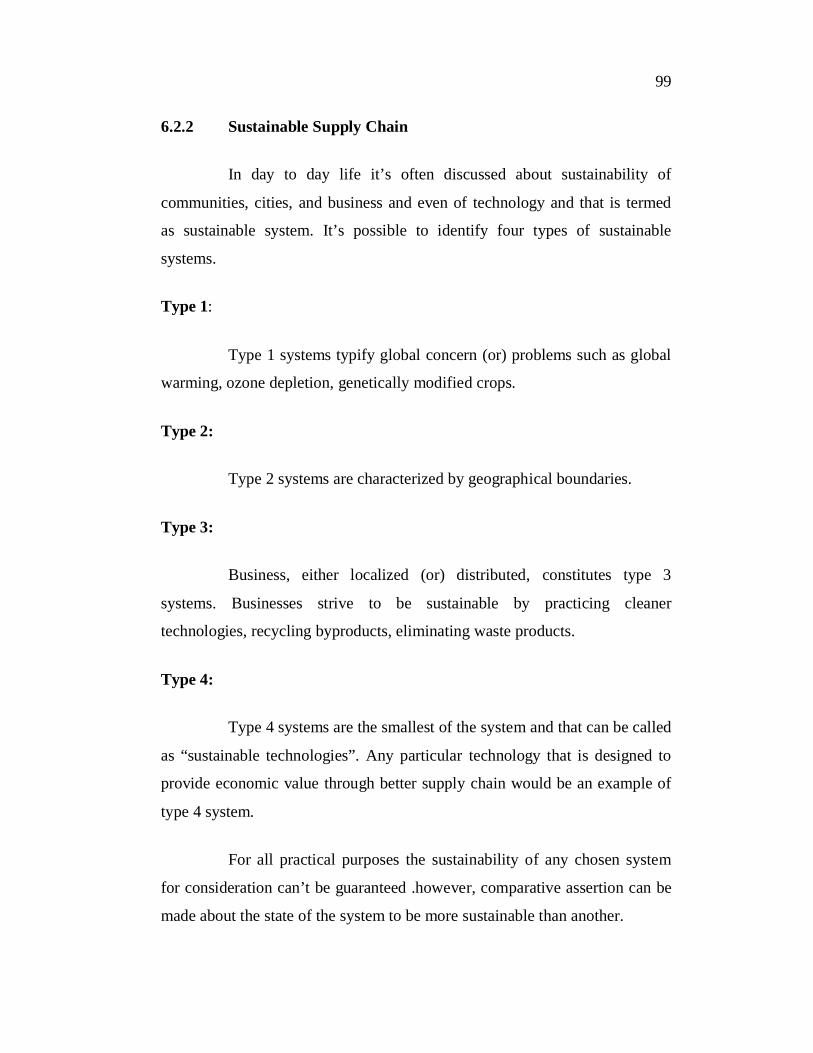
3. Type 3 (Closed system)
Figure 6.3 Type 3 (Closed system)
Type 1:
Type 1 systems, raw materials and energy inputs enter the process,
are used once and exit the system as products and waste outputs.
Type 2:
Type 2 systems, raw materials and energy inputs enter the process,
but a fraction of the process outputs are re-used as inputs.
Type 3:
Systems are completely closed, as no waste is generated from the
process.
The milk supply chain in discussion belongs to type 1 system since
the milk residuals can’t be recycled, because the modern supply chain will
need to consider the lifecycle of products beyond their traditional end-of-life
and design products accordingly. Lifecycle product design facilitates the
processes applied to a product after it reaches its traditional end-of-life.
99
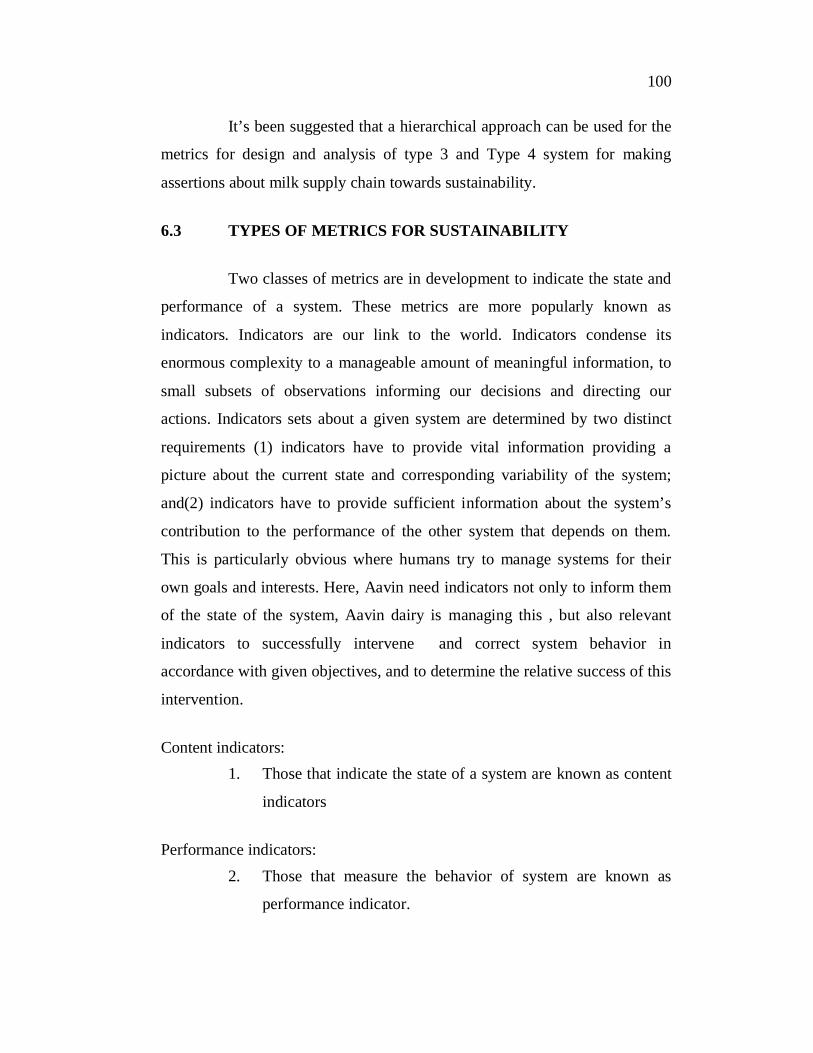
6.2.2 Sustainable Supply Chain
In day to day life it’s often discussed about sustainability of
communities, cities, and business and even of technology and that is termed
as sustainable system. It’s possible to identify four types of sustainable
systems.
Type 1:
Type 1 systems typify global concern (or) problems such as global
warming, ozone depletion, genetically modified crops.
Type 2:
Type 2 systems are characterized by geographical boundaries.
Type 3:
Business, either localized (or) distributed, constitutes type 3
systems. Businesses strive to be sustainable by practicing cleaner
technologies, recycling byproducts, eliminating waste products.
Type 4:
Type 4 systems are the smallest of the system and that can be called
as “sustainable technologies”. Any particular technology that is designed to
provide economic value through better supply chain would be an example of
type 4 system.
For all practical purposes the sustainability of any chosen system
for consideration can’t be guaranteed .however, comparative assertion can be
made about the state of the system to be more sustainable than another.
100
It’s been suggested that a hierarchical approach can be used for the
metrics for design and analysis of type 3 and Type 4 system for making
assertions about milk supply chain towards sustainability.
6.3 TYPES OF METRICS FOR SUSTAINABILITY
Two classes of metrics are in development to indicate the state and
performance of a system. These metrics are more popularly known as
indicators. Indicators are our link to the world. Indicators condense its
enormous complexity to a manageable amount of meaningful information, to
small subsets of observations informing our decisions and directing our
actions. Indicators sets about a given system are determined by two distinct
requirements (1) indicators have to provide vital information providing a
picture about the current state and corresponding variability of the system;
and(2) indicators have to provide sufficient information about the system’s
contribution to the performance of the other system that depends on them.
This is particularly obvious where humans try to manage systems for their
own goals and interests. Here, Aavin need indicators not only to inform them
of the state of the system, Aavin dairy is managing this , but also relevant
indicators to successfully intervene and correct system behavior in
accordance with given objectives, and to determine the relative success of this
intervention.
Content indicators:1. Those that indicate the state of a system are known as content
indicators
Performance indicators:2. Those that measure the behavior of system are known as
performance indicator.
101
6.3.1 Content Indicators
The major reason for the search for indicators is the wish to receive
timely warning of changes that are developing in the system to allow prompt
control and counteraction, if that should be necessary. Aavin in itself implies
continuing but unpredictable changes - sometimes slow, sometimes fast. The
rate of change provides the most important information about changes in a
system. At Aavin the structure is overwhelmingly determined by the internal
structure and processes of the system and can be hardly influenced from the
outside. The structure determines the pace of this slow and fast change within
the system and it is directly related to system viability. The process of
learning and adoption are slower than the pace of environmental changes then
its adaptability is inadequate for ensuring long term viability, i.e.,
sustainability.
The fact that system states can only change gradually that means in
real systems the response to even a strong interaction will always be delayed.
For Aavin sustainability, reactive control may come too late; proactive control
is often needed. It may not be enough to wait until a crucial variable actually
changes (feedback control), but it may be necessary to anticipate that change
before it happens (feed forward control). Aavin requires a dynamic model that
can reliably predict what is going to happen next. In the view of the dynamics
of the real systems, it is essential to focus on indicators that provide early
warning of impending threats, leaving enough time for adequate response. For
assessing sustainable development, Aavin need to be concerned with the
viability of the different essential systems and their contribution to the
viability of the system.
In particular, Aavin has to determine whether the viability of the
different systems is improving or deteriorating. To stay viable and
sustainable, there must be enough time (respite time) for an effective
102
response. The time Aavin takes to get an effective response underway (also
called walk-away time) must be less than the respite time. Coping
successfully with these possibilities, calls for early and accurate signals i.e.,
proper indicators of the rate of threats especially, when Aavin hike the prices
of milk, consumers are not left with sufficient time to decide on their loyalty
towards Aavin.
6.3.2 Performance Indicator
Performance indicator is all about measuring the behavior of the
system. To assess the viability of a system requires that an essential minimum
satisfaction of each of the factors associated with the content indicator must
be assured. The reason behind this is, the system produce their own intrinsic
dynamics with characteristic time scale. Aavin systems are complex, adaptive,
and self-organizing, changing their structure and behavior in the course of
time. In the beginning of the chapter it’s discussed that Aavin has a one-way
system under supply chain outputs and it belongs to type 3 and Type 4 of
sustainable systems which is capable of creating the business in a self-
organized manner. At Aavin, the processes of self-organization that
continuously changes the complex systems in the real world, often exhibit
their own cyclical dynamics. These development cycles have some relevance
for the selection of indicators, since the focus of attention will necessarily
shift during the cycle.
Four distinct stages of the development cycle can be identified
1. Renewal and growth
2. Conservation
3. Deterioration and creative destruction
4. Innovation and reorganization.
103
The cycle then repeats. This sequence can be observed in Aavin
which is expected to play a role in the sustainable development of the
organization and the stakeholders who are associated with Aavin. The
penetration of new technologies, the renewal of infrastructure and production
capital, changes in work and employment, changes in the age composition
with their implications for infrastructure and social and cultural changes all
drive this cycle. When the management of Aavin fails to see these changes in
the light of the external conditions, the sustainability of Aavin remains a big
question mark.
6.4 VEHICLES USED FOR TRANSPORTING MILKS
All the unions are not using same kind of vehicle for collecting
milk, Based on the routes and primary society’s milk capacity vehicles are
assigned. Vehicles are hired using tender method, generally the tender call are
given in the leading magazines and while giving tender all the information are
given related to milk routes viz distance, number of milk collection centre,
capacity of the vehicle need etc. After receiving sealed tender from transport
companies, tenders are opened in the presence of higher officials of the
union. The tender that quotes the least cost for per kilometer will be given the
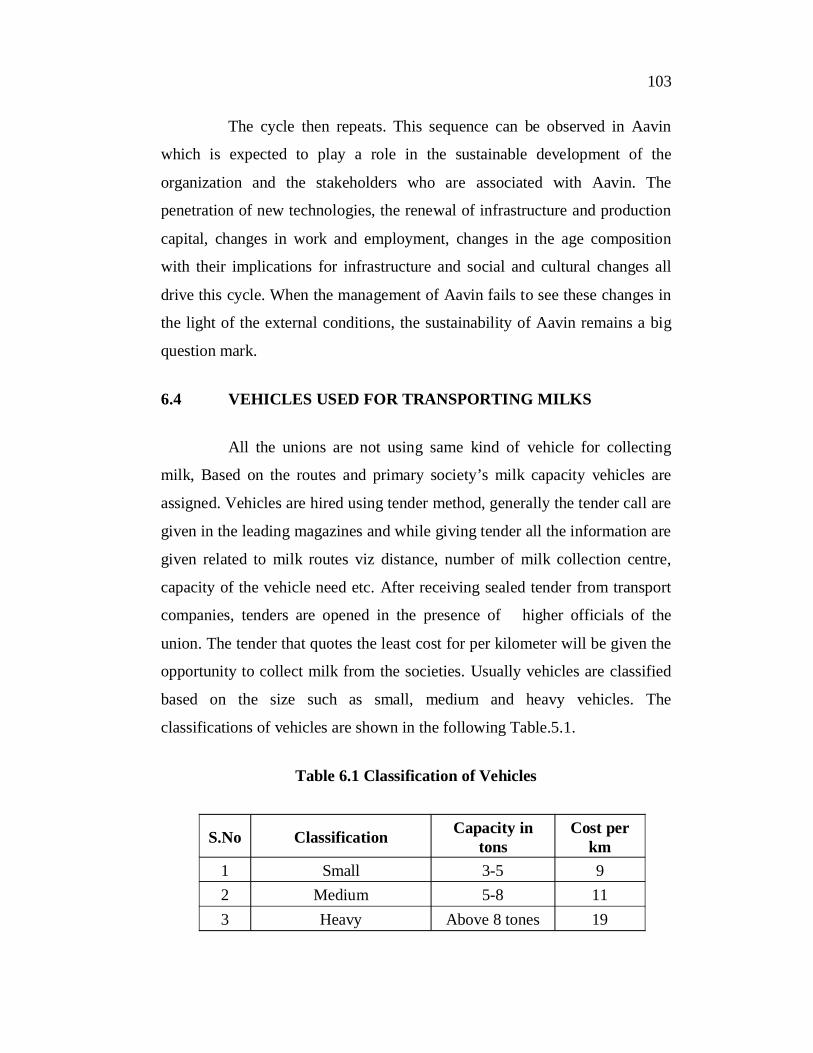
opportunity to collect milk from the societies. Usually vehicles are classified
based on the size such as small, medium and heavy vehicles. The
classifications of vehicles are shown in the following Table.5.1.
Table 6.1 Classification of Vehicles
S.No Classification Capacity intons
Cost perkm
1 Small 3-5 92 Medium 5-8 113 Heavy Above 8 tones 19
104
Table 6.1 shows the cost for hiring the vehicles based on its loading
capacity. Since milk is of perishable nature, vehicles are chosen, depending
on the distance. For transporting milk to metro cities air-conditioned vehicles
are used to supply on fresh condition. From the study it is found that the
maximum capacity of carrying milk is above eight tons with rupees fifteen per
kilometer.
6.5 FACTORS AFFECTING MILK TRANSPORTATION
The main factors affecting transportation of milk are natural
calamities viz, hot climate, heavy rain and sometimes the routes also may be
one of the major affecting factors. Since milk is perishable nature that has to
be protected till reaches the processing and chilling center.
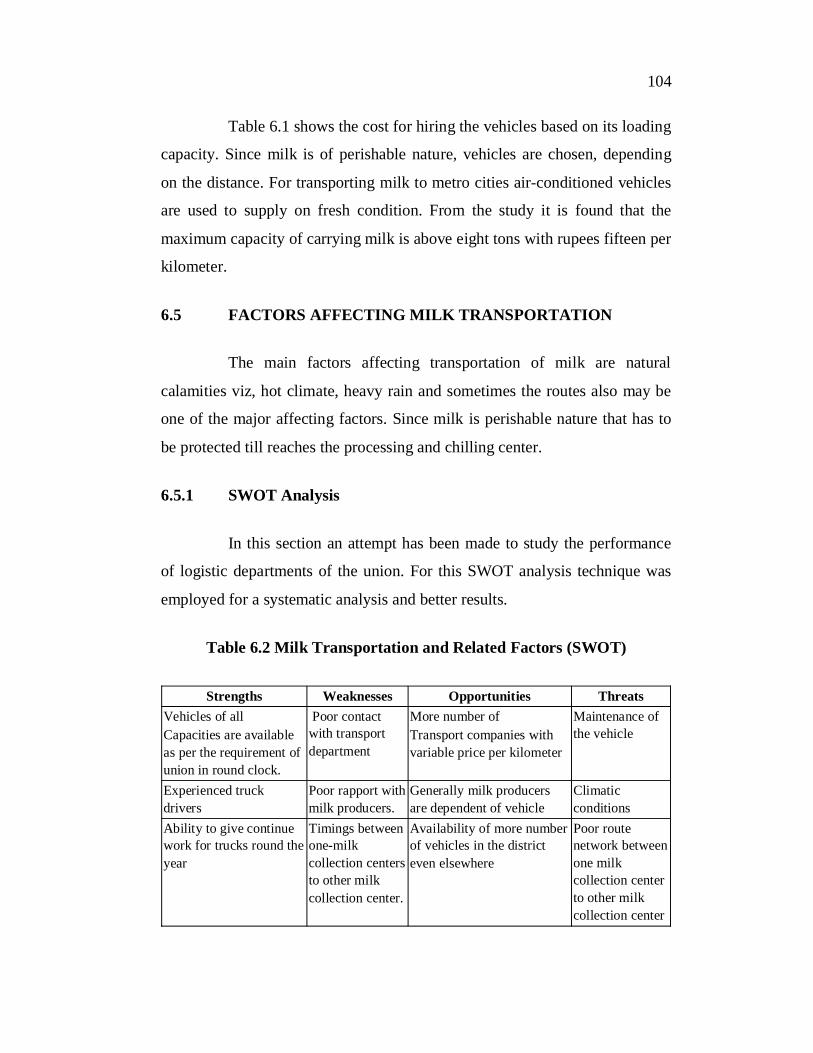
6.5.1 SWOT Analysis
In this section an attempt has been made to study the performance
of logistic departments of the union. For this SWOT analysis technique was
employed for a systematic analysis and better results.
Table 6.2 Milk Transportation and Related Factors (SWOT)
Strengths Weaknesses Opportunities ThreatsVehicles of allCapacities are availableas per the requirement ofunion in round clock.
Poor contactwith transportdepartment
More number ofTransport companies withvariable price per kilometer
Maintenance ofthe vehicle
Experienced truckdrivers
Poor rapport withmilk producers.
Generally milk producersare dependent of vehicle
Climaticconditions
Ability to give continuework for trucks round theyear
Timings betweenone-milkcollection centersto other milkcollection center.
Availability of more numberof vehicles in the districteven elsewhere
Poor routenetwork betweenone milkcollection centerto other milkcollection center
105
Table 6.2 reveals that the main weakness and threat of the
transporting milk from milk producers’ societies to processing centre are poor
knowledge about transport, poor rapport with milk producers and timings
between the milk collection centres. The threats are the maintenance of
vehicles by the transport companies, seasonality of milk production and poor
route network between the primary milk collection centres. Though many
strengths and opportunities like availability of all sort of vehicles, experienced
truck drivers, availability of milk production round the year, different price
level for hiring vehicles and availability of more number of vehicles
strengthen the union into right direction to achieve the goals, since
transportation acts as a hindrance to the development of the organization it
has to be concentrated more on the weak and threatening areas.
6.6. CONSTRUCTION OF SHORTEST ROUTE
For constructing the shortest routes flow based algorithm and basic
logic of transshipment methods are used. Because of maximum capacity with
shortest route construction it is not require covering the entire milk collection
center. Milk can be collected using separate low capacity vehicles from the
nodes that are left without collecting milk and transported to the nearest
neighboring node in the main stream. By doing this, it is possible to minimize
the transportation cost- instead of giving higher rent to heavy vehicles, it is
optimal to choose small vehicle with lower cost. In the following section, all
the information related to milk transportation namely existing route map,
name of the route, distance between each node and directions are shown for
all thirty sample routes.
106
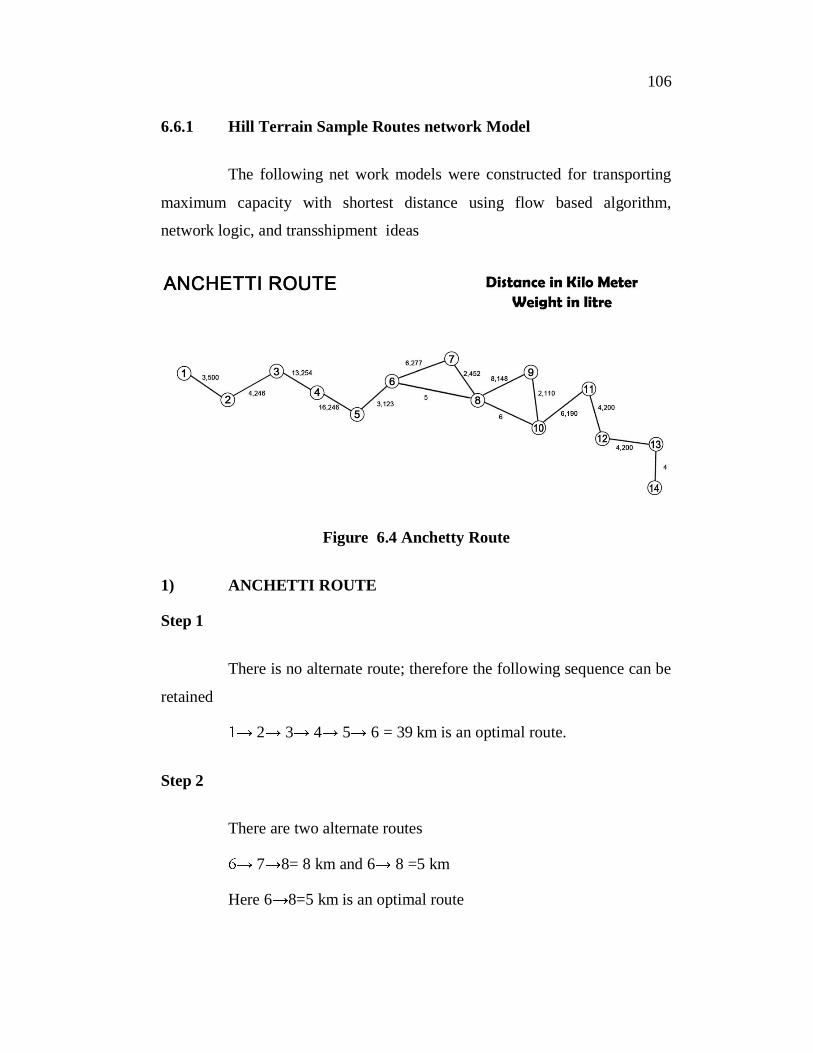
6.6.1 Hill Terrain Sample Routes network Model
The following net work models were constructed for transporting
maximum capacity with shortest distance using flow based algorithm,
network logic, and transshipment ideas
Figure 6.4 Anchetty Route
1) ANCHETTI ROUTE
Step 1
There is no alternate route; therefore the following sequence can be
retained
2 3 4 5 6 = 39 km is an optimal route.
Step 2
There are two alternate routes
7 8= 8 km and 6 8 =5 km
Here 6 8=5 km is an optimal route
107
Step 3
There are two alternate routes
9 10= 10 km and 8 10= 6 km
Here 8 10=6 km is an optimal route
Step 4
There is no alternate route and therefore the following sequence can
be retained 10 11 12 13 14= 12 km is an optimal sequence of route.
Step 5
The ultimate route from the starting node is following
2 3 4 5 6 8 10 11 12 13 14 = 68 km
Step 6
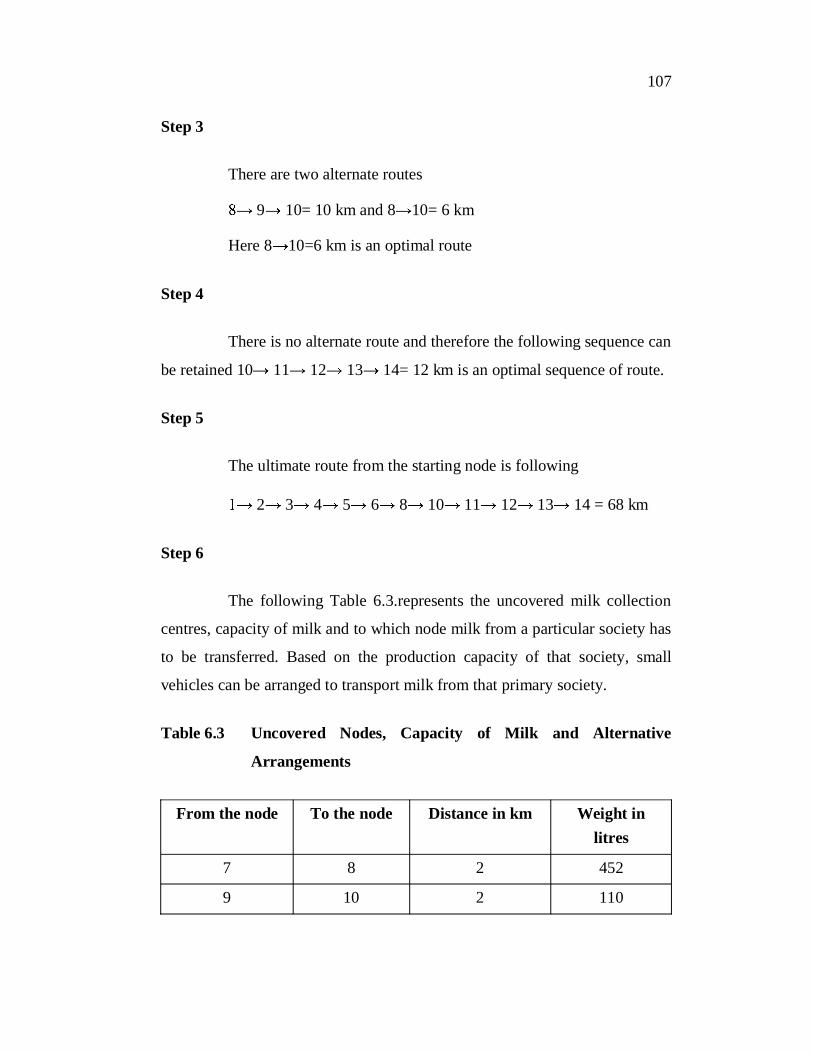
The following Table 6.3.represents the uncovered milk collection
centres, capacity of milk and to which node milk from a particular society has
to be transferred. Based on the production capacity of that society, small
vehicles can be arranged to transport milk from that primary society.
Table 6.3 Uncovered Nodes, Capacity of Milk and Alternative
Arrangements
From the node To the node Distance in km Weight inlitres
7 8 2 452
9 10 2 110
108
From the above Table 6.3, of Anchetti route, it can be understood
that a distance of 49 km is reduced when utilizing the alternative
arrangements to transport milk from the uncovered nodes. The calculations
are given below in detail:
For one trip
Actual distance = 121 km
Total distance as per network flow = 68 km
As per above arrangements = 4 km with 562 litres--------
Total 72 km--------
Distance saved through this model = 49 Km
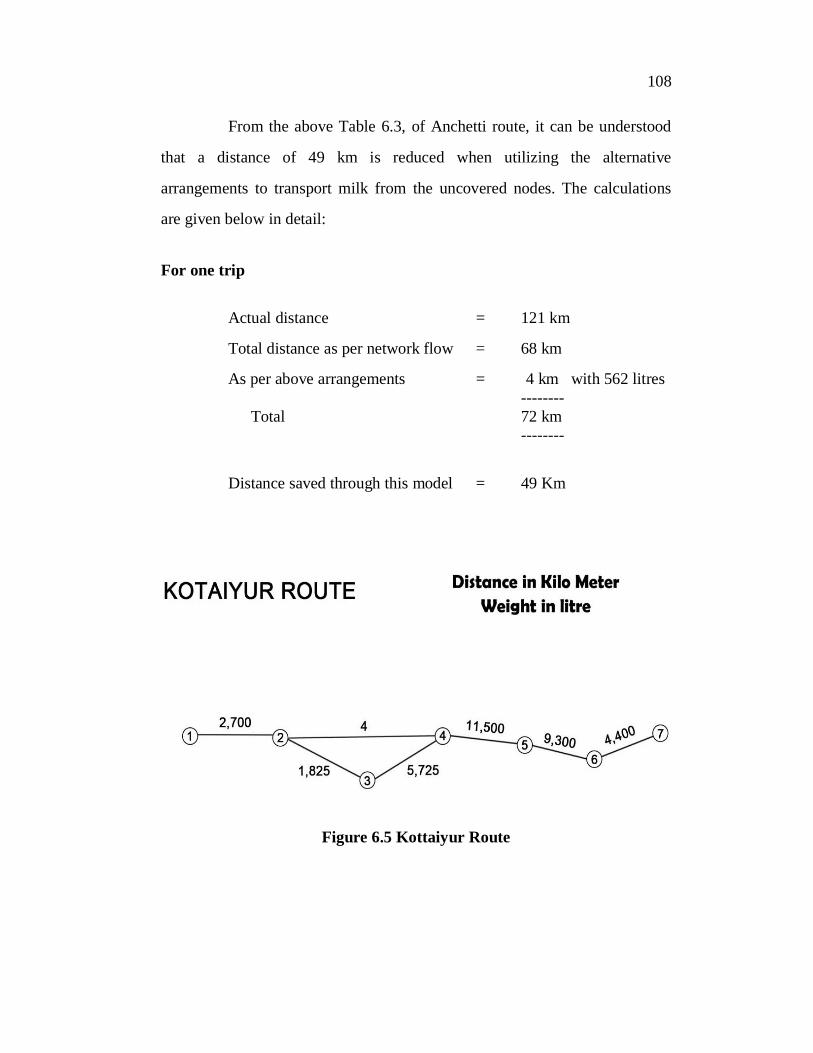
Figure 6.5 Kottaiyur Route
109
2) KOTTAIYUR ROUTE
Step 1
There is no alternate route and therefore the following sequence can
be retained 1 2 = 2 km is an optimal route
Step 2
There are two alternate routes
3 4 = 6 km and 2 4 = 4km
Here 2 4 = 4 km is an optimal route
Step 3
There is no alternate route; therefore the following sequence can be
retained 4 7 = 24 km is an optimal sequence of route
Step 4
The ultimate route from the starting node is following
7 = 30 km
Step 5
The following Table6.4 represents the uncovered milk collection
centres and to which node milk from a particular society has to be transferred.
Based on the production capacity of the society, vehicles can be arranged to
transport milk.
110
Table 6.4 Uncovered Nodes and Alternative Arrangements forkotaiyur route
From the node To the node Distance in km Weight inlitres
3 2 1 825
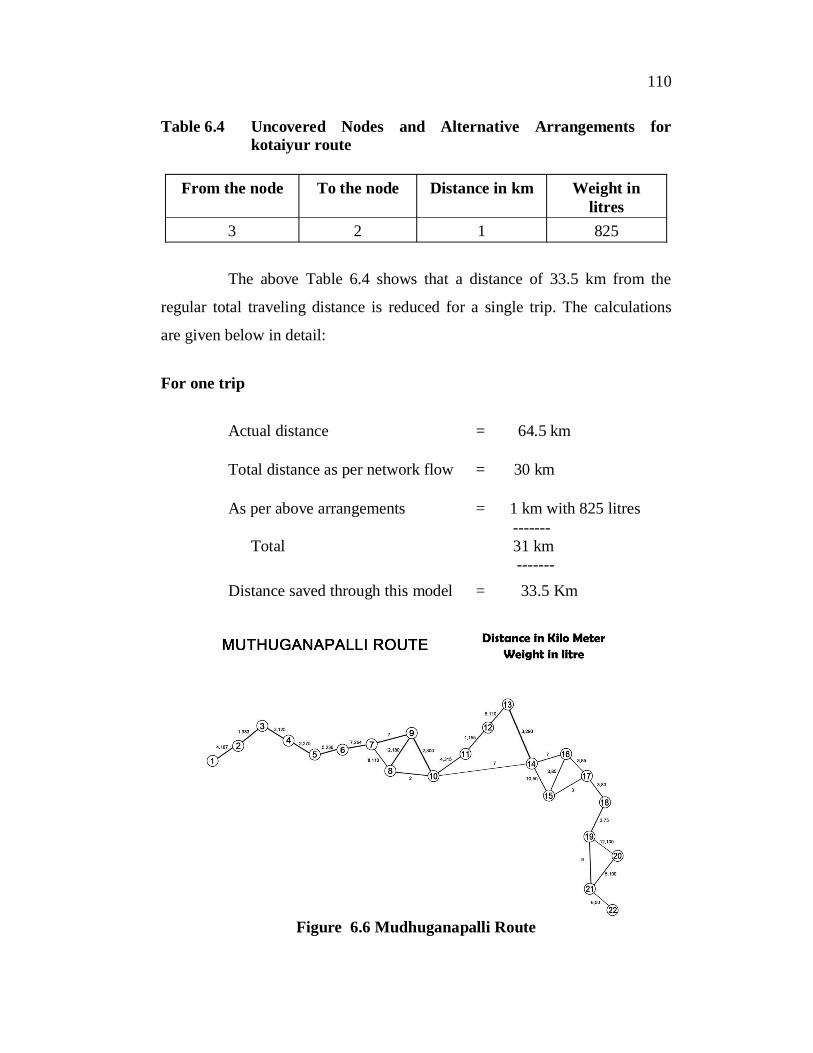
The above Table 6.4 shows that a distance of 33.5 km from the
regular total traveling distance is reduced for a single trip. The calculations
are given below in detail:
For one trip
Actual distance = 64.5 km
Total distance as per network flow = 30 km
As per above arrangements = 1 km with 825 litres -------
Total 31 km -------
Distance saved through this model = 33.5 Km
Figure 6.6 Mudhuganapalli Route
111
3) MUTHUGANA PALLI ROUTE
Step 1
There is no alternate route and therefore the following sequence can
be retained 1 7 = 22 km is an optimal sequence of route
Step 2
There are three alternate routes 7 10 = 22 km, 7 10 =
9 km and 7 10 = 10 km
10=9km is an optimal sequence of route
Step 3
There are two alternate routes
10 11 12 13 14 = 13 km and 10 14 = 7 km
There 10 14 = 7 km is an optimal route
Step 4There are three alternate routes
14 15 16 17 = 16 km, 14 16 17=10 km and 14 15 17=13 km
14 16 17=10km is an optimal sequence of the route
Step 5There is no alternate route; therefore the following sequence can be
retained 17 18 19=8km is an optimal sequence of the route.
Step 6There are two alternate routes
19 21 = 9 km, and 19 20 21 = 17 km and
19 21 = 9 km is an optimal route
112
Step 7There is no alternate route; therefore the following sequence can be
retained 21 22 = 6 km is an optimal sequence of the route
Step 8The ultimate route from the starting node is following
10 14 16 17 18 19 21
22=71km
Step 9The following Table 6.5 represents the uncovered milk collection
centres and to which node milk from a particular society has to be transferred.
Based on the production capacity of the society, vehicles can be arranged to
transport milk.
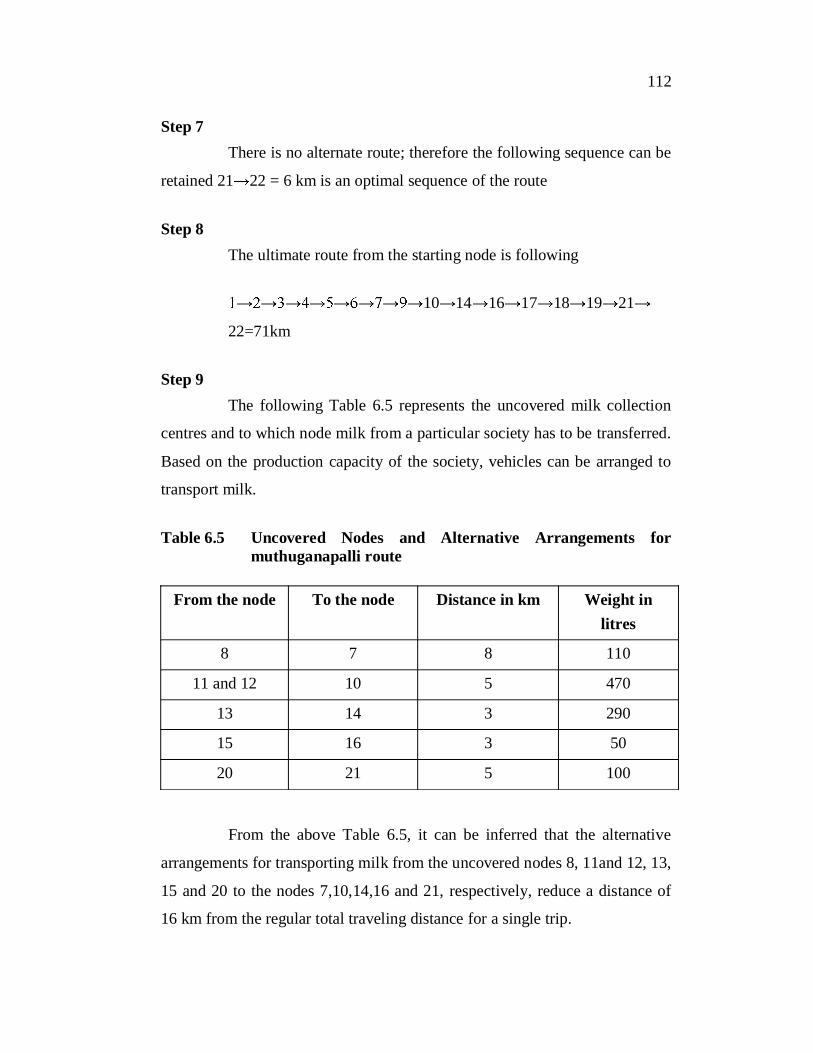
Table 6.5 Uncovered Nodes and Alternative Arrangements formuthuganapalli route
From the node To the node Distance in km Weight inlitres
8 7 8 110
11 and 12 10 5 470
13 14 3 290
15 16 3 50
20 21 5 100
From the above Table 6.5, it can be inferred that the alternative
arrangements for transporting milk from the uncovered nodes 8, 11and 12, 13,
15 and 20 to the nodes 7,10,14,16 and 21, respectively, reduce a distance of
16 km from the regular total traveling distance for a single trip.
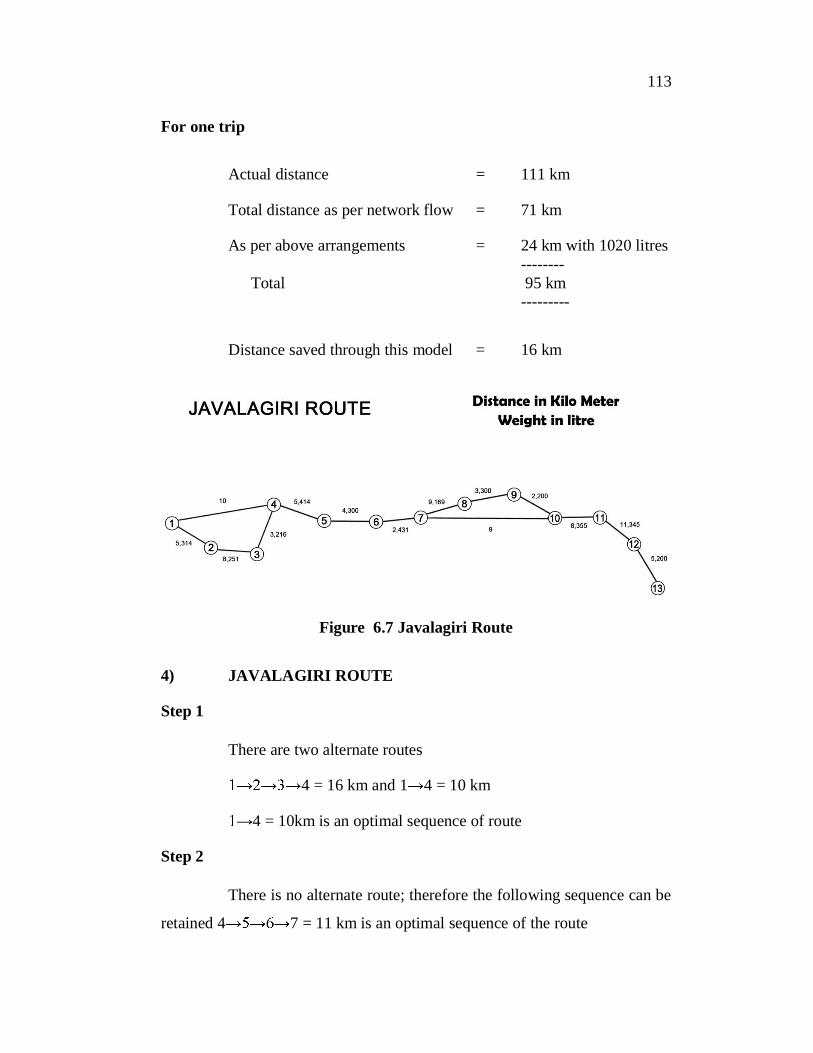
113
For one trip
Actual distance = 111 km
Total distance as per network flow = 71 km
As per above arrangements = 24 km with 1020 litres--------
Total 95 km---------
Distance saved through this model = 16 km
Figure 6.7 Javalagiri Route
4) JAVALAGIRI ROUTE
Step 1
There are two alternate routes
4 = 16 km and 1 4 = 10 km
4 = 10km is an optimal sequence of route
Step 2
There is no alternate route; therefore the following sequence can be
retained 4 7 = 11 km is an optimal sequence of the route
114
Step 3
There are two alternate routes
10 = 14 km, and 7 10 = 9 km
Here 7 10 = 9 km is an optimal route
Step 4
There is no alternate route; therefore the following sequence can be
retained 10 11 12 13 = 24 km is an optimal sequence of the route.
Step 5
The ultimate route from the starting node is following
10 11 12 13 = 54 km
Step6
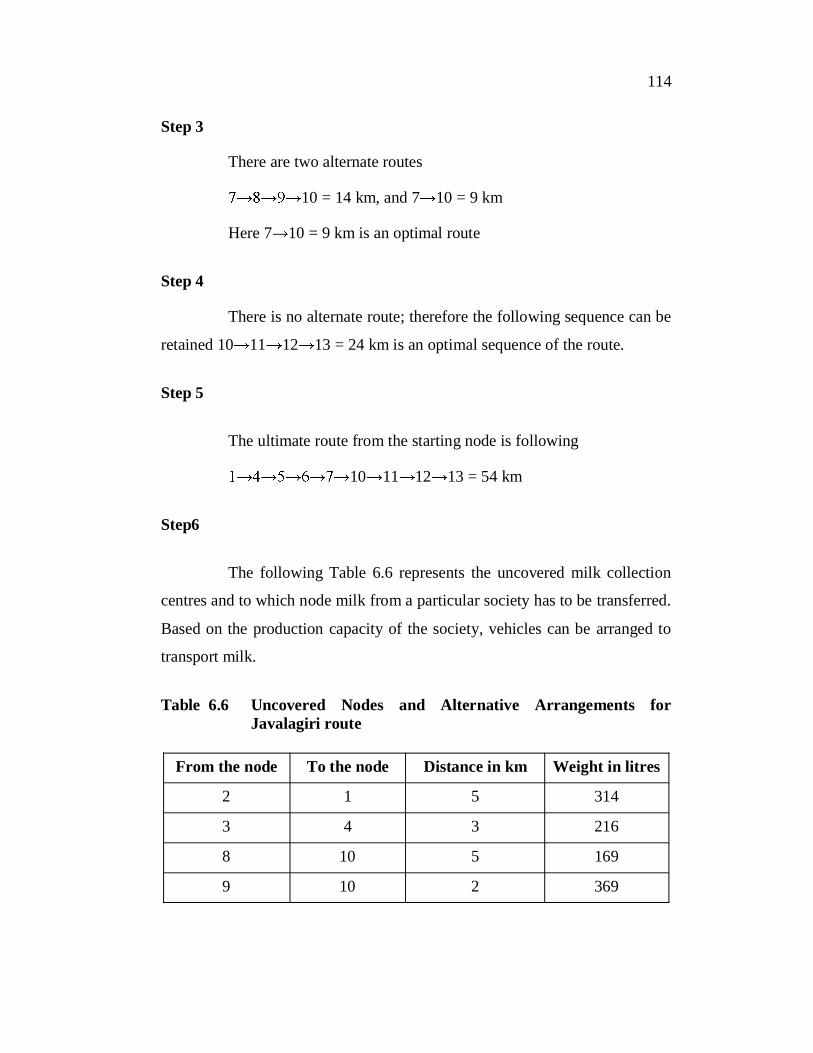
The following Table 6.6 represents the uncovered milk collection
centres and to which node milk from a particular society has to be transferred.
Based on the production capacity of the society, vehicles can be arranged to
transport milk.
Table 6.6 Uncovered Nodes and Alternative Arrangements forJavalagiri route
From the node To the node Distance in km Weight in litres
2 1 5 314
3 4 3 216
8 10 5 169
9 10 2 369
115
From the above Table 6.6, In Javalagiri route, milk can be
transported from the uncovered nodes 2, 3 and both the node 8 and 9 to the
nodes 1, 4, and 10 respectively. And doing this can save a distance of 2 km.
The calculations are given below in detail:
For one trip
Actual distance = 71km
Total distance as per network flow = 54 km
As per above arrangements = 15 km with 899--------
Total 69 km--------
Distance saved through this model = 2 Km
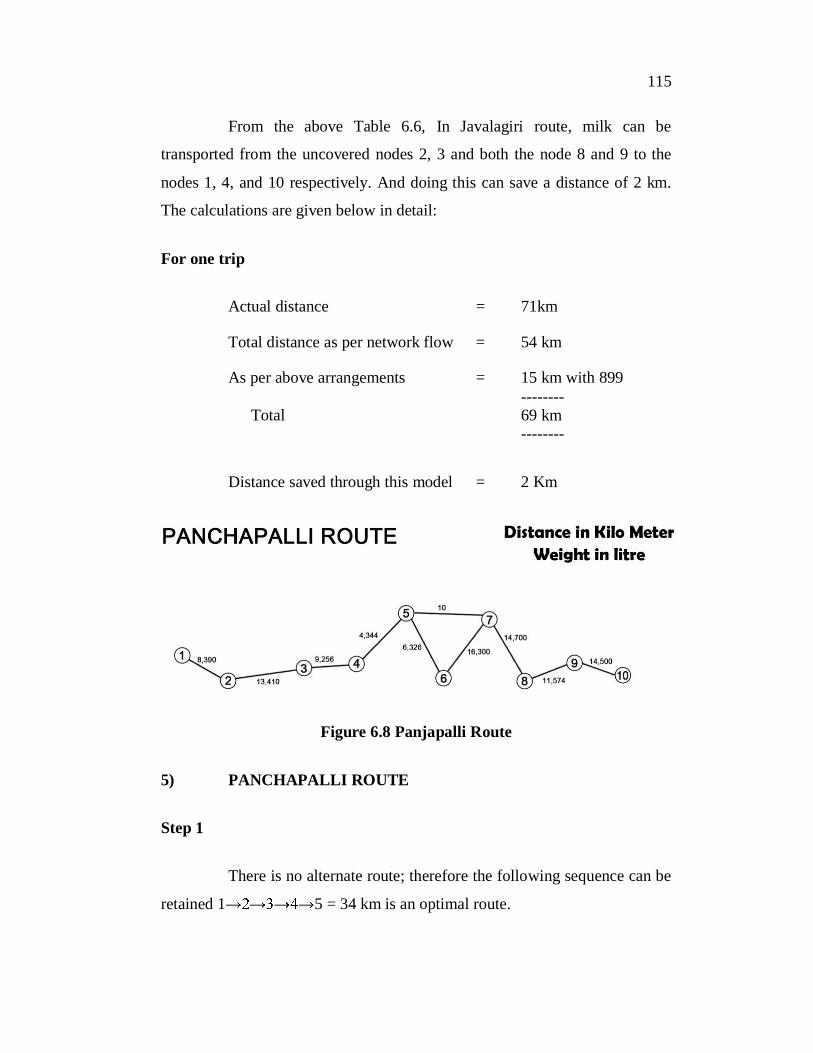
Figure 6.8 Panjapalli Route
5) PANCHAPALLI ROUTE
Step 1
There is no alternate route; therefore the following sequence can be
retained 1 5 = 34 km is an optimal route.
116
Step 2
There are two alternate routes
7 = 22 km and 5 7 = 10 km
Here 5 7 =10 km is an optimal route
Step 3
There is no alternate route and therefore the following sequence can
be retained 7 8 9 10 = 39 km is an optimal route
Step 4
The ultimate route from the starting node is following
2 4 5 8 9 10 = 83 km
Step 5
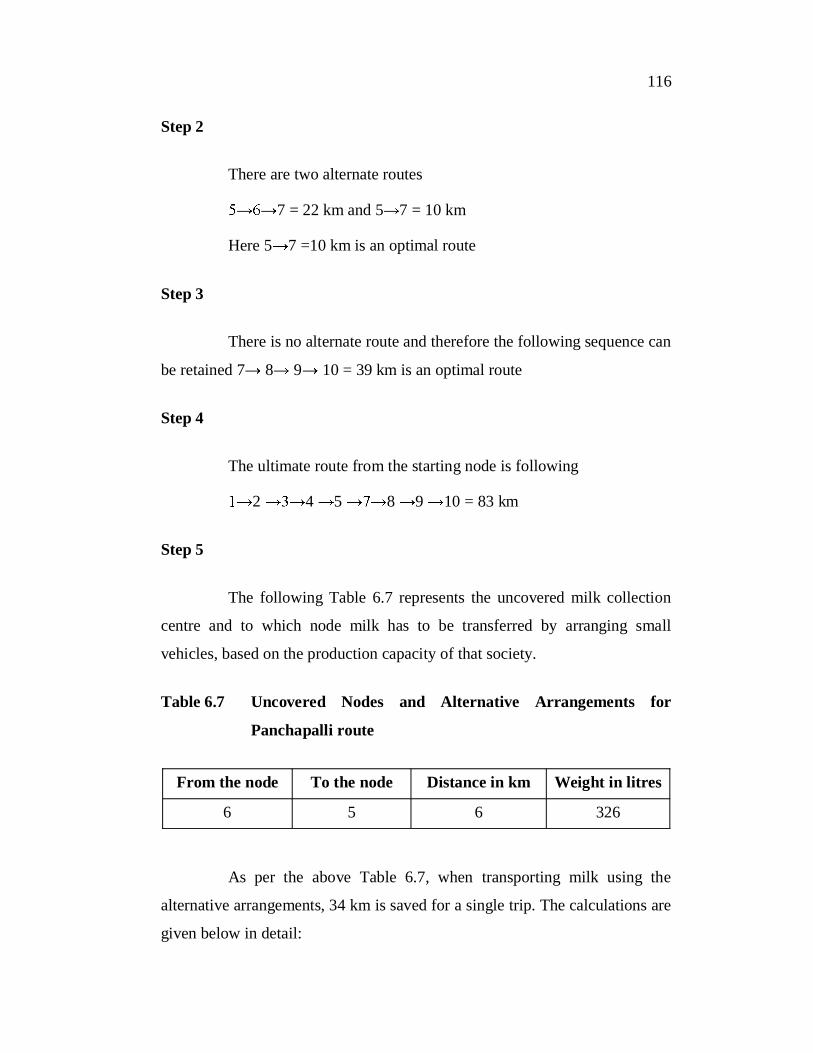
The following Table 6.7 represents the uncovered milk collection
centre and to which node milk has to be transferred by arranging small
vehicles, based on the production capacity of that society.
Table 6.7 Uncovered Nodes and Alternative Arrangements for
Panchapalli route
From the node To the node Distance in km Weight in litres
6 5 6 326
As per the above Table 6.7, when transporting milk using the
alternative arrangements, 34 km is saved for a single trip. The calculations are
given below in detail:
117
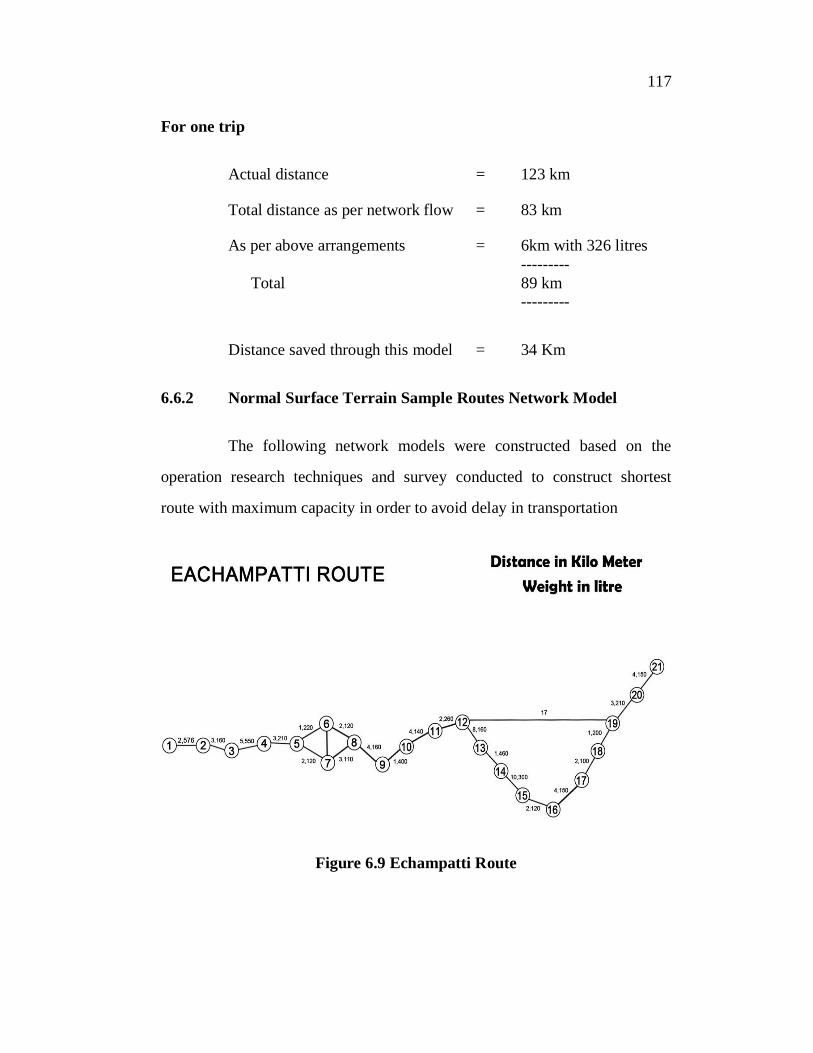
For one trip
Actual distance = 123 km
Total distance as per network flow = 83 km
As per above arrangements = 6km with 326 litres---------
Total 89 km---------
Distance saved through this model = 34 Km
6.6.2 Normal Surface Terrain Sample Routes Network Model
The following network models were constructed based on the
operation research techniques and survey conducted to construct shortest
route with maximum capacity in order to avoid delay in transportation
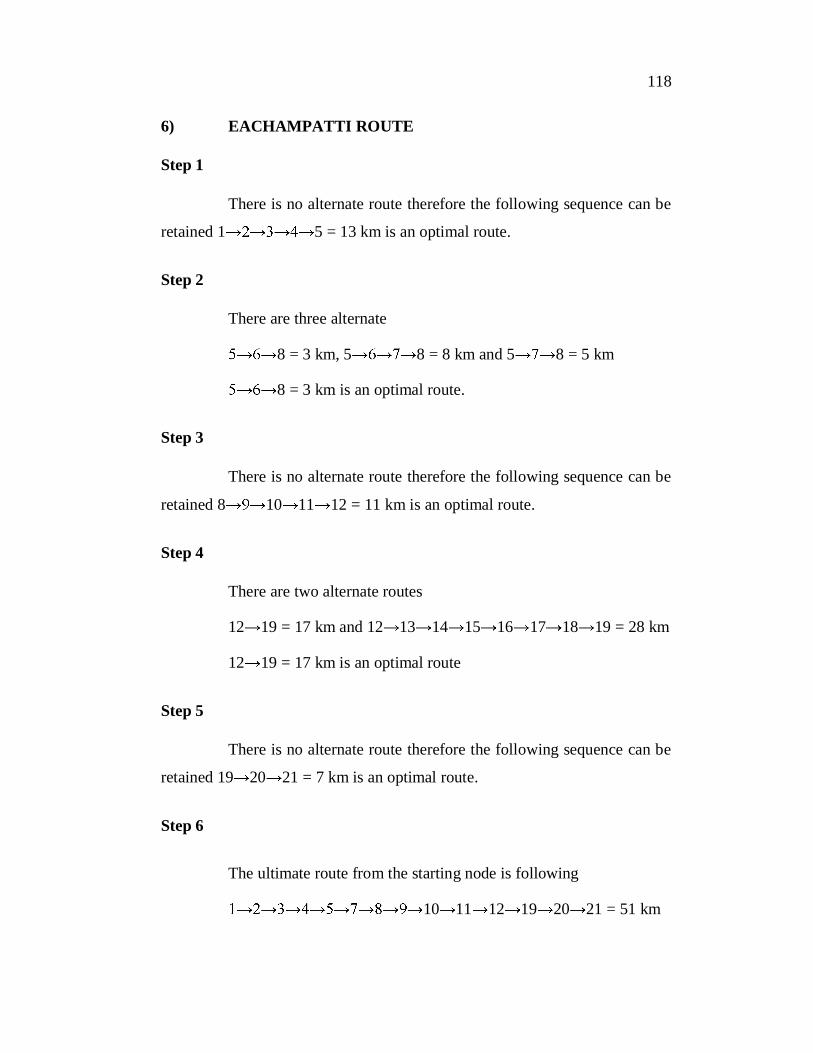
Figure 6.9 Echampatti Route
118
6) EACHAMPATTI ROUTE
Step 1
There is no alternate route therefore the following sequence can be
retained 1 5 = 13 km is an optimal route.
Step 2
There are three alternate
8 = 3 km, 5 8 = 8 km and 5 8 = 5 km
8 = 3 km is an optimal route.
Step 3
There is no alternate route therefore the following sequence can be
retained 8 10 11 12 = 11 km is an optimal route.
Step 4
There are two alternate routes
12 19 = 17 km and 12 13 14 15 16 17 18 19 = 28 km
12 19 = 17 km is an optimal route
Step 5
There is no alternate route therefore the following sequence can be
retained 19 20 21 = 7 km is an optimal route.
Step 6
The ultimate route from the starting node is following
10 11 12 19 20 21 = 51 km
119
Step 7
The following Table 6.8 represents the uncovered milk collection
centres and to which node milk from a particular society has to be transferred.
Based on the production capacity of the society, vehicles can be arranged to
transport milk.
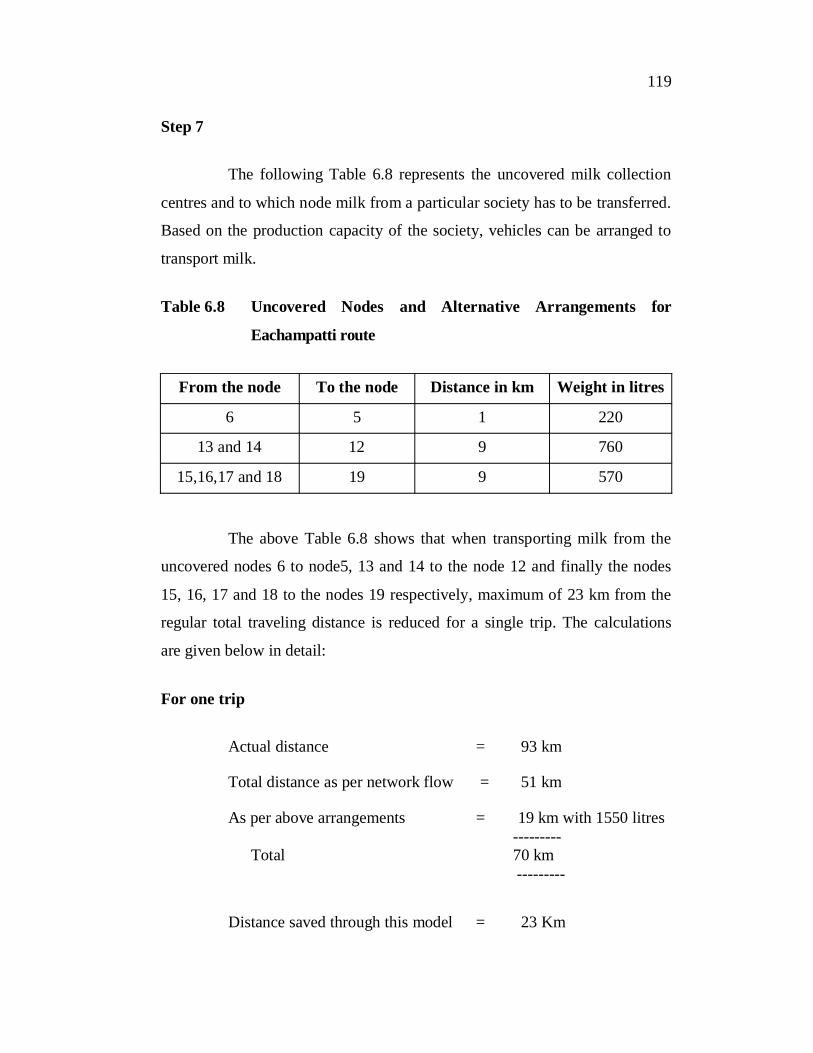
Table 6.8 Uncovered Nodes and Alternative Arrangements for
Eachampatti route
From the node To the node Distance in km Weight in litres
6 5 1 220
13 and 14 12 9 760
15,16,17 and 18 19 9 570
The above Table 6.8 shows that when transporting milk from the
uncovered nodes 6 to node5, 13 and 14 to the node 12 and finally the nodes
15, 16, 17 and 18 to the nodes 19 respectively, maximum of 23 km from the
regular total traveling distance is reduced for a single trip. The calculations
are given below in detail:
For one trip
Actual distance = 93 km
Total distance as per network flow = 51 km
As per above arrangements = 19 km with 1550 litres ---------
Total 70 km ---------
Distance saved through this model = 23 Km
120
Somanahalli
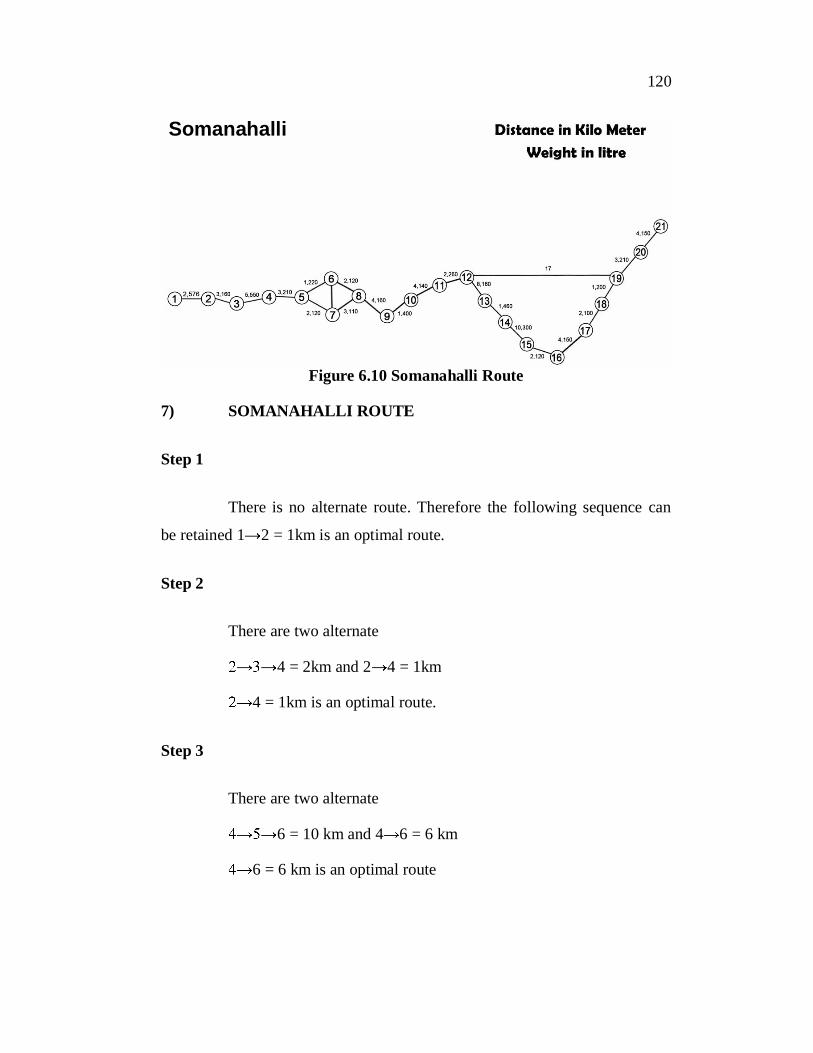
Figure 6.10 Somanahalli Route
7) SOMANAHALLI ROUTE
Step 1
There is no alternate route. Therefore the following sequence can
be retained 1 2 = 1km is an optimal route.
Step 2
There are two alternate
4 = 2km and 2 4 = 1km
4 = 1km is an optimal route.
Step 3
There are two alternate
6 = 10 km and 4 6 = 6 km
6 = 6 km is an optimal route
121
Step 4
There is no alternate route. Therefore the following sequence can
be retained 6 10 11 12 13 14 = 42 km is an optimal route.
Step 5
There are three alternate routes
14 16 17= 8 km, 14 15 16 17 = 12 km
and 14 15 17 = 7 km
Here 14 15 17 = 7 km is an optimal route
Step 6
There is no alternate route. Therefore the following sequence can
be retained 17 18 19 = 3 km is an optimal route.
Step 7
There are three alternate routes
19 20 21 22 23 24 = 13 km and 19 24 = 5 km
Here 19 24 = 5 km is an optimal route
Step 8
There is no alternate route. Therefore the following sequence can
be retained 24 25 26 27 = 12 km is an optimal route.
Step 9
The ultimate route from the starting node is following
10 11 12 13 14 15 17 18
19 24 25 26 27 = 77 km
122
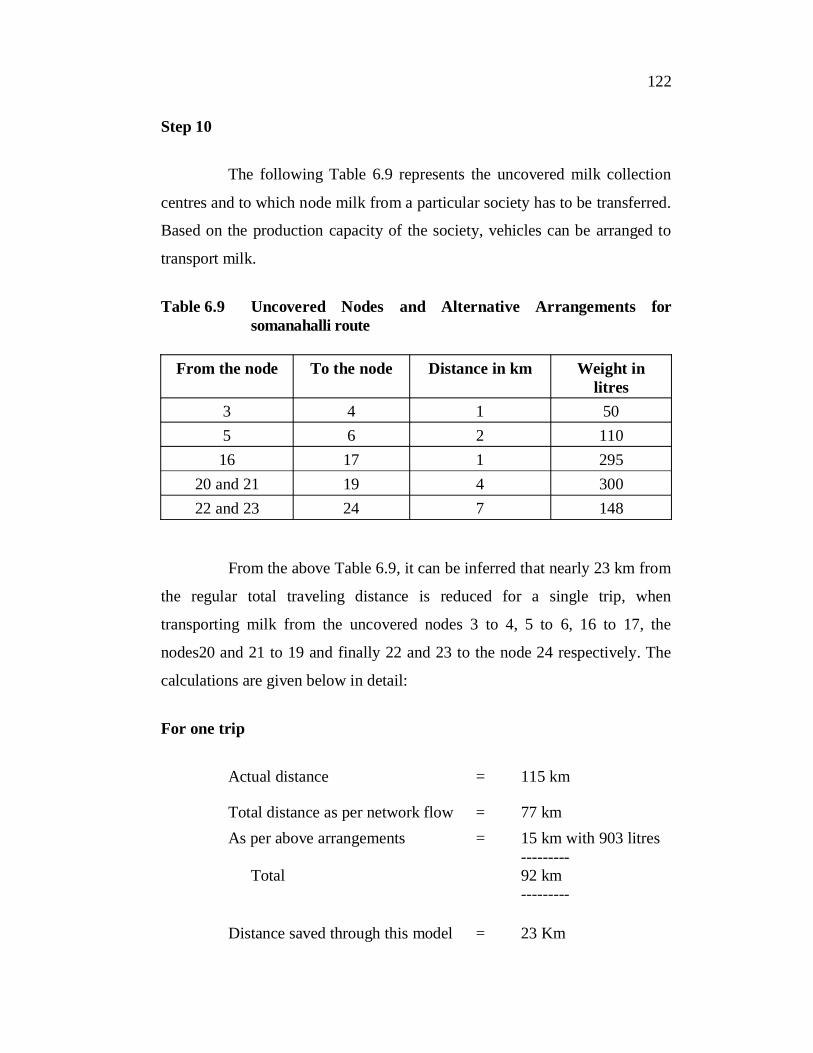
Step 10
The following Table 6.9 represents the uncovered milk collection
centres and to which node milk from a particular society has to be transferred.
Based on the production capacity of the society, vehicles can be arranged to
transport milk.
Table 6.9 Uncovered Nodes and Alternative Arrangements forsomanahalli route
From the node To the node Distance in km Weight inlitres
3 4 1 505 6 2 11016 17 1 295
20 and 21 19 4 30022 and 23 24 7 148
From the above Table 6.9, it can be inferred that nearly 23 km from
the regular total traveling distance is reduced for a single trip, when
transporting milk from the uncovered nodes 3 to 4, 5 to 6, 16 to 17, the
nodes20 and 21 to 19 and finally 22 and 23 to the node 24 respectively. The
calculations are given below in detail:
For one trip
Actual distance = 115 km
Total distance as per network flow = 77 kmAs per above arrangements = 15 km with 903 litres
--------- Total 92 km
---------
Distance saved through this model = 23 Km
123
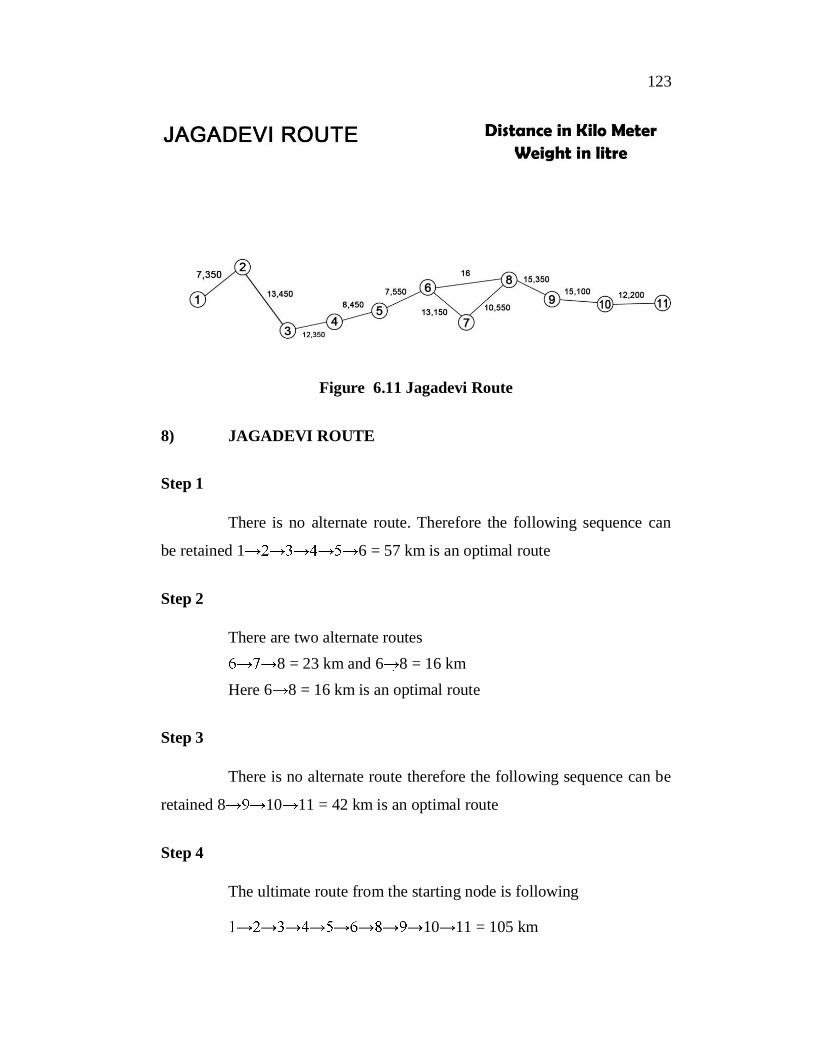
Figure 6.11 Jagadevi Route
8) JAGADEVI ROUTE
Step 1
There is no alternate route. Therefore the following sequence can
be retained 1 6 = 57 km is an optimal route
Step 2
There are two alternate routes8 = 23 km and 6 8 = 16 km
Here 6 8 = 16 km is an optimal route
Step 3
There is no alternate route therefore the following sequence can be
retained 8 10 11 = 42 km is an optimal route
Step 4
The ultimate route from the starting node is following
10 11 = 105 km
124
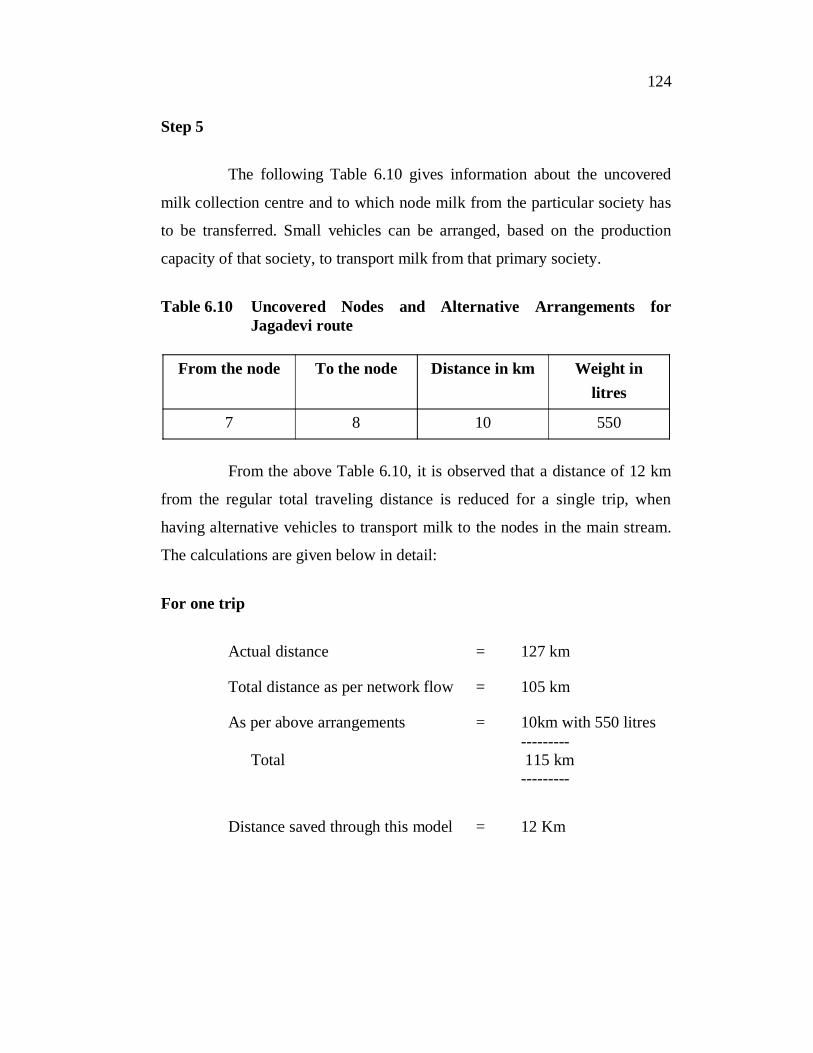
Step 5
The following Table 6.10 gives information about the uncovered
milk collection centre and to which node milk from the particular society has
to be transferred. Small vehicles can be arranged, based on the production
capacity of that society, to transport milk from that primary society.
Table 6.10 Uncovered Nodes and Alternative Arrangements forJagadevi route
From the node To the node Distance in km Weight inlitres
7 8 10 550
From the above Table 6.10, it is observed that a distance of 12 km
from the regular total traveling distance is reduced for a single trip, when
having alternative vehicles to transport milk to the nodes in the main stream.
The calculations are given below in detail:
For one trip
Actual distance = 127 km
Total distance as per network flow = 105 km
As per above arrangements = 10km with 550 litres---------
Total 115 km---------
Distance saved through this model = 12 Km
125
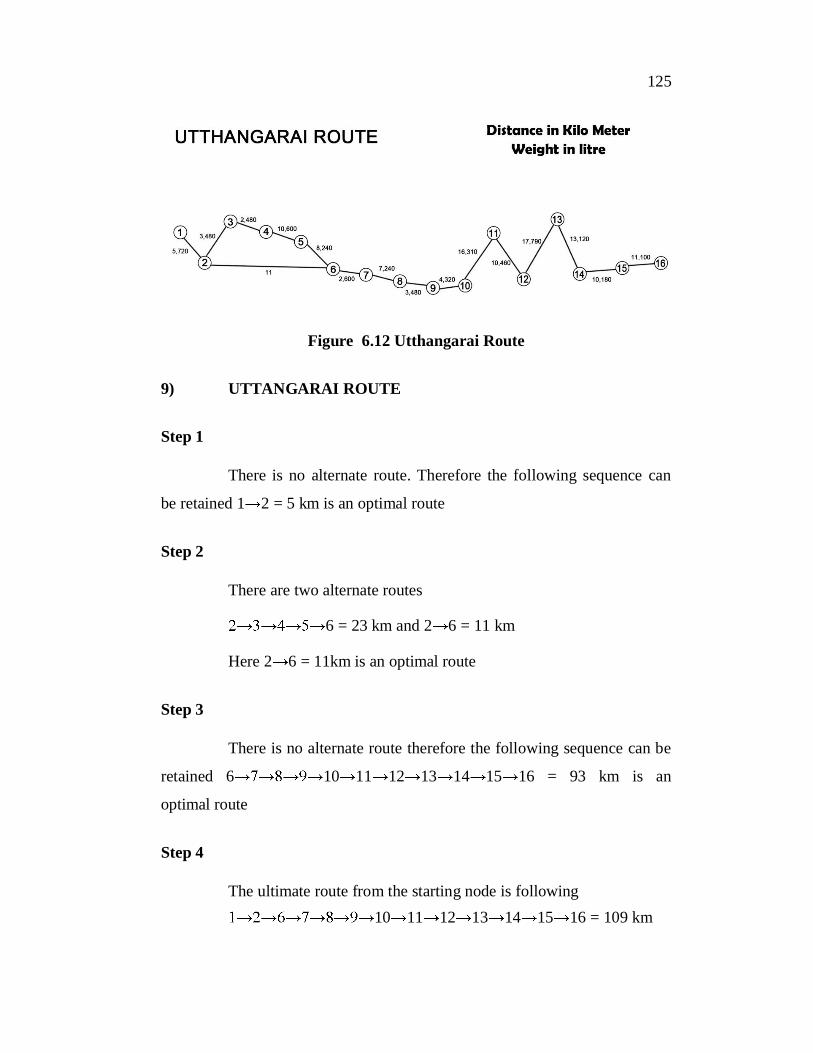
Figure 6.12 Utthangarai Route
9) UTTANGARAI ROUTE
Step 1
There is no alternate route. Therefore the following sequence can
be retained 1 2 = 5 km is an optimal route
Step 2
There are two alternate routes
6 = 23 km and 2 6 = 11 km
Here 2 6 = 11km is an optimal route
Step 3
There is no alternate route therefore the following sequence can be
retained 6 10 11 12 13 14 15 16 = 93 km is an
optimal route
Step 4
The ultimate route from the starting node is following10 11 12 13 14 15 16 = 109 km
126
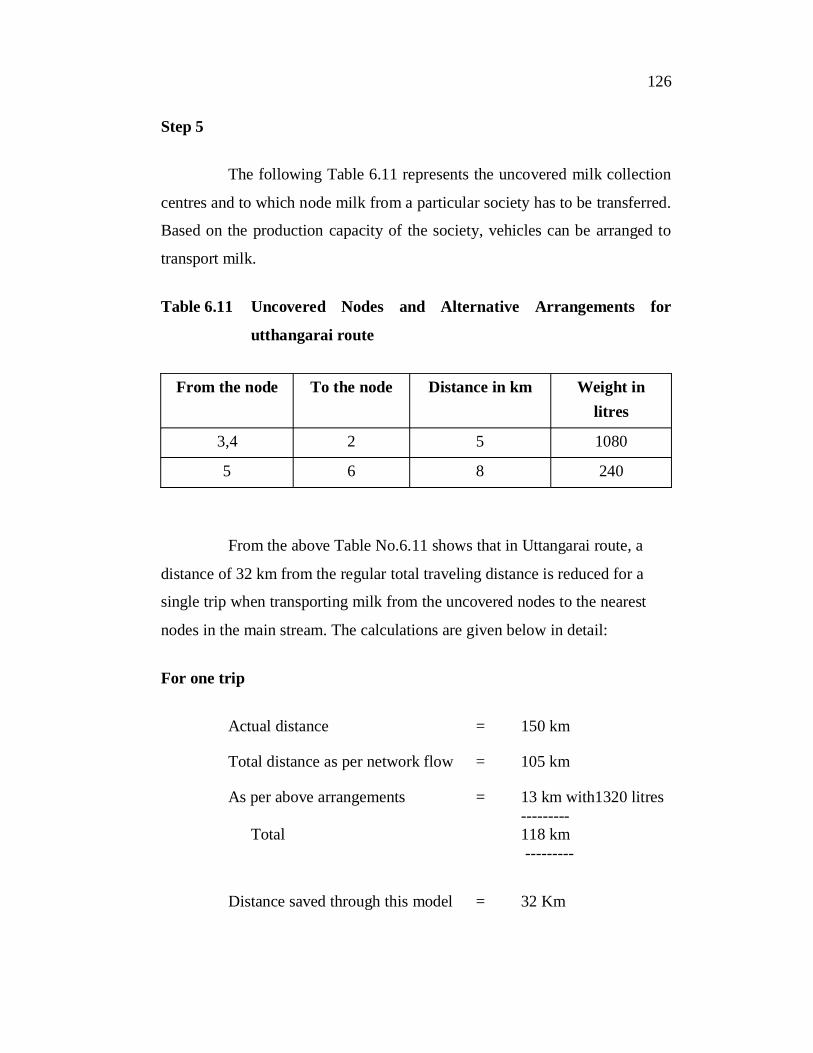
Step 5
The following Table 6.11 represents the uncovered milk collection
centres and to which node milk from a particular society has to be transferred.
Based on the production capacity of the society, vehicles can be arranged to
transport milk.
Table 6.11 Uncovered Nodes and Alternative Arrangements for
utthangarai route
From the node To the node Distance in km Weight inlitres
3,4 2 5 1080
5 6 8 240
From the above Table No.6.11 shows that in Uttangarai route, a
distance of 32 km from the regular total traveling distance is reduced for a
single trip when transporting milk from the uncovered nodes to the nearest
nodes in the main stream. The calculations are given below in detail:
For one trip
Actual distance = 150 km
Total distance as per network flow = 105 km
As per above arrangements = 13 km with1320 litres---------
Total 118 km ---------
Distance saved through this model = 32 Km
127
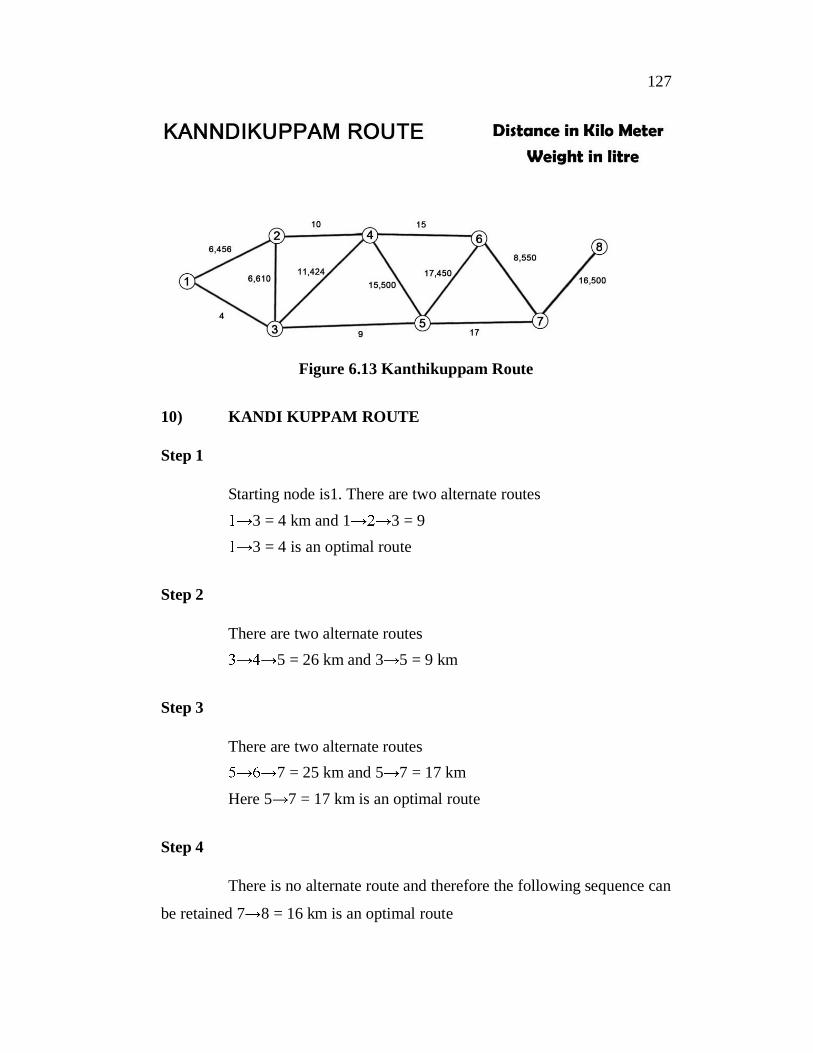
Figure 6.13 Kanthikuppam Route
10) KANDI KUPPAM ROUTE
Step 1
Starting node is1. There are two alternate routes3 = 4 km and 1 3 = 93 = 4 is an optimal route
Step 2
There are two alternate routes5 = 26 km and 3 5 = 9 km
Step 3
There are two alternate routes7 = 25 km and 5 7 = 17 km
Here 5 7 = 17 km is an optimal route
Step 4
There is no alternate route and therefore the following sequence can
be retained 7 8 = 16 km is an optimal route
128
Step 5
The ultimate route from the starting node is following 3 5 7 8 = 46 km
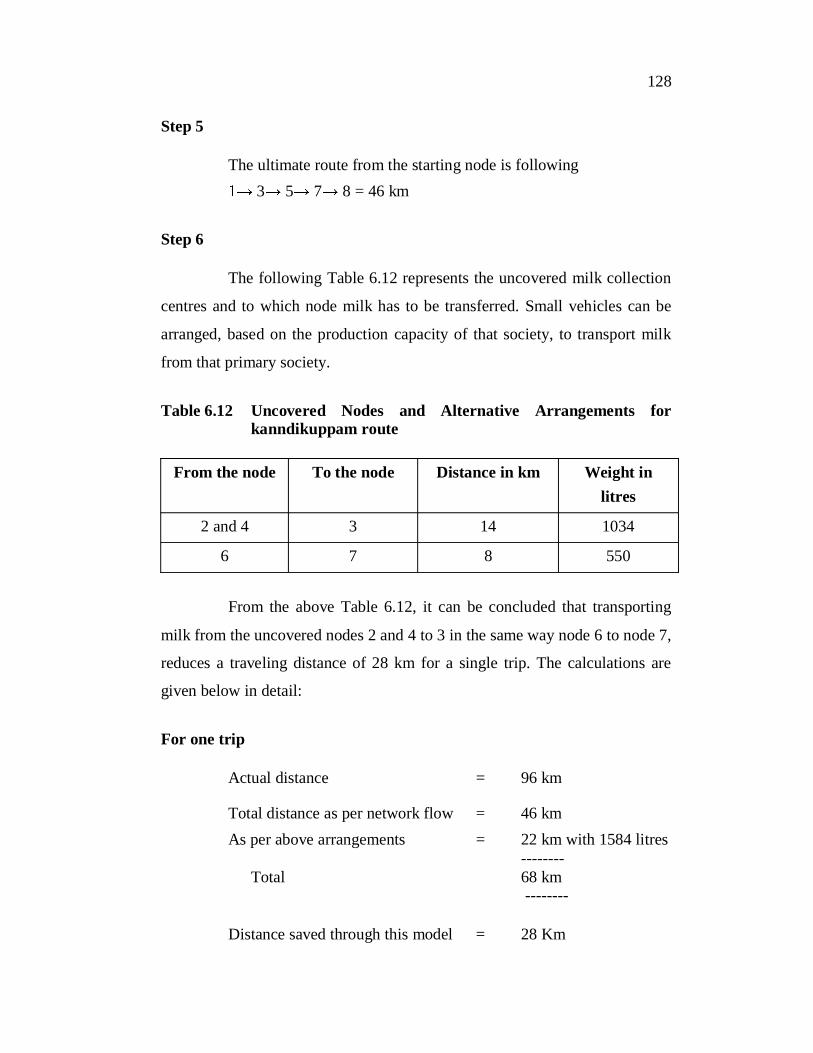
Step 6
The following Table 6.12 represents the uncovered milk collection
centres and to which node milk has to be transferred. Small vehicles can be
arranged, based on the production capacity of that society, to transport milk
from that primary society.
Table 6.12 Uncovered Nodes and Alternative Arrangements forkanndikuppam route
From the node To the node Distance in km Weight inlitres
2 and 4 3 14 1034
6 7 8 550
From the above Table 6.12, it can be concluded that transporting
milk from the uncovered nodes 2 and 4 to 3 in the same way node 6 to node 7,
reduces a traveling distance of 28 km for a single trip. The calculations are
given below in detail:
For one trip
Actual distance = 96 km
Total distance as per network flow = 46 kmAs per above arrangements = 22 km with 1584 litres
-------- Total 68 km
--------
Distance saved through this model = 28 Km
129
6.7 CONCLUSION
This chapter covers the sustainability of milk supply chain and
construction of the shortest route for milk collection.
1. Content indicator shows Aavin structure and process of the
system can be hardly influence from the outside, learning and
adoption is very slow than the environmental changes
2. Performance indicators shows the penetration of new
technology, renewal of of infrastructure , changes in work
and employment in all these areas the management of Aavin
fails to see changes in the light of the external conditions , the
sustainability of aavin not up to the mark
3. Here, flow based algorithm and Transshipment logic were
employed and it is found that the traveling distance has been
notably reduced with a minimum of 2 Km to maximum of 86
Km for one trip and with an average of 30.15 Km. Milk
collection from the nodes that are left unconnected through the
shortest route were 129 km with 9539 Litres, this has to be
done using alternative small/medium vehicles to the nearest
possible node in the main stream. This enhances the reduction
of cost (vehicle rent) and time (transportation). Among all
these factors, the ‘Empty’ trips are totally wiped away and this
saves lot of money and time.