1
Chapter 10Correlation and Regression
Chapter 10.1Correlation
2
Define the following terms in your notes: correlation, regression, simple relationship, multiple relationship (multiple regression), correlation coefficient, PPMCC, lurking variable, population correlation coefficient
Then read p. 531 (starting at 101) to example 101 on p. 532.
3
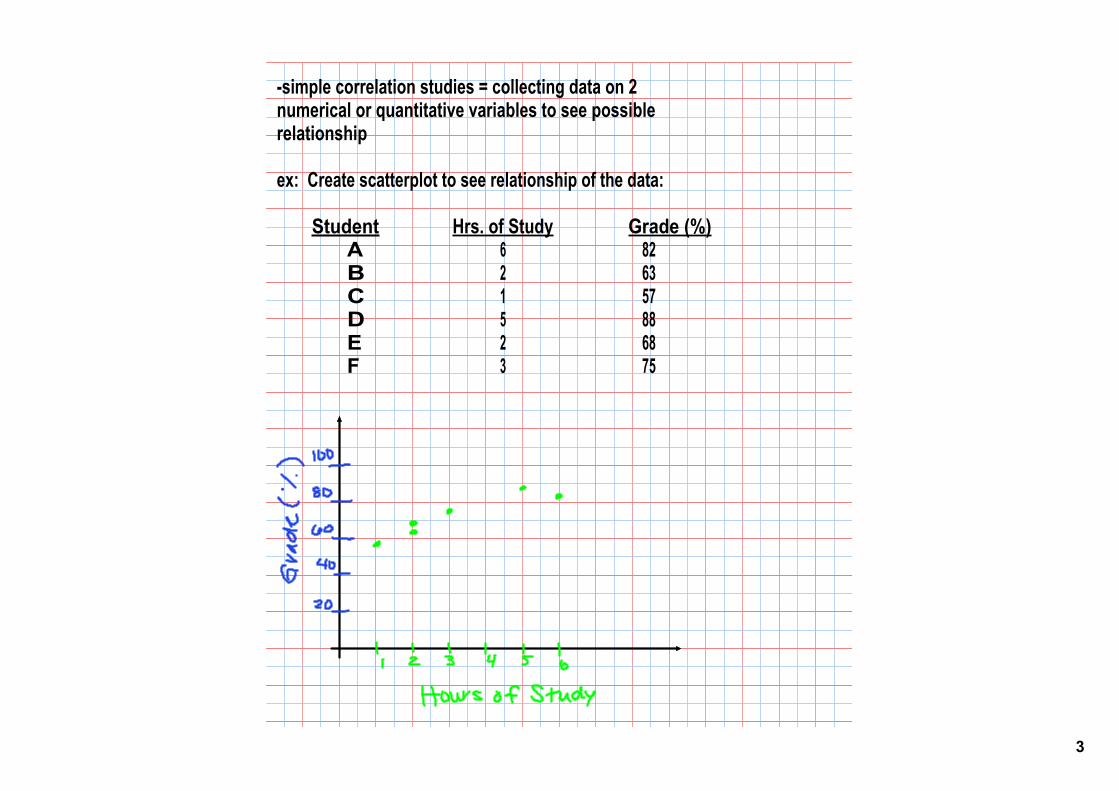
simple correlation studies = collecting data on 2 numerical or quantitative variables to see possible relationship
ex: Create scatterplot to see relationship of the data:
Student Hrs. of Study Grade (%)A 6 82B 2 63C 1 57D 5 88E 2 68F 3 75
4
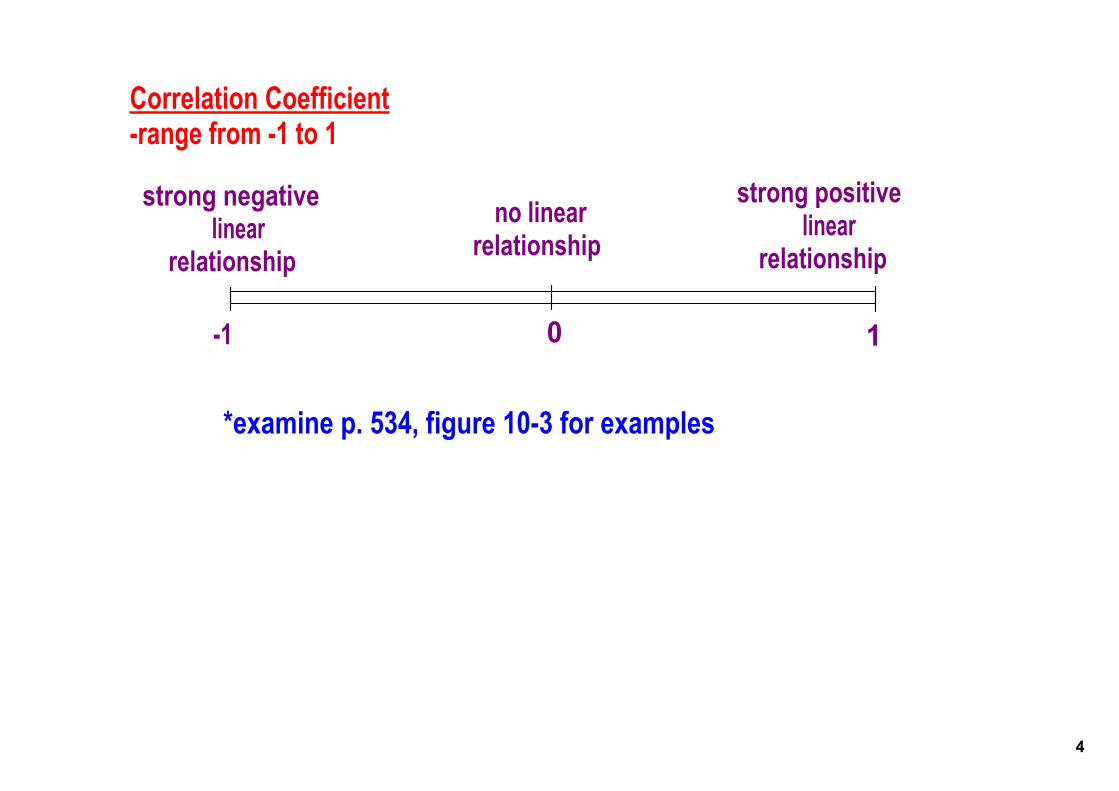
Correlation Coefficientrange from 1 to 1
01 1
strong negativelinear
relationship
strong positivelinear
relationshipno linear
relationship
*examine p. 534, figure 103 for examples
5
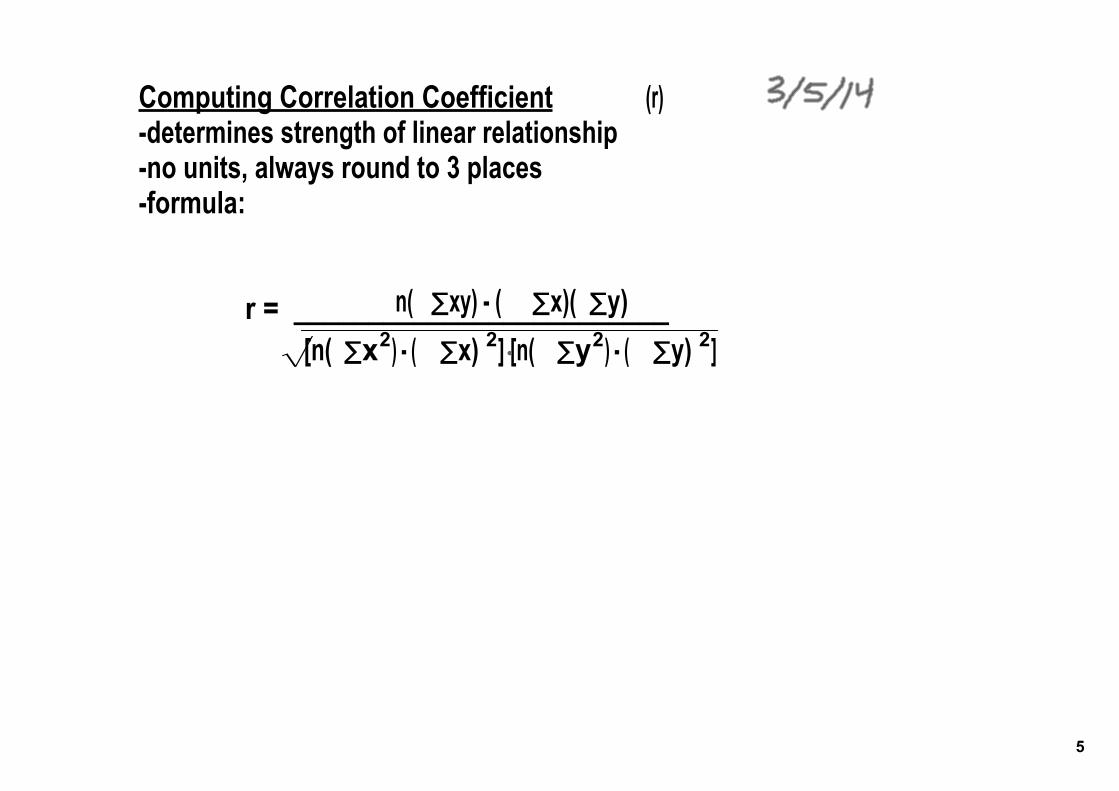
Computing Correlation Coefficient (r)determines strength of linear relationshipno units, always round to 3 placesformula:
r = _________________________ n( Σxy) ( Σx)( Σy)√[n( Σx2) ( Σx) 2] [n( Σy2) ( Σy) 2]
6
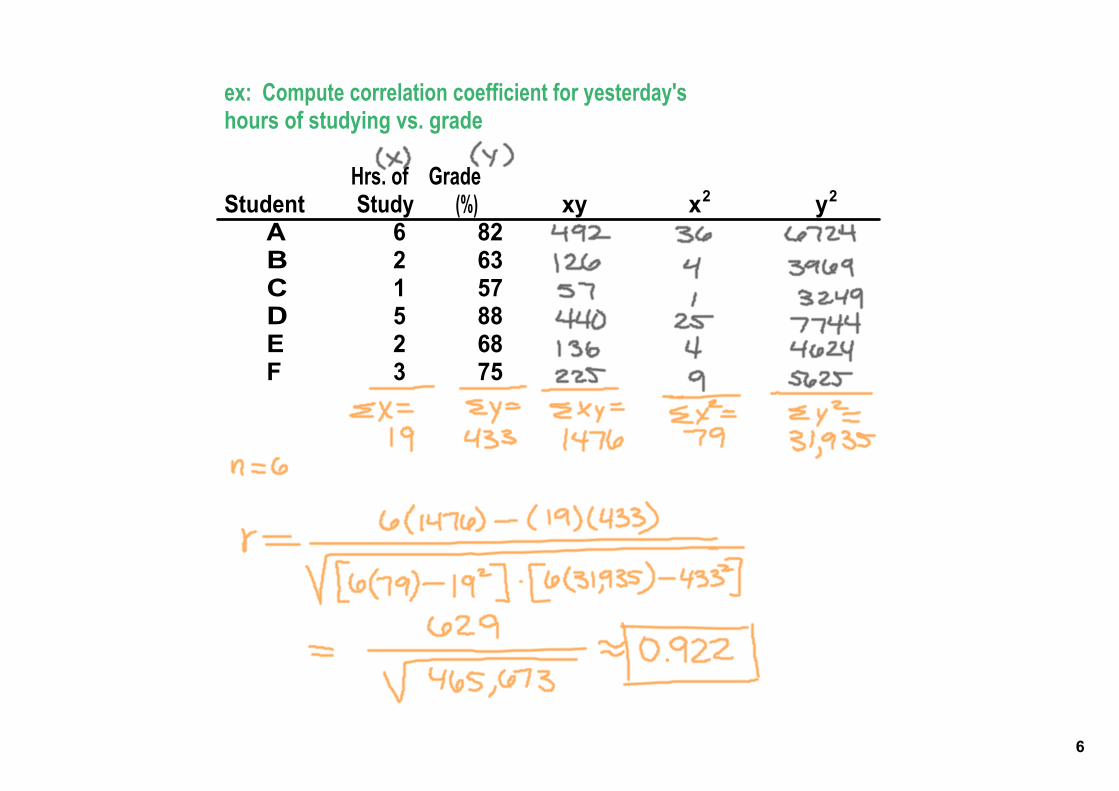
ex: Compute correlation coefficient for yesterday's hours of studying vs. grade
Hrs. of GradeStudent Study (%) xy x2 y2
A 6 82B 2 63C 1 57D 5 88E 2 68F 3 75
7
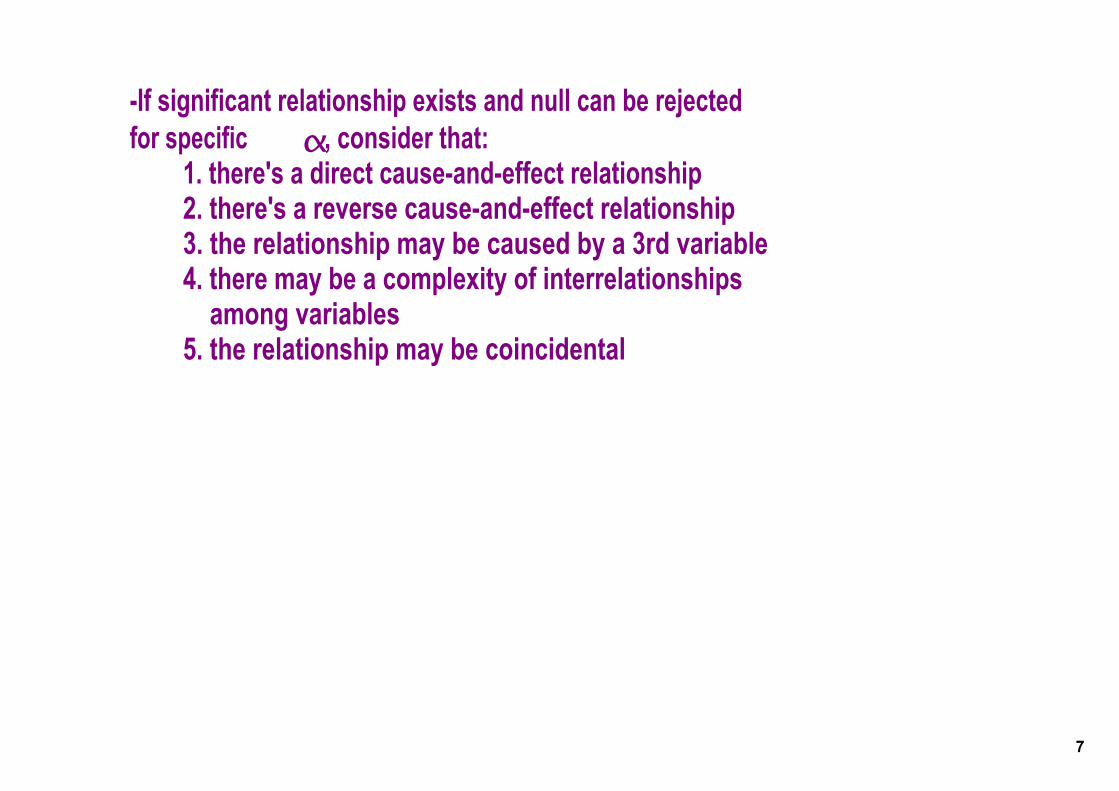
If significant relationship exists and null can be rejected for specific α, consider that:
1. there's a direct causeandeffect relationship 2. there's a reverse causeandeffect relationship3. the relationship may be caused by a 3rd variable4. there may be a complexity of interrelationships among variables5. the relationship may be coincidental
8
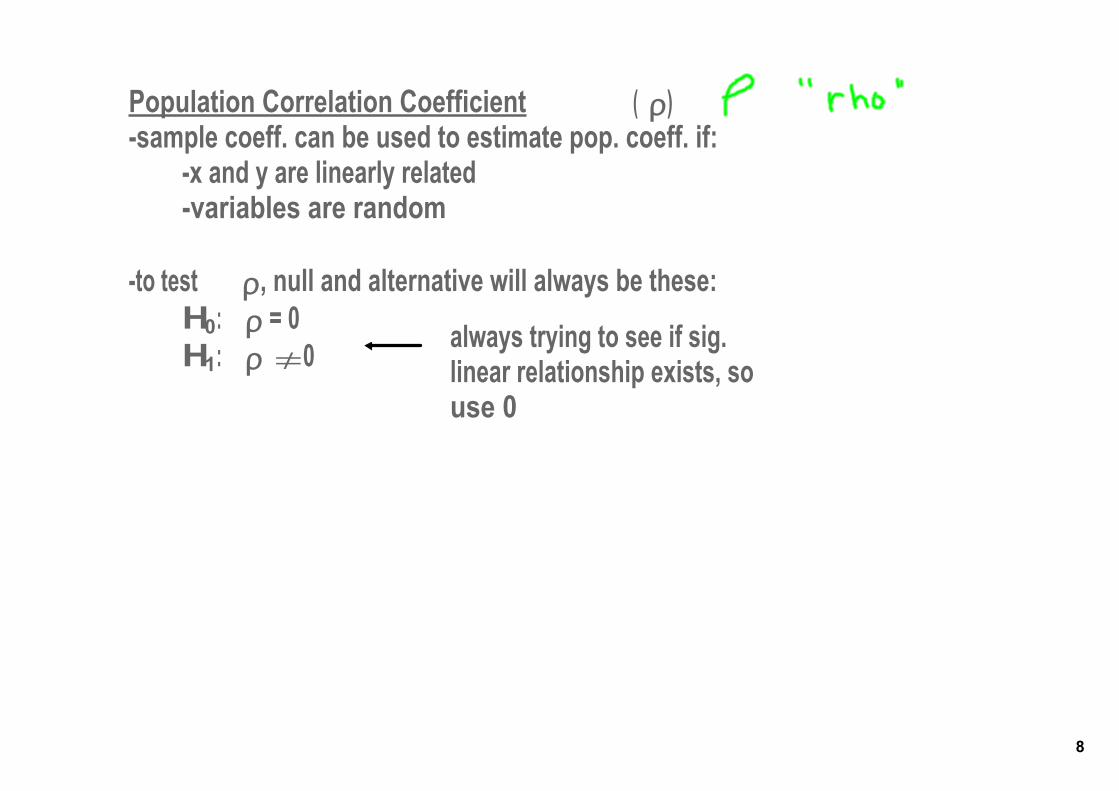
Population Correlation Coefficient ( ρ)sample coeff. can be used to estimate pop. coeff. if:
x and y are linearly relatedvariables are random
to test ρ, null and alternative will always be these:H0: ρ = 0H1: ρ ≠ 0 always trying to see if sig.
linear relationship exists, so use 0
9
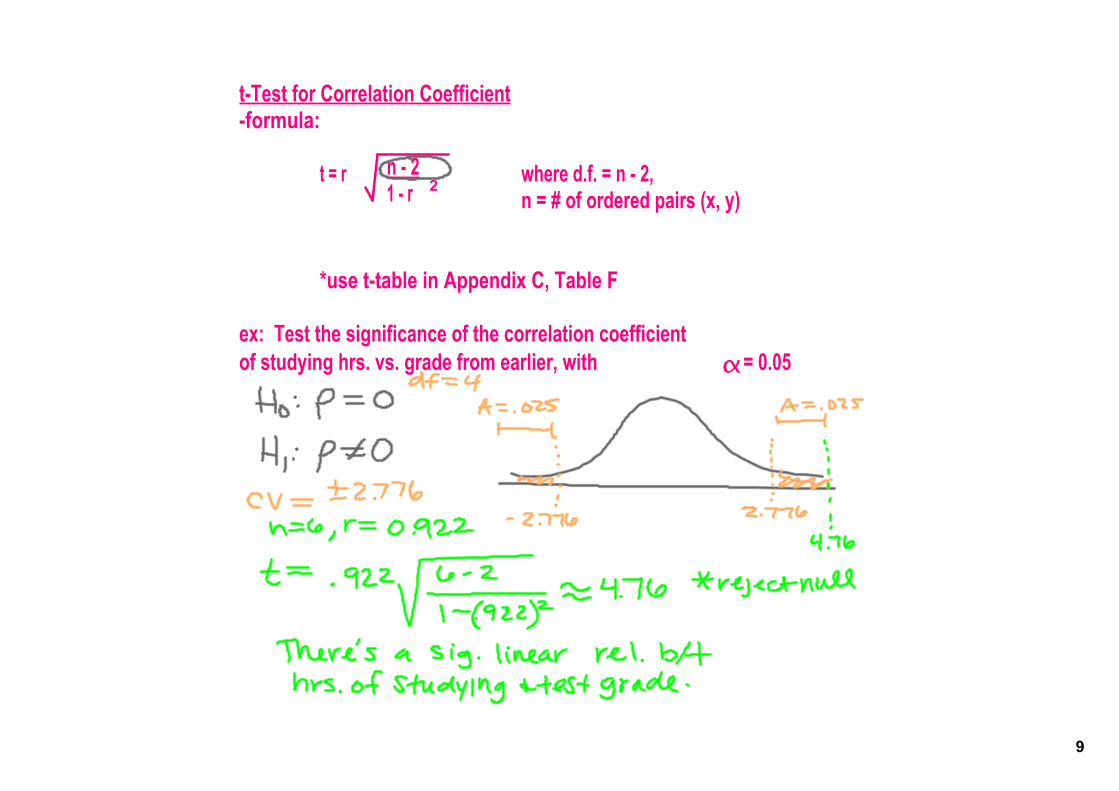
tTest for Correlation Coefficientformula:
t = r where d.f. = n 2, n = # of ordered pairs (x, y)
*use ttable in Appendix C, Table F
ex: Test the significance of the correlation coefficientof studying hrs. vs. grade from earlier, with α = 0.05
n 21 r 2
10
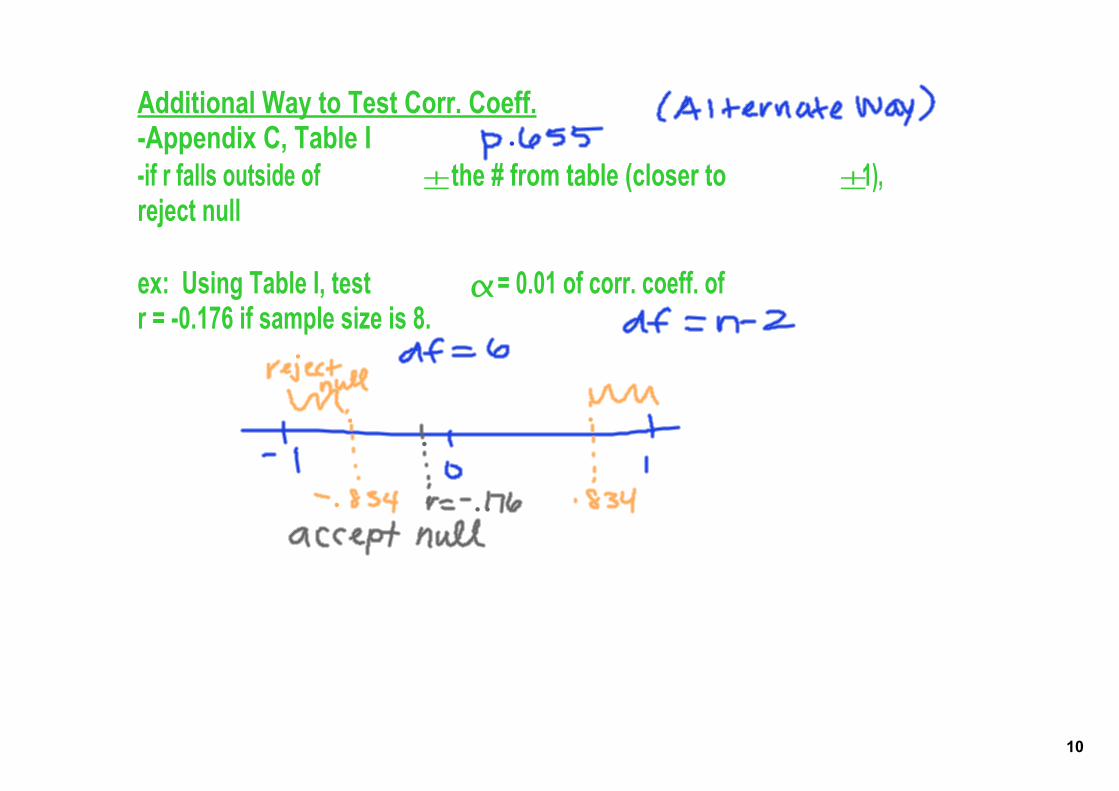
Additional Way to Test Corr. Coeff.Appendix C, Table Iif r falls outside of ± the # from table (closer to ±1), reject null
ex: Using Table I, test α = 0.01 of corr. coeff. of r = 0.176 if sample size is 8.
11
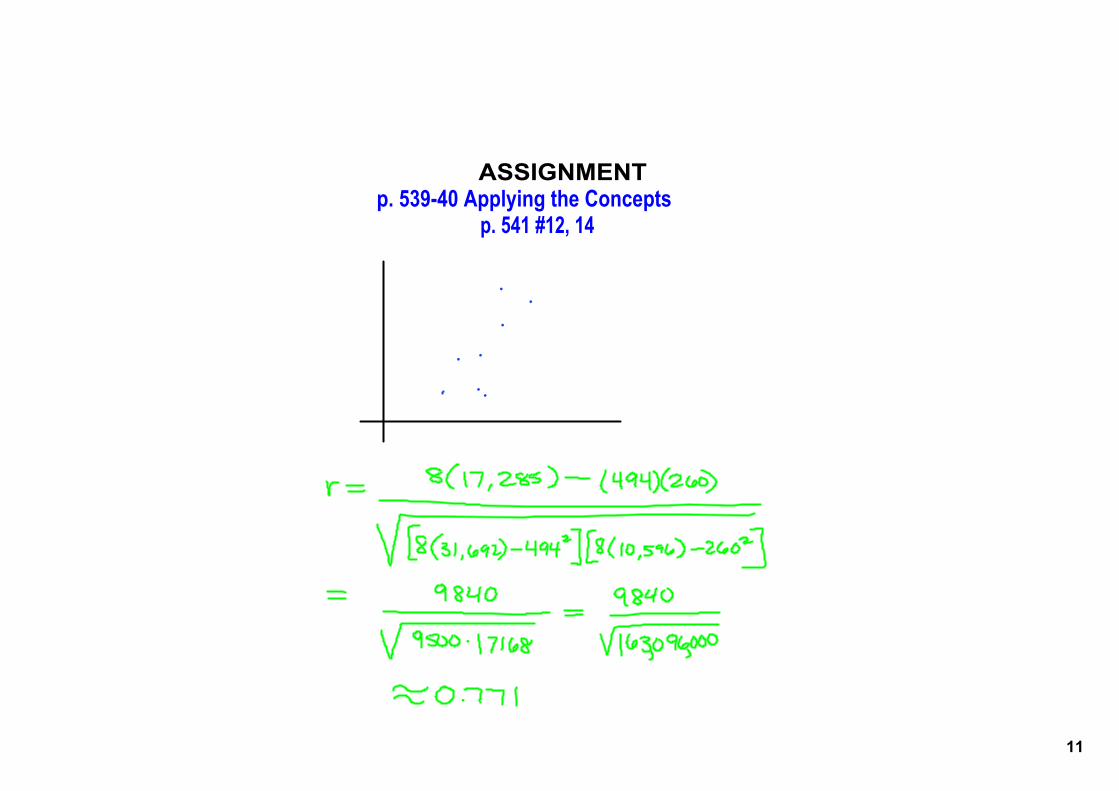
ASSIGNMENTp. 53940 Applying the Concepts
p. 541 #12, 14