Chapter 10 Correlation and Regression

Welcome message from author
This document is posted to help you gain knowledge. Please leave a comment to let me know what you think about it! Share it to your friends and learn new things together.
Transcript

Chapter 10Correlation and Regression
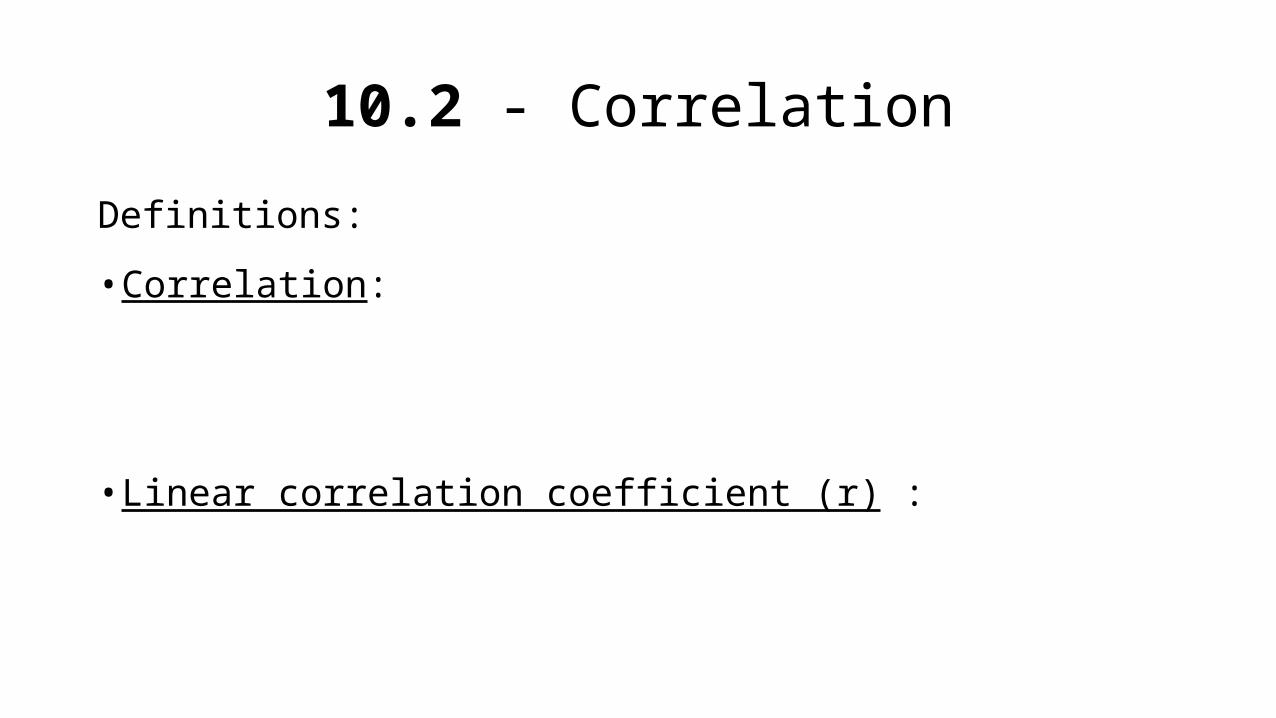
10.2 - Correlation
Definitions:
• Correlation:
• Linear correlation coefficient (r) :

Types of Correlation

Requirements for calculating r
1. The sample of paired (x,y) data is 2.
3. •
Notation: ρ – “rho” is
• Note: r and ρ are • •

Formulas for calculating r1.
(can go to STAT > CALC > 2-Var Stats to find )
2. (much harder to do by hand)
a) zx is the z score for the sample value x
b) zy is the z score for the sample value y
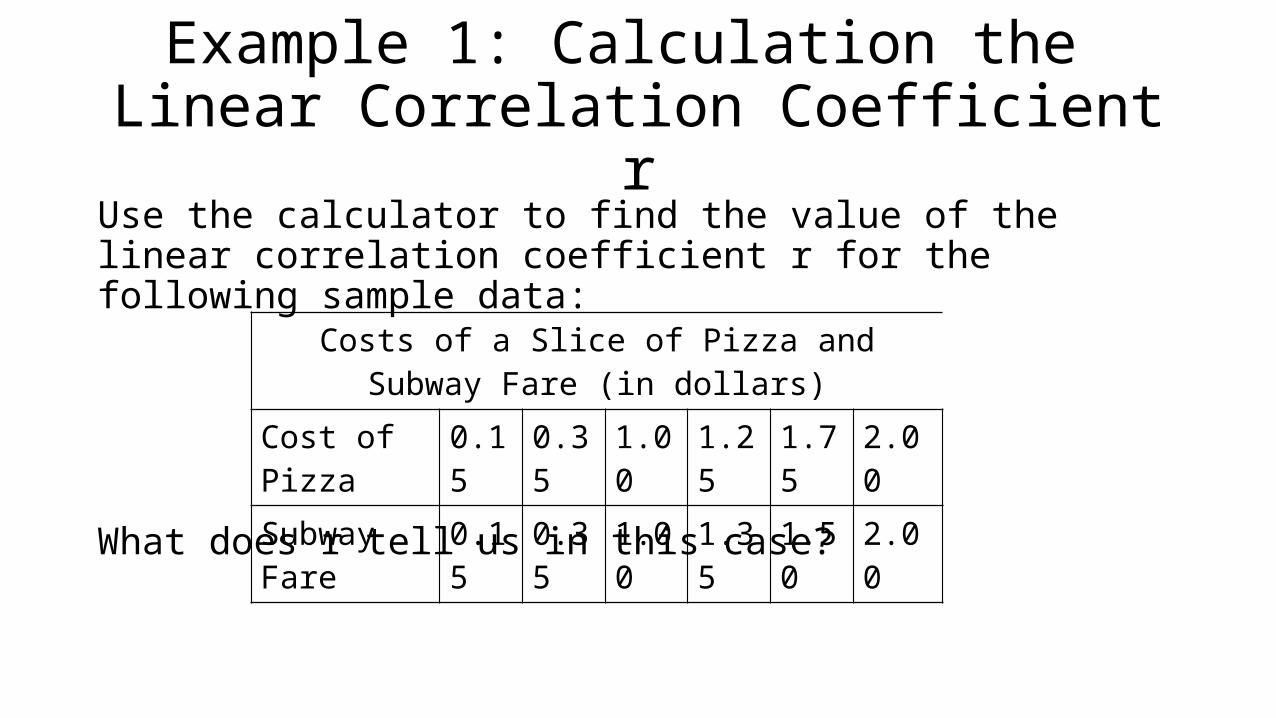
Example 1: Calculation the Linear Correlation Coefficient r
Use the calculator to find the value of the linear correlation coefficient r for the following sample data:
Costs of a Slice of Pizza and Subway Fare (in dollars)Cost of Pizza 0.15 0.35 1.00 1.25 1.75 2.00Subway Fare 0.15 0.35 1.00 1.35 1.50 2.00
What does r tell us in this case?
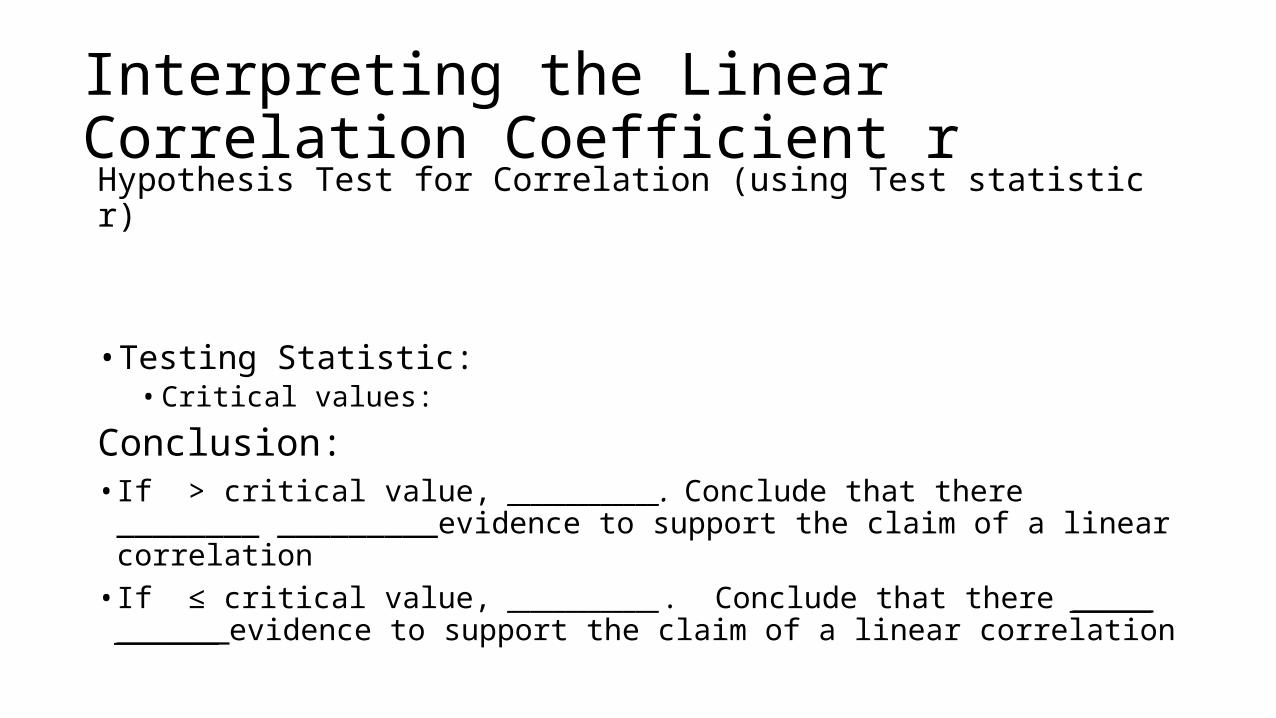
Interpreting the Linear Correlation Coefficient rHypothesis Test for Correlation (using Test statistic r)
• Testing Statistic: • Critical values:
Conclusion:• If > critical value, _____________. Conclude that there ________
_________evidence to support the claim of a linear correlation• If ≤ critical value, _____________. Conclude that there _______
_________ evidence to support the claim of a linear correlation
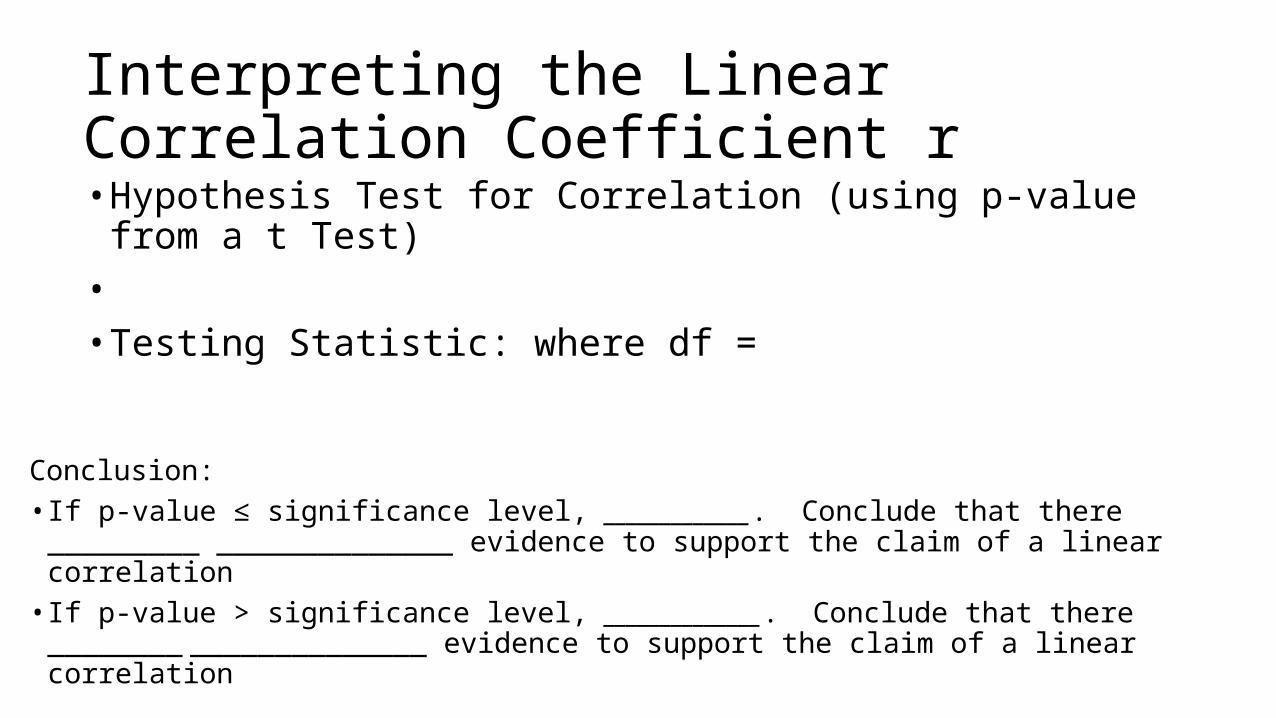
Interpreting the Linear Correlation Coefficient r• Hypothesis Test for Correlation (using p-value from a t Test)• • Testing Statistic: where df =
Conclusion:• If p-value ≤ significance level, _____________. Conclude that there _________
______________ evidence to support the claim of a linear correlation• If p-value > significance level, ______________. Conclude that there ________
______________ evidence to support the claim of a linear correlation
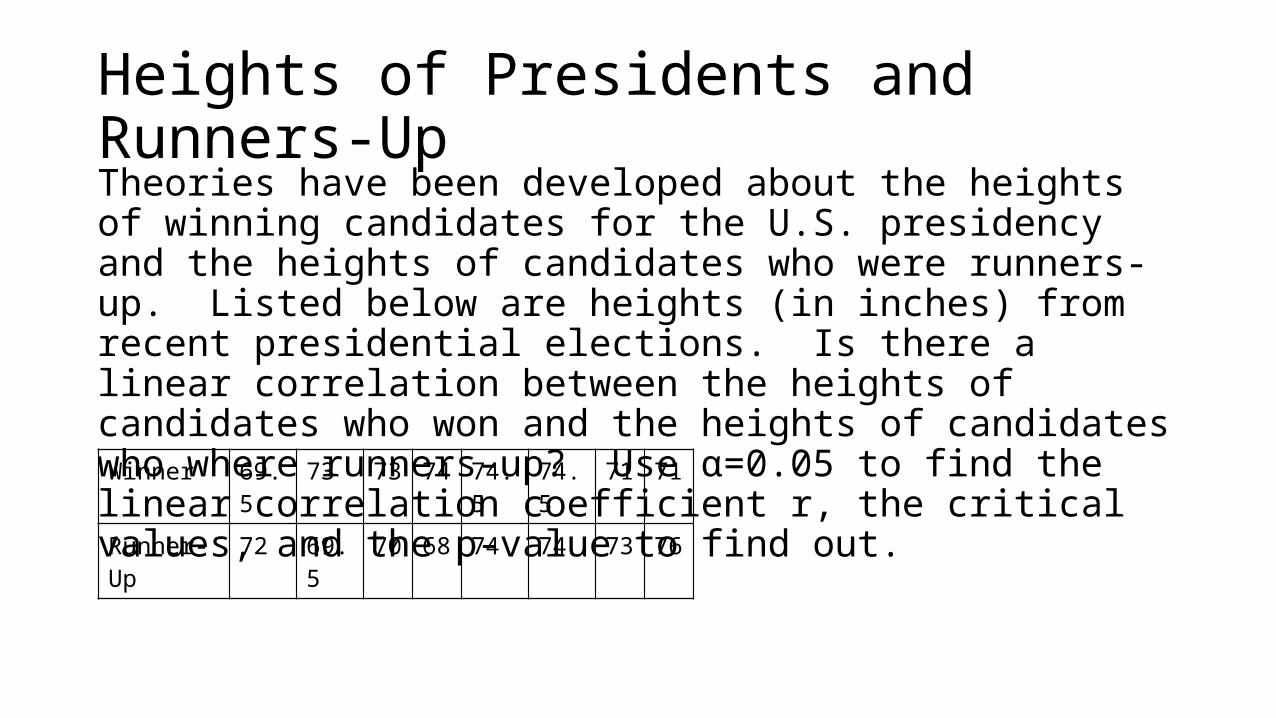
Heights of Presidents and Runners-UpTheories have been developed about the heights of winning candidates for the U.S. presidency and the heights of candidates who were runners-up. Listed below are heights (in inches) from recent presidential elections. Is there a linear correlation between the heights of candidates who won and the heights of candidates who where runners-up? Use α=0.05 to find the linear correlation coefficient r, the critical values, and the p-value to find out.Winner 69.5 73 73 74 74.5 74.5 71 71
Runner-Up 72 69.5 70 68 74 74 73 76
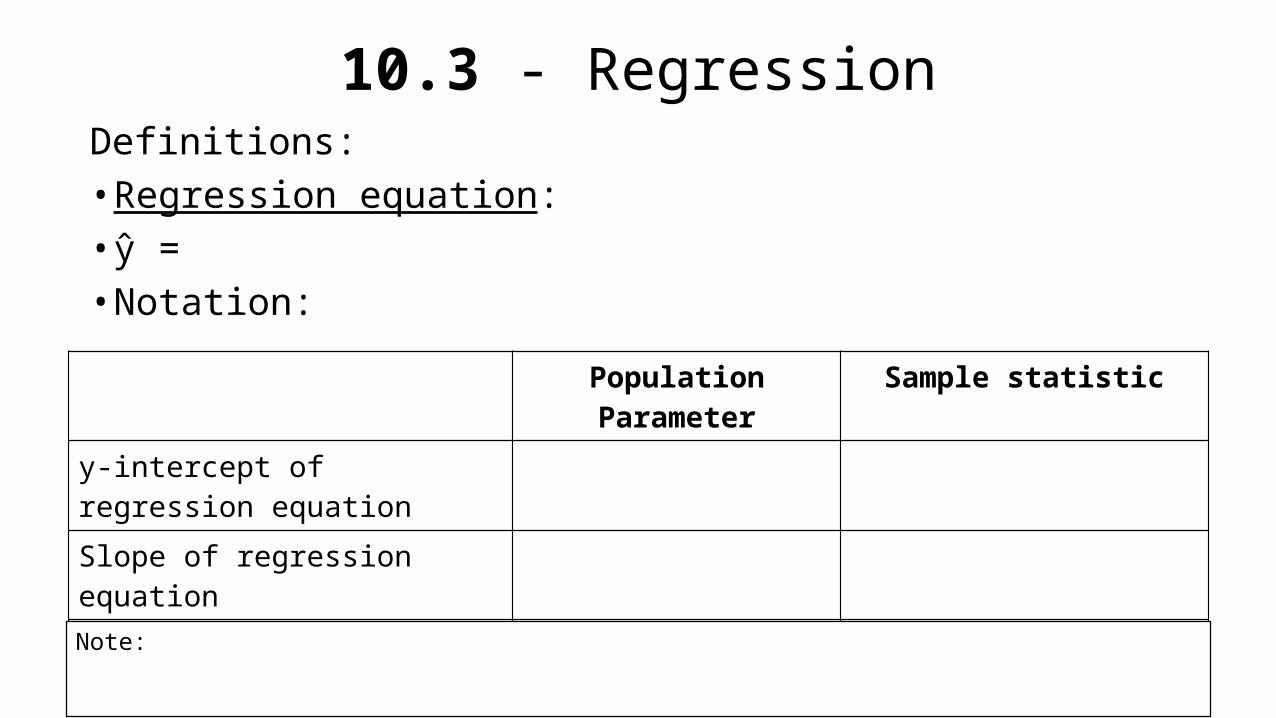
10.3 - RegressionDefinitions:• Regression equation: • ŷ = • Notation:
Population Parameter Sample statisticy-intercept of regression equation
Slope of regression equation
Equation of the regression line
Note:

Requirements and Formulas1. The sample of paired (x,y) data is
2.
3.
Slope:
y-intercept:
On the Calculator: Use
Predicting the value of y
1. Check the following to determine if the regression equation is a good model:a)
b) c)
2. If all of those are satisfied, then
3. Otherwise, if the equation is not a good model, then
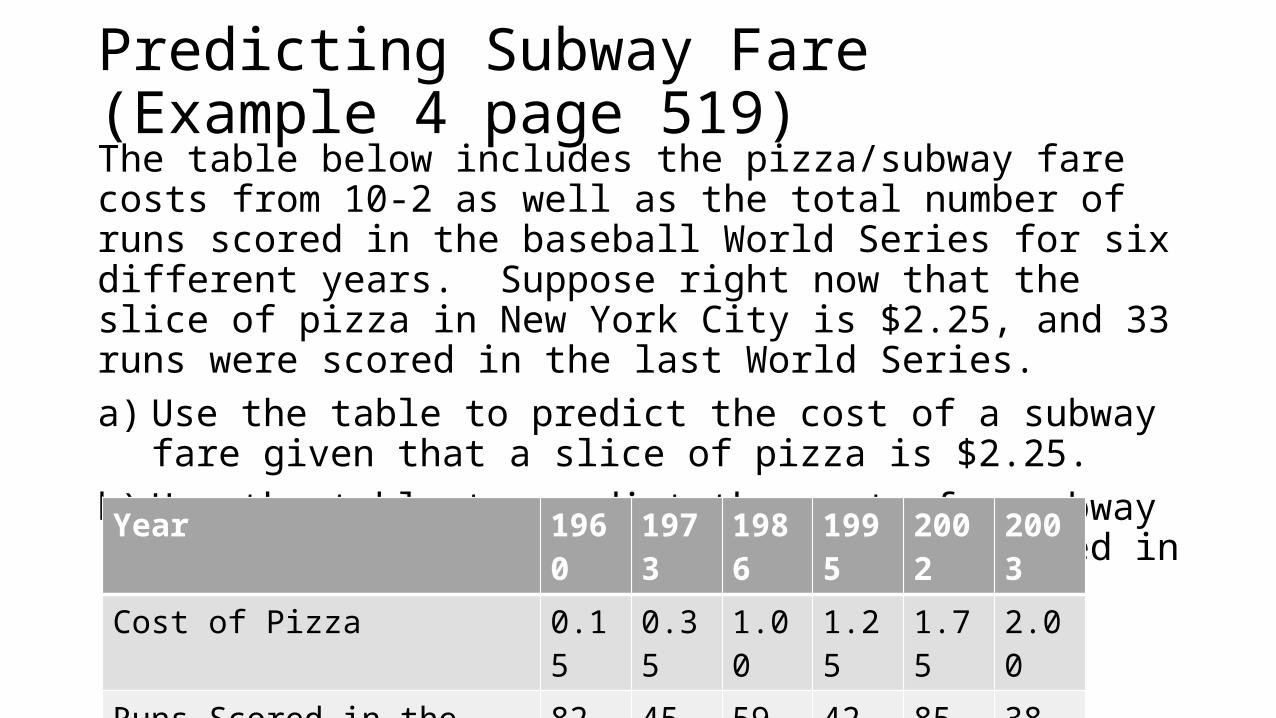
Predicting Subway Fare (Example 4 page 519)The table below includes the pizza/subway fare costs from 10-2 as well as the total number of runs scored in the baseball World Series for six different years. Suppose right now that the slice of pizza in New York City is $2.25, and 33 runs were scored in the last World Series.a) Use the table to predict the cost of a subway fare given that a slice
of pizza is $2.25.b) Use the table to predict the cost of a subway fare in a year in which
33 runs were scored in the World SeriesYear 1960 1973 1986 1995 2002 2003Cost of Pizza 0.15 0.35 1.00 1.25 1.75 2.00Runs Scored in the World Series 82 45 59 42 85 38Subway Fare 0.15 0.35 1.00 1.35 1.50 2.00
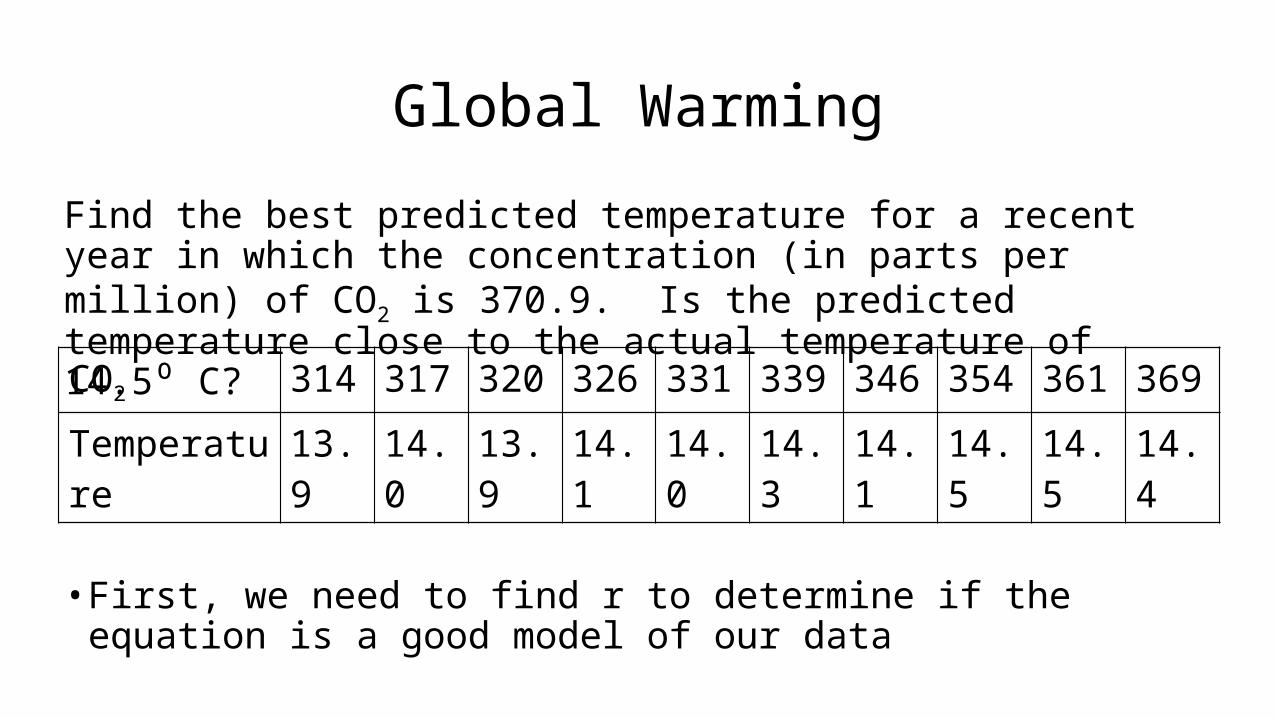
Global Warming
Find the best predicted temperature for a recent year in which the concentration (in parts per million) of CO2 is 370.9. Is the predicted temperature close to the actual temperature of 14.5⁰ C?
• First, we need to find r to determine if the equation is a good model of our data
CO2 314 317 320 326 331 339 346 354 361 369Temperature 13.9 14.0 13.9 14.1 14.0 14.3 14.1 14.5 14.5 14.4
Related Documents