Cement Outlook: 2007
World of Concrete
Las Vegas, Nevada
Edward J. Sullivan
Staff Vice President and PCA Chief Economist
For the Second Straight Year Awarded Most Accurate Forecaster (GDP) by the Chicago Federal Reserve

Economic Comfort Index *
1996=100
0.0
20.0
40.0
60.0
80.0
100.0
120.0
140.0
160.0
180.0
200.0
1980 1982 1984 1986 1988 1990 1992 1994 1996 1998 2000 2002 2004
•Combines Real GDP Against the Levels Interest Rates, Inflation and Unemployment
Most Favorable Economic Conditions Since the 1960’s

Economic Outlook
Snap Shot of Economic Activity
Investment15%
Government18%
Consumer69%
Consumption acts as the anchor for US economic activity.Consumption acts as the anchor for US economic activity.
Any retrenchment in consumer spending will lead to slower economy-wide growth rates

Consumer Worksheet
Pay Increase Averages 3.5%.Pay Increase Averages 3.5%. Health Insurance Premiums Rise 7%-11%.Health Insurance Premiums Rise 7%-11%.
State and Local Property Taxes Rise.State and Local Property Taxes Rise. Reassessments based on high home appreciationReassessments based on high home appreciation
Energy Prices Take a Large Bite.Energy Prices Take a Large Bite. Even in context of recent improvement.Even in context of recent improvement.
Inflation Running near 3%Inflation Running near 3%
Interest Rates Rising in Context of Record Consumer DebtInterest Rates Rising in Context of Record Consumer Debt
Tapping Home Equity Not as Viable As In the PastTapping Home Equity Not as Viable As In the Past Slowdown in Job CreationSlowdown in Job Creation
Consumer Growth Rate Under PressureConsumer Growth Rate Under Pressure

Economic Outlook
No “Bleeding” from Housing
Housing Threat
Real threat to economic growth not Real threat to economic growth not the decline in housing…..the decline in housing…..
But…..But…..
The way we financed the past The way we financed the past boom…boom…
And…And…
Its impact on consumer Its impact on consumer spending…..spending…..
Potentially more profound in Potentially more profound in historyhistory
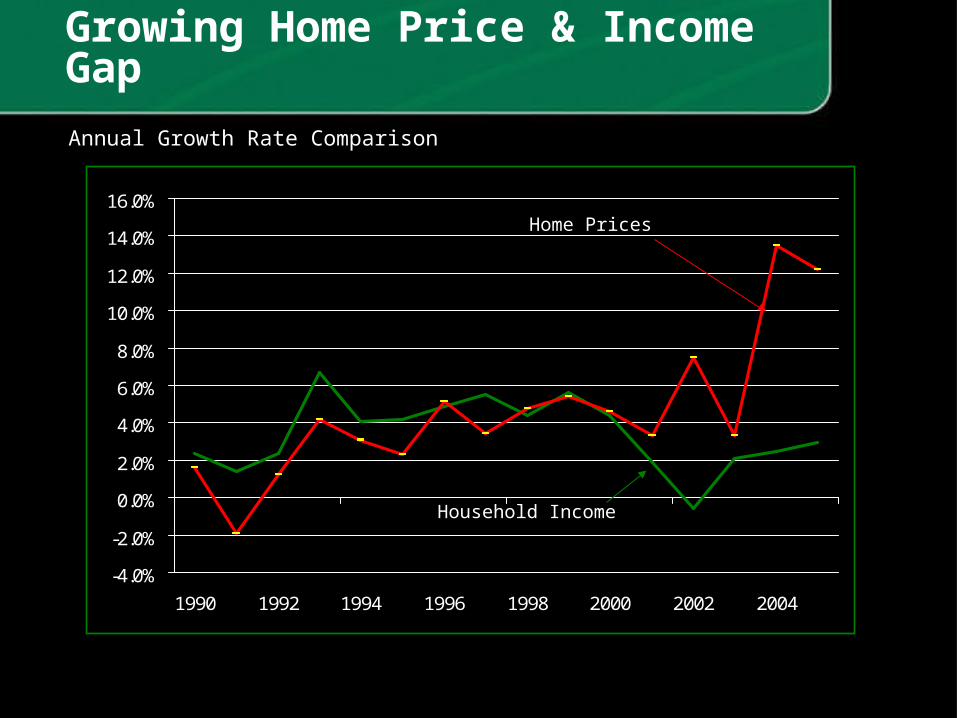
Growing Home Price & Income Gap
-4.0%
-2.0%
0.0%
2.0%
4.0%
6.0%
8.0%
10.0%
12.0%
14.0%
16.0%
1990 1992 1994 1996 1998 2000 2002 2004
Annual Growth Rate Comparison
Home Prices
Household Income
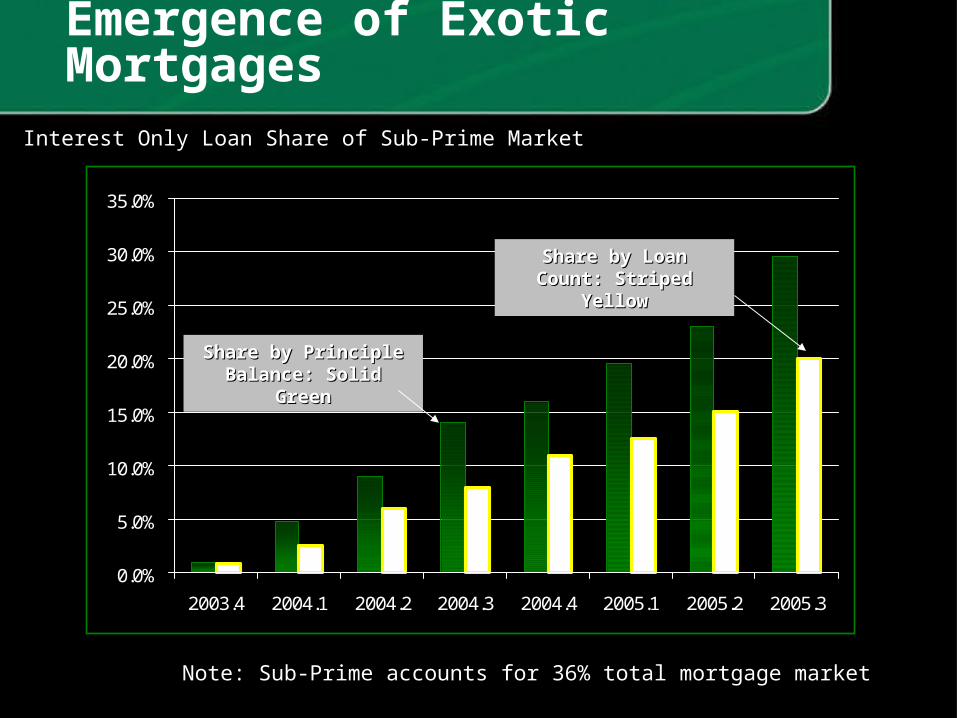
Emergence of Exotic Mortgages
0.0%
5.0%
10.0%
15.0%
20.0%
25.0%
30.0%
35.0%
2003.4 2004.1 2004.2 2004.3 2004.4 2005.1 2005.2 2005.3
Interest Only Loan Share of Sub-Prime Market
Share by Principle Share by Principle Balance: Solid GreenBalance: Solid Green
Share by Loan Count: Share by Loan Count: Striped YellowStriped Yellow
Note: Sub-Prime accounts for 36% total mortgage market

Sub-Prime Mortgage Resets
0
5,000
10,000
15,000
20,000
25,000
30,000
35,000
40,000
45,000
50,000
2000 2001 2002 2003 2004 2005 2006 2007 2008
Total Loans Scheduled for Reset
Period of Emerging Period of Emerging TroubleTrouble
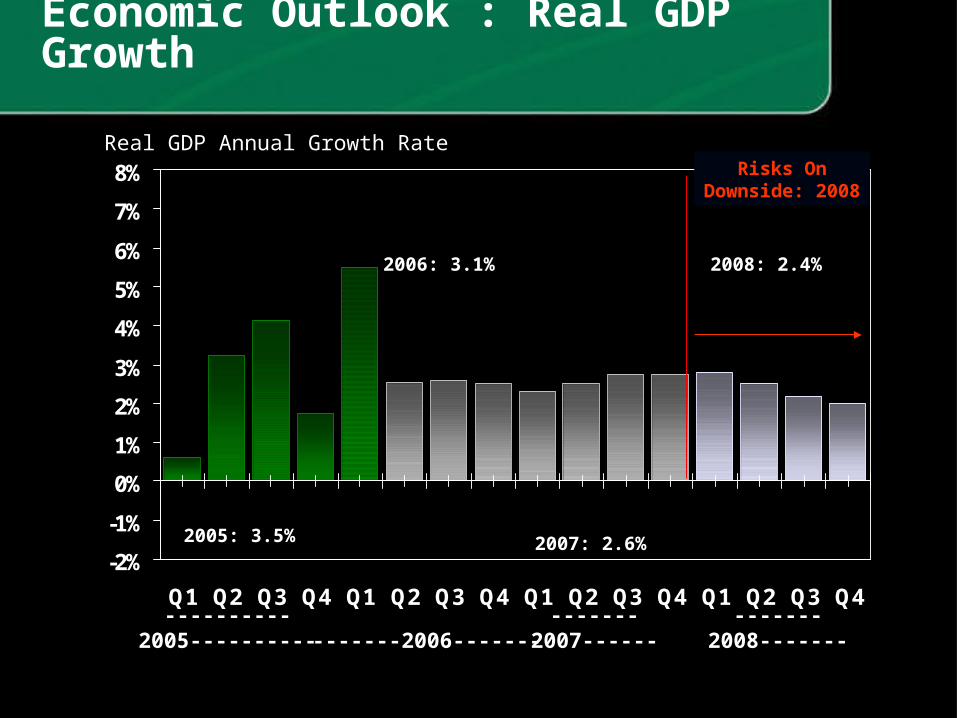
Economic Outlook : Real GDP Growth
-2%
-1%
0%
1%
2%
3%
4%
5%
6%
7%
8%
Q1 Q2 Q3 Q4 Q1 Q2 Q3 Q4 Q1 Q2 Q3 Q4 Q1 Q2 Q3 Q4
----------2005---------- -------2006------- -------2007------
2005: 3.5%
Real GDP Annual Growth Rate
-------2008-------
2006: 3.1%
2007: 2.6%
2008: 2.4%
Risks On Downside: 2008
Construction & Cement OutlookOverview
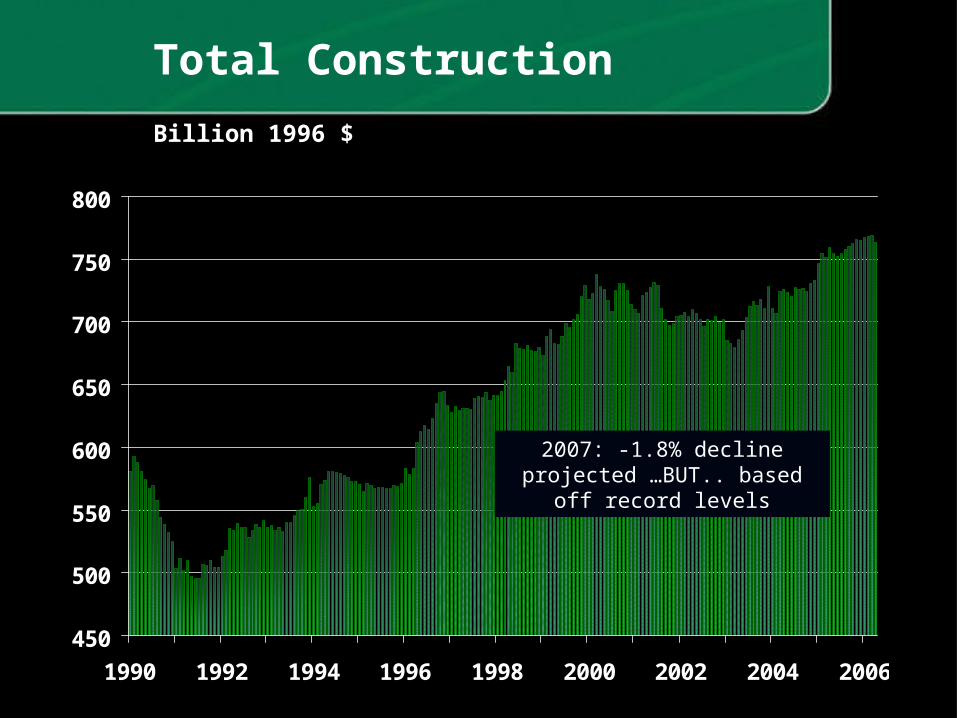
Total Construction
Billion 1996 $
450
500
550
600
650
700
750
800
1990 1992 1994 1996 1998 2000 2002 2004 2006
2007: -1.8% decline projected …BUT.. based off record levels
Cement Intensities

Composition Of Cement Growth: Construction Activity Vs Cement Intensity Growth
0%
1%
2%
3%
4%
5%
6%
7%
8%
2003 2004 2005
Cement Intensity Growth
Cement Intensity Growth
Cement Intensity Growth
Construction Activity Growth
Construction Activity Growth
Annual Percent Change, Real Put-In-Place Construction & Cement Intensity

Concrete: Run-up in Competing Material Prices
-10.0%
-5.0%
0.0%
5.0%
10.0%
15.0%
20.0%
25.0%
30.0%
35.0%
40.0%
6-Jan 6-Mar 6-May 6-Jul sept nov
Annual Percent Change, PPI, Bureau of Labor Statistics
Concrete
Asphalt
Steel

Concrete: Improving Competitive Position
-30.0%
-20.0%
-10.0%
0.0%
10.0%
20.0%
30.0%
40.0%
50.0%
2005 5-May 5-Sep 2006 6-May sept 6-Feb 6-Jun oct
Change Relative Price Vs Concrete
Asphalt
Steel
Rapid Improvement in Concrete’s Relative Pricing Position

Residential Construction Single Family

Strength in Starts More Than Low Rates…
The Cyclical Upside: 2001 - 2005The Cyclical Upside: 2001 - 2005
Low mortgage rates key factor in single family starts over past few years.Low mortgage rates key factor in single family starts over past few years. Emergence of exotic mortgages also a key factor…particularly in strong home Emergence of exotic mortgages also a key factor…particularly in strong home
appreciation environment.appreciation environment.
Easy credit conditions contributed to strong home-buying environment.Easy credit conditions contributed to strong home-buying environment. Speculators add froth to market in light of strong appreciation rates.Speculators add froth to market in light of strong appreciation rates.
The Cyclical Downside: 2006 - 2009The Cyclical Downside: 2006 - 2009 Mortgage rates rising.Mortgage rates rising. Exotic mortgages losing favor.Exotic mortgages losing favor.
Defaults and delinquencies cause a deterioration in credit quality and a Defaults and delinquencies cause a deterioration in credit quality and a tightening of credit conditionstightening of credit conditions
Speculators reduced/disappear in lower appreciation rate environmentSpeculators reduced/disappear in lower appreciation rate environment

Affordability Index
Most Affordable
Pacific
MountainWest North Central East North
Central
SouthAtlantic
East South
Central
West South Central
NewEngland
Middle Atlantic
Affordability Ratio
2nd Tier 3rd Tier 4th Tier Least Affordable

Profile: Single Family Buyer
Primary91%
Investment2%
Vacation7%
2000 Estimated 2006
Primary81%
Investment12%
Vacation7%
Coastal and Resort Areas: Double the National Average For Speculators
Note: Speculators Are 1st to Leave the Market
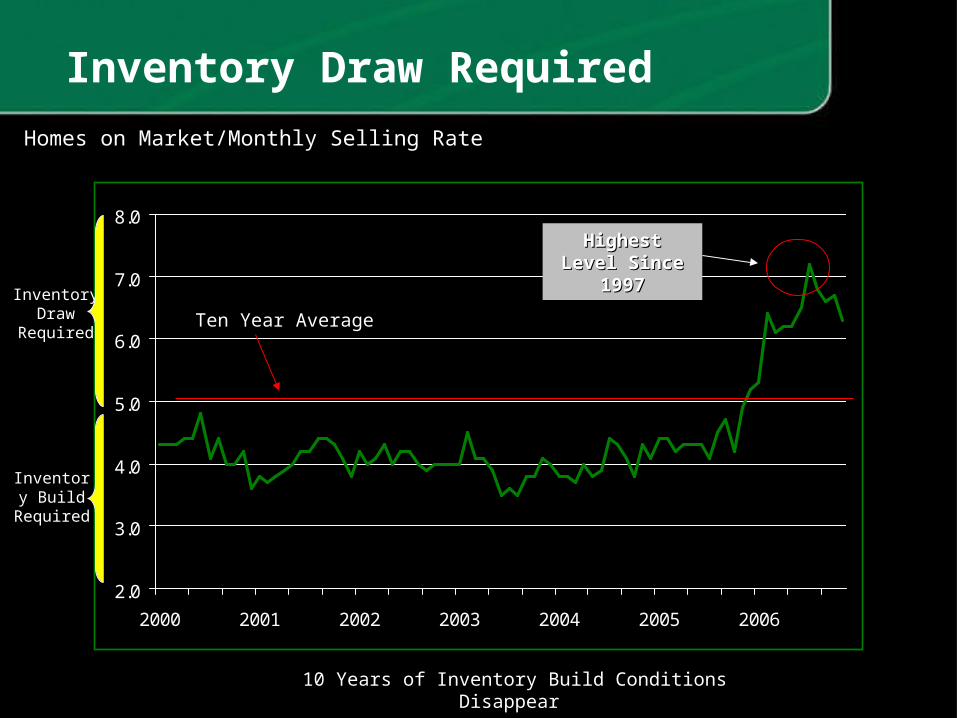
Inventory Draw Required
2.0
3.0
4.0
5.0
6.0
7.0
8.0
2000 2001 2002 2003 2004 2005 2006
Homes on Market/Monthly Selling Rate
Ten Year Average
Inventory Build
Required
Inventory Draw
Required
Highest Level Highest Level Since 1997Since 1997
10 Years of Inventory Build Conditions Disappear
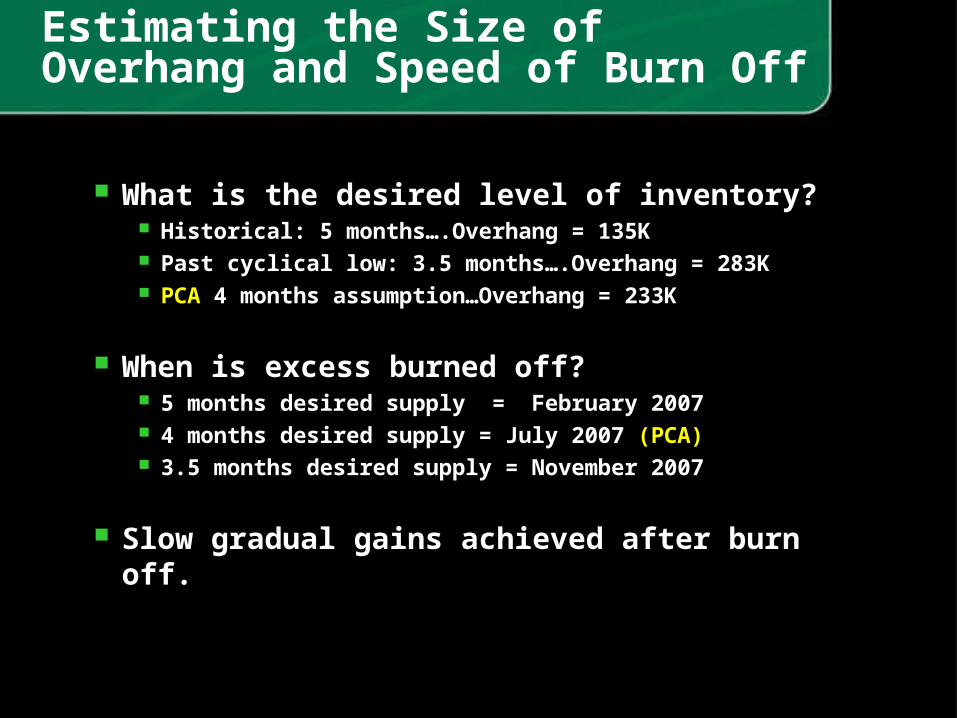
Estimating the Size of Overhang and Speed of Burn Off
What is the desired level of inventory?What is the desired level of inventory? Historical: 5 months….Overhang = 135K Historical: 5 months….Overhang = 135K Past cyclical low: 3.5 months….Overhang = 283KPast cyclical low: 3.5 months….Overhang = 283K PCAPCA 4 months assumption…Overhang = 233K 4 months assumption…Overhang = 233K
When is excess burned off?When is excess burned off? 5 months desired supply = February 20075 months desired supply = February 2007 4 months desired supply = July 2007 4 months desired supply = July 2007 (PCA)(PCA) 3.5 months desired supply = November 20073.5 months desired supply = November 2007
Slow gradual gains achieved after burn off.Slow gradual gains achieved after burn off.
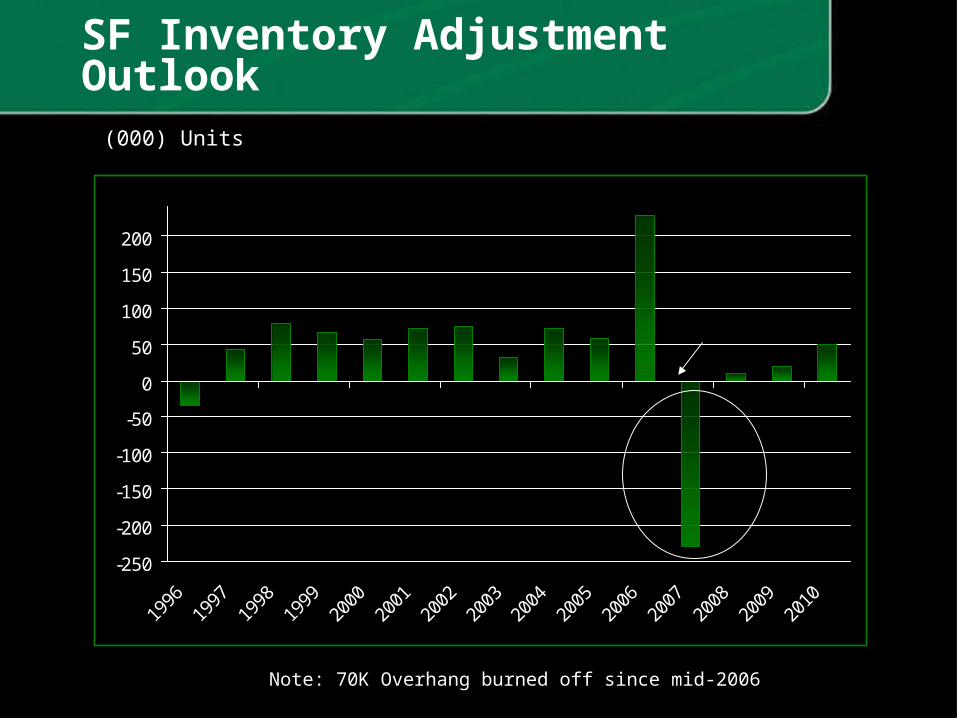
SF Inventory Adjustment Outlook
-250
-200
-150
-100
-50
0
50
100
150
200
1996
1997
1998
1999
2000
2001
2002
2003
2004
2005
2006
2007
2008
2009
2010
(000) Units
Note: 70K Overhang burned off since mid-2006

Nonresidential Construction
Overview

Nonresidential Outlook
20
40
60
80
100
120
140
160
180
200
Billion Dollars, Real 1996 $
Projected
Underlying nonresidential drivers Underlying nonresidential drivers improving. improving.
Despite large percentage gains for Despite large percentage gains for 2006, most markets weak from 2006, most markets weak from historical perspective.historical perspective.
Past cyclical peak not realized.Past cyclical peak not realized. Slower growth outlook depresses Slower growth outlook depresses
expected ROI and tempers expected ROI and tempers recovery.recovery.
High material costs reduce growth. High material costs reduce growth. Increasing cement intensities Increasing cement intensities
reinforce construction activity gains.reinforce construction activity gains.
Institutional nonresidential gaining Institutional nonresidential gaining momentum; less sensitive to slower momentum; less sensitive to slower growth environmentgrowth environment
Public Construction
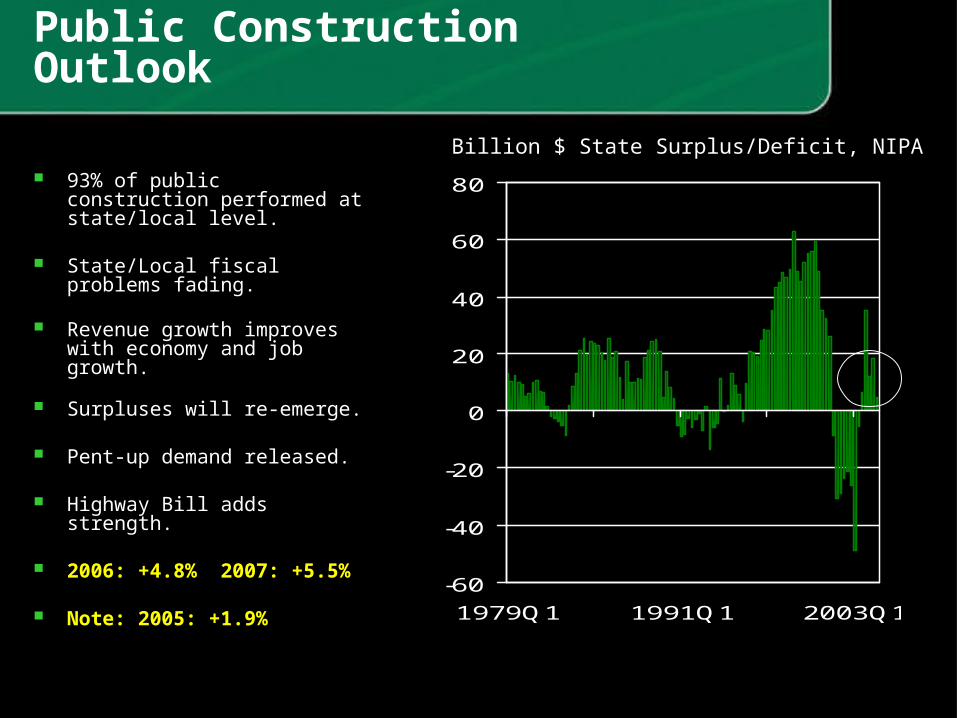
Public Construction Outlook
-60
-40
-20
0
20
40
60
80
1979Q1 1991Q1 2003Q1
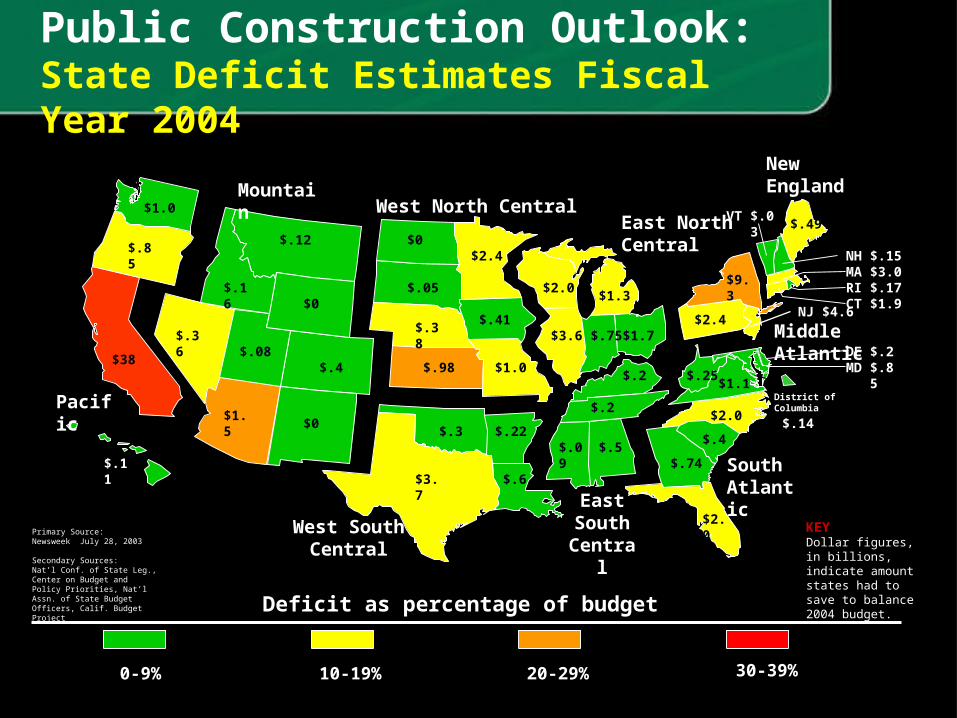
93% of public construction 93% of public construction performed at state/local level.performed at state/local level.
State/Local fiscal problems State/Local fiscal problems
fading.fading.
Revenue growth improves with Revenue growth improves with economy and job growth.economy and job growth.
Surpluses will re-emerge.Surpluses will re-emerge.
Pent-up demand released.Pent-up demand released. Highway Bill adds strength.Highway Bill adds strength. 2006: +4.8% 2007: +5.5%2006: +4.8% 2007: +5.5% Note: 2005: +1.9%Note: 2005: +1.9%
Billion $ State Surplus/Deficit, NIPA
MARI
NH
0-9% 20-29% 30-39%
Pacific
MountainWest North Central
East North Central
SouthAtlantic
East South
Central
District of Columbia
West South Central
NewEngland
Middle Atlantic
10-19%
Deficit as percentage of budget
$.85
$.11
$1.0
$.16$0
$.36
$.4 $.98
$0$1.5
$.05
$.38
$.3
$.12
$38
$3.7
$3.6
$.6
$.22
$.41
$1.0
$.09
$2.4$0
$2.0
$.75
$.5
$.49
$1.3
$1.7
$.2
$.2
$2.4
$9.3
$2.0
$.74
$4.6
$.14$.4
$.15$3.0$.17
$.85$.2
NJ$1.9CT
MDDE
VT
$.25$1.1
$2.0
$.03
$.08
Primary Source: Newsweek July 28, 2003
Secondary Sources:Nat’l Conf. of State Leg., Center on Budget and Policy Priorities, Nat’l Assn. of State Budget Officers, Calif. Budget Project
Dollar figures, in billions, indicate amount states had to save to balance 2004 budget.
KEY
Public Construction Outlook: State Deficit Estimates Fiscal Year 2004

MARI
NH
Public Construction Outlook: State Deficit Estimates Fiscal Year 2005
0-9% 20-29% 30-39%
Pacific
MountainWest North Central
East North Central
SouthAtlantic
East South
Central
District of Columbia
West South Central
NewEngland
Middle Atlantic
10-19%
Deficit as percentage of budget
$0
$0
$0
$0
$.3
$1.1
$.17
$15
$0
$2
$.5
$.34
$.71
$.19
$.0
$.6
$.62
$.17
$.9
$0
$5.1
$5
$.14
$0$1.5$.19
$.74
NJ$.2CT
MD$.93
$.8
Secondary Source: National Association of Budget Officers
Dollar figures, in billions, indicate amount states had to save to balance 2005 budget.
KEY
No availabledata
DE $0
$0
$.9
$0
$.6$.2
$.9
$0
$.21
$0
$0
$0
$.3
$0
$.5
$0
$0
VT $0
$.12
$0
Primary Source: Center on Budget Policy and Priorities Feb / 04

Market Conditions

No Shortage Tight Supplies
Cement Supply Survey Summer 2006
Spot Tight Supplies
$0
$10
$20
$30
$40
$50
$60
1/1/2001 1/1/2002 1/1/2003 1/1/2004 1/1/2005 1/1/2006
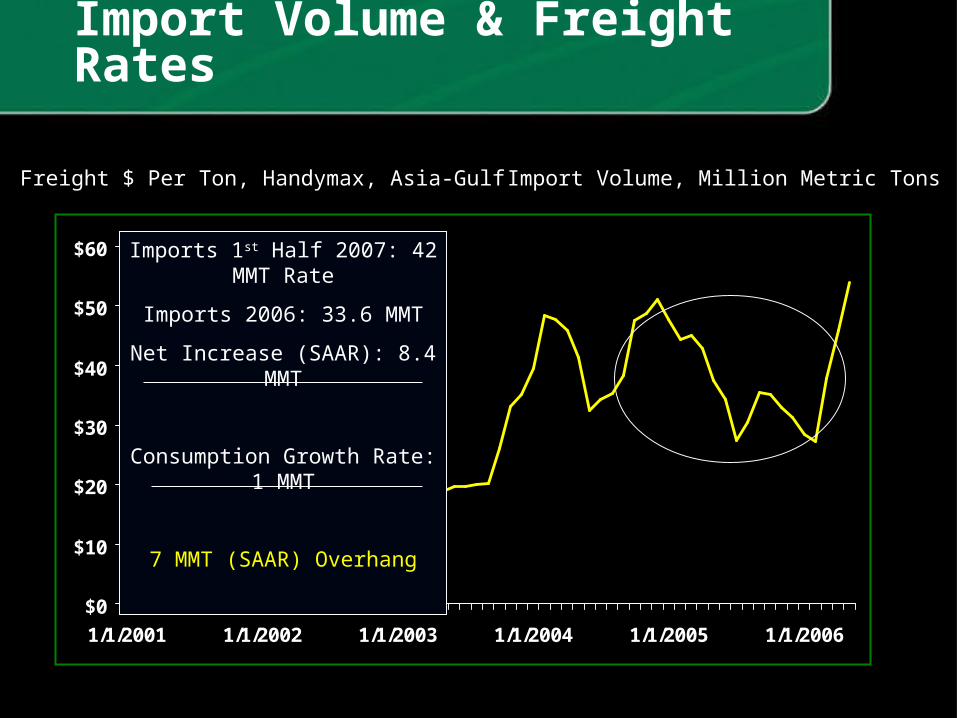
Import Volume & Freight Rates
Import Volume, Million Metric TonsFreight $ Per Ton, Handymax, Asia-Gulf
Imports 1st Half 2007: 42 MMT Rate
Imports 2006: 33.6 MMT
Net Increase (SAAR): 8.4 MMT
Consumption Growth Rate: 1 MMT
7 MMT (SAAR) Overhang
$0
$10
$20
$30
$40
$50
$60
1/1/2001 1/1/2002 1/1/2003 1/1/2004 1/1/2005 1/1/2006
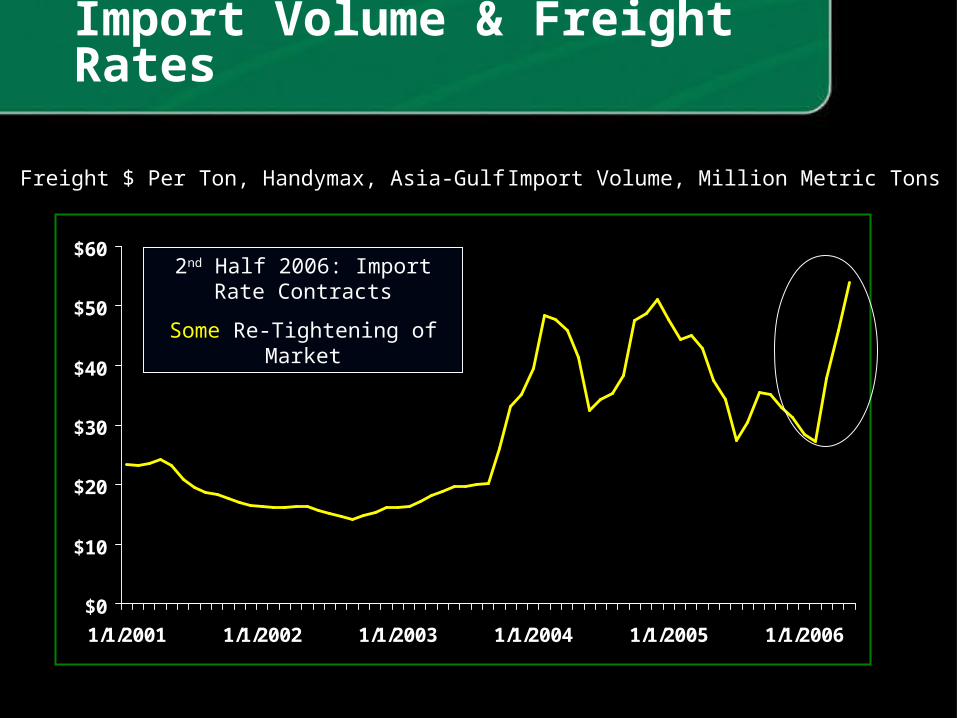
Import Volume & Freight Rates
Import Volume, Million Metric TonsFreight $ Per Ton, Handymax, Asia-Gulf
2nd Half 2006: Import Rate Contracts
Some Re-Tightening of Market

Conclusions
Cement Outlook: 2007
World of Concrete
Las Vegas, Nevada
Edward J. Sullivan
Staff Vice President and PCA Chief Economist
For the Second Straight Year Awarded Most Accurate Forecaster (GDP) by the Chicago Federal Reserve