CONSENSUS FORECAST AUSTRALIA 2 CALENDAR 11 NOTES 13 Contributors PUBLICATION DATE 28 April 2015 FORECASTS COLLECTED 21 April - 27 April 2015 INFORMATION AVAILABLE Up to and including 27 April 2015 NEXT EDITION 26 May 2015 Australia • May 2015 ARNE POHLMAN Chief Economist ARMANDO CICCARELLI Head of Research RICARDO ACEVES Senior Economist RICARD TORNÉ Senior Economist OLGA COSCODAN Economist CARL KELLY Economist TERESA KERSTING Economist DIRINA MANÇELLARI Economist ANGELA BOUZANIS Economist CECILIA SIMKIEVICH Economist ROBERT HILL Economist ERIC DENIS Economist MIRIAM DOWD Editor

Welcome message from author
This document is posted to help you gain knowledge. Please leave a comment to let me know what you think about it! Share it to your friends and learn new things together.
Transcript

CONSENSUS FORECAST
AUSTRALIA 2CALENDAR 11NOTES 13
Contributors
PUBLICATION DATE 28 April 2015FORECASTS COLLECTED 21 April - 27 April 2015
INFORMATION AVAILABLE Up to and including 27 April 2015 NEXT EDITION 26 May 2015
Australia • May 2015
ARNE POHLMAN Chief EconomistARMANDO CICCARELLI Head of ResearchRICARDO ACEVES Senior EconomistRICARD TORNÉ Senior EconomistOLGA COSCODAN Economist
CARL KELLY EconomistTERESA KERSTING EconomistDIRINA MANÇELLARI EconomistANGELA BOUZANIS EconomistCECILIA SIMKIEVICH Economist
ROBERT HILL Economist ERIC DENIS Economist MIRIAM DOWD Editor

FOCUSECONOMICS Australia
FocusEconomics Consensus Forecast | 2
May 2015
Outlook stable
2011-13 2014-16 2017-19Population (million): 22.7 23.9 24.8GDP (USD bn): 1,452 1,329 1,566GDP per capita (USD): 63,834 55,696 63,182GDP growth (%): 2.8 2.7 3.2Fiscal Balance (% of GDP): -3.0 -2.5 -1.4Public Debt (% of GDP): 25.8 32.7 34.7Inflation (%): 2.5 2.3 2.7Current Account (% of GDP): -3.5 -2.6 -1.4
The slowdown in China presents problems for Australia’s economy, which relies heavily on natural resources. Softened demand for commodities translates into decreased exports and investment, particularly in the mining sector. Meanwhile, The Reserve Bank of Australia’s (RBA) February rate cut has sparked renewed optimism in some sectors such as housing, as demonstrated by the jump in March’s business confidence reading, with gradual pass through into the wider economy. It is widely believed by analysts that the RBA’s rate cutting cycle will be gradual and protracted in an effort to rebalance the economy away from the resource sector. This has been exemplified by increased business confidence in sensitive sectors of the economy such as housing, although the impact on the wider economy is still nascent.
The Australian economy is expected to decelerate in 2015 due to weakened global demand for iron and coal. The challenge going forward will be to replace the mining sector’s contribution to GDP with other economic activities. FocusEconomics Consensus Forecast panelists expect GDP to expand 2.5% in 2015, which is unchanged from last month’s projection. For 2016, the panel expects growth to pick up to 2.9%.
Inflation fell to 1.3% in Q1 2015 from Q4’s 1.7%, which is below the RBA’s
target range of 2.0-3.0%. The RBA left the cash rate at 2.25% at its 7 April meeting. FocusEconomics Consensus Forecast panelists see inflation averaging 1.8% in 2015 and 2.6% in 2016.
REAL SECTOR | Retail sales accelerate slightly in FebruaryNominal retail sales rose 0.7% in February over the previous month in seasonally-adjusted terms, which was slightly above the revised 0.5% increase recorded in January (previously estimated: +0.4% month-on-month). The result just overshot the 0.4% increase that the markets had expected.
On a year-on-year basis, the pace of growth in retail sales rose from a 4.0% expansion in January to a 4.4% increase in February. Annual average growth in retail sales ticked down from January’s 5.1% to 5.0% in February.
The Reserve Bank of Australia (RBA) sees the economy expanding between 1.75% and 2.75% in 2015. For 2016, the RBA expects GDP growth to be between 2.50% and 3.50%. FocusEconomics Consensus Forecast panelists see the economy expanding 2.5% in 2015, which is unchanged from last month’s forecast. For 2016, the panel expects economic growth to accelerate to 2.9%.
REAL SECTOR | Unemployment rate continues to fall in MarchIn March, the labor market gained 37,700 jobs compared to the previous month in seasonally-adjusted terms. The increase was lower than February’s revised 42,000 jobs gain (previously reported: 15,600). March’s result came
Australia
Australia
LONG-TERM TRENDS | 3-year averages
Robert Hill Economist
Retail Sales | variation in %
Note: Month-on-month seasonally adjusted and annual variation of retail sales index in %.Source: Australia Bureau of Statistics and FocusEconomics calculations.
2.0
3.5
5.0
6.5
-1.0
0.0
1.0
2.0
Feb-13 Aug-13 Feb-14 Aug-14 Feb-15
Month-on-month s.a. (left scale)
Annual average (right scale)
%%

FOCUSECONOMICS Australia
FocusEconomics Consensus Forecast | 3
May 2015
in significantly above market expectations of a 15,000 gain. The increase was driven by a 31,500 increase in the number of new full-time positions, as well as a 6,100 rise in the number of new part-time positions.
Labor market participation ticked up to 64.8% in March from February’s 64.7% (previously reported: 64.6%). As a result of the job gains, the unemployment rate inched down to 6.1% from February’s 6.2% (previously reported: 6.3%).
FocusEconomics panelists expect the unemployment rate to average 6.4% in 2015, which is unchanged from last month’s forecast. In 2016, the panel expects the unemployment rate to inch down to 6.3%.
OUTLOOK | Business confidence recovers in MarchThe business sentiment index published by the National Australia Bank (NAB) jumped from zero points in February to three points in March. The indicator is now above the 0-point threshold, meaning that Australian businesses are optimistic regarding economic conditions in the coming months.
According to the NAB, all of the components of the index improved. As the Bank pointed out, “much of the improvement was driven by a particularly large jump in mining confidence (up 29), while outcomes in other industries were generally mixed.” Conversely, confidence deteriorated in the retail sector, which fell into negative territory for the first time since the middle of 2013.
FocusEconomics Consensus Forecast panelists see fixed investment contracting 1.7% in 2015, which is up 0.3 percentage points from last month’s forecast. For 2016, the panel sees investment contracting 0.2%.
OUTLOOK | Consumer confidence falls in April The Westpac-Melbourne Institute Survey of Consumer Sentiment fell from 99.5 points in March to 96.2 points in April. The indicator has now moved further below the 100-point threshold that separates optimistic from pessimistic territory.
April’s reading mainly reflected a decrease in consumer confidence ahead of the release of Australia’s budget period next month. As the institute pointed out, “with the Index entering the Budget period well below the key 100 level and with downward momentum we must recognise that confidence is again looking vulnerable heading into the Budget announcement next month.” Other factors contributing to the fall in the index included a hike in fuel prices, the fact that the Central Bank did not cut rates in March and high-profile coverage of the sharp fall in iron ore prices, Australia’s premier export commodity. All sub-indices saw a decrease in confidence apart from the “time to buy a major household item” index, which increased 5.9%.
FocusEconomics Consensus Forecast panelists see private consumption growing 2.7% in 2015, which is unchanged from last month’s forecast. In 2016, panelists see private consumption expanding 2.7%.
MONETARY SECTOR | Inflation eases in Q1In the first quarter of 2015, consumer prices were stable at the 0.2% recorded in Q4 2014 as market analyst had expected. The quarterly figure mainly reflected higher prices for domestic holiday travel and accommodation, tertiary education, and medical and hospital services. These price increases were partially offset by lower prices for fuel and fruit.
Labor Market
Note: Seasonally adjusted unemployment rate in % and new jobs in thousands.Source: Australian Bureau of Statistics.
5.0
5.5
6.0
6.5
7.0
-60
-30
0
30
60
Mar-13 Sep-13 Mar-14 Sep-14 Mar-15
New jobs - total (left scale)Unemployment rate (right scale)
%
Business Confidence
Note: Index of business sentiment; 0-point threshold indicates equal number of positive and negative responses. Source: National Australia Bank’s Monthly Business Survey.
-16
-8
0
8
16
Mar-12 Sep-12 Mar-13 Sep-13 Mar-14 Sep-14 Mar-15
Consumer Confidence
Note: Index of consumer sentiment; 100-point threshold indicates equal number of positive and negative responses.Source: Westpac - Melbourne Institute Survey of Consumer Sentiment.
90
95
100
105
110
115
Apr-12 Oct-12 Apr-13 Oct-13 Apr-14 Oct-14 Apr-15

FOCUSECONOMICS Australia
FocusEconomics Consensus Forecast | 4
May 2015
Annual inflation eased from 1.7% in Q4 to 1.3% in Q1, which marked the lowest reading since Q2 2012. Following the drop in annual inflation figures, annual average inflation declined from 2.5% in Q4 to 2.1% in Q1, marking the lowest rate that has been seen since Q2 2013.
FocusEconomics panelists expect that inflation will average 1.8% in 2015, which is unchanged from last month’s forecast. For 2016, panelists see average inflation of 2.6%.
MONETARY SECTOR | RBA leaves cash rate unchanged again in AprilThe Reserve Bank of Australia (RBA) decided to leave the cash rate unchanged at 2.25% for the second consecutive month at its 7 April meeting. The decision was in line with market expectations. The Bank had cut its cash rate for the first time in 20 months at its February meeting.
In its accompanying statement, the Bank stated that the global economy is continuing to grow at a moderate pace. While growth in the U.S. remains strong, growth in China is weak and is projected to continue to be sluggish this year. Regarding price developments, the RBA pointed out that the decline in commodity prices is a reflection of subdued global demand. However, the Bank also commented that, “much lower levels of energy prices will act to strengthen global output and temporarily to lower CPI inflation rates.”
In regard to the domestic economy, the RBA mentioned that the Australian economy is expected to continue growing below trend, dragged down by weak business capital expenditure. As a result, unemployment is expected to peak at a higher level than previously estimated. The Bank also noted that, “the Australian dollar has declined noticeably against a rising US dollar over the past year, though less so against a basket of currencies. Further depreciation seems likely, particularly given the significant declines in key commodity prices. A lower exchange rate is likely to be needed to achieve balanced growth in the economy.”
Finally, the Bank considered that, having eased monetary policy at February’s meeting, “it was appropriate to hold interest rates steady for the time being. Further easing of policy may be appropriate over the period ahead, in order to foster sustainable growth in demand and inflation consistent with the target. The Board will continue to assess the case for such action at forthcoming meetings.”
FocusEconomics Consensus Forecast panelists expect the cash rate to end 2015 at 2.00% and to rise to 2.32% at the end of 2016.
RBA Cash Rate | in %
Note: RBA Cash Rate in %.Source: Reserve Bank of Australia (RBA).
2.0
3.0
4.0
5.0
Jan-10 Jul-10 Jan-11 Jul-11 Jan-12 Jul-12 Jan-13 Jul-13 Jan-14 Jul-14 Jan-15
%
Inflation | Consumer Price Index
Note: Year-on-year and quarter-on-quarter variation of consumer price indexin %.Source: Australian Bureau of Statistics.
0.0
1.0
2.0
3.0
4.0
0.0
0.5
1.0
1.5
2.0
Q1 2011 Q1 2012 Q1 2013 Q1 2014 Q1 2015
Quarter-on-quarter (left scale)
Year-on-year (right scale)
%%

FOCUSECONOMICS Australia
FocusEconomics Consensus Forecast | 5
May 2015
Economic Indicators | 2010 - 2019
Annual Data 2010 2011 2012 2013 2014 2015 2016 2017 2018 2019Real Sector Population (million) 22.2 22.5 22.9 23.3 23.6 23.9 24.2 24.5 24.8 25.1GDP per capita (USD) 56,330 66,684 67,871 64,453 61,186 52,530 53,371 57,748 63,551 68,246GDP (USD bn) 1,249 1,502 1,556 1,502 1,443 1,254 1,289 1,413 1,574 1,711GDP per capita (AUD) 61,242 64,597 65,538 66,563 67,796 71,217 74,269 77,555 81,088 84,942GDP (AUD bn) 1,358 1,455 1,502 1,552 1,599 1,667 1,760 1,861 1,970 2,089Economic Growth (Nominal GDP, ann. var. in %) 8.0 7.1 3.3 3.3 3.1 4.3 5.5 5.7 5.9 6.1Economic Growth (GDP, ann. var. in %) 2.3 2.7 3.6 2.1 2.7 2.5 2.9 3.1 3.1 3.3Private Consumption (ann. var. in %) 3.3 3.1 2.5 1.7 2.5 2.7 2.7 2.7 2.8 2.9Fixed Investment (ann. var. in %) 4.1 7.3 8.9 -2.1 -2.1 -1.7 -0.2 1.3 1.8 2.0Exports (G&S, ann. var. in %) 5.8 0.1 6.0 6.2 6.7 6.5 7.7 6.6 5.4 5.3Imports (G&S, ann. var. in %) 15.2 11.0 6.2 -1.8 -1.7 -1.0 2.8 3.2 3.5 3.5Industrial Production (annual variation in %) 4.6 1.1 3.4 2.1 4.2 2.5 3.0 3.0 2.9 2.9Retail Sales (annual variation in %) 2.5 2.6 3.4 3.2 5.3 - - - - -Unemployment (% of active population, aop) 5.2 5.1 5.2 5.6 6.1 6.4 6.3 5.9 5.6 5.5Fiscal Balance (% of GDP) -4.2 -3.3 -2.7 -1.9 -3.0 -2.4 -2.0 -1.8 -1.4 -1.1Public Debt (% of GDP) 20.5 24.2 27.9 30.7 34.3 32.1 31.8 34.8 34.7 34.7Monetary and Financial Sector Money (annual variation of M1 in %) 8.5 0.2 3.2 10.0 7.2 - - - - -Inflation (CPI, annual variation in %, eop) 2.8 3.0 2.2 2.8 1.7 - - - - -Inflation (CPI, annual variation in %, aop) 2.9 3.3 1.8 2.5 2.5 1.8 2.6 2.6 2.7 2.7Inflation (PPI, annual variation in %, aop) 1.4 3.0 1.2 1.6 1.7 - - - - -RBA Cash Rate (%, eop) 4.75 4.25 3.00 2.50 2.50 2.00 2.32 2.78 2.89 3.1990-Day Bank Bill (%, eop) 5.03 4.51 3.11 2.61 2.75 2.30 2.70 3.55 3.98 4.6210-Year Bond Yield (%, eop) 5.51 3.67 3.27 4.23 2.81 2.76 3.47 3.80 4.06 4.20Stock Market (variation of ASX in %) -0.7 -15.2 13.5 14.8 0.7 - - - - -Exchange Rate (USD per AUD, eop) 1.02 1.02 1.04 0.89 0.82 0.73 0.74 0.78 0.82 0.82Exchange Rate (USD per AUD, aop) 0.92 1.03 1.04 0.97 0.90 0.75 0.73 0.76 0.80 0.82External Sector Current Account Balance (% of GDP) -3.6 -2.9 -4.3 -3.3 -2.9 -2.8 -2.2 -1.7 -1.2 -1.1Current Account Balance (USD bn) -44.4 -43.9 -66.3 -50.0 -41.7 -34.9 -29.0 -24.2 -19.4 -19.6Trade Balance (USD bn) 19.0 35.9 6.2 20.8 12.4 - - - - - Quarterly Data Q3 14 Q4 14 Q1 15 Q2 15 Q3 15 Q4 15 Q1 16 Q2 16 Q3 16 Q4 16Economic Growth (GDP, ann. var. in %) 2.7 2.5 2.3 2.4 2.6 2.8 2.9 2.9 2.9 2.9Economic Growth (GDP, s.a. qoq var. in %) 0.4 0.6 - - - - - - - -Retail Sales (annual variation in %) 3.4 3.6 - - - - - - - -Unemployment (% of active population, eop) 6.2 6.1 6.1 6.4 6.5 6.6 6.2 6.2 6.1 6.1Inflation (CPI, annual variation in %, aop) 2.3 1.7 1.3 1.7 1.8 2.3 2.6 2.7 2.8 2.8RBA Cash Rate (%, eop) 2.50 2.50 2.25 2.08 2.03 2.00 2.08 2.16 2.29 2.3290-Day Bank Bill (%, eop) 2.66 2.75 2.30 2.25 2.25 2.30 2.46 2.60 2.62 2.7010-Year Bond Yield (%, eop) 3.48 2.81 2.32 2.58 2.67 2.76 3.08 3.26 3.36 3.47Exchange Rate (USD per AUD, eop) 0.88 0.82 0.76 0.74 0.74 0.73 0.73 0.74 0.74 0.74 Monthly Data Jul-14 Aug-14 Sep-14 Oct-14 Nov-14 Dec-14 Jan-15 Feb-15 Mar-15 Apr-15Retail Sales (mom variation in %) 0.4 0.1 1.3 0.3 0.1 0.1 0.5 0.7 - -Unemployment (% of active population) 6.3 6.1 6.2 6.3 6.2 6.1 6.3 6.2 6.1 -Consumer Sent. Index (100-point threshold) 94.9 98.5 94.0 94.8 96.6 91.1 93.2 100.7 99.5 96.2Business Confidence Index (0-point threshold) 9 8 6 5 2 2 3 0 3 -Exchange Rate (USD per AUD, eop) 0.93 0.93 0.88 0.88 0.85 0.82 0.78 0.78 0.76 -

FOCUSECONOMICS Australia
FocusEconomics Consensus Forecast | 6
May 2015
Real Sector | Gross Domestic Product
1 | Real GDP | 2000 - 2019 | var. in %
3 | GDP 2015 | evolution of forecasts
5 | Consumption | variation in % 6 | Consumption | evolution of fcst
2 | Real GDP | Q1 12-Q4 16 | var. in % Real GDP growth in %
4 | GDP 2016 | evolution of forecasts
Notes and sources
General: Long-term chart period from 2000 to 2019 unless otherwise stated. All real sector data are from the Australian Bureau of Statistics (ABS). Forecasts based on FocusEconomics Consensus Forecast. 1 GDP, annual variation in %. 2 Quarterly GDP (not seasonally adjusted), year-on-year variation in %. 3 GDP, evolution of 2015 forecasts during the last 18 months.4 GDP, evolution of 2016 forecasts during the last 18 months.5 Private consumption, annual variation in %. 6 Private consumption, evolution of 2015 and 2016 forecasts during the last 18 months.7 Gross fixed investment, annual variation in %. 8 Unemployment, % of active population. 9 Balance of non-financial public sector as % of GDP. 10 Gross fixed investment, evolution of 2015 and 2016 during the last 18 months.11 Unemployment, evolution of 2015 and 2016 forecasts during the last 18 months.12 Balance of non-financial public sector as % of GDP, evolution of 2015 and 2016 forecasts
during the last 18 months.
-3
0
3
6
2000 2005 2010 2015
Australia World1
2
3
4
5
Q1 12 Q1 13 Q1 14 Q1 15 Q1 16
1
2
3
4
5
Dec Mar Jun Sep Dec Mar
MaximumConsensusMinimum
1
2
3
4
Dec Mar Jun Sep Dec Mar
MaximumConsensusMinimum
2.4
2.7
3.0
3.3
3.6
Dec Mar Jun Sep Dec Mar
2015 2016
0
2
4
6
2000 2005 2010 2015
Individual Forecasts 2015 2016ANZ 2.4 3.0BMI Research 2.3 2.3BofA Merrill Lynch 2.4 2.8Capital Economics 2.0 2.0Citigroup Global Mkts 2.4 3.0Commerzbank 2.5 2.8Credit Agricole 2.8 -Credit Suisse 2.8 3.2DekaBank 2.0 2.8Deutsche Bank 2.7 3.4EIU 2.9 3.1Goldman Sachs 2.3 3.5HSBC 2.6 3.0ING 2.5 3.1JPMorgan 2.8 3.2Morgan Stanley 2.1 2.4National Australia Bank 2.4 3.2Nomura 2.2 2.5Oxford Economics 2.7 2.8RBC Capital Markets 2.4 2.8Scotiabank 2.8 2.8Standard Chartered 2.6 3.2UBS 2.2 2.8United Overseas Bank 2.5 3.0SummaryMinimum 2.0 2.0Maximum 2.9 3.5Median 2.5 3.0Consensus 2.5 2.9History30 days ago 2.5 3.060 days ago 2.6 3.090 days ago 2.6 3.0Additional ForecastsCentral Bank (Feb. 2015) 1.75-2.75 2.5-3.5IMF (Apr. 2015) 2.9 3.0OECD (Nov. 2014) 2.5 3.0
FOCUSECONOMICS Australia
FocusEconomics Consensus Forecast | 7
May 2015
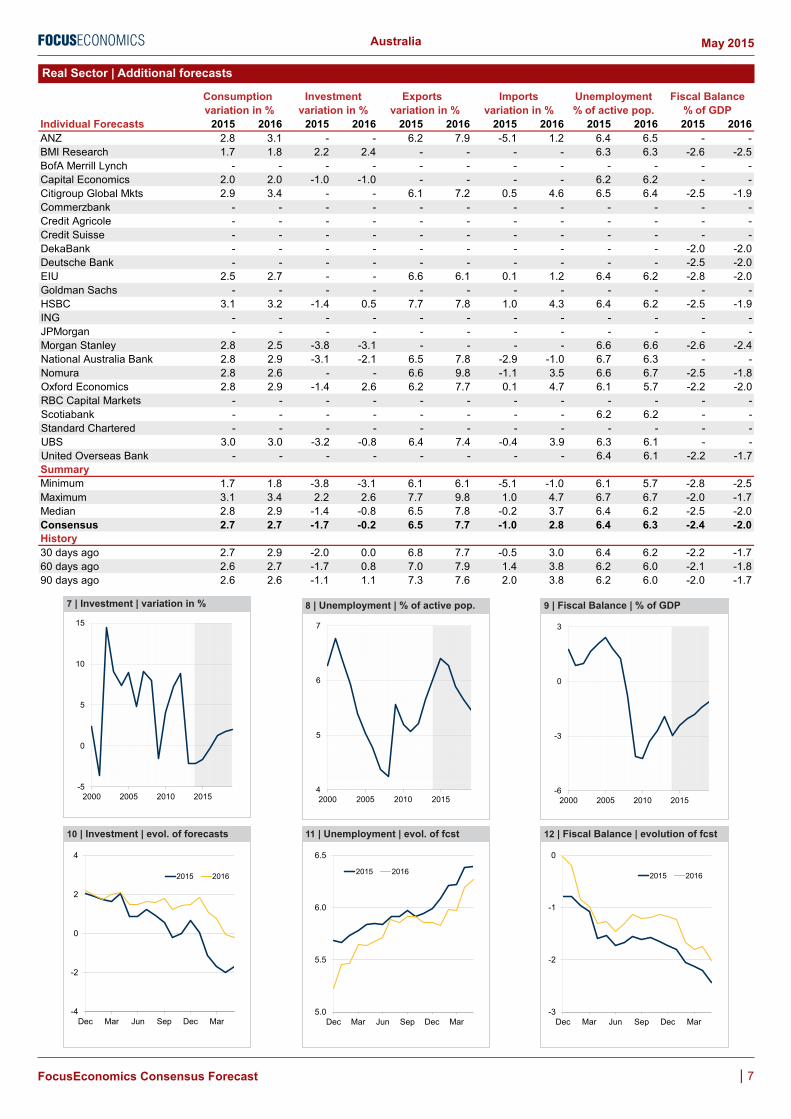
Real Sector | Additional forecasts
Individual Forecasts 2015 2016 2015 2016 2015 2016 2015 2016 2015 2016 2015 2016ANZ 2.8 3.1 - - 6.2 7.9 -5.1 1.2 6.4 6.5 - -BMI Research 1.7 1.8 2.2 2.4 - - - - 6.3 6.3 -2.6 -2.5BofA Merrill Lynch - - - - - - - - - - - -Capital Economics 2.0 2.0 -1.0 -1.0 - - - - 6.2 6.2 - -Citigroup Global Mkts 2.9 3.4 - - 6.1 7.2 0.5 4.6 6.5 6.4 -2.5 -1.9Commerzbank - - - - - - - - - - - -Credit Agricole - - - - - - - - - - - -Credit Suisse - - - - - - - - - - - -DekaBank - - - - - - - - - - -2.0 -2.0Deutsche Bank - - - - - - - - - - -2.5 -2.0EIU 2.5 2.7 - - 6.6 6.1 0.1 1.2 6.4 6.2 -2.8 -2.0Goldman Sachs - - - - - - - - - - - -HSBC 3.1 3.2 -1.4 0.5 7.7 7.8 1.0 4.3 6.4 6.2 -2.5 -1.9ING - - - - - - - - - - - -JPMorgan - - - - - - - - - - - -Morgan Stanley 2.8 2.5 -3.8 -3.1 - - - - 6.6 6.6 -2.6 -2.4National Australia Bank 2.8 2.9 -3.1 -2.1 6.5 7.8 -2.9 -1.0 6.7 6.3 - -Nomura 2.8 2.6 - - 6.6 9.8 -1.1 3.5 6.6 6.7 -2.5 -1.8Oxford Economics 2.8 2.9 -1.4 2.6 6.2 7.7 0.1 4.7 6.1 5.7 -2.2 -2.0RBC Capital Markets - - - - - - - - - - - -Scotiabank - - - - - - - - 6.2 6.2 - -Standard Chartered - - - - - - - - - - - -UBS 3.0 3.0 -3.2 -0.8 6.4 7.4 -0.4 3.9 6.3 6.1 - -United Overseas Bank - - - - - - - - 6.4 6.1 -2.2 -1.7SummaryMinimum 1.7 1.8 -3.8 -3.1 6.1 6.1 -5.1 -1.0 6.1 5.7 -2.8 -2.5Maximum 3.1 3.4 2.2 2.6 7.7 9.8 1.0 4.7 6.7 6.7 -2.0 -1.7Median 2.8 2.9 -1.4 -0.8 6.5 7.8 -0.2 3.7 6.4 6.2 -2.5 -2.0Consensus 2.7 2.7 -1.7 -0.2 6.5 7.7 -1.0 2.8 6.4 6.3 -2.4 -2.0History30 days ago 2.7 2.9 -2.0 0.0 6.8 7.7 -0.5 3.0 6.4 6.2 -2.2 -1.760 days ago 2.6 2.7 -1.7 0.8 7.0 7.9 1.4 3.8 6.2 6.0 -2.1 -1.890 days ago 2.6 2.6 -1.1 1.1 7.3 7.6 2.0 3.8 6.2 6.0 -2.0 -1.7
Unemployment Fiscal Balance% of active pop. % of GDP
Consumption Investment Exports Imports variation in % variation in % variation in % variation in %
7 | Investment | variation in %
10 | Investment | evol. of forecasts
-5
0
5
10
15
2000 2005 2010 2015
-4
-2
0
2
4
Dec Mar Jun Sep Dec Mar
2015 2016
9 | Fiscal Balance | % of GDP
12 | Fiscal Balance | evolution of fcst
8 | Unemployment | % of active pop.
11 | Unemployment | evol. of fcst
4
5
6
7
2000 2005 2010 2015-6
-3
0
3
2000 2005 2010 2015
-3
-2
-1
0
Dec Mar Jun Sep Dec Mar
2015 2016
5.0
5.5
6.0
6.5
Dec Mar Jun Sep Dec Mar
2015 2016

FOCUSECONOMICS Australia
FocusEconomics Consensus Forecast | 8
May 2015
Monetary Sector | Inflation, Interest Rates and Exchange Rate
16 | Inflation 2015 | evolution of fcst 17 | Inflation 2016 | evolution of fcst 18 | RBA Cash Rate | evol. of fcst
0
1
2
3
4
Dec Mar Jun Sep Dec Mar
MaximumConsensusMinimum
1
2
3
4
Dec Mar Jun Sep Dec Mar
MaximumConsensusMinimum
1.5
2.3
3.0
3.8
4.5
Dec Mar Jun Sep Dec Mar
2015 2016
Individual Forecasts 2015 2016 2015 2016 2015 2016 2015 2016ANZ 1.7 2.9 2.00 2.00 2.10 3.25 0.72 0.70BMI Research 2.1 2.3 2.00 2.00 - - 0.72 0.68BofA Merrill Lynch 1.8 2.9 2.13 2.52 - - 0.77 0.75Capital Economics 1.0 2.0 2.50 2.50 - - 0.75 0.75Citigroup Global Mkts 1.9 2.9 1.94 2.00 2.90 - 0.70 -Commerzbank 2.0 2.7 2.00 - 3.00 - 0.73 -Credit Agricole 2.5 - - - - - 0.76 0.81Credit Suisse 1.8 3.0 - - - - - -DekaBank 1.8 2.4 2.00 2.75 2.80 3.55 0.77 0.75Deutsche Bank 1.1 2.0 2.00 2.00 2.75 3.00 0.73 0.69EIU 1.8 2.8 - - - - 0.77 0.86Goldman Sachs 2.3 2.7 - - - - - -HSBC 1.8 2.8 2.00 2.00 2.30 2.60 0.72 0.70ING 1.5 2.6 2.00 2.75 3.10 4.40 0.71 0.68JPMorgan 2.0 2.6 2.00 - - - 0.72 -Morgan Stanley 1.6 3.0 1.75 2.50 2.90 - 0.68 0.62National Australia Bank - - 2.00 2.50 2.75 3.35 0.74 0.75Nomura 1.5 2.5 2.00 2.50 3.05 3.70 0.77 0.78Oxford Economics 2.0 2.9 - - 2.60 3.35 0.77 0.83RBC Capital Markets 2.3 2.9 1.75 1.50 3.00 3.70 0.72 0.70Scotiabank 2.1 2.5 2.00 3.00 - - 0.73 0.75Standard Chartered 1.2 2.1 2.00 - - - 0.70 -UBS 1.6 2.8 2.00 2.25 2.58 3.32 0.70 0.70United Overseas Bank 1.7 2.7 2.00 2.00 - - 0.70 0.70SummaryMinimum 1.0 2.0 1.75 1.50 2.10 2.60 0.68 0.62Maximum 2.5 3.0 2.50 3.00 3.10 4.40 0.77 0.86Median 1.8 2.7 2.00 2.50 2.85 3.35 0.72 0.75Consensus 1.8 2.6 2.00 2.32 2.76 3.47 0.73 0.74History30 days ago 1.8 2.6 2.02 2.48 2.95 3.65 0.74 0.7660 days ago 1.8 2.7 2.18 2.77 3.15 3.90 0.74 0.7690 days ago 2.2 2.7 2.56 3.19 3.60 4.23 0.78 0.78
Consumer Prices RBA Cash 10-Year Bond Exchange Ratevariation in % Rate in % Yield in % USD per AUD
13 | Inflation | in % 14 | 10-Year Bond | in %
1
2
3
4
5
2000 2005 2010 20152
3
4
5
6
7
2000 2005 2010 2015
15 | RBA Cash Rate | in %
2
3
4
5
6
7
2000 2005 2010 2015

FOCUSECONOMICS Australia
FocusEconomics Consensus Forecast | 9
May 2015
Monetary and External Sector | Current Account Balance
21 | USD per AUD 2015 | evol. of fcst
20 | Exchange Rate | USD per AUD Current Account Balance as % of GDP
22 | USD per AUD 2016 | evol. of fcst
24 | Current Account | evol. of fcst
Notes and sources
Long-term chart period from 2000 to 2019 unless otherwise stated. All monetary and external sector data are from the Australian Bureau of Statistics (ABS), the Reserve Bank of Australia (RBA), and Thomson Reuters. See below for details. Forecasts based on FocusEconomics Consensus Forecast.13 Inflation, annual average variation of consumer prices (CPI) in %. Source: ABS.14 10-year bond yield (eop). Source: RBA. 15 RBA Cash Rate in % (eop). Source: RBA.16 Inflation, evolution of 2015 forecasts during the last 18 months.17 Inflation, evolution of 2016 forecasts during the last 18 months.18 RBA Cash Rate, evolution of 2015 and 2016 forecasts during the last 18 months.19 Exchange rate, USD per AUD. Source: Thomson Reuters.20 Exchange rate, USD per AUD. Source: Thomson Reuters.21 Exchange rate, evolution of 2015 forecasts during the last 18 months.22 Exchange rate, evolution of 2016 forecasts during the last 18 months.23 Current account balance as % of GDP. Source: ABS.24 Current account balance as % of GDP, evolution of 2015 and 2016 forecasts during the last
18 months.
0.6
0.8
1.0
1.2
Dec Mar Jun Sep Dec Mar
MaximumConsensusMinimum
0.6
0.8
1.0
1.2
Dec Mar Jun Sep Dec Mar
MaximumConsensusMinimum
0.7
0.8
0.9
1.0
1.1
Q1 12 Q1 13 Q1 14 Q1 15 Q1 16
-4
-3
-2
-1
Dec Mar Jun Sep Dec Mar
2015 2016
Individual Forecasts 2015 2016ANZ -2.6 -1.5BMI Research -2.0 -1.4BofA Merrill Lynch - -Capital Economics - -Citigroup Global Mkts -3.5 -3.6Commerzbank - -Credit Agricole -2.4 -Credit Suisse -3.8 -3.2DekaBank -3.0 -2.5Deutsche Bank -1.9 -1.7EIU -3.2 -1.6Goldman Sachs - -HSBC -2.3 -1.9ING - -JPMorgan - -Morgan Stanley -3.5 -2.9National Australia Bank -3.0 -1.3Nomura -2.2 -1.9Oxford Economics -2.5 -2.3RBC Capital Markets - -Scotiabank -3.0 -2.6Standard Chartered - -UBS -3.4 -3.5United Overseas Bank -2.2 -1.7SummaryMinimum -3.8 -3.6Maximum -1.9 -1.3Median -2.8 -1.9Consensus -2.8 -2.2History30 days ago -2.9 -2.360 days ago -3.0 -2.490 days ago -2.9 -2.4
19 | Exchange Rate | USD per AUD
0.4
0.6
0.8
1.0
1.2
2000 2005 2010 2015
23 | Current Account | % of GDP
-7
-5
-3
-1
2000 2005 2010 2015

FOCUSECONOMICS Australia
FocusEconomics Consensus Forecast | 10
May 2015
Fact Sheet
Politics
House of Representatives | %-share Senate | %-share
General Data
Economic Infrastructure
Political Data
Long-term Foreign Currency Ratings
Strengths Weaknesses
LiberalNational Coalition
46%
Australian Labor Party41%
Greens12%
Palmer United
4%
Liberal Democratis
1%
The Coalition
60%
Australian Labor Party36%
Greens1%
Independent1%
Others2%
U.S.A.11.7%
Japan7.9%
EU-2717.6%
Other Asia ex-Japan
21.4%
China18.4%
Singapore6.0%
Other17.0%
Japan19.3%
EU-276.9%
Other Asia ex-Japan
19.3%China29.5%
Korea8.0%
Other17.0%
Other5.5%
Manufact. Products72.9%
Mineral Fuels16.3%
Food5.3%
Other7.2%
Manufact. Products15.6%
Ores & Metals34.9%
Mineral Fuels30.4%
Food11.9%
Trade Structure
Primary markets | share in %
Primary products | share in %
Economic Structure
GDP by Sector | share in % GDP by Expenditure | share in %
Exports
Exports
Imports
Imports
-20
0
20
40
60
80
100
1202005-07 2008-10 2011-13
Net Exports
Investment
GovernmentConsumption
PrivateConsumption
0
20
40
60
80
1002005-07 2008-10 2011-13
Agriculture
Industry
Services
Official name: Commonwealth of AustraliaCapital: Canberra (0.4 m)Other cities: Sydney (4.5 m)
Melbourne (4.0 m)Area (km2): 7,741,220Population (million, 2014 est.): 23.6Population density (per km2, 2014 est.): 3.0Population growth rate (%, 2014 est.): 1.1Life expectancy (years, 2014 est.): 82.1Illiteracy rate (%, 2009): 1.0Language: EnglishMeasures: Metric SystemTime: GMT+8 to GMT+10
Energy (2012)Primary Energy Production (trillion Btu): 12,925Primary Energy Consumption (trillion Btu): 5,991Electricity Generation (billion kW-h): 235Electricity Consumption (billion kW-h): 223Oil Supply (thousand bpd): 519Oil Consumption (thousand bpd): 1074CO2 Emmissions (million metric tons): 421
Telecommunication (2013)Telephones - main lines (per 100 inhab.): 44.3Telephones - mobile cellular (per 100 inhab.): 107Internet Users (per 100 inhabitants): 83.0Broadband Subscribers (per 100 inhabitants): 25.0
Transportation (2013) Airports: 480Railways (km): 38,455Roadways (km): 823,217Waterways (km): 2,000Chief Ports: Melbourne, Sydney, Brisbane
Prime Minister Tony AbbottSince: 18 September 2013Next elections: September 2016Central Bank Governor: Glenn Stevens
Agency Rating OutlookMoody’s: Aaa StableS&P: AAA StableFitch Ratings: AAA Stable
• High education levels• Substantial mineral resources• High Internet penetration• Low ethnic tensionsab
• Volatile performance in mining industry• Trade dependant on commodity exports• Inflation highly affected by commodity prices

FOCUSECONOMICS Calendar
FocusEconomics Consensus Forecast | 11
May 2015
Economic Release Calendar
Date Country Event28 April New Zealand Central Bank Meeting29 April Korea May Business Confidence29 April Thailand Central Bank Meeting29 April Vietnam April Industrial Production (**)30 April New Zealand Central Bank Meeting30 April Taiwan Q1 2015 National Accounts (*)30 April Thailand March Manufacturing Production30 April Thailand March Merchandise Trade1 May China April Manufacturing PMI1 May Korea April HSBC Manufacturing PMI1 May Korea April Consumer Prices1 May Singapore April SIPMM Manufacturing PMI (**)1 May Taiwan April HSBC Manufacturing PMI1 May Vietnam April HSBC Manufacturing PMI 4 May India April HSBC Manufacturing PMI4 May Indonesia April HSBC Manufacturing PMI4 May Indonesia April Consumer Prices4 May Thailand April Consumer Prices5 May Australia Central Bank Meeting5 May Hong Kong March Retail Sales5 May Indonesia Q1 2015 National Accounts5 May Philippines April Consumer Prices5 May Taiwan April Consumer Prices6 May Australia March Retail Sales6 May Hong Kong April HSBC PMI6 May India April HSBC Services PMI6 May New Zealand Q1 2015 Unemployment7 May Australia April Unemployment7 May Malaysia Central Bank Meeting7 May Malaysia March Merchandise Trade7 May Taiwan April Merchandise Trade9 May China April Consumer Prices9 May China April Producer Prices9 May China April Merchandise Trade (**)10 May Australia May Consumer Confidence (**)10 May Australia April Business Confidence (**)10 May China April New Yuan loans (**)10 May China April Money Supply (M2) (**)11 May India March Industrial Production11 May India April Consumer Prices11 May Malaysia March Industrial Production12 May Philippines March Exports13 May China April Industrial Production
Calendar

FOCUSECONOMICS Calendar
FocusEconomics Consensus Forecast | 12
May 2015
Economic Release Calendar
(*) Preliminary estimate. (**) Approximate date.
Date Country Event13 May China April Retail Sales13 May China April Fixed Asset Investment14 May India April Wholesale Prices14 May Malaysia Q1 2015 National Accounts14 May New Zealand Q1 2015 Retail Sales14 May Philippines Central Bank Meeting15 May Hong Kong Q1 2015 National Accounts15 May India April Merchandise Trade (**)15 May Indonesia April Merchandise Trade15 May Korea Central Bank Meeting16 May Indonesia March Retail Sales (**)18 May China April Property Prices18 May Singapore April Merchandise Trade 18 May Thailand Q1 2015 National Accounts19 May Indonesia Central Bank Meeting19 May Korea April Merchandise Trade20 May Malaysia April Consumer Prices20 May New Zealand May Business Confidence (**)21 May Hong Kong April Consumer Prices22 May China May HSBC Manufacturing PMI25 May Singapore April Consumer Prices25 May Taiwan April Industrial Production25 May Taiwan Central Bank Meeting (**)25 May Vietnam May Consumer Prices (**)

FOCUSECONOMICS
FocusEconomics Consensus Forecast | 13
May 2015
Notes and Statements
PUBLICATION NOTE
Consensus forecasts are mean averages of projections of economic forecasters surveyed by FocusEconomics for our monthly publication. Quarterly averages may not correspond to the annual figures due to different forecast panels. The GDP-weighted averages for the regional aggregates refer to economies surveyed by FocusEconomics on a monthly basis, and include the following countries:
G7 (Group of Seven, 7 countries): Canada, Japan, United Kingdom and United States; France, Germany and Italy are also Euro area countries.Euro area (19 countries): Austria, Belgium, Cyprus, Estonia, Finland, France, Germany, Greece, Ireland, Italy, Latvia, Lithuania, Luxembourg, Malta, Netherlands, Portugal, Slovakia, Slovenia, and Spain.Nordic Economies (5 countries): Denmark, Norway, Sweden and Iceland. Finland is also a Euro area member.Eastern Europe (14 countries): Bulgaria, Croatia, Czech Republic, Hungary, Latvia, Lithuania, Poland, Romania, Russia, Turkey and Ukraine; Estonia, Latvia, Lithuania, Slovakia and Slovenia are also Euro area members.MENA (Middle East and North Africa, 16 countries): Algeria, Bahrain, Egypt, Iran, Iraq, Israel, Jordan, Kuwait, Lebanon, Morocco, Oman, Qatar, Saudi Arabia, Tunisia, United Arab Emirates and Yemen.GCC (Cooperation Council for the Arab States of the Gulf, also known as Gulf Cooperation Council, 6 countries): Bahrain, Kuwait, Oman, Qatar, Saudi Arabia and United Arab Emirates.Asia-Pacific (17 countries): Australia, Brunei, Cambodia, China, Hong Kong, India, Indonesia, Korea, Laos, Malaysia, Myanmar, New Zealand, Philippines, Singapore, Taiwan, Thailand and Vietnam.Latin America (23 countries): Argentina, Belize, Bolivia, Brazil, Chile, Colombia, Costa Rica, Dominican Republic, Ecuador, El Salvador, Guatemala, Haiti, Honduras, Jamaica, Mexico, Nicaragua, Panama, Paraguay, Peru, Puerto Rico, Trinidad and Tobago, Uruguay and Venezuela.Sub-Saharan Africa (13 countries): Angola, Botswana, Cote d’Ivoire, Democratic Republic of the Congo, Ethiopia, Ghana, Kenya, Mozambique, Nigeria, South Africa, Tanzania, Uganda and Zambia.Additional Countries: Switzerland.
Weights are based on market exchange rates and reflect the latest forecasts on GDP growth, inflation and exchange rates.
COPYRIGHT NOTE © Copyright 2015 FocusEconomics S.L. Duplication, reproduction, transmission, publication or redistribution in any form or by any means electronic, mechanical, or otherwise without prior written consent of FocusEconomics S.L. is strictly prohibited. Please cite source when quoting. All rights reserved under International Copyright Conventions.
The FocusEconomics Consensus Forecast Middle East and North Africa is a monthly publication of FocusEconomics. Communications to the Editor or FocusEconomics in general should be addressed as follows:
FocusEconomics S.L.Gran Via 657, E-08010 Barcelona, SpainE-mail: [email protected]
DISCLOSURE STATEMENTThe FocusEconomics Consensus Forecast (“Forecast”) is based on information obtained from sources believed to be reliable. FocusEconomics and the participating panelists (“Information Providers”) do not guarantee that the information supplied in the Forecast is accurate, complete or timely. The Information Providers do not make any warranties with regard to the results obtained from the Forecast. The Information Providers are not responsible for any errors or omissions, or for any injuries or damages resulting from the use of this information, including incidental and consequential damages. Recipients should not regard the Forecast as a substitute for the exercise of their own judgement. The recommendations made in the Forecast may be unsuitable for investors depending on their specific investment objectives and financial position. The Forecast has been prepared solely for informational purposes and is not a solicitation of any transaction or an offer to enter into any transaction. Any opinions expressed in this report are subject to change without notice and the Information Providers are under no obligation to update the information contained herein.
Notes

FocusEconomics Consensus Forecast reports cover economic forecasts for over 1,600 unique indicators in 107 countries. Every monthly report includes the Consensus Forecast for each indicator covered. The Consensus Forecast, based on an average of the forecasts provided by the most reputable economic research authorities in the world, is the one number you can rely on to make important business decisions.
WHY CHOOSE FOCUSECONOMICSInstantly diversify your intelligence portfolio with dozens of forecasts.
Get just the information you need, all in one place.
Streamline research efforts by utilizing our comprehensive survey of leading economists.
Prepare for what may occur next by studying how forecasts have evolved over time.
Gain key insight into political and economic developments in a country or region to assess the potential impact on business prospects.
REDUCE RISK
SAVE TIME
OPTIMIZE RESEARCH
ANALYZE TRENDS
ANTICIPATE DEVELOPMENTS
INDICATORS INCLUDED
REAL SECTOR GDP per capita Economic Growth Consumption Investment Industrial Production Unemployment Rate Fiscal Balance Public Debt
EXTERNAL SECTORCurrent Account Trade BalanceExportsImportsInternational ReservesExternal Debt
MONETARY & FINANCIAL SECTORMoneyInflation Rate Policy Interest Rate Exchange Rate
REGIONS & COUNTRIES COVEREDStandard Regional PublicationsIncludes forecasts for Brunei, Cambodia, China, Hong Kong, India, Indonesia, Korea, Laos, Malaysia, Myanmar, Philippines, Singapore, Taiwan, Thailand, Vietnam, Australia & New Zealand
Includes forecasts for Belize, Costa Rica, Dominican Republic, El Salvador, Guatemala, Haiti, Honduras, Nicaragua, Panama, Puerto Rico and Trinidad and Tobago
Includes forecasts for Bulgaria, Croatia, Czech Republic, Estonia, Hungary, Latvia, Lithuania, Poland, Romania, Russia, Slovakia, Slovenia, Turkey & Ukraine
Includes forecasts for Austria, Belgium, Cyprus, Estonia, Finland, France, Germany, Greece, Ireland, Italy, Latvia, Lithuania, Luxembourg, Malta, Netherlands, Portugal, Slovakia, Slovenia & Spain
Includes forecasts for Argentina, Bolivia, Brazil, Chile, Colombia, Ecuador, Mexico, Paraguay, Peru, Uruguay & Venezuela
Includes forecasts for G7 countries (United States, Canada, Japan, United Kingdom, France, Germany & Italy) and overview of the BRIC countries (Brazil, Russia, India & China); Switzerland
Includes forecasts for Algeria, Bahrain, Egypt, Iran, Iraq, Israel, Jordan, Kuwait, Lebanon, Morocco, Oman, Qatar, Saudi Arabia, Tunisia, United Arab Emirates
Includes forecasts for Denmark, Finland, Norway, Sweden and Iceland
Includes forecasts for Angola, Botswana, Cote d’Ivoire, DR Congo, Ethiopia, Ghana, Kenya, Mozambique, Nigeria, South Africa, Tanzania, Uganda and Zambia.
Major Economies
Euro Area
Asia/Pacific
Sub-Saharan Africa
Eastern Europe
Latin America
Central America& Caribbean
Nordic Economies
Middle East & North Africa
FocusEconomics | Gran Via 657, 08010, Barcelona, Spain | +34 932 651 040 | [email protected] | www.focus-economics.com
Related Documents