Carbon 43 (2005) 551–557
www.elsevier.com/locate/carbon
Carbon nanofibres and activated carbon nanofibres as electrodesin supercapacitors
Cesar Merino a, Pablo Soto a, Eduardo Vilaplana-Ortego b, Jose M. Gomez de Salazar c,Fernando Pico d, Jose M. Rojo d,*
a Grupo Antolin Ingenieria S.A., Carretera Madrid-Irun km. 244.8, E-09007 Burgos, Spainb Departamento de Quimica Inorganica, Universidad de Alicante, E-03080 Alicante, Spain
c Departamento de Ciencia de Materiales e Ingenieria Metalurgica, Facultad de Ciencias, Universidad Complutense Madrid,
Ciudad Universitaria, E-28040 Madrid, Spaind Instituto de Ciencia de Materiales de Madrid, Consejo Superior de Investigaciones Cientıficas, Cantoblanco, E-28049 Madrid, Spain
Received 6 July 2004; accepted 13 October 2004
Available online 25 November 2004
Abstract
Carbon nanofibres have been prepared by a floating catalyst procedure at industrial scale in a metallic furnace. The nanofibres
(50–500nm diameter and 5–200lm length) are grown from the Fe particles used as catalyst. Soot appears together with the carbon
nanofibres. The sample has been chemically activated using KOH as activating agent. Scanning electron microscopy has shown a
smooth surface for the as-prepared carbon nanofibres but a rough surface for the activated ones. The specific surface area increases
from 13 to 212m2/g due to the activation. The volume of the micropores (in the 1–2nm range) and the mesopores (2–5nm range), as
deduced by density functional theory methods, also increases after the activation. Electrochemical behaviour of the as-prepared and
activated carbon nanofibres has been tested in a supercapacitor at laboratory scale using 6M KOH aqueous solution as electrolyte.
The specific capacitance, which is less than 1F/g for the as-prepared sample, increase up to �60F/g for the activated sample. Only aslight decrease in capacitance has been observed as the current density increases. Specific power of �100W/kg at specific energy of1Wh/kg has been found in some particular cases. We have compared the electrochemical parameters of our activated carbon nano-
fibres with those of activated carbon nanofibres coming from a commercial sample; the latter was activated by the same way as our
sample.
� 2004 Elsevier Ltd. All rights reserved.
Keywords: A. Catalytically grown carbon, Electrodes; B. Activation; C. Scanning electron microscopy; D. Electrochemical properties
1. Introduction
Carbon nanofibres are catalytically vapour-grown
carbon fibres (s-VGCF) of submicrometric size (diame-
ters of 50–500nm and lengths of 50–100lm) that showphysical properties between those of commercial ex-
PAN or pitch carbon fibres and carbon nanotubes. They
0008-6223/$ - see front matter � 2004 Elsevier Ltd. All rights reserved.
doi:10.1016/j.carbon.2004.10.018
* Corresponding author. Tel.: +34 913349000; fax: +34 913720623.
E-mail address: [email protected] (J.M. Rojo).
present a highly graphitic structure and can massively
be produced sacrificing product quality in some degree[1].
Two Japanese and two American companies are cur-
rently producing carbon nanofibres in moderate indus-
trial amount (several tens of tons per year) [2]. At the
European level, the Spanish Company Grupo Antolın
Ingenierıa, S.A. is involved in the industrial production
of carbon nanofibres. Its production capacity was of
half a ton per year in 2002; the production is expectedto increase to 10tons in 2004.
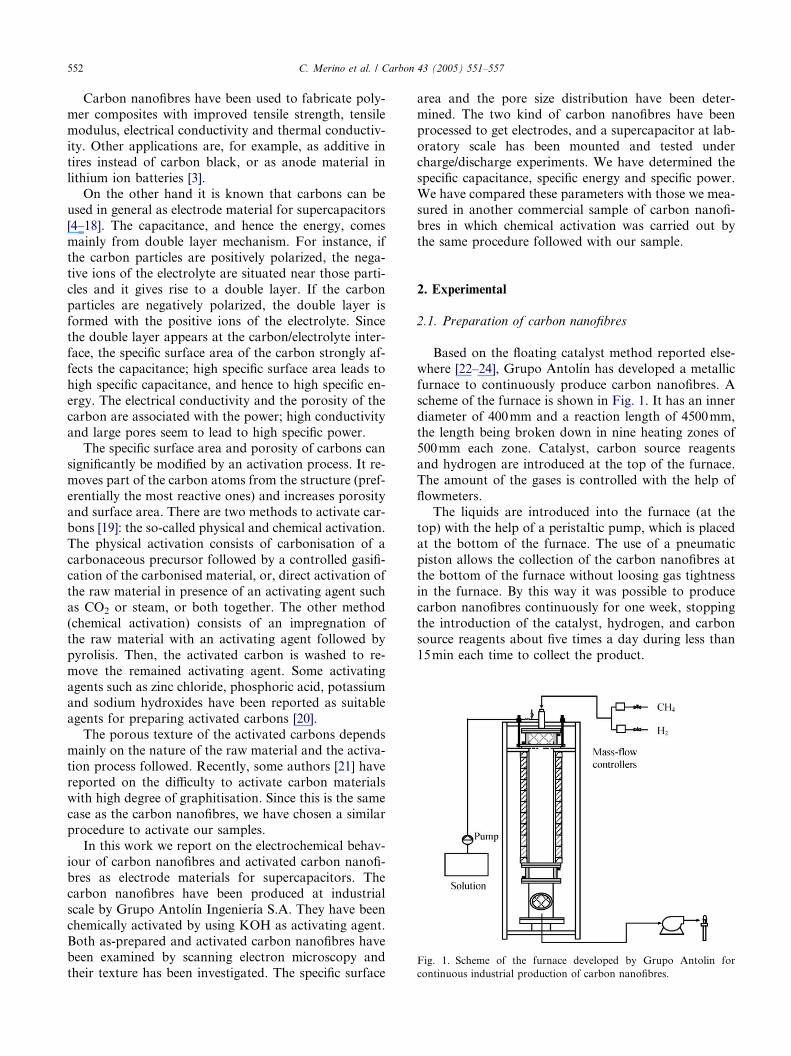
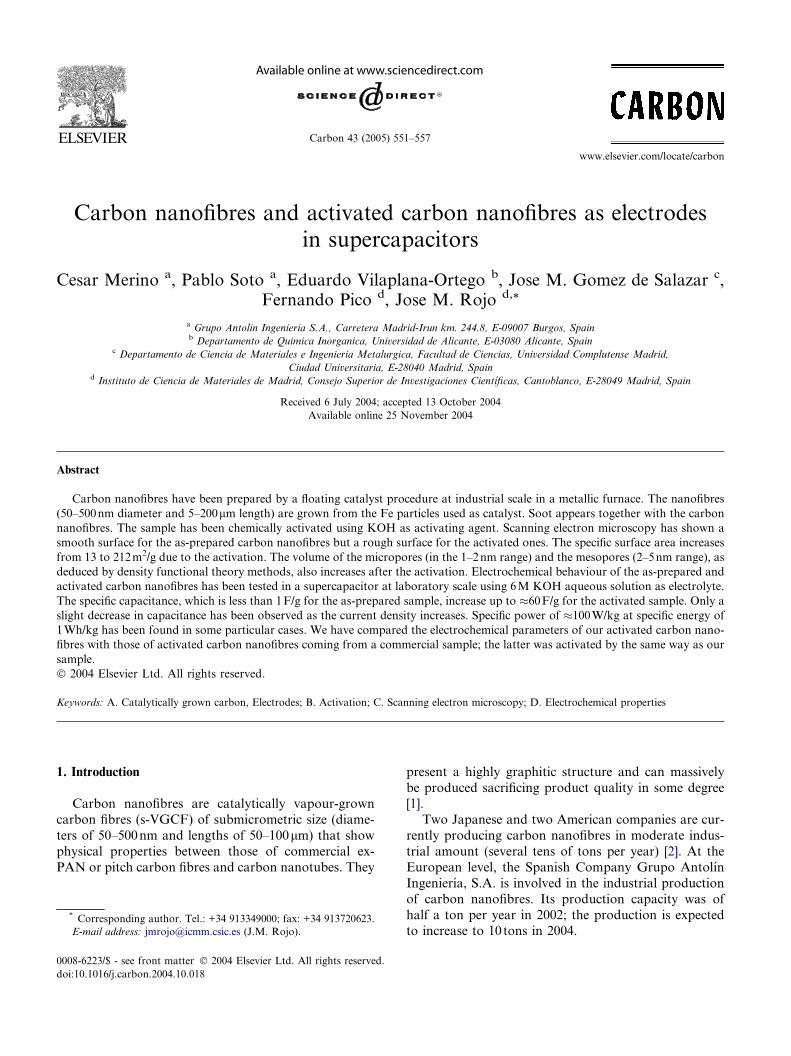
Fig. 1. Scheme of the furnace developed by Grupo Antolin for
continuous industrial production of carbon nanofibres.
552 C. Merino et al. / Carbon 43 (2005) 551–557
Carbon nanofibres have been used to fabricate poly-
mer composites with improved tensile strength, tensile
modulus, electrical conductivity and thermal conductiv-
ity. Other applications are, for example, as additive in
tires instead of carbon black, or as anode material in
lithium ion batteries [3].On the other hand it is known that carbons can be
used in general as electrode material for supercapacitors
[4–18]. The capacitance, and hence the energy, comes
mainly from double layer mechanism. For instance, if
the carbon particles are positively polarized, the nega-
tive ions of the electrolyte are situated near those parti-
cles and it gives rise to a double layer. If the carbon
particles are negatively polarized, the double layer isformed with the positive ions of the electrolyte. Since
the double layer appears at the carbon/electrolyte inter-
face, the specific surface area of the carbon strongly af-
fects the capacitance; high specific surface area leads to
high specific capacitance, and hence to high specific en-
ergy. The electrical conductivity and the porosity of the
carbon are associated with the power; high conductivity
and large pores seem to lead to high specific power.The specific surface area and porosity of carbons can
significantly be modified by an activation process. It re-
moves part of the carbon atoms from the structure (pref-
erentially the most reactive ones) and increases porosity
and surface area. There are two methods to activate car-
bons [19]: the so-called physical and chemical activation.
The physical activation consists of carbonisation of a
carbonaceous precursor followed by a controlled gasifi-cation of the carbonised material, or, direct activation of
the raw material in presence of an activating agent such
as CO2 or steam, or both together. The other method
(chemical activation) consists of an impregnation of
the raw material with an activating agent followed by
pyrolisis. Then, the activated carbon is washed to re-
move the remained activating agent. Some activating
agents such as zinc chloride, phosphoric acid, potassiumand sodium hydroxides have been reported as suitable
agents for preparing activated carbons [20].
The porous texture of the activated carbons depends
mainly on the nature of the raw material and the activa-
tion process followed. Recently, some authors [21] have
reported on the difficulty to activate carbon materials
with high degree of graphitisation. Since this is the same
case as the carbon nanofibres, we have chosen a similarprocedure to activate our samples.
In this work we report on the electrochemical behav-
iour of carbon nanofibres and activated carbon nanofi-
bres as electrode materials for supercapacitors. The
carbon nanofibres have been produced at industrial
scale by Grupo Antolın Ingenierıa S.A. They have been
chemically activated by using KOH as activating agent.
Both as-prepared and activated carbon nanofibres havebeen examined by scanning electron microscopy and
their texture has been investigated. The specific surface
area and the pore size distribution have been deter-
mined. The two kind of carbon nanofibres have been
processed to get electrodes, and a supercapacitor at lab-
oratory scale has been mounted and tested under
charge/discharge experiments. We have determined the
specific capacitance, specific energy and specific power.We have compared these parameters with those we mea-
sured in another commercial sample of carbon nanofi-
bres in which chemical activation was carried out by
the same procedure followed with our sample.
2. Experimental
2.1. Preparation of carbon nanofibres
Based on the floating catalyst method reported else-
where [22–24], Grupo Antolın has developed a metallic
furnace to continuously produce carbon nanofibres. A
scheme of the furnace is shown in Fig. 1. It has an inner
diameter of 400mm and a reaction length of 4500mm,
the length being broken down in nine heating zones of500mm each zone. Catalyst, carbon source reagents
and hydrogen are introduced at the top of the furnace.
The amount of the gases is controlled with the help of
flowmeters.
The liquids are introduced into the furnace (at the
top) with the help of a peristaltic pump, which is placed
at the bottom of the furnace. The use of a pneumatic
piston allows the collection of the carbon nanofibres atthe bottom of the furnace without loosing gas tightness
in the furnace. By this way it was possible to produce
carbon nanofibres continuously for one week, stopping
the introduction of the catalyst, hydrogen, and carbon
source reagents about five times a day during less than
15min each time to collect the product.
C. Merino et al. / Carbon 43 (2005) 551–557 553
The H2 flow chosen was 7.4 l/min. The hydrocarbons
used as carbon source were methane (9.3 l/min), and n-
heptane (1 l/h). The catalysts used was a Fe-based com-
pound (ferrocene), which was introduced in the furnace
as a solution in n-heptane (25g/l). The operating furnace
temperature was 1100 �C.
2.2. Activation of carbon nanofibres
It was conducted by a chemical activation method in
which KOH was the activating agent. First the sample
and KOH lentils were mixed at room temperature; the
KOH/sample weight ratio was 3/1. Then carbonisation
of the mixtures was done in a horizontal furnace undernitrogen flow. The heating rate from room temperature
to the final carbonisation temperature (800 �C) was of20 �C/min. The temperature at 800 �C was held for 1h.
Then the furnace was cooled down to room tempera-
ture. The nitrogen flow was kept at 500ml/min along
the heating and cooling runs. After carbonisation the
samples were repeatedly washed with 5 N HCl aqueous
solution. In addition, they were washed with distilledwater to get samples free of chloride ions. Once the acti-
vating agent was removed in the washing step, the sam-
ples were dried at 110 �C for at least 12h. The samples
were weighted to know the final yield of the activation
process.
2.3. Surface characterization
The porous texture of the as-prepared and activated
carbon nanofibres was analysed by physical adsorption
of gases (N2 at 77K and CO2 at 273K) in two automatic
volumetric adsorption systems (Autosorb-6 and Auto-
sorb-6B, Quantachrome Corporation). All samples were
outgassed at 250 �C for 4h prior to the adsorption
measurements. The total micropore volume (pores
smaller than 2nm) was calculated by applying theDubbinin–Radushkevich (DR) equation to the N2 ad-
sorption data collected at 77K. The narrow micropore
volume (pores smaller than 0.7nm) was assessed from
CO2 adsorption data obtained at 273K using the DR
equation [25–27]. The specific surface area was mea-
sured in the relative pressure interval of 0.05–0.30 by
using the BET method. The micropore size distributions
were calculated by applying the density functional the-ory (DFT) to the N2 isotherms using the Autosorb Mul-
tistation software.
2.4. Scanning electron microscopy
The as-prepared and activated carbon nanofibres
were examined by scanning electron microscopy
(SEM) in a Jeol JSM 6345 F microscope. It allowed usto compare the surface of the carbon nanofibres before
and after the activation.
2.5. Electrochemical measurements
From the as-prepared and activated carbon nanofi-
bres, electrodes were processed as composites. Polyviny-
lidenefluoride (PVDF, MW � 534000) was used as an
inert binder. In all cases the content of the PVDF andas-prepared sample (or activated sample) was 10wt.%
and 90wt.%, respectively. The two components of the
composites were mixed and ground in an agate mortar.
Then cylindrical pellets of 13mm diameter and �0.5mmthickness were obtained by cold pressing at 38MPa.
With two equal electrodes a supercapacitor was
mounted in a Swagelok-type cell. The two electrodes
were separated by a glassy microfibre paper into whichthe liquid electrolyte (6M KOH aqueous solution) had
been impregnated. For comparison 2M H2SO4 aqueous
solution was used as electrolyte. The charge and dis-
charge of the supercapacitor cells were followed at room
temperature with a 1286 Solartron potentiostat/galvano-
stat. The galvanostatic and voltametric measurements
were carried out in the current range of 1–100mA and
in the voltage scan rate range of 2–50mVs�1,respectively.
3. Results and discussion
3.1. Activation of the carbon nanofibres
The sample produced as described in the experimen-tal section, was washed ultrasonically in acetone. It re-
moved polycyclic aromatic hydrocarbons that usually
accompany the sample due to the fast cooling of the
gas at the bottom of the furnace. Then a portion of
the sample was activated in KOH as described in the
experimental section. The yield of the activation process
was 58% by weight. The as-prepared and activated sam-
ple from Grupo Antolin are hereafter called S andS-K800, respectively.
For comparison purposes a commercial sample of
carbon nanofibres from Applied Sciences-Pyrograf
Products Inc. (the product of reference Pyrograf III
24-PR PS) was activated according to the procedure
already mentioned. The yield of the activation process
was 52%. The starting and activated sample from Pyrog-
raf are hereafter called Pyr III and Pyr III-K800,respectively.
3.2. Microstructural characterization of the
as-prepared and activated carbon nanofibres
A SEM photograph of the S sample is shown in Fig.
2a. It can be seen carbon nanofibres that are grown from
the Fe particles used as catalyst. Soot is also observed asballs with Fe particles inside. The presence of soot is
indicative of a poor catalytic activity of the Fe particles
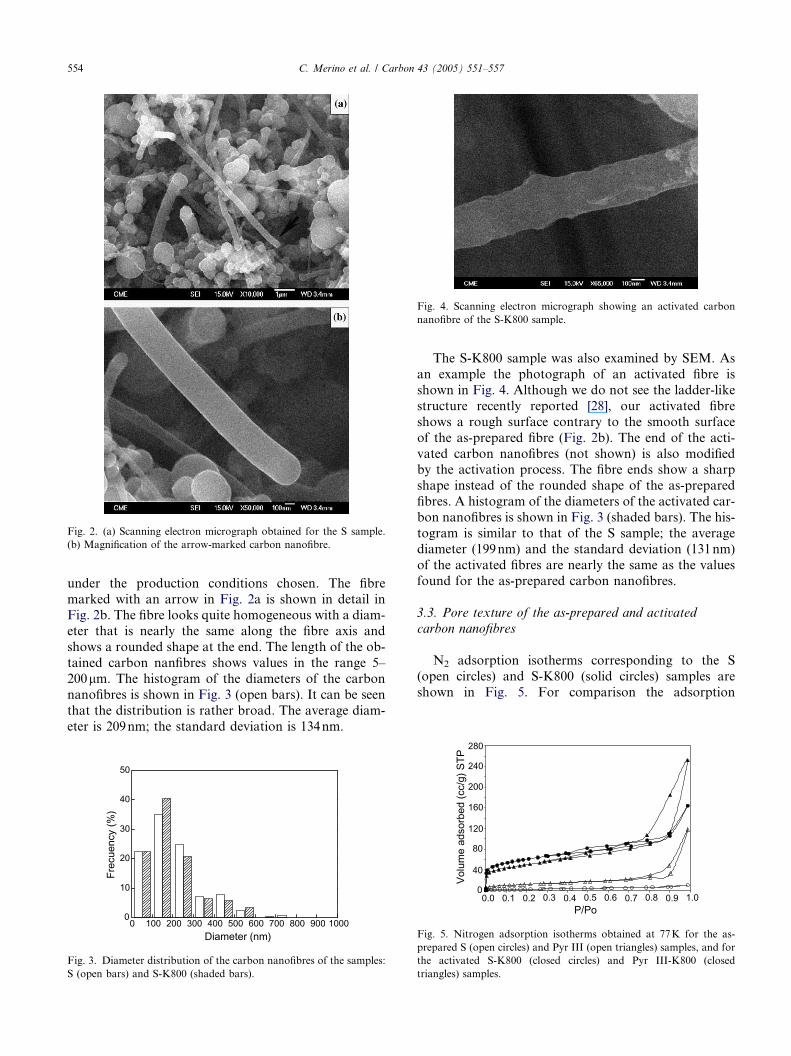
Fig. 2. (a) Scanning electron micrograph obtained for the S sample.
(b) Magnification of the arrow-marked carbon nanofibre.
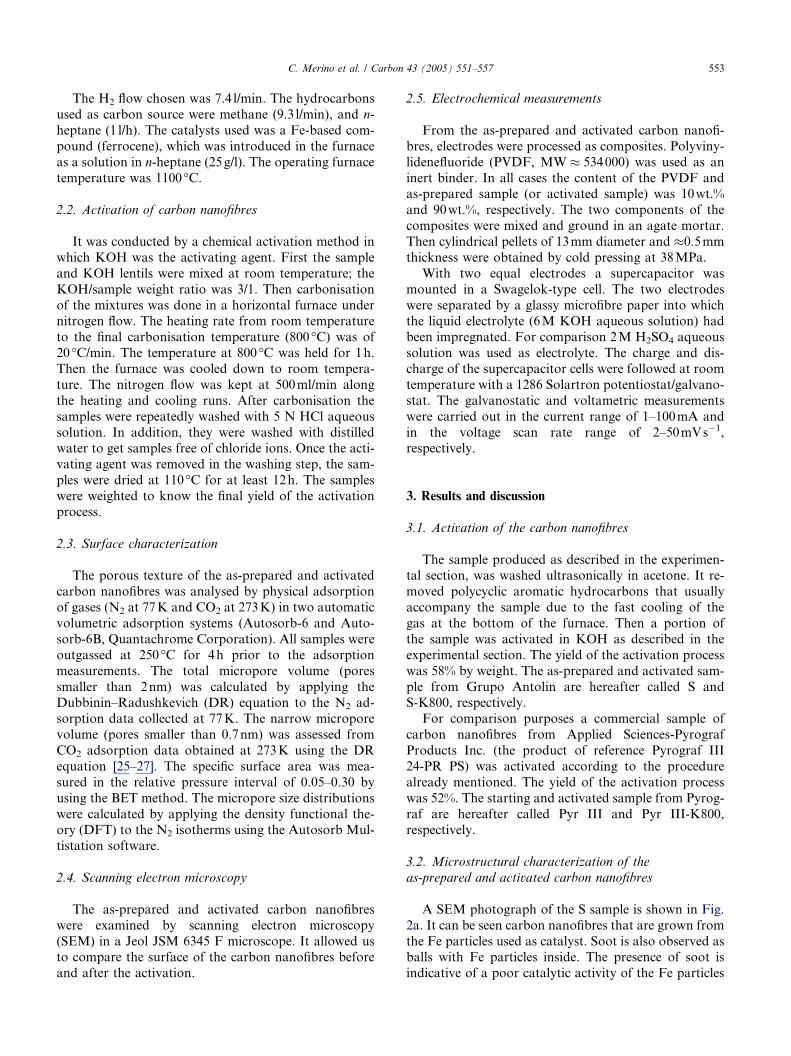
Fig. 4. Scanning electron micrograph showing an activated carbon
nanofibre of the S-K800 sample.
554 C. Merino et al. / Carbon 43 (2005) 551–557
under the production conditions chosen. The fibre
marked with an arrow in Fig. 2a is shown in detail inFig. 2b. The fibre looks quite homogeneous with a diam-
eter that is nearly the same along the fibre axis and
shows a rounded shape at the end. The length of the ob-
tained carbon nanfibres shows values in the range 5–
200lm. The histogram of the diameters of the carbon
nanofibres is shown in Fig. 3 (open bars). It can be seen
that the distribution is rather broad. The average diam-
eter is 209nm; the standard deviation is 134nm.
0 100 200 300 400 500 600 700 800 900 10000
10
20
30
40
50
Frec
uenc
y (%
)
Diameter (nm)
Fig. 3. Diameter distribution of the carbon nanofibres of the samples:
S (open bars) and S-K800 (shaded bars).
The S-K800 sample was also examined by SEM. As
an example the photograph of an activated fibre is
shown in Fig. 4. Although we do not see the ladder-like
structure recently reported [28], our activated fibre
shows a rough surface contrary to the smooth surface
of the as-prepared fibre (Fig. 2b). The end of the acti-
vated carbon nanofibres (not shown) is also modifiedby the activation process. The fibre ends show a sharp
shape instead of the rounded shape of the as-prepared
fibres. A histogram of the diameters of the activated car-
bon nanofibres is shown in Fig. 3 (shaded bars). The his-
togram is similar to that of the S sample; the average
diameter (199nm) and the standard deviation (131nm)
of the activated fibres are nearly the same as the values
found for the as-prepared carbon nanofibres.
3.3. Pore texture of the as-prepared and activated
carbon nanofibres
N2 adsorption isotherms corresponding to the S
(open circles) and S-K800 (solid circles) samples are
shown in Fig. 5. For comparison the adsorption
0
40
80
120
160
200
240
280
0.0 0.1 0.2 0.3 0.4 0.5 0.6 0.7 0.8 0.9 1.0P/Po
Volu
me
adso
rbed
(cc/
g) S
TP
Fig. 5. Nitrogen adsorption isotherms obtained at 77K for the as-
prepared S (open circles) and Pyr III (open triangles) samples, and for
the activated S-K800 (closed circles) and Pyr III-K800 (closed
triangles) samples.
10
15 (a)
charge
C. Merino et al. / Carbon 43 (2005) 551–557 555
isotherms obtained on the Pyr III (open triangle) and
Pyr III-K800 (solid triangle) samples are also presented
in that figure. For the as-prepared S and Pyr III samples
the volume adsorbed at low and medium relative pres-
sures is very low. At high relative pressures the S iso-
therm shows no significant adsorption but the Pyr IIIisotherm shows a hysteresis, which is typical of materials
containing mesopores [29]. The isotherms of the acti-
vated S-K800 and Pyr III-K800 samples show: (i) a
sharp adsorption at very low relative pressures that is
typical of materials having micropores, and (ii) a hyster-
esis at medium-high relative pressures indicating the
presence of mesopores.
The BET surface areas and the micropore volumescalculated from N2 adsorption data at 77K [VDR (N2)]
and from CO2 adsorption data at 273K [VDR (CO2)]
are outlined in Table 1 for each sample. The comparison
between the total micropore volume [VDR (N2)] and the
narrow micropore volume [VDR (CO2)] gives an idea of
the micropore size distribution. Since the difference is
negligible [i.e. VDR (N2) � VDR (CO2)], the microporos-
ity is homogeneous in size [25–27,30]. Although the PyrIII sample has a BET surface area higher than the S
sample, the BET surface area developed by the chemical
activation is similar in both S-K800 and Pyr III-K800
samples.
Fig. 6 shows the DFT pore size distributions for the
as-prepared samples and the activated ones. We can
see that: (i) the two activated samples (solid symbols)
Table 1
Textural characteristics obtained from N2 and CO2 isotherms for the
original carbon nanofibres and the activated ones
Sample SBET(m2/g)
VDR(N2)
(cc/g)
VDR(CO2)
(cc/g)
VDR(N2)–VDR(CO2)
(cc/g)
S 13 – – –
S-K800 212 0.09 0.09 0.00
Pyr III 40 – – –
Pyr III-K800 183 0.08 0.09 0.01
0.000
0.001
0.002
0.003
0.004
0.005
0.006
0.007
0 10 20 30 40 50Pore width (Å)
Pore
vol
ume
(cc/
Å/g)
Fig. 6. DFT pore size distribution for the as-prepared S (open circles)
and Pyr-III (open triangles) samples, and for the activated S-K800
(closed circles) and Pyr III-K800 (closed triangles) samples.
show higher porosity than the two as-prepared ones
(open symbols), and (ii) the chemical activation has
led to similar pore size distributions in the two samples.
The activated samples present a mean micropore size at
around 11A, and an unimodal micropore size distri-
bution with most of the pores in the range 7–20A. Inaddition, they have mesopores with sizes in the range
20–50A. Therefore the chemical activation carried out
develops microporosity and mesoporosity.
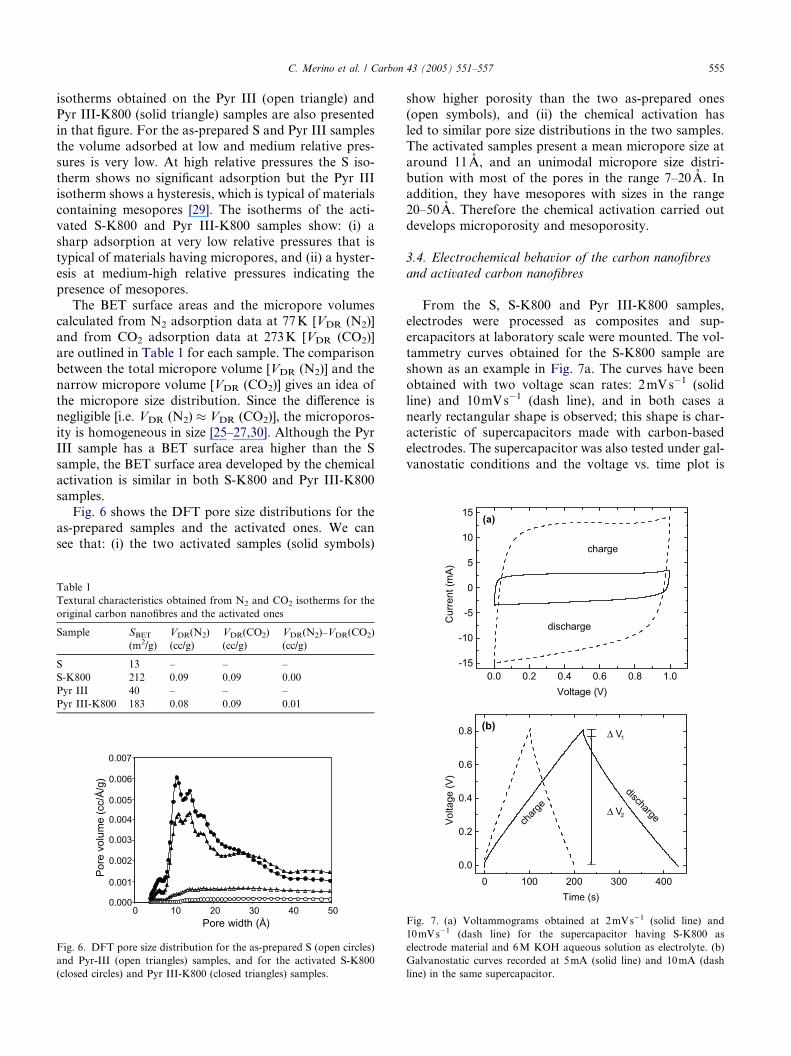
3.4. Electrochemical behavior of the carbon nanofibres
and activated carbon nanofibres
From the S, S-K800 and Pyr III-K800 samples,electrodes were processed as composites and sup-
ercapacitors at laboratory scale were mounted. The vol-
tammetry curves obtained for the S-K800 sample are
shown as an example in Fig. 7a. The curves have been
obtained with two voltage scan rates: 2mVs�1 (solid
line) and 10mVs�1 (dash line), and in both cases a
nearly rectangular shape is observed; this shape is char-
acteristic of supercapacitors made with carbon-basedelectrodes. The supercapacitor was also tested under gal-
vanostatic conditions and the voltage vs. time plot is
0.0 0.2 0.4 0.6 0.8 1.0-15
-10
-5
0
5
dischargeCur
rent
(mA)
Voltage (V)
0 100 200 300 4000.0
0.2
0.4
0.6
0.8 (b)
∆ V 2
∆ V1
dischargecharg
e
Volta
ge(V
)
Time (s)
Fig. 7. (a) Voltammograms obtained at 2mVs�1 (solid line) and
10mVs�1 (dash line) for the supercapacitor having S-K800 as
electrode material and 6M KOH aqueous solution as electrolyte. (b)
Galvanostatic curves recorded at 5mA (solid line) and 10mA (dash
line) in the same supercapacitor.
556 C. Merino et al. / Carbon 43 (2005) 551–557
shown in Fig. 7b. The solid and dash lines stand for the
results obtained at the currents of 5 and 10mA, respec-
tively. In both cases we can see at the beginning of the
charge and discharge a sharp change in voltage (DV1),
which is usually associated with the equivalent series
resistance (ESR) of the supercapacitor [9]. We also seea gradual variation in voltage (DV2) that increases for
the charge and decreases for the discharge. From DV2
in the discharge, the capacitance (C) of the supercapac-
itor was calculated according to C = I · Dtd/D V2, where
Dtd is the time spent along the discharge and I is the
current. The capacitance of each electrode (Ce) was cal-
culated as Ce = 2 · C because both electrodes are ar-
ranged in series within the supercapacitor. From thecapacitance of each electrode and its carbon mass, the
specific capacitance (in F/g) was also calculated.
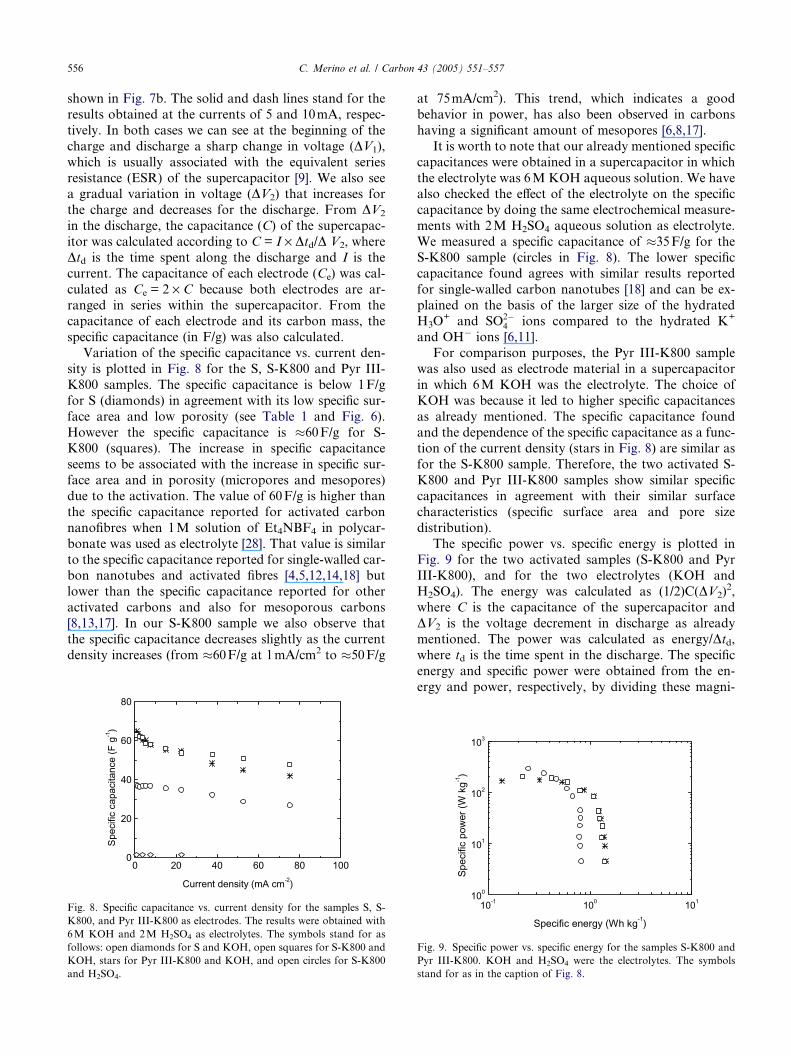
Variation of the specific capacitance vs. current den-
sity is plotted in Fig. 8 for the S, S-K800 and Pyr III-
K800 samples. The specific capacitance is below 1F/g
for S (diamonds) in agreement with its low specific sur-
face area and low porosity (see Table 1 and Fig. 6).
However the specific capacitance is �60F/g for S-K800 (squares). The increase in specific capacitance
seems to be associated with the increase in specific sur-
face area and in porosity (micropores and mesopores)
due to the activation. The value of 60F/g is higher than
the specific capacitance reported for activated carbon
nanofibres when 1M solution of Et4NBF4 in polycar-
bonate was used as electrolyte [28]. That value is similar
to the specific capacitance reported for single-walled car-bon nanotubes and activated fibres [4,5,12,14,18] but
lower than the specific capacitance reported for other
activated carbons and also for mesoporous carbons
[8,13,17]. In our S-K800 sample we also observe that
the specific capacitance decreases slightly as the current
density increases (from �60F/g at 1mA/cm2 to �50F/g
0 20 40 60 80 1000
20
40
60
80
Spe
cific
capa
cita
nce
(Fg-1
)
Current density (mA cm-2)
Fig. 8. Specific capacitance vs. current density for the samples S, S-
K800, and Pyr III-K800 as electrodes. The results were obtained with
6M KOH and 2M H2SO4 as electrolytes. The symbols stand for as
follows: open diamonds for S and KOH, open squares for S-K800 and
KOH, stars for Pyr III-K800 and KOH, and open circles for S-K800
and H2SO4.
at 75mA/cm2). This trend, which indicates a good
behavior in power, has also been observed in carbons
having a significant amount of mesopores [6,8,17].
It is worth to note that our already mentioned specific
capacitances were obtained in a supercapacitor in which
the electrolyte was 6M KOH aqueous solution. We havealso checked the effect of the electrolyte on the specific
capacitance by doing the same electrochemical measure-
ments with 2M H2SO4 aqueous solution as electrolyte.
We measured a specific capacitance of �35F/g for theS-K800 sample (circles in Fig. 8). The lower specific
capacitance found agrees with similar results reported
for single-walled carbon nanotubes [18] and can be ex-
plained on the basis of the larger size of the hydratedH3O
+ and SO2�4 ions compared to the hydrated K+
and OH� ions [6,11].
For comparison purposes, the Pyr III-K800 sample
was also used as electrode material in a supercapacitor
in which 6M KOH was the electrolyte. The choice of
KOH was because it led to higher specific capacitances
as already mentioned. The specific capacitance found
and the dependence of the specific capacitance as a func-tion of the current density (stars in Fig. 8) are similar as
for the S-K800 sample. Therefore, the two activated S-
K800 and Pyr III-K800 samples show similar specific
capacitances in agreement with their similar surface
characteristics (specific surface area and pore size
distribution).
The specific power vs. specific energy is plotted in
Fig. 9 for the two activated samples (S-K800 and PyrIII-K800), and for the two electrolytes (KOH and
H2SO4). The energy was calculated as (1/2)C(DV2)2,
where C is the capacitance of the supercapacitor and
DV2 is the voltage decrement in discharge as already
mentioned. The power was calculated as energy/Dtd,
where td is the time spent in the discharge. The specific
energy and specific power were obtained from the en-
ergy and power, respectively, by dividing these magni-
10-1 100 101100
101
102
103
Spe
cific
pow
er(W
kg-1)
Specific energy (Wh kg-1)
Fig. 9. Specific power vs. specific energy for the samples S-K800 and
Pyr III-K800. KOH and H2SO4 were the electrolytes. The symbols
stand for as in the caption of Fig. 8.
C. Merino et al. / Carbon 43 (2005) 551–557 557
tudes by the mass of the carbon in the supercapacitor. In
Fig. 9 we can see that: (i) the maximum specific power
(�200W/kg) is similar for both S-K800 (squares) andPyr III-K800 (stars) and is not affected by the electrolyte
chosen, i.e. either KOH (squares) or H2SO4 (circles), (ii)
the maximum specific energy (�1Wh/kg) is similar forS-K800 and Pyr III-K800, and (iii) the maximum spe-
cific energy is higher for KOH (squares and stars) com-
pared to H2SO4 (circles).
4. Conclusions
Carbon nanofibres have been produced in a continu-ous way at industrial scale. The as-prepared carbon
nanofibres show low specific surface area and low poros-
ity as well as negligible specific capacitance as electrode
material.
The chemical activation carried out using KOH as
activating agent gives rise to an alteration of the surface
of the carbon nanofibres as observed by SEM. The spe-
cific surface area and porosity (micropores of 1–2nmsize and mesopores of 2–5nm size) increase and the spe-
cific capacitance is of �60F/g even at high current den-sity. In some particular cases specific energy of 1Wh/kg
at specific power of 100W/kg has been found.
Acknowledgment
F. Pico thanks the Red de Pilas de Combustible del
CSIC for the fellowship got.
References
[1] Morita T, Inoue H, Suhara Y. Fine carbon fiber and method for
producing the same. US Patent 2002/0058139 A1, 2002.
[2] Tibbetts GG. Vapor-Grown Carbon Fiber research and applica-
tions: achievements and barriers. In: Biro LP, Bernardo CA,
Tibbetts GG, Lambin Ph, editors. Carbon filaments and nano-
tubes: common origins, differing applications?. Dordrecht: Klu-
wer Academic Publishers; 2001. p. 1–9.
[3] Lake ML. Novel applications of VGCF including hydrogen
storage. In: Biro LP, Bernardo CA, Tibbetts GG, Lambin Ph,
editors. Carbon filaments and nanotubes: common origins,
differing applications?. Dordrecht: Kluwer Academic Publishers;
2001. p. 331–41.
[4] Shi H. Activated carbons and double layer capacitance. Electro-
chim Acta 1996;41:1633–9.
[5] Niu C, Sichel EK, Hoch R, Moy D, Tennent H. High power
electrochemical capacitors based on carbon nanotube electrodes.
Appl Phys Lett 1997;70:1480–2.
[6] Qu D, Shi H. Studies of activated carbons used in double-layer
capacitors. J Power Sources 1998;74:99–107.
[7] Lin C, Ritter JA, Popov BN. Correlation of double-layer
capacitance with the pore structutre of sol–gel derived carbon
xerogels. J Electrochem Soc 1999;146:3639–43.
[8] Yoon S, Lee J, Hyeon T, Oh SM. Electric double-layer capacitor
performance of a new mesoporous carbon. J Electrochem Soc
2000;147:2507–12.
[9] Conway BE. Electrochemical supercapacitors. N.Y.: Kluwer
Academic; 1999. 528-532.
[10] Kotz R, Carlen M. Principles and applications of electrochemical
capacitors. Electrochim Acta 2000;45:2483–98.
[11] Endo M, Takeda T, Kim YJ, Koshiba K, Ishii K. High power
electric double layer capacitor (EDLC�s); from operating principle
to pore size control in advance activated carbons. Carbon Sci
2001;1:117–28.
[12] Frackowiak E, Beguin F. Carbon materials for the electrochem-
ical storage of energy in capacitors. Carbon 2001;39:937–50.
[13] Weng TC, Teng H. Characterization of high porosity carbon
electrodes derived from mesophase pitch for electric double-layer
capacitors. J Electrochem Soc 2001;148:A368–73.
[14] Emmenegger Ch, Mauron Ph, Sudan P, Wenger P, Hermann V,
Gallay R, et al. Investigation of electrochemical double-layer
(ECDL) capacitors electrodes based on carbon nanotubes and
activated carbon materials. J Power Sources 2003;124:321–9.
[15] Lozano-Castello D, Cazorla-Amoros D, Linares-Solano A, Shi-
raishi S, Kurihara H, Oya A. Influence of pore structure and
surface chemistry on electric double layer capacitance in non-
aqueous electrolyte. Carbon 2003;41:1765–75.
[16] Babel K, Jurewicz K. KOH activated carbon fabrics as superca-
pacitor material. J Phys Chem Solids 2004;65:275–80.
[17] Fuertes AB, Pico F, Rojo JM. Influence of pore structure on
electric double-layer capacitance of template mesoporous carbons.
J Power Sources 2004;133:329–36.
[18] Pico F, Rojo JM, Sanjuan ML, Anson A, Benito AM, Callejas
MA, et al. Single-walled carbon nanotubes as electrodes in
supercapacitors. J Electrochem Soc 2004;151:A831–7.
[19] Bansal RC, Donnet JB, Stoeckli F. Active carbon. New
York: Marcel Dekker; 1998.
[20] Lozano-Castello D, Lillo-Rodenas MA, Cazorla-Amoros D,
Linares-Solano A. Preparation of activated carbons from Spanish
anthracite. I. Activation by KOH. Carbon 2001;39(5):741–9.
[21] Macia-Agullo JA, Moore JC, Cazorla-Amoros D, Linares-Solano
A. Chemical activation by KOH and NaOH of carbon materials
with different cristallinity. In: Extended Abstracts, Carbon 2003:
International Conference, Oviedo, Spain, July 6–10. Spanish
Carbon Group, 2003, p. 197.
[22] Arakawa K. Process for preparing fine carbon fibers in a gaseous
phase reaction. US Patent 4,572,813, 1986.
[23] Arakawa K. Process for preparing fine fibers. US Patent
4,640,830, 1987.
[24] Tibbetts GG, Gorkiewicz DW. A new reactor for growing carbon
fibers from liquid- and vapor-phase hydrocarbons. Carbon 1993;
31(5):809–14.
[25] Rodriguez-Reinoso F, Linares-Solano A. Microporous structure
of activated carbons as revealed by adsorption methods. In:
Thrower PA, editor. Chemistry and physics of carbon, vol.
21. New York: Marcel Dekker; 1988. p. 1–146.
[26] Cazorla-Amoros D, Alcaniz-Monge J, Linares-Solano A. Char-
acterisation of activated carbon fibres by CO2 adsorption.
Langmuir 1996;12(11):2820–4.
[27] Cazorla-Amoros D, Alcaniz-Monge J, De la Casa-Lillo MA,
Linares-Solano A. CO2 as an adsorptive to characterise carbon
molecular sieves and activated carbons. Langmuir 1998;14(16):
4589–96.
[28] Yoon SH, Lim S, Song Y, Ota Y, Qiao W, Tanaka A, et al. KOH
activation of carbon nanofibres. Carbon 2004;42:1723–9.
[29] Sing KSW, Everett DH, Haul RAW, Moscou L, Pierotti RA,
Rouquerol J, et al. Reporting physisorption data for gas/solid
systems with special reference to the determination of surface area
and porosity. Pure Appl Chem 1985;57(4):603–19.
[30] Linares-Solano A, Salinas-Martınez de Lecea C, Alcaniz-Monge
J, Cazorla-Amoro s D. Further advances in the characterisation of
microporous carbons by physical adsorption of gases. Tanso
1998;185:316–25.