Biological Productivity and Coastal Habitats
• Why do we care?– Fishing– Water quality– Wildlife

Ecology and Ecosystems
• Ecology– Natural systems– Include interactions between living and
non-living parts
• Ecosystem– Totality of the environment
encompassing all chemical, physical, geological and biological parts
• Food chain– Succession of organisms within an
ecosystem base upon trophic dynamics – Trophic dynamics
• Trophic refers to nutrition• who is eaten by whom

Ecosystems
• Function by exchange of matter and energy
• Differ in size, complexity, and diversity of organisms

Ecosystem Energy Flow
• Plants take energy from the sun and put it into the system– Use chlorophyll in photosynthesis to
convert inorganic material into organic compounds and to store energy for growth and reproduction
– Plants are autotrophs – Plants are primary producers
• Heterotrophs – All other organisms– Consumers - animals– Decomposers – bacteria and fungi– Herbivores eat plants– Carnivores eat animals– Omnivores eat both plants and animals

Ecosystem Pathway
•Material is constantly cycled
•Energy comes from sun, gradually dissipates as heat and is lost

Trophic Dynamics
• Trophic refers to nutrition• Trophic dynamics - study of the
nutritional interconnections among organisms within an ecosystem

Tropic Level • Position of the organism within the
tropic dynamics– Autotrophs – first level
• Provide the organic matter and energy for all other levels
– Herbivores - second level– Carnivores – third and higher levels– Decomposers – the terminal level

Energy Pyramid
• Graphic representation of a food chain in terms of the energy contained at each trophic level
• The size of each successive level is controlled by the size of the level immediately below it

Primary Producers
• Phytoplankton in the ocean• Require sunlight, nutrients, water
and carbon dioxide for photosynthesis
• The limiting factors is commonly sunlight and/or nutrients
• PhotosynthesisSunlight + 6CO2 +6 H2O ? C6H12O6 + 6O2
– C6H12O6 is sugar
• Other organic compounds besides sugar, such as RMA and DNA, are also formed
• Rapid cell division• Phytoplankton blooms – rapid
expansion of a phytoplankton population because light and nutrients are abundant

Doubling Rates
• Someone will start working for a penny a day, but the rate doubles every day for 30 days. Has to last 30 days.
• Is that a good deal for the employer or employee?

Consumers
• Animals are the consumers• Animals break down the organic
compounds into their inorganic components to obtain the stored energy
• RespirationC6H12O6 + 6O2 ? 6CO2 +6 H2O + energy
• The recovered energy is used for movement, reproduction and growth
• Food consumed by most organisms is proportional to their body size– Generally smaller animals eat smaller
food and larger animals larger food
Feeding Styles• Grazers – consume plant material –
copepods, snails, sea urchins, some fish
• Predators – hunt and kill prey –sharks, some fish
• Scavengers – consume dead organic matter – crabs, lobsters, snails, some fish
• Filter feeders – filter the water for suspended food – barnacles, mussels, oysters
• Deposit feeders – selectively or not-selectively consume food that is mixed in the sediments

What Feeding Style are These Guys?
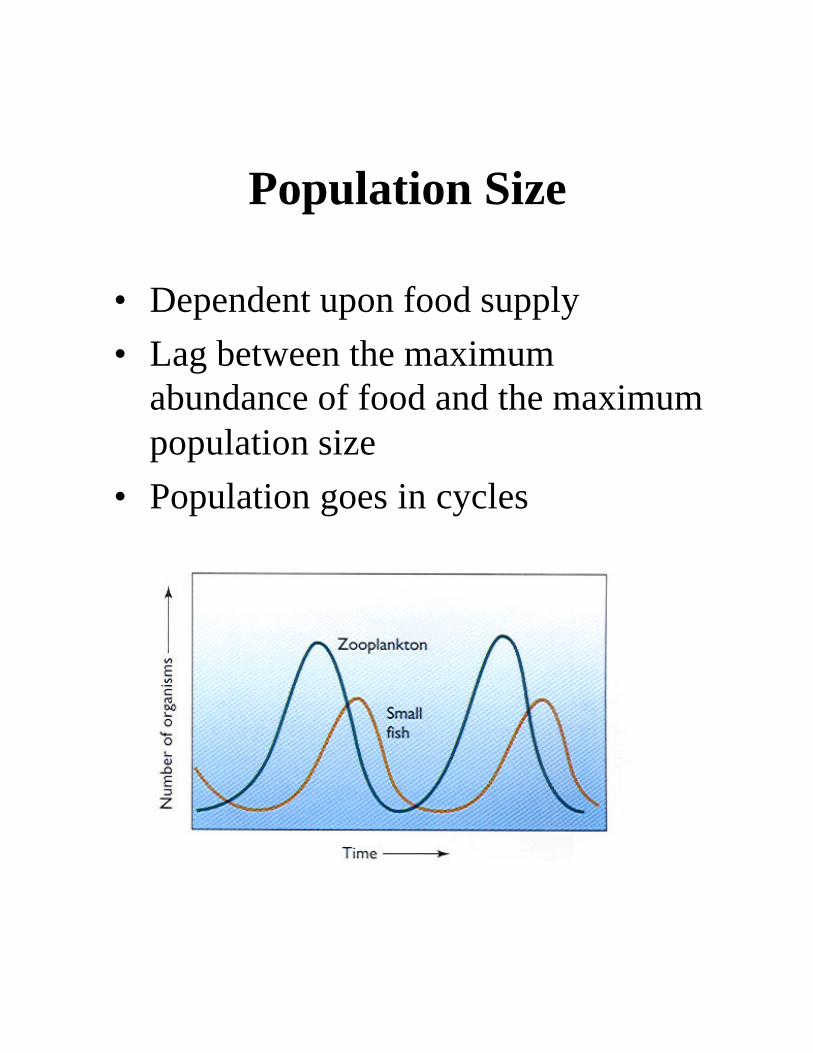
Population Size
• Dependent upon food supply• Lag between the maximum
abundance of food and the maximum population size
• Population goes in cycles

Decomposition
• Bacteria and fungi are the decomposers
• They break down organic material and release nutrients for recycling
• NH3 + 2O2 ? H+ +NO-3 + H2O
• Ammonia and oxygen to nitrate and water• Nitrate is used by plants for growth• Few bacteria are capable of completely
degrading organic material into its inorganic components
• Most operate in succession with other bacteria to decompose material in a series of stages
• Bacteria are food for other organisms either directly or indirectly

Bacteria• Aerobic
– require free oxygen to respire and decompose dead matter
• Anaerobic – Live in an oxygen free (anoxic)
environment– Obtain oxygen for respiration from
other sources such as SO4-2 (sulfate ion)
and release H2S (hydrogen sulfide gas) as a byproduct of decay
– Hydrogen sulfide – rotten egg smell

Bacteria
• Most are heterotrophs• Two autotrophic bacteria
– Cyanobacteria • blue-green algae • Photosynthesize
– Chemosynthetic bacteria• Use chemical energy released in the
oxidation of inorganic compounds to produce food
• Volcanic vent communities
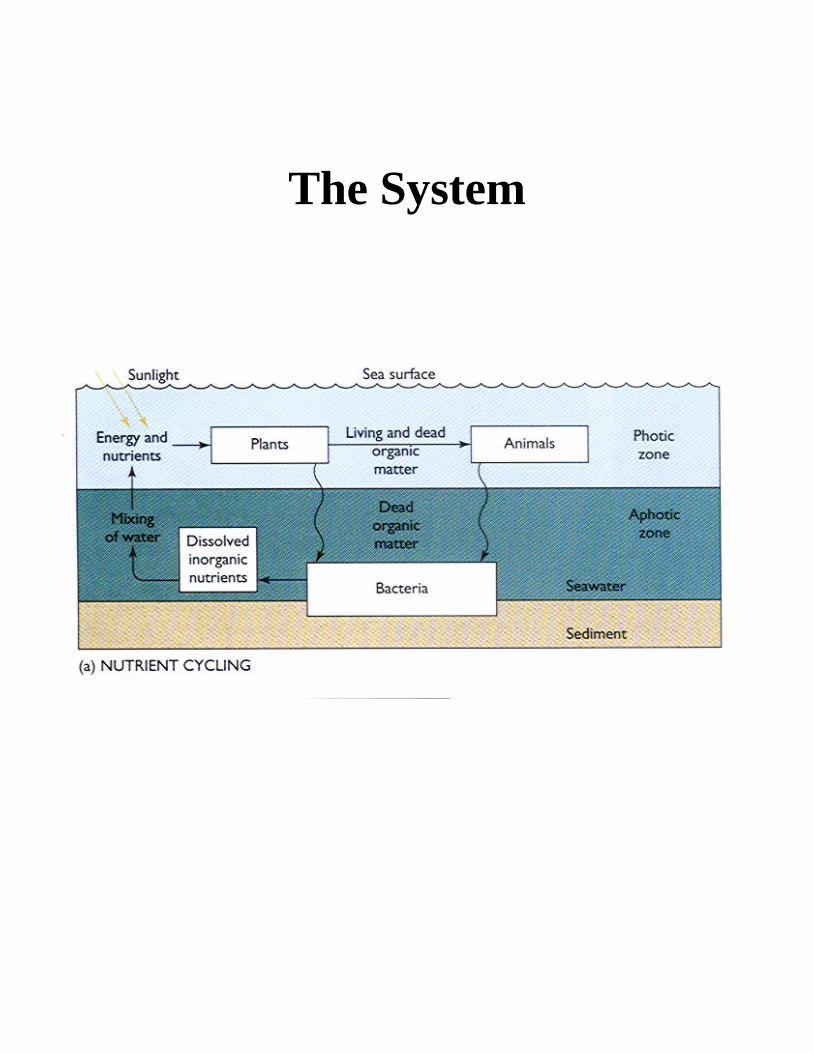
The System

Food Chains
• Transfer the energy from one tropic level to another
• Biomass is the quantity of living matter per volume of water
• With each higher trophic level, the size of the organisms generally increase, but their number and total biomass decreases
• Rate of growth is inversely related to position in the food chain
• Low on the food chain, the individuals are small but reproduce rapidly
• High on the food chain, individuals are large but reproduce slowly

Two Major Food Chains
• Grazing food chain– Phytoplankton ? zooplankton ?
nekton– Herbivores consume autotrophs in the
photic zone
• Detritus food chain– Detritus ? deposit feeder ? nekton– Non-living wastes form the base of the
food chain– Organic matter from the surface waters
settles into the deep-sea food chain when it is consumed by detritus feeders

Energy Transfer
• Only about 10-20% of the energy is transferred between trophic levels
• This produces a rapid decline in biomass at each successive trophic level

Efficiency • Example of 10% efficiency
– 100,000,000 g diatoms– 10,000,000 g copepods– 1,000,000 g small fish– 100,000 g large fish– 10,000 g human = 10 kg = 22 lb
• Most (80-90%) of the energy consumed by organisms is lost in movement or in growing non-nutritional structures, such as bone or shell
• The longer the food chain, the greater the autotrophic biomass needed to support it
• There must be a balance between the energy expended to obtain food and the energy obtained from the food
• Not all potential food sources are practical

Solar Radiation
• Only 0.1-0.2% of the solar radiation is employed for photosynthesis and its energy is stored in organic compound
• The amount of light decreases rapidly with depth
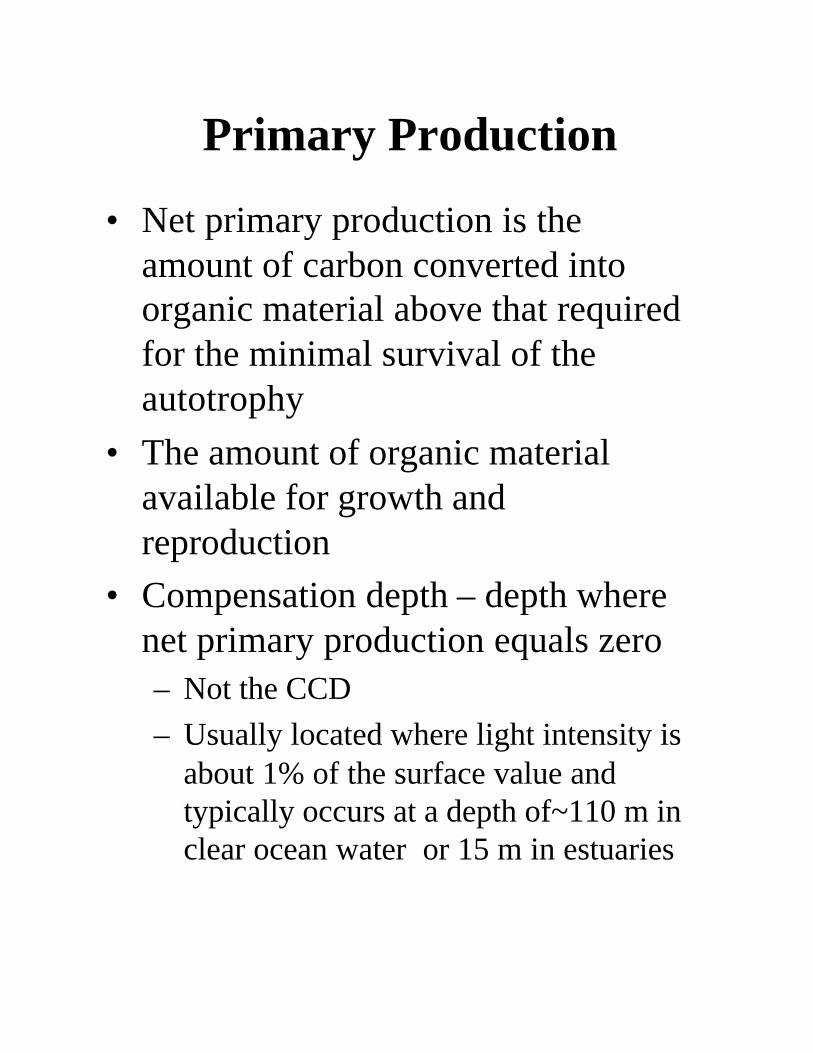
Primary Production
• Net primary production is the amount of carbon converted into organic material above that required for the minimal survival of the autotrophy
• The amount of organic material available for growth and reproduction
• Compensation depth – depth where net primary production equals zero– Not the CCD– Usually located where light intensity is
about 1% of the surface value and typically occurs at a depth of~110 m in clear ocean water or 15 m in estuaries
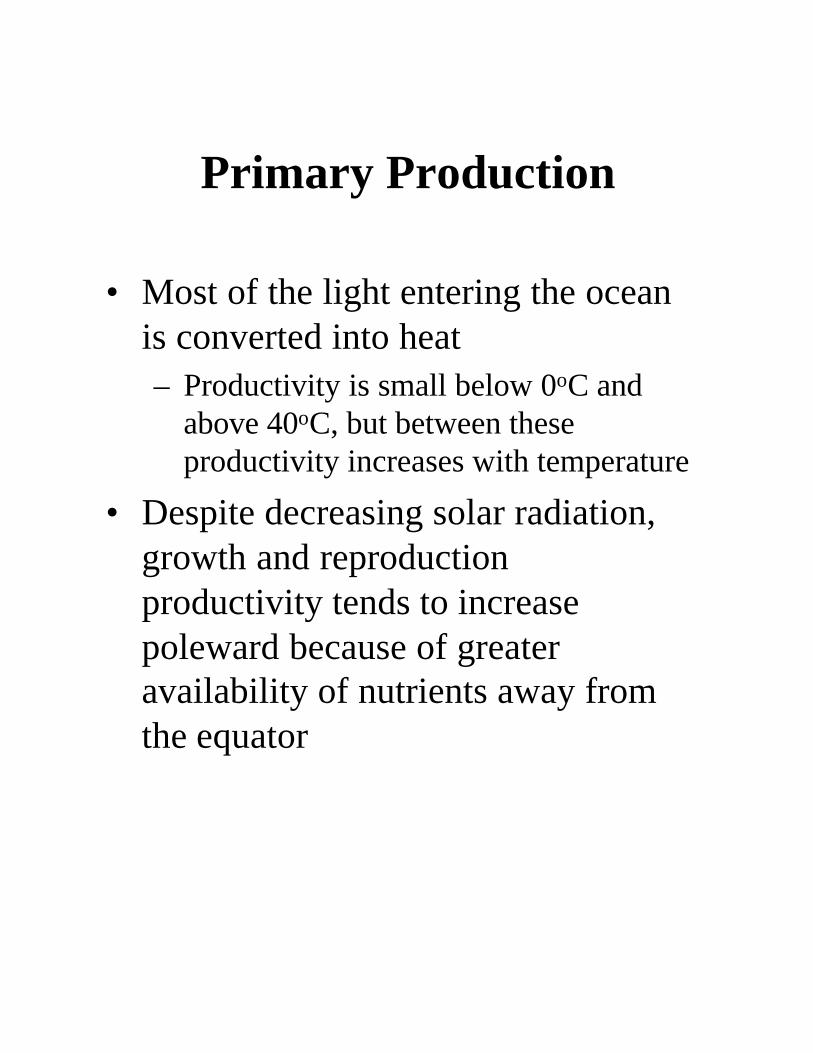
Primary Production
• Most of the light entering the ocean is converted into heat– Productivity is small below 0oC and
above 40oC, but between these productivity increases with temperature
• Despite decreasing solar radiation, growth and reproduction productivity tends to increase poleward because of greater availability of nutrients away from the equator

Nutrients• Nutrients are chemicals needed for
survival, growth, and reproduction• Macronutrients are elements or
compounds required in large quantities and include phosphorus (P), nitrogen (N), and silicon (Si)– Scarcity of macronutrients usually
occurs over a broad region and limits growth on a regional scale
• Micronutrients are indispensable elements and compounds used in very small quantities– Iron, copper, manganese, boron, cobalt
– trace metals– Because they are needed in small
amounts, they rarely are scarce over a large region, but may limit growth locally

Nutrient Limitations• Phytoplankton generally requires
phosphorus, nitrogen and carbon in the ratio of 116 C: 16N : 1P
• Despite the enormous demand for carbon, it is so abundant as bicarbonate ion that it is never a limiting factor
• N and P are needed in much smaller amounts, but can be limiting factors
• N harder to recycle than P– Decomposition releases N compounds
more slowly than P– N is usually the limiting factor
• Silicon can be a limiting factor for diatoms and silicoflagellates

Vertical Limitations• Dead organisms sink into deep water
removing them from the productive surface zone – photic zone
• Upwelling and turbulence can return nutrients to the surface
• Upwelling regions are highly productive
• Upwelling occurs– Coastal waters– Along the equator between the large
circulation gyres
• Near shore turbulence – From tides, waves, and storms (waves)

Other Limitations
• Overgrazing of autotrophs can deplete the population and lead to a decrease in productivity
• Turbidity reduces the depth of light penetration and restricts productivity even when nutrients are abundant

Marine Productivity
• Primary production – the total amount of carbon in grams converted into organic material per square meter of sea surface per year
• If plants abound, so will animals• Factors that limit plant growth and
reduce primary productivity include:– Solar radiation - primary– Nutrients- primary– Upwelling- primary– Turbulence - secondary– Grazing intensity - secondary– Turbidity - secondary
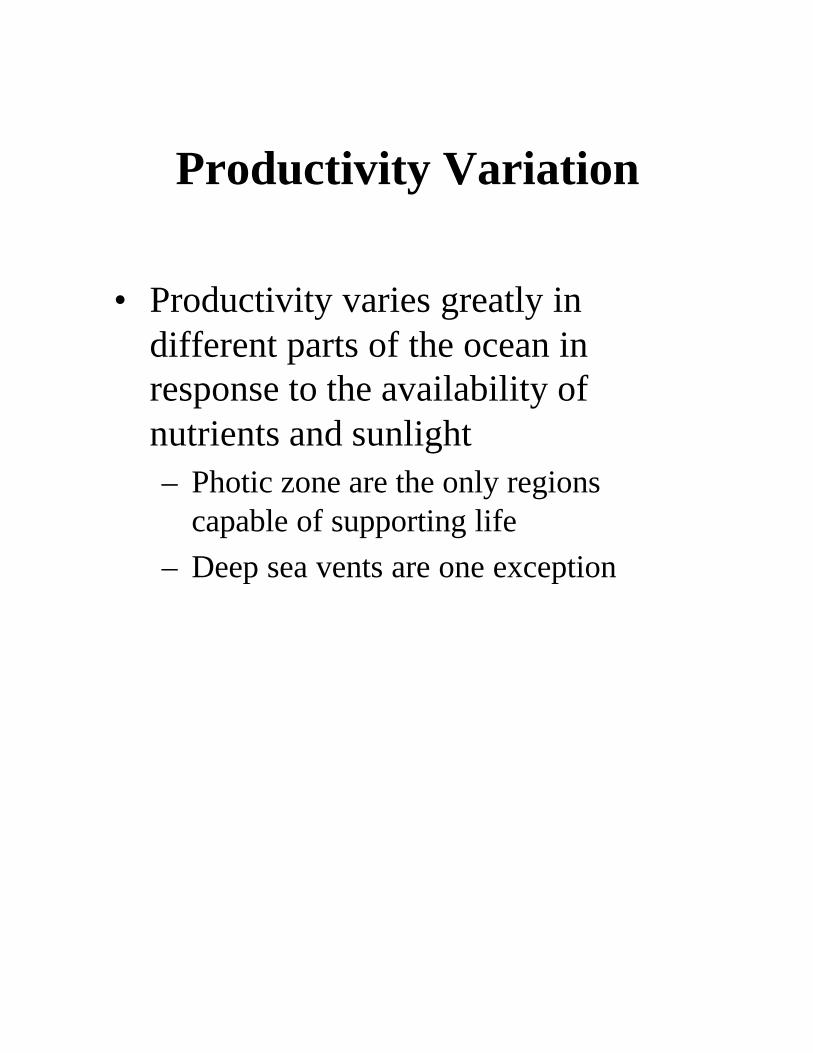
Productivity Variation
• Productivity varies greatly in different parts of the ocean in response to the availability of nutrients and sunlight– Photic zone are the only regions
capable of supporting life– Deep sea vents are one exception

Productivity by latitude regions
• In tropics and subtropics– Light is abundant– Nutrients are limiting– Strong thermocline restricts upwelling– Result = low productivity most places– High productivity where upwelling
occurs
• In temperate regions– Productivity is seasonal– Sunlight is limited seasonally– Nutrients also vary seasonally
• In polar regions– Nutrient rich– Light poor
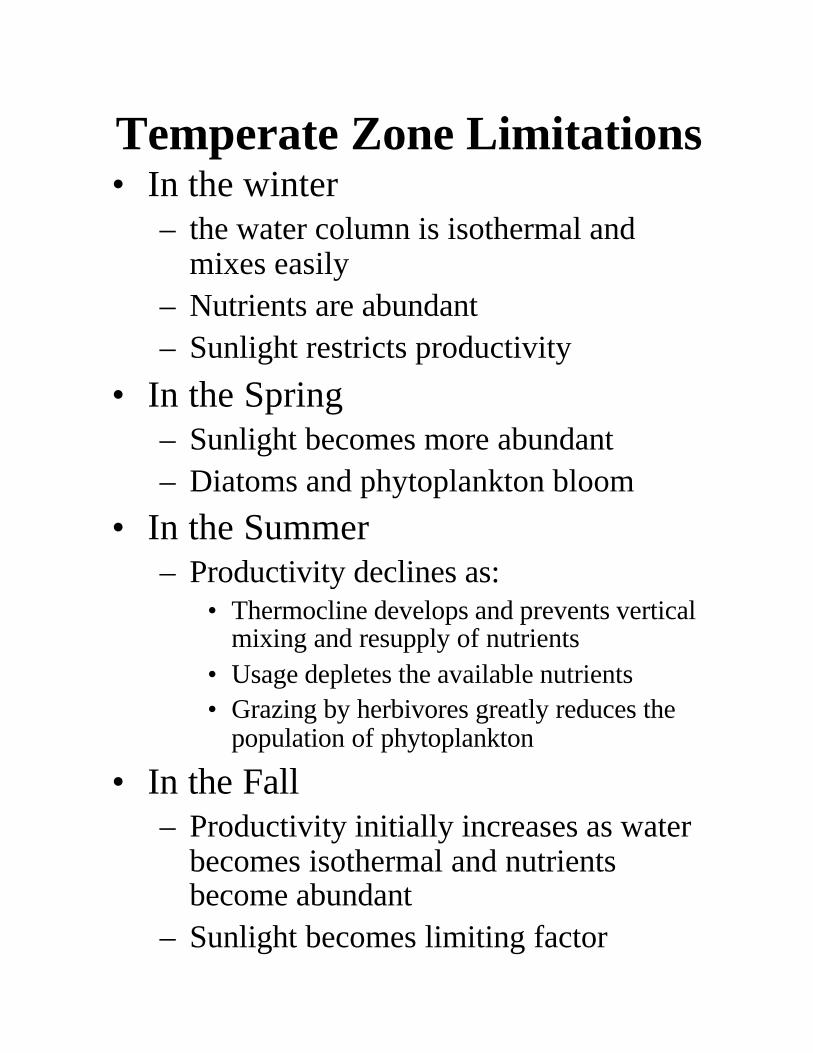
Temperate Zone Limitations• In the winter
– the water column is isothermal and mixes easily
– Nutrients are abundant– Sunlight restricts productivity
• In the Spring– Sunlight becomes more abundant– Diatoms and phytoplankton bloom
• In the Summer– Productivity declines as:
• Thermocline develops and prevents vertical mixing and resupply of nutrients
• Usage depletes the available nutrients • Grazing by herbivores greatly reduces the
population of phytoplankton
• In the Fall– Productivity initially increases as water
becomes isothermal and nutrients become abundant
– Sunlight becomes limiting factor

Global Patterns of Productivity
• Primary productivity varies from 25 to 1250 gm C/m2/yr – Lowest in the open ocean
• Low in center – like a desert• High on edges
– Continental shelves – 50-200 gm C/m2/yr
– Highest in estuaries, upwelling areas– High in polar regions

Estimating Productivity
• Plankton biomass is good indicator of biomass in rest of food web
• Annual primary production =APP– APP = PPR x Area– PPR – Primary production rate
• Transfer efficiency = TE– Measure of the amount of carbon that is
passed between trophic levels– Varies from 10-20 %, generally
• Potential production = PP– PP for each trophic level– PP = APP x TE (for each step)– Must use TE for each step in the food
chain to the trophic level of the organism under consideration

Fish Production

Productivity• Open ocean has greatest biomass
productivity– Rate of productivity is very low – Area is very large
• Open ocean food chains are longer and energy transfer low, so fish populations are small
• Most fish production is equally divided between upwelling areas and coastal waters
• Annual fish production – ~ 240 million tons/yr

Fishing
• Annual fish production – ~ 240 million tons/yr
• Fishing– 1970 – 70 million tons/yr– 1990 – 98 million tons/yr– Limit should be 110 million tons/yr

Productivity in Upwelling Regions
• Upwelling of nutrient rich water supports large populations of phytoplankton and fish
• Waters off Peru – upwelling and support one of the world’s largest fisheries
• During El Nino, the upwelling stops and the productivity is severely reduced
• Leads to mass starvation of organisms – fish, birds, etc.

Global Primary Productivity

Global Zooplankton Density

Global Benthic Biomass Density

Residence Time
• The average time that a material remains in a system
• Calculations are only valid if input and output of material from system are known
• If the system is steady-state, input = output
Residence time = material within the systeminput or output of system