Pepperdine University Pepperdine University
Pepperdine Digital Commons Pepperdine Digital Commons
Theses and Dissertations
2018
Best practices to reduce math anxiety Best practices to reduce math anxiety
Karen Michelle Mitchell
Follow this and additional works at: https://digitalcommons.pepperdine.edu/etd
Recommended Citation Recommended Citation Mitchell, Karen Michelle, "Best practices to reduce math anxiety" (2018). Theses and Dissertations. 1013. https://digitalcommons.pepperdine.edu/etd/1013
This Dissertation is brought to you for free and open access by Pepperdine Digital Commons. It has been accepted for inclusion in Theses and Dissertations by an authorized administrator of Pepperdine Digital Commons. For more information, please contact [email protected] , [email protected].
Pepperdine University
Graduate School of Education and Psychology
BEST PRACTICES TO REDUCE MATH ANXIETY
A dissertation submitted in partial satisfaction
of the requirements for the degree of
Doctor of Education in Organizational Leadership
by
Karen Michelle Mitchell
October, 2018
Farzin Madjidi, Ed.D. – Dissertation Chairperson
This dissertation, written by
Karen Michelle Mitchell
under the guidance of a Faculty Committee and approved by its members, has been submitted to and accepted by the Graduate Faculty in partial fulfillment of the requirements for the degree of
DOCTOR OF EDUCATION Doctoral Committee:
Farzin Madjidi, Ed.D., Chairperson
Lani Fraizer, Ed.D.
Gabriella Miramontes, Ed.D.

© Copyright by Karen Michelle Mitchell (2018)
All Rights Reserved
TABLE OF CONTENTS Page
LIST OF TABLES ....................................................................................................................... vii
LIST OF FIGURES ..................................................................................................................... viii
DEDICATION ................................................................................................................................ x
ACKNOWLEDGMENTS .............................................................................................................. xi
VITA ............................................................................................................................................ xiii
ABSTRACT .................................................................................................................................. xv
Chapter 1: Introduction .................................................................................................................... 1
Background .......................................................................................................................... 1 STEM Proficiency ............................................................................................................... 2 Math and Anxiety ................................................................................................................ 4 Perceptions About Math ...................................................................................................... 5 Various Roles in Math Anxiety ........................................................................................... 5 Statement of the Problem .................................................................................................... 7 Purpose Statement ............................................................................................................... 8 Research Questions ............................................................................................................. 8 Significance of the Study ..................................................................................................... 9 Assumptions of the Study .................................................................................................. 11 Limitations of the Study .................................................................................................... 12 Summary ............................................................................................................................ 14
Chapter 2: Literature Review ........................................................................................................ 16
General Anxiety ................................................................................................................. 16 Math Achievement ............................................................................................................ 20 Understanding Math Anxiety ............................................................................................ 23 Consequences of Math Anxiety ......................................................................................... 36 Reducing Math Anxiety .................................................................................................... 38 Understanding Self-Efficacy ............................................................................................. 43 Understanding Mindset ..................................................................................................... 46 Consequences of Mindset .................................................................................................. 51 Changing Mindset ............................................................................................................. 52 Increasing Growth Mindset ............................................................................................... 55 Parachutes and Decimals Case Study ................................................................................ 57 Summary ............................................................................................................................ 58
Chapter 3: Research Design and Methodology ............................................................................. 60
v
Page
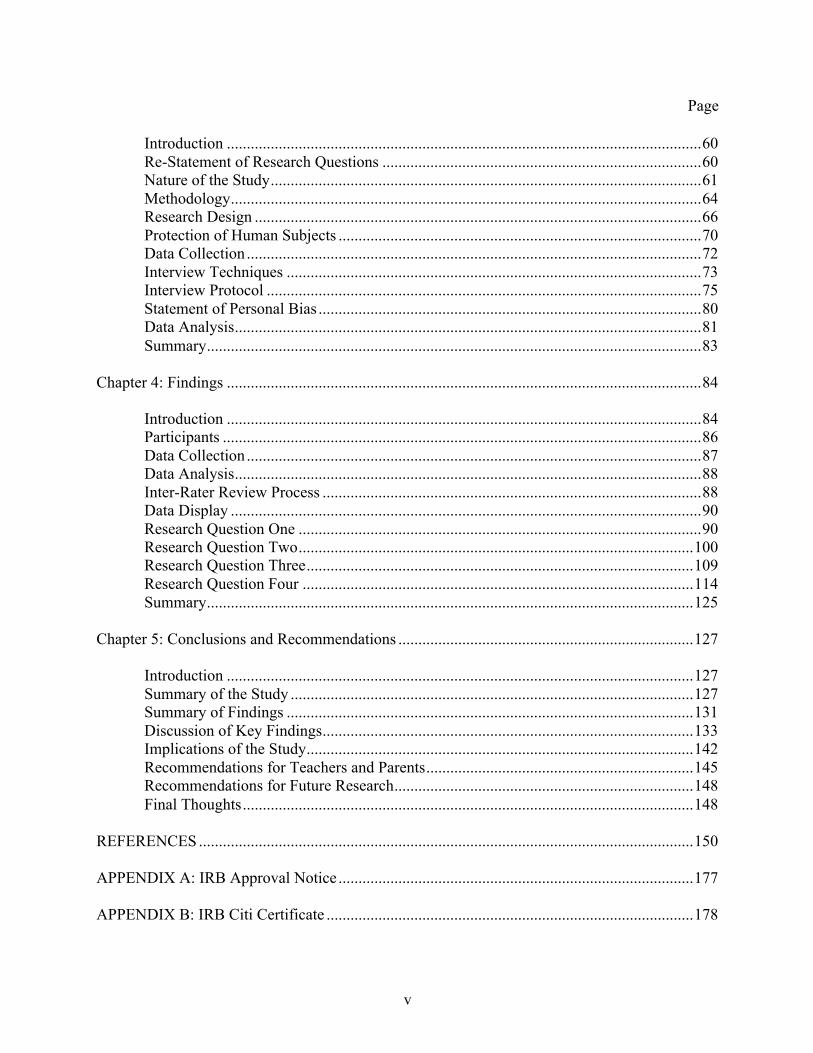
Introduction ....................................................................................................................... 60 Re-Statement of Research Questions ................................................................................ 60 Nature of the Study ............................................................................................................ 61 Methodology ...................................................................................................................... 64 Research Design ................................................................................................................ 66 Protection of Human Subjects ........................................................................................... 70 Data Collection .................................................................................................................. 72 Interview Techniques ........................................................................................................ 73 Interview Protocol ............................................................................................................. 75 Statement of Personal Bias ................................................................................................ 80 Data Analysis ..................................................................................................................... 81 Summary ............................................................................................................................ 83
Chapter 4: Findings ....................................................................................................................... 84
Introduction ....................................................................................................................... 84 Participants ........................................................................................................................ 86 Data Collection .................................................................................................................. 87 Data Analysis ..................................................................................................................... 88 Inter-Rater Review Process ............................................................................................... 88 Data Display ...................................................................................................................... 90 Research Question One ..................................................................................................... 90 Research Question Two ................................................................................................... 100 Research Question Three ................................................................................................. 109 Research Question Four .................................................................................................. 114 Summary .......................................................................................................................... 125
Chapter 5: Conclusions and Recommendations .......................................................................... 127
Introduction ..................................................................................................................... 127 Summary of the Study ..................................................................................................... 127 Summary of Findings ...................................................................................................... 131 Discussion of Key Findings ............................................................................................. 133 Implications of the Study ................................................................................................. 142 Recommendations for Teachers and Parents ................................................................... 145 Recommendations for Future Research ........................................................................... 148 Final Thoughts ................................................................................................................. 148
REFERENCES ............................................................................................................................ 150
APPENDIX A: IRB Approval Notice ......................................................................................... 177
APPENDIX B: IRB Citi Certificate ............................................................................................ 178

vi
Page
APPENDIX C: Informed Consent Form ..................................................................................... 179
APPENDIX D: Recruitment Script ............................................................................................. 183
APPENDIX E: Peer Reviewer Form ........................................................................................... 184
vii
LIST OF TABLES
Page
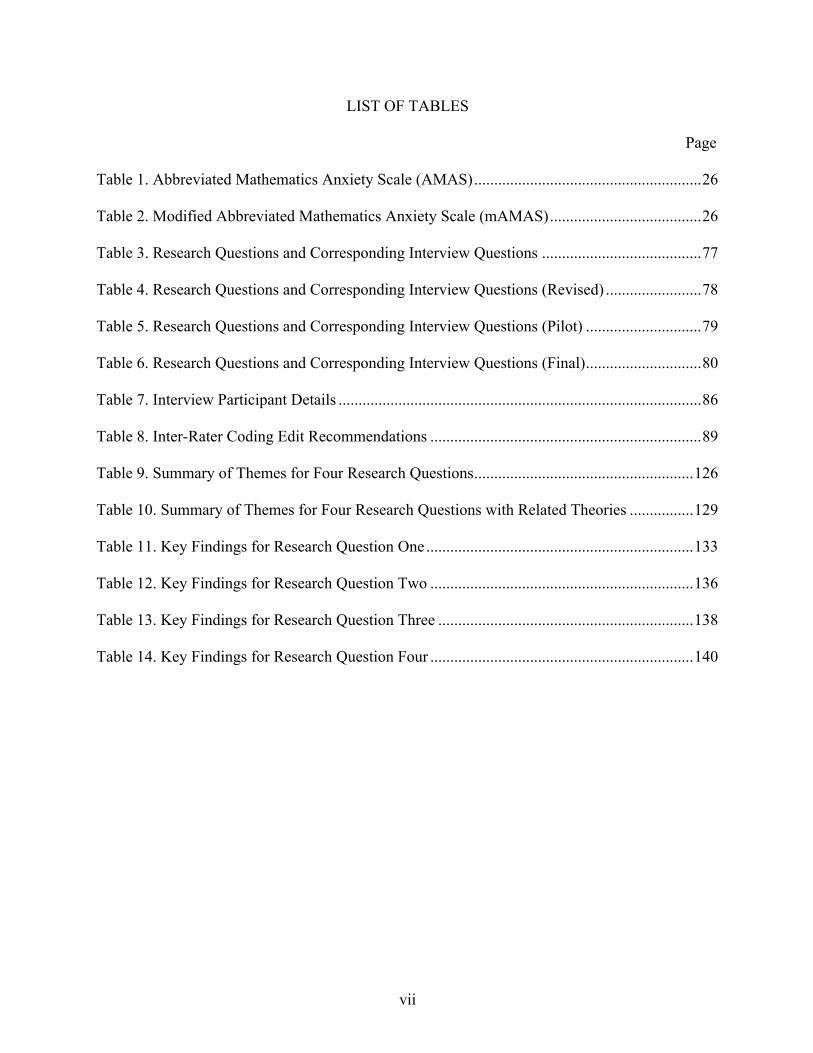
Table 1. Abbreviated Mathematics Anxiety Scale (AMAS) ......................................................... 26
Table 2. Modified Abbreviated Mathematics Anxiety Scale (mAMAS) ...................................... 26
Table 3. Research Questions and Corresponding Interview Questions ........................................ 77
Table 4. Research Questions and Corresponding Interview Questions (Revised) ........................ 78
Table 5. Research Questions and Corresponding Interview Questions (Pilot) ............................. 79
Table 6. Research Questions and Corresponding Interview Questions (Final) ............................. 80
Table 7. Interview Participant Details ........................................................................................... 86
Table 8. Inter-Rater Coding Edit Recommendations .................................................................... 89
Table 9. Summary of Themes for Four Research Questions ....................................................... 126
Table 10. Summary of Themes for Four Research Questions with Related Theories ................ 129
Table 11. Key Findings for Research Question One ................................................................... 133
Table 12. Key Findings for Research Question Two .................................................................. 136
Table 13. Key Findings for Research Question Three ................................................................ 138
Table 14. Key Findings for Research Question Four .................................................................. 140
viii
LIST OF FIGURES
Page
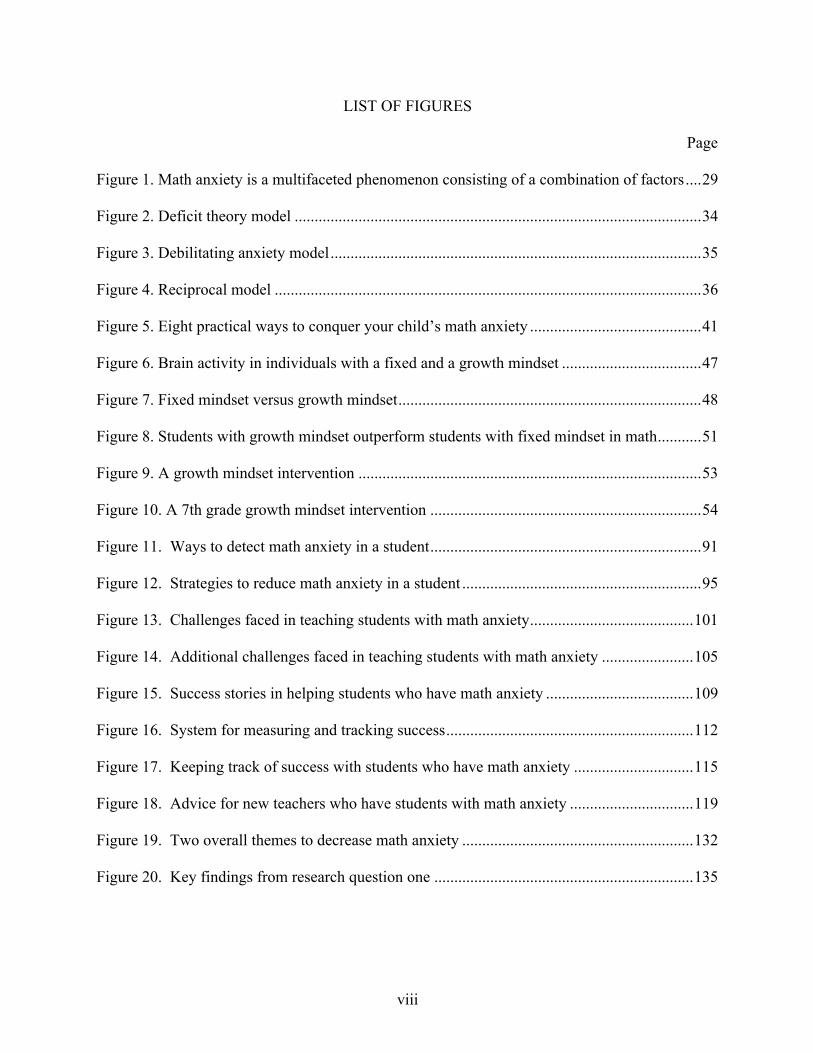
Figure 1. Math anxiety is a multifaceted phenomenon consisting of a combination of factors .... 29
Figure 2. Deficit theory model ...................................................................................................... 34
Figure 3. Debilitating anxiety model ............................................................................................. 35
Figure 4. Reciprocal model ........................................................................................................... 36
Figure 5. Eight practical ways to conquer your child’s math anxiety ........................................... 41
Figure 6. Brain activity in individuals with a fixed and a growth mindset ................................... 47
Figure 7. Fixed mindset versus growth mindset ............................................................................ 48
Figure 8. Students with growth mindset outperform students with fixed mindset in math ........... 51
Figure 9. A growth mindset intervention ...................................................................................... 53
Figure 10. A 7th grade growth mindset intervention .................................................................... 54
Figure 11. Ways to detect math anxiety in a student .................................................................... 91
Figure 12. Strategies to reduce math anxiety in a student ............................................................ 95
Figure 13. Challenges faced in teaching students with math anxiety ......................................... 101
Figure 14. Additional challenges faced in teaching students with math anxiety ....................... 105
Figure 15. Success stories in helping students who have math anxiety ..................................... 109
Figure 16. System for measuring and tracking success .............................................................. 112
Figure 17. Keeping track of success with students who have math anxiety .............................. 115
Figure 18. Advice for new teachers who have students with math anxiety ............................... 119
Figure 19. Two overall themes to decrease math anxiety .......................................................... 132
Figure 20. Key findings from research question one ................................................................. 135

ix
Page
Figure 21. Key findings from research question two ................................................................. 137
Figure 22. Key findings from research question three ............................................................... 139
Figure 23. Key findings from research question four ................................................................. 142

x
DEDICATION
I dedicate this dissertation to my husband, Pete Mitchell, who believes in me and pushes
me to always be a better version of myself. You offered unending encouragement and made
many sacrifices along the way to make this happen. I love you and am grateful for you.

xi
ACKNOWLEDGMENTS
First, I would like to acknowledge my Lord and Savior, Jesus. Thank you, Lord, for your
grace and wisdom and providing the strength to travel on this journey. I am grateful for the
people you have brought into my life.
My husband, Pete, who has been with me every step of the way. I cannot wait to
continue on this journey with you. Now it is my turn to do more of the cooking. I love you and
our life together.
My two children, Josh and Amanda, who are my greatest blessings. Your encouraging
words, hugs, texts, and notes brought many smiles to my face. I count it the greatest privilege to
be your mom, and I was able to accomplish this because you believed in me. I love you more
than you will ever know.
My parents, Larry and Sandy, who believed in me from the start. I am thankful for your
unconditional love, support, and example. You have always encouraged me to pursue my
dreams and you found a way to provide endless opportunities for me growing up.
My sister, Melinda, who I am fortunate to call my dear friend. You know all about me
and you love me just the same. I am ready to have some fun outings and holiday celebrations
together.
My friend, Dr. B, who completed this journey before me. It was because of our coffee
meeting and your encouragement that I followed your example to become a fellow doctor.
My boss, Jaclene, and co-workers at Applied Medical who were completely
understanding of my schedule and various times off work. You picked up the slack, stepped in
for me, and made me feel it was all okay.

xii
My dear friends and colleagues, Michele and Jay – 2/3 of KMJ. What can I say? We
started this journey together and we are crossing the finish line together. You have been my
greatest support and I am thankful for you and our group.
Finally, my esteemed dissertation committee, Dr. Farzin Madjidi, Dr. Lani Fraizer, and
Dr. Gabriella Miramontes. Thank you for your guidance, tough love, knowledge, experience,
insight, and stories. You provided the tools for success.
xiii
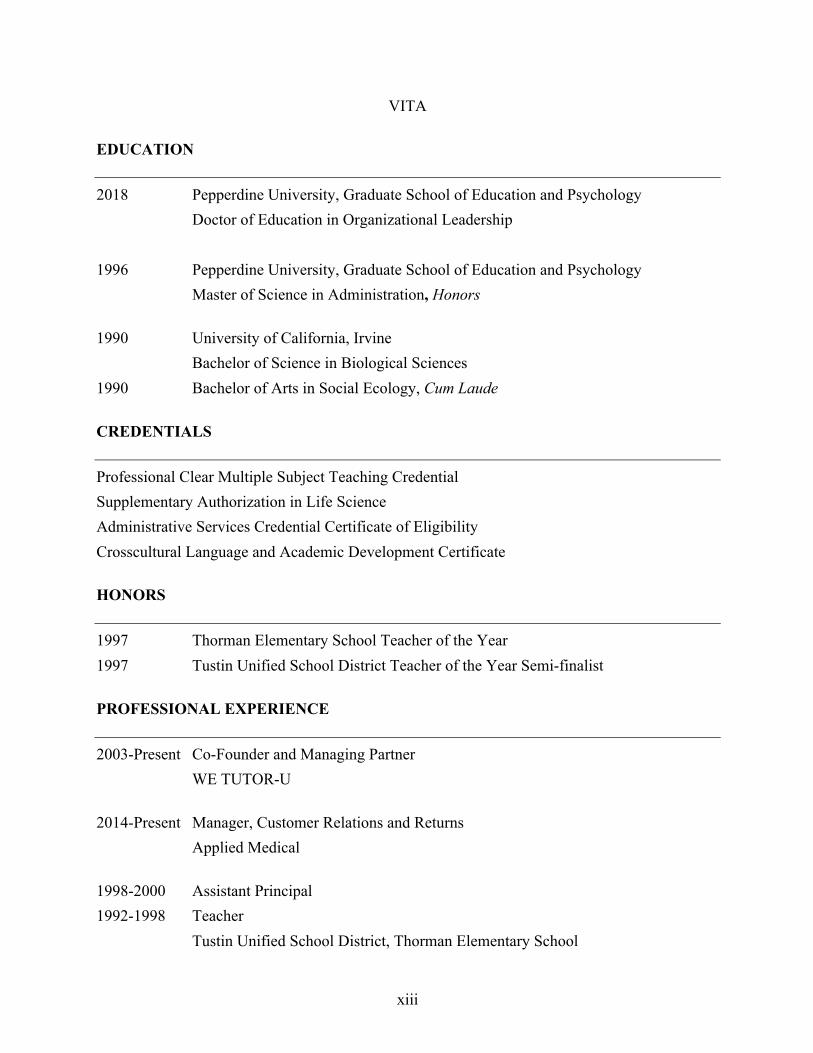
VITA
EDUCATION
2018 Pepperdine University, Graduate School of Education and Psychology Doctor of Education in Organizational Leadership 1996 Pepperdine University, Graduate School of Education and Psychology Master of Science in Administration, Honors
1990 University of California, Irvine Bachelor of Science in Biological Sciences 1990 Bachelor of Arts in Social Ecology, Cum Laude
CREDENTIALS
Professional Clear Multiple Subject Teaching Credential Supplementary Authorization in Life Science Administrative Services Credential Certificate of Eligibility Crosscultural Language and Academic Development Certificate
HONORS
1997 Thorman Elementary School Teacher of the Year 1997 Tustin Unified School District Teacher of the Year Semi-finalist
PROFESSIONAL EXPERIENCE
2003-Present Co-Founder and Managing Partner WE TUTOR-U
2014-Present Manager, Customer Relations and Returns Applied Medical
1998-2000 Assistant Principal 1992-1998 Teacher Tustin Unified School District, Thorman Elementary School

xiv
VOLUNTEER EXPERIENCE
2013-2014 Saddleback Valley PTA, Treasurer 2012-2014 Rancho Santa Margarita Intermediate School Site Council, Elected Member 2008-2013 Robinson Elementary PTA, President/Executive VP/Treasurer/Advocacy 2008-2013 Robinson Elementary School Site Council, Elected Member
xv
ABSTRACT
The subjects of science, technology, engineering, and math (STEM) have grown in importance
because they are fundamental to the future quality of life and the ability to compete in today’s
global society. The demand for STEM careers is increasing; however, the United States is
having difficulty meeting this demand. Society needs students who can research and think
critically, so they can be proficient in STEM education and become the next generation of
mathematicians, scientists, technologists, and engineers. Mathematical proficiency is of
particular concern because while it is required for STEM education success, individuals find it
challenging.
Both adults and children have apprehension about mathematics, and their negative
attitudes toward math develop a barrier to STEM education and careers. This negative math
phobia, or math anxiety, causes a decrease in math achievement. This study explored the
perceptions of elementary teachers in establishing a classroom environment free of math
anxiety. Specifically, this study focused on best practices that teachers incorporate in order to
reduce math anxiety.
The purpose of the study was to (a) determine the strategies and practices teachers
employ to reduce math anxiety, (b) determine the challenges teachers face in reducing math
anxiety, (c) determine how teachers measure the success of their practices in reducing math
anxiety, and (d) determine the recommendations teachers would make for future implementation
of strategies in reducing math anxiety.
1
Chapter 1: Introduction
Background
In his book, The World is Flat, Friedman (2007) describes a flattening of the world
because economic competition has become global and the playing field has been leveled. In this
global economy, the subjects of science, technology, engineering, and math (STEM) have grown
in importance because they are fundamental to our quality of life and future prosperity (Cal,
2017; Kennedy & Odell, 2014; National Mathematics Advisory Panel, 2008; Yildirim & Selvi,
2015). Instead of viewing the four subjects as independent disciplines, they are thought of as a
meta-discipline and integrated together (Estapa & Tank, 2017; Kennedy & Odell, 2014). STEM
education includes teaching and learning of the disciplines in all classroom settings from
preschool through graduate school (Gonzalez & Kuenzi, 2012).
The purpose of STEM education is to promote and develop a STEM literate society that
can compete in today’s global economy. Bybee (2013) explains STEM literacy as:
• “Knowledge, attitudes, and skills to identify questions and problems in life situations,
explain the natural and designed world, and draw evidence-based conclusions about
STEM-related issues” (p. 101).
• “Understanding of the characteristic features of STEM disciplines as forms of human
knowledge, inquiry, and design” (p. 101).
• “Awareness of how STEM disciplines shape our material, intellectual, and cultural
environments” (p. 101).
• “Willingness to engage in STEM-related issues and with the ideas of science,
technology, engineering and mathematics as a constructive, concerned, and reflective
citizen” (p. 101).
2
STEM Proficiency
Proficiency in STEM education is becoming increasingly important in modern society as
students are expected to have the knowledge and skills for solving problems and analyzing
information (National Mathematics Advisory Panel, 2008; U.S. Department of Education,
2017). Society needs students who are able to research, innovate, and think deeply, so they can
participate successfully in STEM careers (U.S. National Academies Press, 2006; U.S.
Department of Education, 2017). According to the U.S. Bureau of Labor Statistics, occupations
in STEM fields will increase by 9 million between 2012 and 2022 (Vilorio, 2014). By 2022,
software development is expected to have more than 200,000 job openings and civil engineering
is expected to have more than 120,000 job openings (Vilorio, 2014). Also, by 2022, careers in
mathematics are expected to increase 23% and jobs for statisticians are expected to increase by
27% (Vilorio, 2014).
While there is an increasing need and opportunity for STEM employment, the U.S. is
facing an inadequacy in meeting the demand (Roehrig, Moore, Wang, & Park, 2012). The U.S.
is expected to lose a fraction of its science and engineering workforce because 26% of science
and engineering workers were above age 50 in 2003 (National Science Board, 2008). During the
time of the decreasing workforce, growth in STEM careers will triple that of other occupations
(National Science Board, 2008). In addition, there will not be as many scientists and engineers
to import from overseas because they are working in their own countries, such as China,
Singapore, South Korea, and Taiwan, where rapid research and development is occurring
(National Science Foundation, 2007). Finally, U.S. students may not possess the competence
required to successfully fill the STEM positions (National Research Council, 2011). The 2010
3
Executive Report by President’s Council of Advisors on Science and Technology state the
following:
The success of the United States in the 21st century - its wealth and welfare - will
depend on the ideas and skills of its population. These have always been the
Nation’s most important assets. As the world becomes increasingly
technological, the value of these national assets will be determined in no small
measure by the effectiveness of science, technology, engineering, and
mathematics (STEM) education in the United States. STEM education will
determine whether the United States will remain a leader among nations
and...help produce the capable and flexible workforce needed to compete in a
global marketplace. (p. vii)
Mathematical proficiency is of particular concern for achieving the necessary competence
in STEM fields (National Mathematics Advisory Panel, 2008); however, there may be little
interest in pursuing mathematics because individuals find it challenging (Harari, Vukovic, &
Bailey, 2013). Approximately 75% of U.S. eighth graders are not proficient in math when they
complete eighth grade (National Research Council, 2011). The National Assessment of
Education Progress (NAEP) states that 27% of eighth graders could not correctly shade one-third
of a rectangle and 45% could not solve a word problem that required dividing fractions (U.S
Department of Education, 2004). Moreover, NAEP data shows that 39% of students are at or
above the proficient level of math in eighth grade (U.S. Department of Education, 2007), and
only 23% are at or above the proficient level by twelfth grade (U.S. Department of Education,
2005). Finally, 78% of adults cannot compute the interest paid on a loan, 71% cannot calculate
miles per gallon on a trip, and 58% cannot calculate a 10% tip (Phillips, 2007). Murnane and
4
Levy (1996) stressed the importance of math as a skill when they explained that almost half of
all seventeen-year olds cannot do math at the level needed to get a job at a modern automobile
plant. The statistics are disheartening because mathematics is considered the foundational
language of science, technology, and engineering (Schmidt & Houang, 2007).
Since mathematics is a foundational language, mathematical proficiency is critical for
success in the subject. Factors that affect mathematical proficiency are working memory,
gender, math anxiety, and mindset/self-efficacy (Dweck, 2016; Miller & Bichsel, 2004). Math
anxiety is considered to be the most significant factor; however, mindset and self-efficacy are
related because they are negatively related to math anxiety (Dweck, 2016).
Math and Anxiety
Regardless of cultural and economic background, two-thirds of adults in the United
States fear and dislike math and recall having negative experiences with the subject, even in
elementary school (Burns, 1998; Furner & Duffy, 2002). These fears and negative experiences
could pose as a major impediment to future math experiences and entry in a STEM career
(Ferguson, Maloney, Fugelsang, & Risko, 2015).
Research shows that in addition to adults, children have apprehension about mathematics
as well (Blazer, 2011). For many children, anxiety and a negative attitude toward math are
growing barriers to mathematics (Geist, 2010), and negative attitudes often develop from
society’s over reliance on timed tests and standardized testing (Scarpello, 2007). These attitudes
about math are perpetuated by the following math myths that exist today:
• “Math is thought to be inherently difficult” (Ashcraft, 2002, p. 181).
• “Aptitude is considered far more important than effort” (Ashcraft, 2002, p. 181).
5
• “Being good at math is considered relatively unimportant, or even optional”
(Ashcraft, 2002, p. 181).
Perceptions About Math
According to Ashcraft (2002), individuals continue to believe these myths. There is an
acceptance of the idea that math is a field where a student has talent or not, such as athletics, art,
or music (Stodolsky, 1985). Society would not say that about reading; however, it is said about
math even though math is necessary for many of life’s functions. Students need a sufficient level
of numeracy, which is the counterpart of literacy (Paulos, 1988). Math negativity and anxiety
are an impediment to numeracy and create a disparity between levels of math achievement
(Beilock & Maloney, 2015).
No longer can we accept that a rigorous mathematics education is reserved for the
few who will go on to be engineers for scientists. Mathematics may indeed be the
“the new literacy” (Schoenfeld, 1995); at the least, it is essential for any citizen
who is to be prepared for the future (National Mathematics Advisory Panel, 2008,
p. 5).
Various Roles in Math Anxiety
Role of educators. Research shows there are high levels of math anxiety in many
preservice elementary teachers (Gresham, 2004; Singh, Granville, & Dika, 2002; Zettle &
Raines, 2002). Elementary school teachers who are higher in math anxiety affect their students
negatively. At the beginning and end of the school year, Beilock, Gunderson, Ramirez, and
Levine (2010) assessed first- and second-grade teachers’ levels of math anxiety and their
students’ attitudes and math achievement. They discovered that when female elementary
teachers are higher in math anxiety, their students have lower levels of math achievement and
6
believe stereotypes that boys are better at math than girls (Beilock et al., 2010). The results did
not indicate if the teachers’ math anxiety levels affected the student’s math anxiety; however,
negative attitudes are related to math anxiety (Hembree, 1990).
Educators also play a key role in developing students’ mindsets. Studies show the
positive effects of growth mindset on students’ achievement (Aronson, Fried, & Good, 2002;
Blackwell, Trzesniewski, & Dweck, 2007; Boaler, 2013a, 2016), and the importance of
communicating that learning takes time and is the product of effort. The most successful schools
design learning practices on growth mindset messages and beliefs (Sahlberg, 2011; Stigler &
Hiebert, 1999). Since teachers regularly communicate with students about their ability and
learning, a need exists in order to study the best practices and strategies educators use in order to
promote a growth mindset.
Role of parents. Parents’ math anxiety affects their children’s math anxiety in specific
situations. Maloney, Ramirez, Gunderson, Levine, and Beilock (2015) assessed parents’ math
anxiety and the frequency of homework help they provide to their first- and second-grade
children. Parents who regularly help their children with homework may pass on their frustration
and dislike of math to their children. They have the ability to be positive or negative academic
role models to their children.
Parents also affect their children’s mindset by the words they use and how they offer
praise (Dweck, 2016). By praising brains and talent, parents think they are increasing their
children’s confidence. However, this technique has the opposite effect because children doubt
themselves when something is difficult or challenging (Dweck, 2016). The best gift parents can
give their children is “to teach their children to love challenges, be intrigued by mistakes, enjoy
effort, seek new strategies, and keep on learning” (Dweck, 2016, pp. 179-180).
7
Role of teacher education programs. Most mathematics curriculum and instructional
practices are traditional in that memorization of facts is emphasized, teachers lecture, and
students do not have ample opportunity to engage in experiential learning and hands-on activities
(Gresham, 2004; Tobias & Weissbrod, 1980). This traditional emphasis results in the learning
styles of all students not being met and an increase in math anxiety (Hodges, 1983; Sloan,
Daane, & Geisen, 2001; Tobias & Weissbrod, 1980). All teacher education programs should
emphasize the importance of an inviting classroom, students’ learning style differences, safe
environment, multiple teaching approaches, and praise for students’ accomplishments in math
(Gresham, 2007).
Role of STEM initiatives. Current STEM initiatives focus on math content and largely
ignore affective factors such as math anxiety, self-efficacy, and growth mindset (Beilock &
Maloney, 2015). Since math anxiety is a widespread phenomenon and negatively affects math
performance, math attitudes, and math avoidance (Ashcraft & Kirk, 2001; Beilock & Maloney,
2015; Blazer, 2011; Hoffman, 2010), it should be addressed in present day policy
initiatives. More STEM teachers and more students pursuing STEM careers would certainly be a
positive result, in addition to incorporating best practices to reduce math anxiety and growth
mindset.
Statement of the Problem
Individual differences in math achievement are attributed to a variety of factors (Dweck,
2016; Miller & Bichsel, 2004). First, a widely researched factor is working memory, consisting
of retrieval, processing, and storage (Adams & Hitch, 1998; Ashcraft, 2002; Brainerd, 1983;
Geary & Widaman, 1987; Hitch, 1978a; Hitch, 1978b). A second factor contributing to
differences in math achievement is gender (Hyde, Fennema, Ryan, Frost, & Hopp, 1990; Leahey
8
& Guo, 2001). A third factor is math anxiety (Ashcraft, 2002; Faust, Ashcraft, & Fleck, 1996;
Wu et al., 2012). The final factor known to cause differences in math achievement is mindset
and self-efficacy (Dweck, 2008).
Out of the four factors, this study will primarily focus on math anxiety because research
indicates it is the strongest predictor of math performance (Ashcraft, 2002; Ashcraft & Kirk,
2001; Beilock & Maloney, 2015; Hoffman, 2010; Miller & Bichsel, 2004). Mindset and self-
efficacy will also be areas of interest because they have a negative relationship with math anxiety
and affect math performance (Aksu, Ozkaya, Gedik, & Konyalioglu, 2016; Cooper & Robinson,
1991; Jain & Dowson, 2009; Ma & Xu, 2004;). The earlier math anxiety and mindset is
addressed in students, especially elementary school age, the earlier improvements in
performance may be demonstrated, the shorter the period of math avoidance, and the earlier
participation in STEM may be experienced (Beilock & Maloney, 2015).
Purpose Statement
The purpose of the study was to:
• Determine the strategies and practices teachers employ to reduce math anxiety.
• Determine the challenges teachers face in reducing math anxiety.
• Determine how teachers measure the success of their practices in reducing math
anxiety.
• Determine the recommendations teachers would make for future implementation of
strategies in reducing math anxiety.
Research Questions
In order to discover how to increase math achievement by reducing math anxiety, the
following research questions (RQ) were addressed in this study.
9
Research Question 1: What strategies and practices do teachers employ to reduce math
anxiety?
Research Question 2: What challenges do teachers face in reducing math anxiety?
Research Question 3: How do teachers measure the success of their practices in reducing
math anxiety?
Research Question 4: What recommendations would teachers make for future
implementation of strategies in reducing math anxiety?
Significance of the Study
It is critical that students receive the instruction and tools they need to be successful in
math (National Mathematics Advisory Panel, 2008). Teachers need to have high expectations
for all students, and students need to believe they can succeed in math. Students can make
significant progress when they believe their intelligence can increase through learning, effort,
and persistence. The National Council of Teachers of Mathematics (NCTM) states,
A strong foundation in mathematics, for each and every student from pre-K–12, is
vital to our nation’s economic stability, national security, workforce productivity,
and full participation in our democratic society. Mathematical literacy is
fundamental for adult numeracy, financial literacy, and everyday life (NCTM,
2017, para. 1).
According to research, there are numerous ways to increase math achievement including
equity and access, intervention, high expectations, teacher training, teacher evaluation, early
childhood learning, and assessment (NCTM, 2017). This study specifically focuses on best
practices to reduce math anxiety in elementary students, so math achievement is increased. The
significance of this study is that by having a deeper understanding of math anxiety, self-efficacy,
10
and growth mindset, teachers, parents, teacher education programs, and STEM initiatives can
implement strategies in their practice to improve outcomes.
Significance for teachers. The results of this study can be utilized by teachers in order
to underscore the importance of identifying math anxiety early (Zubrzycki, 2017) and to develop
strategies to reduce it. Research shows that teacher practices have a strong influence over a
student’s degree of math anxiety (Geist, 2010; Scarpello, 2007). Teachers can implement best
practices to help students in reducing math anxiety. Moreover, the findings can be implemented
so teachers can intentionally teach growth mindset. They can model growth mindset, promote it
with their students, and provide process praise so students persevere through challenging math
tasks (Cimpian, Arce, Markman, & Dweck, 2007). Finally, lead and mentor teachers can create
professional development courses for existing teachers about the research on math anxiety and
how to spot it in students (Beilock & Maloney, 2015).
Significance for parents. The results also have significance for parents because the
information can be shared with and extended to parents, and they can implement strategies in
their home. Parents’ attitudes toward math shape their children’s attitudes toward math
(Scarpello, 2007; Woodard, 2004). Parents can read the study and benefit from parent education
nights at schools and childhood centers. Moreover, they can focus on expressing positive
attitudes about math while in the presence of their children, even if they did not experience math
success in school (Blazer, 2011).
Significance for teacher-education programs. The findings of this study will
contribute to teacher-education programs. All teacher-education programs that have a STEM
component - multiple subject elementary programs and single STEM subject programs - can
incorporate lessons on math anxiety, so teachers understand that success in math requires not
11
only content but also the right mindset (Beilock & Maloney, 2015). The elementary pre-service
programs should not be neglected because negative math attitudes often develop when children
are young.
Significance for STEM policy initiatives. This study also has significance for STEM
initiatives. The federal government has developed various STEM policy initiatives in an effort
to elevate U.S. students from their 27th place world ranking in math and 20th place world
ranking in science (Beilock & Maloney, 2015). Specifically, President Obama launched the
Educate to Innovate initiative in 2009, which provides funding for STEM research, programs,
and training. Elements of the initiative can be expanded by incorporating this research on math
anxiety and the role of fixed mindset in creating a barrier to entry into STEM fields (Beilock &
Maloney, 2015).
Assumptions of the Study
There were four assumptions in this phenomenological study, and Creswell (2013)
suggested assumptions should be acknowledged. Assumptions in a research study are those parts
that are somewhat out of the researcher’s control; however, the research would not exist without
them (Leedy & Ormrod, 2010).
1. The interviewer established rapport with the participants while providing a safe
environment that encouraged sharing and open reflection.
2. The participants responded to the interviewer’s questions in an honest, transparent,
and candid manner. Transparency was encouraged because the participants knew that
their responses were anonymous and confidential and that they could withdraw from
the study at any time.
12
3. The participants had adequate teaching experience to share insights, personal
anecdotes, and observations. They have worked with numerous students and are able
to determine and utilize successful math teaching strategies.
4. The participants in this study had no personal interest in influencing the study’s data
or analysis. There was no compensation and participation did not influence the
individual’s teaching positions.
Limitations of the Study
Research studies have limitations and are out of the researcher’s control (Simon,
2011). It is useful to explain the limitations of a study because they highlight the potential
weaknesses (Simon, 2011) and improve the credibility of the study (Ioannidis, 2007). Moreover,
Brutus, Aguinis, and Wassmer (2013) believe that limitations are an important aspect of
advancing research and must be disclosed and described. The researcher acknowledged the
following limitations of this study.
Creswell (2014) states that researchers bring bias to a study and should clarify the
bias. In this study, the researcher may have had bias in interpreting the data resulting from her
prior education roles as a math tutor, elementary teacher, mentor/master teacher, and
administrator. The researcher has her own knowledge and experience from teaching students
across a variety of grades and abilities, training developing teachers, and evaluating teachers’
instruction.
Participants were exclusively from XYZ Unified School District, so the interviewees may
or may not represent the broader population of elementary math teachers. The district may have
had a focus on math instruction to improve all students’ math achievement or may have had
13
additional math inservices. The results may not translate across districts, geographic areas, or
socio-economic levels.
Definition of Terms
The following key terms are used in this study:
• Anxiety: An aversive state of worry occurring in situations when an individual
perceives a threat is high (Davis, Ollendick, Nebel-Schwalm, 2008; Derakshan &
Eysenck, 2009; Jarrett, Black, Rapport, Grills-Taquechel, & Ollendick, 2015).
• Best practices: Existing procedures, techniques, or methodology, shown by
research and experience, to produce optimal results and widely-agreed
effectiveness (Hargreaves & Fullan, 2012).
• Fixed mindset: The belief that intelligence and ability are fixed traits (Dweck,
2016).
• Growth mindset: The belief that intelligence can be increased, and the brain can
be developed through exercise; belief that effort, curiosity, and perseverance help
to become better at something (Dweck, 2016).
• Intelligence: The ability to acquire knowledge and skills; capacity for learning;
level of intelligence is based on genes and environment (Dweck, 2016).
• Math achievement: The amount of basic and applied math content a student
learns in a given amount of time (Miller & Bichsel, 2004).
• Math anxiety: Math negativity and phobia; feeling of fear, panic, apprehension,
helplessness that arises when confronted with solving a math problem (Blazer,
2011; Carey, Hill, Devine, & Szücs, 2016; Stodolsky, 1985; Tobias & Weissbrod,
1980).
14
• Mindset: Implied theories about the essence of intelligent behavior; engagement,
motivation; ownership (David, 2015; Dweck, 2000).
• Self-efficacy: Beliefs that a student holds about his or her academic capabilities to
produce desired results (Bandura, 1986).
• STEM: A metadiscipline comprised of the four fields of science, technology,
engineering, and mathematics (Kennedy & Odell, 2014; Treacy & O’Donoghue,
2014).
Summary
As society becomes more technological and data driven, it is imperative that students are
well prepared to succeed in future STEM careers (English, 2016). Students’ math achievement
can be impeded when they suffer from math anxiety or have a fixed mindset (Blazer, 2011;
Boaler, 2013a; Cavanaugh, 2007; Geist, 2010). Math anxiety can be debilitating because it
undermines a student’s academic performance. It also leads to avoidance, which ultimately
means students may not take higher math classes, not pursue higher education, and avoid careers
that are perceived as mathematically burdened (Ashcraft, 2002; Blazer, 2011; Jameson, 2014;
Pletzer, Wood, Scherndl, Kerschbaum, & Nuerk, 2016; Ramirez, Gunderson, Levine, & Beilock,
2013; Wu et al., 2012). Studies also show there is a strong negative correlation between math
anxiety and test scores (Chiu & Henry, 1990; Wu et al., 2012). As math anxiety increases, test
scores and grades decrease. Students with a fixed mindset lose confidence and motivation when
the math task becomes challenging. They believe effort will not make a difference and they are
not oriented toward learning goals (Dweck, 2006).
This study explores the best practices and strategies teachers incorporate to reduce math
anxiety and promote growth mindset in their students. The goal is to increase math

15
achievement. This study also looks at the challenges teachers face and recommendations they
have for future implementation of best practices. Chapters 2 and 3 provide an overview of the
literature on math anxiety and mindset, summarize existing research on the topic, present the
research methodology and rationale, and describe the interview and data collection procedures.
16
Chapter 2: Literature Review
Many people have a genuine fear of math (Burns, 1998; Furner & Duffy, 2002). This
math trauma, or math anxiety, carries implications for future math success. Math anxiety and its
related factors, self-efficacy and growth mindset, all play a role in math achievement (Beilock &
Maloney, 2015). By developing a deeper understanding of math anxiety and its related factors,
best practices can be established for reducing math anxiety. In this literature review, the initial
sections focus on general anxiety in the education arena and factors affecting math
achievement. The research on math anxiety and related factors are then examined in detail, all
while aiming to ensure the best possible outcomes for students.
General Anxiety
Anxiety is an emotion that signals to the individual possible challenges or difficulties are
involved with the situation or task at hand (Bigdeli & Bai, 2009). Moreover, anxiety is a “highly
pervasive and insidious psychological phenomenon” (Bigdeli & Bai, 2009, p. 103) that
negatively affects teaching and learning. Reviews of studies show that anxiety disorders are the
most common disorder in youth (Albano, Chorpita, & Barlow, 2003), and that the prevalence
rate ranges from 2% to 27%, depending on age and the measure used (Costello, Egger, &
Angold, 2004).
There are several negative aspects associated with anxiety. Children with anxiety tend to
be shyer, more socially withdrawn, less popular, and less likeable than children who are not
anxious (Coplan, Girardi, Findlay, & Frohlick, 2007; Nelson, Rubin, & Fox, 2005). Parent
reports of anxious children compared to those of non-anxious children detail more difficulties
with the anxious children (Kashani & Orvaschel, 1990). Students who are classified as anxious
by their teachers demonstrate greater difficulties and problems adjusting than their non-anxious
17
peers (Strauss, Frame, & Forehand, 1987). The negative effects of childhood anxiety tend to
persist into adulthood and may include adult anxiety disorders, mood disorders, and substance
abuse problems (Kendall, Safford, Flannery-Schroeder, & Webb, 2004; Woodward & Fergusson,
2001). Several aspects related to school such as peers, school work, homework, teachers, and
tests are correlated with anxiety (Barrett & Heubeck, 2000).
Schools are often imbued with anxiety since there are several types of educational
anxiety including separation anxiety, general anxiety, math anxiety, English as a second
language anxiety, test anxiety, and performance anxiety (Bigdeli & Bai, 2009; Mychailyszyn,
Mendez, & Kendall, 2010). Anxiety causes interference with attention, memory, processing, and
inductive reasoning (Bigdeli & Bai, 2009; Ellis, 1990; Jarrett, Wolff, Davis, Cowart, &
Ollendick, 2016). Elevated anxiety creates a state of arousal where attention is focused on the
perceived threat, which impairs the ability to focus on learning (Wood, 2006). Since there is a
negative relationship between childhood anxiety and academic achievement (Jarrett et al., 2015),
it would be particularly beneficial to help teachers understand the nature of anxiety and to best
assist their students in overcoming it (Beilock & Maloney, 2015; Bigdeli & Bai, 2009). Training
in a teacher education program would provide the necessary knowledge for teachers so they
could incorporate anxiety awareness into the curriculum. Once a student understands anxiety,
she can attend to it instead of letting it proliferate. When anxiety is experienced before a
learning situation such as a test, presentation, or debate, the student can use the anxiety as a
trigger to accept the challenge and perform at a higher level. On the contrary, when anxiety
permeates and is experienced relentlessly, especially during a demanding task, it can be seriously
damaging to the student’s learning ability and impairs performance (Bigdeli & Bai, 2009;
Chansky & Kendall, 1997; Derakshan & Eysenck, 2009).
18
Davis et al. (2008) conducted a study by comparing the cognitive impairment of children
with anxiety disorders to the cognitive impairment of children without significant anxiety. The
study participants were 161 children with a mean age of 10.56 referred by schools, physicians,
and mental health professionals (Davis et al., 2008). The researchers administered three
assessments to the children: The Wechsler Intelligence Scale for Children - Third Edition to
measure ability (IQ), The Wechsler Individual Achievement Test - First Edition to measure
academic achievement, and The Anxiety Disorders Interview Schedule to assess
psychopathology. The parents took the parent version of The Anxiety Disorders Interview
Schedule. The researchers found a statistically significant influence of anxiety on ability and
achievement; although, the effects were only observed on the overall composite score, not
individual achievement scores (Davis et al., 2008). This study did not indicate any causal
direction as it is undetermined if children with lower IQ scores are predisposed to develop
anxiety disorders or if children with anxiety disorders are predisposed to experience deficits in
IQ over time. In the first situation, a child with lower ability may have a more difficult time
persevering through stress or solving life problems. In the second scenario, a child with an
anxiety disorder may achieve less because of the pervasive worry that impedes focus (Davis et
al., 2008). Overall, anxiety disorders impact psychological functioning and their impact on
children needs to be recognized.
In a similar study, Ialongo, Edelsohn, Werthamer-Larsson, Crockett, and Kellam (1996)
examined anxiety, depression, and cognition in a sample of 1,197 first-grade children from 19
Baltimore public elementary schools. The children were selected from school-based intervention
groups that targeted early learning and aggression. The participants completed the following
assessments: Revised Children’s Manifest Anxiety Scale to measure the level of anxiety and
19
Children’s Depression Inventory to measure symptoms associated with depression. The
researchers and trained interviewers administered the Teacher Observation of Classroom
Adaptation - Revised where the teachers answered questions regarding the student’s ability to
adapt to classroom demands. All classmates completed the Peer Assessment Instrument where
the researcher read a description such as plays alone a lot or your best friends and the students
circled the child who best fit the description. Finally, scores from the standardized test
California Achievement Test were used (Ialongo et al., 1996). The researchers specifically
studied the degree of social and cognitive impairment on the children with only anxious
symptoms, only depressive symptoms, and comorbid anxious and depressive symptoms. First,
boys who were only anxious or only depressed showed significantly greater impairment in social
and cognitive functioning than boys who were neither anxious nor depressed. Girls who were
only anxious or only depressed showed little social and cognitive impairment when compared to
girls who were neither anxious nor depressed (Ialongo et al., 1996). Second, the researchers
compared anxious symptoms to depressive symptoms. Boys who only showed depressive
symptoms showed very slight social and cognitive impairment over boys who only showed
anxious symptoms. There was no difference between the two in girls (Ialongo et al.,
1996). Third, the researchers compared comorbid symptoms. There was limited evidence that
boys with comorbid status had greater social and cognitive impairment than boys with only
anxious or only depressive symptoms. For girls, the cognitive and social impairment were
apparent when using the standardized achievement test and the teacher ratings of shy behavior
(Ialongo et al., 1996). The researchers shared that further research was warranted in order to
explain the different outcomes by gender. Although the degree of social and cognitive
impairment varied across situations and gender, the researchers felt it was still worth recognizing
20
because early achievement is linked to future educational and occupational success and
psychological well-being (Ialongo et al., 1996).
In two of their previous studies, Ialongo, Edelsohn, Werthamer-Larsson, Crockett, &
Kellam (1994, 1995), discovered that first grade children in the top quartile of anxiety were eight
times more likely to be in the lowest quartile of reading achievement and two and a half times
more likely to be in the lowest quartile of math achievement. The researchers also reported that
anxiety in first grade was a strong predictor of anxiety in fifth grade (Ialongo et al., 1995).
Finally, Ialongo et al. (1995) proposed that anxiety in school-age children continues through the
years if left untreated.
General education anxiety impedes students’ future success in school. Depending on the
severity of the anxiety, it can affect students in a variety of ways as explained above. One aspect
that general anxiety affects is overall math achievement.
Math Achievement
Individual differences in math achievement are attributed to a variety of factors (Dweck,
2016; Miller & Bichsel, 2004). First, a widely researched factor is working memory, consisting
of retrieval, processing, and storage (Adams & Hitch, 1998; Ashcraft, 2005; Baddeley, 2000;
Brainerd, 1983; Engle, 2002; Geary & Widaman, 1987; Hitch, 1978a; Hitch, 1978b). Hitch
(1978a, 1978b), one of the earliest researchers who studied the relationship of working memory
on math performance, found that the number of mathematical errors students made increased as
the number of operations held in working memory increased, as the answers needed be to written
in reverse order (hundreds, tens, ones), and as the number of operations that had to be executed
within working memory increased. Specifically, Hitch’s results demonstrated that working
memory was overwhelmed by holding more information in memory, holding the information for
21
a longer time, and executing more operations in memory (Ashcraft, 1995). Students who are
more competent in the working memory processes perform better overall on mathematics
achievement tests (Miller & Bichsel, 2004).
A second factor used to account for discrepancies in math ability is gender. Throughout
the years, researchers have often debated if the findings demonstrating that males have an
advantage in math courses are inherent or if it is the influence of sex-based stereotypes (Hyde,
Fennema, & Ryan et al., 1990; Leahey & Guo, 2001). Benbow (1988) found large gender
differences showing a male advantage that emerged as early as middle school. When Leahey
and Guo (2001) studied large, national samples, they found no gender differences among middle
school students; however, they found slight gender differences among high school students in the
areas of general math, reasoning, and geometry.
A third factor found to create low math achievement is math anxiety (Ashcraft, 2002;
Faust et al., 1996; Wu et al., 2012). Research shows performance differences were more
prominent when difficult arithmetic problems were tested (Ashcraft & Faust, 1994; Faust et al.,
1996). High-math anxiety individuals had difficulty solving two-column addition problems due
to the regrouping operation (Ashcraft & Faust, 1994), and it took them three times as long to
complete the problems than the low-math anxiety individuals (Faust et. al., 1996). According to
documented literature, there is a significant relationship between math anxiety and math
achievement, and math anxiety has long-term damaging consequences (Ashcraft & Kirk, 2001;
Faust et al., 1996; Hembree, 1990). Specifically, math anxiety “disrupts the ongoing, task-
relevant activities of working memory, slowing down performance and degrading its accuracy”
(Ashcraft & Kirk, 2001, p. 236). Math anxious individuals worry about solving a math problem
and the worries occupy their thinking resources that are needed for the present math task at hand.
22
Math anxious individuals are focusing on two tasks at once - attending to their worries and
solving the problem - so their performance suffers (Beilock & Maloney, 2015).
Neuroscientific data from functional magnetic resonance imaging (fMRI) were used to
analyze the differences of brain activity between children with high math anxiety and children
with low math anxiety while they completed math problems (Young, Wu, & Menon, 2012). The
children with high math anxiety had more activation in brain regions associated with negative
emotions and had less activation in brain regions associated with working memory. The
scientific data confirm that math anxiety disrupts working memory and interferes with the math
task at hand (Young et al., 2012).
Math anxiety is not only limited to decreasing math performance in academic settings. It
has been identified with poor drug calculations in nursing (McMullan, Jones, & Lea, 2012),
reduced teaching self-efficacy in teachers (Swars, Daane, & Giesen, 2006), and unsound
financial planning (McKenna & Nickols, 1988). This study primarily focused on math anxiety
because research indicates it is the strongest predictor of math performance (Ashcraft, 2002;
Ashcraft & Kirk, 2001; Beilock & Maloney, 2015; Hoffman, 2010; Miller & Bichsel, 2004).
Finally, mindset and self-efficacy account for differences in math performance. Low
achievement stems from students who believe that math ability is a fixed trait or mindset
(Dweck, 2008). Good, Aronson, and Inzlich (2003) studied a group of seventh grade students
who were not performing well in math. One group served as a control group and the second
group had growth mindset intervention. The growth mindset group met with math mentors in
November and January and had e-mail correspondence throughout the year. There was no
improvement in the control group; however, the growth mindset group had a 4.5-point gain in
their mathematics achievement test scores (Good et al., 2003). Poor math performance also
23
results when students have no self-efficacious beliefs. Regardless of how hard the student
works, she believes her grade will not improve because she has no influence over her
achievement (Bandura, 1986; Usher & Pajares, 2009).
Understanding Math Anxiety
Definition of math anxiety. Math anxiety is referred to as math negativity and math
phobia; although, math anxiety is the commonly used term (Ferguson et al., 2015). It is defined
as negative emotions and a state of discomfort that interfere with the solving of math problems
(Blazer, 2011; Carey et al., 2016; Stodolsky, 1985). Math anxiety is more than just disliking
math, and 93% of Americans indicate they experience math anxiety to some degree (Blazer,
2011). Tobias, a pioneer in the study of math anxiety, described it as “the panic, helplessness,
paralysis and mental disorganization that arises among some people when they are required to
solve a mathematics problem” (Tobias & Weissbrod, 1980, p. 64). Buckley and Ribordy (1982)
define math anxiety as “an inconceivable dread of mathematics that can interfere with
manipulating numbers and solving mathematical problems within a variety of everyday life and
academic situations” (p. 1). Characteristics of math anxiety include avoidance, lack of
perseverance, rigidness, and resistance (Kulkin, 2016). Math anxiety is a trait anxiety as
opposed to a state anxiety because it is a persevering part of an individual’s personality and
extends across all situations (Elliot & Dweck, 2013; Miller & Bichsel, 2004).
Math anxiety is studied to see if it is related to other important characteristics. Even
though math anxiety is related to other forms of anxiety explained previously, such as test
anxiety, separation anxiety, and general anxiety, research shows that it is its own phenomenon
(Ashcraft, 2002; Devine, Fawcett, Szücs, Dowker, 2012; Hembree, 1990; Kazelskis et al., 2000;
Mychailyszyn et al., 2010). The interrelationship between math anxiety and test anxiety is a 0.52
24
correlation; however, intercorrelations provide support that math anxiety is its own
phenomenon. Intercorrelations between assessments of math anxiety range from 0.50 to 0.70,
but intercorrelations of math anxiety to other forms of anxiety range from 0.30 to 0.50 (Ashcraft,
2002). When Faust, Ashcraft, and Fleck (1996) studied a group of highly math-anxious
individuals performing math tasks of increasing difficulty, they found physiological evidence of
increasing reactivity such as changes in heart rate. When the same individuals performed verbal
tasks of increasing difficulty, there was hardly any increase in their reactivity. Participants with
low math anxiety showed negligible increases during either the math or verbal task. Next, the
characteristic of overall intelligence is found to be weakly related to math anxiety with a small
correlation of -0.17 (Ashcraft, 2002). Finally, in the relationship between gender and math
anxiety, anxiety is found to be somewhat higher in women than men (Ashcraft, 2002).
The first math anxiety measurement scale was development by Richardson and Suinn in
1972. Titled the Mathematics Anxiety Rating Scale (MARS), the tool asks participants to rate
themselves on levels of anxiety they would feel in various situations such as calculating a
restaurant bill and taking a math test (a representing “not at all” anxious and 5 representing “very
much” anxious). An example of one item on the 98-item scale is, “Adding two three-digit
numbers while someone looks over your shoulder” (Richardson & Suinn, 1972, p. 552). Scores
range from 98 to 490 and elevated scores on the MARS represent high math anxiety. The
authors first used the MARS on a group of 397 undergraduate students. The Pearson product-
moment correlation coefficient was found to be 0.85, which indicates that the MARS is reliable
and valid (Richardson & Suinn, 1972). Ten years later, Richardson and Suinn revised the
MARS, which resulted in a shorter version known as the Mathematics Anxiety Rating Scale for
Adolescents (MARS-A, Abidin, Alwi, & Jaafar, 2010). Then in 1988, Suinn, Taylor, and
25
Edwards developed the Mathematics Anxiety Rating Scale for Elementary School Students
(MARS-E, Wu et al., 2012). Other measures have been developed over the years without
determining validity; however, the MARS tests appear to be the educational standard for
measuring math anxiety due to their reliability and validity (Ashcraft, 2002).
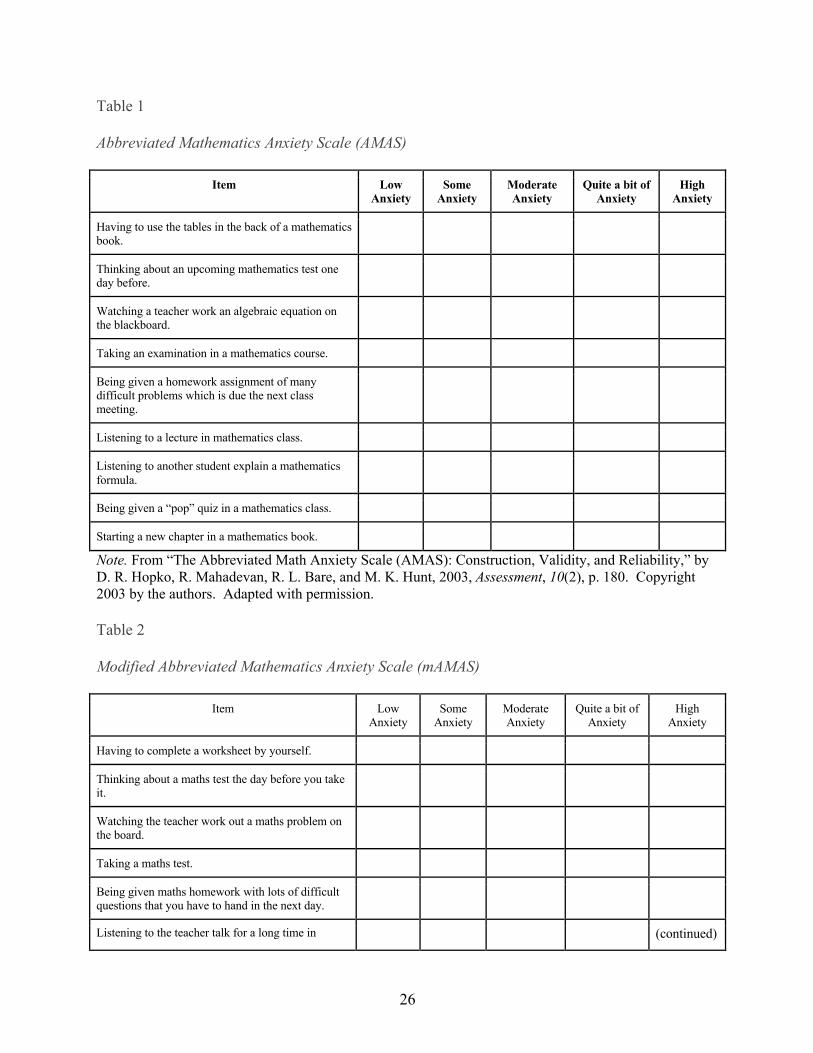
Although the MARS tests were accepted as standard assessments, a practical need
emerged for a shorter assessment, so the Abbreviated Math Anxiety Scale (AMAS) was
developed by Hopko, Mahadevan, Bare, and Hunt in 2003 for adolescents and adults (see Table
1). The AMAS was created with a two-factor analysis: learning math anxiety and math
evaluation anxiety. The AMAS is a nine-item inventory including specific items such as,
“listening to a lecture in mathematics class,” “starting a new chapter in a mathematics book,” and
“being given a ‘pop quiz’ in a mathematics class” (Hopko et al., 2003, p. 180). Participants rank
each item on a five-point scale from one representing “low anxiety” to five representing “high
anxiety.” Scores range from 9 to 45 and higher scores represent higher levels of math anxiety
(Hopko et al., 2003). Upon testing the reliability and validity of the measure, Hopko et al.
(2003) found that internal consistency, external validity, and test-retest reliability were strong.
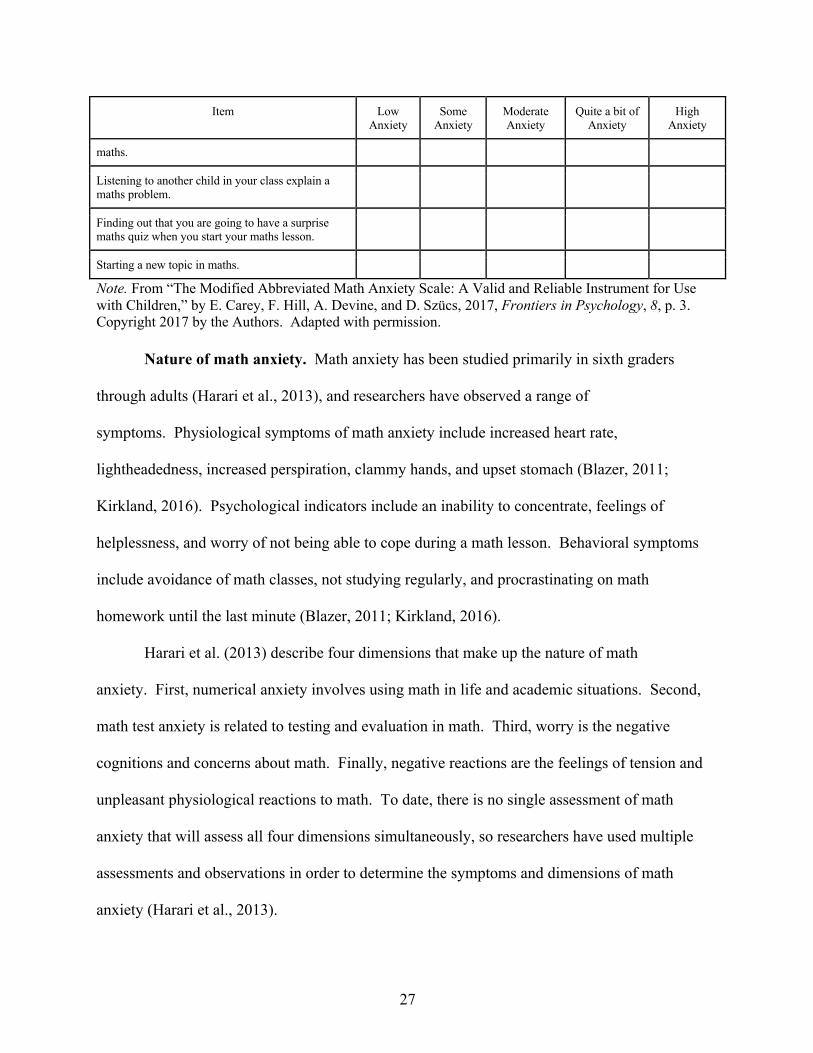
A team of researchers desired the ease of administering the shorter assessment; however,
they needed a scale suitable for children as young as eight years old. Carey, Hill, Devine, and
Szücs (2017) adapted the AMAS to use with British children aged 8-13 years old. They used
British vocabulary (maths for math) and named the scale the Modified Abbreviated Math Anxiety
Scale (mAMAS (see Table 2). The mAMAS was found to be both a valid and reliable for
measuring math anxiety in children and adolescents (Carey et al., 2017).
26
Table 1
Abbreviated Mathematics Anxiety Scale (AMAS)
Item Low Anxiety
Some Anxiety
Moderate Anxiety
Quite a bit of Anxiety
High Anxiety
Having to use the tables in the back of a mathematics book.
Thinking about an upcoming mathematics test one day before.
Watching a teacher work an algebraic equation on the blackboard.
Taking an examination in a mathematics course.
Being given a homework assignment of many difficult problems which is due the next class meeting.
Listening to a lecture in mathematics class.
Listening to another student explain a mathematics formula.
Being given a “pop” quiz in a mathematics class.
Starting a new chapter in a mathematics book.
Note. From “The Abbreviated Math Anxiety Scale (AMAS): Construction, Validity, and Reliability,” by D. R. Hopko, R. Mahadevan, R. L. Bare, and M. K. Hunt, 2003, Assessment, 10(2), p. 180. Copyright 2003 by the authors. Adapted with permission. Table 2
Modified Abbreviated Mathematics Anxiety Scale (mAMAS)
Item Low Anxiety
Some Anxiety
Moderate Anxiety
Quite a bit of Anxiety
High Anxiety
Having to complete a worksheet by yourself.
Thinking about a maths test the day before you take it.
Watching the teacher work out a maths problem on the board.
Taking a maths test.
Being given maths homework with lots of difficult questions that you have to hand in the next day.
Listening to the teacher talk for a long time in
(continued)
27
Item Low Anxiety
Some Anxiety
Moderate Anxiety
Quite a bit of Anxiety
High Anxiety
maths.
Listening to another child in your class explain a maths problem.
Finding out that you are going to have a surprise maths quiz when you start your maths lesson.
Starting a new topic in maths.
Note. From “The Modified Abbreviated Math Anxiety Scale: A Valid and Reliable Instrument for Use with Children,” by E. Carey, F. Hill, A. Devine, and D. Szücs, 2017, Frontiers in Psychology, 8, p. 3. Copyright 2017 by the Authors. Adapted with permission.
Nature of math anxiety. Math anxiety has been studied primarily in sixth graders
through adults (Harari et al., 2013), and researchers have observed a range of
symptoms. Physiological symptoms of math anxiety include increased heart rate,
lightheadedness, increased perspiration, clammy hands, and upset stomach (Blazer, 2011;
Kirkland, 2016). Psychological indicators include an inability to concentrate, feelings of
helplessness, and worry of not being able to cope during a math lesson. Behavioral symptoms
include avoidance of math classes, not studying regularly, and procrastinating on math
homework until the last minute (Blazer, 2011; Kirkland, 2016).
Harari et al. (2013) describe four dimensions that make up the nature of math
anxiety. First, numerical anxiety involves using math in life and academic situations. Second,
math test anxiety is related to testing and evaluation in math. Third, worry is the negative
cognitions and concerns about math. Finally, negative reactions are the feelings of tension and
unpleasant physiological reactions to math. To date, there is no single assessment of math
anxiety that will assess all four dimensions simultaneously, so researchers have used multiple
assessments and observations in order to determine the symptoms and dimensions of math
anxiety (Harari et al., 2013).
28
Since math anxiety has been primarily studied in children starting in sixth grade, Harari
et al. (2013) wanted to study three dimensions of math anxiety in first-grade children: numerical
anxiety, negative reactions, and worry; they did not feel math test anxiety would be an age-level
appropriate dimension. The researchers wanted to determine if math anxiety was
multidimensional in younger children just as it is in older children and adults. They studied 106
ethnically and linguistically diverse children using the numerical questions from the original 26
question MARS-E. They also used a five-item, researcher-developed, Likert-scale survey
including statements such as, “I think math is fun” and “I think math is easy” (Harari et al.,
2013). The researchers determined that numerical anxiety, worry, and negative reactions were
all dimensions of math anxiety in young children. In another study of first and second grade
children, math anxiety served as a negative predictor of the use of problem solving strategies
(Ramirez, Chang, Maloney, Levine, & Beilock, 2016). Gierl and Bisanz (1995) studied the level
of math anxiety in third and sixth grade children. They found that most children had low levels
of math anxiety; however, there were some children who possessed high levels of math anxiety
and negative attitudes toward math. This finding indicates that math anxiety not only exists in
adolescents through adults, but in younger children as well. Older students from sixth grade and
up experience greater levels of math anxiety (Lent, Brown, & Larkin, 1984; Meeks, 1997).
Specifically, Chin (2009) determined high levels of math anxiety in 4% of elementary-aged
children.
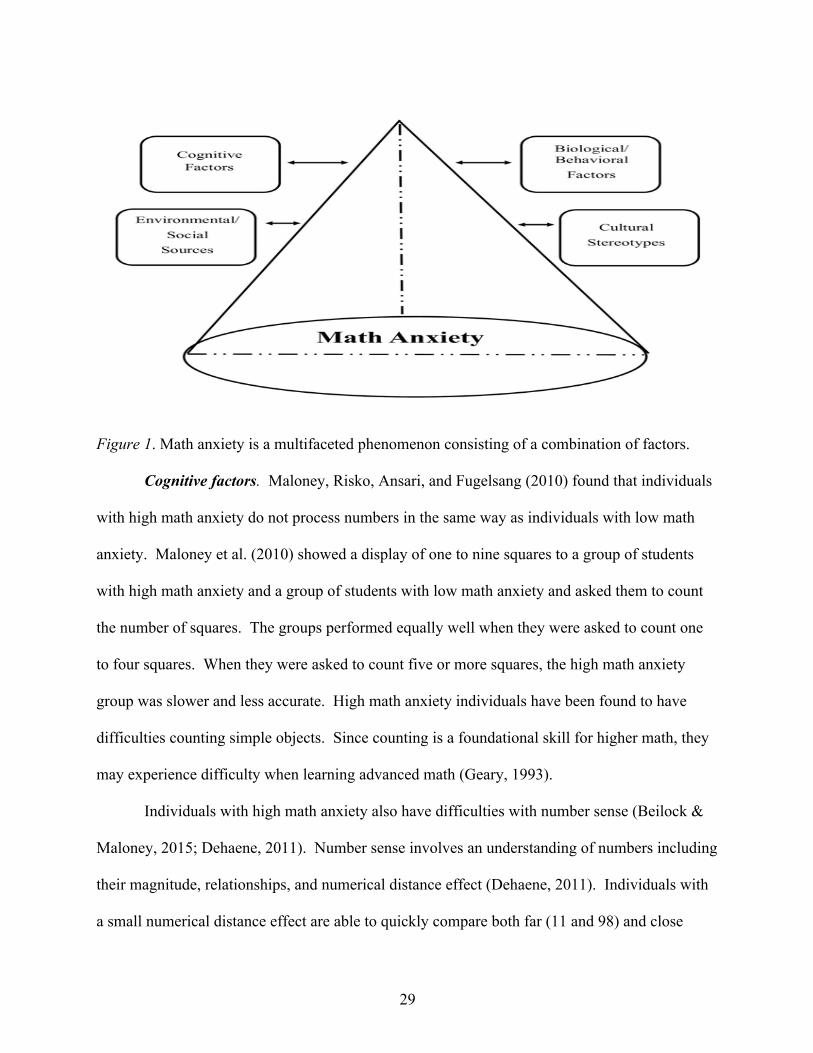
Development of math anxiety. Math anxiety is a multifaceted phenomenon and is likely
influenced by a combination of cognitive factors, biological/behavioral factors, cultural
stereotypes, and environmental/social sources (Ashcraft & Krause, 2007; Beilock & Maloney,
2015; Casad, Hale, & Wachs, 2015; Harari et al., 2013, see Figure 1).
29
Figure 1. Math anxiety is a multifaceted phenomenon consisting of a combination of factors.
Cognitive factors. Maloney, Risko, Ansari, and Fugelsang (2010) found that individuals
with high math anxiety do not process numbers in the same way as individuals with low math
anxiety. Maloney et al. (2010) showed a display of one to nine squares to a group of students
with high math anxiety and a group of students with low math anxiety and asked them to count
the number of squares. The groups performed equally well when they were asked to count one
to four squares. When they were asked to count five or more squares, the high math anxiety
group was slower and less accurate. High math anxiety individuals have been found to have
difficulties counting simple objects. Since counting is a foundational skill for higher math, they
may experience difficulty when learning advanced math (Geary, 1993).
Individuals with high math anxiety also have difficulties with number sense (Beilock &
Maloney, 2015; Dehaene, 2011). Number sense involves an understanding of numbers including
their magnitude, relationships, and numerical distance effect (Dehaene, 2011). Individuals with
a small numerical distance effect are able to quickly compare both far (11 and 98) and close
30
number pairs (4 and 4.5), which means they have a precise mental number line. Individuals with
a large numerical distance effect struggle when they compare close number pairs relative to far
number pairs, which means they have a non-precise mental number line (Holloway & Ansari,
2008; 2009). Maloney, Ansari, and Fugelsang (2011) studied numerical distance effect between
individuals with high math anxiety and individuals with low math anxiety. They found that
high-math-anxiety individuals have a higher numerical distance effect and a less precise mental
number line that low-math-anxiety individuals. A less developed number sense is detrimental
when learning advanced math.
Another foundational cognitive skill for math is spatial ability, which is the ability to
transform symbolic information and identify spatial relationships among objects and in space
(Gardner, 1983). By studying individuals with math anxiety, Maloney, Waechter, Risko, and
Fugelsang (2012) determined that a link exists between math anxiety and spatial ability. Math
anxiety was negatively related to perceived spatial ability (Maloney et al., 2012). Moreover,
Ferguson et al. (2015) found individuals with high math anxiety report having a poor sense of
direction and perform worse on large-scale spatial skill tests. Maloney’s team of researchers
concluded that individuals with high math anxiety struggled on tasks involving counting ability,
number sense, and spatial ability that are foundational to math. Having difficulty in math will
likely cause math anxiety, which creates an avoidance of future math learning and then more
anxiety. According to Maloney and Beilock (2012), this avoidance and anxiety cause a vicious
cycle to emerge.
Biological/behavioral factors. In addition to cognitive factors, there are biological and
behavioral factors that influence math anxiety. Individuals who have a biological predisposition
toward anxiety may be more at risk of developing math anxiety (Ashcraft & Krause, 2007;
31
Harari et al., 2013). Behavioral factors also include low self-esteem, inability to handle
frustration, self-efficacy, shyness, and intimidation (Blazer, 2011; Jain & Dowson,
2009). Individuals with low self-efficacy show low levels of academic performance, motivation,
and attitudes (Valentine, DuBois, & Cooper, 2004; Zimmerman, 2000).
Cultural stereotypes. Cultural stereotypes about gender and math exist, specifically that
men and boys are superior in math (Casad et al., 2015; Jameson, 2014) and that math-related
fields are masculine domains (Gutbezahl, 1995; Halpern et al., 2007). After Hyde, Fennema, and
Lamon (1990) conducted a meta-analysis of 100 studies, they found the gender difference in
math to be negligible. Males performed slightly better in problem solving and females had an
advantage in computation. They found slight gender differences in adolescence in algebra and
geometry, but the differences were not statistically significant (Hyde, Fennema, et al., 1990).
Although there are no significant gender differences in math achievement, research shows there
are definite gender differences in math anxiety levels (Jameson, 2014). Middle school girls
reported math anxiety levels 20% higher than middle school boys (Meece, Wigfield, & Eccles,
1990). In their meta-analysis, Hyde, Fennema, et al. (1990) found women report that they
experience higher levels of math anxiety than men. Ma and Xu (2004) also found significant
findings regarding gender when they studied 3116 seventh grade through twelfth grade
students. Prior low math achievement caused high math anxiety for boys across all grades
seventh through twelfth. Conversely, prior low math achievement caused high math anxiety for
girls only at critical transitions (elementary to junior high and junior high to high school (Ma &
Xu, 2004). Overall, math anxiety was more stable in the girls than boys. It is believed that self-
efficacy affects perceived math ability (Meece et al., 1990). Girls’ levels of math self-efficacy
are lower than boys and directly affects their levels of math anxiety. In boys, their levels of
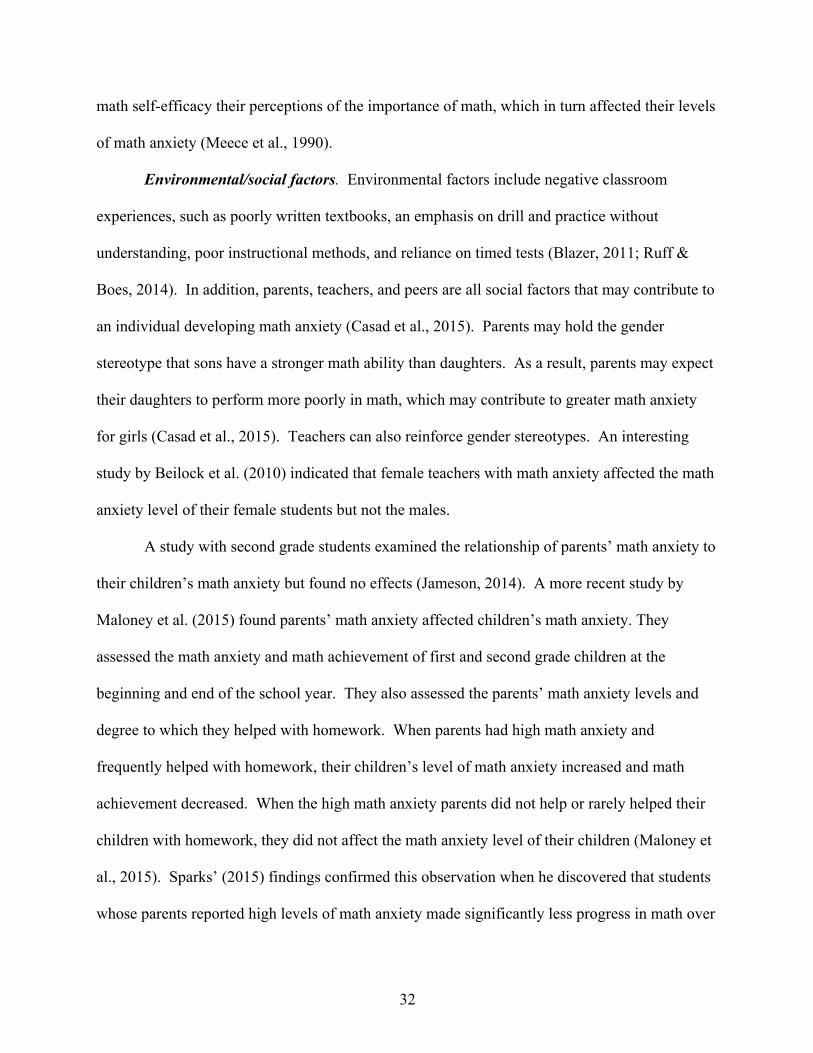
32
math self-efficacy their perceptions of the importance of math, which in turn affected their levels
of math anxiety (Meece et al., 1990).
Environmental/social factors. Environmental factors include negative classroom
experiences, such as poorly written textbooks, an emphasis on drill and practice without
understanding, poor instructional methods, and reliance on timed tests (Blazer, 2011; Ruff &
Boes, 2014). In addition, parents, teachers, and peers are all social factors that may contribute to
an individual developing math anxiety (Casad et al., 2015). Parents may hold the gender
stereotype that sons have a stronger math ability than daughters. As a result, parents may expect
their daughters to perform more poorly in math, which may contribute to greater math anxiety
for girls (Casad et al., 2015). Teachers can also reinforce gender stereotypes. An interesting
study by Beilock et al. (2010) indicated that female teachers with math anxiety affected the math
anxiety level of their female students but not the males.
A study with second grade students examined the relationship of parents’ math anxiety to
their children’s math anxiety but found no effects (Jameson, 2014). A more recent study by
Maloney et al. (2015) found parents’ math anxiety affected children’s math anxiety. They
assessed the math anxiety and math achievement of first and second grade children at the
beginning and end of the school year. They also assessed the parents’ math anxiety levels and
degree to which they helped with homework. When parents had high math anxiety and
frequently helped with homework, their children’s level of math anxiety increased and math
achievement decreased. When the high math anxiety parents did not help or rarely helped their
children with homework, they did not affect the math anxiety level of their children (Maloney et
al., 2015). Sparks’ (2015) findings confirmed this observation when he discovered that students
whose parents reported high levels of math anxiety made significantly less progress in math over
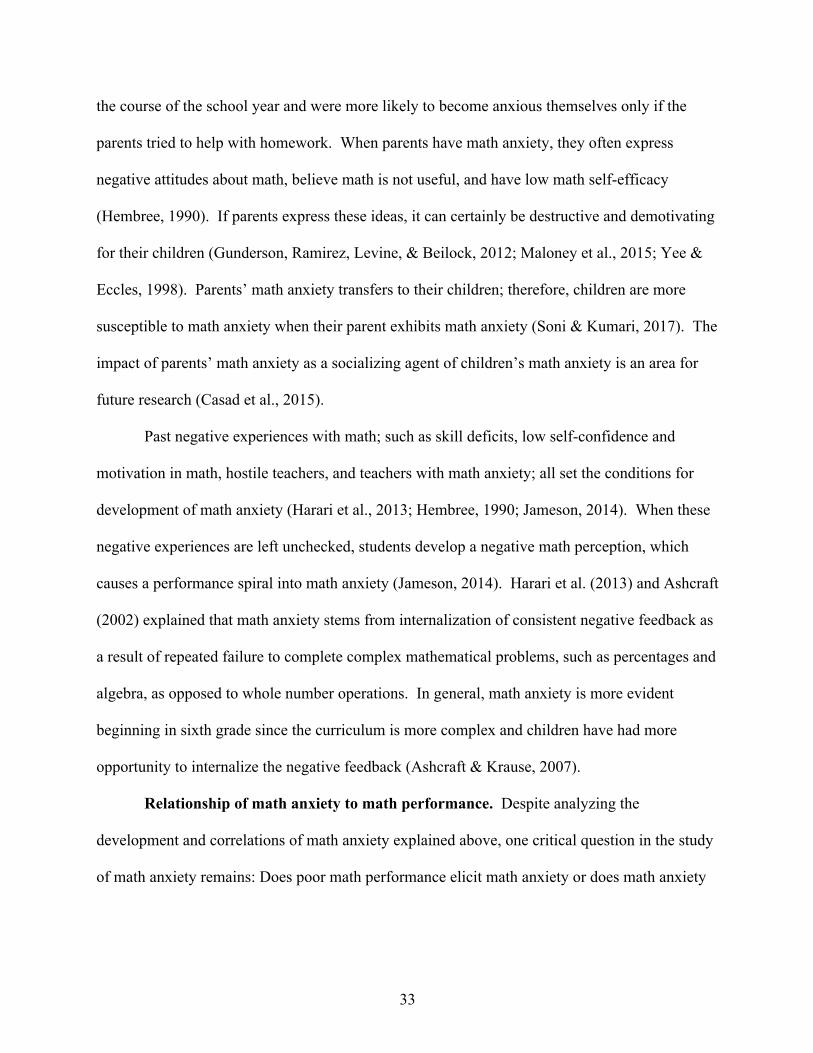
33
the course of the school year and were more likely to become anxious themselves only if the
parents tried to help with homework. When parents have math anxiety, they often express
negative attitudes about math, believe math is not useful, and have low math self-efficacy
(Hembree, 1990). If parents express these ideas, it can certainly be destructive and demotivating
for their children (Gunderson, Ramirez, Levine, & Beilock, 2012; Maloney et al., 2015; Yee &
Eccles, 1998). Parents’ math anxiety transfers to their children; therefore, children are more
susceptible to math anxiety when their parent exhibits math anxiety (Soni & Kumari, 2017). The
impact of parents’ math anxiety as a socializing agent of children’s math anxiety is an area for
future research (Casad et al., 2015).
Past negative experiences with math; such as skill deficits, low self-confidence and
motivation in math, hostile teachers, and teachers with math anxiety; all set the conditions for
development of math anxiety (Harari et al., 2013; Hembree, 1990; Jameson, 2014). When these
negative experiences are left unchecked, students develop a negative math perception, which
causes a performance spiral into math anxiety (Jameson, 2014). Harari et al. (2013) and Ashcraft
(2002) explained that math anxiety stems from internalization of consistent negative feedback as
a result of repeated failure to complete complex mathematical problems, such as percentages and
algebra, as opposed to whole number operations. In general, math anxiety is more evident
beginning in sixth grade since the curriculum is more complex and children have had more
opportunity to internalize the negative feedback (Ashcraft & Krause, 2007).
Relationship of math anxiety to math performance. Despite analyzing the
development and correlations of math anxiety explained above, one critical question in the study
of math anxiety remains: Does poor math performance elicit math anxiety or does math anxiety
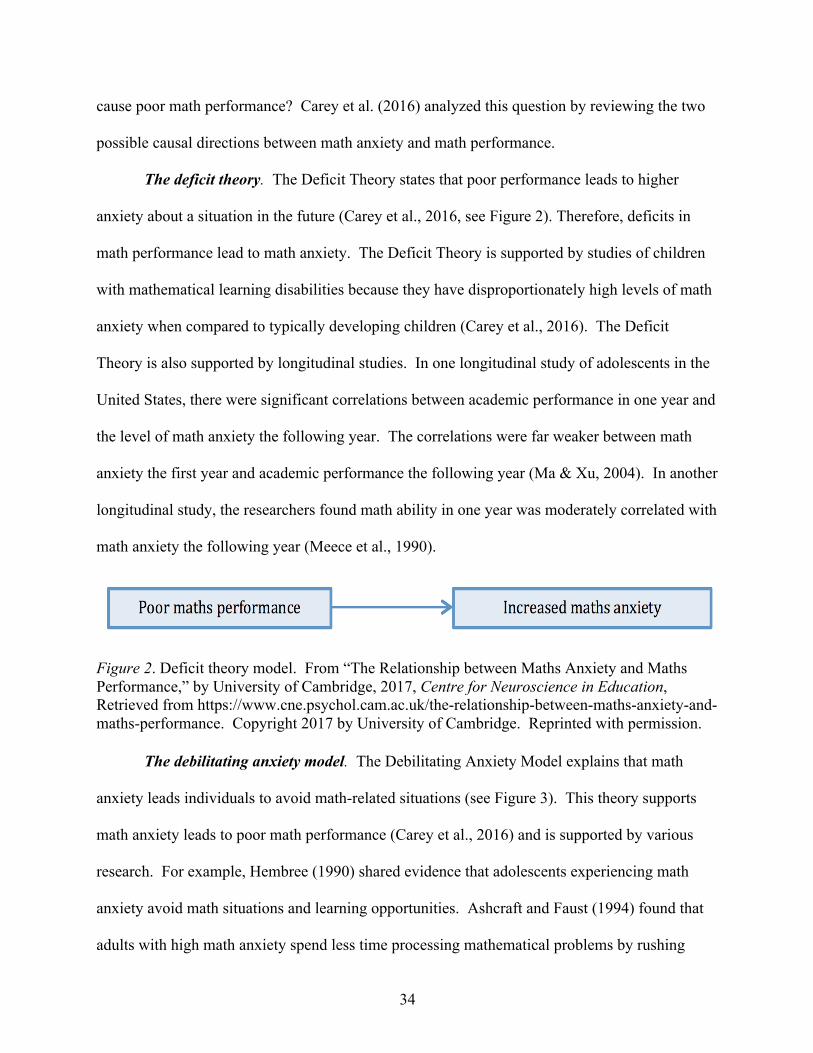
34
cause poor math performance? Carey et al. (2016) analyzed this question by reviewing the two
possible causal directions between math anxiety and math performance.
The deficit theory. The Deficit Theory states that poor performance leads to higher
anxiety about a situation in the future (Carey et al., 2016, see Figure 2). Therefore, deficits in
math performance lead to math anxiety. The Deficit Theory is supported by studies of children
with mathematical learning disabilities because they have disproportionately high levels of math
anxiety when compared to typically developing children (Carey et al., 2016). The Deficit
Theory is also supported by longitudinal studies. In one longitudinal study of adolescents in the
United States, there were significant correlations between academic performance in one year and
the level of math anxiety the following year. The correlations were far weaker between math
anxiety the first year and academic performance the following year (Ma & Xu, 2004). In another
longitudinal study, the researchers found math ability in one year was moderately correlated with
math anxiety the following year (Meece et al., 1990).
Figure 2. Deficit theory model. From “The Relationship between Maths Anxiety and Maths Performance,” by University of Cambridge, 2017, Centre for Neuroscience in Education, Retrieved from https://www.cne.psychol.cam.ac.uk/the-relationship-between-maths-anxiety-and-maths-performance. Copyright 2017 by University of Cambridge. Reprinted with permission.
The debilitating anxiety model. The Debilitating Anxiety Model explains that math
anxiety leads individuals to avoid math-related situations (see Figure 3). This theory supports
math anxiety leads to poor math performance (Carey et al., 2016) and is supported by various
research. For example, Hembree (1990) shared evidence that adolescents experiencing math
anxiety avoid math situations and learning opportunities. Ashcraft and Faust (1994) found that
adults with high math anxiety spend less time processing mathematical problems by rushing
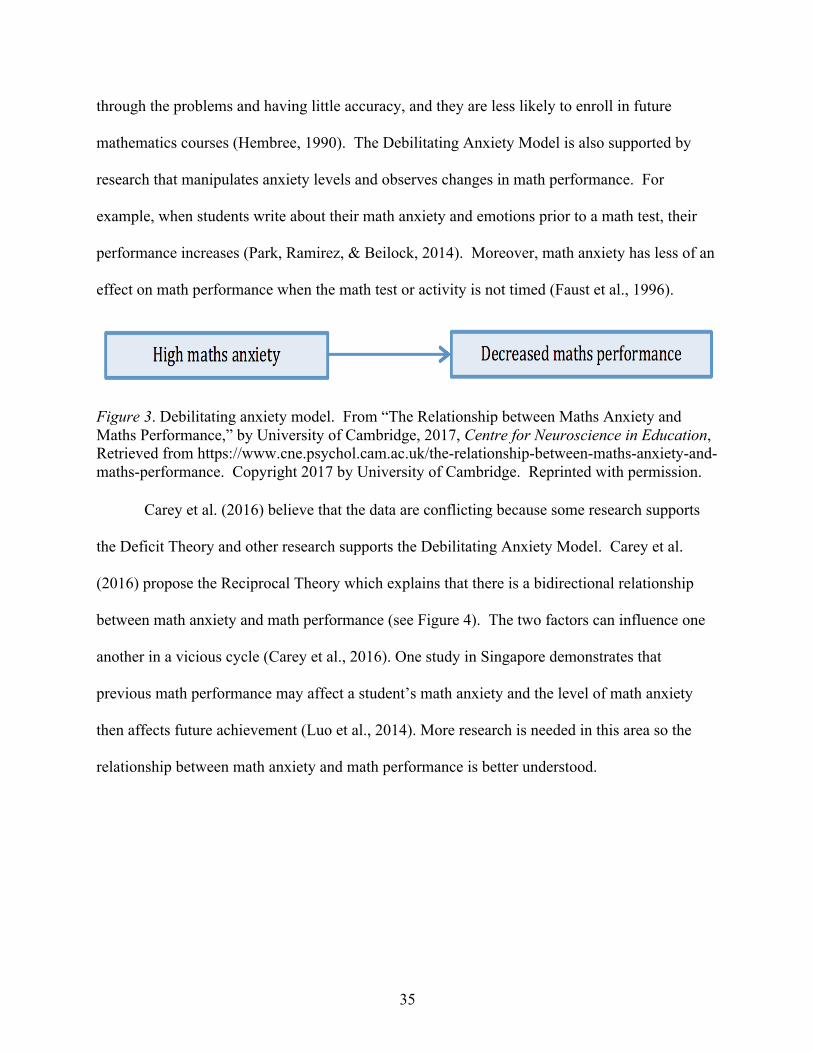
35
through the problems and having little accuracy, and they are less likely to enroll in future
mathematics courses (Hembree, 1990). The Debilitating Anxiety Model is also supported by
research that manipulates anxiety levels and observes changes in math performance. For
example, when students write about their math anxiety and emotions prior to a math test, their
performance increases (Park, Ramirez, & Beilock, 2014). Moreover, math anxiety has less of an
effect on math performance when the math test or activity is not timed (Faust et al., 1996).
Figure 3. Debilitating anxiety model. From “The Relationship between Maths Anxiety and Maths Performance,” by University of Cambridge, 2017, Centre for Neuroscience in Education, Retrieved from https://www.cne.psychol.cam.ac.uk/the-relationship-between-maths-anxiety-and-maths-performance. Copyright 2017 by University of Cambridge. Reprinted with permission.
Carey et al. (2016) believe that the data are conflicting because some research supports
the Deficit Theory and other research supports the Debilitating Anxiety Model. Carey et al.
(2016) propose the Reciprocal Theory which explains that there is a bidirectional relationship
between math anxiety and math performance (see Figure 4). The two factors can influence one
another in a vicious cycle (Carey et al., 2016). One study in Singapore demonstrates that
previous math performance may affect a student’s math anxiety and the level of math anxiety
then affects future achievement (Luo et al., 2014). More research is needed in this area so the
relationship between math anxiety and math performance is better understood.
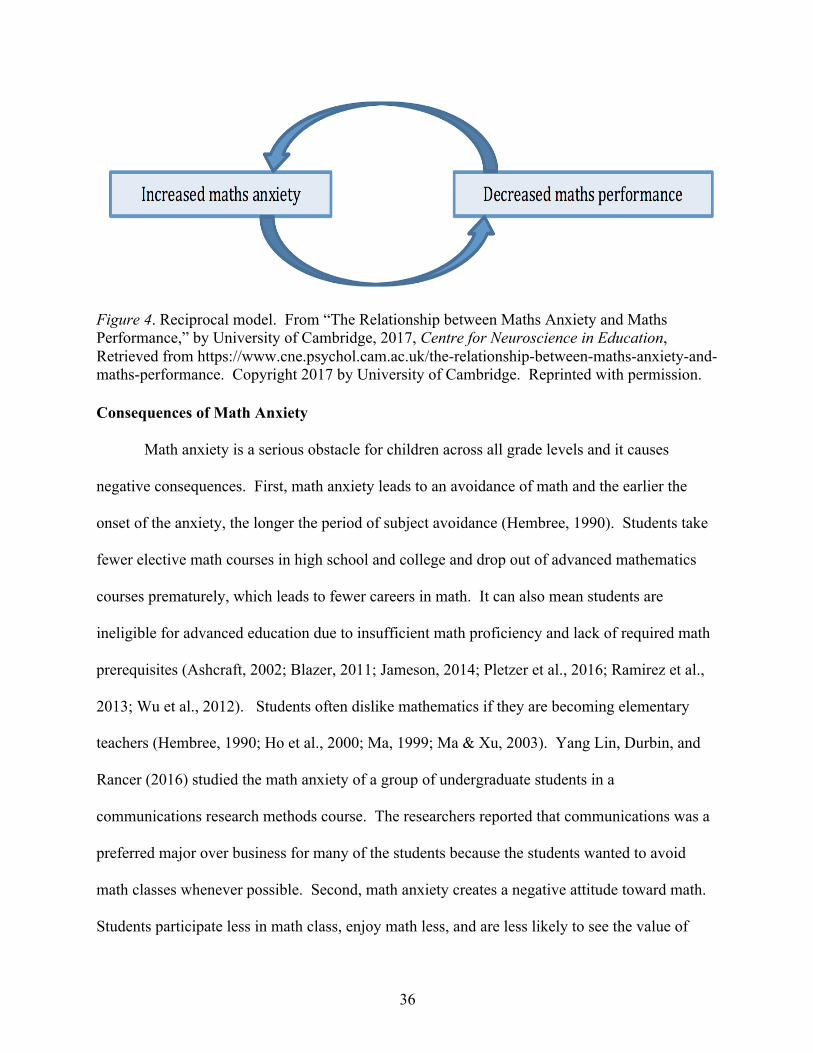
36
Figure 4. Reciprocal model. From “The Relationship between Maths Anxiety and Maths Performance,” by University of Cambridge, 2017, Centre for Neuroscience in Education, Retrieved from https://www.cne.psychol.cam.ac.uk/the-relationship-between-maths-anxiety-and-maths-performance. Copyright 2017 by University of Cambridge. Reprinted with permission. Consequences of Math Anxiety
Math anxiety is a serious obstacle for children across all grade levels and it causes
negative consequences. First, math anxiety leads to an avoidance of math and the earlier the
onset of the anxiety, the longer the period of subject avoidance (Hembree, 1990). Students take
fewer elective math courses in high school and college and drop out of advanced mathematics
courses prematurely, which leads to fewer careers in math. It can also mean students are
ineligible for advanced education due to insufficient math proficiency and lack of required math
prerequisites (Ashcraft, 2002; Blazer, 2011; Jameson, 2014; Pletzer et al., 2016; Ramirez et al.,
2013; Wu et al., 2012). Students often dislike mathematics if they are becoming elementary
teachers (Hembree, 1990; Ho et al., 2000; Ma, 1999; Ma & Xu, 2003). Yang Lin, Durbin, and
Rancer (2016) studied the math anxiety of a group of undergraduate students in a
communications research methods course. The researchers reported that communications was a
preferred major over business for many of the students because the students wanted to avoid
math classes whenever possible. Second, math anxiety creates a negative attitude toward math.
Students participate less in math class, enjoy math less, and are less likely to see the value of
37
learning math (Ashcraft, 2002; Harari et al., 2013; Jameson, 2014; Pletzer et al., 2016; Ramirez
et al., 2013; Wu et al., 2012). Third, math anxiety causes negative self-perceptions about one’s
math abilities. Students have decreased self confidence in their own ability to understand math.
Moreover, they falsely believe that they do not have the efficacy to succeed in math (Ashcraft,
2002; Hembree, 1990; Jameson, 2014; Pletzer et al., 2016; Ramirez et al., 2013; Wu et al.,
2012). The correlations between math anxiety, motivation, and math self-confidence are highly
negative, ranging from -0.47 to -0.82 (Ashcraft, 2002).
Fourth, math anxiety lowers math competence and achievement and reduces students’
working memory. While studying high school students, Wu et al. (2012) found math anxiety
was negatively correlated (-0.31) with term grades, final exam grades, and tests of math
aptitude. Math anxiety was also negatively correlated with the total mathematics score of the
SAT (Stanford Achievement Test). Chiu and Henry (1990) found that fifth, sixth, and eighth
graders had levels of math anxiety that significantly negatively correlated with semester math
grades. In order to determine if poor test performance was a result of low competence versus
heightened math anxiety, Ashcraft, Kirk, and Hopko (1998) administered a standard math
achievement test to students with low, medium, or high math anxiety. The researchers scored the
test line-by-line to analyze by difficulty. They found no math-anxiety effects on the first half of
the test, which had whole-number arithmetic problems. Anxiety effects were noted on the
second half of the test, which had more difficult problems, including mixed fractions,
percentages, solving for unknowns, and factoring. There was a strong negative correlation
between accuracy and math anxiety. Therefore, students with high levels of math anxiety did not
have an overall deficit in math competence (Ashcraft et al., 1998). The higher-level arithmetic
was where the competence and anxiety relationship was observed.
38
In an earlier research study, Ashcraft and Faust (1994) found that math anxiety had
minimal effects on performance with single-digit addition and multiplication problems. They
did find an effect of math anxiety on arithmetic problems including two-column addition or
multiplication problems. Students with high levels of math anxiety completed the task, but they
sacrificed considerable accuracy. This behavior resembles the avoidance of individuals with
high math anxiety, and it shows that the addition problems with regrouping were more difficult
for those individuals. Certainly, math anxiety causes lower math performance regardless of
actual math ability.
Reducing Math Anxiety
Teacher strategies. Since researchers have found teachers have a profound effect on
students’ math anxiety, addressing it at the teacher level may be an effective starting point in
reducing it in young children and improving overall math achievement (Geist, 2010; Ramirez et
al., 2013). Teachers should use the following techniques in order to lessen students’ math
anxiety (Blazer, 2011). First, teachers should develop strong skills and a positive attitude toward
math (Blazer, 2011). As explained above, teachers with math anxiety or negative views of math
contribute to math anxiety in their students (Sparks, 2015). By being positive and participating
in math skills’ training, teachers can counteract the negativity.
Second, teachers are encouraged to relate math to real life (Blazer, 2011). By making
connections to everyday life, students are able to view math as an important and useful tool
(Geist, 2010; Jackson, 2008). In addition, teachers should encourage critical thinking and active
learning (Blazer, 2011), and remove the emphasis on memorization and drill and practice, which
increase math anxiety (Geist, 2010). It also encourages teachers to incorporate games and hands-
on activities into math lessons. Furthermore, there should be less emphasis on correct answers
39
and computational speed (Blazer, 2011). Timed tests often increase math anxiety. By focusing
on the process, students may feel less anxious. In math, there is usually one right answer, but
there may be more than one way to obtain the correct answer. Instruction should balance the
speed and correct answer emphasis with the process (Geist, 2010; Jackson, 2008). Teachers
should praise student progress in mathematics (Gresham, 2007). All students need to feel
supported.
In addition, teachers should vary their instruction to include cooperative learning groups,
manipulatives, and technology in the classroom (Blazer, 2011). These are all ways of decreasing
math anxiety because students have the opportunity to exchange ideas, justify answers,
understand abstract ideas, and receive instant feedback (Woodard, 2004). Furthermore, teachers
should place an emphasis on differences in students’ learning styles, respect all learning styles,
and work to meet all students’ needs (Geist, 2010; Gresham, 2007). Moreover, teachers should
avoid putting students in embarrassing situations (Blazer, 2011). The atmosphere cultivated in
the classroom should be one of a safe, secure, and inviting place (Gresham, 2007). Students
should not feel threatened when they are called upon and expected to give an oral answer or
solve a problem on the board. They should be allowed alternative methods in order to decrease
their math anxiety (Ashcraft et al., 2007; Woodard, 2004). Finally, teachers should incorporate a
variety of assessments in addition to traditional and standardized tests (Blazer, 2011). Alternative
assessments include observation, demonstration, projects, journals, oral questioning, portfolios,
and performance tasks (Woodard, 2004).
Parent strategies. While the significance of parents’ attitudes on their children’s attitude
toward math warrants additional research, studies have found that parents still have an
influence. In order to prevent or reduce their children’s math anxiety, parents should not express
40
negative attitudes about math (Blazer, 2011). Parents may pass their negative attitudes toward
math to their children by modeling negative math behaviors. Parents need to conquer their own
math fears and avoid passing them onto their children (Geist, 2010; Sparks, 2011).
In addition, parents should have realistic expectations and monitor their children’s math
progress (Blazer, 2011). When parents have unrealistic expectations, it increases a child’s math
anxiety. Parents should follow their child’s progress by communicating with the teacher, helping
with homework as needed, and reviewing tests and quizzes. Moreover, parents should allow
mistakes (Boaler, 2016). Making mistakes is a critical part of the math learning. Further,
parents should provide support and encourage a growth mindset. Encouragement in math
strongly influences children’s attitudes toward math (Blazer, 2011). It is critical for parents to let
children know they believe they can succeed at math. Parents should believe and model a
growth mindset. Finally, parents should demonstrate positive uses for math (Blazer, 2011),
which help children understand the value of learning math. Sports, hobbies, home repairs,
cooking, bills, shopping, and checkbooks are all practical ways to demonstrate math positively
(see Figure 5).
Student strategies. Ramirez et al. (2016) believe that addressing math anxiety at the
teacher and parent level is even more effective when combined with student level interventions
(Blazer, 2011). In order to overcome math anxiety, researchers recommend that students
practice math problems every day (Cavanaugh, 2007). Second, students should use good study
techniques that match their individual learning style (Blazer, 2011). For example, visual learners
learn best through pictures, diagrams, and visuals; auditory learners learn best through lectures
and discussions; and kinesthetic learners learn best through hands-on learning. Third, students
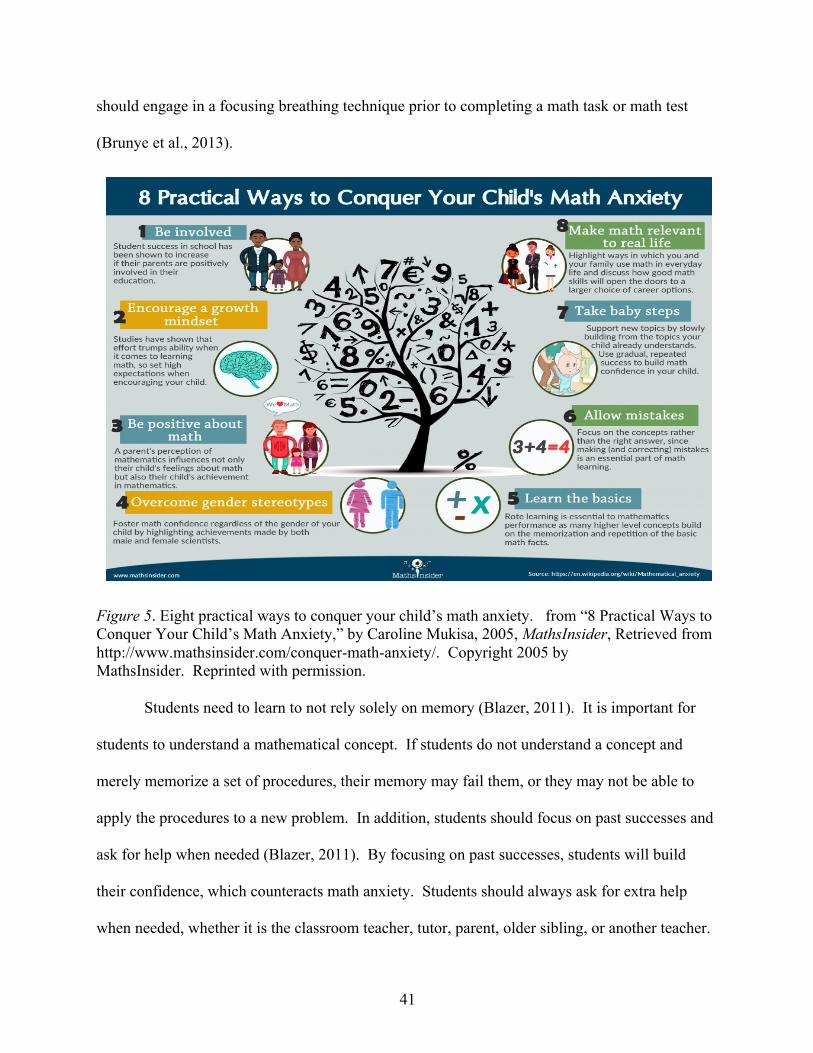
41
should engage in a focusing breathing technique prior to completing a math task or math test
(Brunye et al., 2013).
Figure 5. Eight practical ways to conquer your child’s math anxiety. from “8 Practical Ways to Conquer Your Child’s Math Anxiety,” by Caroline Mukisa, 2005, MathsInsider, Retrieved from http://www.mathsinsider.com/conquer-math-anxiety/. Copyright 2005 by MathsInsider. Reprinted with permission.
Students need to learn to not rely solely on memory (Blazer, 2011). It is important for
students to understand a mathematical concept. If students do not understand a concept and
merely memorize a set of procedures, their memory may fail them, or they may not be able to
apply the procedures to a new problem. In addition, students should focus on past successes and
ask for help when needed (Blazer, 2011). By focusing on past successes, students will build
their confidence, which counteracts math anxiety. Students should always ask for extra help
when needed, whether it is the classroom teacher, tutor, parent, older sibling, or another teacher.
42
Finally, students may find expressive writing helpful before an upcoming math test. Park
et al. (2014) compared individual’s performance on math ability tests before and after an
expressive writing exercise where they wrote for five to ten minutes about their feelings on the
upcoming math test. The expressive writing led to an increase in math performance for the
individuals with the greatest math anxiety (Park et al., 2014). Ramirez and Beilock (2011) had
highly math anxious students write about their worries and feelings before their final exam. The
writing helped increase their final exam scores from B- to B+ (Ramirez & Beilock, 2011).
School and district strategies. There are strategies that can be implemented in schools
and partnerships that can be developed between home and school that decrease math anxiety.
First, schools should provide parents workshops on ways to bolster number sense and spatial
abilities in young children (Maloney & Beilock, 2012). By targeting some of the precursors of
math anxiety, math anxiety can be reduced overall. Schools can also provide homework tools
such as math worksheets, iPad applications, and websites so parents are better prepared to help
with homework (Beilock & Maloney, 2015). Schools and districts should also provide
professional development courses on the research on math anxiety for established teachers
(Beilock & Maloney, 2015). Another intervention is to have schools employ professional school
counselors who are uniquely trained to help students cope with math anxiety (Ruff & Boes,
2014; Soni & Kumari, 2017).
Teacher education strategies. In teacher education math methods courses, there are
effective ways to teach the material in order to decrease the math anxiety of pre-service teachers
(Battista, 1986). When a math methods course is focused on how children learn mathematical
concepts, the math anxiety levels of pre-service teachers decrease. When a math methods course
is focused on how to teach a specific concept, the math anxiety levels of pre-service teachers do
43
not improve (Tooke & Lindstrom, 1998). By simply framing the course differently, teachers’
math anxiety decreases, which leads to greater math outcomes for students. Further, reflective
notebooks should be used by pre-service teachers in their mathematics course (Salinas, 2004).
The notebooks are used to write about perspectives on learning and math anxiety. Pre-service
teachers who incorporated this strategy reported that they were able to monitor their own
learning, share feelings, write questions, and express their concern and confusion (Salinas,
2004).
Understanding Self-Efficacy
Definition of self-efficacy. Self-efficacy is the belief students hold about their academic
abilities (Bandura, 1986). An important feature of self-efficacy is understanding that it refers to
the perceptions a student has about his ability as opposed to his actual ability. Students with self-
efficacy are effortful and able to perform at a high level, and when related to math, self-efficacy
may diminish math anxiety (Jain & Dowson, 2009; Pajares & Graham, 1999; Shores & Shannon,
2007). There is a positive correlation of .38 between self-efficacy and mathematics performance
(Stajkovic & Luthans, 1998). This correlation approximates the average negative correlation of -
.34 between anxiety and math performance (Hembree, 1990; Ma, 1999), and may mitigate the
negative correlation.
Nature of self-efficacy. Students with higher levels of self-efficacy put forth more
effort, persevere, attempt challenging problems, and incorporate wise problem-solving strategies
(Hoffman, 2010; Pajares, 1996; Pajares & Graham, 1999). They believe they are more
competent, which leads to their levels of higher self-efficacy. Students who perceive they are
less competent in math do not perform as well because their lower performance expectations
influence learning (Hoffman, 2010).
44
Self-efficacy has a negative correlation to math anxiety, and students with high math
anxiety believe they are less competent in math (Hoffman, 2010; Jain & Dowson, 2009; Ma &
Xu, 2004). Math anxiety interferes with a student’s ability to say, “I can” do mathematics
(Gresham, 2007). To overcome math anxiety, high self-efficacy and working memory ability are
necessary (Hoffman, 2010). Moreover, research indicates that self-efficacy, math anxiety, and
working memory play a role in problem-solving accuracy (Ashcraft & Kirk, 2001; Cooper &
Robinson, 1991; Hembree, 1990). Hoffman (2010) found that individuals with math anxiety
were more successful when solving problems that they perceived as easier. When the problems
increased in difficulty, the individuals struggled when attempting to find the solution. The
anxiety was present in both situations; however, self-efficacy appeared to be the prevailing
variable because it compensated for anxiety when the problems were perceived as easier. Self-
efficacy can help to intercept anxiety before it is cultivated.
Development of self-efficacy. Bandura (1997) asserts that an individual’s self-efficacy
beliefs come from four sources: mastery experience, vicarious experience, social persuasions,
and emotional and physiological states. Mastery experience is the most powerful source and
represents an individual’s interpretation of her personal accomplishments. For example, when a
student completes a particularly difficult math assignment and experiences success in
overcoming the task, there is a boost to self-efficacy (Bandura, 1997; Usher & Pajares, 2009).
Vicarious experience represents an individual’s observations of others and comparisons of
herself to them. Students compare themselves to peers, classmates, and adults and gauge their
performance and academic abilities against others (Usher & Pajares, 2009). If a student sees a
classmate solve a challenging math problem, then she may believe she can tackle the problem as
well. Social persuasions are the third source of self-efficacy. Self-efficacy is the encouragement
45
a student receives from parents, teachers, and peers that bolsters the student’s confidence in her
academic abilities (Bandura, 1997; Usher & Pajares, 2009). Finally, self-efficacy beliefs are
shaped by the emotional and physiological states of anxiety, stress, fatigue, and mood (Bandura,
1997). Strong emotions to school tasks trigger expected success or failure. High math anxiety
can undermine self-efficacy. In general, increasing a student’s emotional well-being and
decreasing a negative physiological state such as high math anxiety will strengthen self-efficacy
(Usher & Pajares, 2009).
Relationship of self-efficacy to math anxiety and math performance. Previous
research regarding psychological factors in math focuses on the relationship between (a) self-
efficacy (independent variable) and math performance (dependent variable), and (b) math
anxiety (independent variable) and math performance (dependent variable). Self-efficacy is
related to superior performance and the correlation has been shown in several studies (Akin &
Kurbanoglu, 2011; Jain & Dowson, 2009; Pajares & Graham, 1999; Shores & Shannon,
2007). As explained previously, math anxiety is a key affective variable and is linked to
decreased math achievement (Ashcraft, 2002; Hembree, 1990; Maloney et al., 2015; Ramirez et
al., 2013). Very few studies have focused on math anxiety as the dependent variable; however,
when those studies focused on math anxiety as the dependent variable, they looked at
instructional variables such as teacher instruction and textbook (Furner & Duffy, 2002; Jackson
& Leffingwell, 1999). In Jain and Dowson’s (2009) research study, they intentionally focused on
psychological variables, specifically self-efficacy, that may reduce math anxiety. Their results
indicated that self-efficacy was negatively related to math anxiety. Jain and Dowson (2009)
proposed that self-efficacy is a “key motivational variable impacting outcomes” (p. 246). Aksu
et al.’s (2016) study confirmed this concept when they found self-efficacy has a negative
46
relationship with anxiety, and they shared that self-efficacy was a predictor of math anxiety.
Math anxiety and self-efficacy go hand-in-hand and affect math achievement in an opposite
manner (Akin & Kurbanoglu, 2011; Cooper & Robinson, 1991). According to Bandura (1977),
self-efficacy is an extremely important factor influencing math anxiety.
Understanding Mindset
The brain and math. New technologies allow scientists to watch brain activity while
children and adults are working on math. Through brain scanning, scientists have been able to
prove that brains have plasticity; they are able to grow and change within periods of time
(Maguire, Woollett, & Spiers, 2006; Woollett & Maguire, 2011). One brain study had people
work on a ten-minute exercise every day for three weeks (Karni et al., 1998). Those individuals
who worked on the exercise daily experienced brain changes. Effort changes the brain because
the brain forms new connections (Blackwell et al., 2007; Boaler, 2013a). If the brain is able to
change from short daily exercises, it can certainly change from continued math instruction.
Brain research establishes that everyone can be successful in math with the right teaching and
communication (Boaler, 2016). Students need to believe in themselves and believe that they are
able to learn math.
Brain research also shows that brains grow when mistakes are made. Psychologist Jason
Moser found this growth by studying people’s brains as they made mistakes (Moser, Schroder,
Heeter, Moran, & Lee, 2011). When a mistake is made, the brain has two responses. The first is
increased electrical activity when there is a conflict between the correct answer and the
error. Growth happens whether or not the person is aware she made a mistake. The second is a
brain signal that reflects conscious attention to mistakes. This brain signal happens when the
person is aware an error has been made. Moser et al. (2011) compared these brain responses
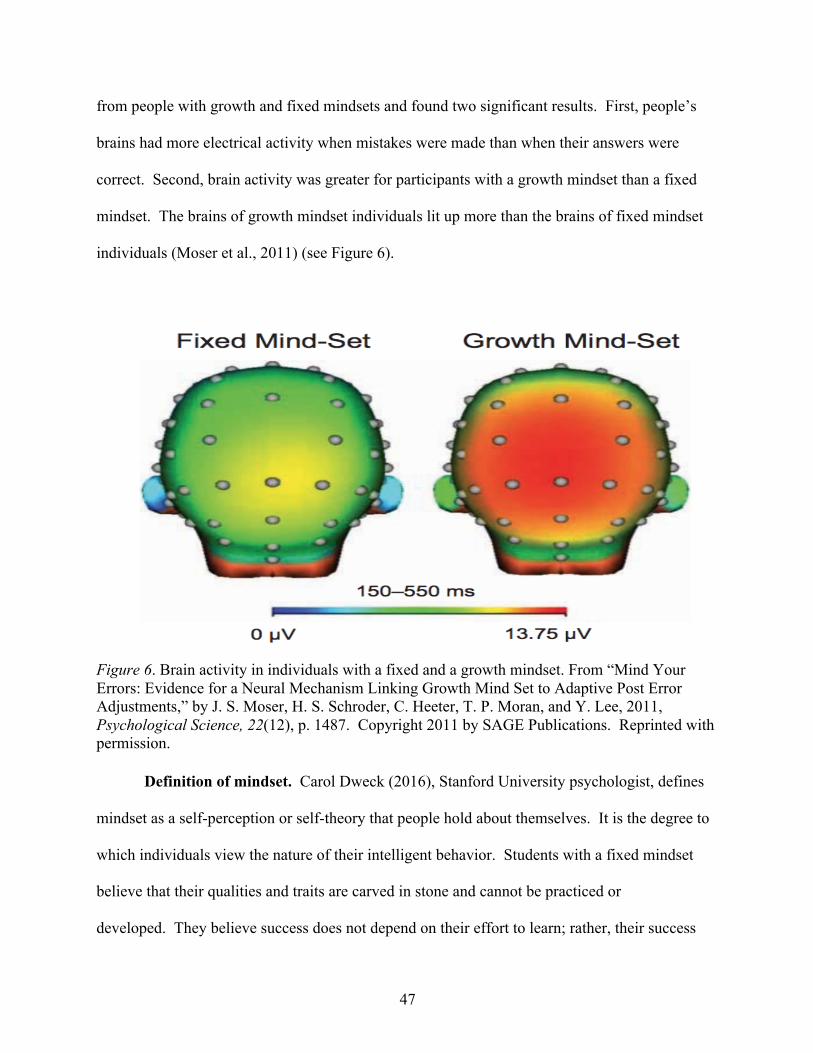
47
from people with growth and fixed mindsets and found two significant results. First, people’s
brains had more electrical activity when mistakes were made than when their answers were
correct. Second, brain activity was greater for participants with a growth mindset than a fixed
mindset. The brains of growth mindset individuals lit up more than the brains of fixed mindset
individuals (Moser et al., 2011) (see Figure 6).
Figure 6. Brain activity in individuals with a fixed and a growth mindset. From “Mind Your Errors: Evidence for a Neural Mechanism Linking Growth Mind Set to Adaptive Post Error Adjustments,” by J. S. Moser, H. S. Schroder, C. Heeter, T. P. Moran, and Y. Lee, 2011, Psychological Science, 22(12), p. 1487. Copyright 2011 by SAGE Publications. Reprinted with permission.
Definition of mindset. Carol Dweck (2016), Stanford University psychologist, defines
mindset as a self-perception or self-theory that people hold about themselves. It is the degree to
which individuals view the nature of their intelligent behavior. Students with a fixed mindset
believe that their qualities and traits are carved in stone and cannot be practiced or
developed. They believe success does not depend on their effort to learn; rather, their success
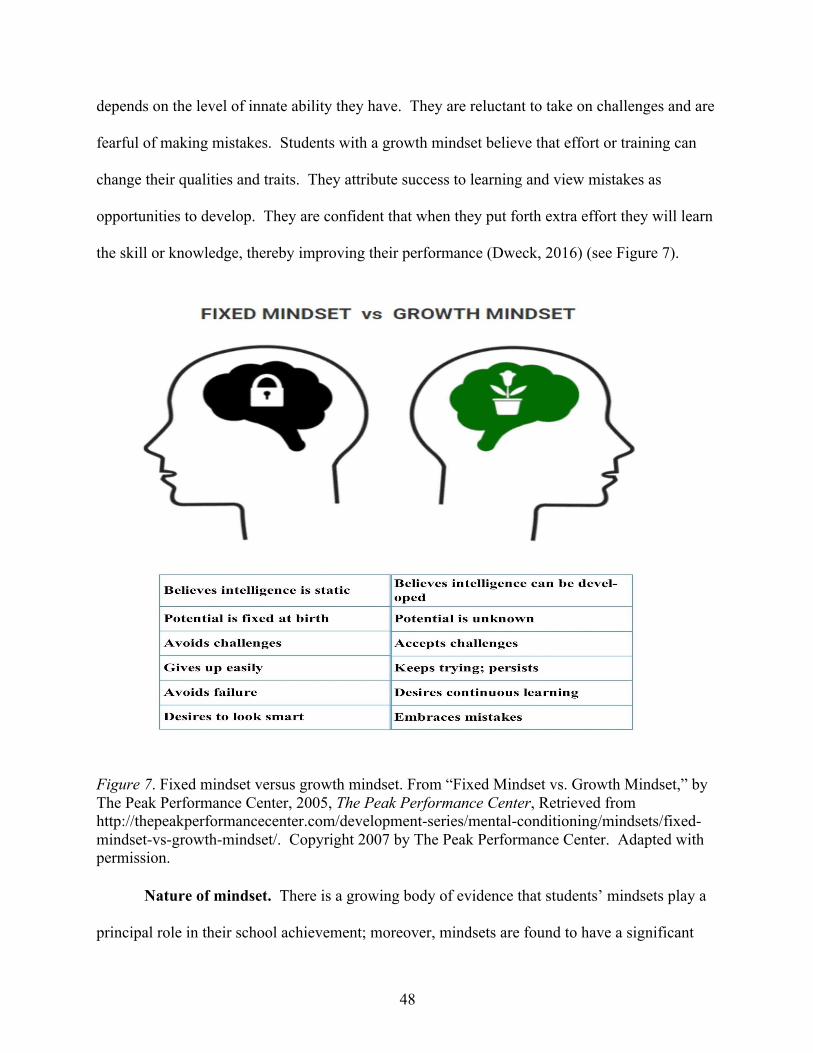
48
depends on the level of innate ability they have. They are reluctant to take on challenges and are
fearful of making mistakes. Students with a growth mindset believe that effort or training can
change their qualities and traits. They attribute success to learning and view mistakes as
opportunities to develop. They are confident that when they put forth extra effort they will learn
the skill or knowledge, thereby improving their performance (Dweck, 2016) (see Figure 7).
Figure 7. Fixed mindset versus growth mindset. From “Fixed Mindset vs. Growth Mindset,” by The Peak Performance Center, 2005, The Peak Performance Center, Retrieved from http://thepeakperformancecenter.com/development-series/mental-conditioning/mindsets/fixed-mindset-vs-growth-mindset/. Copyright 2007 by The Peak Performance Center. Adapted with permission.
Nature of mindset. There is a growing body of evidence that students’ mindsets play a
principal role in their school achievement; moreover, mindsets are found to have a significant
49
effect on math and science achievement (Boaler, 2013b; Dweck, 2008). Dweck’s research
classifies about 40% of students with a growth mindset and about 40% of students with a fixed
mindset. About 20% of students show mixed profiles (Boaler, 2013b; Dweck, 2008). Students
with a growth mindset perform at higher levels in school, and mindsets predict math
achievement over time. The differences in math grades can be attributed to several factors.
First, students with a growth mindset are more oriented toward learning goals, whereas students
with a fixed mindset are more focused on validating their intelligence (Blackwell et al.,
2007). Second, students with a growth mindset show a stronger belief in the potential of effort;
however, students with a fixed mindset believe that effort will be ineffective for them (Dweck,
2008). Finally, those with a growth mindset stand strong in the face of setbacks, such as putting
forth greater effort. When individuals with a fixed mindset face challenges, they tend to employ
negative strategies, such as withdrawal and cheating (Dweck, 2008).
Development of mindset. Mindsets are often formed at an early age and are influenced
by adults’ feedback. When teachers believe that math intelligence is fixed, they often respond to
students who scored low on a test with comments such as, “Not everyone has math talent – some
people are ‘math people’ and some aren’t” (Dweck, 2008, p. 8). On the other hand, when
teachers have a growth mindset and believe that math intelligence is acquirable, they give more
support to students and provide concrete feedback such as changing study strategies, working
with a tutor, and practicing with challenging math problems (Dweck, 2008). This finding
demonstrates how adults create self-fulfilling prophecies because when teachers believe in fixed
mindset, only the students that tend to achieve at a high level are those with high ability. When
teachers have a growth mindset, a broader range of students do well (Rheinberg, Vollmeyer, &
Rollett, 2000). Research shows that praising students for their intelligence makes students think
50
their abilities are fixed, makes them avoid challenging tasks, makes them lose confidence and
motivation when the task becomes hard, and impairs their performance on difficult problems
(Dweck, 2008). Process praise for effort or strategy, on the other hand, leads students to seek
and thrive on challenges (Dweck, 2008). An example of process praise is, “I see that you tried
several different strategies to solve that math problem. You stuck with it and were able to solve
using guess and check.”
Relationship of mindset to math performance. Mindsets play a key role in math
achievement. Students with a fixed mindset are at a significant disadvantage in math because
they believe that their mathematics ability is a fixed trait. Students with a growth mindset
perform at a higher level in math because they believe their abilities can be developed (Dweck,
2008). This observation was illustrated in a study by Blackwell et al. (2007) when they followed
373 students entering seventh grade. The researchers assessed the students’ mindsets and
monitored their math grades for the next two years. The results were dramatic. The achievement
of students with a fixed mindset stayed constant over the two years while the achievement of
students with a growth mindset increased (Blackwell et al., 2007; Boaler, 2016) (see Figure
8). During middle school, students’ beliefs about their intelligence played a significant role in
their math performance. According to Blackwell et al. (2007), students put forth more effort and
persistence when they believed their intelligence could increase.
Additional data suggest that a growth mindset leads to high math achievement. The
Program for International Student Assessment (PISA) team administers international tests every
four years and shares the data around the world. In the last set of tests, the United States ranked
36th out of 65 countries (PISA, 2012). Indeed, this statistic is alarming and speaks to the need
for reform in mathematics teaching and learning (Boaler, 2016). PISA also surveys students on
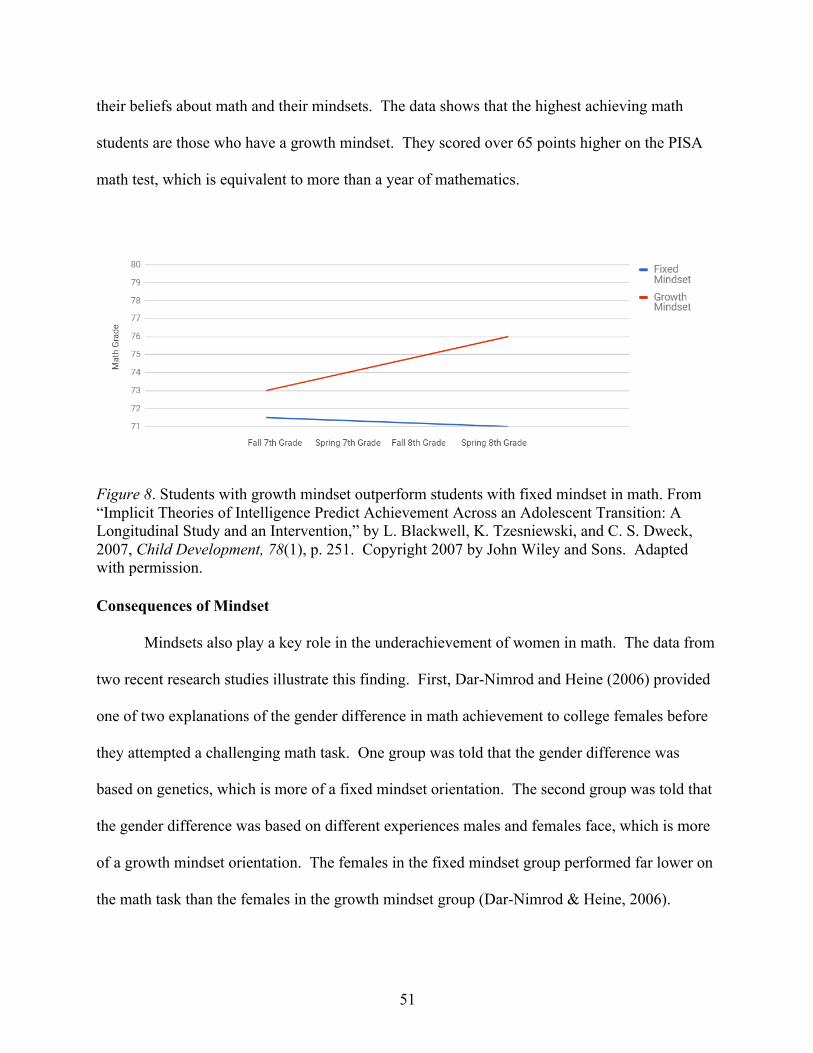
51
their beliefs about math and their mindsets. The data shows that the highest achieving math
students are those who have a growth mindset. They scored over 65 points higher on the PISA
math test, which is equivalent to more than a year of mathematics.
Figure 8. Students with growth mindset outperform students with fixed mindset in math. From “Implicit Theories of Intelligence Predict Achievement Across an Adolescent Transition: A Longitudinal Study and an Intervention,” by L. Blackwell, K. Tzesniewski, and C. S. Dweck, 2007, Child Development, 78(1), p. 251. Copyright 2007 by John Wiley and Sons. Adapted with permission. Consequences of Mindset
Mindsets also play a key role in the underachievement of women in math. The data from
two recent research studies illustrate this finding. First, Dar-Nimrod and Heine (2006) provided
one of two explanations of the gender difference in math achievement to college females before
they attempted a challenging math task. One group was told that the gender difference was
based on genetics, which is more of a fixed mindset orientation. The second group was told that
the gender difference was based on different experiences males and females face, which is more
of a growth mindset orientation. The females in the fixed mindset group performed far lower on
the math task than the females in the growth mindset group (Dar-Nimrod & Heine, 2006).
52
In a second study, Dweck (2008) followed several hundred females in a university
calculus class and studied how mindsets influenced their sense of belonging in math, their math
grades, and their desire to pursue math in the future. Females with a growth mindset were not
affected by negative stereotypes of women in math. They felt they belonged in the higher math
classes, they earned high grades, and they intended to continue higher math courses (Dweck,
2008). Females with a fixed mindset were affected by negative stereotypes about women in the
field of mathematics. Their math grade decreased over the course of the semester and they
questioned if they should pursue further advanced math courses (Dweck, 2008). Dweck explains
that “a fixed mindset contributes to this eroding sense of belonging, whereas a growth mindset
protects women’s beliefs that they are full and accepted members of the math community”
(Dweck, 2008, p. 5).
Changing Mindset
Changing the mindsets of students can have significant impact on their grades, test
scores, and overall math achievement (Dweck, 2008). In the second part of Blackwell et al.’s
(2007) research study explained previously, the researchers implemented growth mindset
workshops with the seventh graders. One group participated in eight study skills workshops with
growth mindset training. The students were taught about the brain as a muscle and how the brain
forms new synapses when new information is learned. The control group participated in the
eight study skills workshops, but they received no growth mindset training. The control groups’
math grades continued to decline, and the growth mindset groups’ math grades improved right
after the intervention and continued the upward climb toward higher achievement (Blackwell et
al., 2007, see Figure 9).
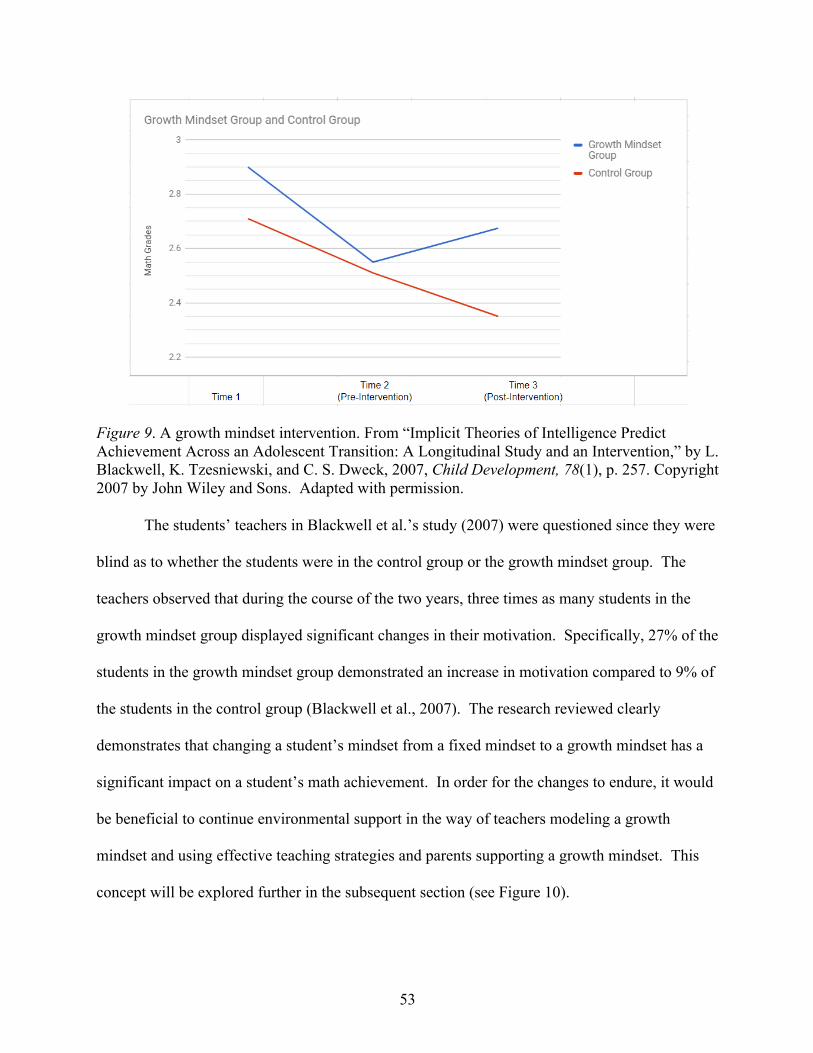
53
Figure 9. A growth mindset intervention. From “Implicit Theories of Intelligence Predict Achievement Across an Adolescent Transition: A Longitudinal Study and an Intervention,” by L. Blackwell, K. Tzesniewski, and C. S. Dweck, 2007, Child Development, 78(1), p. 257. Copyright 2007 by John Wiley and Sons. Adapted with permission.
The students’ teachers in Blackwell et al.’s study (2007) were questioned since they were
blind as to whether the students were in the control group or the growth mindset group. The
teachers observed that during the course of the two years, three times as many students in the
growth mindset group displayed significant changes in their motivation. Specifically, 27% of the
students in the growth mindset group demonstrated an increase in motivation compared to 9% of
the students in the control group (Blackwell et al., 2007). The research reviewed clearly
demonstrates that changing a student’s mindset from a fixed mindset to a growth mindset has a
significant impact on a student’s math achievement. In order for the changes to endure, it would
be beneficial to continue environmental support in the way of teachers modeling a growth
mindset and using effective teaching strategies and parents supporting a growth mindset. This
concept will be explored further in the subsequent section (see Figure 10).
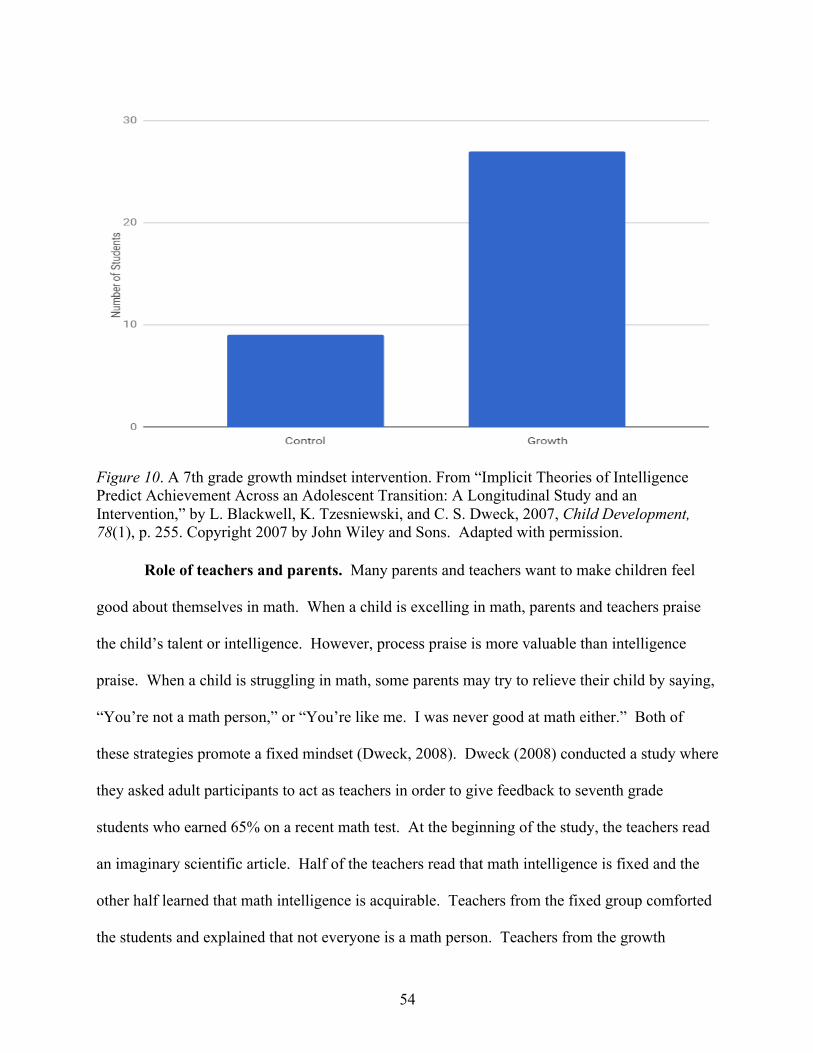
54
Figure 10. A 7th grade growth mindset intervention. From “Implicit Theories of Intelligence Predict Achievement Across an Adolescent Transition: A Longitudinal Study and an Intervention,” by L. Blackwell, K. Tzesniewski, and C. S. Dweck, 2007, Child Development, 78(1), p. 255. Copyright 2007 by John Wiley and Sons. Adapted with permission.
Role of teachers and parents. Many parents and teachers want to make children feel
good about themselves in math. When a child is excelling in math, parents and teachers praise
the child’s talent or intelligence. However, process praise is more valuable than intelligence
praise. When a child is struggling in math, some parents may try to relieve their child by saying,
“You’re not a math person,” or “You’re like me. I was never good at math either.” Both of
these strategies promote a fixed mindset (Dweck, 2008). Dweck (2008) conducted a study where
they asked adult participants to act as teachers in order to give feedback to seventh grade
students who earned 65% on a recent math test. At the beginning of the study, the teachers read
an imaginary scientific article. Half of the teachers read that math intelligence is fixed and the
other half learned that math intelligence is acquirable. Teachers from the fixed group comforted
the students and explained that not everyone is a math person. Teachers from the growth
55
mindset group gave more encouragement and support and shared strategies for improvement.
Moreover, teachers from the fixed group favored boys over girls and gave them more strategies
for improvement (Dweck, 2008). This finding provides an example of how adults’ mindsets
influence students’ mindsets. Both parents and teachers have the power to model growth
mindset.
Increasing Growth Mindset
Teacher strategies. Teachers have the profound ability to impact students. First, they
can convey a growth mindset by teaching students about brain plasticity and the view that the
brain becomes smarter when exercised (Dweck 2008). When teachers introduce a new math
concept, they can remind students that the new skill is developed and mastered through practice
and hard work because the brain is making new connections. Teachers can illustrate this concept
by sharing the examples of people who have made great contributions (Ericsson, Charness,
Feltovich, & Hoffman, 2006). Innate talent does not automatically propel an individual to genius
status. Success is often achieved through dedication, self-improvement, hard work, and
persistence. Next, teachers can promote a growth mindset by encouraging students to learn from
their mistakes (Boaler, 2016; Dweck, 2008). When a student makes a mistake, her brain sparks
and grows (Boaler, 2016; Moser et al., 2011). Mistakes have a double benefit because they
encourage learning and cause brain growth. Some teachers provide extra points when students
attempt challenging problems and make mistakes versus only providing points for correct
answers. Third, teachers can encourage a growth mindset by providing process praise over
intelligence praise (Dweck, 2008). Process praise focuses on effort, perseverance, and
improvement, as opposed to intelligence praise focusing on the person or final outcome. An
56
example of process praise is, “Everyone learns in a different way. Let’s keep trying to find the
way that works for you” (Dweck, 2008, p. 14).
As a summary, Boaler (2016) suggests seven messages that teachers can post and teach in
their math classrooms:
1. Everyone can learn math to the highest levels.
2. Mistakes are valuable.
3. Questions are really important.
4. Math is about creativity and making sense.
5. Math is about connections and communicating.
6. Depth is more important than speed.
7. Math class is about learning not performing (p. 277).
Parent strategies. Similar to teacher strategies, parents have the power to influence their
children in the area of mindset. First, parents should recognize their own mindset and be aware
of the messages they send through their words. Parents can focus on positive growth messages
instead of making comments such as, “I’m not good at math” or “You got my math
gene.” Second, parents can model learning from failure. When parents make mistakes in their
own lives, they can talk positively about the mistakes and model the process for their
children. Third, parents can support the productive struggle of their children. When a child is
struggling with a challenging math homework problem, parents should give the child time with
the problem. The child’s brain makes new connections through the effort put forth. Finally,
parents can praise the process by providing process praise to their children. Praising the child’s
effort instead of the child’s intellect acts as a constructive growth mindset message.
57
Teacher education program strategies. Teachers with fixed and growth mindsets
create self-fulfilling prophecies. When teachers have a fixed mindset, students with high ability
perform well in their class but other students do not perform as well. When teachers have a
growth mindset, students with a wide range of abilities do well (Rheinberg et al., 2000). Training
must exist to change the teachers’ fixed mindsets. Dweck (2008) recommends that all teacher
education programs include the following four components: (a) brain plasticity findings showing
that the brain is capable of changing, (b) idea that dedication and perseverance bring students
long-term success, (c) difference between process praise and intelligence praise and practice
using process praise statements, and (d) training on how to effectively challenge students of all
ability levels.
Another recommendation is to share the research on ability grouping with pre-service
teachers. The research indicates that ability grouping has a negative impact on the achievement
of students in the low and middle groups and does not improve the achievement of students in
the high group (Boaler, 2013b). Students’ beliefs about their own potential changes to match the
group in which they are placed. Ability grouping is based on fixed mindset beliefs and is
generally practiced by teachers with fixed mindsets. Students in mixed ability groups show
significant increases in achievement (Burris, Heubert, & Levin, 2006). Mixed ability grouping is
based on growth mindset beliefs.
Parachutes and Decimals Case Study
Margaret Kulkin is a Washington State certified teacher and fellow in School’s Out
Washington. She taught fifth grade and is the founder of Northwest K-8 Learning
Support. Kulkin strongly believes that all students need to make a “meaningful connection to
math” (Kulkin, 2016, p. 28). Furthermore, she promotes a focus on mastery goals rather than
58
performance. When the focus is on mastery, “success is defined by improvement, value is
placed on effort and the process of learning, satisfaction is gained from working hard and
learning something new” (Furner & Gonzalez-DeHass, 2011, p. 236). Students apply problem-
solving strategies to real world situations. Performance, on the other hand, creates competition,
memorization, and acquisition of skills.
Kulkin (2016) had the opportunity of working with Terry, a sixth-grader who loved speed
and sports. Terry needed to work on decimals, so Kulkin designed activities that appealed to
Terry’s interests while involving decimal calculations and averages. In the first activity, Terry
used a variety of materials to design two parachutes tied to Lego men. Kulkin dropped the
parachutes from a high stool while Terry used a stopwatch to time the drops to the nearest
thousandth of a second. He then calculated average drop time for both parachutes. In a second
math investigation, Terry explored decimals by playing virtual baseball. He hit a ball thrown by
a virtual pitcher and recorded the reaction time to the nearest hundredth of a second. He also
found the average. Kulkin witnessed Terry’s focus shift from performance to mastery and his
level of anxiety decreased. Terry’s description of math changed from “a scary movie” (Kulkin,
2016, p. 32) to “a book with many surprises” (Kulkin, 2016, p. 32).
Summary
It is beneficial to study math anxiety within the context of the types of general education
anxiety and overall math achievement. Original researchers believed that math anxiety was a
specific type of test anxiety, but math anxiety is now believed to be its own entity (Tobias &
Weissbrod, 1980). Math anxiety is the biggest predictor of math achievement, even when
considering working memory, gender, mindset, and self-efficacy (Ashcraft, 2002; Ashcraft &
Kirk, 2001; Beilock & Maloney, 2015; Hoffman, 2010; Miller & Bichsel, 2004). Most of the
59
research on math anxiety is with adolescents through adults (Harari et al., 2013). After
conducting several studies on younger elementary students, researchers have demonstrated that
math anxiety also exists among younger students (Chin, 2009; Ramirez et al., 2016). Studying
these younger students is an area that could benefit from further research.
Math anxiety is believed to be related to self-efficacy and mindset (Dweck, 2016; Jain &
Dowson, 2009; Miller & Bichsel, 2004). Self-efficacy and math anxiety are negatively
correlated (Hoffman, 2010; Jain & Dowson, 2009; Ma & Xu, 2004). When an individual is
struggling in math and has low self-efficacy, the struggle often leads to math anxiety. The field
of Mindset was also reviewed since having a fixed mindset contributes to math anxiety (Boaler,
2016). In contrast, growth mindset has the potential to change a student’s performance and make
a significant difference in the student’s ability to learn (Dweck, 2008).
In order to reduce math anxiety, a variety of strategies were reviewed from a teacher,
parent, student, school, and teacher education perspective. Since promoting growth mindset is
another way to reduce math anxiety, specific strategies for increasing it were reviewed. The
final section of the literature review was a case study in which the teacher incorporated several of
the strategies in order to reduce math anxiety and model a growth mindset.
60
Chapter 3: Research Design and Methodology
Introduction
The purpose of this qualitative research study was to determine the best practices
incorporated and challenges faced by teachers in reducing math anxiety. This chapter explains
the nature of qualitative research, as well as the strengths, weaknesses, and assumptions of the
qualitative approach. The specific methodology is described, which is a phenomenological
design. Moreover, the analysis unit, population, and sample are all detailed, in addition to
participant selection and human subject consideration. A key component of phenomenological
design is interviews, and the interview protocol and process is explained in detail. A discussion
of the reliability, validity, and researcher bias of the study follows. Finally, this chapter provides
a description of the data analysis.
Re-Statement of Research Questions
This chapter describes the research methods that were applied to achieve the objectives of
this study, which is to primarily answer these four research questions:
Research Question 1: What strategies and practices do teachers employ to reduce math
anxiety?
Research Question 2: What challenges do teachers face in reducing math anxiety?
Research Question 3: How do teachers measure the success of their practices in reducing
math anxiety?
Research Question 4: What recommendations would teachers make for future
implementation of strategies in reducing math anxiety?
61
Nature of the Study
The nature of this study is qualitative. Creswell (2013) defined qualitative research as an
approach that “begins with assumptions and the use of interpretive/theoretical frameworks that
inform the study of research problems addressing the meaning individuals or groups ascribe to a
social or human problem” (p. 44). Qualitative research is an inquiry-based approach, and it
shares common characteristics (Creswell, 2013; Creswell, 2014). First, the researcher collects
data in a natural setting where the participants experience the issue or problem being studied.
Instead of having participants complete instruments such as surveys, the researcher gathers
information by talking to participants directly (Creswell, 2013; Hatch 2002; Marshall &
Rossman, 2010). Second, the researcher is the key instrument and gathers data by observing
behavior, examining documents, and interviewing participants (Creswell, 2013; Hatch, 2002). In
addition, qualitative research involves multiple forms of data such as interviews, observations,
and documents (Creswell, 2013; Marshall & Rossman, 2010). It also involves both inductive
and deductive logic (Creswell, 2013; Hatch, 2002; Marshall & Rossman, 2010). Another
important aspect of qualitative research is that it is highly focused on learning the meaning the
participants have about the issue, rather than the meaning from the literature (Creswell, 2013;
Hatch, 2002). It is emergent because the research plan may change depending on the data
collection (Creswell, 2013; Marshall & Rossman, 2010). Moreover, qualitative research is
reflexive because the researcher emanates her background and how it affects her interpretation of
the study (Creswell, 2013; Horsburgh, 2003; Wolcott, 2010). Finally, it is holistic by providing a
complex picture and multiple perspectives (Creswell, 2013; Creswell, 2014; Hatch, 2002;
Marshall & Rossman, 2010).
62
Strengths. As with all types of research, there are strengths and weaknesses with
qualitative inquiry. When conducted properly, qualitative research allows issues or phenomena
to be studied in detail and in depth (Anderson, 2010). Much of the data are collected through
observations and interviews, which act as a strength. Interviews allow for flexibility in the
process, and the researcher is able to redirect and ask additional questions at a moment’s notice
(Anderson, 2010; Cal, 2017; Creswell, 2014). The researcher also has flexibility with the
research design, which can be revised as new information is obtained (Anderson, 2010; Cal,
2017). In addition, human subjects have the opportunity to share their personal reality and
experience (Creswell, 2014). The data collected from the participants is often more compelling
and powerful than quantitative data (Anderson, 2010). Nuances and subtleties about the
participants or topic may be discovered that could be missed with other forms of inquiry
(Anderson, 2010). A final strength is that conclusions from the research study are generalized to
other settings (Anderson, 2010).
Weaknesses. Qualitative research also has several weaknesses or limitations.
Sometimes, it is not as well respected and understood as quantitative research in scientific circles
(Anderson, 2010). In addition, the quality of the research may be influenced by the researcher’s
personal biases and the researcher’s observing and interviewing skills (Anderson, 2010;
Creswell, 2014; Horsburgh, 2003). Moreover, the presence of the researcher may affect the
participants’ responses (Anderson, 2010; Creswell, 2014; Horsburgh, 2003). The participants
may not be equally articulate and may differ in their degree of openness (Anderson, 2010;
Creswell, 2010). Another challenge of qualitative research is presenting certain findings due to
anonymity and confidentiality (Anderson, 2010; Creswell, 2014). Analysis and interpretation are
more time consuming in qualitative research because of the volume of data (Anderson, 2010).
63
Assumptions. There are four philosophical assumptions of qualitative studies:
ontological, epistemological, axiological, and methodological (Creswell, 2010). The ontological
assumption relates to the nature of reality because there are multiple realities in qualitative
research (Creswell, 2010). The researcher studies various individuals who all have their own
realities, and the readers of the research have their own realities. With this qualitative study, it is
the goal of the researcher to report the multiple perspectives across all participants (Moustakas,
1994). The epistemological assumption is characterized by how knowledge is known (Creswell,
2010). In qualitative research, the researcher gains knowledge through the participants and their
subjective experiences. The closer the researcher is to the participants, the more she knows what
she knows through first-hand information. In this study, the researcher is able to rely on quotes
and subjective experiences of the participants by interviewing and collaborating with them. Guba
and Lincoln (1988) describe it as minimizing the “distance” (p. 94) or “objective separateness”
(p. 94) between the researcher and participant. The axiological assumption relates to the role of
values in a study (Creswell, 2010). All researchers have values, but qualitative studies are
unique because the researchers make their values and biases known. When a researcher
interprets the data in a given study, it is shaped by the researcher’s own experiences (Denzin &
Lincoln, 2011). In this study, the researcher shares her bias as an educator and how it influences
her interpretation of the data. With the methodological assumption, the process of research is
detailed (Creswell, 2010). Qualitative research is inductive and emerging because the researcher
develops her questions from the ground up as opposed to developing all questions from a theory.
The researcher may add questions or modify existing procedures as she moves through the
interview and data collection process. In this study, the researcher has some follow-up questions
designed and may ask additional ones as the participants share information during the interviews.
64
Methodology
This study specifically utilized a phenomenological approach, which is one of five
approaches to qualitative research: narrative study, phenomenology, grounded theory,
ethnography, and case study (Creswell, 2013). A phenomenological study “describes the
common meaning for several individuals of their lived experiences of a concept or a
phenomenon” (Creswell, 2013, p. 76). The goal of phenomenological research is to gather
accounts from people who have experienced the phenomenon in question (Giorgi, 1997;
Moustakas, 1994). Giorgi (1997) wrote,
The turn to others is chosen in order to avoid the possible objection of bias, and the
natural attitude is utilized because, practically, one cannot expect all of the persons in the
whole world to be phenomenological and thus be capable of assuming the attitude of the
reduction. (p. 243)
Phenomenological research is used when the desired goal is to create meaning out of a
phenomenon. Adams and van Manen (2017) explain that,
[Phenomenology] promises fascinating insights into the meaningfulness of everyday life
and professional practice. Phenomenology calls us to wonder, reflect, and draw nearer to
joy, love, loss, contact, care, and all manner of deeply human meanings. It grants
inceptual understandings of the nature of being and becoming human in our increasingly
commercial, distracted, and conflicted world. (p. 781)
A phenomenological approach was best suited for this study because knowledge was
gained about the best practices for reducing math anxiety, which ultimately increase
mathematical proficiency and achievement. The knowledge was gained through a series of semi-
structured interviews with elementary teachers. The researcher transcribed all interviews and
65
found the common themes throughout the data. This method supported the primary goal of
phenomenological research to “synthesize multiple reported experiences to a description or
definition that expresses a universal theme” (Cal, 2017, p. 96).
Structured process of phenomenology. Giorgi (2009) and Moustakas (1994) detailed
specific procedures for conducting phenomenological research, which Creswell (2013) organized
into a list of seven steps: (a) the researcher determines if the research question is best answered
using a phenomenological approach; (b) the phenomenon of interest to study is selected, in this
case, math anxiety; (c) the researcher explains the assumptions of the phenomenological
approach and how she brackets out her own experiences; (d) data are collected in the form of
observations, interviews, and journals from individuals who have experienced the phenomena;
(e) the researcher analyzes the data by highlighting common statements to group them into
meaningful themes; (f) the researcher uses the significant themes to write a “textural description”
(Creswell, 2013, p. 82) of what the participants experienced and a “structural description”
(Creswell, 2013, p. 82) of how the participants experienced the phenomenon; and (g) the
researcher writes a composite description that focuses on the “essence of the phenomenon”
(Creswell, 2013, p. 82), or the common experiences of the participants.
Appropriateness of phenomenology methodology. The phenomenological approach
was best applied to this study because the research benefited from the teacher participants’ lived
experiences of working with students who have math anxiety. The participants shared strategies
they have successfully utilized and challenges they have encountered. As a result, the researcher
created a composite description of what the participants experienced and how they experienced it
(Creswell, 2013; Englander, 2012).
66
There are strengths of phenomenology that support using the phenomenological approach
for this study. Specifically, this phenomenological study provided an in-depth understanding of
the individual phenomena of math anxiety, and the researcher had the flexibility to redirect and
ask follow-up questions during the interview process. The result is a rich array of data gathered
from the experiences of the teacher participants (Anderson, 2010).
Although the phenomenological approach is considered the best approach for this study,
there are three weaknesses to address. First, it can be difficult to prevent researcher
bias. Second, there can be difficulty in ensuring pure bracketing, which can interfere in the
interpretation of the data. Third, there can be a variety of responses based on the participant’s
ability to articulate. This study mitigated these weaknesses in the following ways. First, the
researcher biases were clearly explained. Next, the researcher bracketed personal experiences as
an educator and administrator, so they did not interfere with the interpretation of the data
(Creswell, 2013). Finally, the questions were given to the participants in advance, and the
researcher asked an ice breaker question at the beginning of the interview to build rapport.
Research Design
A research design is a framework that “serves as a bridge between research questions and
the execution or implementation of the research” (Durrheim, 2006, p. 34).
Analysis unit. The analysis unit for this research study was a teacher identified as such:
1. An elementary teacher who teaches first through sixth grade at an elementary
school in the XYZ Unified School District,
2. A teacher with at least three years of teaching experience,
3. A teacher who possesses a California teaching credential.
67
Population. The population was all first through sixth grade elementary teachers in the
XYZ Unified School District. There are a total of 23 elementary schools in the district. The
elementary schools are kindergarten through sixth grade and have about 14 to 22 teachers.
Sample size. Sample size is an important decision in the data collection process and there
are various opinions in the research. A general guideline for qualitative research is to study a
few individuals in order to collect specific details about each individual (Creswell, 2013). The
purpose of qualitative research is to illuminate the particular as opposed to generalizing the
information (Pinnegar & Daynes, 2007). For phenomenological studies, researchers recommend
three to 25 subjects (Dukes, 1984; Polkinghorne, 1989; Riemen, 1986). According to Moustakas
(1994) and Creswell (2013), sample sizes in phenomenological studies should be from three or
four individuals to ten to 15 so the researcher can effectively explore the phenomenon with “a
group of individuals who have all experienced the phenomenon” (Creswell, 2013, p. 78).
Guetterman (2015) analyzed 11 phenomenological studies and found that the mean sample size
was 15 in the field of education and 25 in the field of health sciences, with a broad range of eight
to 52 subjects. Several of the 11 studies discussed saturation and defined saturation as,
“sufficient quality, completeness, and amount of information in addition to no evidence of new
themes in the interviews” (Guetterman, 2015, p. 10). Specifically, Martins (2008) interviewed
15 participants until she reached saturation. She felt she reached saturation after 12 interviews
but conducted an additional three interviews to ensure no new themes emerged. Guest, Bunce,
and Johnson (2006) administered an experiment to study saturation and found 12 interviews
were optimal for saturation. Kvale stated (1992), “To the common question ‘How many
interview subjects do I need?’, the answer is simply, ‘Interview so many subjects that you find
out what you need to know,’” (p. 165). Given that there is research supporting smaller sample
68
sizes (Creswell, 2013; Dukes, 1984; Moustakas, 1994; Polkinghorne, 1989; Riemen, 1986) and
that saturation is consistently found between 12 and 15 interviews (Beck & Watson, 2008; De
Wet, 2010; Guest et al., 2006; Martins, 2008), the sample size for this study was determined to
be 15 participants.
Purposive sampling. Purposive sampling is a sampling technique often used in
qualitative research to identify and select individuals that are knowledgeable about and have
experience in the phenomenon of interest (Anderson, 2010; Creswell & Plano Clark, 2011;
Palinkas, Horwitz, Green, Wisdom, Duan, & Hoagwood, 2015; Patton, 1990; Patton, 2002;
Sandelowski, 1995). In addition to having knowledge and experience, it is important for the
subjects to be available, willing to participate, and able to communicate in an articulate manner
(Bernard, 2002). Purposive sampling in qualitative research generates depth of understanding
whereas quantitative research focuses more on breadth of understanding (Palinkas et al., 2015).
Participation selection: Sampling frame to create the master list. Purposive sampling
was applied to this study to identify and select the individuals utilizing the following procedures.
Sampling frame is the master list of people who form the population from which the sample is
taken (Coyne, 1997). For this qualitative research study, a systematic procedure was developed
to create a master list of possible participants as explained below:
1. The XYZ Unified School District website was visited at https://www.xxxxx.org
(name redacted to ensure confidentiality).
2. Under the “Schools” tab, “Elementary A-L” was selected. There were 12
elementary schools.
3. The “Elementary M-Z” page was selected. There were 11 elementary schools.
69
4. The “View Website” button under each elementary school name was
clicked. This displayed each elementary school website.
5. On the individual school menu bar, “Programs” was expanded and “Teachers and
Websites” was selected.
6. Grade levels kindergarten through sixth grade were displayed. Grades first
through sixth were expanded and teacher names and emails were displayed.
7. This search generated 430 first through sixth grade teachers that made up the
master list. The master list included name, email, grade, and school, so inclusion
and exclusion criteria and maximum variation could be executed.
8. A master list of the population of first through sixth grade elementary teachers in
the XYZ Unified School District was created.
9. Inclusion and exclusion criteria such as education level, years of experience, and
availability for interviews eliminates a percentage of the potentially eligible
population (Preskorn, Macaluso, & Trivedi, 2015). The master list of eligible
participants was reduced by applying the inclusion and exclusion criteria as
explained subsequently.
10. Applying criteria for maximum variation. Maximum variation is an approach that
determines certain criteria in advance to differentiate the participants (Coyne,
1997; Creswell, 2013;). Participants are then selected that differ on the
criteria. Examples of maximum variation are age, gender, ethnicity, and grade
level of classroom. An advantage of maximum variation is that it increases the
probability that the research findings will represent different perspectives, which
is “an ideal in qualitative research” (Creswell, 2013, p. 157).
70
Criteria of inclusion. Criteria for inclusion were applied to the master list to further
create the sample. Each teacher’s name was entered on the CA Commission on Teacher
Credentialing website https://www.ctc.ca.gov on the “Public Search for an Educator” page. For
inclusion into the subpopulation of the study, the teacher needed to:
• Possess a Multiple Subject Teaching Credential
• Possess a Cross-cultural, Language, and Academic Development Certificate.
• Have had their teaching credential for five or more years
• Have three years of teaching experience
Criteria of exclusion. The following were criteria for exclusion:
• Any participants not available in January through March of 2018 for interviews
will be excluded.
• Any participant not willing to be audio recorded will be excluded.
Purposive sampling maximum variation. Maximum variation is a strategy that captures
and describes central themes that branch across participant variation (Hoepfl, 1997). It ensures a
variety of participants are selected and allows for patterns to emerge across the variation. If the
study’s sample list was larger than 20 individuals, then maximum variation was applied. Gender,
grade level, and location of school were used to ensure the list had variety. Finally, the master
list of potential teachers was contacted and invited to participate. Through the processes of
inclusion, exclusion, and maximum variation, a final list of 15 eligible participants was
generated.
Protection of Human Subjects
In accordance with Pepperdine University’s Internal Review Board (IRB) when
conducting research with human participants, consent must be obtained. For this study, the
71
researcher submitted an exempt application to IRB for review and approval prior to recruiting
participants (see Appendix A). In addition, the researcher completed the CITI program required
for persons conducting research (see Appendix B). The goal of the IRB process is two-fold: (a)
protect the welfare and dignity of human subjects, and (b) assist investigators in conducting
ethical research that complies with applicable regulations. As stated by Pepperdine University’s
IRB (2017),
It is the policy of Pepperdine University that all research involving human
participants must be conducted in accordance with accepted ethical, federal, and
professional standards for research and that all such research must be approved by
one of the university’s Institutional Review Boards (IRBs). In the review and
conduct of research, Pepperdine University is guided by the ethical principles set
forth in the Belmont Report. In addition, all human subjects research conducted
by or under the auspices of Pepperdine University will be performed in
accordance with the U.S. Code of Federal Regulations, CHHS (CFR), Title 45
Part 46 (45 CFR 46), entitled Protection of Human Research Subjects, and Parts
160 and 164, entitled Standards for Privacy of Individually Identifiable Health
Information and the California Protection of Human Subjects in Medical
Experimentation Act. (para. 2)
Prior to beginning the study, each participant signed an informed consent form that
acknowledged the protection of their human rights (see Appendix C). Informed consent forms
included the following (Sarantakos, 2005):
• Identification of the researcher
• Identification of the sponsoring institution
72
• Identification of the purpose of the study
• Identification of the benefits for participating
• Identification of the level and type of participant involvement
• Notation of risks to the participant
• Guarantee of confidentiality to the participant
• Assurance that the participant can withdraw at any time
• Provision of names of persons to contact if questions arise (p. 96).
Study participants originally received an e-mail to participate (see Appendix D).
Participation was voluntary and if a subject agreed to participate, the consent form (see
Appendix C) was secured. Confidentiality and anonymity was emphasized both verbally and in
writing. Participants were reminded that no negative ramifications would result from their
participation. Participants were identified as P1 through P15, so no records, including the
researcher’s notebook, had personally identifiable information. The researcher’s laptop was
password protected and all of the data were secured. As soon as the interviews were transcribed,
the recordings were destroyed. Upon completion of the study, all data with personally
identifiable information were destroyed. The transcriptions and non-identifiable data will be
kept securely at the researcher’s residence and destroyed after five years. Participants received
no remuneration other than a written thank you note and a copy of the completed research.
Data Collection
Subjects were contacted via e-mail using the IRB approved recruitment script (see
Appendix D). If no response was received within three days, then another e-mail was
sent. Once the subject agreed to participate in the study, the informed consent form (see
Appendix C) and interview questions (see Table 6) were e-mailed. E-mail correspondence was
73
used to schedule one-hour, in-person interviews at a convenient location for the participant. At
the beginning of each interview, the signed consent form was collected. A hard copy of the
consent form was brought to the interview in the event that the participant did not bring his
signed copy. Each interview was recorded using two recording devices and the researcher had a
notebook for key thoughts or questions for later reflection.
Interview Techniques
A semi-structured interview technique was used for the data collection in this
phenomenological research study. Before explaining the reasoning behind selecting the semi-
structured interview, the three types of interviews in qualitative research will be explained in
detail. The first type, the structured interview, follows a set of stringent questions that do not
allow the interviewer to divert (DiCicco-Bloom & Crabtree, 2006; Gray, 2009). A strength of
the structured interview is that it is believed to reduce interviewer bias (Bragger, Kutcher,
Morgan, & Firth, 2002), and a weakness is that it does not provide any flexibility if the
interviewer would like to ask follow-up questions or probe deeper based on the participant’s
responses. The second type is the semi-structured interview, which is an in-depth interview
where the interviewer asks predesigned open-ended questions (Jamshed, 2014). It is generally
conducted one time, with an individual or group, and lasts 30 minutes to one hour (Corbin &
Strauss, 2008; DiCicco-Bloom & Crabtree, 2006). Collecting descriptive responses during a
semi-structured interview helps to achieve the goal of making meaning out of a particular
phenomenon (Englander, 2012). Weaknesses of the semi-structured interview include limited
flexibility in questions and responses, duration of time, and a lack of detailed responses if the
interviewer is not skilled and the interviewee is not articulate (Fontana & Frey, 2000). The third
type, the unstructured interview, resembles a conversation without a pre-planned set of questions
74
and it is often used in long-term field work (Jamshed, 2014). It is more difficult to control for
interviewer bias during the unstructured interview; however, it offers more of an in-depth
understanding of the phenomenon and human behavior (Fontana & Frey, 2000).
For this study, the semi-structured interview was selected because it allowed the
interviewer to be prepared with questions and possible follow-up questions, and it allotted time
for the interviewee to ruminate on the questions in advance. In addition, the semi-structured
interview had strong validity due to the lack of interference from the interviewer (Cal, 2017), and
it allowed the interviewee to speak in detail about the phenomenon of math anxiety (Englander,
2012). According to Seidman (2013), the purpose of the interview was not to obtain answers to
questions, but to understand the lived experiences of the participants. The interview allowed for
the participants to explain their experiences and for the interviewer to listen carefully and follow-
up accordingly (Castillo-Montoya, 2016).
One week prior to the scheduled interviews, a reminder e-mail was sent to each
participant. In addition, the informed consent form and interview questions were re-sent.
Receiving the interview questions in advance allowed the participants time to consider their
responses. The evening before the interviews, a final reminder e-mail was sent detailing the date,
time, and location of the interview appointment.
For each interview, the researcher arrived 15 minutes early to the location with two
recording devices, pens, and a notebook. She introduced herself to the participant with eye
contact and a firm handshake and expressed gratitude for the subject’s willingness to
participate. The goal was to build rapport with the interviewee (Rubin & Rubin, 2012). She
reviewed and collected the signed copy of the informed consent form and asked if there were any
clarifying questions before they began. The researcher reminded the participant that the
75
interview would be recorded and confirmed confidentiality. To open the interview, the
researcher asked two ice-breaker questions about the participant’s professional background and
thoughts on math anxiety (Castillo-Montoya, 2016). The interviewer then proceeded to ask all
eight questions (see Table 6) and any follow-up questions as deemed appropriate. The
researcher was prepared and engaged, so she was able to respond thoughtfully to the responses
and further probe themes (Louw, Todd, & Jimakorn, n.d.). Throughout the interview, the
researcher practiced active listening, which is listening with a purpose (Pearson, Nelson,
Titsworth, & Harter, 2006). The researcher asked follow-up questions and statements, such as
(Wilson, 2016):
• “How do you typically…?”
• “Why do you think…?
• “Can you clarify…?”
• “Tell me more…”
To close the interview, the researcher asked if the participant had any final thoughts and
reiterated confidentiality. The researcher explained the written transcription would be provided,
expressed gratitude for the participant’s time and willingness to share, and explained a copy of
the research findings would be provided once complete. The researcher sent a handwritten thank
you note to each participant within a week of the interview.
Interview Protocol
The study was guided by the following interview questions:
IQ 1: How do you detect math anxiety in a student?
IQ 2: What strategies do you use to reduce math anxiety in your students?
76
IQ 3: In implementing the strategies mentioned in IQ 2, what challenges do you face in
teaching students with math anxiety?
IQ 4: What other challenges have you faced regarding math anxiety?
IQ 5: Share some of your success stories in helping students who have math anxiety.
IQ 6: What is your system for measuring and tracking success?
IQ 7: How do you keep track of your success with students who have math anxiety?
IQ 8: What advice do you have for new teachers who have students with math anxiety?
Relationship between research and interview questions. The development of the eight
interview questions was designed to address each research question. The interview questions
resulted from literature reviewed in Chapter 2, personal knowledge, and a three-step process to
establish validity that included prima facie, peer review, and expert review. The process will be
explained in detail below.
Validity of the study. Validity in qualitative research is how accurately the data truly
represent the phenomenon being studied and the extent an instrument measures what it is
intended to measure (Biddix, n.d.; Creswell, 2000; Creswell & Miller, 2000). Moreover, validity
relates to the terms “trustworthiness, authenticity, and credibility” (Creswell, 2013, p. 205). To
ensure that the interview questions addressed the research questions and, ultimately, provided
accuracy in the research findings, the research instrument was validated using the three-step
process of prima facie, peer review, and expert review.
Prima facie and content validity. Prima facie is a Latin term used in the early works of
Roman and Medieval scholars of philosophy and law (Herlitz, 1994). Translated, prima facie
means “on/at first appearance” (Herlitz, 1994, p. 392). Content validity is the “appropriateness
of the content of the instrument” (Biddix, n.d., p. 2). The first step in establishing instrument
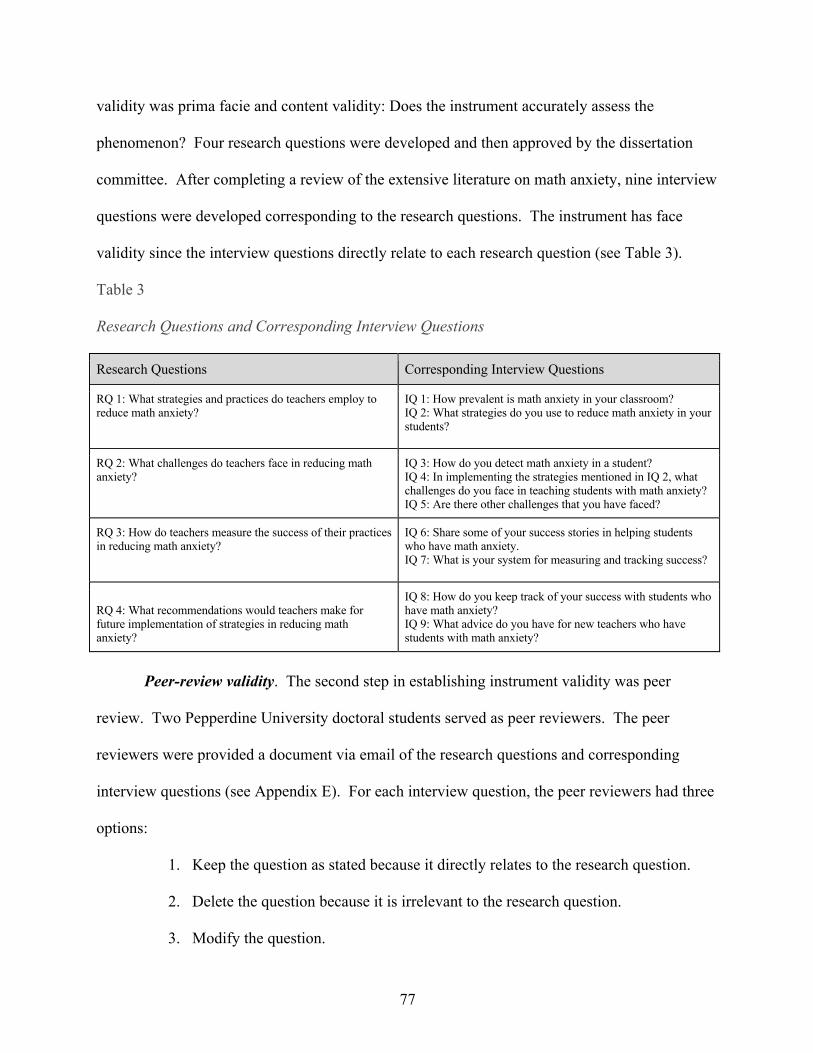
77
validity was prima facie and content validity: Does the instrument accurately assess the
phenomenon? Four research questions were developed and then approved by the dissertation
committee. After completing a review of the extensive literature on math anxiety, nine interview
questions were developed corresponding to the research questions. The instrument has face
validity since the interview questions directly relate to each research question (see Table 3).
Table 3
Research Questions and Corresponding Interview Questions
Research Questions Corresponding Interview Questions
RQ 1: What strategies and practices do teachers employ to reduce math anxiety?
IQ 1: How prevalent is math anxiety in your classroom? IQ 2: What strategies do you use to reduce math anxiety in your students?
RQ 2: What challenges do teachers face in reducing math anxiety?
IQ 3: How do you detect math anxiety in a student? IQ 4: In implementing the strategies mentioned in IQ 2, what challenges do you face in teaching students with math anxiety? IQ 5: Are there other challenges that you have faced?
RQ 3: How do teachers measure the success of their practices in reducing math anxiety?
IQ 6: Share some of your success stories in helping students who have math anxiety. IQ 7: What is your system for measuring and tracking success?
RQ 4: What recommendations would teachers make for future implementation of strategies in reducing math anxiety?
IQ 8: How do you keep track of your success with students who have math anxiety? IQ 9: What advice do you have for new teachers who have students with math anxiety?
Peer-review validity. The second step in establishing instrument validity was peer
review. Two Pepperdine University doctoral students served as peer reviewers. The peer
reviewers were provided a document via email of the research questions and corresponding
interview questions (see Appendix E). For each interview question, the peer reviewers had three
options:
1. Keep the question as stated because it directly relates to the research question.
2. Delete the question because it is irrelevant to the research question.
3. Modify the question.

78
The peer reviewers provided written feedback on the document and returned to the researcher via
email within one week. Based on the doctoral students’ feedback, interview question five (IQ 5)
was revised to obtain explicitness (see Table 4).
Table 4
Research Questions and Corresponding Interview Questions (Revised)
Research Questions Corresponding Interview Questions (Revised)
RQ 1: What strategies and practices do teachers employ to reduce math anxiety?
IQ 1: How prevalent is math anxiety in your classroom? IQ 2: What strategies do you use to reduce math anxiety in your students?
RQ 2: What challenges do teachers face in reducing math anxiety?
IQ 3: How do you detect math anxiety in a student? IQ 4: In implementing the strategies mentioned in IQ 2, what challenges do you face in teaching students with math anxiety? IQ 5: What other challenges have you faced regarding math anxiety?
RQ 3: How do teachers measure the success of their practices in reducing math anxiety?
IQ 6: Share some of your success stories in helping students who have math anxiety. IQ 7: What is your system for measuring and tracking success?
RQ 4: What recommendations would teachers make for future implementation of strategies in reducing math anxiety?
IQ 8: If there was a student you could go back and help in math, what would you do differently? IQ 9: What advice do you have for new teachers who have students with math anxiety?
Reliability of the study and pilot interview. Reliability is the degree to which the
instrument consistently measures what it is supposed to measure (Biddix, n.d.). Specifically,
reliability is repeatability and consistency. Richard and Morse (2013) explained that a study has
reliability if it yields the same results when repeated. In order to establish the reliability of the
instrument, the researcher conducted two pilot interviews with current teachers who met the
criteria for participation. At the end of each interview, the researcher sought input from the
interviewees regarding clarity, flow, and understandability of the interview questions. Their
recommendations were incorporated into the interview questions (see Table 5).
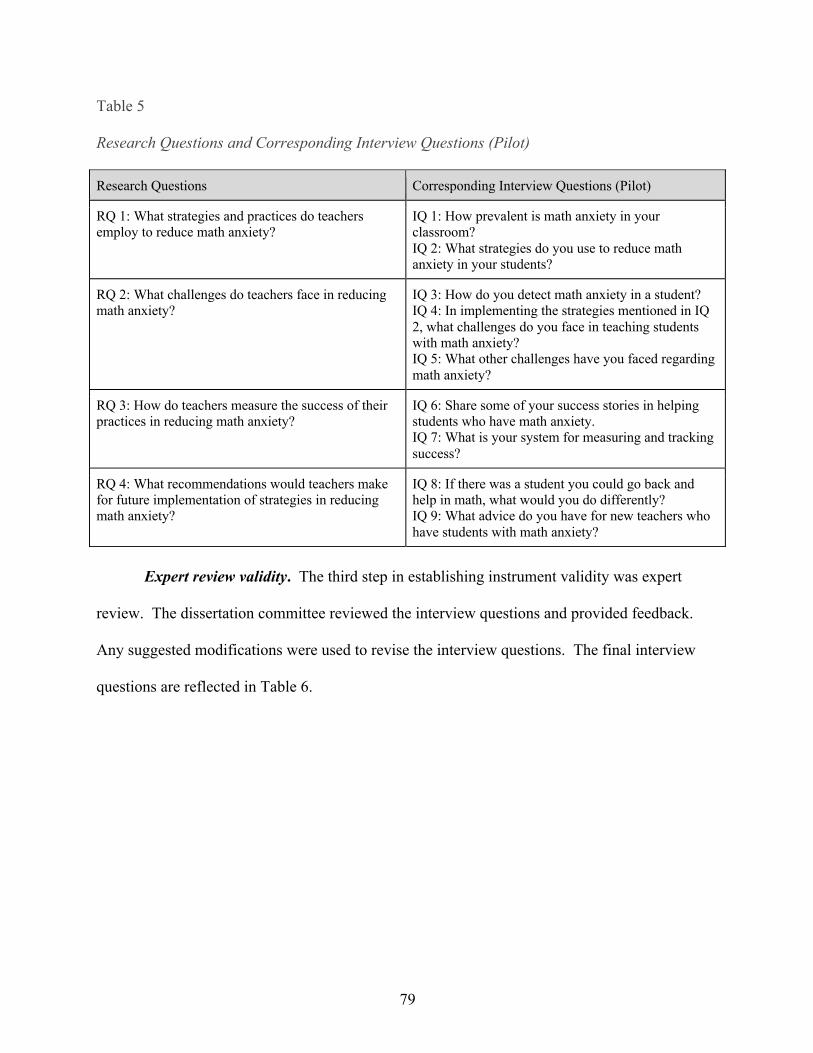
79
Table 5
Research Questions and Corresponding Interview Questions (Pilot)
Research Questions Corresponding Interview Questions (Pilot)
RQ 1: What strategies and practices do teachers employ to reduce math anxiety?
IQ 1: How prevalent is math anxiety in your classroom? IQ 2: What strategies do you use to reduce math anxiety in your students?
RQ 2: What challenges do teachers face in reducing math anxiety?
IQ 3: How do you detect math anxiety in a student? IQ 4: In implementing the strategies mentioned in IQ 2, what challenges do you face in teaching students with math anxiety? IQ 5: What other challenges have you faced regarding math anxiety?
RQ 3: How do teachers measure the success of their practices in reducing math anxiety?
IQ 6: Share some of your success stories in helping students who have math anxiety. IQ 7: What is your system for measuring and tracking success?
RQ 4: What recommendations would teachers make for future implementation of strategies in reducing math anxiety?
IQ 8: If there was a student you could go back and help in math, what would you do differently? IQ 9: What advice do you have for new teachers who have students with math anxiety?
Expert review validity. The third step in establishing instrument validity was expert
review. The dissertation committee reviewed the interview questions and provided feedback.
Any suggested modifications were used to revise the interview questions. The final interview
questions are reflected in Table 6.
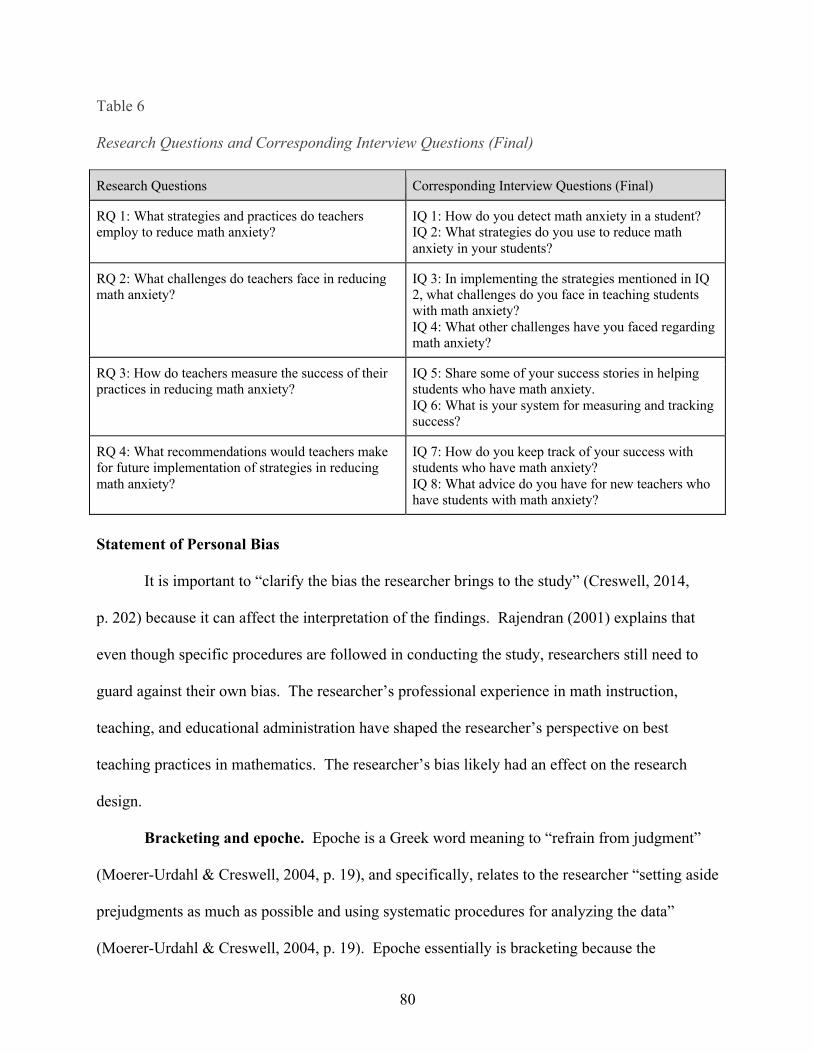
80
Table 6
Research Questions and Corresponding Interview Questions (Final)
Research Questions Corresponding Interview Questions (Final)
RQ 1: What strategies and practices do teachers employ to reduce math anxiety?
IQ 1: How do you detect math anxiety in a student? IQ 2: What strategies do you use to reduce math anxiety in your students?
RQ 2: What challenges do teachers face in reducing math anxiety?
IQ 3: In implementing the strategies mentioned in IQ 2, what challenges do you face in teaching students with math anxiety? IQ 4: What other challenges have you faced regarding math anxiety?
RQ 3: How do teachers measure the success of their practices in reducing math anxiety?
IQ 5: Share some of your success stories in helping students who have math anxiety. IQ 6: What is your system for measuring and tracking success?
RQ 4: What recommendations would teachers make for future implementation of strategies in reducing math anxiety?
IQ 7: How do you keep track of your success with students who have math anxiety? IQ 8: What advice do you have for new teachers who have students with math anxiety?
Statement of Personal Bias
It is important to “clarify the bias the researcher brings to the study” (Creswell, 2014,
p. 202) because it can affect the interpretation of the findings. Rajendran (2001) explains that
even though specific procedures are followed in conducting the study, researchers still need to
guard against their own bias. The researcher’s professional experience in math instruction,
teaching, and educational administration have shaped the researcher’s perspective on best
teaching practices in mathematics. The researcher’s bias likely had an effect on the research
design.
Bracketing and epoche. Epoche is a Greek word meaning to “refrain from judgment”
(Moerer-Urdahl & Creswell, 2004, p. 19), and specifically, relates to the researcher “setting aside
prejudgments as much as possible and using systematic procedures for analyzing the data”
(Moerer-Urdahl & Creswell, 2004, p. 19). Epoche essentially is bracketing because the
81
researcher is bracketing, or suspending judgment, and setting aside her experiences to have a
fresh perspective regarding the phenomenon under study (Aagaard, 2017; Creswell, 2013;
Moerer-Urdahl & Creswell, 2004; Moustakas, 1994). For this study, the researcher listed all
preconceived thoughts on math anxiety and mindset toward math prior to beginning the
interviews. In addition, the researcher kept a reflective journal of observations and assumptions
during the data collection process. This journal allowed for a clearing of thoughts where
preconceptions and prejudgments leave the mind, so the researcher could focus on the
participants’ answers during the interviews (Moerer-Urdahl & Creswell, 2004). These two
exercises served as a means of bracketing (Creswell, 2013) and helped to reduce personal
biases.
Data Analysis
After the data were collected and transcribed, the data analysis began. The researcher
read all of the transcriptions while writing down brief notes in the margins. Coding
followed. According to Moustakas (1994), analyzing the data consist of the researcher
identifying significant words and phrases from participants, clustering these phrases into themes,
synthesizing the themes into descriptions of the interviewees’ experiences, and making meaning
about the essence of the phenomenon. Creswell (2014) used Moustakas’ approach to develop
six specific steps in qualitative data analysis: (a) prepare the data for analysis, including
transcription, (b) read all of the data and write brief notes regarding initial impressions, (c) code
the data, (d) use the coding to generate descriptions and themes, (e) explain the findings through
narration, tables, graphs, and (f) interpret the findings and results.
Coding. Coding is a word or short phrase that assigns an “essence-capturing attribute”
(Saldana, 2013, p. 2) for a portion of the data. The three main types of coding are structured,
82
semi-structured, and unstructured. Structured coding uses a “conceptual phrase representing a
topic of inquiry to a segment of data that relates to a specific research question used to frame the
interview” (MacQueen, McLellan-Lemal, Bartholow, & Milstein, 2008, p. 124). It is a
questions-based code and is appropriate for all qualitative studies, particularly hypothesis testing
and structured or semi-structured interviews (Saldana, 2013). Unstructured coding does not have
a predetermined notion of the codes to use during the coding process. It is also effective for all
qualitative studies. Semi-structured coding is a combination of the two. This study used
unstructured coding to allow themes to develop from the interpretation of data.
The transcribed data were analyzed and coded. The codes were one-word descriptive
codes, which summarize the main topic of the excerpt. Other codes were phrases that captured
the essence of the excerpt. Creswell (2014) explains that 25 to 30 codes is the ideal range to
develop five to six themes. A table was created for each interview question and each column
represented one of the 15 participants. The codes were added to the table and were used to arrive
at themes.
Inter-rater reliability and validity. External validity is “the extent to which the results
of a study can be generalized from a sample to a population” (Biddix, n.d., p. 2). One procedure
to reduce the threat to external validity is to incorporate inter-rater reliability (Creswell,
2014). Inter-rater reliability is a measure of reliability used to assess the degree to which
different raters or observers agree on the same phenomenon (Phelan & Wren, 2005). A three-
step process was used to establish inter-rater reliability.
Step 1: The researcher individually coded the first three interviews according to the
coding process explained previously.
83
Step 2: The researcher shared the transcripts and coding results from the three interviews
with two peer reviewers. The reviewers were doctoral students in the Organizational
Leadership program at Pepperdine University. They were experienced in qualitative
research and were both completing dissertation work with a similar coding process. The
reviewers reviewed the transcripts and coding results and supported the initial results or
recommended modifications. The researcher and reviewers discussed until consensus
was reached. If the panel was unable to arrive at a consensus, the dissertation committee
reviewed.
Step 3: The researcher proceeded to code the remaining 12 interviews. The researcher
once again shared the transcripts and coding results with the two peer reviewers. Upon
review, the researcher and reviewers discussed to gain consensus. If consensus was not
reached, the dissertation committee worked to resolve the differences and made the final
decision.
Summary
Chapter 3 discussed the nature of qualitative research and presented the strengths and
weaknesses of qualitative studies. The research questions were re-stated and the specific
methodology for this phenomenological study was explained in detail. Data were collected
through semi-structured interviews, and the interview questions were developed through a three-
step process including prima facie, peer review, and expert review. Techniques for conducting
valid and reliable qualitative research were described. The chapter concluded with a discussion
on data analysis. The research findings are presented in Chapter 4.
84
Chapter 4: Findings
Introduction
Competence in mathematics is necessary to achieve success in STEM fields (National
Mathematics Advisory Panel, 2008). One area that significantly impacts math proficiency is
math anxiety (Ashcraft, 2002), and math anxiety can cause students to develop negative attitudes
toward math, avoid future math courses, and refrain from careers involving math (Ferguson et
al., 2015). Even if a student is not going to pursue a career in STEM fields, it is essential to
reduce math anxiety and increase mathematical competence for daily math literacy (Schoenfeld,
1995). The intention of this qualitative study was to investigate best practices in reducing math
anxiety.
Specifically, the purpose of the study was to (a) determine the strategies and practices
teachers employ to reduce math anxiety, (b) determine the challenges teachers face in reducing
math anxiety, (c) determine how teachers measure the success of their practices in reducing math
anxiety, and (d) determine the recommendations teachers would make for future implementation
of strategies in reducing math anxiety. To accomplish this task, this study sought to answer the
following four research questions:
Research Question 1: What strategies and practices do teachers employ to reduce math
anxiety?
Research Question 2: What challenges do teachers face in reducing math anxiety?
Research Question 3: How do teachers measure the success of their practices in reducing
math anxiety?
Research Question 4: What recommendations would teachers make for future
implementation of strategies in reducing math anxiety?
85
To answer these four research questions, eight open-ended interview questions were
developed that directly inform a specific research question. The interview questions were
confirmed through a three-step validity process that included prima facie, peer review, and
expert review. Reliability was established by conducting pilot interviews with two current
teachers who meet the criteria for participation. The following eight interview questions were
included in the interview protocol and were used to interview the participants in the study:
IQ 1: How do you detect math anxiety in a student?
IQ 2: What strategies do you use to reduce math anxiety in your students?
IQ 3: In implementing the strategies mentioned in IQ 2, what challenges do you face in
teaching students with math anxiety?
IQ 4: What other challenges have you faced regarding math anxiety?
IQ 5: Share some of your success stories in helping students who have math anxiety.
IQ 6: What is your system for measuring and tracking success?
IQ 7: How do you keep track of your success with students who have math anxiety?
IQ 8: What advice do you have for new teachers who have students with math anxiety?
Interview participants were asked to provide responses to the eight interview questions in as
much detail as possible. The interviewer asked further probing and follow-up questions as
deemed appropriate. This chapter provides a description of the participants in this study, a
discussion of the data collection and data analysis process, and a description of the inter-rater
review process. Finally, the chapter details the findings from the data collected from the eight
interview questions.
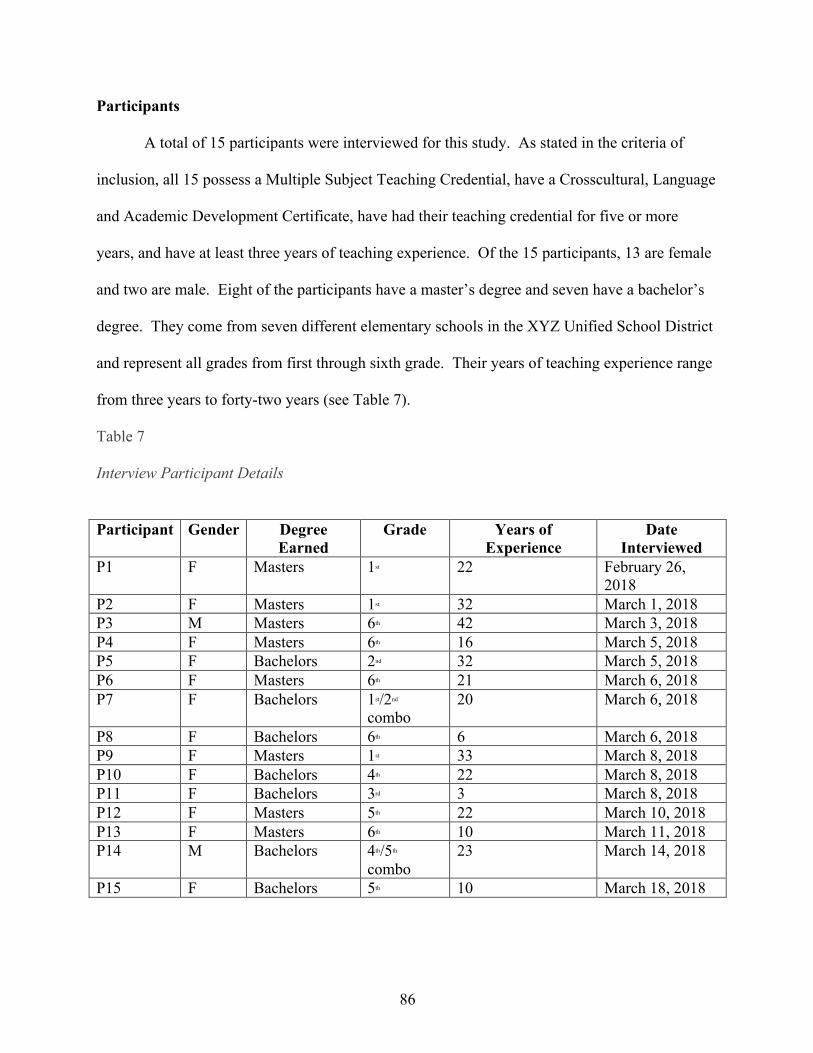
86
Participants
A total of 15 participants were interviewed for this study. As stated in the criteria of
inclusion, all 15 possess a Multiple Subject Teaching Credential, have a Crosscultural, Language
and Academic Development Certificate, have had their teaching credential for five or more
years, and have at least three years of teaching experience. Of the 15 participants, 13 are female
and two are male. Eight of the participants have a master’s degree and seven have a bachelor’s
degree. They come from seven different elementary schools in the XYZ Unified School District
and represent all grades from first through sixth grade. Their years of teaching experience range
from three years to forty-two years (see Table 7).
Table 7
Interview Participant Details
Participant Gender Degree
Earned Grade Years of
Experience Date
Interviewed P1 F Masters 1st 22 February 26,
2018 P2 F Masters 1st 32 March 1, 2018 P3 M Masters 6th 42 March 3, 2018 P4 F Masters 6th 16 March 5, 2018 P5 F Bachelors 2nd 32 March 5, 2018 P6 F Masters 6th 21 March 6, 2018 P7 F Bachelors 1st/2nd
combo 20 March 6, 2018
P8 F Bachelors 6th 6 March 6, 2018 P9 F Masters 1st 33 March 8, 2018 P10 F Bachelors 4th 22 March 8, 2018 P11 F Bachelors 3rd 3 March 8, 2018 P12 F Masters 5th 22 March 10, 2018 P13 F Masters 6th 10 March 11, 2018 P14 M Bachelors 4th/5th
combo 23 March 14, 2018
P15 F Bachelors 5th 10 March 18, 2018
87
Data Collection
Data collection began in mid-February of 2018 after receiving full IRB approval from
Pepperdine University on February 16, 2018. Data collection was conducted over the last two
weeks of February and through the first three weeks of March using the IRB approved
recruitment script (see Appendix D). First, the master list was created using the XYZ Unified
School District website http://www.xxxxx.org (name redacted to ensure confidentiality), and the
four criteria of inclusion were applied to ensure that the participants possessed a Multiple Subject
Teaching Credential, possessed a Crosscultural, Language and Academic Development
Certificate, had their teaching credential for five or more years, and had three years of teaching
experience. Criteria for inclusion was verified by visiting the CA Commission on Teacher
Credentialing website https://www.ctc.ca.gov and each teacher’s website. Maximum variation
was applied to guarantee a variety of participants were included. On February 18, 2018, 15
recruitment e-mails were sent. The first batch of recruitment e-mails yielded three interviews,
one response of no interest, and 11 non-responses. On February 21, 2018, a second e-mail was
sent to the 11 non-responders, which yielded six interviews. The master list was revisited and on
February 25, 2018, 20 new recruitment e-mails were sent, which yielded six interviews. The
interviewer applied the exclusion criteria by ensuring that the participants were available during
the last half of February and first half of March for interviews and that they were willing to be
audio-recorded. A total of 46 interview requests were sent during a two-week time period
yielding a total of 15 interviews.
Once a participant agreed to an interview, the informed consent form (see Appendix C)
and interview questions (see Table 6) were e-mailed. All interview participants were provided
with the opportunity to ask questions prior to signing the consent form. A total of one hour was
88
requested to conduct the interview; however, none of the interviews lasted the full hour. The
interviews ranged in duration from 18 minutes to 54 minutes. Fourteen interviews were
conducted in-person and one interview was conducted via telephone. Saturation was reached in
data collection at interviews 11 and 12. All interviews were audio-recorded after obtaining the
consent form from the participants. The participants were ensured confidentiality.
Data Analysis
Data analysis began by the researcher listening to each audio recording and transcribing
the recordings into Word documents. As the transcriptions were complete, the researcher read
through the transcripts twice making notes in the margins and highlighting key words, phrases,
viewpoints. The researcher developed a spreadsheet organized by question number for all
responses. The responses for each question were coded and added to the spreadsheet by question
and participant number. The codes were then analyzed to derive common themes. Theme
names were developed by utilizing verbiage included in the transcripts. The next step in the data
analysis process was utilizing the inter-rater review process to ensure reliability and external
validity.
Inter-Rater Review Process
Once the researcher coded the first three interviews, she shared the transcripts and
spreadsheet of coding results with two peer reviewers. The peer reviewers were fellow doctoral
students in the Organizational Leadership program at Pepperdine University and have training in
qualitative research methods and data analysis. The reviewers reviewed the transcripts and
supported the initial results of interview questions one and three. They recommended
modifications of combining themes for question two. The panel was in consensus for the
recommended modifications. The specific edits can be seen in Table 8. After the remaining 12
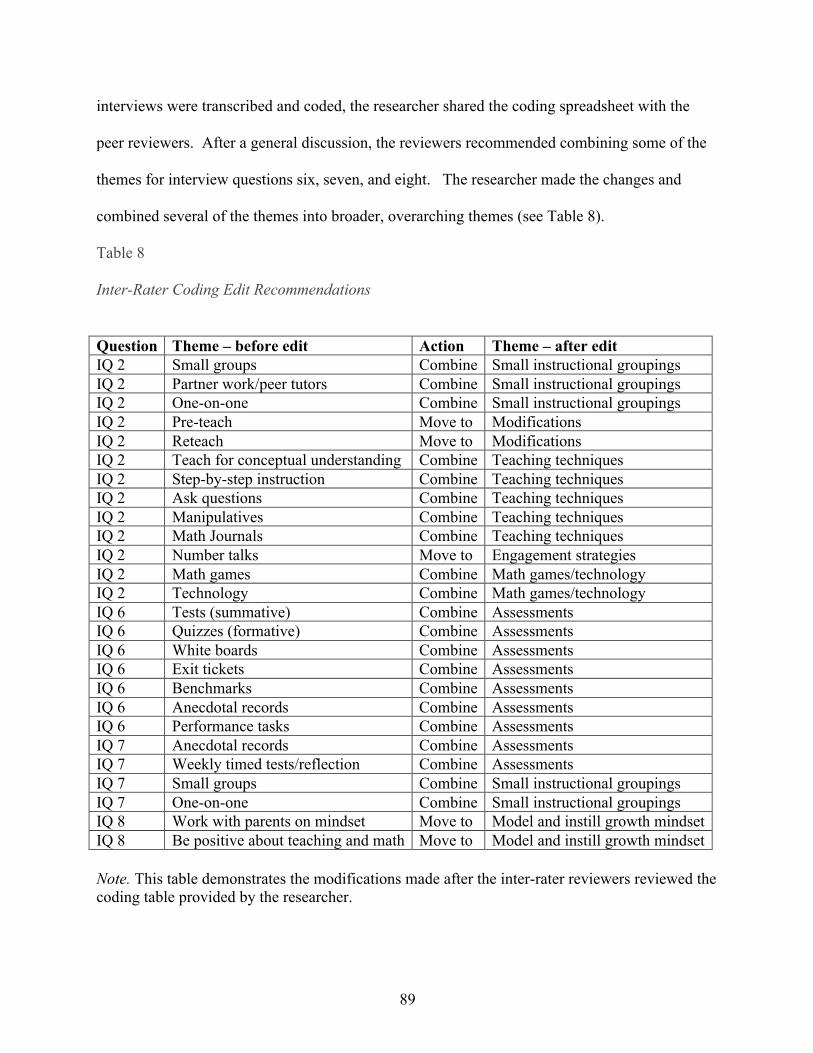
89
interviews were transcribed and coded, the researcher shared the coding spreadsheet with the
peer reviewers. After a general discussion, the reviewers recommended combining some of the
themes for interview questions six, seven, and eight. The researcher made the changes and
combined several of the themes into broader, overarching themes (see Table 8).
Table 8
Inter-Rater Coding Edit Recommendations
Question Theme – before edit Action Theme – after edit IQ 2 Small groups Combine Small instructional groupings IQ 2 Partner work/peer tutors Combine Small instructional groupings IQ 2 One-on-one Combine Small instructional groupings IQ 2 Pre-teach Move to Modifications IQ 2 Reteach Move to Modifications IQ 2 Teach for conceptual understanding Combine Teaching techniques IQ 2 Step-by-step instruction Combine Teaching techniques IQ 2 Ask questions Combine Teaching techniques IQ 2 Manipulatives Combine Teaching techniques IQ 2 Math Journals Combine Teaching techniques IQ 2 Number talks Move to Engagement strategies IQ 2 Math games Combine Math games/technology IQ 2 Technology Combine Math games/technology IQ 6 Tests (summative) Combine Assessments IQ 6 Quizzes (formative) Combine Assessments IQ 6 White boards Combine Assessments IQ 6 Exit tickets Combine Assessments IQ 6 Benchmarks Combine Assessments IQ 6 Anecdotal records Combine Assessments IQ 6 Performance tasks Combine Assessments IQ 7 Anecdotal records Combine Assessments IQ 7 Weekly timed tests/reflection Combine Assessments IQ 7 Small groups Combine Small instructional groupings IQ 7 One-on-one Combine Small instructional groupings IQ 8 Work with parents on mindset Move to Model and instill growth mindset IQ 8 Be positive about teaching and math Move to Model and instill growth mindset Note. This table demonstrates the modifications made after the inter-rater reviewers reviewed the coding table provided by the researcher.
90
Data Display
Data are presented and organized in this chapter by research question and corresponding
interview questions. Key words, phrases, viewpoints, and responses were coded and sorted into
common themes for each interview question. A description of each theme is provided and
corroborated with a participant quote from at least one participant in the transcribed data. To
preserve the integrity of the data, phrases and responses are reported verbatim and may include
incomplete sentences. Every attempt was made to ensure that the participants’ intent is clearly
communicated and interpreted. Participant quotes are reported using labels corresponding to
their interview order. For example, the first interviewee is Participant 1 and is labeled P1, the
second interviewee is Participant 2 and is labeled P2, and so on through Participant 15.
Research Question One
Research question one asked, “What strategies and practices do teachers employ to
reduce math anxiety?” A total of two interview questions were asked to the participants to
provide an answer to research question number one. The two interview questions relating to
research question one are as follows:
IQ 1. How do you detect math anxiety in a student?
IQ 2. What strategies do you use to reduce math anxiety in your students?
The responses from all participants were coded and analyzed for common themes that informed
the overall response to research question one.
Interview question one. “How do you detect math anxiety in a student?” Through the
analysis of all responses to interview question one, a total of 45 key words, phrases, or
viewpoints were identified as ways to detect math anxiety in a student. The eight common
themes that emerged are as follows: (a) shuts down, (b) avoidance, (c) facial expressions, (d)
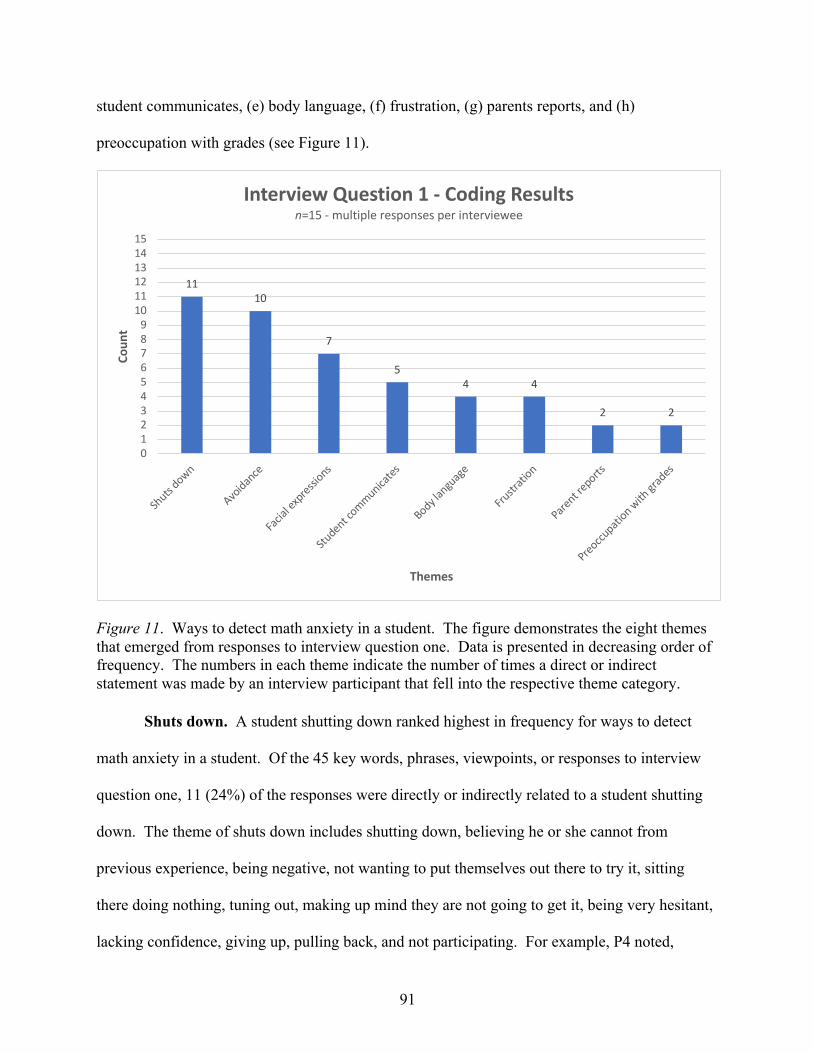
91
student communicates, (e) body language, (f) frustration, (g) parents reports, and (h)
preoccupation with grades (see Figure 11).
Figure 11. Ways to detect math anxiety in a student. The figure demonstrates the eight themes that emerged from responses to interview question one. Data is presented in decreasing order of frequency. The numbers in each theme indicate the number of times a direct or indirect statement was made by an interview participant that fell into the respective theme category.
Shuts down. A student shutting down ranked highest in frequency for ways to detect
math anxiety in a student. Of the 45 key words, phrases, viewpoints, or responses to interview
question one, 11 (24%) of the responses were directly or indirectly related to a student shutting
down. The theme of shuts down includes shutting down, believing he or she cannot from
previous experience, being negative, not wanting to put themselves out there to try it, sitting
there doing nothing, tuning out, making up mind they are not going to get it, being very hesitant,
lacking confidence, giving up, pulling back, and not participating. For example, P4 noted,
1110
7
54 4
2 2
0123456789
101112131415
Shuts
down
Avoidan
ce
Facia
l exp
ressions
Student c
ommunicates
Body lan
guag
e
Frustr
ation
Parent r
eports
Preoccupati
on with
grad
es
Coun
t
Themes
Interview Question 1 - Coding Resultsn=15 - multiple responses per interviewee
92
“Well, I teach sixth graders, so a lot of times, they shut down and nothing happens, so I feel like
that’s when I, you know, there’s an alert there” (P4).
Avoidance. Avoidance ranked second highest in frequency for ways to detect math
anxiety in a student. Of the 45 key words, phrases, viewpoints, or responses to interview
question one, ten (22%) of the responses were directly or indirectly related to avoidance. The
theme of avoidance includes a student vegging out, avoiding the task, having a hard time getting
started, looking at a neighbor, asking to use the restroom, asking to go to the health office, taking
the trash out, asking for a drink, wanting to return a library book, missing math book, looking
down to avoid eye contact, and being off task. For example, P12 explained,
Well, the way I detect it in my students, the first sign is always just avoidance. I
need to go the bathroom. Can I get a drink? I can’t find my math book. My
stomach hurts. Oh, I need to return the library book. Um, they’ll be sitting there
and be completely off task. It’s just usually complete avoidance, but also,
sometimes I’ve seen as much but the kid will just sit there, or the kid will put
anything on their paper because they just don’t - they don’t want to deal with it at
all. (P12)
Facial expressions. Facial expressions ranked third highest in frequency for ways to
detect math anxiety in a student. Of the 45 key words, phrases, viewpoints, or responses to
interview question one, seven (16%) of the responses were directly or indirectly related to facial
expressions. The theme of facial expressions includes a puzzled look on face, startled look,
halted expression, pained or strained look, confused look, and blank stares. For example, P10
commented, “Sometimes they might have kind of like a deer in headlights look on their face or
kind of a strained or pained look on their face like I can’t do this” (P10).
93
Student communicates. Student communicates ranked fourth highest in frequency for
ways to detect math anxiety in a student. Of the 45 key words, phrases, viewpoints, or responses
to interview question one, five (11%) of the responses were directly or indirectly related to
student communicates. The theme of student communicates includes a student sighing, telling
the teacher, verbalizing they are nervous, saying “I don’t get this,” and saying, “I can’t do
this.” For example, P7 expressed, “But I had a little girl who just a couple of years ago, just
bursting out and she would, you know, be a little verbal and actually know that this is making me
nervous, you know” (P7).
Body language. Body language ranked fifth highest in frequency for ways to detect
math anxiety in a student. Of the 45 key words, phrases, viewpoints, or responses to interview
question one, four (9%) of the responses were directly or indirectly related to body
language. The theme of body language includes shaking, rubbing temples, holding head in
hands, and tapping legs. For example, P11 described, “I think if one of my particular students
who is tapping her legs or like shaking - like her shoulders are moving so that’s one indicator”
(P11).
Frustration. Frustration also ranked fifth highest in frequency for ways to detect math
anxiety in a student. Of the 45 key words, phrases, viewpoints, or responses to interview
question one, four (9%) of the responses were directly or indirectly related to frustration. The
theme of frustration includes frustration and crying. For example, P7 shared, “I do think it’s, you
know, the frustration or just the...I mean I do have a tear sometimes in second grade and first
grade just with new concepts or not understanding something” (P7).
Parent reports. Parent reports ranked lowest in frequency for ways to detect math
anxiety in a student. Of the 45 key words, phrases, viewpoints, or responses to interview
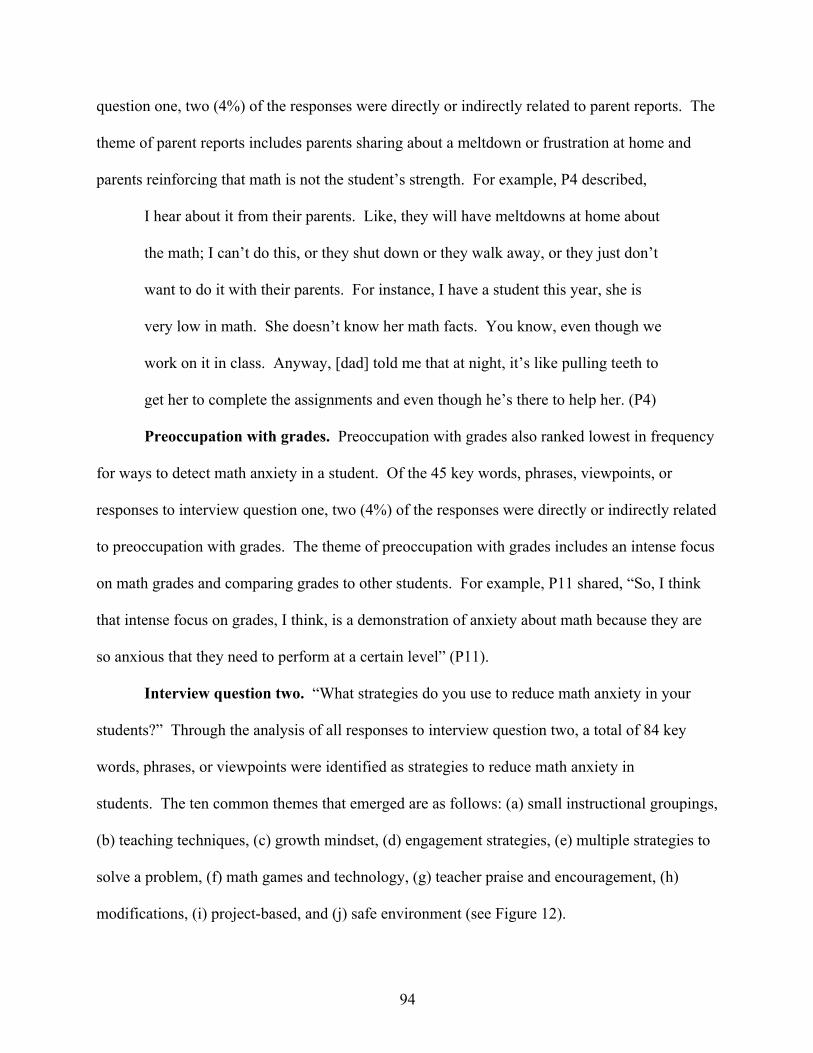
94
question one, two (4%) of the responses were directly or indirectly related to parent reports. The
theme of parent reports includes parents sharing about a meltdown or frustration at home and
parents reinforcing that math is not the student’s strength. For example, P4 described,
I hear about it from their parents. Like, they will have meltdowns at home about
the math; I can’t do this, or they shut down or they walk away, or they just don’t
want to do it with their parents. For instance, I have a student this year, she is
very low in math. She doesn’t know her math facts. You know, even though we
work on it in class. Anyway, [dad] told me that at night, it’s like pulling teeth to
get her to complete the assignments and even though he’s there to help her. (P4)
Preoccupation with grades. Preoccupation with grades also ranked lowest in frequency
for ways to detect math anxiety in a student. Of the 45 key words, phrases, viewpoints, or
responses to interview question one, two (4%) of the responses were directly or indirectly related
to preoccupation with grades. The theme of preoccupation with grades includes an intense focus
on math grades and comparing grades to other students. For example, P11 shared, “So, I think
that intense focus on grades, I think, is a demonstration of anxiety about math because they are
so anxious that they need to perform at a certain level” (P11).
Interview question two. “What strategies do you use to reduce math anxiety in your
students?” Through the analysis of all responses to interview question two, a total of 84 key
words, phrases, or viewpoints were identified as strategies to reduce math anxiety in
students. The ten common themes that emerged are as follows: (a) small instructional groupings,
(b) teaching techniques, (c) growth mindset, (d) engagement strategies, (e) multiple strategies to
solve a problem, (f) math games and technology, (g) teacher praise and encouragement, (h)
modifications, (i) project-based, and (j) safe environment (see Figure 12).
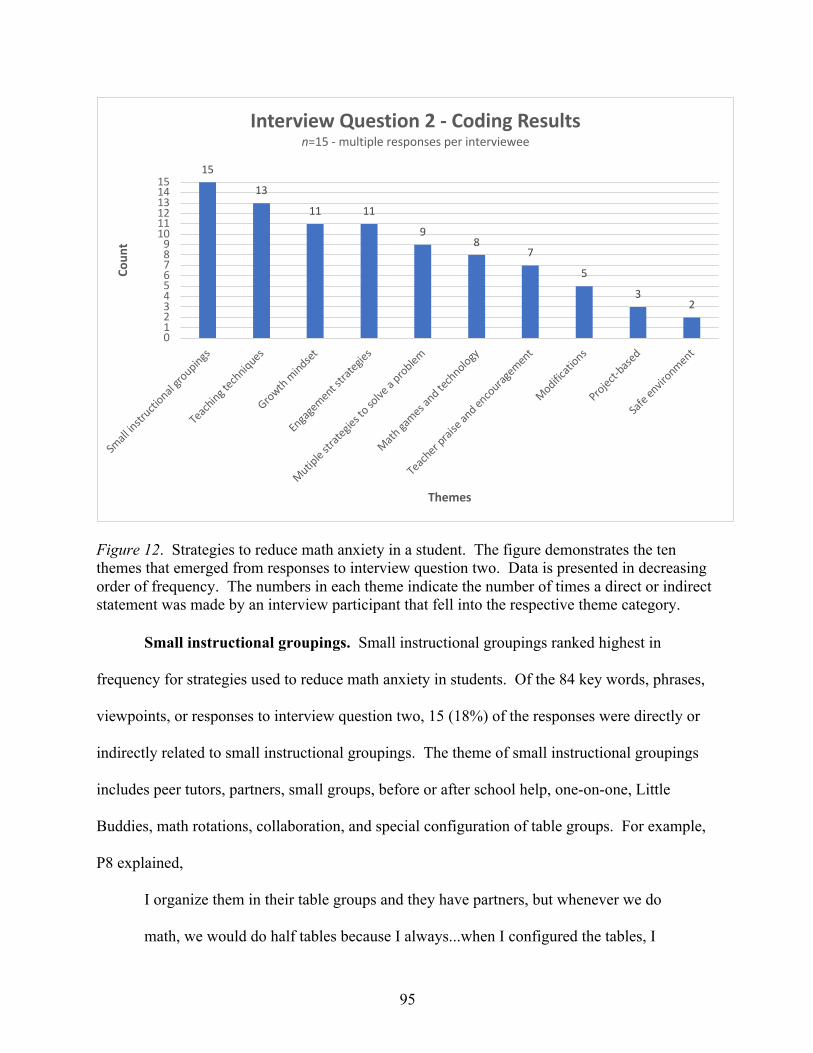
95
Figure 12. Strategies to reduce math anxiety in a student. The figure demonstrates the ten themes that emerged from responses to interview question two. Data is presented in decreasing order of frequency. The numbers in each theme indicate the number of times a direct or indirect statement was made by an interview participant that fell into the respective theme category.
Small instructional groupings. Small instructional groupings ranked highest in
frequency for strategies used to reduce math anxiety in students. Of the 84 key words, phrases,
viewpoints, or responses to interview question two, 15 (18%) of the responses were directly or
indirectly related to small instructional groupings. The theme of small instructional groupings
includes peer tutors, partners, small groups, before or after school help, one-on-one, Little
Buddies, math rotations, collaboration, and special configuration of table groups. For example,
P8 explained,
I organize them in their table groups and they have partners, but whenever we do
math, we would do half tables because I always...when I configured the tables, I
15
13
11 11
98
7
5
32
0123456789
101112131415
Small
instr
uctional
groupings
Teac
hing tech
niques
Growth mindset
Enga
gement s
trategie
s
Mutiple st
rategie
s to so
lve a
problem
Math ga
mes and te
chnology
Teac
her prai
se an
d enco
uragemen
t
Modificati
ons
Project-base
d
Safe
envir
onment
Coun
t
Themes
Interview Question 2 - Coding Resultsn=15 - multiple responses per interviewee
96
look at the math students, the type of math students, when I configure the table
groups. So, I usually have a high, a high medium, and a medium and a low so
they’re always able to help one another. I talked to the kids about, you know
what? I put you in these groups because some of you have strengths and
weaknesses and we bounce ideas off of each other and that’s how we learn. (P8)
Teaching techniques. Teaching techniques ranked second highest in frequency for
strategies used to reduce math anxiety in students. Of the 84 key words, phrases, viewpoints, or
responses to interview question two, 13 (15%) of the responses were directly or indirectly related
to teaching techniques. The theme of teaching techniques includes multiple explanations,
manipulatives, step-by-step instruction, challenge questions, math journals, interactive
notebooks, conceptual understanding, metacognition, and real-life problem solving. For
example, P2 said, “So, one of the things, I just think explaining things as many different ways as
you can. We use a lot of manipulatives in first grade and our program has a lot of manipulatives
that came with it” (P2).
Growth mindset. Growth mindset ranked third highest in frequency for strategies used
to reduce math anxiety in students. Of the 84 key words, phrases, viewpoints, or responses to
interview question two, 11 (13%) of the responses were directly or indirectly related to growth
mindset. The theme of growth mindset includes the message to keep trying, make mistakes,
focus on Carol Dweck and Jo Boaler’s growth mindset, ask for help, have a growth mindset
bulletin board, memorize a growth mindset quote of the week, see teachers make mistakes, grow
your brain with mistakes, persevere, reward effort, and understand brain blocks. For example, P1
shared,
97
My main thing is for them to be able to say that they are struggling and to maybe
not do things exactly perfect or correct so that they’ll still try, that they’ll still
keep trying. And my mantra right now this year is, ‘What’s first grade for? First
grade’s for making mistakes!’ (P1)
Engagement strategies. Engagement strategies also ranked third highest in frequency
for strategies used to reduce math anxiety in students. Of the 84 key words, phrases, viewpoints,
or responses to interview question two, 11 (13%) of the responses were directly or indirectly
related to engagement strategies. The theme of engagement strategies includes number tricks,
whiteboards, number talks, Factwise, dot cards, foldables, thumbs up/thumbs down, finger
raising, and brain breaks. For example, P14 explained,
You know a big thing with math is engagement - you know, engagement
strategies. That’s kind of the, actually with all of the subjects now, all of the kids
are engaged. It’s not so much standing up and asking a question and kids are
raising their hands, but you know we’re doing a lot with whiteboards and things,
so, you know, everybody is holding up their whiteboard. (P14)
Multiple strategies to solve a problem. Multiple strategies to solve a problem ranked
fourth highest in frequency for strategies used to reduce math anxiety in students. Of the 84 key
words, phrases, viewpoints, or responses to interview question two, nine (11%) of the responses
were directly or indirectly related to multiple strategies to solve a problem. The theme of
multiple strategies to solve a problem includes multiple problem-solving strategies, drawing
pictures to illustrate problems, cognitively-guided instruction, math task cards, open-ended
problems, highlighting key words in problems, mental math strategies, number pictures, and
incorporating math in spare daily moments. For example, P3 explained, “Teach numerous
98
strategies to solve problems. You can show your students how to use the distributive property to
break up numbers and help with mental math” (P3).
Math games and technology. Math games and technology ranked fifth highest in
frequency for strategies used to reduce math anxiety in students. Of the 84 key words, phrases,
viewpoints, or responses to interview question two, eight (10%) of the responses were directly or
indirectly related to math games and technology. The theme of math games and technology
includes videos, Khan Academy, Aleks, technology, online tools, math games, make math fun,
and math homework games. For example, P9 stated, “I’ve read research that says that the games
for math are actually highly effective and far more so than just paper/pencil” (P9).
Teacher praise and encouragement. Teacher praise and encouragement ranked sixth
highest in frequency for strategies used to reduce math anxiety in students. Of the 84 key words,
phrases, viewpoints, or responses to interview question two, seven (8%) of the responses were
directly or indirectly related to teacher praise and encouragement. The theme of teacher praise
and encouragement includes reassure students, help students experience success, play a little bit,
be excited, be patient, praise effort, give pep talks, know our students, and focus on the
teacher/student relationship. For example, P14 said, “I give a lot of pep talks, you know” (P14).
Modifications. Modifications ranked seventh highest in frequency for strategies used to
reduce math anxiety in students. Of the 84 key words, phrases, viewpoints, or responses to
interview question two, five (6%) of the responses were directly or indirectly related to
modifications. The theme of modifications includes backing up students to a previous familiar
concept, providing additional time, modifying assignments, introducing concepts early, having
students practice basic skills every day, flipping the classroom, and front loading of
information. For example, P13 explained,
99
I try to go back to the beginning and where did this start and I truly believe your
basic skills, your adding, subtracting, multiplying, dividing is a key defining
moment, that if they’re struggling with that, no wonder they’re struggling with
number sense, no wonder they’re struggling with ratios because they don’t really
understand the numbers. So, I force my kids to do basic skills they’re supposed to
do every day and they have a computerized program. (P13)
Project-based. Project-based ranked eighth highest in frequency for strategies used to
reduce math anxiety in students. Of the 84 key words, phrases, viewpoints, or responses to
interview question two, three (4%) of the responses were directly or indirectly related to project-
based. The theme of project-based includes project-based assignments, investigations, real life
math experiences, hands-on activities, and cooking. For example, P6 shared,
I feel project-based, embedding the math into something that they can relate
to. So, one year for Willy Wonka, using scale and drawings and math, you know,
measurements, we came up with scenery for our play so it’s like being able to
embed the math into their everyday experiences and what they can use. (P6)
Safe environment. Safe environment ranked lowest in frequency for strategies used to
reduce math anxiety in students. Of the 84 key words, phrases, viewpoints, or responses to
interview question two, two (2%) of the responses were directly or indirectly related to safe
environment. The theme of safe environment includes safe environment and privacy
folders. For example, P1 said, “My main thing is trying to make it a safe environment for them”
(P1).
Summary of research question one. Research question one sought to identify the
strategies and practices teachers employ to reduce math anxiety. A total of 18 themes were
100
identified by analyzing key words, phrases, viewpoints, or responses to the two interview
questions. Eight of the themes informed how teachers detect math anxiety: shuts down,
avoidance, facial expressions, body language, student communicates, frustration, parent reports,
and preoccupation with grades. Ten of the themes identified strategies that teacher employ:
small instructional groupings, growth mindset, teaching techniques, multiple strategies to solve a
problem, engagement strategies, teacher praise and encouragement, math games and technology,
modifications, project-based, and safe environment.
Research Question Two
Research question two asked, “What challenges do teachers face in reducing math
anxiety?” A total of two interview questions were asked to the participants to provide an answer
to research question number two. The two interview questions relating to research question two
are as follows:
IQ 3. In implementing the strategies mentioned in IQ 2, what challenges do you face in
teaching students with math anxiety?
IQ 4. What other challenges have you faced regarding math anxiety?
The responses from all participants were coded and analyzed for common themes that informed
the overall response to research question two.
Interview question three. “In implementing the strategies mentioned in IQ 2, what
challenges do you face in teaching students with math anxiety?” Through the analysis of all
responses to interview question three, a total of 23 key words, phrases, or viewpoints were
identified as challenges faced in teaching students with math anxiety. The eight common themes
that emerged are as follows: (a) student mindset, (b) differentiation, (c) time, (d) exhausted
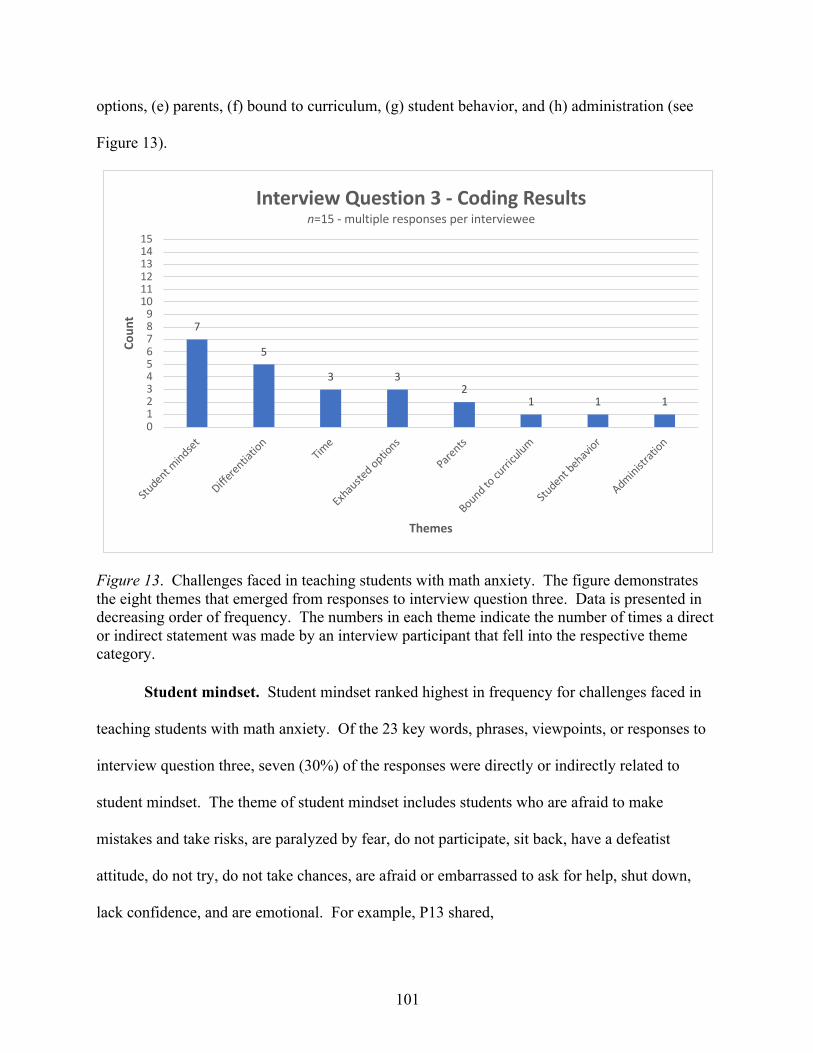
101
options, (e) parents, (f) bound to curriculum, (g) student behavior, and (h) administration (see
Figure 13).
Figure 13. Challenges faced in teaching students with math anxiety. The figure demonstrates the eight themes that emerged from responses to interview question three. Data is presented in decreasing order of frequency. The numbers in each theme indicate the number of times a direct or indirect statement was made by an interview participant that fell into the respective theme category.
Student mindset. Student mindset ranked highest in frequency for challenges faced in
teaching students with math anxiety. Of the 23 key words, phrases, viewpoints, or responses to
interview question three, seven (30%) of the responses were directly or indirectly related to
student mindset. The theme of student mindset includes students who are afraid to make
mistakes and take risks, are paralyzed by fear, do not participate, sit back, have a defeatist
attitude, do not try, do not take chances, are afraid or embarrassed to ask for help, shut down,
lack confidence, and are emotional. For example, P13 shared,
7
5
3 32
1 1 1
0123456789
101112131415
Student m
indset
Differentia
tion
Time
Exhau
sted optio
ns
Parents
Bound to cu
rricu
lum
Student b
ehavior
Administrat
ion
Coun
t
Themes
Interview Question 3 - Coding Resultsn=15 - multiple responses per interviewee
102
One of them is the whole mindset. I’m just not good in math. My family is not
good in math. Um, the whole mentality of, again if I say I’m - if I’m gonna fail so
I’m not gonna bother to try because it’s gonna’ hurt worse if I’m trying and I fail
than if I just say I give up. So, one of the biggest problems is the kids that refuse,
and they just won't even try. (P13)
Differentiation. Differentiation ranked second highest in frequency for challenges faced
in teaching students with math anxiety. Of the 23 key words, phrases, viewpoints, or responses
to interview question three, five (22%) of the responses were directly or indirectly related to
differentiation. The theme of differentiation includes different abilities and levels, little
knowledge of math facts, differentiating instruction. For example, P12 expressed,
I think the biggest challenge is, um, especially with any of those strategies is the
differentiation within your classroom. You’ve got kids at different levels and
when you’re trying to use those strategies and meet kids where they are so that
they can always be successful. (P12)
Time. Time ranked third highest in frequency for challenges faced in teaching students
with math anxiety. Of the 23 key words, phrases, viewpoints, or responses to interview question
three, three (13%) of the responses were directly or indirectly related to time. The theme of time
includes not enough time, hard to fit everything in, and finding time for one-on-one help. For
example, P9 explained,
Time. Not enough. I mean really, that’s it. I’ve been feeling guilty because I feel
like I should, you know, bring some kids in and tutor them in the mornings, you
know, before school. But, you know, it is, it’s the time. (P9)
103
Exhausted options. Exhausted options also ranked third highest in frequency for
challenges faced in teaching students with math anxiety. Of the 23 key words, phrases,
viewpoints, or responses to interview question three, three (13%) of the responses were directly
or indirectly related to exhausted options. The theme of exhausted options includes still not
getting it even with small groups, when you’ve explained it every way possible, and unable to
motivate student. For example, P10 said, “And you explain it all the ways that you think you can
explain it and they’re still not getting it” (P10).
Parents. Parents ranked fourth highest in frequency for challenges faced in teaching
students with math anxiety. Of the 23 key words, phrases, viewpoints, or responses to interview
question three, two (9%) of the responses were directly or indirectly related to parents. The
theme of parents includes parents hyper-focused on test score, parents with a fixed mindset, and
parents not supporting children with homework or staying after school. For example, P11
indicated, “So I think that if the parents of my students don’t understand growth mindset, it’s
really hard for me to communicate that to them” (P11).
Bound to curriculum. Bound to curriculum ranked lowest in frequency for challenges
faced in teaching students with math anxiety. Of the 23 key words, phrases, viewpoints, or
responses to interview question three, one (4%) of the responses was directly or indirectly related
to bound to curriculum. The theme of bound to curriculum includes curriculum, district fluency
tests, and not much freedom. For example, P7 noted, “I think that sometimes because we are
kind of bound to the curriculum and so we do have to teach it, you know they - they basically
have to learn it all and they have to perform and there are benchmarks” (P7).
Student behavior. Student behavior also ranked lowest in frequency for challenges
faced in teaching students with math anxiety. Of the 23 key words, phrases, viewpoints, or
104
responses to interview question three, one (4%) of the responses was directly or indirectly related
to student behavior. The theme of student behavior includes establishing procedures,
expectations, and boundaries. For example, P6 noted, “You know, moving around the
classroom, you encounter challenges with certain students. So, you know it’s just more the
management and showing them” (P6).
Administration. Administration also ranked lowest in frequency for challenges faced in
teaching students with math anxiety. Of the 23 key words, phrases, viewpoints, or responses to
interview question three, one (4%) of the responses was directly or indirectly related to
administration. The theme of administration includes arrangement of classes. For example, P13
stated,
And then another one, I think, is follow through as far as, you know, I hate to say
it, but administration within the school, trying to provide the time and trying to
put the kids in some sort of assisted class. (P13)
Interview question four. “What other challenges have you faced regarding math
anxiety?” Through the analysis of all responses to interview question four, a total of 16 key
words, phrases, or viewpoints were identified as other challenges teachers face regarding math
anxiety. The eight common themes that emerged are as follows: (a) differentiation, (b)
unrealistic standards, (c) student mindset, (d) parents, (e) student behavior, (f) teachers being
open-minded, (g) alternative assessments, and (h) time. Five of the themes also emerged in
interview question three: differentiation, student mindset, student behavior, parents, and time
(see Figure 14).
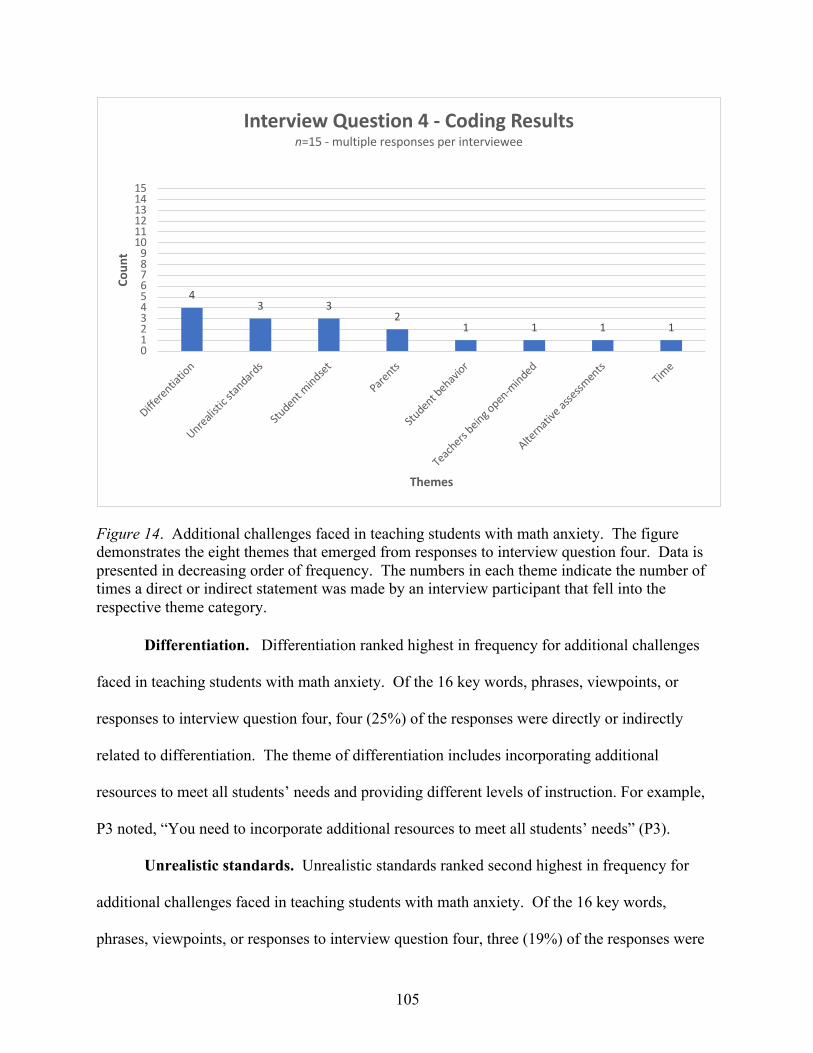
105
Figure 14. Additional challenges faced in teaching students with math anxiety. The figure demonstrates the eight themes that emerged from responses to interview question four. Data is presented in decreasing order of frequency. The numbers in each theme indicate the number of times a direct or indirect statement was made by an interview participant that fell into the respective theme category.
Differentiation. Differentiation ranked highest in frequency for additional challenges
faced in teaching students with math anxiety. Of the 16 key words, phrases, viewpoints, or
responses to interview question four, four (25%) of the responses were directly or indirectly
related to differentiation. The theme of differentiation includes incorporating additional
resources to meet all students’ needs and providing different levels of instruction. For example,
P3 noted, “You need to incorporate additional resources to meet all students’ needs” (P3).
Unrealistic standards. Unrealistic standards ranked second highest in frequency for
additional challenges faced in teaching students with math anxiety. Of the 16 key words,
phrases, viewpoints, or responses to interview question four, three (19%) of the responses were
43 3
21 1 1 1
0123456789
101112131415
Differentia
tion
Unrealisti
c stan
dards
Student m
indset
Parents
Student b
ehavior
Teac
hers being o
pen-m
inded
Alternati
ve as
sessm
ents
Time
Coun
t
Themes
Interview Question 4 - Coding Resultsn=15 - multiple responses per interviewee
106
directly or indirectly related to unrealistic standards. The theme of unrealistic standards includes
standards moving to earlier grades and expectations to teach certain standards by grade
level. For example, P9 shared,
I remember probably about 15 years ago Marilyn Burns came out with an
assessment, and she said that it was appropriate for fourth grade and above, where
she said to write the number 18 and then have 18 objects. Ask the child to count
the 18 objects and point out the ones place and say, ‘What does this number
represent?’ So, of course they, you know, count the eight and put them forward.
And then you point to the tens and say, ‘Show me what this number represents,’
and, you know, children that understand value will say, ‘The remaining.’ The
remaining objects are ten. But most, you know, kids that don’t understand would
just pull the one. She said that was appropriate developmentally when they were
about nine. And now, first graders are being expected to understand place value
and demonstrate their understanding, not just memorize. (P9)
Student mindset. Student mindset also ranked second highest in frequency for
additional challenges faced in teaching students with math anxiety. Of the 16 key words,
phrases, viewpoints, or responses to interview question four, three (19%) of the responses were
directly or indirectly related to student mindset. The theme of student mindset includes not
asking for help, shutting down, and lacking confidence. For example, P5 noted, “I think just
having them sort of shut down or be frustrated or just be unwilling to try” (P5).
Parents. Parents ranked third highest in frequency for additional challenges faced in
teaching students with math anxiety. Of the 16 key words, phrases, viewpoints, or responses to
interview question four, two (13%) of the responses were directly or indirectly related to
107
parents. The theme of parents includes math anxiety continuing at home if parents have math
anxiety and parents saying they are not good at math. For example, P8 explained, “Some of that
math anxiety comes from when they go home, the parents have that math anxiety” (P8).
Student behavior. Student behavior ranked lowest in frequency for additional
challenges faced in teaching students with math anxiety. Of the 16 key words, phrases,
viewpoints, or responses to interview question four, one (6%) of the responses was directly or
indirectly related to student behavior. The theme of student behavior includes behavior
disruptions and challenging behavior. For example, P2 stated, “That was one of the hardest
years of my life teaching. You can have one child like that and those behavior disruptions really
can impact. We all feel like behavior is really changing. It makes it more challenging” (P2).
Teachers being open-minded. Teachers being open-minded also ranked lowest in
frequency for additional challenges faced in teaching students with math anxiety. Of the 16 key
words, phrases, viewpoints, or responses to interview question four, one (6%) of the responses
was directly or indirectly related to teachers being open-minded. The theme of teachers being
open-minded includes teacher attitude and instructional strategies used. For example, P12
shared,
Some teachers still think, well the kids just gotta do it, they gotta know it. This is
what they gotta do. It’s hard to get teachers to understand, no this is something
that you’ve gotta work with. This is a real issue and we need to get on top of
this. This is what’s keeping them from learning. (P12)
Alternative assessments. Alternative assessments also ranked lowest in frequency for
additional challenges faced in teaching students with math anxiety. Of the 16 key words,
phrases, viewpoints, or responses to interview question four, one (6%) of the responses was
108
directly or indirectly related to alternative assessments. The theme of alternative assessments
includes creating alternative assessments and educating colleagues and parents on the value of
alternative assessments. For example, P11 indicated,
I feel like I am tirelessly like creating exit and entrance tickets and all different
things and like the last thing I wanna do is create an alternative form of
assessment, which then I have to prove to my team is the same as the book’s
test. So, I think that is a challenge. (P11)
Time. Time also ranked lowest in frequency for additional challenges faced in teaching
students with math anxiety. Of the 16 key words, phrases, viewpoints, or responses to interview
question four, one (6%) of the responses was directly or indirectly related to time. The theme of
time includes making time to have math rotations with small groups. For example, P7 explained,
“You know, it’s hard pulling small groups and, you know, working with math rotations like we
do in language arts” (P7).
Summary of research question two. Research question two sought to identify the
challenges teachers face in reducing math anxiety. A total of 16 themes were identified by
analyzing key words, phrases, viewpoints, or responses to the two interview questions. The 16
themes are as follows: student mindset (appearing once in each question), differentiation
(appearing once in each question), time (appearing once in each question), parents (appearing
once in each question), bound to curriculum, exhausted options, student behavior (appearing
once in each question), administration, unrealistic standards, teachers being open-minded, and
alternative assessments.
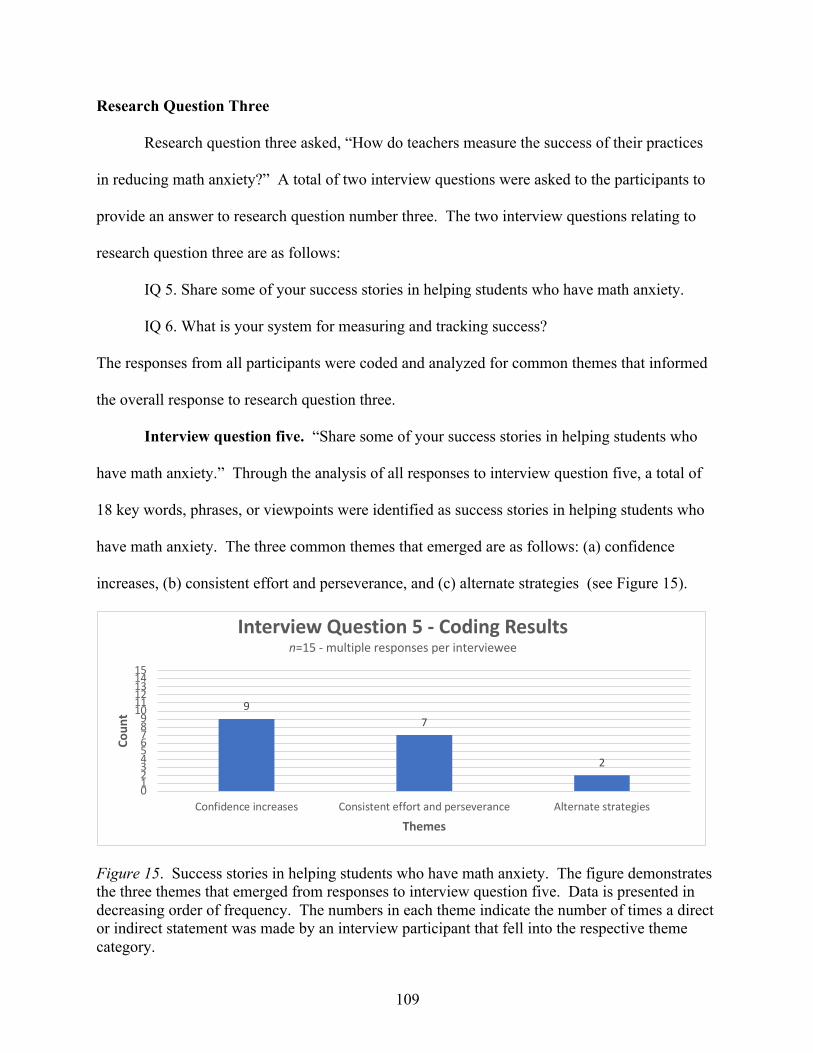
109
Research Question Three
Research question three asked, “How do teachers measure the success of their practices
in reducing math anxiety?” A total of two interview questions were asked to the participants to
provide an answer to research question number three. The two interview questions relating to
research question three are as follows:
IQ 5. Share some of your success stories in helping students who have math anxiety.
IQ 6. What is your system for measuring and tracking success?
The responses from all participants were coded and analyzed for common themes that informed
the overall response to research question three.
Interview question five. “Share some of your success stories in helping students who
have math anxiety.” Through the analysis of all responses to interview question five, a total of
18 key words, phrases, or viewpoints were identified as success stories in helping students who
have math anxiety. The three common themes that emerged are as follows: (a) confidence
increases, (b) consistent effort and perseverance, and (c) alternate strategies (see Figure 15).
Figure 15. Success stories in helping students who have math anxiety. The figure demonstrates the three themes that emerged from responses to interview question five. Data is presented in decreasing order of frequency. The numbers in each theme indicate the number of times a direct or indirect statement was made by an interview participant that fell into the respective theme category.
97
2
0123456789
101112131415
Confidence increases Consistent effort and perseverance Alternate strategies
Coun
t
Themes
Interview Question 5 - Coding Resultsn=15 - multiple responses per interviewee
110
Confidence increases. Confidence increases ranked highest in frequency for success
stories in helping students who have math anxiety. Of the 18 key words, phrases, viewpoints, or
responses to interview question five, nine (50%) of the responses were directly or indirectly
related to confidence increases. The theme of confidence increases includes students leading
their group, modeling a problem in front of the class, sharing their group’s solution with the
class, asking questions, having the light bulb go off, and participating. For example, P1,
enthusiastically shared,
This was great last year. I had three students at the beginning of the year who just
weren’t getting it and half the time they were crying in math. I worked with them
in a small group and tried to eliminate the anxiety by pretending that I didn’t
know what I was doing. ‘What do we do? How do we do this together?’ Over
time, they were starting to lead the group. I was like, and I was like so surprised
and blown away because I was depending on this other student to lead the group
and this other student asked them, ‘Well, do you want to take over today and we
can discuss this together. And you can be the one who describes to the class what
we’re doing.’ They were able to do it. I was like, ‘Oh, my goodness!’ That part
was all working out. They were able to not feel stressed, stand up in front of the
class and describe what their group came up with as far as what the lesson was
going to be about. And I thought, ‘Oh man, they got it. It connected! It really
connected!’ I think I had three students that struggled that did that. (P1)
Consistent effort and perseverance. Consistent effort and perseverance ranked second
highest in frequency for success stories in helping students who have math anxiety. Of the 18
key words, phrases, viewpoints, or responses to interview question five, seven (39%) of the
111
responses were directly or indirectly related to consistent effort and perseverance. The theme of
consistent effort and perseverance includes students now at grade level as a result of consistency
through games, manipulatives, partners, effort, interventions, and after school help. For
example, P9 shared,
I have this one little girls who’s in, she’s in fourth grade now and her parents are really
bright, bright, bright professionals. And, um, you know when they came to the first
conference and I said - and they’re doctors. So, I said, ‘Well I hate to tell you, but your
child’s really struggling in math.’ She had no concept of numbers. I just did all of the
strategies and by the end of the year, I mean, she was smiling. She loved math. She
wanted to do it, but it was just all of those, you know, manipulatives and never just giving
her the numeric representation. (P9)
Alternate strategies. Alternate strategies ranked lowest in frequency for success stories
in helping students who have math anxiety. Of the 18 key words, phrases, viewpoints, or
responses to interview question five, two (11%) of the responses were directly or indirectly
related to alternate strategies. The theme of alternate strategies includes showing knowledge of
fractions during a cooking activity and a student with dyscalculia using various strategies to
experience success. For example, P12 explained,
Well, one in particular I can think of, I had a little girl who’s probably in college
now and actually had math anxiety severe because she had dyscalculia. And she,
so any time she knew numbers were coming, she would have anxiety. So, we
ended up being able to get her the help she wanted, and we were able to work
with her and we found that if we could read the problems to her, she could
actually do the mental math better than she could with paper if we could break it
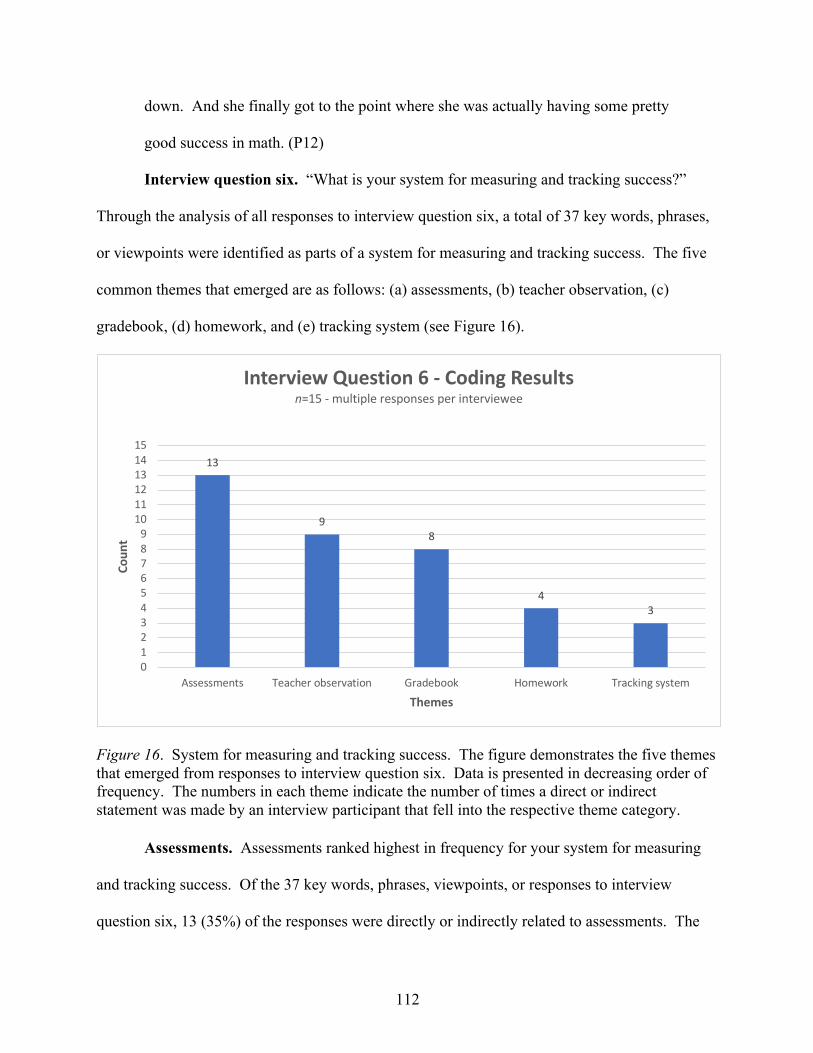
112
down. And she finally got to the point where she was actually having some pretty
good success in math. (P12)
Interview question six. “What is your system for measuring and tracking success?”
Through the analysis of all responses to interview question six, a total of 37 key words, phrases,
or viewpoints were identified as parts of a system for measuring and tracking success. The five
common themes that emerged are as follows: (a) assessments, (b) teacher observation, (c)
gradebook, (d) homework, and (e) tracking system (see Figure 16).
Figure 16. System for measuring and tracking success. The figure demonstrates the five themes that emerged from responses to interview question six. Data is presented in decreasing order of frequency. The numbers in each theme indicate the number of times a direct or indirect statement was made by an interview participant that fell into the respective theme category.
Assessments. Assessments ranked highest in frequency for your system for measuring
and tracking success. Of the 37 key words, phrases, viewpoints, or responses to interview
question six, 13 (35%) of the responses were directly or indirectly related to assessments. The
13
98
43
0123456789
101112131415
Assessments Teacher observation Gradebook Homework Tracking system
Coun
t
Themes
Interview Question 6 - Coding Resultsn=15 - multiple responses per interviewee
113
theme of assessments includes formative, summative, quizzes, tests, whiteboards, exit tickets,
benchmarks, anecdotal records, performance tasks, engagement strategies, fluency assessments,
and inventories. For example, P15 noted, “So informally would be the whiteboards. I can see
boom, boom, look if she doesn't get it. I mean I can just tell and it is from the whiteboards”
(P15).
Teacher observation. Teacher observation ranked second highest in frequency for your
system for measuring and tracking success. Of the 37 key words, phrases, viewpoints, or
responses to interview question six, nine (24%) of the responses were directly or indirectly
related to teacher observation. The theme of teacher observation includes observation, checking
on students, walking around classroom, and monitoring students. For example, P5 said, “Even in
second grade, just observing every single day and seeing where they are and just really being in
the mix. Being up and around, seeing what they’re doing” (P5).
Gradebook. Gradebook ranked third highest in frequency for your system for measuring
and tracking success. Of the 37 key words, phrases, viewpoints, or responses to interview
question six, eight (22%) of the responses were directly or indirectly related to gradebook. The
theme of gradebook includes grades and gradebook. For example, P13 indicated, “I keep my
gradebook up daily” (P13).
Homework. Homework ranked fourth highest in frequency for your system for
measuring and tracking success. Of the 37 key words, phrases, viewpoints, or responses to
interview question six, four (11%) of the responses were directly or indirectly related to
homework. The theme of homework includes nightly homework, correcting daily work, and
importance of effort on daily work. For example, P14 shared,
114
Now it’s safe. Kids are allowed to mess up in here. The daily assignments that they’re
doing in here, it’s not a grade to me. You know, that’s practice. Even I grade effort. I
don’t really let them know this - that it’s really credit/no credit. (P14)
Tracking system. Tracking system ranked lowest in frequency for your system for
measuring and tracking success. Of the 37 key words, phrases, viewpoints, or responses to
interview question six, three (8%) of the responses were directly or indirectly related to tracking
system. The theme of tracking system includes spreadsheets to track each student, students track
exit tickets based on standards, and bulletin board keeping track of progress. For example, P6
noted, “I use different measurement tools that you know track what they’re doing and then I do a
lot of spreadsheets so that I can see” (P6).
Summary of research question three. Research question three sought to identify how
teachers measure the success of their practices in reducing math anxiety. A total of two
interview questions were used to inform research question three. A total of eight themes were
identified by analyzing key words, phrases, viewpoints, or responses to the two interview
questions. The eight themes are as follows: confidence increases, consistent effort and
perseverance, alternate strategies, assessments, teacher observation, gradebook, tracking system,
and homework.
Research Question Four
Research question four asked, “What recommendations would teachers make for future
implementation of strategies in reducing math anxiety?” A total of two interview questions were
asked to the participants to provide an answer to research question number four. The two
interview questions relating to research question four are as follows:
IQ 7. How do you keep track of your success with students who have math anxiety?
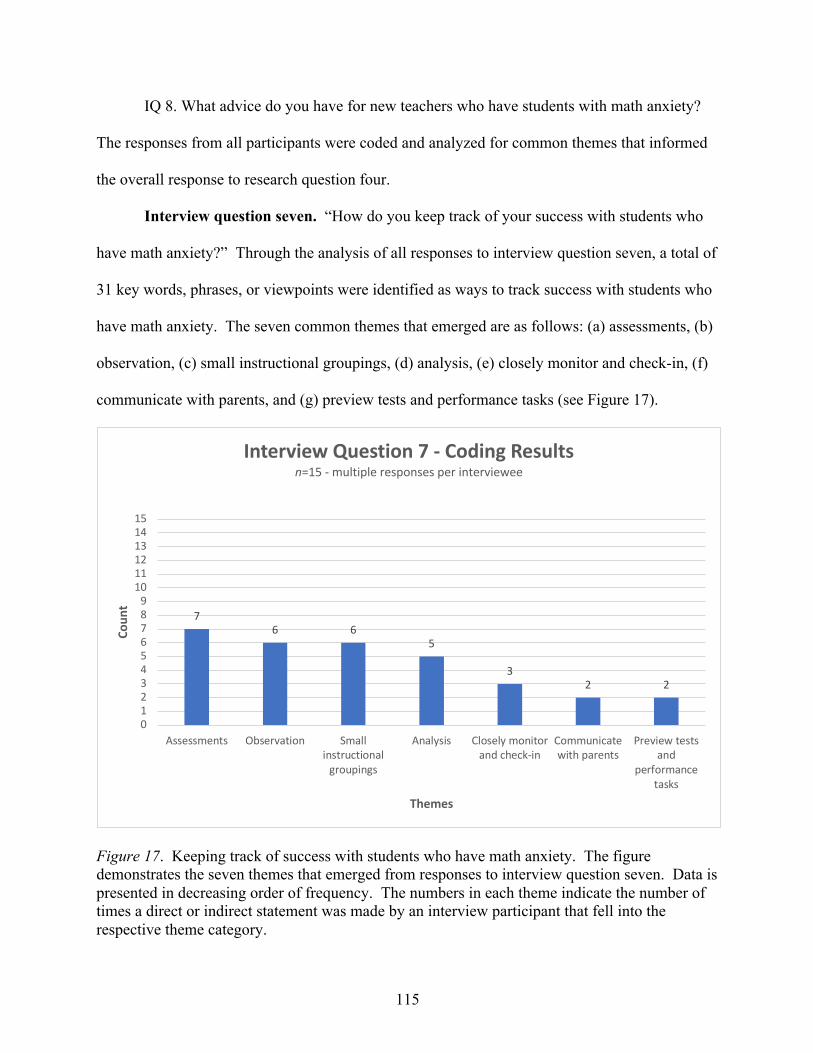
115
IQ 8. What advice do you have for new teachers who have students with math anxiety?
The responses from all participants were coded and analyzed for common themes that informed
the overall response to research question four.
Interview question seven. “How do you keep track of your success with students who
have math anxiety?” Through the analysis of all responses to interview question seven, a total of
31 key words, phrases, or viewpoints were identified as ways to track success with students who
have math anxiety. The seven common themes that emerged are as follows: (a) assessments, (b)
observation, (c) small instructional groupings, (d) analysis, (e) closely monitor and check-in, (f)
communicate with parents, and (g) preview tests and performance tasks (see Figure 17).
Figure 17. Keeping track of success with students who have math anxiety. The figure demonstrates the seven themes that emerged from responses to interview question seven. Data is presented in decreasing order of frequency. The numbers in each theme indicate the number of times a direct or indirect statement was made by an interview participant that fell into the respective theme category.
76 6
5
32 2
0123456789
101112131415
Assessments Observation Smallinstructional
groupings
Analysis Closely monitorand check-in
Communicatewith parents
Preview testsand
performancetasks
Coun
t
Themes
Interview Question 7 - Coding Resultsn=15 - multiple responses per interviewee
116
Assessments. Assessments ranked highest in frequency for keeping track of success with
students who have math anxiety. Of the 31 key words, phrases, viewpoints, or responses to
interview question seven, seven (23%) of the responses were directly or indirectly related to
assessments. The theme of assessments includes writing notes, keeping anecdotal records,
checking for understanding using whiteboards, reading math journals, and ongoing timed
tests. For example, P13 explained,
I think it’s more just like anecdotal or just kind of thinking about it. Yeah, I have
a page for each kid in my planning book and I just stick Post-it notes on there so
when the time comes that I have to give information on them, I have all of this
information to give. (P13)
Observation. Observation ranked second highest in frequency for keeping track of
success with students who have math anxiety. Of the 31 key words, phrases, viewpoints, or
responses to interview question seven, six (19%) of the responses were directly or indirectly
related to observation. The theme of observation includes observation and mental notes. For
example, P3 explained, “Observing in first grade is key. Being out there when they’re working,
you can automatically check on your students who have math anxiety and see who’s struggling
and who’s stuck and who needs that support” (P2).
Small instructional groupings. Small instructional groupings also ranked second
highest in frequency for keeping track of success with students who have math anxiety. Of the
31 key words, phrases, viewpoints, or responses to interview question seven, six (19%) of the
responses were directly or indirectly related to small instructional groupings. The theme of small
instructional groupings includes one-on-one, small groups, and after school practice. For
example, P4 shared,
117
So, during that math computer game time on Fridays, I can then pull kids that I’ve
noticed that have struggled. And again, tracking. It’s basically what I’ve done
through the week and maybe I have those papers here and I’ve pulled kids aside.
So that’s my system as far as meeting those needs of those kids that are struggling
with math anxiety. (P4)
Analysis. Analysis ranked third highest in frequency for keeping track of success with
students who have math anxiety. Of the 31 key words, phrases, viewpoints, or responses to
interview question seven, five (16%) of the responses were directly or indirectly related to
analysis. The theme of analysis includes analyzing data, documenting when pull kids, keeping
track of different strategies, and looking at data from tests. For example, P7 explained, “You’re
inputting data constantly. You’re constantly looking a pie charts and you’re looking at, you
know, individual students in sub groups and so you know. I mean, you’re evaluating yourself
constantly” (P7).
Closely monitor and check-in. Closely monitor and check-in ranked fourth highest in
frequency for keeping track of success with students who have math anxiety. Of the 31 key
words, phrases, viewpoints, or responses to interview question seven, three (10%) of the
responses were directly or indirectly related to closely monitor and check-in. The theme of
closely monitor and check-in includes paying attention to what kids need and checking in daily
with students. For example, P8 noted, “Just checking in. I mean, you, you’ll know who the kids
are” (P8).
Communicate with parents. Communicate with parents ranked lowest in frequency for
keeping track of success with students who have math anxiety. Of the 31 key words, phrases,
viewpoints, or responses to interview question seven, two (6%) of the responses were directly or
118
indirectly related to communication with parents. The theme of communicate with parents
includes meeting with parents and communicating with them. For example, P10 shared, “You
know, like meeting with parents and talking to them about if whether or not they can help at
home and documenting” (P10).
Preview tests and performance tasks. Preview tests and performance tasks also ranked
lowest in frequency for keeping track of success with students who have math anxiety. Of the 31
key words, phrases, viewpoints, or responses to interview question seven, two (6%) of the
responses were directly or indirectly related to preview tests and performance tasks. The theme
of preview tests and performance tasks includes giving practice tests and previewing problem-
solving tasks. For example, P12 shared,
And we’re definitely pushing in, and like, if we’re going to be doing a
performance task or a problem-solving task, we might give them one that’s
similar in the morning and walk them through it as a group so that when they have
the real assessment, we can actually get a true measure of how well they’re gonna
do because then they don’t feel - at least they’ve had some exposure. (P12)
Interview question eight. “What advice do you have for new teachers who have
students with math anxiety?” Through the analysis of all responses to interview question eight, a
total of 56 key words, phrases, or viewpoints were identified as advice for new teachers who
have students with math anxiety. The 12 common themes that emerged are as follows: (a)
incorporate multiple strategies, (b) know your students, (c) be your student’s biggest cheerleader,
(d) be flexible with curriculum and pacing guide, (e) create safe environment, (f) observe while
keeping anecdotal records, (g) model and instill growth mindset, (h) differentiate instruction, (i)
work with students in smaller settings, (j) reflect on own teaching practices, (k) collaborate with
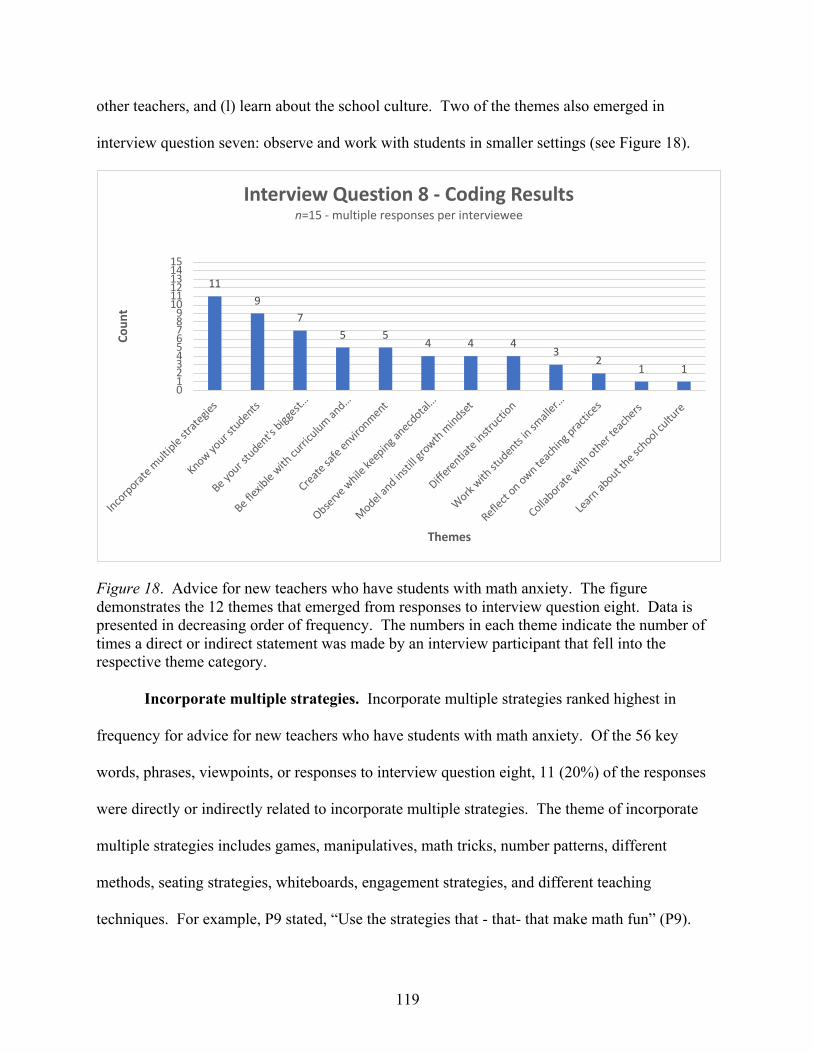
119
other teachers, and (l) learn about the school culture. Two of the themes also emerged in
interview question seven: observe and work with students in smaller settings (see Figure 18).
Figure 18. Advice for new teachers who have students with math anxiety. The figure demonstrates the 12 themes that emerged from responses to interview question eight. Data is presented in decreasing order of frequency. The numbers in each theme indicate the number of times a direct or indirect statement was made by an interview participant that fell into the respective theme category.
Incorporate multiple strategies. Incorporate multiple strategies ranked highest in
frequency for advice for new teachers who have students with math anxiety. Of the 56 key
words, phrases, viewpoints, or responses to interview question eight, 11 (20%) of the responses
were directly or indirectly related to incorporate multiple strategies. The theme of incorporate
multiple strategies includes games, manipulatives, math tricks, number patterns, different
methods, seating strategies, whiteboards, engagement strategies, and different teaching
techniques. For example, P9 stated, “Use the strategies that - that- that make math fun” (P9).
119
75 5
4 4 43
21 1
0123456789
101112131415
Incorporat
e multip
le strat
egies
Know your s
tudents
Be your s
tudent's bigg
est…
Be flexib
le with
curri
culum an
d…
Create sa
fe envir
onment
Observe w
hile ke
eping a
necdotal
…
Model an
d insti
ll growth m
indset
Differentia
te instr
uction
Work with
studen
ts in sm
aller…
Reflect
on own teach
ing prac
tices
Collaborat
e with
other teac
hers
Learn
about th
e school cu
lture
Coun
t
Themes
Interview Question 8 - Coding Resultsn=15 - multiple responses per interviewee
120
Know your students. Know your students ranked second highest in frequency for
advice for new teachers who have students with math anxiety. Of the 56 key words, phrases,
viewpoints, or responses to interview question eight, nine (16%) of the responses were directly
or indirectly related to know your students. The theme of know your students includes collect
information on students, relationship is key, find out their passion, know your kids, find out what
motivates each child, don’t label kids, and don’t make assumptions. For example, P6 explained,
“Bottom line is get to know your students. Get to know them really, really well. Find out what
everyone brings to your classroom and find out what their passion is” (P6).
Be your student’s biggest cheerleader. Be your student’s biggest cheerleader ranked
third highest in frequency for advice for new teachers who have students with math anxiety. Of
the 56 key words, phrases, viewpoints, or responses to interview question eight, seven (13%) of
the responses were directly or indirectly related to be your student’s biggest cheerleader. The
theme of be your student’s biggest cheerleader includes reminding students of other successes
they’ve experienced, letting students know how smart they are, having pep talks, being
encouraging, catching them putting forth effort, and praising little successes and strengths. For
example, P15, noted, “Let them know you’re there for them. Let them know it’s okay that
they’re anxious, and just find ways to help them learn” (P15).
Be flexible with curriculum and pacing guide. Be flexible with curriculum and
packing guide ranked fourth highest in frequency for advice for new teachers who have students
with math anxiety. Of the 56 key words, phrases, viewpoints, or responses to interview question
eight, five (9%) of the responses were directly or indirectly related to be flexible with curriculum
and pacing guide. The theme of be flexible with curriculum and pacing guide includes
sometimes abandon the lesson plan, do not be so tied to curriculum calendar, be flexible, and do

121
not be afraid to teach a student with material that is below grade level. For example, P9 said,
“Don’t move on just because the book says move to the next page tomorrow. You have to make
sure that you have understanding and you’re not gonna get it with every one of them” (P9).
Create safe environment. Create safe environment also ranked fourth highest in
frequency for advice for new teachers who have students with math anxiety. Of the 56 key
words, phrases, viewpoints, or responses to interview question eight, five (9%) of the responses
were directly or indirectly related to create safe environment. The theme of create safe
environment includes pray, safe to take risks, have patience, and allow students time. For
example, P4 noted, “I think that relationship is so important with the kids and creating that
environment where it’s okay to take risks and you need to ask those questions because you are
still learning” (P4).
Observe while keeping anecdotal records. Observe while keeping anecdotal records
ranked fifth highest in frequency for advice for new teachers who have students with math
anxiety. Of the 56 key words, phrases, viewpoints, or responses to interview question eight, four
(7%) of the responses were directly or indirectly related to observe while keeping anecdotal
records. The theme of observe while keeping anecdotal records includes observe, watch facial
expressions, watch body language, focus on the why, stay in the trenches, stay away from your
desk, keep anecdotals. For example, P1 explained, “The best thing is the observing, watching
facial expressions, maybe body language, but mainly walking and standing by students” (P1).
Model and instill growth mindset. Model and instill growth mindset also ranked fifth
highest in frequency for advice for new teachers who have students with math anxiety. Of the 56
key words, phrases, viewpoints, or responses to interview question eight, four (7%) of the
responses were directly or indirectly related to model and instill growth mindset. The theme of
122
model and instill growth mindset includes having a positive attitude toward every student and
subject, getting parents to believe their kids can succeed, taking a positive approach to math,
believing in students, constantly highlighting effort, encouraging mistakes, and using the word
yet. For example, P14 shared,
You know, just to encourage the effort and to be patient, you know, encourage
them to be patient. I love the word yet, you know. You don’t get it yet. You
know, you’ll get it. You know, and just let them know it’s okay to struggle and
that struggle becomes a good thing. (P14)
Differentiate instruction. Differentiate instruction also ranked fifth highest in frequency
for advice for new teachers who have students with math anxiety. Of the 56 key words, phrases,
viewpoints, or responses to interview question eight, four (7%) of the responses were directly or
indirectly related to differentiate instruction. The theme of differentiate instruction includes
varying groups, differentiate in chunks, and eventually differentiate each rotation. For example,
P9 explained, “As a new teacher, don’t overdo trying to differentiate your instruction
completely. You have to take it in chunks” (P9).
Work with students in smaller settings. Work with students in smaller settings ranked
sixth highest in frequency for advice for new teachers who have students with math anxiety. Of
the 56 key words, phrases, viewpoints, or responses to interview question eight, three (5%) of the
responses were directly or indirectly related to work with students in smaller settings. The theme
of work with students in smaller settings includes working one-on-one, helping after school, and
pulling kids individually. For example, P15 shared,
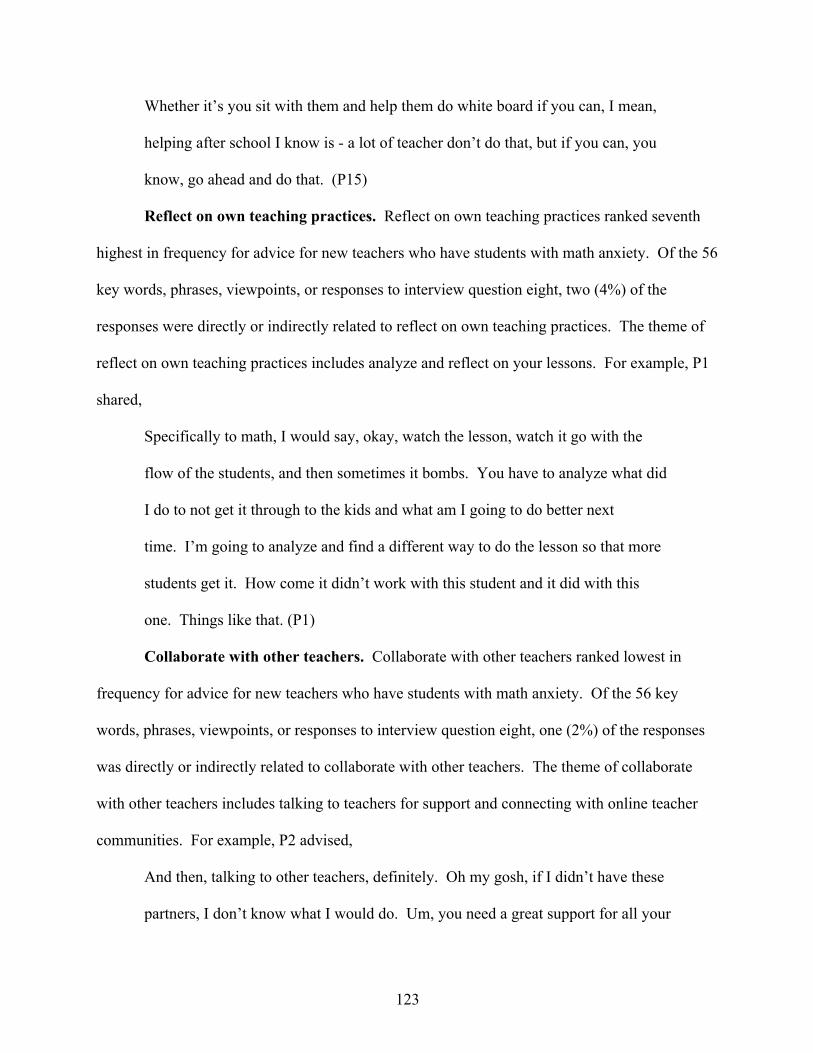
123
Whether it’s you sit with them and help them do white board if you can, I mean,
helping after school I know is - a lot of teacher don’t do that, but if you can, you
know, go ahead and do that. (P15)
Reflect on own teaching practices. Reflect on own teaching practices ranked seventh
highest in frequency for advice for new teachers who have students with math anxiety. Of the 56
key words, phrases, viewpoints, or responses to interview question eight, two (4%) of the
responses were directly or indirectly related to reflect on own teaching practices. The theme of
reflect on own teaching practices includes analyze and reflect on your lessons. For example, P1
shared,
Specifically to math, I would say, okay, watch the lesson, watch it go with the
flow of the students, and then sometimes it bombs. You have to analyze what did
I do to not get it through to the kids and what am I going to do better next
time. I’m going to analyze and find a different way to do the lesson so that more
students get it. How come it didn’t work with this student and it did with this
one. Things like that. (P1)
Collaborate with other teachers. Collaborate with other teachers ranked lowest in
frequency for advice for new teachers who have students with math anxiety. Of the 56 key
words, phrases, viewpoints, or responses to interview question eight, one (2%) of the responses
was directly or indirectly related to collaborate with other teachers. The theme of collaborate
with other teachers includes talking to teachers for support and connecting with online teacher
communities. For example, P2 advised,
And then, talking to other teachers, definitely. Oh my gosh, if I didn’t have these
partners, I don’t know what I would do. Um, you need a great support for all your
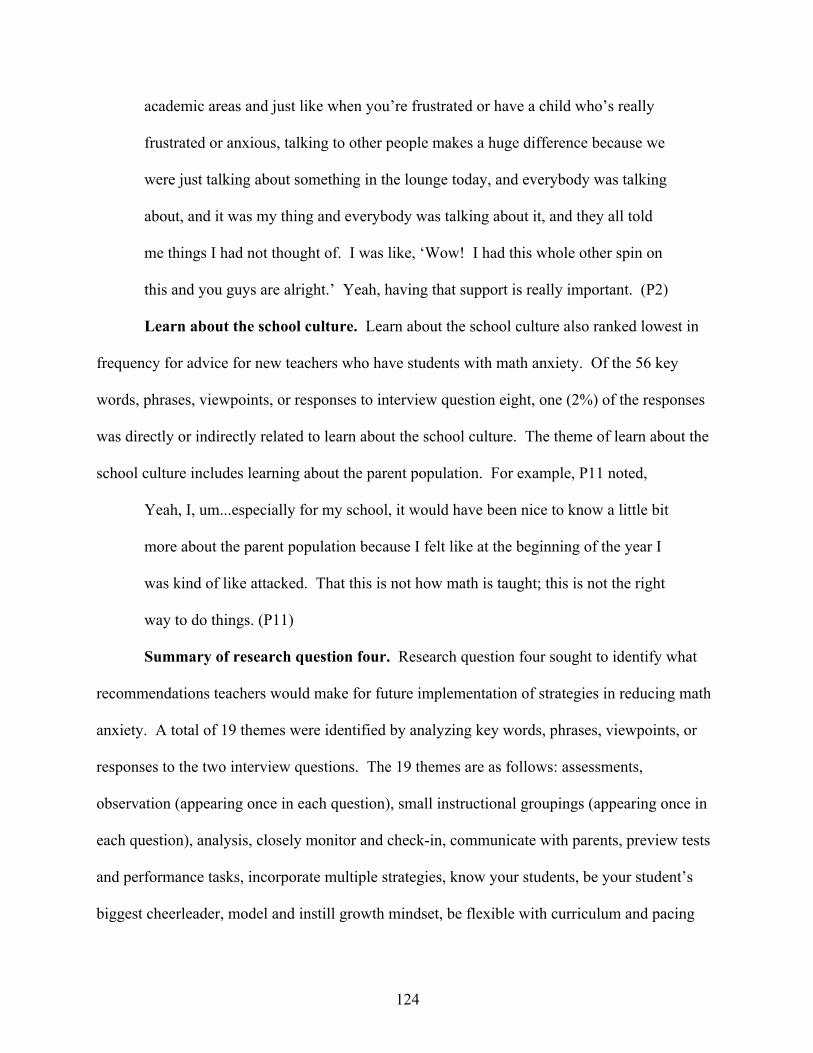
124
academic areas and just like when you’re frustrated or have a child who’s really
frustrated or anxious, talking to other people makes a huge difference because we
were just talking about something in the lounge today, and everybody was talking
about, and it was my thing and everybody was talking about it, and they all told
me things I had not thought of. I was like, ‘Wow! I had this whole other spin on
this and you guys are alright.’ Yeah, having that support is really important. (P2)
Learn about the school culture. Learn about the school culture also ranked lowest in
frequency for advice for new teachers who have students with math anxiety. Of the 56 key
words, phrases, viewpoints, or responses to interview question eight, one (2%) of the responses
was directly or indirectly related to learn about the school culture. The theme of learn about the
school culture includes learning about the parent population. For example, P11 noted,
Yeah, I, um...especially for my school, it would have been nice to know a little bit
more about the parent population because I felt like at the beginning of the year I
was kind of like attacked. That this is not how math is taught; this is not the right
way to do things. (P11)
Summary of research question four. Research question four sought to identify what
recommendations teachers would make for future implementation of strategies in reducing math
anxiety. A total of 19 themes were identified by analyzing key words, phrases, viewpoints, or
responses to the two interview questions. The 19 themes are as follows: assessments,
observation (appearing once in each question), small instructional groupings (appearing once in
each question), analysis, closely monitor and check-in, communicate with parents, preview tests
and performance tasks, incorporate multiple strategies, know your students, be your student’s
biggest cheerleader, model and instill growth mindset, be flexible with curriculum and pacing
125
guide, differentiate instruction, create safe environment, collaborate with other teachers, reflect
on own teaching practices, and learn about the school culture.
Summary
The purpose of this study was to determine the best practices and strategies teachers
employ to reduce math anxiety, the challenges teachers face in reducing math anxiety, how
teachers measure their success in reducing math anxiety, and recommendations teachers would
make for future implementation of strategies in reducing math anxiety. To fulfill this purpose,
15 first through sixth grade teachers were recruited to participate in the research. All participants
were asked eight semi-structured interview questions that were developed to inform the
following four research questions:
1. What strategies and practices do teachers employ to reduce math anxiety?
2. What challenges do teachers face in reducing math anxiety?
3. How do teachers measure the success of their practices in reducing math anxiety?
4. What recommendations would teachers make for future implementation of strategies
in reducing math anxiety?
Data were collected from 15 semi-structured interviews. The researcher coded the data and
validated the results using two inter-rater Pepperdine doctoral candidates. Data analysis
produced 61 themes. Table 9 displays all 61 themes and how they relate to each research
question. Chapter 5 presents a summary of the study, an account of the findings, implications for
the study, and recommendations for further research.
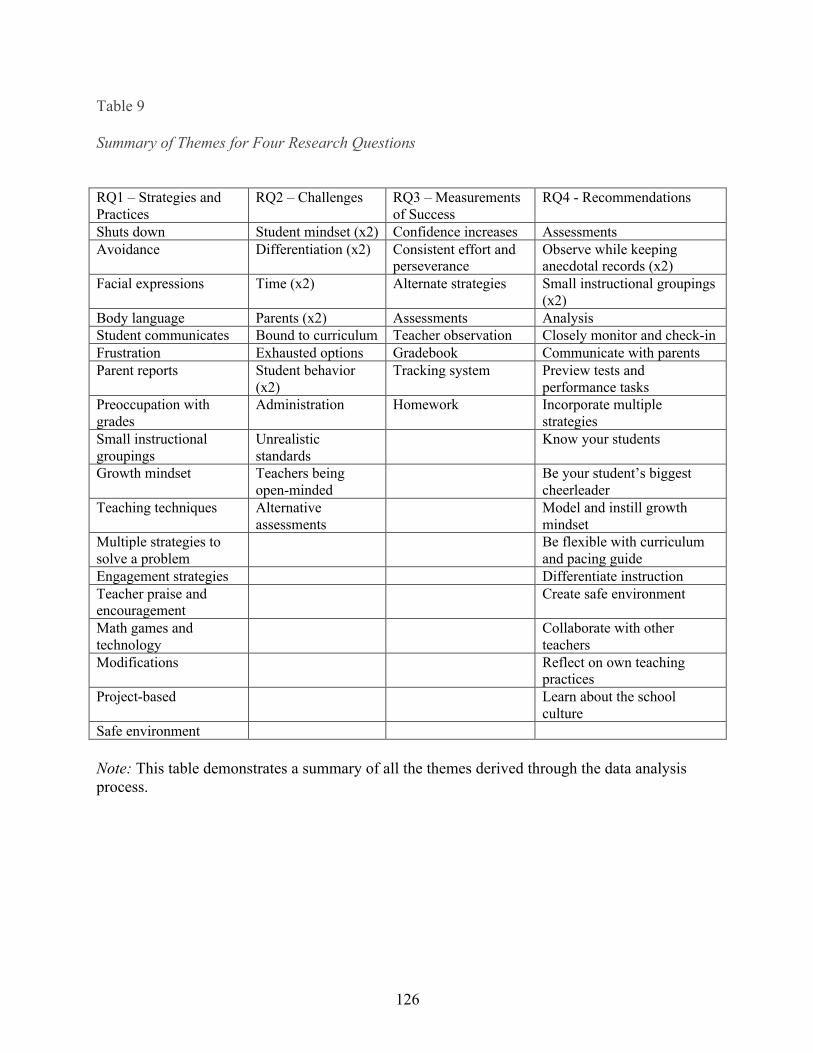
126
Table 9
Summary of Themes for Four Research Questions
RQ1 – Strategies and Practices
RQ2 – Challenges RQ3 – Measurements of Success
RQ4 - Recommendations
Shuts down Student mindset (x2) Confidence increases Assessments Avoidance Differentiation (x2) Consistent effort and
perseverance Observe while keeping anecdotal records (x2)
Facial expressions Time (x2) Alternate strategies Small instructional groupings (x2)
Body language Parents (x2) Assessments Analysis Student communicates Bound to curriculum Teacher observation Closely monitor and check-in Frustration Exhausted options Gradebook Communicate with parents Parent reports Student behavior
(x2) Tracking system Preview tests and
performance tasks Preoccupation with grades
Administration Homework Incorporate multiple strategies
Small instructional groupings
Unrealistic standards
Know your students
Growth mindset Teachers being open-minded
Be your student’s biggest cheerleader
Teaching techniques Alternative assessments
Model and instill growth mindset
Multiple strategies to solve a problem
Be flexible with curriculum and pacing guide
Engagement strategies
Differentiate instruction Teacher praise and encouragement
Create safe environment
Math games and technology
Collaborate with other teachers
Modifications
Reflect on own teaching practices
Project-based
Learn about the school culture
Safe environment
Note: This table demonstrates a summary of all the themes derived through the data analysis process.
127
Chapter 5: Conclusions and Recommendations
Introduction
Proficiency in STEM education develops a STEM literate society, which is needed to
compete in today’s global economy (Bybee, 2013; U.S. Department of Education, 2017).
Mathematical competence is certainly necessary to achieve success in STEM education fields;
however, achieving competence is often hindered by math anxiety, which is shared by both
adults and children (Blazer, 2011; Furner & Duffy, 2002). The purpose of this study was to
determine the best practices teachers employ to reduce math anxiety and the challenges teachers
face in reducing math anxiety. The teachers that participated in this study had various years of
teaching experience and all shared that math anxiety is a real phenomenon shared by several of
their students. Their willingness to share their knowledge and experience provided rich data that
gives insight into reducing math anxiety in elementary students.
This study contributes to the existing literature on math anxiety by enhancing an
understanding of strategies and best practices used to reduce math anxiety and the challenges that
teachers face in reducing math anxiety. In addition, it provides key insights for teachers to
implement strategies to reduce math anxiety in the future. This chapter outlines a summary of
the study, discussion of the research findings, implications of the study, teacher and parent
recommendations, and recommendations for future research.
Summary of the Study
This qualitative, phenomenological study investigated the best strategies and practices
incorporated and challenges faced by teachers in reducing math anxiety. The following four
research questions were addressed as part of this study.
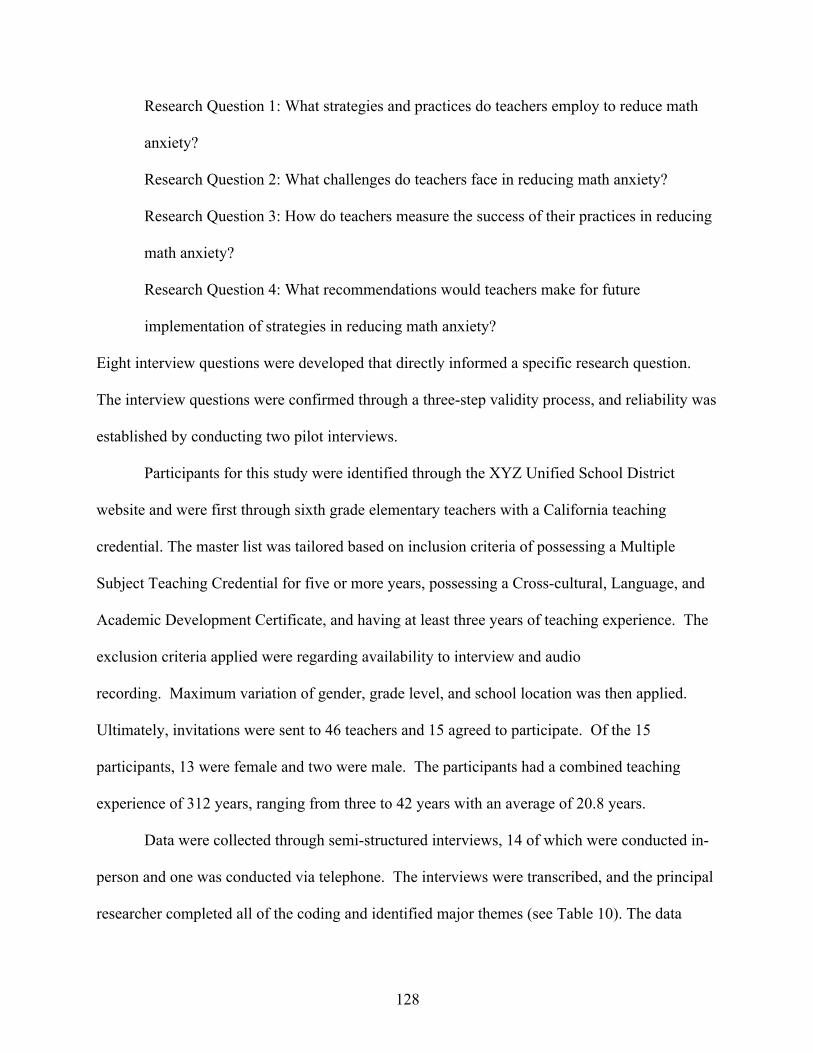
128
Research Question 1: What strategies and practices do teachers employ to reduce math
anxiety?
Research Question 2: What challenges do teachers face in reducing math anxiety?
Research Question 3: How do teachers measure the success of their practices in reducing
math anxiety?
Research Question 4: What recommendations would teachers make for future
implementation of strategies in reducing math anxiety?
Eight interview questions were developed that directly informed a specific research question.
The interview questions were confirmed through a three-step validity process, and reliability was
established by conducting two pilot interviews.
Participants for this study were identified through the XYZ Unified School District
website and were first through sixth grade elementary teachers with a California teaching
credential. The master list was tailored based on inclusion criteria of possessing a Multiple
Subject Teaching Credential for five or more years, possessing a Cross-cultural, Language, and
Academic Development Certificate, and having at least three years of teaching experience. The
exclusion criteria applied were regarding availability to interview and audio
recording. Maximum variation of gender, grade level, and school location was then applied.
Ultimately, invitations were sent to 46 teachers and 15 agreed to participate. Of the 15
participants, 13 were female and two were male. The participants had a combined teaching
experience of 312 years, ranging from three to 42 years with an average of 20.8 years.
Data were collected through semi-structured interviews, 14 of which were conducted in-
person and one was conducted via telephone. The interviews were transcribed, and the principal
researcher completed all of the coding and identified major themes (see Table 10). The data
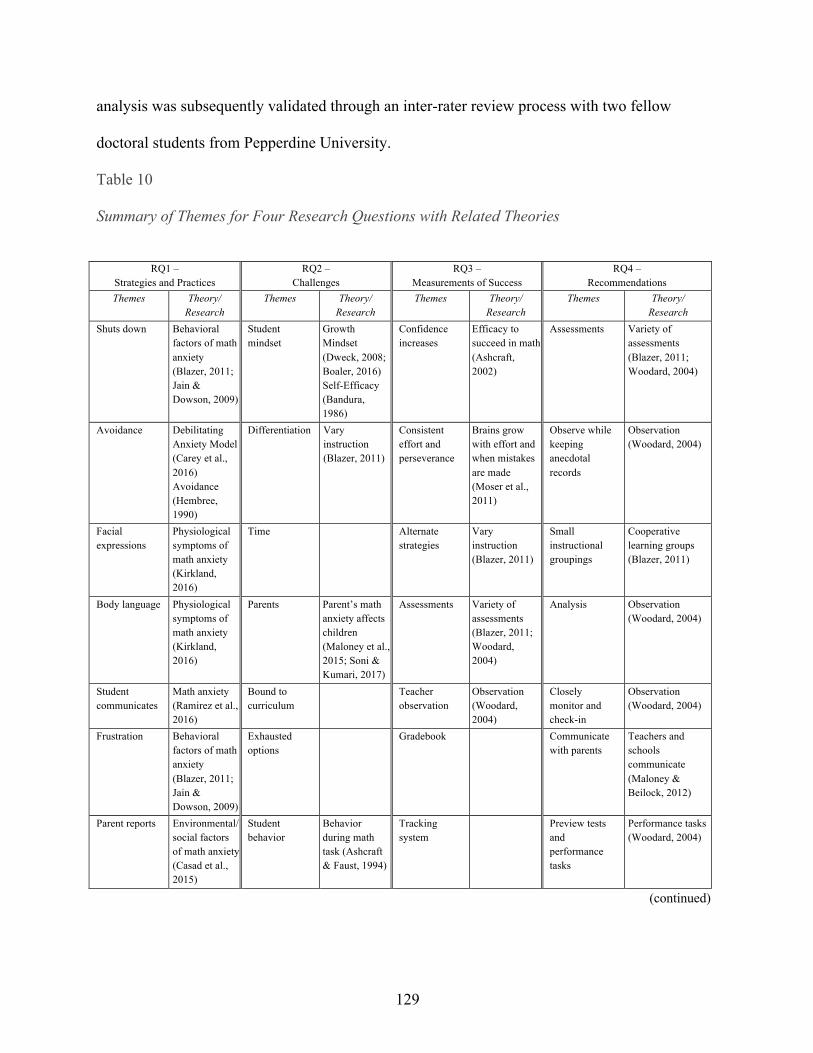
129
analysis was subsequently validated through an inter-rater review process with two fellow
doctoral students from Pepperdine University.
Table 10
Summary of Themes for Four Research Questions with Related Theories
RQ1 –
Strategies and Practices RQ2 –
Challenges RQ3 –
Measurements of Success RQ4 –
Recommendations Themes Theory/
Research Themes Theory/
Research Themes Theory/
Research Themes Theory/
Research Shuts down Behavioral
factors of math anxiety (Blazer, 2011; Jain & Dowson, 2009)
Student mindset
Growth Mindset (Dweck, 2008; Boaler, 2016) Self-Efficacy (Bandura, 1986)
Confidence increases
Efficacy to succeed in math (Ashcraft, 2002)
Assessments Variety of assessments (Blazer, 2011; Woodard, 2004)
Avoidance Debilitating Anxiety Model (Carey et al., 2016) Avoidance (Hembree, 1990)
Differentiation Vary instruction (Blazer, 2011)
Consistent effort and perseverance
Brains grow with effort and when mistakes are made (Moser et al., 2011)
Observe while keeping anecdotal records
Observation (Woodard, 2004)
Facial expressions
Physiological symptoms of math anxiety (Kirkland, 2016)
Time Alternate strategies
Vary instruction (Blazer, 2011)
Small instructional groupings
Cooperative learning groups (Blazer, 2011)
Body language Physiological symptoms of math anxiety (Kirkland, 2016)
Parents Parent’s math anxiety affects children (Maloney et al., 2015; Soni & Kumari, 2017)
Assessments Variety of assessments (Blazer, 2011; Woodard, 2004)
Analysis Observation (Woodard, 2004)
Student communicates
Math anxiety (Ramirez et al., 2016)
Bound to curriculum
Teacher observation
Observation (Woodard, 2004)
Closely monitor and check-in
Observation (Woodard, 2004)
Frustration Behavioral factors of math anxiety (Blazer, 2011; Jain & Dowson, 2009)
Exhausted options
Gradebook Communicate with parents
Teachers and schools communicate (Maloney & Beilock, 2012)
Parent reports Environmental/ social factors of math anxiety (Casad et al., 2015)
Student behavior
Behavior during math task (Ashcraft & Faust, 1994)
Tracking system
Preview tests and performance tasks
Performance tasks (Woodard, 2004)
(continued)
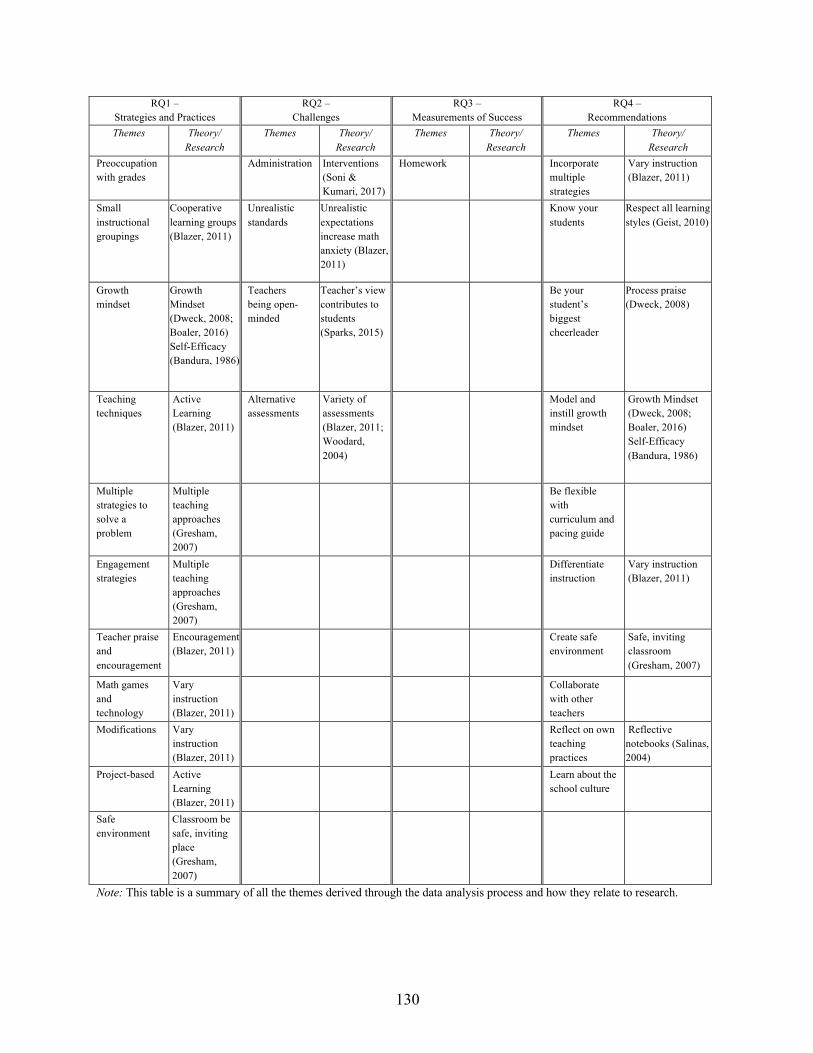
130
RQ1 – Strategies and Practices
RQ2 – Challenges
RQ3 – Measurements of Success
RQ4 – Recommendations
Themes Theory/ Research
Themes Theory/ Research
Themes Theory/ Research
Themes Theory/ Research
Preoccupation with grades
Administration Interventions (Soni & Kumari, 2017)
Homework Incorporate multiple strategies
Vary instruction (Blazer, 2011)
Small instructional groupings
Cooperative learning groups (Blazer, 2011)
Unrealistic standards
Unrealistic expectations increase math anxiety (Blazer, 2011)
Know your
students Respect all learning styles (Geist, 2010)
Growth mindset
Growth Mindset (Dweck, 2008; Boaler, 2016) Self-Efficacy (Bandura, 1986)
Teachers being open-minded
Teacher’s view contributes to students (Sparks, 2015)
Be your
student’s biggest cheerleader
Process praise (Dweck, 2008)
Teaching techniques
Active Learning (Blazer, 2011)
Alternative assessments
Variety of assessments (Blazer, 2011; Woodard, 2004)
Model and
instill growth mindset
Growth Mindset (Dweck, 2008; Boaler, 2016) Self-Efficacy (Bandura, 1986)
Multiple strategies to solve a problem
Multiple teaching approaches (Gresham, 2007)
Be flexible
with curriculum and pacing guide
Engagement strategies
Multiple teaching approaches (Gresham, 2007)
Differentiate
instruction Vary instruction (Blazer, 2011)
Teacher praise and encouragement
Encouragement (Blazer, 2011)
Create safe
environment Safe, inviting classroom (Gresham, 2007)
Math games and technology
Vary instruction (Blazer, 2011)
Collaborate
with other teachers
Modifications Vary instruction (Blazer, 2011)
Reflect on own
teaching practices
Reflective notebooks (Salinas, 2004)
Project-based Active Learning (Blazer, 2011)
Learn about the
school culture
Safe environment
Classroom be safe, inviting place (Gresham, 2007)
Note: This table is a summary of all the themes derived through the data analysis process and how they relate to research.
131
Summary of Findings
The findings of this study are intended to identify the best practices teachers employ and
challenges teachers face when reducing math anxiety. All 15 participants agreed that math
anxiety exists in elementary-aged students, and they acknowledged that they have all taught
students who experience math anxiety. As an icebreaker, the researcher asked the participants
how they define math anxiety. Overall, the participants believed math anxiety is frustration, fear
of math, and shutting down when confronted with a math problem. For all eight semi-structured
interview questions, the participant responses provided rich, genuine data. The data analysis
yielded 61 major themes, seven of which were duplicated in both interview questions for the
corresponding research question. This section provides a summary of general findings and the
subsequent section will present the key findings in detail by research question.
One overarching theme woven throughout most of the 61 themes is the importance of
knowing your students. Teachers need to know how their students learn, what motivates them,
how they communicate, what they like, what they dislike, and what their passion is. The teacher-
student relationship is important and contributes to success. All 15 participants discussed the
importance of knowing their students. By knowing their students, the teachers are able to
successfully incorporate best practices such as partner and small groups, modifications, and
teaching techniques. Knowing your students is also helpful in addressing and possibly
overcoming challenges.
A second theme that resonated across all four of the research questions was mindset.
Indeed, mindset was mentioned 62 times and is considered a best practice as well as a
challenge. Multiple participants shared growth mindset as a best practice. The teacher
participants mentioned having a growth mindset bulletin board in their classrooms, reading aloud
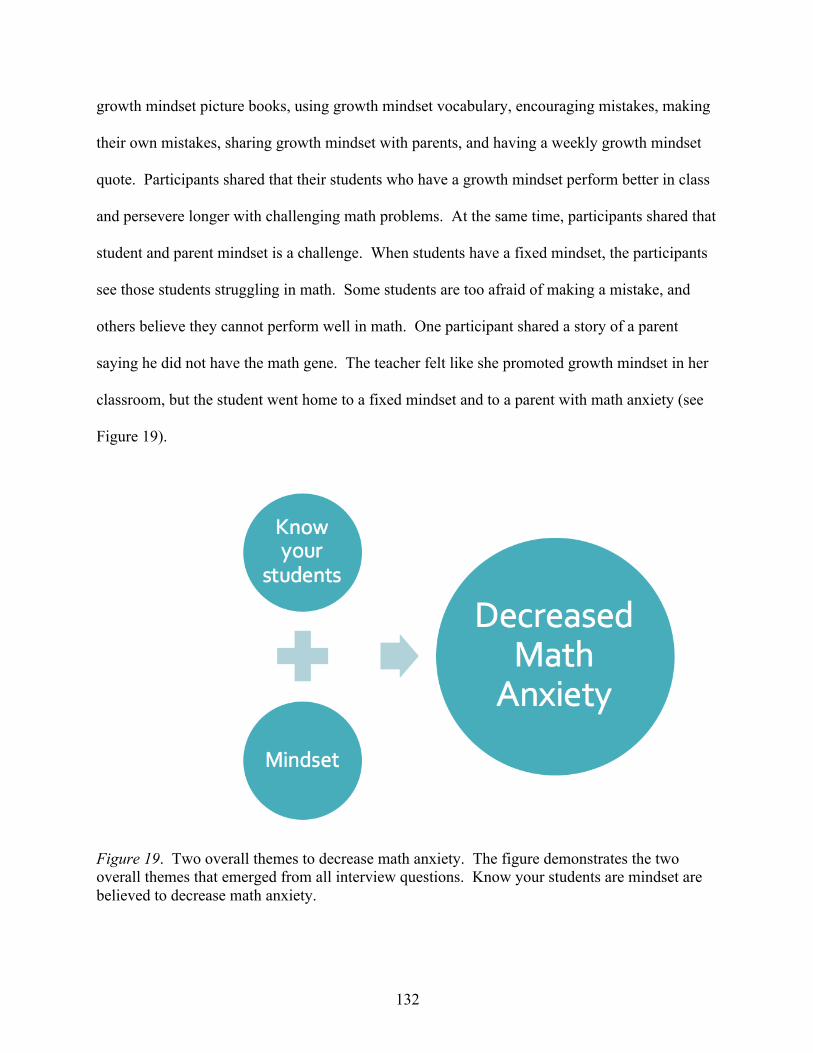
132
growth mindset picture books, using growth mindset vocabulary, encouraging mistakes, making
their own mistakes, sharing growth mindset with parents, and having a weekly growth mindset
quote. Participants shared that their students who have a growth mindset perform better in class
and persevere longer with challenging math problems. At the same time, participants shared that
student and parent mindset is a challenge. When students have a fixed mindset, the participants
see those students struggling in math. Some students are too afraid of making a mistake, and
others believe they cannot perform well in math. One participant shared a story of a parent
saying he did not have the math gene. The teacher felt like she promoted growth mindset in her
classroom, but the student went home to a fixed mindset and to a parent with math anxiety (see
Figure 19).
Figure 19. Two overall themes to decrease math anxiety. The figure demonstrates the two overall themes that emerged from all interview questions. Know your students are mindset are believed to decrease math anxiety.
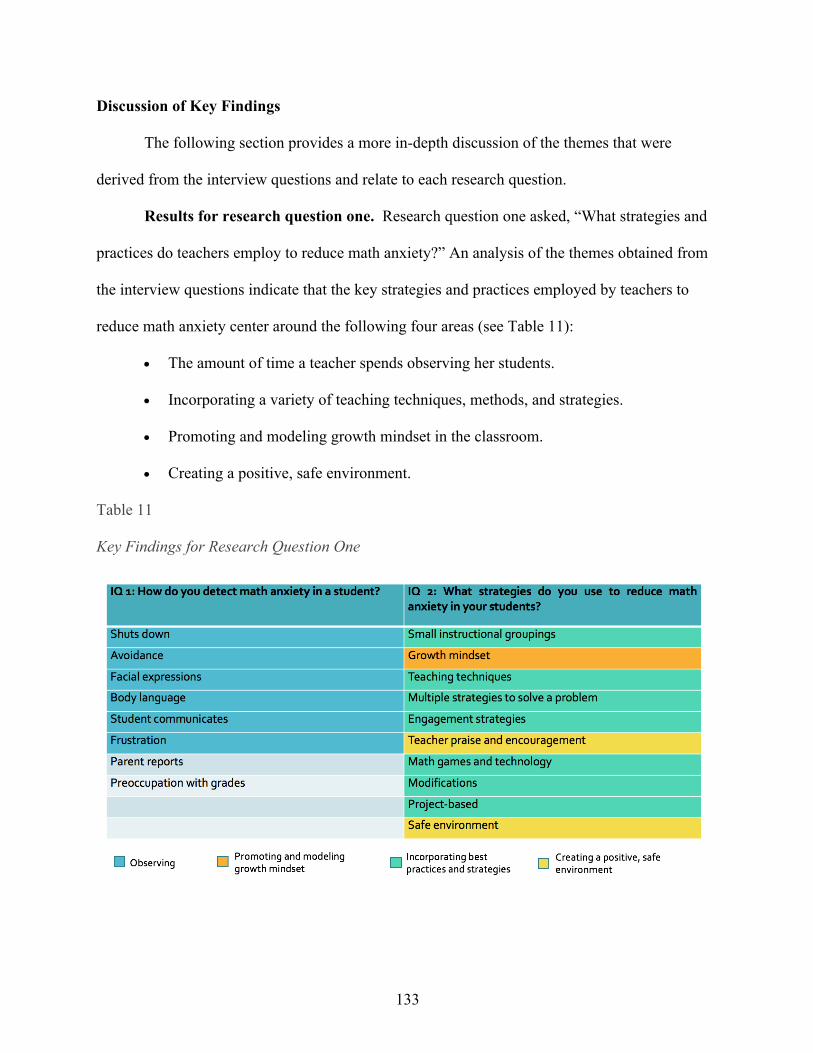
133
Discussion of Key Findings
The following section provides a more in-depth discussion of the themes that were
derived from the interview questions and relate to each research question.
Results for research question one. Research question one asked, “What strategies and
practices do teachers employ to reduce math anxiety?” An analysis of the themes obtained from
the interview questions indicate that the key strategies and practices employed by teachers to
reduce math anxiety center around the following four areas (see Table 11):
• The amount of time a teacher spends observing her students.
• Incorporating a variety of teaching techniques, methods, and strategies.
• Promoting and modeling growth mindset in the classroom.
• Creating a positive, safe environment.
Table 11
Key Findings for Research Question One
134
Discussion of research question one. The key findings of research question one
indicate the amount of time a teacher spends observing her students is directly related to how
well she knows her students and knows if they have math anxiety. The better she knows her
students, the better prepared she is to incorporate the best practices and strategies and reduce
math anxiety. Participants shared multiple best practices and strategies to reduce math anxiety as
explained in chapter four, including teaching for conceptual understanding. Blazer (2011)
explains that conceptual understanding is critical. Students need to understand a mathematical
concept instead of relying solely on memory.
Another key finding is promoting and modeling growth mindset. Participants shared how
they teach their students about growth mindset through books, bulletin boards, quotes, and
songs. The teachers emphasize effort and praise effort rather than results. Nine participants
specifically shared how they purposefully make mistakes when they are modeling math problems
on the board. They want their students to understand mistakes are part of learning and that
brains grow when mistakes are made (Moser, Schroder, Heeter, Moran, & Lee, 2011).
Participants believe growth mindset has such significance, especially in the area of math, that
they spend class time teaching it (Boaler, 2013a; Dweck, 2008).
A final key finding is creating a positive, safe environment. Participants shared that a
positive environment filled with praise encourages growth mindset as explained above. In
addition, when students feel safe, they are more likely to ask questions, talk to their peers and in
their small groups, and participate in engagement strategies. Participants shared how their
classrooms are not quiet places anymore. They are filled with movement, rotations, math games,
constructive talking, academic language, manipulatives, and technology (see Figure 20).
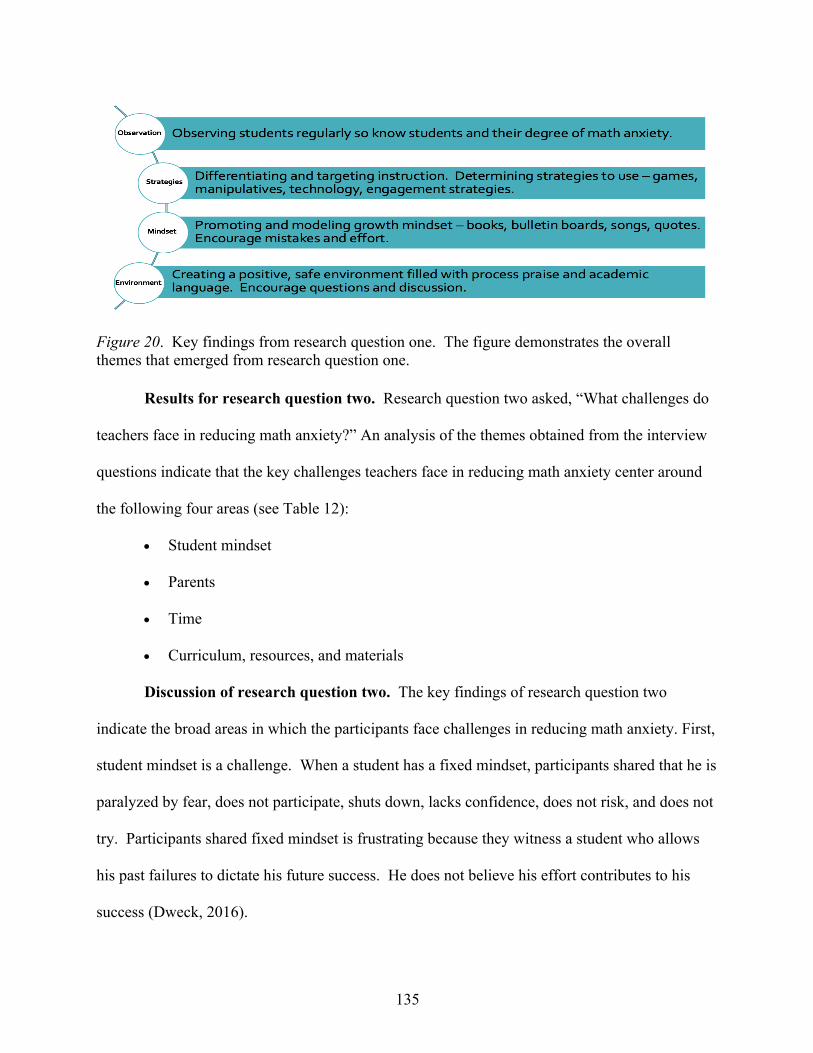
135
Figure 20. Key findings from research question one. The figure demonstrates the overall themes that emerged from research question one.
Results for research question two. Research question two asked, “What challenges do
teachers face in reducing math anxiety?” An analysis of the themes obtained from the interview
questions indicate that the key challenges teachers face in reducing math anxiety center around
the following four areas (see Table 12):
• Student mindset
• Parents
• Time
• Curriculum, resources, and materials
Discussion of research question two. The key findings of research question two
indicate the broad areas in which the participants face challenges in reducing math anxiety. First,
student mindset is a challenge. When a student has a fixed mindset, participants shared that he is
paralyzed by fear, does not participate, shuts down, lacks confidence, does not risk, and does not
try. Participants shared fixed mindset is frustrating because they witness a student who allows
his past failures to dictate his future success. He does not believe his effort contributes to his
success (Dweck, 2016).
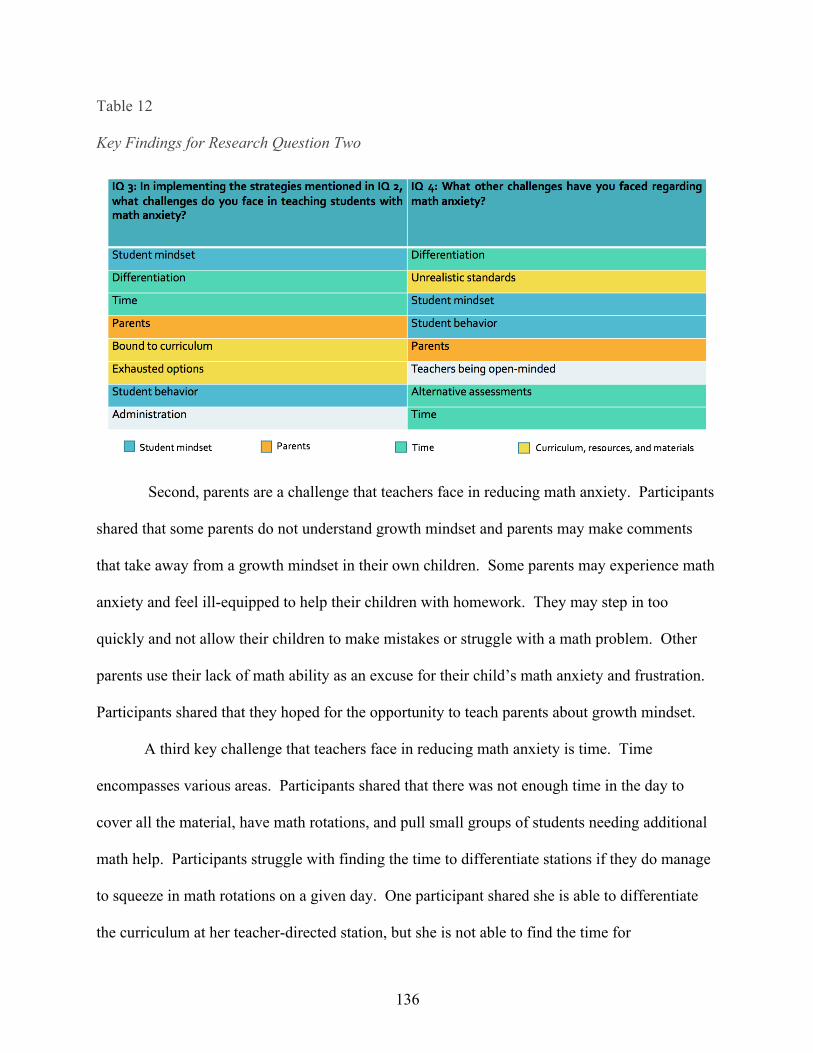
136
Table 12
Key Findings for Research Question Two
Second, parents are a challenge that teachers face in reducing math anxiety. Participants
shared that some parents do not understand growth mindset and parents may make comments
that take away from a growth mindset in their own children. Some parents may experience math
anxiety and feel ill-equipped to help their children with homework. They may step in too
quickly and not allow their children to make mistakes or struggle with a math problem. Other
parents use their lack of math ability as an excuse for their child’s math anxiety and frustration.
Participants shared that they hoped for the opportunity to teach parents about growth mindset.
A third key challenge that teachers face in reducing math anxiety is time. Time
encompasses various areas. Participants shared that there was not enough time in the day to
cover all the material, have math rotations, and pull small groups of students needing additional
math help. Participants struggle with finding the time to differentiate stations if they do manage
to squeeze in math rotations on a given day. One participant shared she is able to differentiate
the curriculum at her teacher-directed station, but she is not able to find the time for
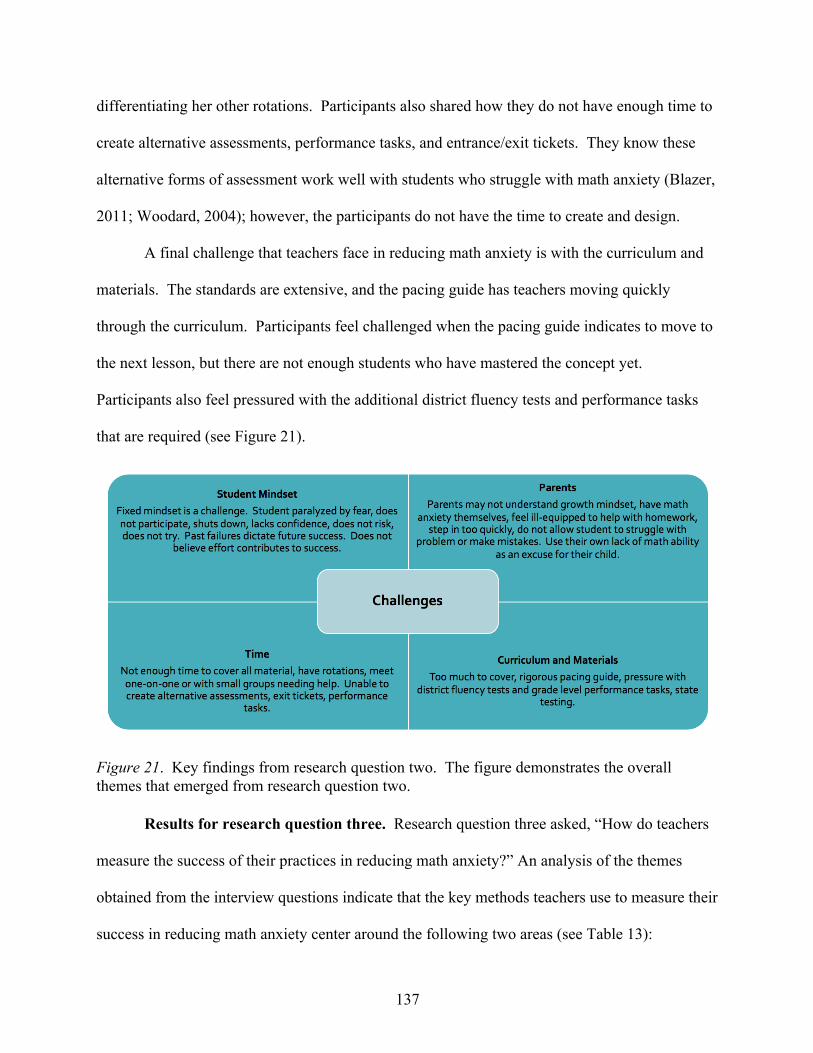
137
differentiating her other rotations. Participants also shared how they do not have enough time to
create alternative assessments, performance tasks, and entrance/exit tickets. They know these
alternative forms of assessment work well with students who struggle with math anxiety (Blazer,
2011; Woodard, 2004); however, the participants do not have the time to create and design.
A final challenge that teachers face in reducing math anxiety is with the curriculum and
materials. The standards are extensive, and the pacing guide has teachers moving quickly
through the curriculum. Participants feel challenged when the pacing guide indicates to move to
the next lesson, but there are not enough students who have mastered the concept yet.
Participants also feel pressured with the additional district fluency tests and performance tasks
that are required (see Figure 21).
Figure 21. Key findings from research question two. The figure demonstrates the overall themes that emerged from research question two.
Results for research question three. Research question three asked, “How do teachers
measure the success of their practices in reducing math anxiety?” An analysis of the themes
obtained from the interview questions indicate that the key methods teachers use to measure their
success in reducing math anxiety center around the following two areas (see Table 13):
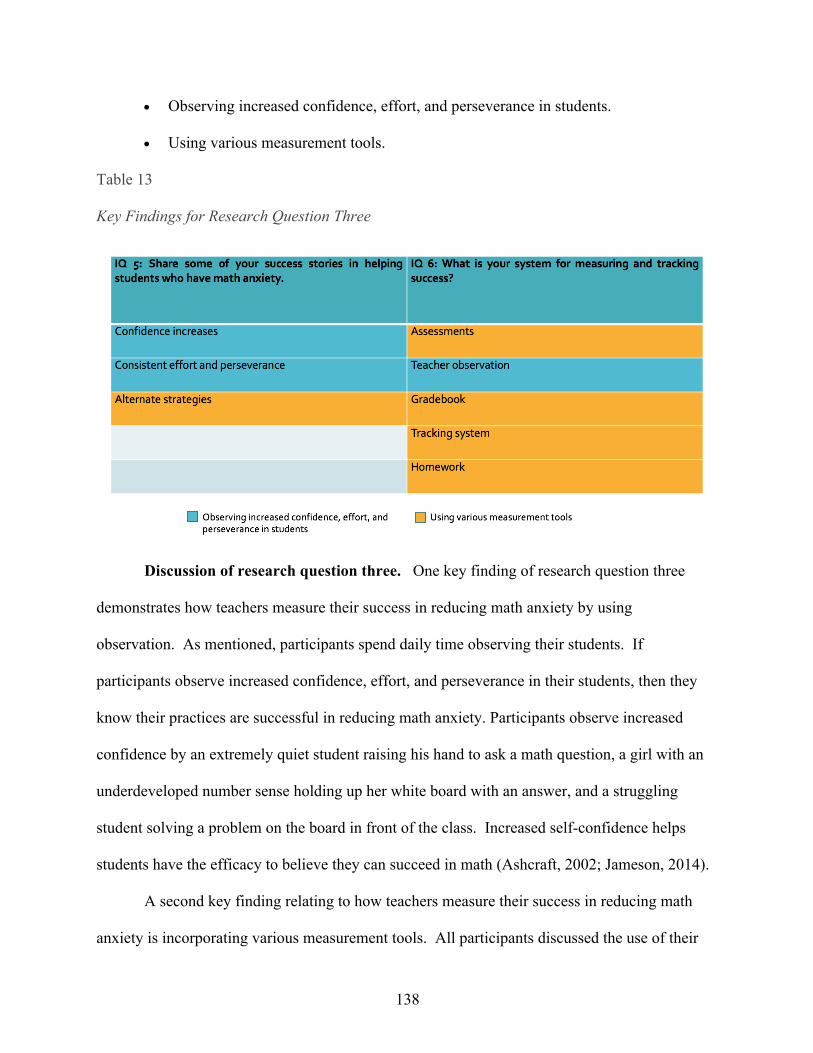
138
• Observing increased confidence, effort, and perseverance in students.
• Using various measurement tools.
Table 13
Key Findings for Research Question Three
Discussion of research question three. One key finding of research question three
demonstrates how teachers measure their success in reducing math anxiety by using
observation. As mentioned, participants spend daily time observing their students. If
participants observe increased confidence, effort, and perseverance in their students, then they
know their practices are successful in reducing math anxiety. Participants observe increased
confidence by an extremely quiet student raising his hand to ask a math question, a girl with an
underdeveloped number sense holding up her white board with an answer, and a struggling
student solving a problem on the board in front of the class. Increased self-confidence helps
students have the efficacy to believe they can succeed in math (Ashcraft, 2002; Jameson, 2014).
A second key finding relating to how teachers measure their success in reducing math
anxiety is incorporating various measurement tools. All participants discussed the use of their
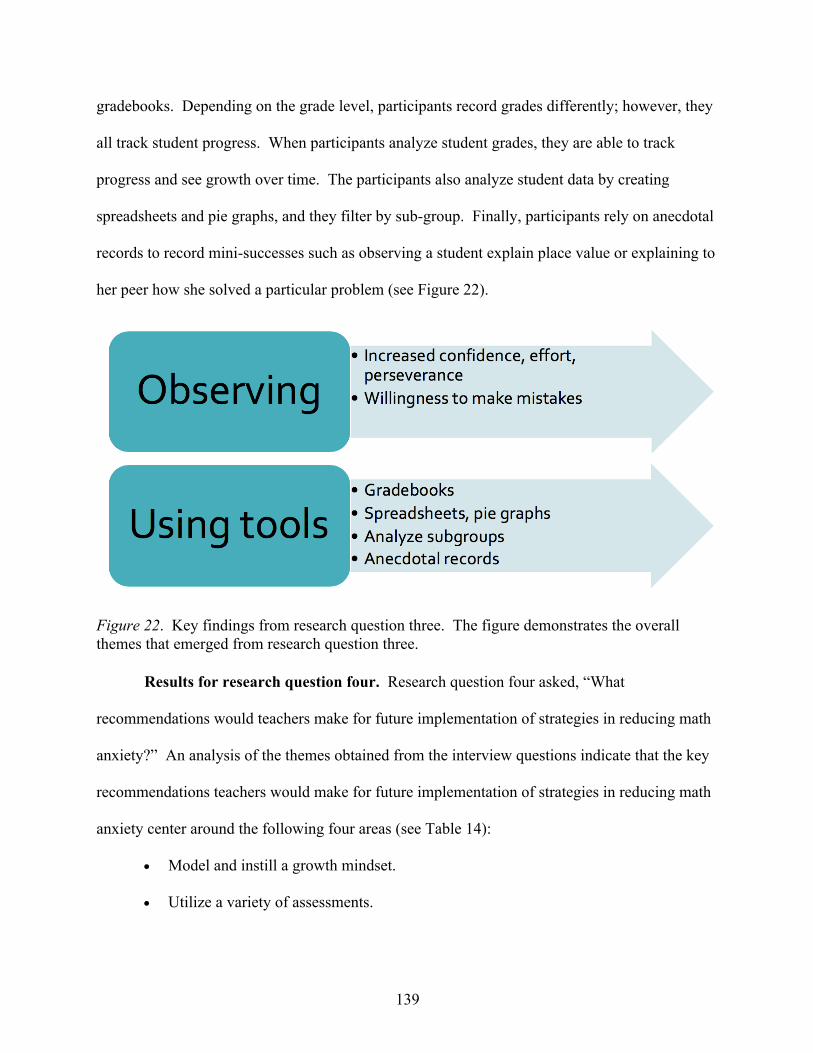
139
gradebooks. Depending on the grade level, participants record grades differently; however, they
all track student progress. When participants analyze student grades, they are able to track
progress and see growth over time. The participants also analyze student data by creating
spreadsheets and pie graphs, and they filter by sub-group. Finally, participants rely on anecdotal
records to record mini-successes such as observing a student explain place value or explaining to
her peer how she solved a particular problem (see Figure 22).
Figure 22. Key findings from research question three. The figure demonstrates the overall themes that emerged from research question three.
Results for research question four. Research question four asked, “What
recommendations would teachers make for future implementation of strategies in reducing math
anxiety?” An analysis of the themes obtained from the interview questions indicate that the key
recommendations teachers would make for future implementation of strategies in reducing math
anxiety center around the following four areas (see Table 14):
• Model and instill a growth mindset.
• Utilize a variety of assessments.
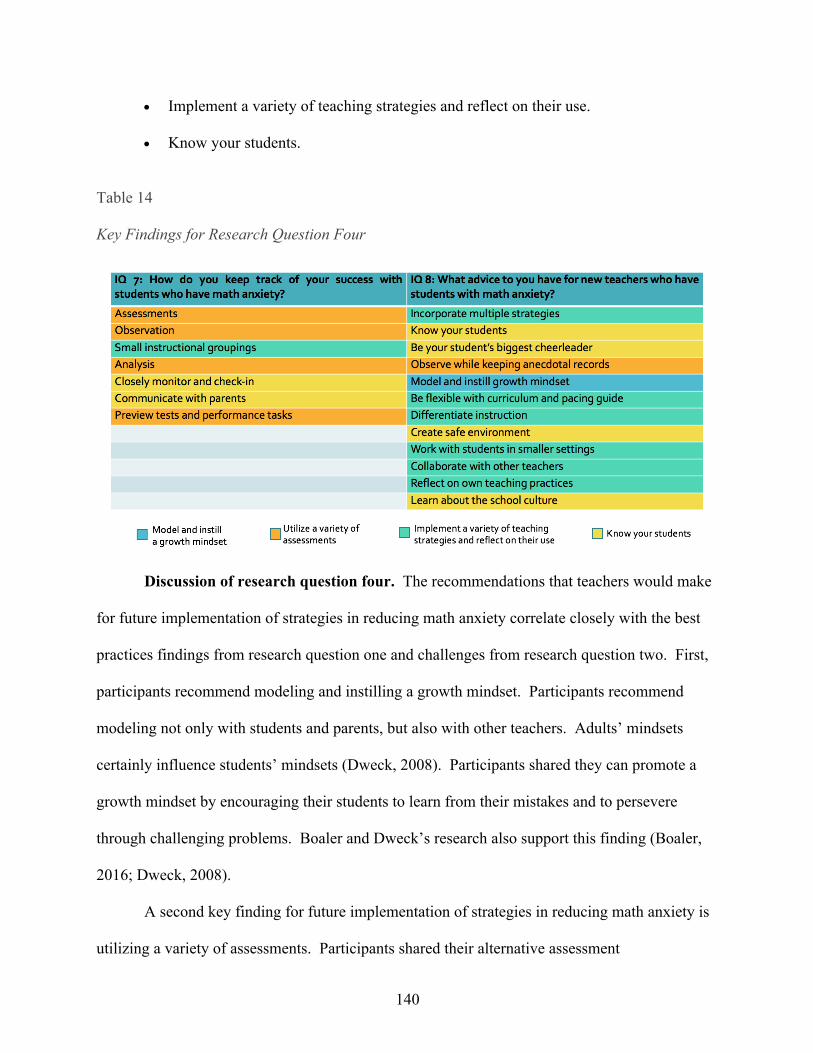
140
• Implement a variety of teaching strategies and reflect on their use.
• Know your students.
Table 14
Key Findings for Research Question Four
Discussion of research question four. The recommendations that teachers would make
for future implementation of strategies in reducing math anxiety correlate closely with the best
practices findings from research question one and challenges from research question two. First,
participants recommend modeling and instilling a growth mindset. Participants recommend
modeling not only with students and parents, but also with other teachers. Adults’ mindsets
certainly influence students’ mindsets (Dweck, 2008). Participants shared they can promote a
growth mindset by encouraging their students to learn from their mistakes and to persevere
through challenging problems. Boaler and Dweck’s research also support this finding (Boaler,
2016; Dweck, 2008).
A second key finding for future implementation of strategies in reducing math anxiety is
utilizing a variety of assessments. Participants shared their alternative assessment
141
recommendations including anecdotal records, performance tasks, weekly reflections, and math
journals. One participant shared it was important to keep a record of the alternative assessments
used to ensure variety. In addition, participants emphasized the importance of analyzing the data
from the assessments and using the data to drive instruction.
A third key finding for future implementation of strategies in reducing math anxiety is
implementing a variety of teaching strategies and reflecting on their success. The best practices
and teaching strategies are detailed in Chapter 4 and include small instructional groupings,
differentiated instruction, math games, manipulatives, engagement strategies, technology, hands-
on activities such as cooking, math journals, and project-based assignments. Participants shared
that strategies that move away from traditional paper and pencil are best for engaging students
and reducing math anxiety. In addition, participants encourage multiple strategies. They
explained that math often has one correct answer, but there are multiple methods to arrive at the
solution. They often teach several different methods to their students and allow their students to
select the method that makes most sense or works best for a particular problem. Participants also
highlighted the importance of reflecting on their own teaching practices. They note what
strategies and practices work well, what they would change about a lesson, what concepts are
more difficult for students to grasp, and what worked with which students.
A fourth key finding for future implementation of strategies in reducing math anxiety is
knowing your students. Participants emphasized the importance of knowing their students, as
detailed earlier in chapter five. Participants learn more about their students by observing,
communicating, checking-in, and engaging in number talks. When participants know their
students well, the teachers are best able to meet students’ needs and praise their efforts (see
Figure 23).
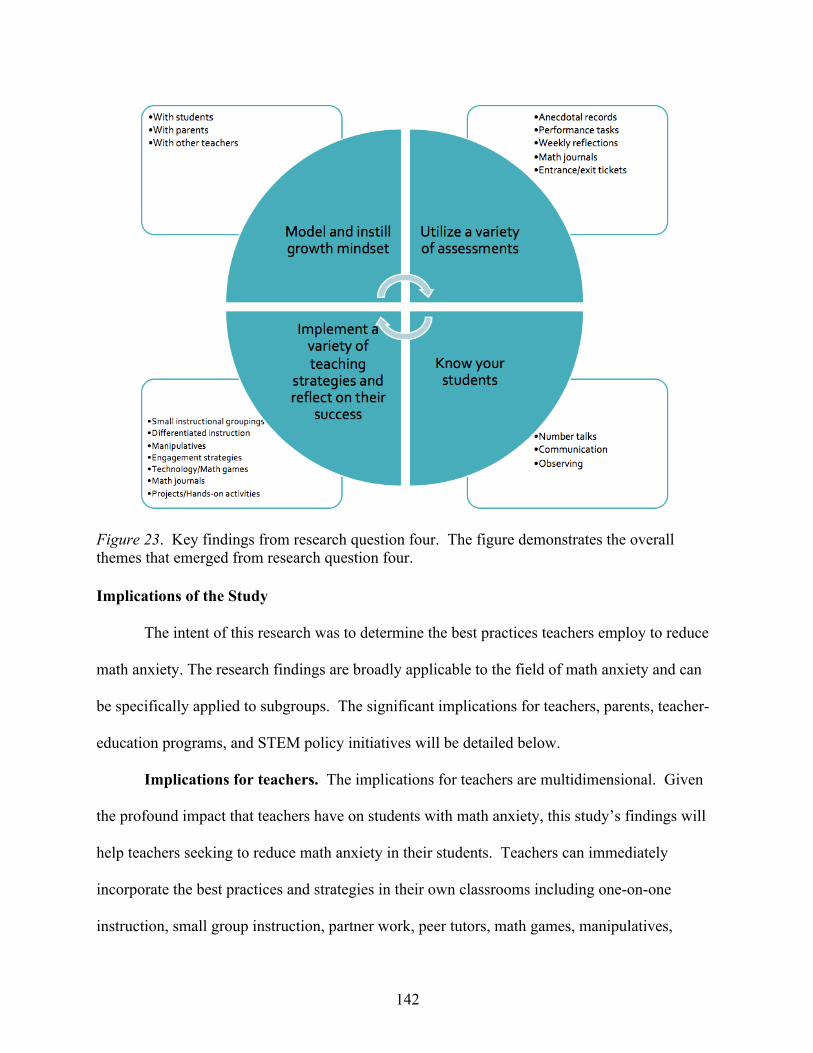
142
Figure 23. Key findings from research question four. The figure demonstrates the overall themes that emerged from research question four. Implications of the Study
The intent of this research was to determine the best practices teachers employ to reduce
math anxiety. The research findings are broadly applicable to the field of math anxiety and can
be specifically applied to subgroups. The significant implications for teachers, parents, teacher-
education programs, and STEM policy initiatives will be detailed below.
Implications for teachers. The implications for teachers are multidimensional. Given
the profound impact that teachers have on students with math anxiety, this study’s findings will
help teachers seeking to reduce math anxiety in their students. Teachers can immediately
incorporate the best practices and strategies in their own classrooms including one-on-one
instruction, small group instruction, partner work, peer tutors, math games, manipulatives,
143
technology, engagement strategies such as number talks and white boards, math journals,
differentiated instruction, and multiple problem-solving strategies. The best practices are all
more successful when done in the context of a safe classroom environment with an abundance of
attention and encouragement.
In addition, this study’s findings and the literature will help educate teachers on the
difference that mindset makes on math achievement. Since growth mindset reduces math
anxiety and increases math achievement, teachers can promote and model growth mindset in
their classrooms. The findings provide practical ways for growth mindset training such as
bulletin boards, vocabulary, quotes, and books. At the same time, teachers can focus on process
praise and praising for effort instead of praising for grades or high achievement. Teachers can
also encourage mistakes and teach students how mistakes actually help their brains to grow.
Finally, lead and mentor teachers can use these findings to educate other teachers and
parents. They can educate other teachers about mindset. Even if another teacher is not ready to
implement growth mindset training in her classroom, she can work on having a growth mindset
herself, so she can best help ensure her students’ success. Also, a team of teachers can conduct
parent nights to educate parents on growth mindset and how best to help their child with math
homework. An individual teacher can even add information about math anxiety and growth
mindset in their weekly or monthly parent newsletter.
Implications for parents. Parents may not realize words they say in passing may be
detrimental to their children. The research findings have implications for parents because
parents can learn to say, “I’m so proud of you. You studied so hard for the test and made
multiple attempts to solve the challenge problem.” Parents can also understand that no math
gene exists. Even if the parent struggled with math, it does not mean the student will always
144
struggle. The student may need more time and has not learned the concept yet. Parents impact
their children and it is important that parents have a positive attitude toward math.
Implications for teacher-education programs. There are two significant implications
for teacher-education programs resulting from this study. First, multiple-subject teaching
programs should have a math anxiety component in their math methods course. Preservice
teachers should have the opportunity to learn about math anxiety, understand how to detect it,
and understand how to address it. They can use the direct advice for new teachers that the
participants in this study shared.
In addition, this study’s findings provided multiple alternative strategies to running a
successful classroom and reducing math anxiety. Instead of a professor lecturing the preservice
teachers on how to teach math, the professor can run the class as if it were an elementary
classroom. The professor can have rotations, incorporate model engagement strategies, use
manipulatives, and play math games. The preservice teachers can learn by doing.
Implications for STEM policy initiatives. Finally, the research findings have
implications for STEM policy initiatives. More and more elementary schools and school
districts have started STEM programs. Within these programs, teachers and policy makers can
add a math anxiety and growth mindset component. By reducing math anxiety, more students
can have the option to pursue more training and courses in STEM field.
On a state or national scale, advertisements and commercials can be designed to promote
growth mindset and provide helpful math homework tips for parents. They can air on PBS, cable
television, or a radio network. It is important that parents, teachers, and communities have a
united front when talking about math and reducing math anxiety.
145
Recommendations for Teachers and Parents
The purpose of this study was to determine best practices and strategies in reducing math
anxiety. The literature review and teacher interviews provided a variety of approaches that
teachers can continue to implement or begin to implement in their daily instruction to make a
concerted effort in helping reduce math anxiety in their students. Many of the strategies can be
implemented at home, so parents can work with their children as well. Teachers and parents can
work as a team to best support students in reducing math anxiety, while encouraging and
increasing growth mindset.
Recommendations for teachers. The data provide best strategies that teachers can
immediately incorporate in their classrooms to help reduce math anxiety. While some educators
may be familiar with these practices, other teachers may face the challenge of time when
designing activities such as alternative assessments, differentiated centers for math rotation, and
entrance/exit tickets. To help educate teachers on best practices to reduce math anxiety and to
overcome the challenges of time, differentiation, and alternative assessments, the researcher
recommends a math anxiety inservice for teachers led by a qualified presenter. The inservice
should be held during professional development time so teachers are not asked to attend an
additional meeting outside the school day. The inservice should be introduced with a brief
overview of math anxiety, including the development of and consequences of the
phenomenon. In addition, time would be spent explaining the difference between growth and
fixed mindset. Teachers will also need to complete a math anxiety scale to help determine their
level of math anxiety and a mindset quiz to help gauge their degree of growth mindset versus
fixed mindset.
146
The presenter should use various engagement strategies during the workshop such as
think-pair-share, word splash, white boards, and thumbs up/thumbs down to model engagement
strategies that the teachers can directly incorporate in their classrooms the following day.
Various hands-on math games should be played using dice and playing cards, and discussions
should take place on how to differentiate the games across grade levels and math readiness.
Teachers may have the option to engage in a sample number talk to practice reasoning their way
through a mathematical situation. It is recommended that ample time is set aside for creative
development to collaborate with colleagues, develop classroom posters and graphics, and/or
write entrance and exit tickets. A reflective math growth mindset journal including various
graphics and quotes should be given to all teachers and the last five minutes of the inservice used
for self-reflection. All teachers would leave the inservice with their reflective journal, a list of
growth mindset book recommendations to read with their students, a packet of entrance/exit
tickets that can be used with their students and are adaptable across grade levels, a list of
engagement strategies with descriptions, number talks, and math game instructions and
templates. It is highly suggested that teachers use their reflection journals on a weekly basis to
note successful strategies, student observations during math, adaptations to make on various
math lessons, and personal reflections based on changes they see when consciously focusing on
engaging all students and modeling growth mindset.
Recommendations for parents. Similar to the teacher inservice, the researcher
recommends conducting parent workshops led by a qualified presenter in the community at
schools, places of worship, and parent association meetings. The goal of the parent workshops is
to teach parents about growth mindset versus fixed mindset, play math games that parents can
play at home with their own children, model higher-order thinking skills questions, and discuss
147
how parent’s fear of math and own math anxiety affect children negatively. The presenter
should begin by sharing several scenarios about math anxiety that parents would find relatable.
It is recommended that parents would have the opportunity to meet other parents at their tables
and to share their own experiences with math. To help determine their level of math anxiety and
to help gauge their degree of growth mindset versus fixed mindset, it is suggested that parents
complete both a math anxiety scale and a mindset quiz. The presenter would then read a
children’s literature book illustrating a math topic, such as The Greedy Triangle by Marilyn
Burns that explores shapes and basic geometry principles.
Following the introductory portion of the workshop, the presenter should guide the
parents to the games portion. During this segment, parents would play four hands-on math
games with a partner at their table. Playing with a partner models how the parent would play the
game with his child. All games use simple materials such as dice, and spinner, and playing
cards. At the end of each game, the presenter should model questioning and strategy discussion,
so the parent can connect with the child in the same manner. The presenter should also offer
multiple ways to differentiate the games for age and current ability. At the conclusion of the
workshop, it is recommended that all parents would have the opportunity to write down their
takeaways and what they plan to implement immediately at home. All parents should leave the
workshop with a list of growth mindset phrases to use, a list of children’s literature books
divided my math strand, a list of children’s growth mindset books for read alouds, directions to
the hands-on math games, a set of dice, a deck of playing cards, a spinner template, and a list of
higher order thinking questions. Holding a parent workshop would help overcome the math
anxiety challenge of parents since education and practice is the best way to change behavior.
Parents may learn how to better assist their child with math homework, praise effort and the
148
process, and encourage mistakes. A follow-up workshop would be scheduled if there is sufficient
interest.
Recommendations for Future Research
While this research study focused on best practices for reducing math anxiety in first
through sixth grade children, it creates opportunities for additional research. The following are
recommended as future areas for research:
• More in-depth study to explore best practices in reducing math anxiety. Expand the
number of school districts to target various districts across Orange County.
• Design a study that uses students as participants to explore student feedback
regarding math anxiety. Students take a math anxiety inventory to determine level of
math anxiety. Implement best practices and strategies from this study for one
semester. Students take another math anxiety inventory and compare.
• Design a longitudinal study of students, teachers, and parents. Measure math anxiety
at the beginning. Implement the best strategies to reduce math anxiety in the
classroom. Provide growth mindset training with the students for one year. Follow-
up with another math anxiety inventory.
Final Thoughts
The researcher had a genuine desire to interview the teachers for this study. The
participants were transparent and provided well-thought responses. They were eager to help and
share what practices they currently used in their classroom. For some of the participants, they
were not able to incorporate one or more of the best practices in their classroom due to time or
resources. However, they still knew it was worthwhile to share.

149
As the focus on STEM education continues and the need for STEM careers increase,
more students are needed to succeed in math courses. Since math anxiety is a large predictor of
math achievement, it is important to work with teachers and parents to reduce math anxiety in
students. The primary goal is for students to feel safe while learning, confident of their abilities,
and believe they can succeed in math with continued effort and perseverance. Students need to
think and talk about numbers, engage in their own learning, and discuss problem-solving
strategies with their peers. Students should understand mathematics conceptually instead of
memorizing algorithms and procedures. All students have the capability to increase their
confidence and to succeed in math. Thinking mathematically will propel students into the future.
150
REFERENCES
Aagaard, J. (2017). Introducing postphenomenological research: A brief and selective sketch of
phenomenological research methods. International Journal of Qualitative Studies in
Education, 30(6), 519-533. doi:10.1080/09518398.2016.1263884
Adams, C., & van Manen, M. A. (2017). Teaching phenomenological research and writing.
Qualitative Health Research, 27(6), 780-791. doi:10.1177/1049732317698960
Adams, J. W., & Hitch, G. J. (1998). Children’s mental arithmetic and working memory. In C.
Donlan (Ed.), The development of mathematical skills (pp. 153-173). East Sussex, UK:
Psychology Press.
Akin, A., & Kurbanoglu, I. N. (2013). The relationships between math anxiety, math attitudes,
and self-efficacy: A structural equation model. Studia Psychologica, 53(3), 263-273.
Retrieved from https://www.researchgate.net/publication/264550653_
The_relationships_between_math_anxiety_math_attitudes_and_self-
efficacy_A_structural_equation_model
Aksu, Z., Ozkaya, M., Gedik, S. D., & Konyalioglu, A. C. (2016). Mathematics self-efficacy and
mistake-handling learning as predictors of mathematics anxiety. Journal of Education
and Training Studies, 4(8), 65-71. doi:10.11114/jets.v4i8.1533
Albano, A. M., Chorpita, B. F., & Barlow, D. H. (2003). Childhood anxiety disorders. In E. J.
Mash, & R. A. Barkley (Eds.), Child psychopathology (pp 279-329). New York, NY:
Guilford Press.
Anderson, C. (2010). Presenting and evaluating qualitative research. American Journal of
Pharmaceutical Education, 74(8), Art. 141. doi:10.5688/aj7408141
151
Aronson, J., Fried, C. B. & Good, C. (2002). Reducing the effects of stereotype threat on African
American college students by shaping theories of intelligence. Journal of Experimental
Social Psychology, 38(2), 113-125. http://dx.doi.org/10.1006/jesp.2001.1491
Ashcraft, M. H. (1995). Cognitive psychology and simple arithmetic: A review and summary of
new directions. Mathematical Cognition, 1(1), 3-34. Retrieved from
https://www.researchgate.net/publication/245684531_Cognitive_psychology_and_simple
_arithmetic_A_review_and_summary_of_new_directions
Ashcraft, M. H. (2002). Math anxiety: Personal, educational, and cognitive consequences.
Current Directions in Psychological Science, 11(5), 181-185.
doi:10.1111/1467-8721.00196
Ashcraft, M. H. (2005). Math anxiety and its cognitive consequences: A tutorial review. In J. I.
D. Campbell (Ed.), The handbook of mathematical cognition (pp. 315-330). New York,
NY: Psychology Press.
Ashcraft, M. H., & Faust, M. W. (1994). Mathematics anxiety and mental arithmetic
performance: An exploratory investigation. Cognition and Emotion, 8(2), 97-125.
doi:10.1080/02699939408408931
Ashcraft, M. H., & Kirk, E. P. (2001). The relationships among working memory, math anxiety,
and performance. Journal of Experimental Psychology: General, 130(2), 224-237.
doi:10.1037/0096-3445.130.2.224
Ashcraft, M. H., Kirk, E. P., & Hopko, D. (1998). On the cognitive consequences of mathematics
anxiety. In C. Donlan (Ed.), The development of mathematical skills. (p. 175-196). East
Sussex, UK: Psychology Press.
152
Ashcraft, M. H., & Krause, J. A. (2007). Working memory, math performance and math anxiety.
Psychonomic Bulletin and Review, 14(2), 243-248. doi:10.3758/BF03194059
Baddeley, A. (2000). The episodic buffer: A new component of working memory? Trends in
Cognitive Sciences, 4(11), 417-423. doi:10.1016/s1364-6613(00)01538-2
Bandura, A. (1977). Self-efficacy: Toward a unifying theory of behavioral change.
Psychological Review, 84(2), 191-215. doi:10.1037//0033-295x84.2.191
Bandura, A. (1986). Social foundations of thought and action: A social cognitive theory.
Englewood Cliffs, NJ: Prentice-Hall.
Barrett, S., & Heubeck, B. G. (2000). Relationships between school hassles and uplifts and
anxiety and conduct problems in grades 3 and 4. Journal of Applied Developmental
Psychology, 21(5), 537-554. doi:10.1016/s0193-3973(00)00053-8
Beck, C. T., & Watson, S. (2008). Impact of birth trauma on breast-feeding - A tale of two
pathways. Nursing Research, 57(4), 228-236. doi:10.1097/01.nnr.0000313494.87282.90
Beilock, S. L., Gunderson, E. A., Ramirez, G., & Levine, S. C. (2010). Female teachers' math
anxiety affects girls' math achievement? Proceedings of the National Academy of
Sciences, 107(5), 1860-1863. doi:10.1073/pnas.0910967107
Beilock, S. L., & Maloney, E. A. (2015). Math anxiety: A factor in math achievement not to be
ignored. Behavioral and Brain Sciences, 2(1), 4-12. doi:10.1177/2372732215601438
Benbow, C. P. (1988). Sex differences in mathematical reasoning ability in intellectually talented
preadolescents: Their nature, effects, and possible causes. Behavioral and Brain Sciences,
1(1), 169-232. doi:10.1017/s0140525x00049244
Bernard, H. R. (2002). Research methods in anthropology: Qualitative and quantitative
approaches (3rd ed.). Walnut Creek, CA: Alta Mira Press.
153
Biddix, J. P. (n.d.). Research rundowns: Instrumentation, validity, reliability. Retrieved from
https://researchrundowns.com/quantitative-methods/instrument-validity-reliability/
Bigdeli, S., & Bai, H. (2009). The triunal model of anxiety and its application to anxiety
reduction in learning and teaching environments. TESL Canada Journal, 27(1), 103-114.
doi:10/18806/tesl.v27i1.1029
Blackwell, L., Tzesniewski, K., & Dweck, C. S. (2007). Implicit theories of intelligence
predict achievement across an adolescent transition: A longitudinal study and an
intervention. Child Development, 78(1), 245-263. doi:10.1111/j.1467-8624.2007.00995.x
Blazer, C. (2011). Strategies for reducing math anxiety. Information Capsule, 1102, 1-8.
Research Services, Miami-Dade County Public Schools. Retrieved from
https://eric.ed.gov/?id=ED536509
Boaler, J. (2013a). Ability and mathematics: The mindset revolution that is reshaping education.
Forum, 55(1), 143-152. doi:10.2304.forum.2013.55.1.143
Boaler, J. (2013b). Ability grouping in mathematics classrooms. In S. Lerman (Ed.),
Encyclopedia of Mathematics Education. Heidelberg, Germany: Springer.
Boaler, J. (2016). Mathematical mindsets: Unleashing students’ potential through creative
math, inspiring messages and innovative teaching. San Francisco, CA: Jossey-Bass.
Bragger, J. D., Kutcher, E., Morgan, J., & Firth, P. (2002). The effects of the structured
interview on reducing biases against pregnant job applicants. Sex Roles, 46(7-8), 215-
226. doi:10.1023/a:1019967231059
Brainerd, C. J. (1983). Young children's mental arithmetic errors: A working-memory analysis.
Child Development, 54(4), 813-830. doi:10.2307/1129887
154
Brutus, S., Aguinis, H., & Wassmer, U. (2013). Self-reported limitations and future directions in
scholarly reports: Analysis and recommendations. Journal of Management, 39(1), 48-75.
doi:10.1177/0149206312455245
Buckley, P. A., & Ribordy, S. C. (1982). Mathematics anxiety and the effects of evaluative
instructions on math performance. Minneapolis, MN: Midwestern Psychological
Association.
Burns, M. (1998). Math facing an American phobia. Sausalito, CA: Math Solutions Publications.
Burris, C., Heubert, J., & Levin, H. (2006). Accelerating mathematics achievement using
heterogeneous grouping. American Educational Research Journal, 43(1), 137-154.
doi:10.3102/00028312043001105.
Bybee, R. W. (2013). The case for STEM education: Challenges and opportunities. Arlington,
VA: NSTA Press.
Cal, A. (2017). Innovative pedagogy: What are the best practices of professors in STEM,
leadership, or professional programs who integrate literature? (Doctoral dissertation).
Retrieved from ProQuest Dissertations & Theses Global. (AAT 10634606)
Carey, E., Hill, F., Devine, A., & Szücs, D. (2016). The chicken or the egg? The direction of the
relationship between mathematics anxiety and mathematics performance. Frontiers in
Psychology, 6, 1-6. doi:10.3389/fpsyg.2015.01987
Carey, E., Hill, F., Devine, A., & Szücs, D. (2017). The modified abbreviated math anxiety
scale: A valid and reliable instrument for use with children. Frontiers in Psychology, 8,
1-13. doi:10.3389/fpsyg.2017.00011
155
Casad, B. J., Hale, P., & Wachs, F. L. (2015). Parent-child math anxiety and math-gender
stereotypes predict adolescents' math education outcomes. Frontiers in Psychology, 6,
1-21. doi:10.3389/fpsyg.2015.01597
Castillo-Montoya, M. (2016). Preparing for interview research: The interview protocol
refinement framework. The Qualitative Report, 21(5), 811-831. Retrieved from
http://nsuworks.nova.edu/tqr/vol21/iss5/2
Chansky, T. E., & Kendall. P. C. (1997). Social expectancies and self-perceptions in anxiety-
disordered children. Journal of Anxiety Disorders, 11(4), 347-363.
doi:10.1016/s0887-6185(97)00015-7
Chin, S. (2009). Mathematics anxiety in secondary students in England. Dyslexia, 15(1), 61-68.
doi:10.1002/dys.381
Cimpian, A., Arce, H. M., Markman, E. M., & Dweck, C. S. (2007). Subtle linguistic
cues impact children's motivation. Psychological Science, 18(4), 314-316.
doi:10.1111/j.1467-9280.2007.01896.x
Cooper, S. E., & Robinson, D. A (1991). The relationship of mathematics self-efficacy beliefs to
mathematics anxiety and performance. Measurement and Evaluation in Counseling and
Development, 24(1), 4-11. Retrieved from http://web.a.ebscohost.com
Coplan, R. J., Girardi, A., Findlay, L. C., & Frohlick, S. L. (2007). Understanding solitude:
Young children's attitudes and responses towards hypothetically socially withdrawn
peers. Social Development, 16(3), 390-409. doi:10.1111/j.1467-9507.2007.00390.x
156
Costello, J. E., Egger, H. L., & Angold, A. (2004). Developmental epidemiology of anxiety
disorders. In T. H. Ollendick, & J. S. March (Eds.), Phobic and anxiety disorders in
children and adolescents: A clinician's guide to effective psychosocial and
pharmacological Interventions (pp. 61-91). New York, NY: Oxford University Press.
Coyne, I. T. (1997). Sampling in qualitative research. Purposeful and theoretical sampling;
merging or clear boundaries? Journal of Advanced Nursing, 26(3), 623-630.
doi:10.1111/1365-2648.ep4514143
Creswell, J. W. (2013). Qualitative inquiry and research design: Choosing among five
approaches. Thousand Oaks, CA: Sage.
Creswell, J. W. (2014). Research design: Qualitative, quantitative, and mixed methods
approaches. Thousand Oaks, CA: Sage.
Creswell, J. W., & Miller, D. L. (2000). Determining validity in qualitative inquiry. Theory into
Practice, 39(3), 124-130. doi:10.1207/s15430421tip3903_2
Creswell, J. W., & Plano Clark, V. L. (2011). Designing and conducting mixed method research
(2nd ed.). Thousand Oaks, CA: Sage.
David L. (2015). Mindset theory – Fixed vs. growth mindset (Dweck) in Learning Theories.
Retrieved from https://www.learning-theories.com/mindset-theory-fixed-vs-growth-
mindset-dweck.html
Davis, T. E., Ollendick, T. H., & Nebel-Schwalm, M. (2008). Intellectual ability and
achievement in anxiety-disordered children: A clarification and extension of the
literature. Journal of Psychopathology and Behavioral Assessment, 30(1), 43-51.
doi:10.1007/s10862-007-9072-y
157
Dar-Nimrod, I., & Heine, S. J. (2006). Exposure to scientific theories affects women's math
performance. Science, 314(5798), 435. doi:10.1126.science.1131100
De Wet, C. (2010). The reasons for and the impact of principal-on-teacher bullying on the
victims’ private and professional lives. Teaching and Teacher Education, 26(7),
1450-1459. doi:10.1016/j.tate.2010.05.005
Dehaene, S. (2011). The number sense: How the mind creates mathematics. New York, NY:
Oxford University Press.
Denzin, N. K., & Lincoln, Y. S. (2011). Introduction: The discipline and practice of qualitative
research. In N. K. Denzin & Y. S. Lincoln (Eds.), The Sage handbook of qualitative
research (pp. 1-19). Thousand Oaks, CA: Sage.
Derakshan, N., & Eysenck, M. W. (2009). Anxiety, processing efficiency, and cognitive
performance: New developments from attentional control theory. European Psychologist,
14(2), 168-176. doi:10.1027/1016-9040.14.2.168
Devine, A., Fawcett, K., Szűcs, D., & Dowker, A. (2012). Gender differences in mathematics
anxiety and the relation to mathematics performance while controlling for test anxiety.
Behavioral and Brain Functions, 8(33), 1-9. doi: 10.1186/1744-9081-8-33
DiCicco-Bloom, B., & Crabtree, B. F. (2006). The qualitative research interview. Medical
Education, 40, 314-321. doi:10.1111/j.1365-2929.2006.02418.x
Durrheim, K. (2006). Research design. In M. T. Blanche, K. Durrheim, & D. Painter (Eds.),
Research in practice: Applied methods for the social sciences (pp. 33-59). Cape Town,
South Africa: University of Cape Town Press.
Dweck, C. S. (2000). Self theories: Their role in motivation, personality, and development. New
York, NY: Taylor & Francis Group.
158
Dweck, C. S. (2007). The secret to raising smart kids. Scientific American: Mind, 12, 36-43.
doi:10.1038.scientificamericanmind1207-36
Dweck, C. S. (2008). Mindsets and math/science achievement. Retrieved from
http://www.growthmindsetmaths.com/uploads/2/3/7/7/23776169/mindset_and_math_scie
nce_achievement_-_nov_2013.pdf
Dweck, C. S. (2016). Mindset: The new psychology of success. New York, NY: Ballantine
Books.
Elliot, A. J., & Dweck, C. S. (2013). Handbook of competence and motivation. New York, NY:
Guilford.
Englander, M. (2012). The interview: Data collection in descriptive phenomenological human
scientific research. Journal of Phenomenological Psychology, 43, 13-35.
doi:10.1163/156916212x632943
Engle, R. W. (2002). Working memory capacity as executive attention. Current Directions in
Psychological Science, 11(1), 19-23. doi:10.1111/1467-8721.00160 English, L. D. (2016). STEM education K-12: Perspectives on integration. International Journal
of STEM Education, 3(3), 1-8. doi:10.1186/s40594-016-0036-1
Ericsson, K. A., Charness, N., Feltovich, P.J., & Hoffman, R.R. (Eds.) (2006). The Cambridge
Handbook of Expertise and Expert Performance. New York, NY: Cambridge University
Press.
Estapa, A. T., & Tank, K. M. (2017). Supporting integrated STEM in the elementary classroom:
A professional development approach centered on an engineering design challenge.
International Journal of STEM Education, 4(6), 1-16. doi:10.1186/s40594-017-0058-3
159
Faust, M. W., Ashcraft, M. H., & Fleck, D. E. (1996). Mathematics anxiety effects in simple and
complex addition. Mathematical Cognition, 2(1), 25-62. doi:10.1080/135467996387534
Ferguson, A. M., Maloney, E. A., Fugelsang, J., & Risko, E. F. (2015). On the relation between
math and spatial anxiety: The case of math anxiety. Learning and Individual Differences,
39, 1-12. doi:10.1016/j.lindif.2015.02.007
Fontana, A., & Frey, J. H. (2000). The interview: From structured questions to negotiated text. In
N. K. Denzin, & Y. S. Lincoln (Eds.), Handbook of qualitative research (2nd ed.,
pp. 645-672). Thousand Oaks, CA: Sage.
Friedman, T. L. (2007). The World is flat: A brief history of the twenty first century. New York,
NY: Picador.
Furner, J. M., & Duffy. M. L. (2002). Equity for all students in the new millennium: Disabling
math anxiety. Intervention in School and Clinic, 38(2), 67-74.
doi:10.1177/10534512020380020101
Furner, J. M., & Gonzalez-DeHass, A. (2011). How do students' mastery and performance goals
relate to math anxiety? EURASIA Journal of Mathematics, Science & Technology
Education, 7(4), 227-242. doi:10.12973/ejmste/75209
Geary, D. C., & Widaman, K. F. (1987). Individual differences in cognitive arithmetic. Journal
of Experimental Psychology: General, 116(2), 154-171.
doi:10.1037/0096-3445.116.2.154
Geary, D. C. (1993). Mathematical disabilities: Cognitive, neuropsychological, and genetic
components. Psychological Bulletin, 114(2), 345-362.
doi: 10.1037//0033-2909.114.2.345
160
Geist, E. (2010). The anti-anxiety curriculum: Combating math anxiety in the classroom.
Journal of Instructional Psychology, 37(1), 24-31. Retrieved from
http://web.a.ebscohost.com
Gierl, M. J., & Bisanz, J. (1995). Anxieties and attitudes related to mathematics in grades 3 and
6. Journal of Experimental Education, 63, 139-158.
doi:10.1080/00220973.1995.9943818
Giorgi, A. (1997). The theory, practice, and evaluation of the phenomenological method as a
qualitative research procedure. Journal of Phenomenological Psychology, 28(2),
235-260. doi:10.1163/156916297X00103
Giorgi, A. (2009). The descriptive phenomenological method in psychology: A modified
Husserlian approach. Pittsburgh, PA: Duquesne University Press.
Good, C., Aronson, J. & Inzlich, M. (2003). Improving adolescents’ standardized test
performance: An intervention to reduce the effects of stereotype threat. Applied
Developmental Psychology, 24(6), 645-662. doi:10.1016/j.appdev.2003.09.002
Gonzalez, H. B. & Kuenzi, J. (2012). Congressional research service science, technology,
engineering, and mathematics (STEM) education: A primer, p. 2. Retrieved from
http://www.stemedcoalition.org/wp-content/uploads/2010/Q5/STEM-Education-
Primer.pdf
Gray, D. E. (2009). Doing research in the real world. Thousand Oaks, CA: Sage.
Gresham, G. (2004). A study of mathematics anxiety in pre-service teachers. Early Childhood
Education Journal, 35(2), 181-188. doi:10.1007/s10643-007-0174-7
161
Gresham, G. (2007). An invitation into the investigation of the relationship between mathematics
anxiety and learning styles in elementary preservice teachers. Journal of Invitational
Theory and Practice, 13, 24-33. Retrieved from https://files.eric.ed.gov/
fulltext/EJ791538.pdf
Guba, E. G., & Lincoln. Y. S. (1988). Do inquiry paradigms imply inquiry methodologies? In
D. M. Fetterman (Ed.), Qualitative approaches to evaluation in education (pp. 89-115).
New York, NY: Praeger.
Guest, G., Bunce, A., & Johnson, L. (2006). How many interviews are enough? An experiment
with data saturation and variability. Field Methods, 18(1), 59-82.
doi:10.1177/1525822x05279903
Guetterman, T. (2015). Descriptions of sampling practices within five approaches to qualitative
research in education and the health sciences. Forum Qualitative Sozialforschung /
Forum: Qualitative Social Research, 16(2), Art. 25.
doi:http://dx.doi.org/10.17169/fqs-16.2.2290
Gunderson, E. A., Ramirez, G., Levine, S. C., & Beilock, S: L. (2012). The role of parents and
teachers in the development of gender-related math attitudes. Sex Roles, 66(3), 153-166.
doi:10.1007/s11199-011-9996-2
Gutbezahl, J. (1995). How negative expectancies and attitudes undermine females’ math
confidence and performance: A review of the literature. Amherst, MA: University of
Massachusetts.
Halpern, D. F., Benbow, C. R, Geary, D. C, Gur, R. C, Hyde, J. S., & Gemsbacher, M. A.
(2007). Sex, math, and scientific achievement. Scientific American Mind, 18, 44-51.
doi:10.1038/scientificamericanmind1207-44
162
Harari, R. R., Vukovic, R. K., & Bailey, S. P. (2013). Mathematics anxiety in young children:
An exploratory study. Journal of Experimental Education, 81(4), 538-555.
doi:10.1080/00220973.2012.727888
Hargreaves, A. & Fullan, M. (2012). Professional Capital: Transforming Teaching in Every
School. New York, NY: Teacher’s College Press.
Hatch, J. A. (2002). Doing qualitative research in education settings. Albany, NY: State
University of New York Press.
Hembree, R. (1990). The nature, effects, and relief of mathematics anxiety. Journal for Research
in Mathematics Education, 21(1), 33-46. doi:10.2307/749455
Herlitz, G. N. (1994). The meaning of the term “prima facie.” Louisiana Law Review, 55(2),
391-408. Retrieved from https://digitalcommons.law.lsu.edu/
cgi/viewcontent.cgi?article=5569&context=lalrev
Hitch, G. J. (1978a). Mental arithmetic: Short-term storage and information processing in a
cognitive skill. In A. M. Lesgold, J. W. Pellegrino, S. D. Fokkema, & R. Glaser (Eds.),
Cognitive psychology and instruction (pp. 331-338). New York, NY: Plenum.
Hitch, G. J. (1978b). The role of short-term working memory in mental arithmetic. Cognitive
Psychology, 10(3), 302-323. doi:10.1016/0010-0285(78)90002-6
Hodges, H. (1983). Learning styles: Rx for mathophobia. Arithmetic Teacher, 30(7), 17-20.
Retrieved from https://www.jstor.org/stable/41190643
Hoepfl, M. (1997). Choosing qualitative research: A primer for technology education
researchers. Journal of Technology Education, 9(1). Retrieved from
http://scholar.lib.vt.edu/ejournals/JTE/v9n1/hoepfl.html
163
Hoffman, B. (2010). “I think I can, but I’m afraid to try”: The role of self-efficacy beliefs and
mathematics anxiety in mathematics problem-solving efficiency. Learning and Individual
Differences, 20(3), 276-283. doi:10.1016/j.lindif.2010.02.001
Hopko, D. R., Mahadevan, R., Bare, R. L., & Hunt, M. K. (2003). The abbreviated math anxiety
scale (AMAS): Construction, validity, and reliability. Assessment, 10(2), 178-182.
doi:10.1177/1073191103252351
Horsburgh, D. (2003). Evaluation of qualitative research. Journal of Clinical Nursing, 12(2),
307-312. doi:10.1046/j.1365-2702.2003.00683.x
Hyde, J. S., Fennema, E., & Lamon, S. J. (1990). Gender differences in mathematical
performance: A meta-analysis. Psychological Bulletin, 107(2), 139-155.
doi:10.1037//0033-2909.107.2.139
Hyde, J. S., Fennema, E., Ryan, M., Frost, L. A., & Hopp, C. (1990). Gender comparisons of
mathematics attitudes and affect. Psychology of Women Quarterly, 14(3), 299-324.
doi:10.1111/j.1471-6402.1990.tb00022.x
Ialongo, N., Edelsohn, G., Werthamer-Larsson. L., Crockett, L., & Kellam, S. (1994). The
significance of self-reported anxious symptoms in first-grade children. Journal of
Abnormal Child Psychology, 22(4), 441-455. doi:10.1007/bf02168084
Ialongo, N., Edelsohn, G., Werthamer-Larsson, L., Crockett, L., & Kellam, S. (1995). The
significance of self-reported anxious symptoms in first grade children: Prediction to
anxious symptoms and adaptive functioning in fifth grade. Journal of Child Psychology
and Psychiatry, 36(3), 427-437. doi:10.1111/j.1469-7610.1995.tb01300.x
164
Ialongo, N., Edelsohn, G., Werthamer-Larsson, L., Crockett, L., & Kellam, S. (1996). Social and
cognitive impairment in first-grade children with anxious and depressive symptoms.
Journal of Clinical Child Psychology, 25(1), 15-24. doi:10.1207/s15374424jccp2501_2
Jackson, C. D., & Leffingwell, R. J. (1999). The role of instructor in creating math anxiety in
students from kindergarten through college. Mathematics Teacher, 92(7), 583-586.
Retrieved from https://www-jstor-org.lib.pepperdine.edu/stable/27971118
Jackson, E. (2008). Mathematics anxiety in student teachers. Practitioner Research in Higher
Education, 2(1), 36-42. Retrieved from http://insight.cumbria.ac.uk/id/eprint/91/
Jain, S., & Dowson, M. (2009). Mathematics anxiety as a function of multidimensional self-
regulation. Contemporary Educational Psychology, 34(3), 240-249. Retrieved from
https://pdfs.semanticscholar.org/63d4/a3dcf633c1b21177f859a058852a975241d6.pdf
Jameson, M. M. (2014). Contextual factors related to math anxiety in second-grade children.
Journal of Experimental Education, 82(4), 518-536. doi:10.1080/00220973.2013.813367
Jamshed, S. (2014). Qualitative research method-interviewing and observation. Journal of Basic
and Clinical Pharmacy, 5(4), 87-88. doi:10.4103/0976-0105.141942
Jarrett, M., Black, A., Rapport, H., Grills-Taquechel, A., & Ollendick, T. (2015). Generalized
anxiety disorder in younger and older children: Implications for learning and school
functioning. Journal of Child & Family Studies, 24(4), 992-1003.
doi:10.1007/s10826-014-9910-y
Jarrett, M. A., Wolff, J. C., Davis, T. E. III, Cowart, M. J., & Ollendick, T. H. (2016).
Characteristics of children with ADHD and comorbid anxiety. Journal of Attention
Disorders, 20(7), 636-644. doi:10.1177/1087054712452914
165
Karni, A., Meyer. G., Rey-Hipolito, C., Jezzard, P., Adams, M., Turner, R., & Ungerleider, L.
(1998). The acquisition of skilled motor performance: Fast and slow experience-drive
changes in primary motor cortex. PNAS, 95(3), 861-868. doi:10.1073/pnas.95.3.861
Kashani, J. H., & Orvaschel, H. (1990). A community study of anxiety in children and
adolescents. American Journal of Psychiatry, 147(3), 313-318. doi:10.1176/ajp.147.3.313
Kazelskis, R., Reeves, C., Kersh, M. E., Bailey, G., Cole, K., Larmon, M., Holliday, D. C.
(2000). Mathematics anxiety and test anxiety: separate constructs? The Journal of
Experimental Education, 68(2), 137-146. doi:10.1080/00220970009598499
Kennedy, T. J., & Odell, M. R. L. (2014). Engaging students in STEM education. Science
Education International, 25(3), 246-258. Retrieved from
https://files.eric.ed.gov/fulltext/EJ1044508.pdf
Kirkland, H. (2016). 'Maths anxiety': Isn't it just a dislike for learning mathematics? Mathematics
Teaching, 250, 11-13. Retrieved from https://www.coursehero.com/file/20457830/to-
short-and-it-is-good/
Kulkin, M. (2016). Math is like a scary movie? Helping young people overcome math anxiety.
Afterschool Matters, 23, 28-32. Retrieved from https://files.eric.ed.gov/
fulltext/EJ1095916.pdf
Leahey, E., & Guo, G. (2001). Gender differences in mathematical trajectories. Social Forces,
80(2), 713-732. doi:10.1353.sof.2001.0102
Leedy, P. D. & Ormrod, J. E. (2010). Practical Research: Planning and Design (9th ed.).
New York, NY: Merrill.
166
Lent, R. W., Brown, S. W., & Larkin, K. C. (1984). Relation self-efficacy expectations to
academic achievement and persistence. Journal of Counseling Psychology, 31(3),
352-362. doi:10.1037//0022-0167.31.3.356
Louw, S., Todd, R. W., & Jimakorn, P. (n.d.). Active listening in qualitative research interviews.
Proceedings from International Conference: Doing Research in Applied Linguistics.
Retrieved from http://arts.kmutt.ac.th/dral/PDF%20proceedings%20on%20Web/71-
82_Active_Listening_in_Qualitative_Research_Interviews.pdf
Luo, W., Hogan, D., Tan, L. S., Kaur, B., Ng, P. T., & Chan, M. (2014). Self-construal and
students’ math self-concept, anxiety and achievement: an examination of achievement
goals as mediators. Asian Journal of Social Psychology, 17(3), 184-195.
doi:10.1111/ajsp.l2058
Ma, X. (1999). A meta-analysis of the relationship between anxiety toward mathematics and
achievement in mathematics. Journal for Research in Mathematics Education, 30(5),
520-540. doi:10.2307/749772
Ma, X., & Xu, J. (2004). The causal ordering of mathematics anxiety and mathematics
achievement: A longitudinal panel analysis. Journal of Adolescence, 27(2), 165-179.
doi:10.1016/j.adolescence. 2003.11.003
MacQueen, K. M., McLellan-Lernal, E., Bartholow, K., & Milstein, B. (2008). Team-based
codebook development: Structure, process, and agreement. In G. Guest & K. M.
MacQueen (Eds.), Handbook for team-based qualitative research (pp. 119-35). Lanham,
MD: AltaMira Press.
167
Maguire, E., Woollett, K., & Spiers, H. (2006). London taxi drivers and bus drivers: A structural
MRI and neuropsychological analysis. Hippocampus, 16(12), 1091-1101.
doi:10.1002/hipo.20233
Maloney, E. A., Ansari, D., & Fugelsang, J. A. (2011). The effect of mathematics anxiety on the
processing of numerical magnitude. The Quarterly Journal of Experimental Psychology,
64(1), 10-16. doi:10.1080/17470218.2010.533278
Maloney, E. A., & Beilock, S. L. (2012). Math anxiety: Who has it, why it develops, and how to
guard against it. Trends in Cognitive Sciences, 16(8), 404-406.
doi:10.1016/j.tics.2012.06.008
Maloney, E. A., Ramirez, G., Gunderson, E. A., Levine, S. C., & Beilock, S. L. (2015).
Intergenerational effects of parents’ math anxiety on children’s math achievement and
anxiety. Psychological Science, 26(9), 1480-1488. doi:10.1177/0956797615592630
Maloney, E. A., Risko, E. F., Ansari, D., & Fugelsang, J. (2010). Mathematics anxiety affects
counting but not subitizing during visual enumeration. Cognition, 114(2), 293-297.
doi:10.1016/j.cognition.2009.09.013
Maloney, E. A., Waechter, S., Risko, E. F., & Fugelsang, J. A. (2012). Reducing the sex
difference in math anxiety: The role of spatial processing ability. Learning and Individual
Differences, 22(3), 380-384. doi:10.1016/j.lindif.2012.01.001
Martins, D. C. (2008). Experiences of homeless people in the health care delivery system: A
descriptive phenomenological study. Public Health Nursing, 25(5), 420-430.
doi:10.1111/j.1525-1446.2008.00726.x
168
McKenna, J. S., & Nickols, S. Y. (1988). Planning for retirement security: What helps or hinders
women in the middle years? Home Economics Research Journal, 17(2), 153-164.
doi:10.1177/1077727x8801700204
McMullan, M., Jones, R., & Lea, S. (2012). Math anxiety, self- efficacy, and ability in British
undergraduate nursing students. Research in Nursing & Health, 35(2), 178-186.
doi:10.1002/nur.21460
Meece, J. L., Wigfield, A., & Eccles, J. S. (1990). Predictors of math anxiety and its influence on
young adolescents’ course enrollment intentions and performance in mathematics.
Journal of Educational Psychology, 82(1), 60-70. doi: 10.1037/0022-0663.82.1.60
Meeks, D. (1997). Mathematics anxiety and community college mathematics course completion.
Doctoral dissertation, Northern Arizona University, 1997. Dissertation Abstracts
International, 58, 711. Retrieved from ProQuest Dissertations & Theses Global.
Miller, H., & Bichsel, J. (2004). Anxiety, working memory, gender, and math performance.
Personality and Individual Differences, 37(3), 591-606. doi:10.1016/j.paid.2003.09.029
Moerer-Urdahl, T., & Creswell, J. (2004). Using transcendental phenomenology to explore the
"ripple effect" in a leadership mentoring program. International Journal of Qualitative
Methods, 3(2), 19-35. doi:10.1177/160940690400300202
Moser, J. S., Schroder, H. S., Heeter, C., Moran, T. P., & Lee, Y. (2011). Mind your errors:
Evidence for a neural mechanism linking growth mind-set to adaptive post error
adjustments. Psychological Science, 22(12), 1484-1489. doi:10.1177/0956797611419520
Moustakas, C. (1994). Phenomenological research methods. Thousand Oaks, CA: Sage.
Murnane, R. J., & Levy, F. (1996). Teaching the new basic skills: Principles for educating
children to thrive in a changing economy. Glencoe, IL: Free Press.
169
Mychailyszyn, M. P., Mendez, J. L., & Kendall, P. C. (2010). School functioning in youth with
and without anxiety disorders: Comparisons by diagnosis and comorbidity. School
Psychology Review, 39(1), 106-121. Retrieved from http://web.b.ebscohost.com
National Mathematics Advisory Panel. (2008). Foundations for success: The final report of the
National Mathematics Advisory Panel. Washington, DC: US Department of Education.
Retrieved from https://www2.ed.gov/about/bdscomm/list/mathpanel/report/final-
report.pdf
National Research Council. (2011). Successful K-12 STEM education: Identifying effective
approaches in science, technology, engineering, and mathematics. Washington, DC: The
National Academies Press. doi: https://doi.org/10.17226/13158
National Science Board. (2008). Science and engineering indicators 2008. Two volumes.
Arlington, VA: National Science Foundation (Vol. 1, NSB 08-01; Vol. 2, NSB 08-0IA).
National Science Foundation. (2007). Asia’s rising science and technology strength:
Comparative indicators for Asia, the European Union, and the United States. NSF 07-
319. Arlington, VA: Author.
Nelson, L. J., Rubin, K. H., & Fox, N. A. (2005). Social withdrawal observed peer acceptance,
and the development of self-perceptions in children ages 4 to 7 years. Early Childhood
Research Quarterly, 20(2), 185-200. doi:10.1016/j.ecresq.2005.04.007
Pajares, F., & Graham, L. (1999). Self-efficacy, motivation constructs, and mathematics
performance of entering middle school students. Contemporary Educational Psychology,
24(2), 124-139. doi:10.1006.ceps.1998.0991
170
Palinkas, L. A., Horwitz, S. M., Green, C. A., Wisdom, J. P., Duan, N., & Hoagwood, K. (2015).
Purposeful sampling for qualitative data collection and analysis in mixed method
implementation research. Administration and Policy in Mental Health and Mental Health
Services Research, 42(5), 533-544. doi:10.1007/s10488-013-0528-y
Park, D., Ramirez, G., & Beilock, S. L. (2014). The role of expressive writing in math anxiety.
Journal of Experimental Psychology: Applied, 20(2), 103-111. doi:10.1037/xap0000013
Patton, M. Q. (1990). Qualitative evaluation and research methods (2nd ed.). Thousand Oaks,
CA: Sage.
Patton, M. Q. (2002). Qualitative research and evaluation methods (3rd ed.). Thousand Oaks,
CA: Sage.
Paulos, J. (1988). Innumeracy: Mathematical illiteracy and its consequences. New York, NY:
Hill and Wang.
Phillips, G. W. (2007). Chance favors the prepared mind: Mathematics and science indicators
for comparing states and nations. Washington, DC: American Institutes for Research.
Retrieved from https://eric.ed.gov/?id=ED498980
Pinnegar, S., & Daynes, J. G. (2007). Locating narrative inquiry historically: Thematics in the
turn to narrative. In D. J. Clandinin (Ed.), Handbook of narrative inquiry: Mapping a
methodology (pp. 3-34). Thousand Oaks, CA: Sage.
Pletzer, B., Wood, G., Scherndl, T., Kerschbaum, H. H., & Nuerk, H. (2016). Components of
mathematics anxiety: Factor modeling of the MARS30-brief. Frontiers in Psychology,
7(91), 1-14. doi:10.3389/fpsyg.2016.00091
171
Preskorn, S. H., Macaluso, M., & Trivedi, M. (2015). How commonly used inclusion and
exclusion criteria in antidepressant registration trials affect study enrollment. Journal of
Psychiatric Practice, 21(4), 267. doi:10.1097/PRA.0000000000000082
Program for International Student Assessment (PISA). (2012). PISA 2012 results in focus. What
15-year-olds know and what they can do with what they know. Paris, France: OECD.
Rajendran, N. S. (2001, Oct 25-26). Dealing with biases in qualitative research: A balancing act
for researchers. Paper presented at Qualitative Research Convention 2001: Navigating
Challenges, University of Malaya, Kuala Lumpur. Retrieved from
https://pdfs.semanticscholar.org/24c3/2ed0dea86ee3459f00c4a4f03dcad4921362.pdf
Ramirez, G., & Beilock, S. L. (2011). Writing about testing worries boosts exam performance in
the classroom. Science, 331, 211-213. doi:10.1126/science.1199427
Ramirez, G., Chang, H., Maloney, E. A., Levine, S. C., & Beilock, S. L. (2016). On the
relationship between math anxiety and math achievement in early elementary school: The
role of problem solving strategies. Journal of Experimental Child Psychology, 141,
83-100. doi:10.1016/j.jecp.2015.07.014
Ramirez, G., Gunderson, E. A., Levine, S. C., & Beilock, S. L. (2013). Math anxiety, working
memory, and math achievement in early elementary school. Journal of Cognition &
Development, 14(2), 187-202. doi:10.1080/15248372.2012.664593
Rheinberg, F., Vollmeyer, R., & Rollett, W. (2000). Motivation and action in self- regulated
learning. In M. Boekaerts, P. Pintrich & M. Zeidner (Eds.), Handbook of self-regulation
(pp.503-529). San Diego, CA: Academic.
Richardson, F. C., & Suinn, R. M. (1972). The mathematics anxiety rating scale: Psychometric
data. Journal of Counseling Psychology, 19(6), 551-554. doi:10.1037/h0033456
172
Roehrig, G. H., Moore, T. J., Wang, H. H., & Park, M. S. (2012). Is adding the E enough?:
Investigating the Impact of K-12 engineering standards on the implementation of STEM
integration. School of Engineering Education Faculty Publications. Paper 6.
http://dx.doi.0rg/lO.llll/j.1949-8594.2011.00112
Rubin, H. J., & Rubin, I. S. (2012). Qualitative interviewing: The art of hearing data (3rd ed.).
Thousand Oaks, CA: Sage.
Ruff, S. E., & Boes, S. R. (2014). The sum of all fears: The effects of math anxiety on math
achievement in fifth grade students and the implications for school counselors. Georgia
School Counselors Association Journal, 21(1). Retrieved from
https://files.eric.ed.gov/fulltext/EJ1084441.pdf
Sahlberg, P. (2011). Finnish Lessons: What can the world learn from educational change in
Finland? (Series on School Reform). New York, NY: Teachers College Press.
Saldana, J. (2013). The coding manual for qualitative researchers (2nd ed.). Thousand Oaks,
CA: Sage.
Salinas, T. M. (2004). Effects of reflective notebooks on perceptions of learning and
mathematics anxiety. Primus, 14(4), 315-327. doi:10.1080/10511970408984096
Sandelowski, M. (1995). Sample size in qualitative research. Research in Nursing & Health,
18(2), 179-183. doi:10.1002/nur.4770180211
Sarantakos, S. (2005). Social research (3rd ed.). New York, NY: Palgrave Macmillan.
Scarpello, G. (2007). Helping students get past math anxiety. Techniques: Connecting Education
and Careers, 82(6), 34-35. Retrieved from https://files.eric.ed.gov/fulltext/EJ775465.pdf
173
Schmidt, W. H., & Houang, R. T. (2007). Lack of focus in the mathematics curriculum: A
symptom or a cause? In T. Loveless (Ed.), Lessons learned: What international
assessments tell us about math achievement (pp. 65-84). Washington, DC: Brookings
Institution Press.
Seidman, I. (2013). Interviewing as qualitative research: A guide researchers in education and
the social sciences (4th ed.). New York, NY: Teachers College Press.
Shores, M., & Shannon, D. (2007). The effects of self-regulation, motivation, anxiety, and
attributions on mathematics achievement for fifth and sixth grade students. School
Science and Mathematics. 107(6), 225-236. doi:10.1111/j.1949-8594.2007.tb18284.x
Singh, K., Granville, M. & Dika, S. (2002). Mathematics and science achievement: Effects of
motivation, interest, and academic engagement. Journal of Educational Research, 95,
323-332. doi:10.1080/00220670209596607
Sloan, T., Daane, C. J., & Giesen, J. (2002). Mathematics anxiety and learning styles: What is
the relationship in elementary preservice teachers? School Science and Mathematics,
102(2), 84-87. doi:10.1111/j.1949-8594.2002.tb17897.x
Soni, A., & Kumari, S. (2017). The role of parental math anxiety and math attitude in their
children's math achievement. International Journal of Science and Mathematics
Education, 15(2), 331-347. doi:10.1007/s10763-015-9687-5
Sparks, S. D. (2015). Intergenerational effects of parents' math anxiety on children's math
anxiety and achievement. Education Week, 35(1), 5. Retrieved from
http://web.a.ebscohost.com
Stajkovic, A., & Luthans, F. (1998). Self-efficacy and work-related performance: A meta-
analysis. Psychological Bulletin, 124(2), 240-261. doi:10.1037/0033-2909.124.2.240
174
Stigler, J. W. & Hiebert, J. (1999). The teaching gap. New York, NY: Free Press.
Stodolsky, S. S. (1985). Telling math: Origins of math aversion and anxiety. Educational
Psychologist, 20(3), 125-133. doi:10.1207/s15326985ep2003_2
Strauss, C. C., Frame, C. L., & Forehand. R. (1987). Psychosocial impairment associated with
anxiety in children. Journal of Clinical Child Psychology, 16(3), 235-239.
doi:10.1207/s15374424jccp1603_8
Swars, S. L., Daane, C. J., & Giesen, J. (2006). Mathematics anxiety and mathematics teacher
efficacy: What is the relationship in elementary preservice teachers? School Science and
Mathematics, 106(7), 306-315. doi:10.1111/j.1949-8594.2006.tb17921.x
Tobias, S., & Weissbrod, C. (1980). Anxiety and mathematics: An update. Harvard Educational
Review, 50(1), 63-70. doi:10.17763/haer.50.1.xw483257j6035084
Tooke, D. J., & Lindstrom, L. C. (1998). Effectiveness of a mathematics methods course in
reducing math anxiety of preservice elementary teachers. School Science and
Mathematics, 98(3), 136-139. doi:10.1111/j.1949-8594.1998.tb17406.x
Treacy, P., & O’Donoghue, J. (2014). Authentic integration: A model for integrating
mathematics and science in the classroom. International Journal of Mathematical
Education in Science and Technology, 45(5), 703-718.
doi:10.1080/0020739x.2013.868543
U.S. Department of Education. (1990-2007). National assessment of educational progress.
National Center for Educational Statistics. Retrieved from http://nces.ed.gov/
nationsreportcard/
175
Usher, E. L., & Pajares, F. (2009). Sources of self-efficacy in mathematics: A validation study.
Contemporary Educational Psychology, 34(1), 89-101.
doi:10.1016/j.cedpsych.2008.09.002
Valentine, J. C., DuBois, D. L., & Cooper, H. (2004). The relation between self-beliefs and
academic achievement: A meta-analytic review. Educational Psychologist, 39(2), 111-
133. doi:10.1207.s15326985ep3902_3
Vilorio, D. (2014). STEM 101: Intro to tomorrow’s jobs. Occupational Outlook Quarterly, 2-12.
Retrieved from https://www.bls.gov/careeroutlook/2014/spring/art01.pdf
Wilson, B. (2016). Engaging diversity: Best practices to create an inclusive work environment
(Doctoral dissertation). Retrieved from ProQuest Dissertations & Theses Global;
(1807413499).
Wolcott, H. F. (2010). Ethnography lessons: A primer. Walnut Creek, CA: Left Coast Press.
Wood, J. (2006) Effect of anxiety reduction on children’s school performance and social
adjustment. Developmental Psychology, 42(2), 345-349. doi:10.1037/0012-1649.42.2.345
Woodard, T. (2004). The effects of math anxiety on post-secondary developmental students as
related to achievement, gender, and age. Inquiry, 9(1), 1-5. Retrieved from
https://files.eric.ed.gov/fulltext/EJ876845.pdf
Woodward, L. J., & Fergusson, D. M. (2001). Life course outcomes of young people with
anxiety disorders in adolescence. Journal of the American Academy of Child and
Adolescent Psychiatry, 40(9), 1086-1093. doi:10.1097/00004583-200109000-00018
Woollett, K., & Maquire, E. A. (2011). Acquiring “The Knowledge” of London’s layout drives
structural brain changes. Current Biology, 21(24), 2109-2114.
doi:10.1016/j.cub.2011.11.018
176
Wu, S. S., Barth, M., Amin, H., Malcarne, V., Menon, V., Maloney, E. A., & Fugelsang, J.
(2012). Math anxiety in second and third graders and its relation to mathematics
achievement. Frontiers in Psychology, 3(162), 1-11. doi:10.3389/fpsyg.2012.00162
Yang Lin, Y. E., Durbin, J. M., & Rancer, A. S. (2016). Math anxiety, need for cognition, and
learning strategies in quantitative communication research methods courses.
Communication Quarterly, 64(4), 390-409. doi:10.1080/01463373.2015.1103294
Yee, D. K., & Eccles, J. S. (1988). Parent perceptions and attributions for children’s math
achievement. Sex Roles, 19(5/6), 317-333. doi:10.1007/bf00289840
Yildirim, B., & Selvi, M. (2015). Adaptation of STEM attitude scale to Turkish. Turkish Studies
– International Periodical for the Languages. Literature and History of Turkish or
Turkic, 10(3), 1107-1120. http://dx.doi.org/10.7827/TurkishStudies.7974
Young, C. B., Wu, S., & Menon, V. (2012). The neurodevelopmental basis of math anxiety.
Psychological Science, 23(5), 492-501. doi:10.1007/3-540-28082-0_3
Zettle, R., & Raines, S. (2002). The relationship of trait and test anxiety with mathematics
anxiety. College Student Journal, 34(2), 246-258. Retrieved from
http://web.a.ebscohost.com
Zimmerman, B. J. (2000). Self-efficacy: An essential motive to learn. Contemporary
Educational Psychology, 25(1), 82-91. doi:10.1006/ceps.1999.1016
Zubrzycki, J. (2017). How much math anxiety is too much? Education Week, 36(31), 10.
Retrieved from https://www.edweek.org/ew/articles/2017/05/17/how-much-math-
anxiety-is-too-much.html
177
APPENDIX A
IRB Approval Notice

178
APPENDIX B
IRB Citi Certificate
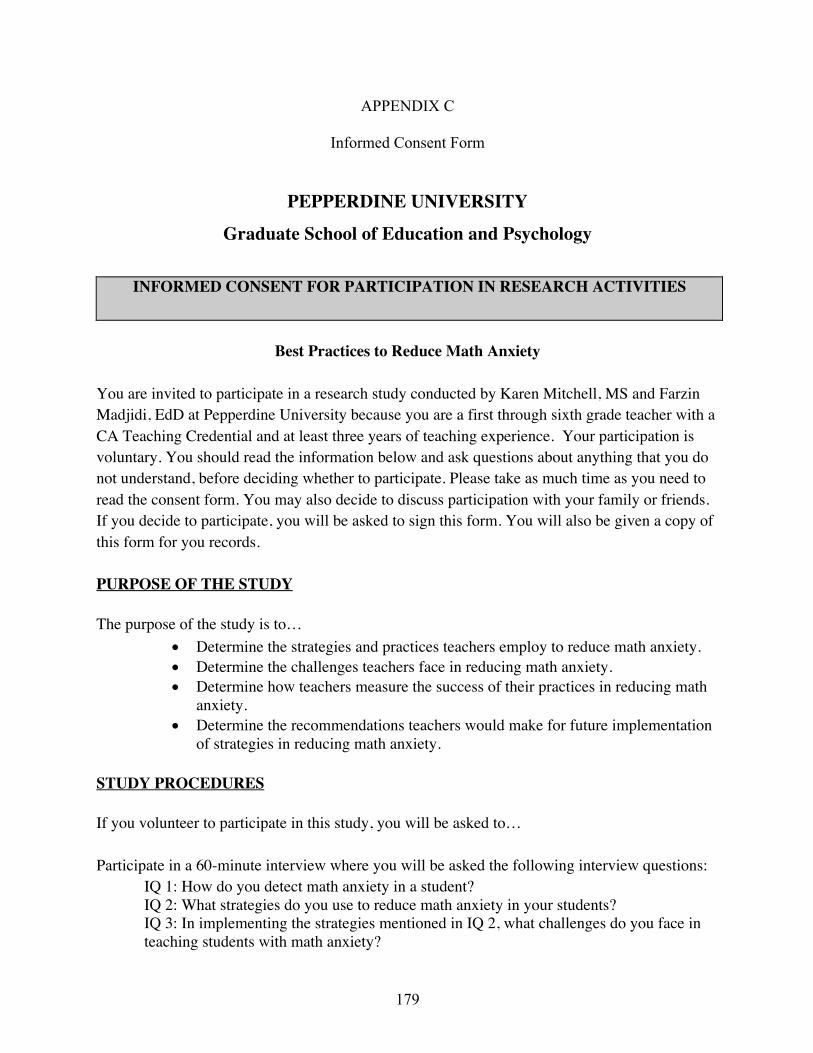
179
APPENDIX C
Informed Consent Form
PEPPERDINE UNIVERSITY
Graduate School of Education and Psychology
INFORMED CONSENT FOR PARTICIPATION IN RESEARCH ACTIVITIES
Best Practices to Reduce Math Anxiety
You are invited to participate in a research study conducted by Karen Mitchell, MS and Farzin Madjidi, EdD at Pepperdine University because you are a first through sixth grade teacher with a CA Teaching Credential and at least three years of teaching experience. Your participation is voluntary. You should read the information below and ask questions about anything that you do not understand, before deciding whether to participate. Please take as much time as you need to read the consent form. You may also decide to discuss participation with your family or friends. If you decide to participate, you will be asked to sign this form. You will also be given a copy of this form for you records. PURPOSE OF THE STUDY The purpose of the study is to…
• Determine the strategies and practices teachers employ to reduce math anxiety. • Determine the challenges teachers face in reducing math anxiety. • Determine how teachers measure the success of their practices in reducing math
anxiety. • Determine the recommendations teachers would make for future implementation
of strategies in reducing math anxiety. STUDY PROCEDURES If you volunteer to participate in this study, you will be asked to… Participate in a 60-minute interview where you will be asked the following interview questions:
IQ 1: How do you detect math anxiety in a student? IQ 2: What strategies do you use to reduce math anxiety in your students? IQ 3: In implementing the strategies mentioned in IQ 2, what challenges do you face in teaching students with math anxiety?
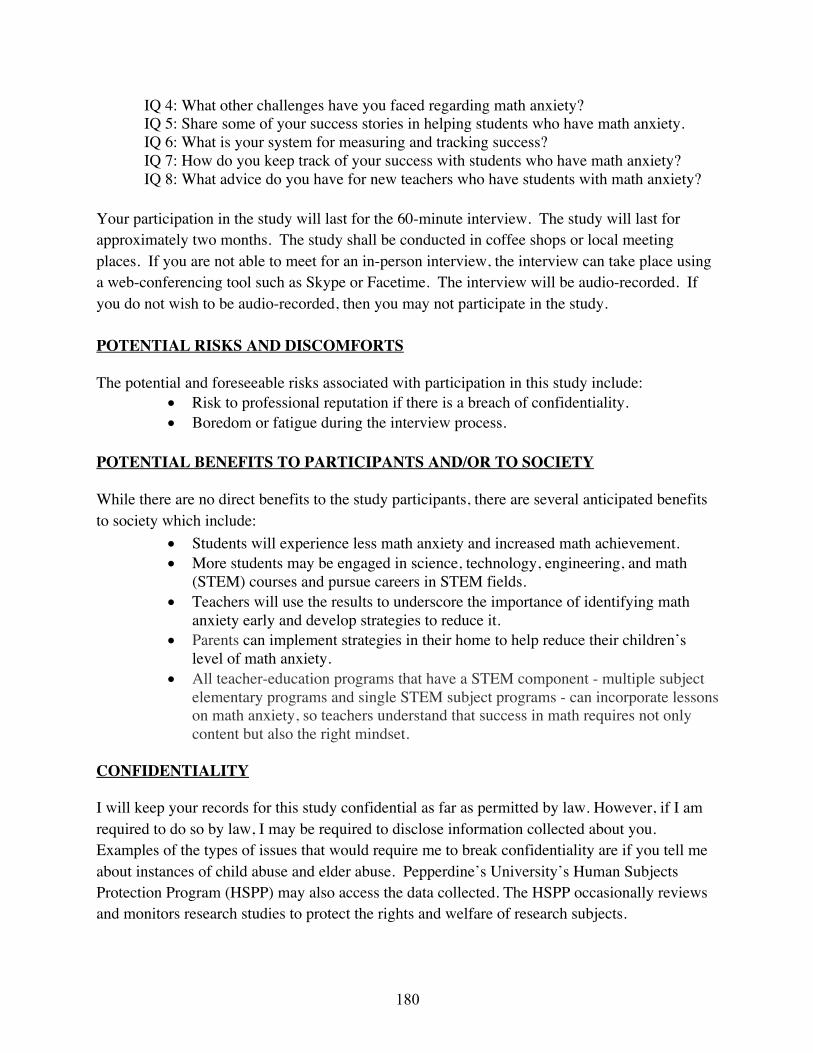
180
IQ 4: What other challenges have you faced regarding math anxiety? IQ 5: Share some of your success stories in helping students who have math anxiety. IQ 6: What is your system for measuring and tracking success? IQ 7: How do you keep track of your success with students who have math anxiety? IQ 8: What advice do you have for new teachers who have students with math anxiety?
Your participation in the study will last for the 60-minute interview. The study will last for approximately two months. The study shall be conducted in coffee shops or local meeting places. If you are not able to meet for an in-person interview, the interview can take place using a web-conferencing tool such as Skype or Facetime. The interview will be audio-recorded. If you do not wish to be audio-recorded, then you may not participate in the study. POTENTIAL RISKS AND DISCOMFORTS The potential and foreseeable risks associated with participation in this study include:
• Risk to professional reputation if there is a breach of confidentiality. • Boredom or fatigue during the interview process.
POTENTIAL BENEFITS TO PARTICIPANTS AND/OR TO SOCIETY While there are no direct benefits to the study participants, there are several anticipated benefits to society which include:
• Students will experience less math anxiety and increased math achievement. • More students may be engaged in science, technology, engineering, and math
(STEM) courses and pursue careers in STEM fields. • Teachers will use the results to underscore the importance of identifying math
anxiety early and develop strategies to reduce it. • Parents can implement strategies in their home to help reduce their children’s
level of math anxiety. • All teacher-education programs that have a STEM component - multiple subject
elementary programs and single STEM subject programs - can incorporate lessons on math anxiety, so teachers understand that success in math requires not only content but also the right mindset.
CONFIDENTIALITY I will keep your records for this study confidential as far as permitted by law. However, if I am required to do so by law, I may be required to disclose information collected about you. Examples of the types of issues that would require me to break confidentiality are if you tell me about instances of child abuse and elder abuse. Pepperdine’s University’s Human Subjects Protection Program (HSPP) may also access the data collected. The HSPP occasionally reviews and monitors research studies to protect the rights and welfare of research subjects.
181
The data will be stored on a password protected computer in the principal investigator’s place of residence. The data will be stored for a minimum of five years and then will be deleted using an eraser procedure. The data collected will be transcribed by only the researcher and then coded. Your responses will be coded with a numerical identifier and transcript data will be maintained separately. The audio recordings will be erased and destroyed within five years. Any identifiable information obtained in connection with this study will remain confidential. PARTICIPATION AND WITHDRAWAL Your participation is voluntary. Your refusal to participate will involve no penalty or loss of benefits to which you are otherwise entitled. You may withdraw your consent at any time and discontinue participation without penalty. You are not waiving any legal claims, rights or remedies because of your participation in this research study. ALTERNATIVES TO FULL PARTICIPATION The alternative to participation in the study is not participating or completing only the items which you feel comfortable. EMERGENCY CARE AND COMPENSATION FOR INJURY If you are injured as a direct result of research procedures you will receive medical treatment; however, you or your insurance will be responsible for the cost. Pepperdine University does not provide any monetary compensation for injury INVESTIGATOR’S CONTACT INFORMATION I understand that the investigator is willing to answer any inquiries I may have concerning the research herein described. I understand that I may contact Dr. Farzin Madjidi at Pepperdine University, 310-568-5600 or [email protected] if I have any other questions or concerns about this research. RIGHTS OF RESEARCH PARTICIPANT – IRB CONTACT INFORMATION If you have questions, concerns or complaints about your rights as a research participant or research in general please contact Dr. Judy Ho, Chairperson of the Graduate & Professional Schools Institutional Review Board at Pepperdine University 6100 Center Drive Suite 500 Los Angeles, CA 90045, 310-568-5753 or [email protected].
182
SIGNATURE OF RESEARCH PARTICIPANT
I have read the information provided above. I have been given a chance to ask questions. My questions have been answered to my satisfaction and I agree to participate in this study. I have been given a copy of this form. Name of Participant Signature of Participant Date SIGNATURE OF INVESTIGATOR
I have explained the research to the participants and answered all of his/her questions. In my judgment the participants are knowingly, willingly and intelligently agreeing to participate in this study. They have the legal capacity to give informed consent to participate in this research study and all of the various components. They also have been informed participation is voluntarily and that they may discontinue their participation in the study at any time, for any reason. Name of Person Obtaining Consent Signature of Person Obtaining Consent Date

183
APPENDIX D
Recruitment Script
Dear [Name], I am a doctoral student in the Organizational Leadership program within the Graduate School of Education and Psychology at Pepperdine University. As part of fulfilling my degree requirements, I am conducting a study regarding the best practices and strategies to reduce math anxiety in elementary students. I found your name and email from the XYZ Unified School District website. As a result of your contributions to the field of education, you have been carefully selected to participate. Participation in the study is voluntary and entails a 60-minute interview in person at a convenient location. Confidentiality will be maintained throughout the study. The questions that will be asked in the interview and an Informed Consent Form will be sent to you in advance of the interview. Your participation will be extremely valuable to other teachers, parents, and students in order to reduce math anxiety. Thank you for your participation, Karen Mitchell Pepperdine University Graduate School of Education and Psychology Status: Doctoral Student
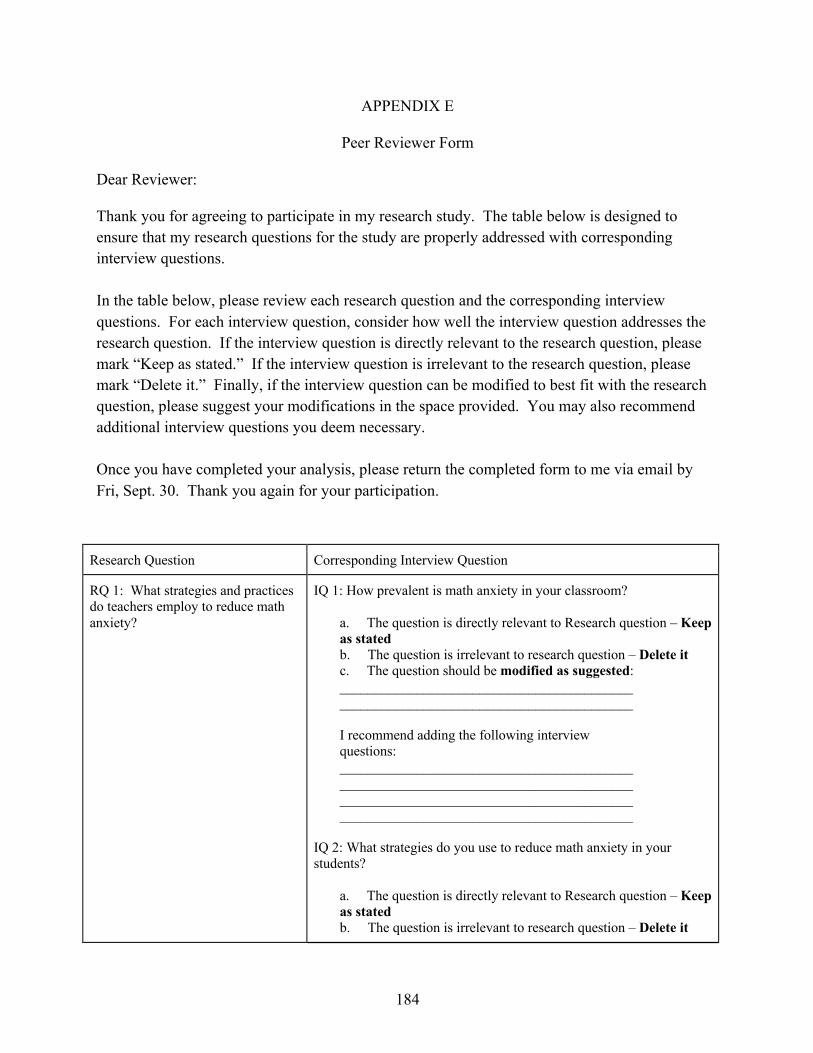
184
APPENDIX E
Peer Reviewer Form
Dear Reviewer:
Thank you for agreeing to participate in my research study. The table below is designed to ensure that my research questions for the study are properly addressed with corresponding interview questions. In the table below, please review each research question and the corresponding interview questions. For each interview question, consider how well the interview question addresses the research question. If the interview question is directly relevant to the research question, please mark “Keep as stated.” If the interview question is irrelevant to the research question, please mark “Delete it.” Finally, if the interview question can be modified to best fit with the research question, please suggest your modifications in the space provided. You may also recommend additional interview questions you deem necessary. Once you have completed your analysis, please return the completed form to me via email by Fri, Sept. 30. Thank you again for your participation.
Research Question Corresponding Interview Question
RQ 1: What strategies and practices do teachers employ to reduce math anxiety?
IQ 1: How prevalent is math anxiety in your classroom?
a. The question is directly relevant to Research question – Keep as stated b. The question is irrelevant to research question – Delete it c. The question should be modified as suggested: __________________________________________ __________________________________________ I recommend adding the following interview questions: __________________________________________ __________________________________________ __________________________________________ __________________________________________
IQ 2: What strategies do you use to reduce math anxiety in your students?
a. The question is directly relevant to Research question – Keep as stated b. The question is irrelevant to research question – Delete it
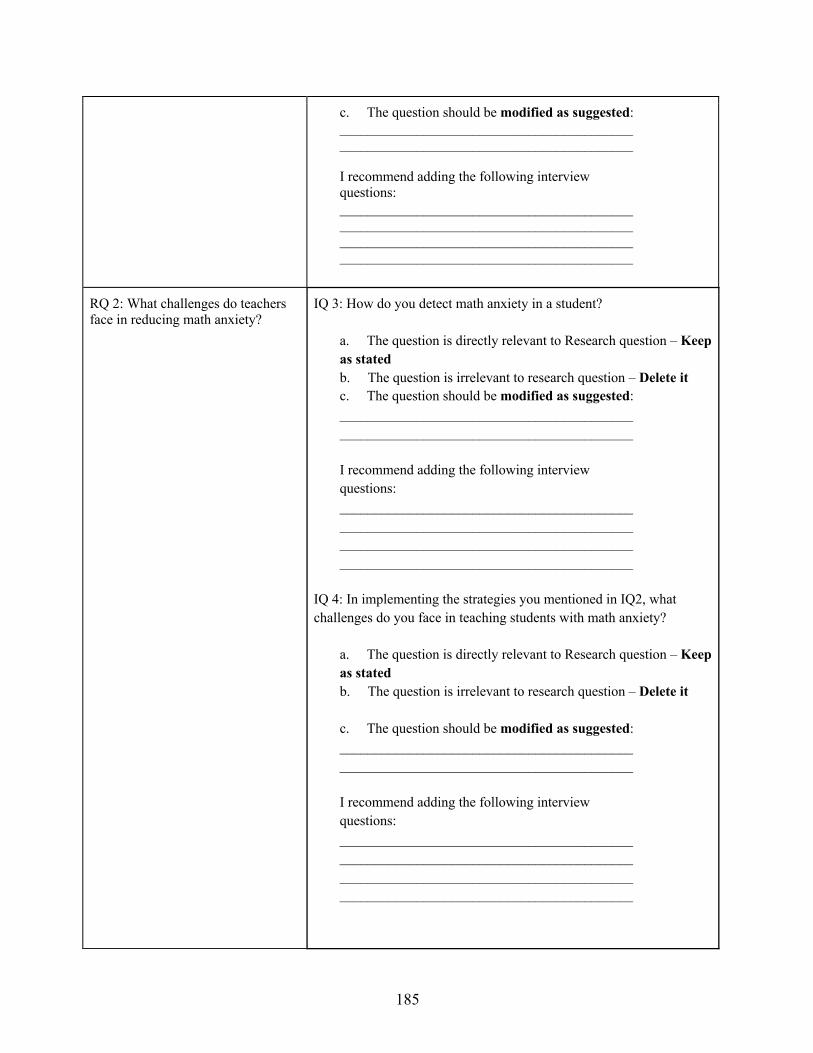
185
c. The question should be modified as suggested: __________________________________________ __________________________________________ I recommend adding the following interview questions: __________________________________________ __________________________________________ __________________________________________ __________________________________________
RQ 2: What challenges do teachers face in reducing math anxiety?
IQ 3: How do you detect math anxiety in a student?
a. The question is directly relevant to Research question – Keep as stated b. The question is irrelevant to research question – Delete it c. The question should be modified as suggested: __________________________________________ __________________________________________ I recommend adding the following interview questions: __________________________________________ __________________________________________ __________________________________________ __________________________________________
IQ 4: In implementing the strategies you mentioned in IQ2, what challenges do you face in teaching students with math anxiety?
a. The question is directly relevant to Research question – Keep as stated b. The question is irrelevant to research question – Delete it c. The question should be modified as suggested: __________________________________________ __________________________________________ I recommend adding the following interview questions: __________________________________________ __________________________________________ __________________________________________ __________________________________________
186
IQ 5: Are there other challenges that you have faced?
a. The question is directly relevant to Research question – Keep as stated b. The question is irrelevant to research question – Delete it c. The question should be modified as suggested: __________________________________________ __________________________________________ I recommend adding the following interview questions: __________________________________________ __________________________________________ __________________________________________ __________________________________________
RQ 3: How do teachers measure the success of their practices in reducing math anxiety?
IQ 6: Share some of your success stories in helping students who have math anxiety.
a. The question is directly relevant to Research question – Keep as stated b. The question is irrelevant to research question – Delete it c. The question should be modified as suggested: __________________________________________ __________________________________________ I recommend adding the following interview questions: __________________________________________ __________________________________________ __________________________________________ __________________________________________
IQ 7: What is your system for measuring and tracking success?
a. The question is directly relevant to Research question – Keep as stated b. The question is irrelevant to research question – Delete it c. The question should be modified as suggested: __________________________________________ __________________________________________
187
I recommend adding the following interview questions: __________________________________________ __________________________________________ __________________________________________ __________________________________________
RQ 4: What recommendations would teachers make for future implementation of strategies in reducing math anxiety?
IQ 8: If there was a student you could go back and help in math, what would you do differently?
a. The question is directly relevant to Research question – Keep as stated b. The question is irrelevant to research question – Delete it c. The question should be modified as suggested: __________________________________________ __________________________________________ I recommend adding the following interview questions: __________________________________________ __________________________________________ __________________________________________ __________________________________________
IQ 9: What advice do you have for new teachers who have students with math anxiety?
a. The question is directly relevant to Research question – Keep as stated b. The question is irrelevant to research question – Delete it c. The question should be modified as suggested: __________________________________________ __________________________________________ I recommend adding the following interview questions: __________________________________________ __________________________________________ __________________________________________ __________________________________________