Behavioral Programs as a Resource
AESP Fall Chapter Meeting, October 2013

Examples of “behavioral energy efficiency”
1% - 2.5% Reduction per
Household
0% - 9% Reduction per
Household

Actual or Planned Proportion of Electric Portfolio Savings for Behavioral Programs (%)
2011 2012 2013 2014Otter Tail Power Company 24.2% 27.4% 27.4% 6.6%PPL Electric Utilities 1.3% Indianapolis Power & Light 22.2%NIPSCO 18.6% 5.7% 4.7% Puget Sound Energy 8.3% ComEd 10.0% 9.9% 12.5%PNM 9.6% Ameren Illinois 9.8% 10.6% 11.6%Arizona Public Service 7.7% 6.7% FirstEnergy - Met-Ed 3.4% 8.2% Duke Energy 0.5% 3.9% National Grid 12.5% 14.6% Bonneville Power Administration
2.1%
Xcel Energy - Minnesota 2.4% 2.2% 2.7% 2.5%Xcel Energy - Colorado 4.3% 4.2% 7.8% FirstEnergy - West Penn Power
0.1% 1.3% 5.8%
Changing residential portfolios
Source: QuadROI

Behavior programs as a resource
Source
Duration
Cost to Acquire

What is the source of the savings?
Data points to as much as 40% of savings associated with physical measures
Estimated savings breakdown: Measures: 40% Behaviors: 60%
Treatment customers reported greater measure-based actions compared to control group, including: consumer electronics, building envelope, low-cost measures
4 Year SMUD OPower Impact Evaluation, Integral Analytics 2013
MA Three-year Cross-cutting Behavioral Program Evaluation, Opinion Dynamics with Navigant Consulting, 2012
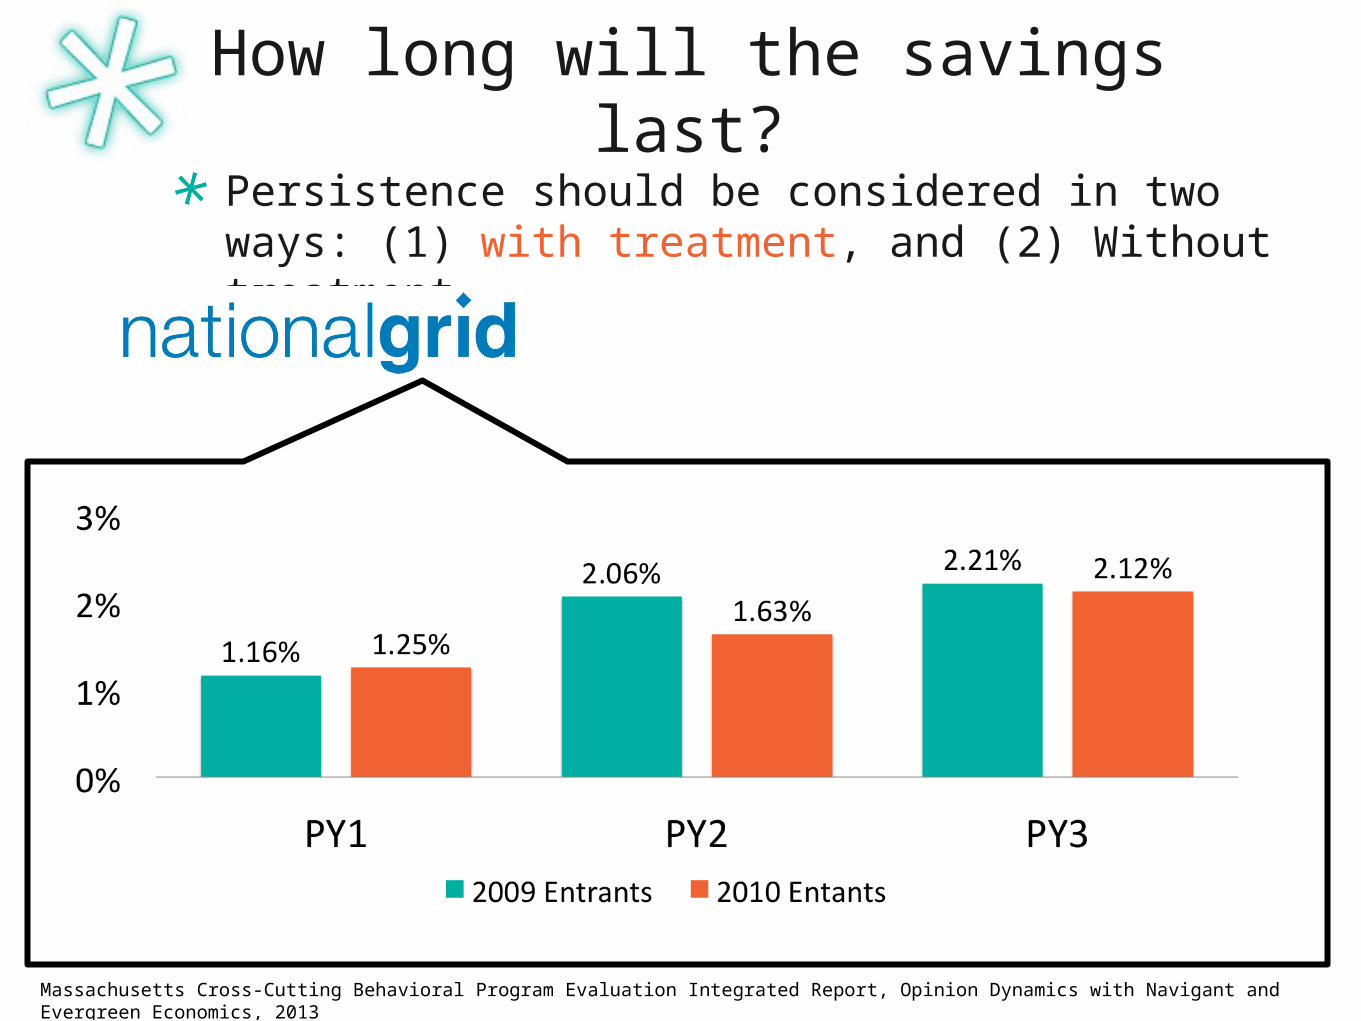
How long will the savings last?Persistence should be considered in two ways: (1) with treatment, and (2) Without treatment
Massachusetts Cross-Cutting Behavioral Program Evaluation Integrated Report, Opinion Dynamics with Navigant and Evergreen Economics, 2013

How long will the savings last?
Persistence should be considered in two ways: (1) with treatment, and (2) without treatment
• Savings with treatment per household: 2.8%• Percent reduction in savings after two years
without treatment: 39%
Puget Sound Energy’s Home Energy Reports 2012 Impact Evaluation, KEMA 2013

Years
kWh
~25 yrs
~15 yrs
~5 yrs
?
How long will the savings last?

Massachusetts Cross-Cutting Behavioral Program Evaluation Integrated Report, Opinion Dynamics with Navigant and Evergreen Economics, 2013
How long will the savings last?
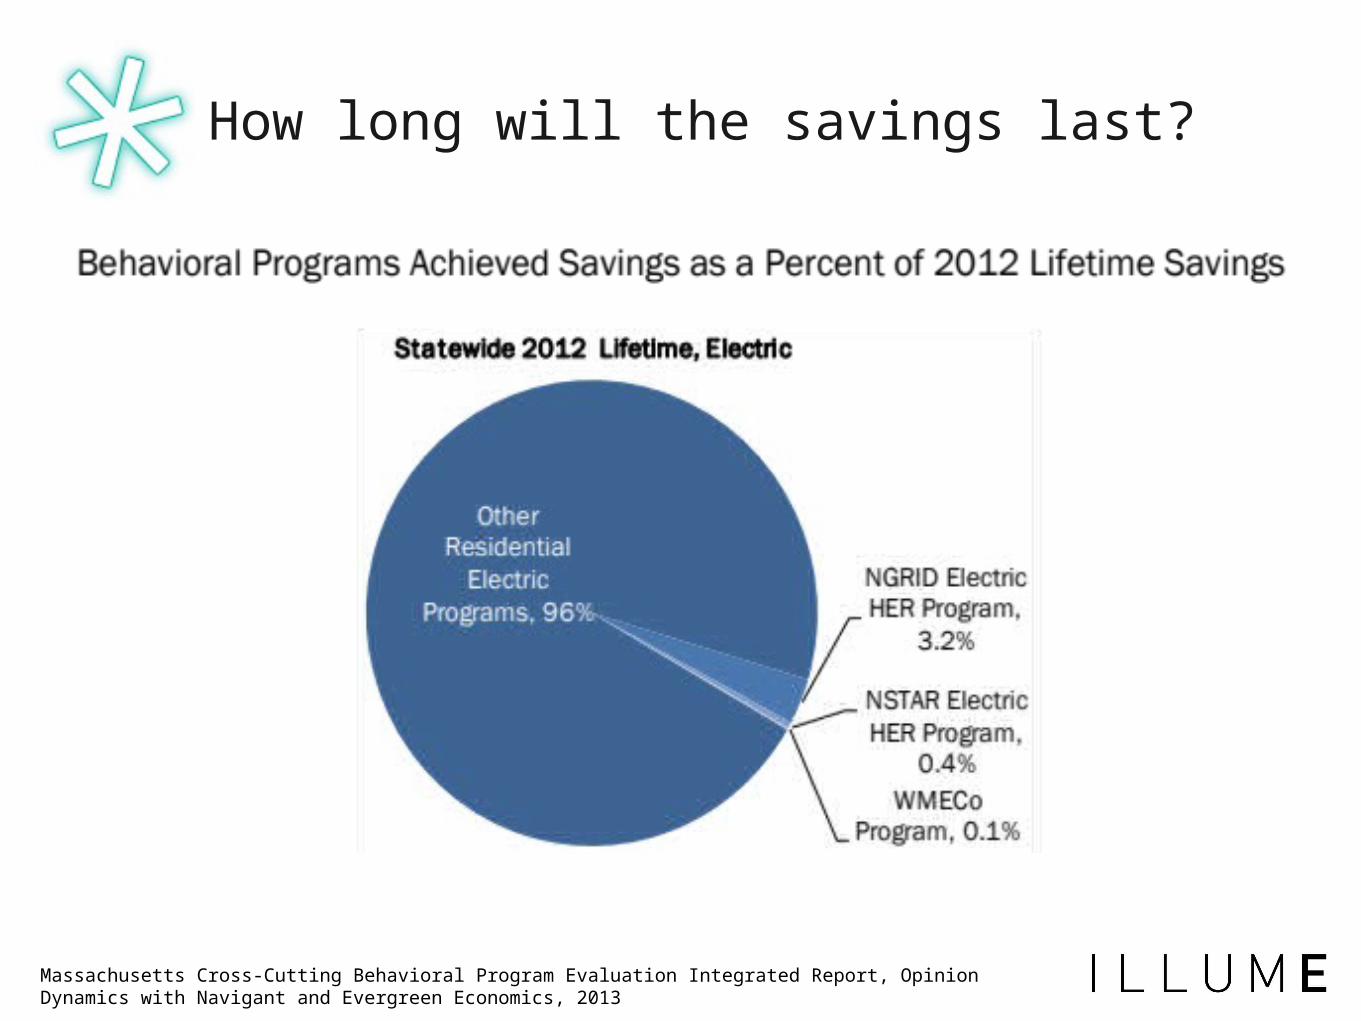
Massachusetts Cross-Cutting Behavioral Program Evaluation Integrated Report, Opinion Dynamics with Navigant and Evergreen Economics, 2013
How long will the savings last?

What is the cost to acquire these savings?
Annual electric savings range from 0.1% to 27% of total residential portfolio goal
The share of budget dedicated to behavioral programs ranges from 0.3% to 10% of overall portfolio spending.
The proportion of kWh savings attributable to behavioral programs is on average 3 to 4 x the budget shareSource: QuadROI

Years
kWh
Are we paying twice for the same savings?
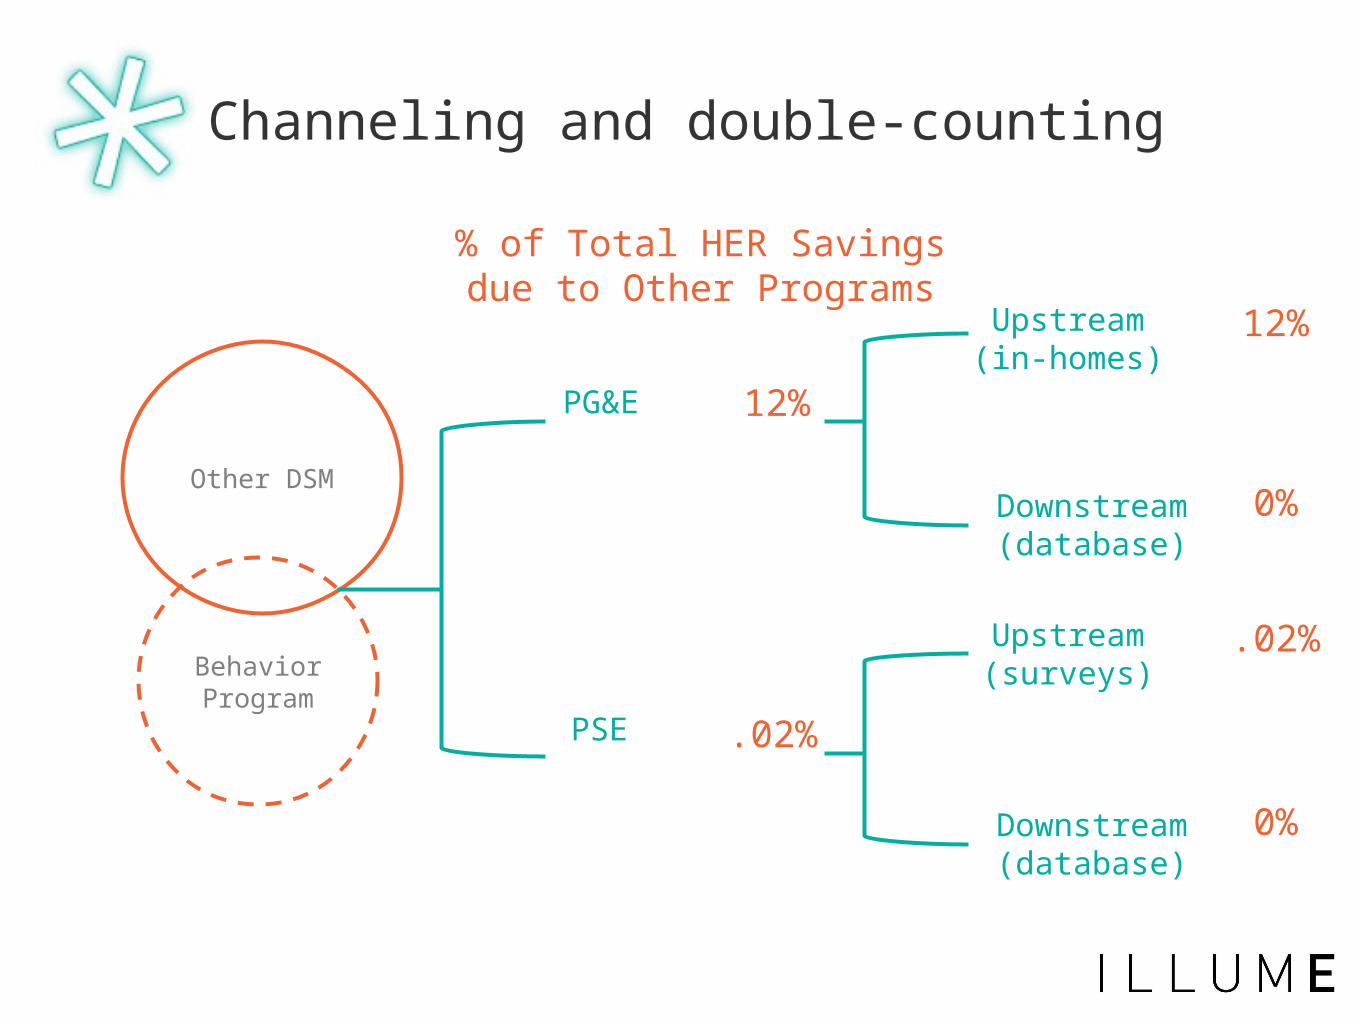
Channeling and double-counting
Behavior Program
Other DSM
PG&E
PSE
12%
.02%
% of Total HER Savings due to Other Programs
Upstream(surveys)
Downstream(database)
0%
.02%
Upstream(in-homes)
Downstream(database)
0%
12%
Behavior programs as a resource