………………………………………………………………………………………………………………………………………………………………………………………………………………. Classified: Public www.comresglobal.com Savanta: ComRes
BECG Planning and Development Councillors Study
Full Tables – 1st October 2020
Methodology: Savanta ComRes interviewed 315 English Councillors from 26th August to 9th September 2020. Data were weighted to be
demographically representative of English Councillors. Savanta ComRes is a member of the British Polling Council and abides by its rules.
Full tables at
www.comresglobal.com
All press releases or other publications must be checked with Savanta ComRes before use. Savanta ComRes requires 48-hours to check a press
release unless otherwise agreed.
For information about commissioning research please contact [email protected] or call +44 (0)20 7871 8660
To register for Pollwatch, featuring commentary and insight from the Savanta ComRes team, please email: [email protected]
Page: iTable of Contents
Table 1 ........................................................................................................................................................................................................................................................................................................................................................................................................................................................ 1Q1. Which of the following methods of holding planning consultations would you say is most effective in engaging the views of your constituents?BASE: All respondents
Table 2 ........................................................................................................................................................................................................................................................................................................................................................................................................................................................ 4Q2. Which of the following statements best fits your view on the digitisation of the planning system? The digitisation of the planning system...BASE: All respondents
Table 3 ........................................................................................................................................................................................................................................................................................................................................................................................................................................................ 7Q3. Which of the following statements best fits your view on when planning consultation should take place for new developments?BASE: All respondents
Table 4 ....................................................................................................................................................................................................................................................................................................................................................................................................................................................... 10Q4. At the beginning of August the government outlined plans to reform the planning system in England. Do you believe that the Government's proposed reforms will make planning more or less democratic?BASE: All respondents
Table 5 ....................................................................................................................................................................................................................................................................................................................................................................................................................................................... 13Q5. Do you think there should or should not be a review of the Green Belt?BASE: All respondents
Table 6 ....................................................................................................................................................................................................................................................................................................................................................................................................................................................... 16Q6. If there were a review of the Green Belt, which of the following, if any, do you think councils should be allowed to do?BASE: All respondents
Table 7 ....................................................................................................................................................................................................................................................................................................................................................................................................................................................... 19D1. Please select your gender.BASE: All respondents
Table 8 ....................................................................................................................................................................................................................................................................................................................................................................................................................................................... 22D2. Please enter your age in years.BASE: All respondents
Table 9 ....................................................................................................................................................................................................................................................................................................................................................................................................................................................... 25D3. Do you currently serve on any of the following committees in your role as a Local Government Councillor?BASE: All respondents
Table 10 ..................................................................................................................................................................................................................................................................................................................................................................................................................................................... 30D4. Which of the following best describes your length of service as a local councillor?BASE: All respondents
Page 1
BECG Councillors Conference Research TablesTable 1
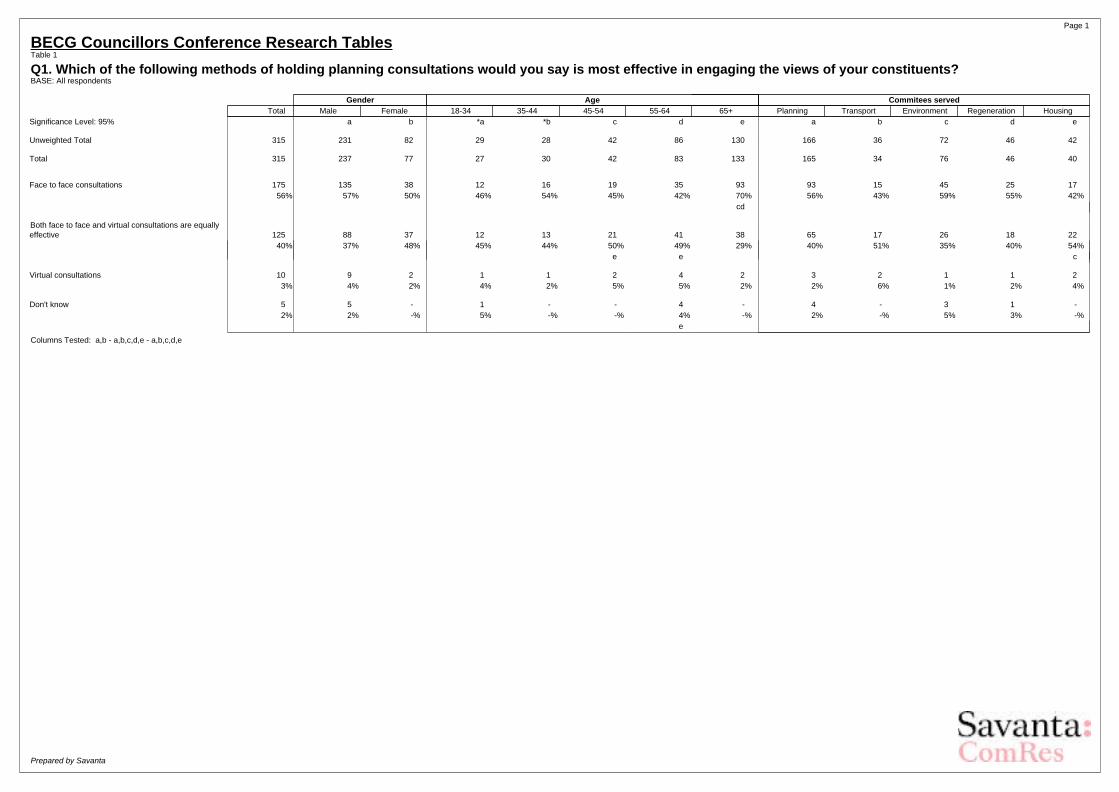
Q1. Which of the following methods of holding planning consultations would you say is most effective in engaging the views of your constituents?BASE: All respondents
Gender Age Commitees servedTotal Male Female 18-34 35-44 45-54 55-64 65+ Planning Transport Environment Regeneration Housing
Significance Level: 95% a b *a *b c d e a b c d e
Unweighted Total 315 231 82 29 28 42 86 130 166 36 72 46 42
Total 315 237 77 27 30 42 83 133 165 34 76 46 40
Face to face consultations 175 135 38 12 16 19 35 93 93 15 45 25 1756% 57% 50% 46% 54% 45% 42% 70% 56% 43% 59% 55% 42%
cd
Both face to face and virtual consultations are equallyeffective 125 88 37 12 13 21 41 38 65 17 26 18 22
40% 37% 48% 45% 44% 50% 49% 29% 40% 51% 35% 40% 54%e e c
Virtual consultations 10 9 2 1 1 2 4 2 3 2 1 1 23% 4% 2% 4% 2% 5% 5% 2% 2% 6% 1% 2% 4%
Don't know 5 5 - 1 - - 4 - 4 - 3 1 -2% 2% -% 5% -% -% 4% -% 2% -% 5% 3% -%
e
Columns Tested: a,b - a,b,c,d,e - a,b,c,d,e
Prepared by Savanta
Page 2
BECG Councillors Conference Research TablesTable 1 (continuation)
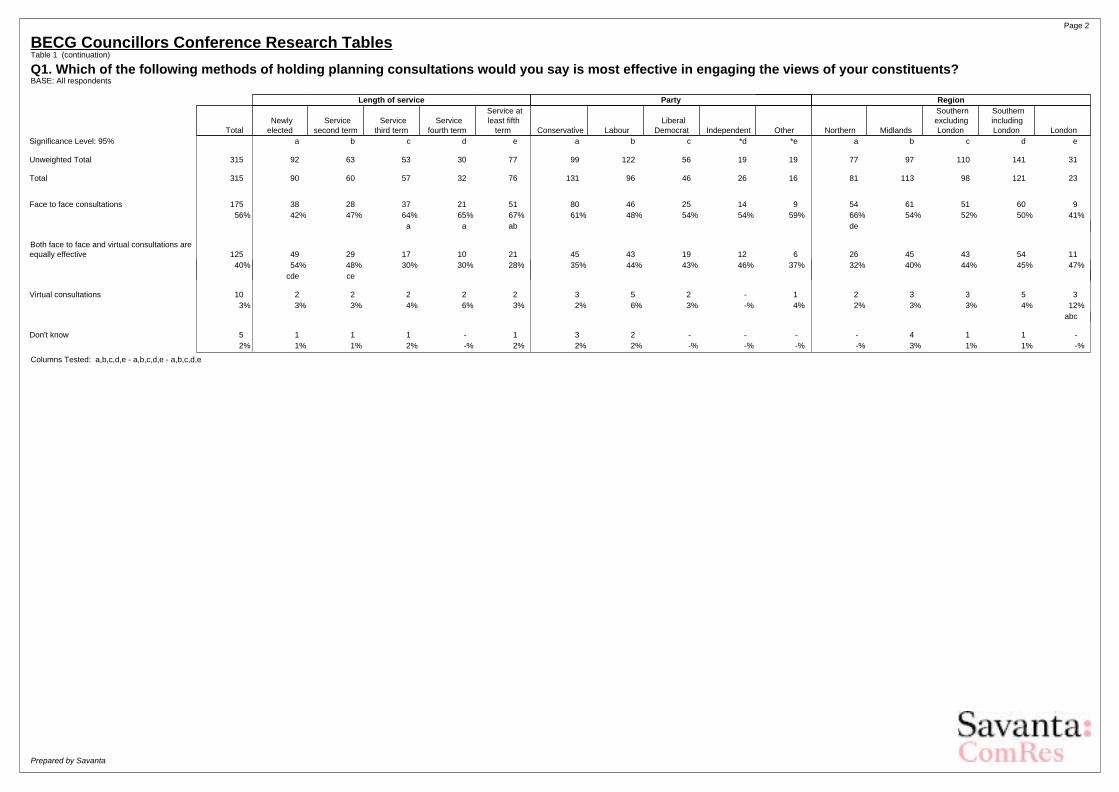
Q1. Which of the following methods of holding planning consultations would you say is most effective in engaging the views of your constituents?BASE: All respondents
Length of service Party Region
Total Newlyelected
Servicesecond term
Servicethird term
Servicefourth term
Service atleast fifth
term Conservative Labour Liberal
Democrat Independent Other Northern Midlands
SouthernexcludingLondon
SouthernincludingLondon London
Significance Level: 95% a b c d e a b c *d *e a b c d e
Unweighted Total 315 92 63 53 30 77 99 122 56 19 19 77 97 110 141 31
Total 315 90 60 57 32 76 131 96 46 26 16 81 113 98 121 23
Face to face consultations 175 38 28 37 21 51 80 46 25 14 9 54 61 51 60 956% 42% 47% 64% 65% 67% 61% 48% 54% 54% 59% 66% 54% 52% 50% 41%
a a ab de
Both face to face and virtual consultations areequally effective 125 49 29 17 10 21 45 43 19 12 6 26 45 43 54 11
40% 54% 48% 30% 30% 28% 35% 44% 43% 46% 37% 32% 40% 44% 45% 47%cde ce
Virtual consultations 10 2 2 2 2 2 3 5 2 - 1 2 3 3 5 33% 3% 3% 4% 6% 3% 2% 6% 3% -% 4% 2% 3% 3% 4% 12%
abc
Don't know 5 1 1 1 - 1 3 2 - - - - 4 1 1 -2% 1% 1% 2% -% 2% 2% 2% -% -% -% -% 3% 1% 1% -%
Columns Tested: a,b,c,d,e - a,b,c,d,e - a,b,c,d,e
Prepared by Savanta
Page 3
BECG Councillors Conference Research TablesTable 1 (continuation)
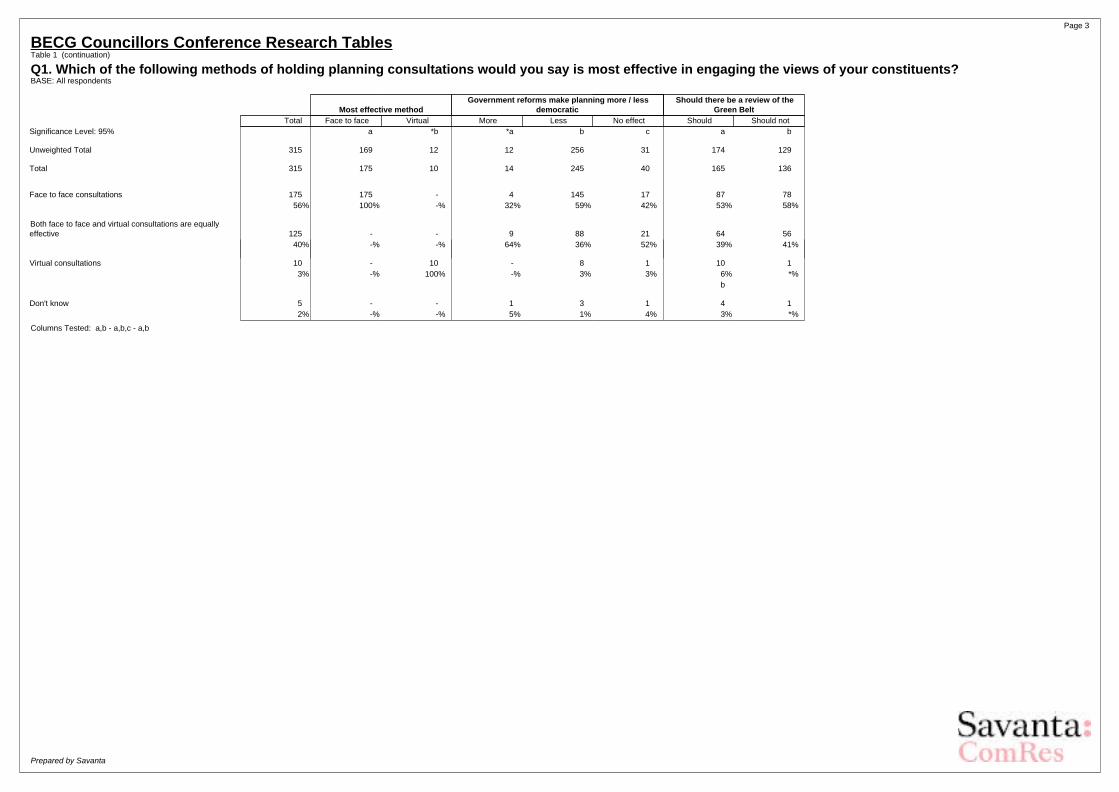
Q1. Which of the following methods of holding planning consultations would you say is most effective in engaging the views of your constituents?BASE: All respondents
Most effective methodGovernment reforms make planning more / less
democraticShould there be a review of the
Green BeltTotal Face to face Virtual More Less No effect Should Should not
Significance Level: 95% a *b *a b c a b
Unweighted Total 315 169 12 12 256 31 174 129
Total 315 175 10 14 245 40 165 136
Face to face consultations 175 175 - 4 145 17 87 7856% 100% -% 32% 59% 42% 53% 58%
Both face to face and virtual consultations are equallyeffective 125 - - 9 88 21 64 56
40% -% -% 64% 36% 52% 39% 41%
Virtual consultations 10 - 10 - 8 1 10 13% -% 100% -% 3% 3% 6% *%
b
Don't know 5 - - 1 3 1 4 12% -% -% 5% 1% 4% 3% *%
Columns Tested: a,b - a,b,c - a,b
Prepared by Savanta
Page 4
BECG Councillors Conference Research TablesTable 2
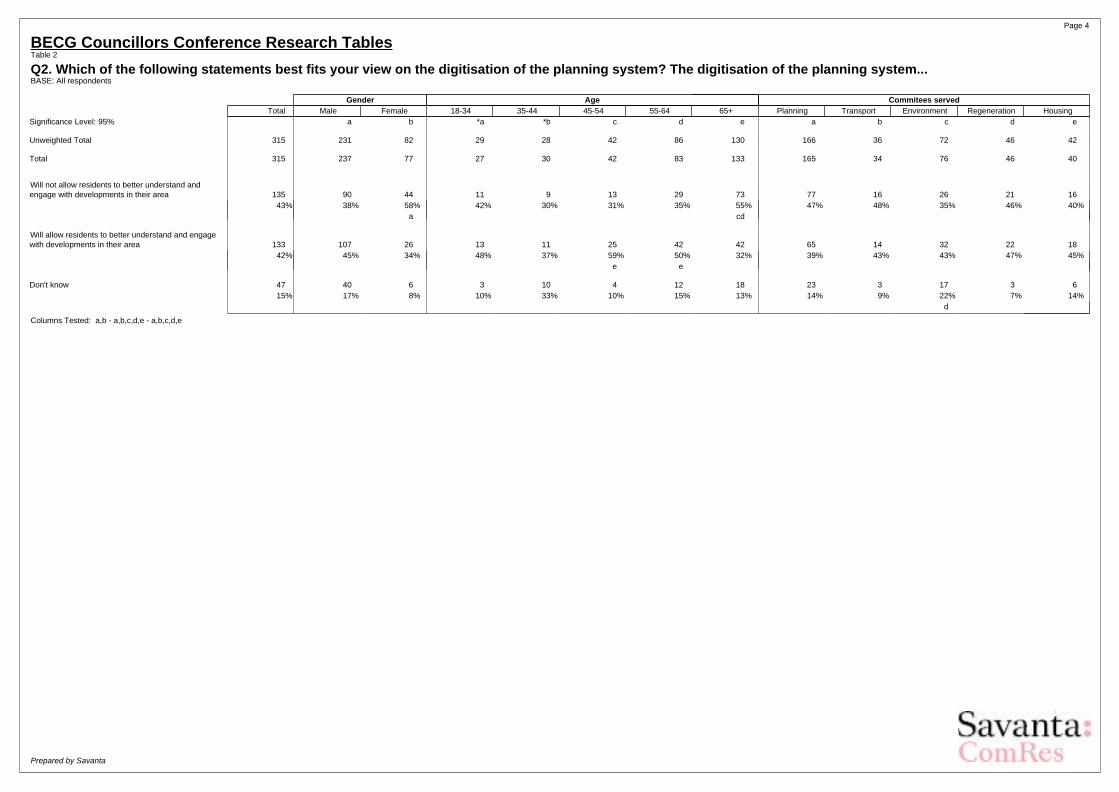
Q2. Which of the following statements best fits your view on the digitisation of the planning system? The digitisation of the planning system...BASE: All respondents
Gender Age Commitees servedTotal Male Female 18-34 35-44 45-54 55-64 65+ Planning Transport Environment Regeneration Housing
Significance Level: 95% a b *a *b c d e a b c d e
Unweighted Total 315 231 82 29 28 42 86 130 166 36 72 46 42
Total 315 237 77 27 30 42 83 133 165 34 76 46 40
Will not allow residents to better understand andengage with developments in their area 135 90 44 11 9 13 29 73 77 16 26 21 16
43% 38% 58% 42% 30% 31% 35% 55% 47% 48% 35% 46% 40%a cd
Will allow residents to better understand and engagewith developments in their area 133 107 26 13 11 25 42 42 65 14 32 22 18
42% 45% 34% 48% 37% 59% 50% 32% 39% 43% 43% 47% 45%e e
Don't know 47 40 6 3 10 4 12 18 23 3 17 3 615% 17% 8% 10% 33% 10% 15% 13% 14% 9% 22% 7% 14%
d
Columns Tested: a,b - a,b,c,d,e - a,b,c,d,e
Prepared by Savanta
Page 5
BECG Councillors Conference Research TablesTable 2 (continuation)
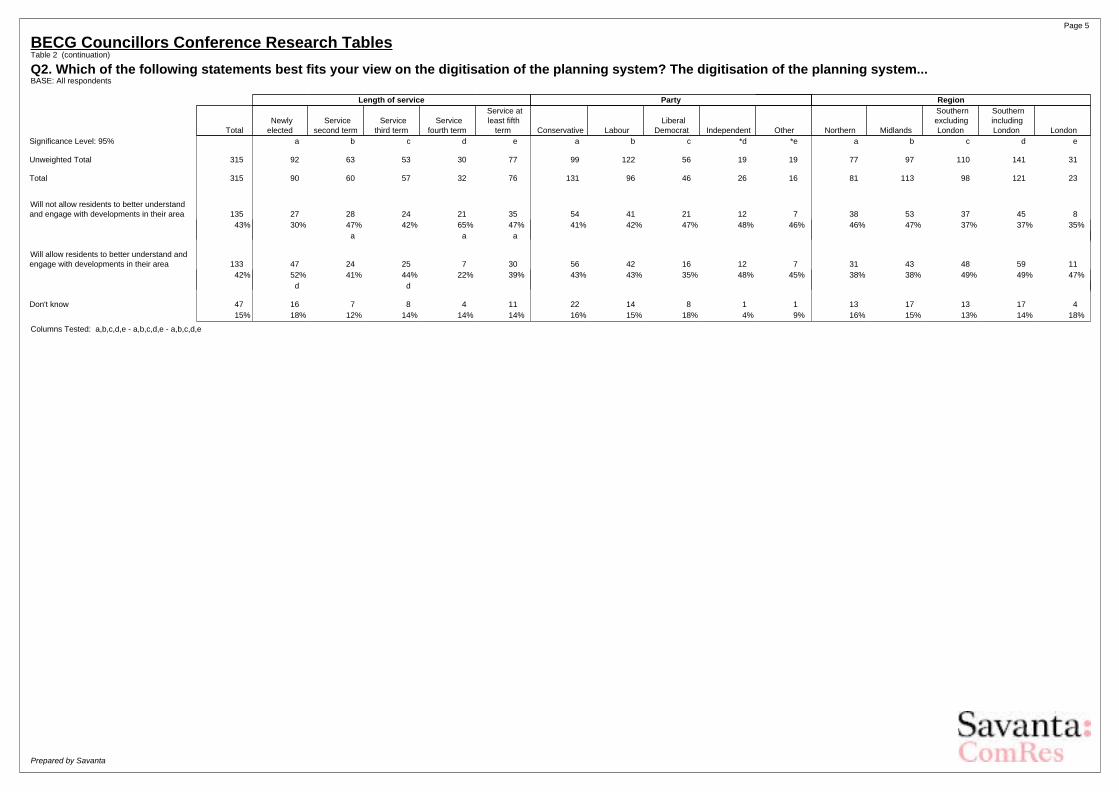
Q2. Which of the following statements best fits your view on the digitisation of the planning system? The digitisation of the planning system...BASE: All respondents
Length of service Party Region
Total Newlyelected
Servicesecond term
Servicethird term
Servicefourth term
Service atleast fifth
term Conservative Labour Liberal
Democrat Independent Other Northern Midlands
SouthernexcludingLondon
SouthernincludingLondon London
Significance Level: 95% a b c d e a b c *d *e a b c d e
Unweighted Total 315 92 63 53 30 77 99 122 56 19 19 77 97 110 141 31
Total 315 90 60 57 32 76 131 96 46 26 16 81 113 98 121 23
Will not allow residents to better understandand engage with developments in their area 135 27 28 24 21 35 54 41 21 12 7 38 53 37 45 8
43% 30% 47% 42% 65% 47% 41% 42% 47% 48% 46% 46% 47% 37% 37% 35%a a a
Will allow residents to better understand andengage with developments in their area 133 47 24 25 7 30 56 42 16 12 7 31 43 48 59 11
42% 52% 41% 44% 22% 39% 43% 43% 35% 48% 45% 38% 38% 49% 49% 47%d d
Don't know 47 16 7 8 4 11 22 14 8 1 1 13 17 13 17 415% 18% 12% 14% 14% 14% 16% 15% 18% 4% 9% 16% 15% 13% 14% 18%
Columns Tested: a,b,c,d,e - a,b,c,d,e - a,b,c,d,e
Prepared by Savanta
Page 6
BECG Councillors Conference Research TablesTable 2 (continuation)
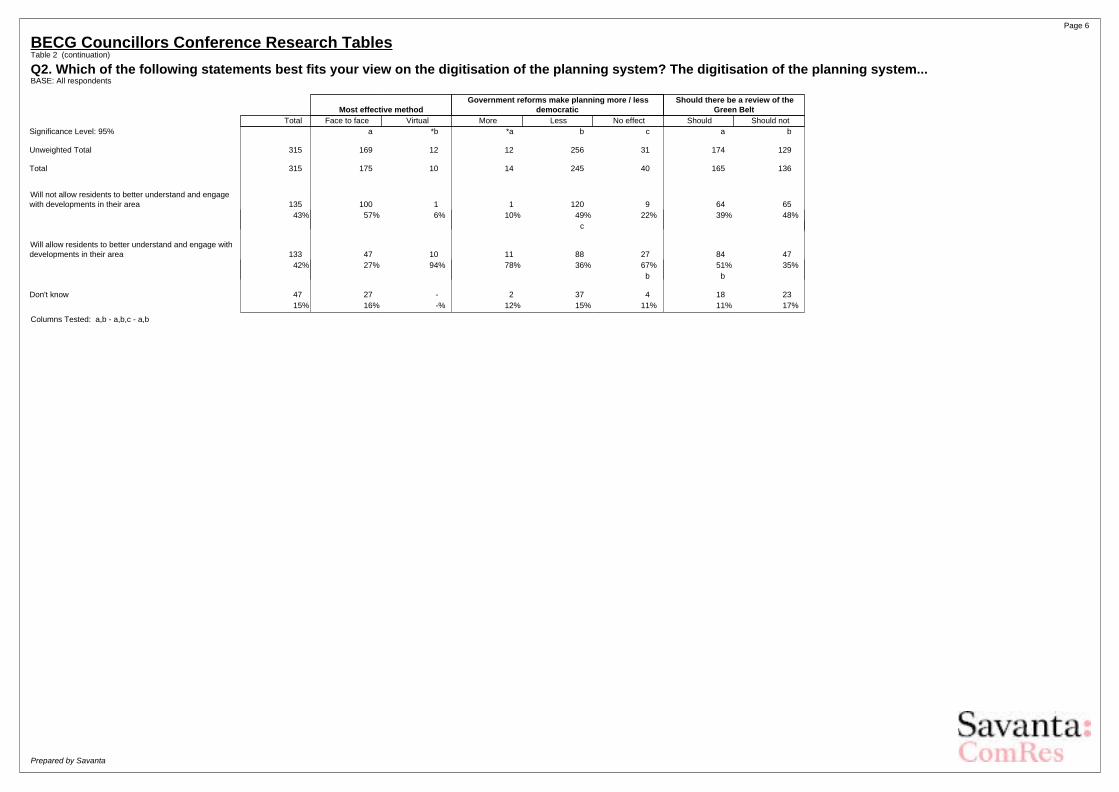
Q2. Which of the following statements best fits your view on the digitisation of the planning system? The digitisation of the planning system...BASE: All respondents
Most effective methodGovernment reforms make planning more / less
democraticShould there be a review of the
Green BeltTotal Face to face Virtual More Less No effect Should Should not
Significance Level: 95% a *b *a b c a b
Unweighted Total 315 169 12 12 256 31 174 129
Total 315 175 10 14 245 40 165 136
Will not allow residents to better understand and engagewith developments in their area 135 100 1 1 120 9 64 65
43% 57% 6% 10% 49% 22% 39% 48%c
Will allow residents to better understand and engage withdevelopments in their area 133 47 10 11 88 27 84 47
42% 27% 94% 78% 36% 67% 51% 35%b b
Don't know 47 27 - 2 37 4 18 2315% 16% -% 12% 15% 11% 11% 17%
Columns Tested: a,b - a,b,c - a,b
Prepared by Savanta
Page 7
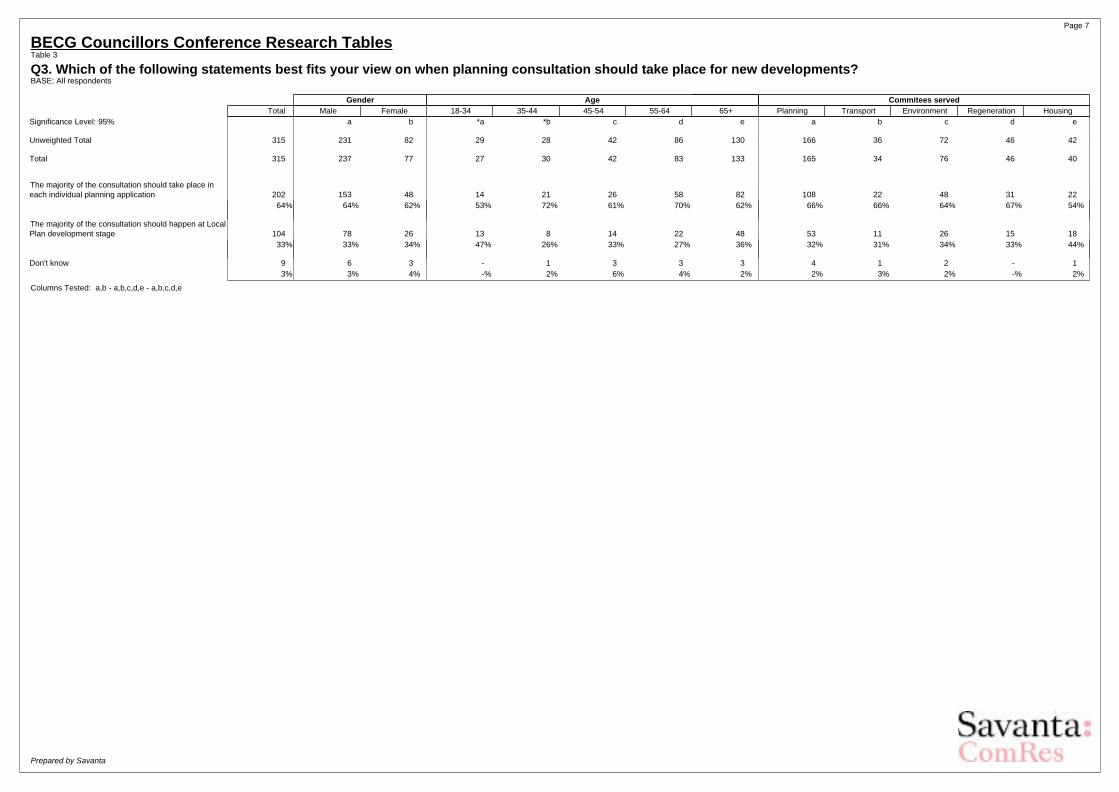
BECG Councillors Conference Research TablesTable 3
Q3. Which of the following statements best fits your view on when planning consultation should take place for new developments?BASE: All respondents
Gender Age Commitees servedTotal Male Female 18-34 35-44 45-54 55-64 65+ Planning Transport Environment Regeneration Housing
Significance Level: 95% a b *a *b c d e a b c d e
Unweighted Total 315 231 82 29 28 42 86 130 166 36 72 46 42
Total 315 237 77 27 30 42 83 133 165 34 76 46 40
The majority of the consultation should take place ineach individual planning application 202 153 48 14 21 26 58 82 108 22 48 31 22
64% 64% 62% 53% 72% 61% 70% 62% 66% 66% 64% 67% 54%
The majority of the consultation should happen at LocalPlan development stage 104 78 26 13 8 14 22 48 53 11 26 15 18
33% 33% 34% 47% 26% 33% 27% 36% 32% 31% 34% 33% 44%
Don't know 9 6 3 - 1 3 3 3 4 1 2 - 13% 3% 4% -% 2% 6% 4% 2% 2% 3% 2% -% 2%
Columns Tested: a,b - a,b,c,d,e - a,b,c,d,e
Prepared by Savanta
Page 8
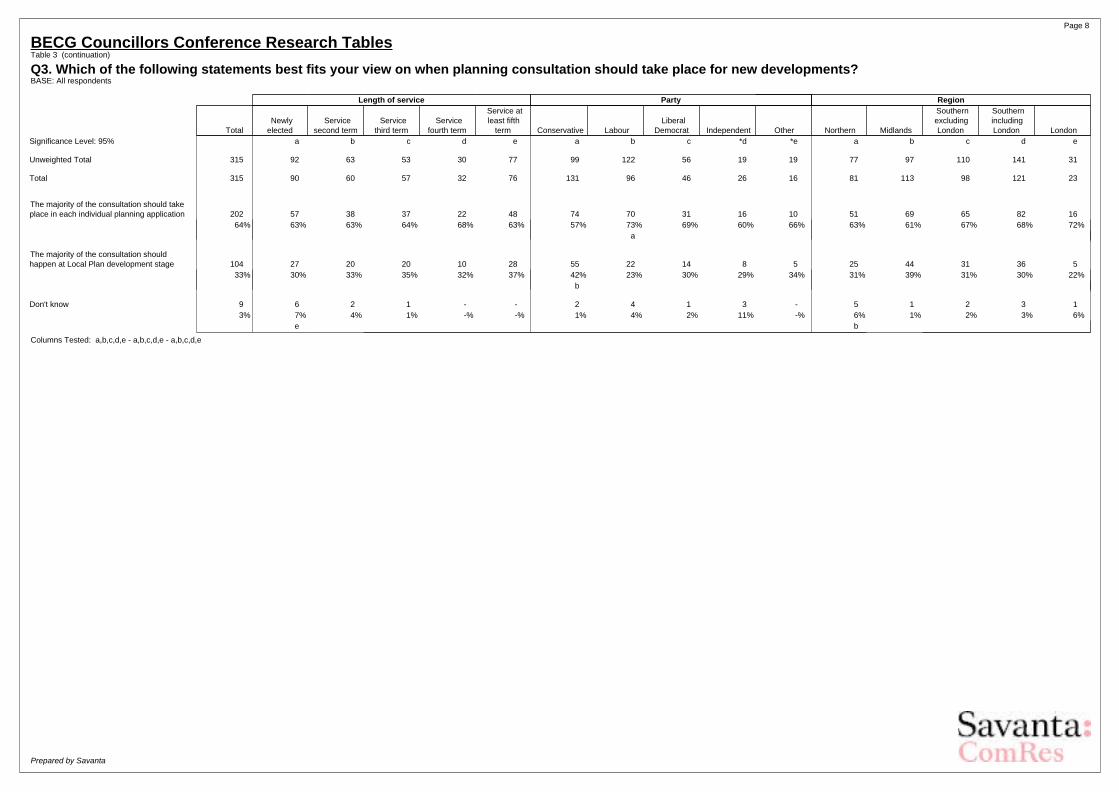
BECG Councillors Conference Research TablesTable 3 (continuation)
Q3. Which of the following statements best fits your view on when planning consultation should take place for new developments?BASE: All respondents
Length of service Party Region
Total Newlyelected
Servicesecond term
Servicethird term
Servicefourth term
Service atleast fifth
term Conservative Labour Liberal
Democrat Independent Other Northern Midlands
SouthernexcludingLondon
SouthernincludingLondon London
Significance Level: 95% a b c d e a b c *d *e a b c d e
Unweighted Total 315 92 63 53 30 77 99 122 56 19 19 77 97 110 141 31
Total 315 90 60 57 32 76 131 96 46 26 16 81 113 98 121 23
The majority of the consultation should takeplace in each individual planning application 202 57 38 37 22 48 74 70 31 16 10 51 69 65 82 16
64% 63% 63% 64% 68% 63% 57% 73% 69% 60% 66% 63% 61% 67% 68% 72%a
The majority of the consultation shouldhappen at Local Plan development stage 104 27 20 20 10 28 55 22 14 8 5 25 44 31 36 5
33% 30% 33% 35% 32% 37% 42% 23% 30% 29% 34% 31% 39% 31% 30% 22%b
Don't know 9 6 2 1 - - 2 4 1 3 - 5 1 2 3 13% 7% 4% 1% -% -% 1% 4% 2% 11% -% 6% 1% 2% 3% 6%
e b
Columns Tested: a,b,c,d,e - a,b,c,d,e - a,b,c,d,e
Prepared by Savanta

Page 9
BECG Councillors Conference Research TablesTable 3 (continuation)
Q3. Which of the following statements best fits your view on when planning consultation should take place for new developments?BASE: All respondents
Most effective methodGovernment reforms make planning more / less
democraticShould there be a review of the
Green BeltTotal Face to face Virtual More Less No effect Should Should not
Significance Level: 95% a *b *a b c a b
Unweighted Total 315 169 12 12 256 31 174 129
Total 315 175 10 14 245 40 165 136
The majority of the consultation should take place in eachindividual planning application 202 117 5 5 168 19 104 87
64% 67% 50% 40% 68% 48% 63% 64%c
The majority of the consultation should happen at LocalPlan development stage 104 55 4 8 72 19 56 46
33% 31% 40% 60% 30% 48% 34% 34%b
Don't know 9 3 1 - 5 2 6 33% 2% 9% -% 2% 4% 4% 2%
Columns Tested: a,b - a,b,c - a,b
Prepared by Savanta
Page 10
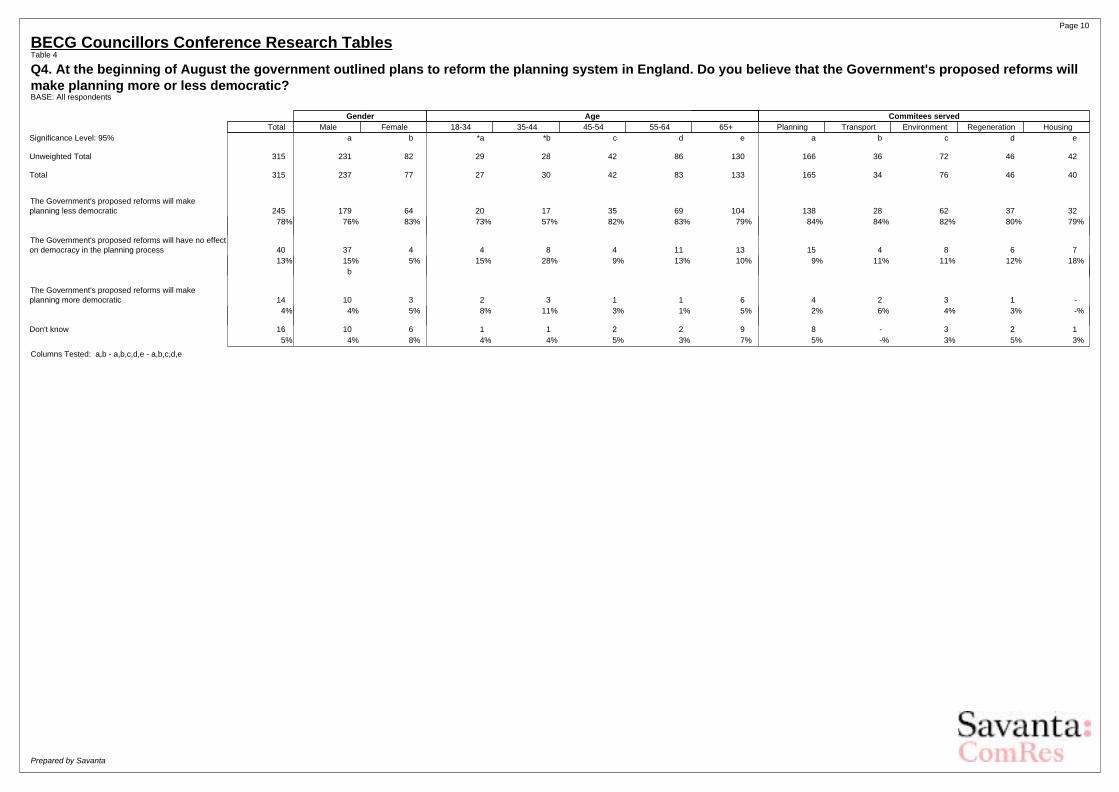
BECG Councillors Conference Research TablesTable 4
Q4. At the beginning of August the government outlined plans to reform the planning system in England. Do you believe that the Government's proposed reforms will make planning more or less democratic?BASE: All respondents
Gender Age Commitees servedTotal Male Female 18-34 35-44 45-54 55-64 65+ Planning Transport Environment Regeneration Housing
Significance Level: 95% a b *a *b c d e a b c d e
Unweighted Total 315 231 82 29 28 42 86 130 166 36 72 46 42
Total 315 237 77 27 30 42 83 133 165 34 76 46 40
The Government's proposed reforms will makeplanning less democratic 245 179 64 20 17 35 69 104 138 28 62 37 32
78% 76% 83% 73% 57% 82% 83% 79% 84% 84% 82% 80% 79%
The Government's proposed reforms will have no effecton democracy in the planning process 40 37 4 4 8 4 11 13 15 4 8 6 7
13% 15% 5% 15% 28% 9% 13% 10% 9% 11% 11% 12% 18%b
The Government's proposed reforms will makeplanning more democratic 14 10 3 2 3 1 1 6 4 2 3 1 -
4% 4% 5% 8% 11% 3% 1% 5% 2% 6% 4% 3% -%
Don't know 16 10 6 1 1 2 2 9 8 - 3 2 15% 4% 8% 4% 4% 5% 3% 7% 5% -% 3% 5% 3%
Columns Tested: a,b - a,b,c,d,e - a,b,c,d,e
Prepared by Savanta
Page 11
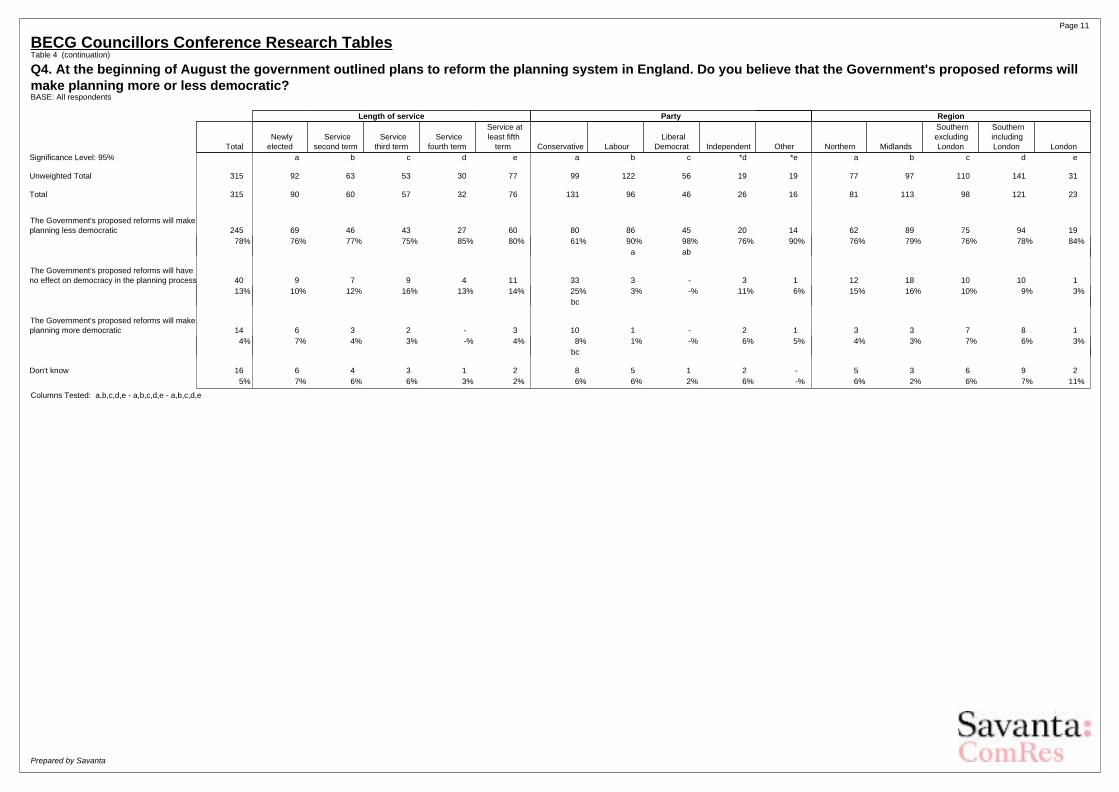
BECG Councillors Conference Research TablesTable 4 (continuation)
Q4. At the beginning of August the government outlined plans to reform the planning system in England. Do you believe that the Government's proposed reforms will make planning more or less democratic?BASE: All respondents
Length of service Party Region
Total Newlyelected
Servicesecond term
Servicethird term
Servicefourth term
Service atleast fifth
term Conservative Labour Liberal
Democrat Independent Other Northern Midlands
SouthernexcludingLondon
SouthernincludingLondon London
Significance Level: 95% a b c d e a b c *d *e a b c d e
Unweighted Total 315 92 63 53 30 77 99 122 56 19 19 77 97 110 141 31
Total 315 90 60 57 32 76 131 96 46 26 16 81 113 98 121 23
The Government's proposed reforms will makeplanning less democratic 245 69 46 43 27 60 80 86 45 20 14 62 89 75 94 19
78% 76% 77% 75% 85% 80% 61% 90% 98% 76% 90% 76% 79% 76% 78% 84%a ab
The Government's proposed reforms will haveno effect on democracy in the planning process 40 9 7 9 4 11 33 3 - 3 1 12 18 10 10 1
13% 10% 12% 16% 13% 14% 25% 3% -% 11% 6% 15% 16% 10% 9% 3%bc
The Government's proposed reforms will makeplanning more democratic 14 6 3 2 - 3 10 1 - 2 1 3 3 7 8 1
4% 7% 4% 3% -% 4% 8% 1% -% 6% 5% 4% 3% 7% 6% 3%bc
Don't know 16 6 4 3 1 2 8 5 1 2 - 5 3 6 9 25% 7% 6% 6% 3% 2% 6% 6% 2% 6% -% 6% 2% 6% 7% 11%
Columns Tested: a,b,c,d,e - a,b,c,d,e - a,b,c,d,e
Prepared by Savanta
Page 12
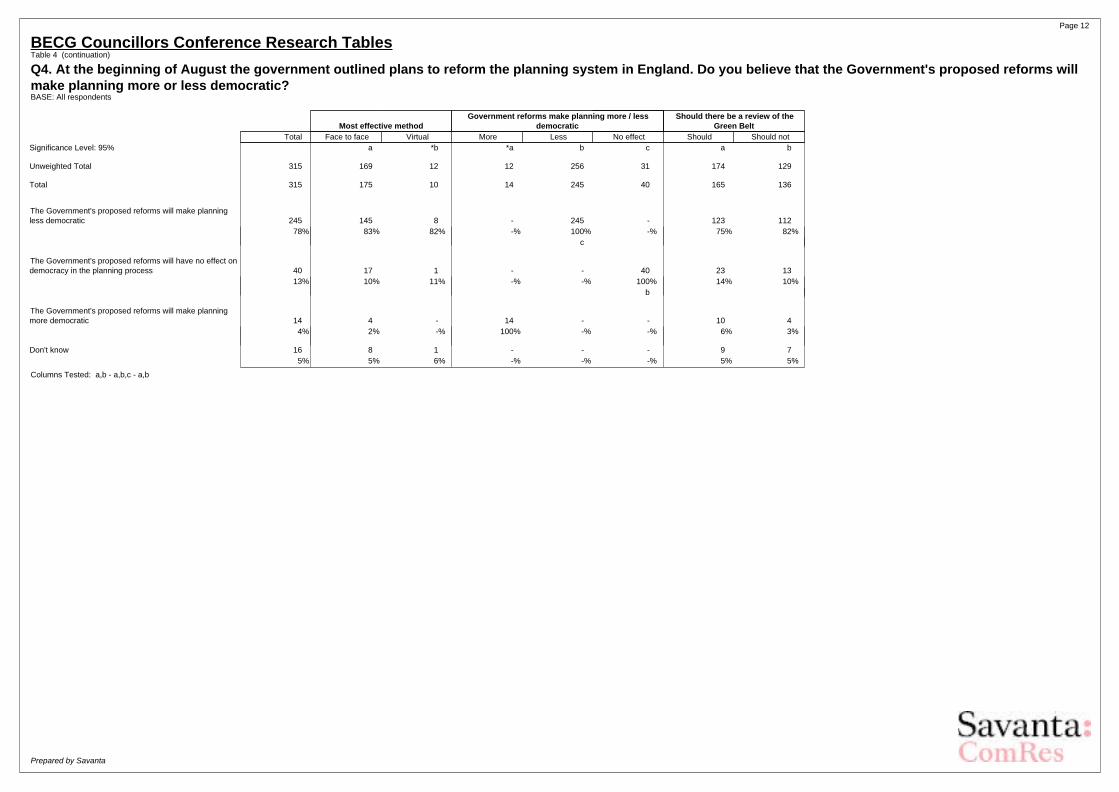
BECG Councillors Conference Research TablesTable 4 (continuation)
Q4. At the beginning of August the government outlined plans to reform the planning system in England. Do you believe that the Government's proposed reforms will make planning more or less democratic?BASE: All respondents
Most effective methodGovernment reforms make planning more / less
democraticShould there be a review of the
Green BeltTotal Face to face Virtual More Less No effect Should Should not
Significance Level: 95% a *b *a b c a b
Unweighted Total 315 169 12 12 256 31 174 129
Total 315 175 10 14 245 40 165 136
The Government's proposed reforms will make planningless democratic 245 145 8 - 245 - 123 112
78% 83% 82% -% 100% -% 75% 82%c
The Government's proposed reforms will have no effect ondemocracy in the planning process 40 17 1 - - 40 23 13
13% 10% 11% -% -% 100% 14% 10%b
The Government's proposed reforms will make planningmore democratic 14 4 - 14 - - 10 4
4% 2% -% 100% -% -% 6% 3%
Don't know 16 8 1 - - - 9 75% 5% 6% -% -% -% 5% 5%
Columns Tested: a,b - a,b,c - a,b
Prepared by Savanta
Page 13
BECG Councillors Conference Research TablesTable 5
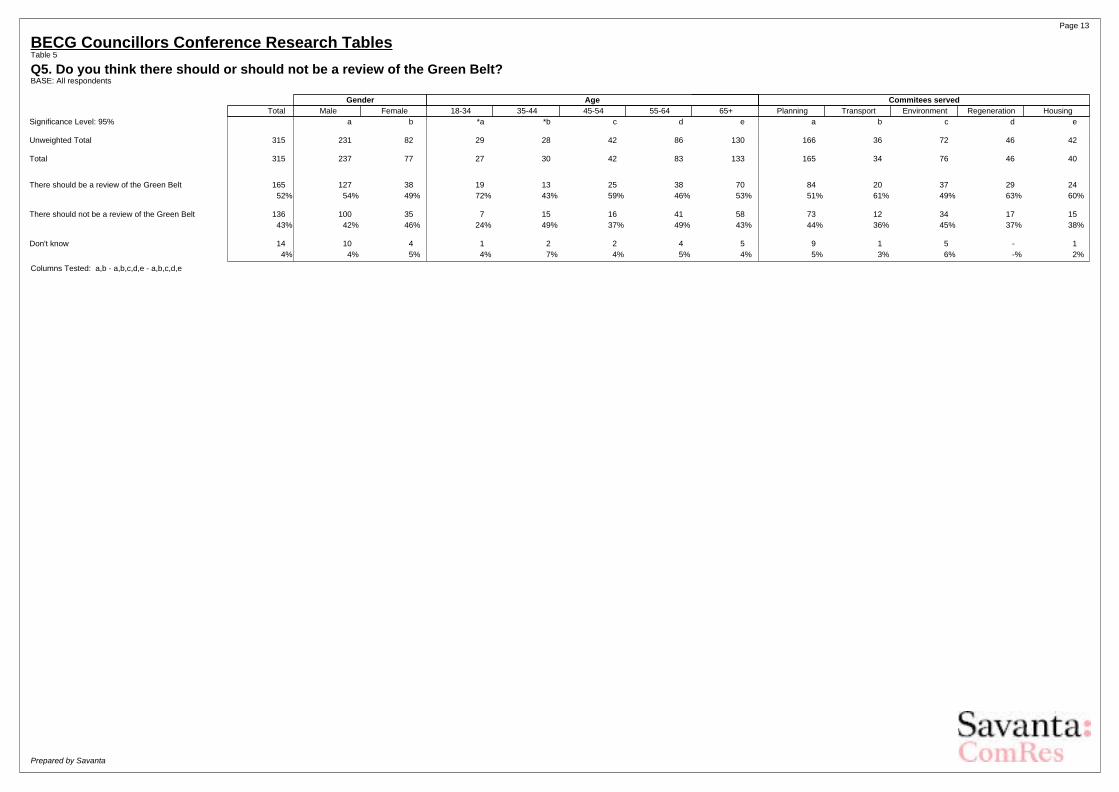
Q5. Do you think there should or should not be a review of the Green Belt?BASE: All respondents
Gender Age Commitees servedTotal Male Female 18-34 35-44 45-54 55-64 65+ Planning Transport Environment Regeneration Housing
Significance Level: 95% a b *a *b c d e a b c d e
Unweighted Total 315 231 82 29 28 42 86 130 166 36 72 46 42
Total 315 237 77 27 30 42 83 133 165 34 76 46 40
There should be a review of the Green Belt 165 127 38 19 13 25 38 70 84 20 37 29 2452% 54% 49% 72% 43% 59% 46% 53% 51% 61% 49% 63% 60%
There should not be a review of the Green Belt 136 100 35 7 15 16 41 58 73 12 34 17 1543% 42% 46% 24% 49% 37% 49% 43% 44% 36% 45% 37% 38%
Don't know 14 10 4 1 2 2 4 5 9 1 5 - 14% 4% 5% 4% 7% 4% 5% 4% 5% 3% 6% -% 2%
Columns Tested: a,b - a,b,c,d,e - a,b,c,d,e
Prepared by Savanta

Page 14
BECG Councillors Conference Research TablesTable 5 (continuation)
Q5. Do you think there should or should not be a review of the Green Belt?BASE: All respondents
Length of service Party Region
Total Newlyelected
Servicesecond term
Servicethird term
Servicefourth term
Service atleast fifth
term Conservative Labour Liberal
Democrat Independent Other Northern Midlands
SouthernexcludingLondon
SouthernincludingLondon London
Significance Level: 95% a b c d e a b c *d *e a b c d e
Unweighted Total 315 92 63 53 30 77 99 122 56 19 19 77 97 110 141 31
Total 315 90 60 57 32 76 131 96 46 26 16 81 113 98 121 23
There should be a review of the Green Belt 165 44 33 27 13 48 62 62 22 10 10 43 49 62 74 1252% 49% 56% 47% 40% 63% 47% 64% 48% 36% 66% 52% 43% 64% 61% 52%
d ac b b
There should not be a review of the Green Belt 136 42 25 27 16 25 58 32 24 17 5 36 56 33 43 1043% 47% 42% 48% 50% 33% 44% 33% 52% 64% 34% 45% 50% 34% 36% 44%
b cd
Don't know 14 4 2 3 3 3 11 3 - - - 2 8 2 3 14% 4% 3% 5% 9% 4% 8% 3% -% -% -% 3% 7% 2% 3% 5%
c
Columns Tested: a,b,c,d,e - a,b,c,d,e - a,b,c,d,e
Prepared by Savanta
Page 15
BECG Councillors Conference Research TablesTable 5 (continuation)
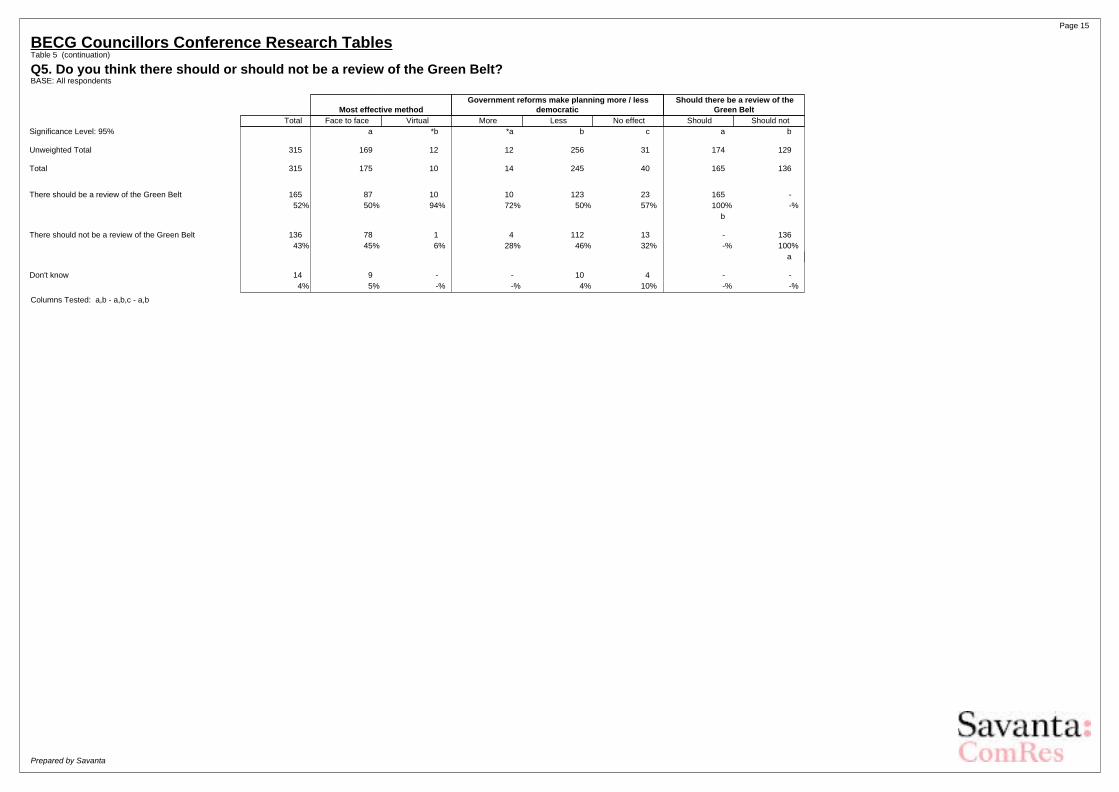
Q5. Do you think there should or should not be a review of the Green Belt?BASE: All respondents
Most effective methodGovernment reforms make planning more / less
democraticShould there be a review of the
Green BeltTotal Face to face Virtual More Less No effect Should Should not
Significance Level: 95% a *b *a b c a b
Unweighted Total 315 169 12 12 256 31 174 129
Total 315 175 10 14 245 40 165 136
There should be a review of the Green Belt 165 87 10 10 123 23 165 -52% 50% 94% 72% 50% 57% 100% -%
b
There should not be a review of the Green Belt 136 78 1 4 112 13 - 13643% 45% 6% 28% 46% 32% -% 100%
a
Don't know 14 9 - - 10 4 - -4% 5% -% -% 4% 10% -% -%
Columns Tested: a,b - a,b,c - a,b
Prepared by Savanta
Page 16
BECG Councillors Conference Research TablesTable 6
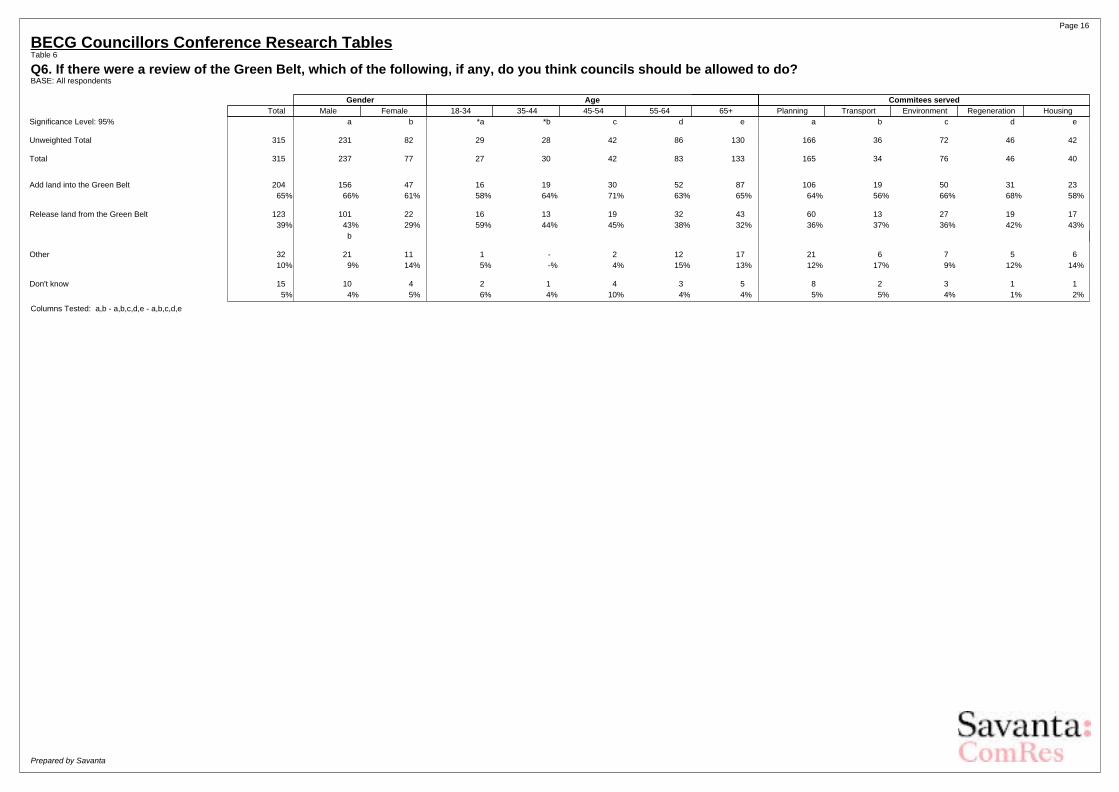
Q6. If there were a review of the Green Belt, which of the following, if any, do you think councils should be allowed to do?BASE: All respondents
Gender Age Commitees servedTotal Male Female 18-34 35-44 45-54 55-64 65+ Planning Transport Environment Regeneration Housing
Significance Level: 95% a b *a *b c d e a b c d e
Unweighted Total 315 231 82 29 28 42 86 130 166 36 72 46 42
Total 315 237 77 27 30 42 83 133 165 34 76 46 40
Add land into the Green Belt 204 156 47 16 19 30 52 87 106 19 50 31 2365% 66% 61% 58% 64% 71% 63% 65% 64% 56% 66% 68% 58%
Release land from the Green Belt 123 101 22 16 13 19 32 43 60 13 27 19 1739% 43% 29% 59% 44% 45% 38% 32% 36% 37% 36% 42% 43%
b
Other 32 21 11 1 - 2 12 17 21 6 7 5 610% 9% 14% 5% -% 4% 15% 13% 12% 17% 9% 12% 14%
Don't know 15 10 4 2 1 4 3 5 8 2 3 1 15% 4% 5% 6% 4% 10% 4% 4% 5% 5% 4% 1% 2%
Columns Tested: a,b - a,b,c,d,e - a,b,c,d,e
Prepared by Savanta
Page 17
BECG Councillors Conference Research TablesTable 6 (continuation)
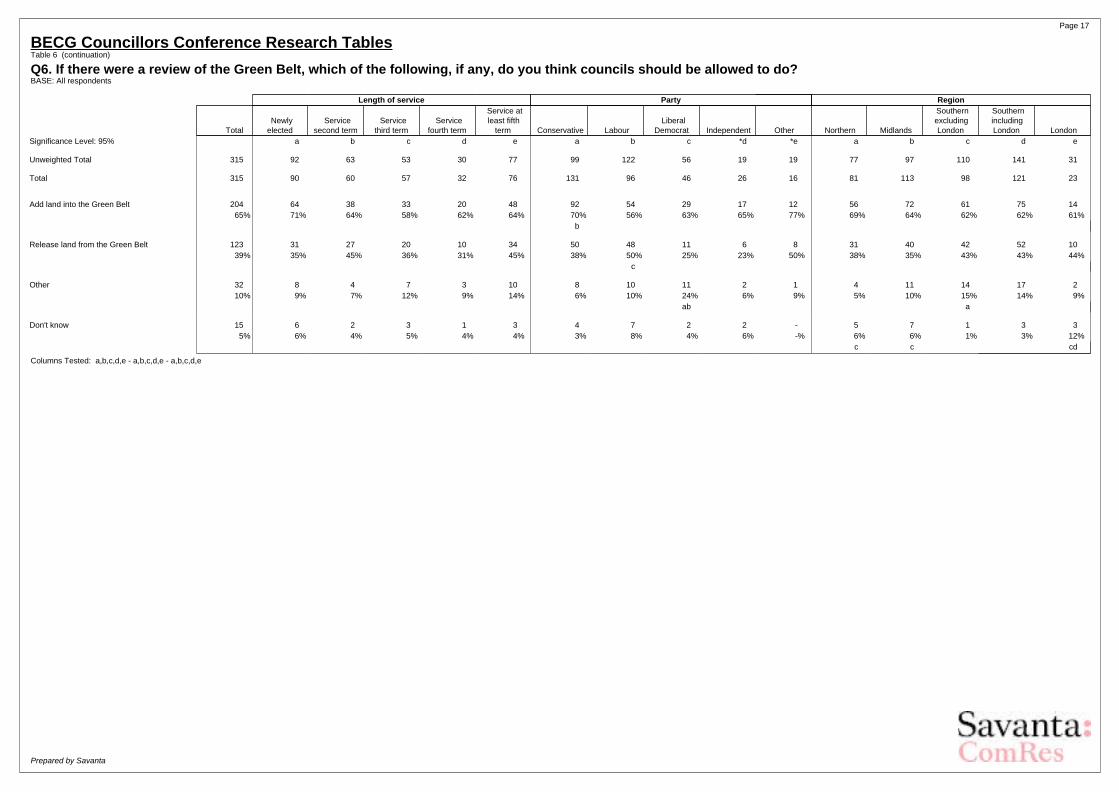
Q6. If there were a review of the Green Belt, which of the following, if any, do you think councils should be allowed to do?BASE: All respondents
Length of service Party Region
Total Newlyelected
Servicesecond term
Servicethird term
Servicefourth term
Service atleast fifth
term Conservative Labour Liberal
Democrat Independent Other Northern Midlands
SouthernexcludingLondon
SouthernincludingLondon London
Significance Level: 95% a b c d e a b c *d *e a b c d e
Unweighted Total 315 92 63 53 30 77 99 122 56 19 19 77 97 110 141 31
Total 315 90 60 57 32 76 131 96 46 26 16 81 113 98 121 23
Add land into the Green Belt 204 64 38 33 20 48 92 54 29 17 12 56 72 61 75 1465% 71% 64% 58% 62% 64% 70% 56% 63% 65% 77% 69% 64% 62% 62% 61%
b
Release land from the Green Belt 123 31 27 20 10 34 50 48 11 6 8 31 40 42 52 1039% 35% 45% 36% 31% 45% 38% 50% 25% 23% 50% 38% 35% 43% 43% 44%
c
Other 32 8 4 7 3 10 8 10 11 2 1 4 11 14 17 210% 9% 7% 12% 9% 14% 6% 10% 24% 6% 9% 5% 10% 15% 14% 9%
ab a
Don't know 15 6 2 3 1 3 4 7 2 2 - 5 7 1 3 35% 6% 4% 5% 4% 4% 3% 8% 4% 6% -% 6% 6% 1% 3% 12%
c c cd
Columns Tested: a,b,c,d,e - a,b,c,d,e - a,b,c,d,e
Prepared by Savanta
Page 18
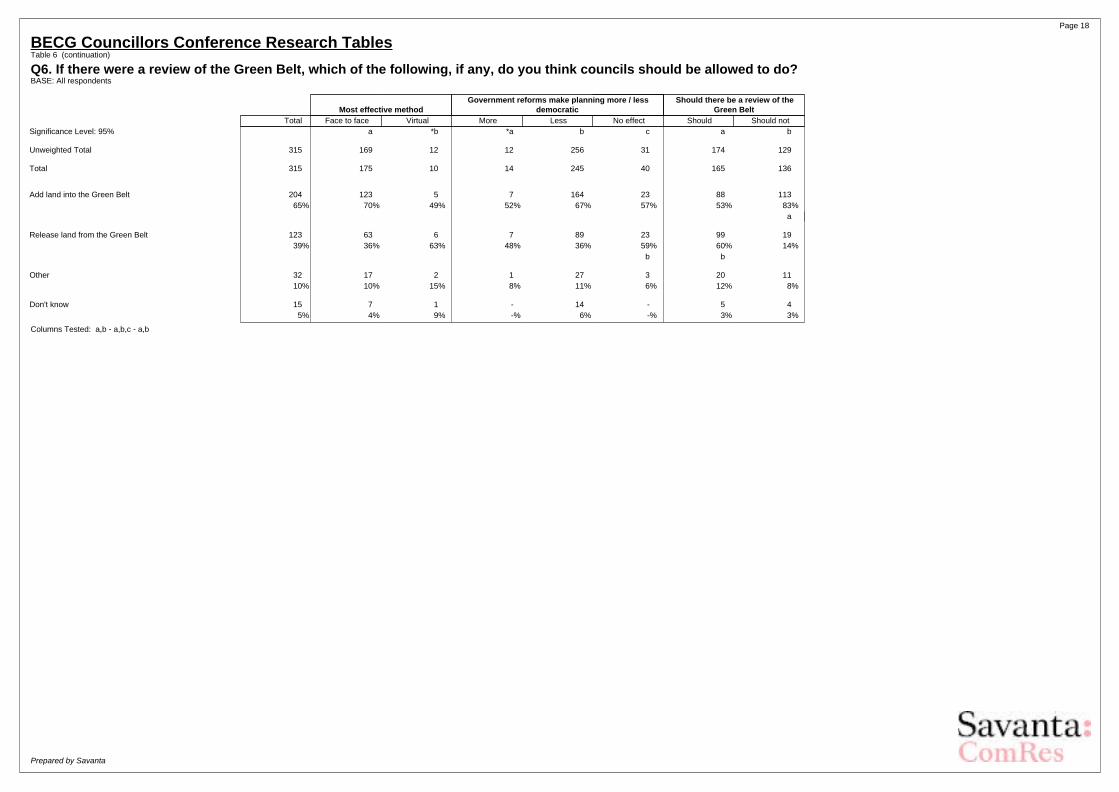
BECG Councillors Conference Research TablesTable 6 (continuation)
Q6. If there were a review of the Green Belt, which of the following, if any, do you think councils should be allowed to do?BASE: All respondents
Most effective methodGovernment reforms make planning more / less
democraticShould there be a review of the
Green BeltTotal Face to face Virtual More Less No effect Should Should not
Significance Level: 95% a *b *a b c a b
Unweighted Total 315 169 12 12 256 31 174 129
Total 315 175 10 14 245 40 165 136
Add land into the Green Belt 204 123 5 7 164 23 88 11365% 70% 49% 52% 67% 57% 53% 83%
a
Release land from the Green Belt 123 63 6 7 89 23 99 1939% 36% 63% 48% 36% 59% 60% 14%
b b
Other 32 17 2 1 27 3 20 1110% 10% 15% 8% 11% 6% 12% 8%
Don't know 15 7 1 - 14 - 5 45% 4% 9% -% 6% -% 3% 3%
Columns Tested: a,b - a,b,c - a,b
Prepared by Savanta

Page 19
BECG Councillors Conference Research TablesTable 7
D1. Please select your gender.BASE: All respondents
Gender Age Commitees servedTotal Male Female 18-34 35-44 45-54 55-64 65+ Planning Transport Environment Regeneration Housing
Significance Level: 95% a b *a *b c d e a b c d e
Unweighted Total 315 231 82 29 28 42 86 130 166 36 72 46 42
Total 315 237 77 27 30 42 83 133 165 34 76 46 40
Male 237 237 - 25 28 29 54 101 122 26 57 36 2875% 100% -% 93% 93% 70% 65% 76% 74% 77% 75% 78% 71%
b
Female 77 - 77 2 2 13 29 31 41 7 19 9 1224% -% 100% 7% 7% 30% 35% 23% 25% 20% 25% 20% 29%
a
I identify in other way - - - - - - - - - - - - --% -% -% -% -% -% -% -% -% -% -% -% -%
Prefer not to say 2 - - - - - 1 1 2 1 - 1 -1% -% -% -% -% -% 1% 1% 1% 2% -% 2% -%
Columns Tested: a,b - a,b,c,d,e - a,b,c,d,e
Prepared by Savanta
Page 20
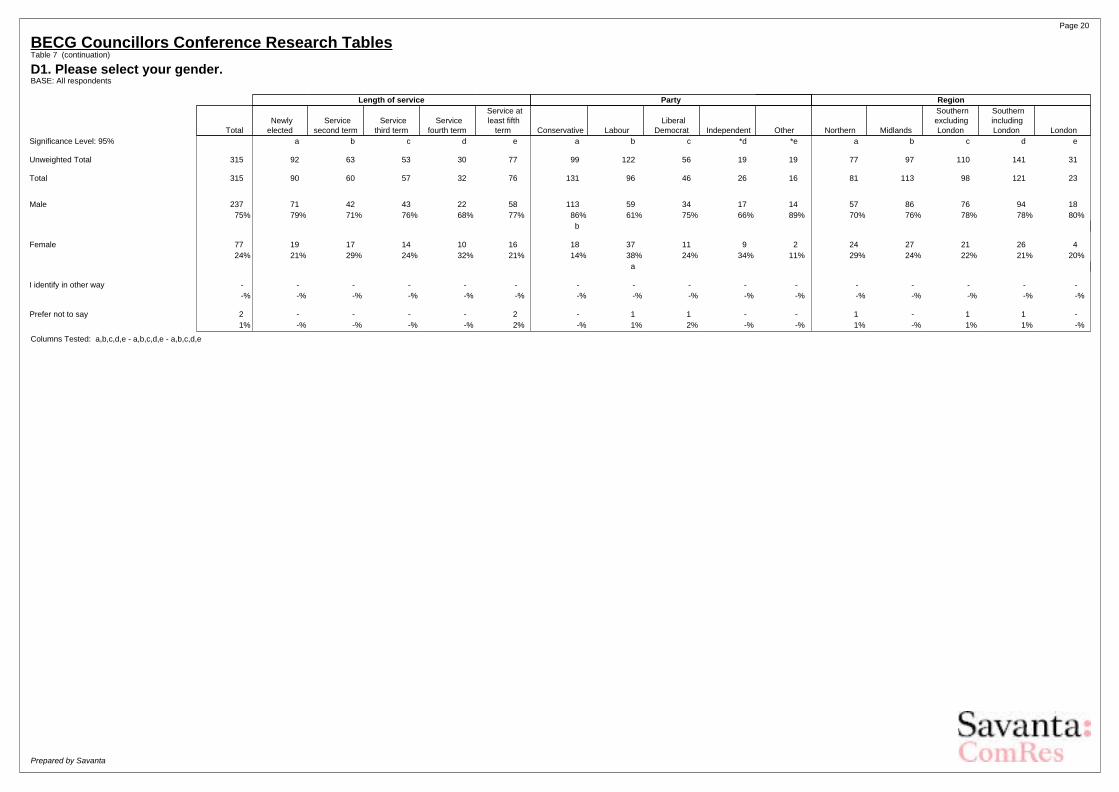
BECG Councillors Conference Research TablesTable 7 (continuation)
D1. Please select your gender.BASE: All respondents
Length of service Party Region
Total Newlyelected
Servicesecond term
Servicethird term
Servicefourth term
Service atleast fifth
term Conservative Labour Liberal
Democrat Independent Other Northern Midlands
SouthernexcludingLondon
SouthernincludingLondon London
Significance Level: 95% a b c d e a b c *d *e a b c d e
Unweighted Total 315 92 63 53 30 77 99 122 56 19 19 77 97 110 141 31
Total 315 90 60 57 32 76 131 96 46 26 16 81 113 98 121 23
Male 237 71 42 43 22 58 113 59 34 17 14 57 86 76 94 1875% 79% 71% 76% 68% 77% 86% 61% 75% 66% 89% 70% 76% 78% 78% 80%
b
Female 77 19 17 14 10 16 18 37 11 9 2 24 27 21 26 424% 21% 29% 24% 32% 21% 14% 38% 24% 34% 11% 29% 24% 22% 21% 20%
a
I identify in other way - - - - - - - - - - - - - - - --% -% -% -% -% -% -% -% -% -% -% -% -% -% -% -%
Prefer not to say 2 - - - - 2 - 1 1 - - 1 - 1 1 -1% -% -% -% -% 2% -% 1% 2% -% -% 1% -% 1% 1% -%
Columns Tested: a,b,c,d,e - a,b,c,d,e - a,b,c,d,e
Prepared by Savanta
Page 21
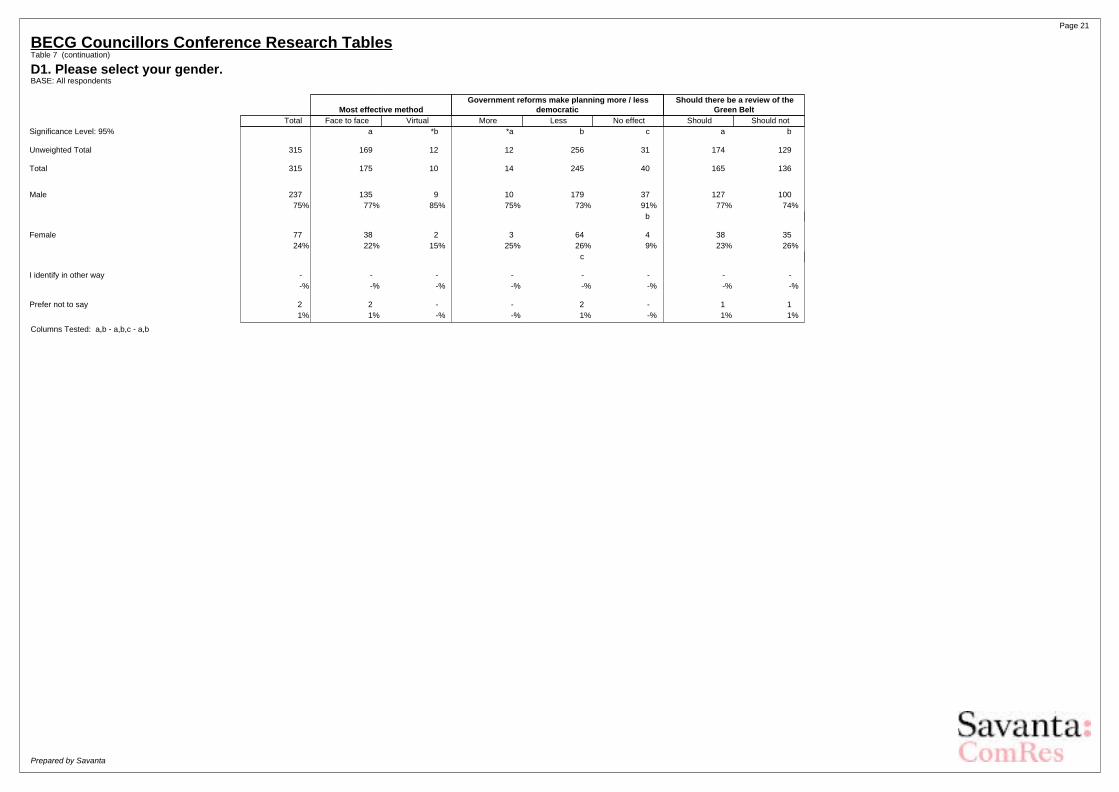
BECG Councillors Conference Research TablesTable 7 (continuation)
D1. Please select your gender.BASE: All respondents
Most effective methodGovernment reforms make planning more / less
democraticShould there be a review of the
Green BeltTotal Face to face Virtual More Less No effect Should Should not
Significance Level: 95% a *b *a b c a b
Unweighted Total 315 169 12 12 256 31 174 129
Total 315 175 10 14 245 40 165 136
Male 237 135 9 10 179 37 127 10075% 77% 85% 75% 73% 91% 77% 74%
b
Female 77 38 2 3 64 4 38 3524% 22% 15% 25% 26% 9% 23% 26%
c
I identify in other way - - - - - - - --% -% -% -% -% -% -% -%
Prefer not to say 2 2 - - 2 - 1 11% 1% -% -% 1% -% 1% 1%
Columns Tested: a,b - a,b,c - a,b
Prepared by Savanta
Page 22
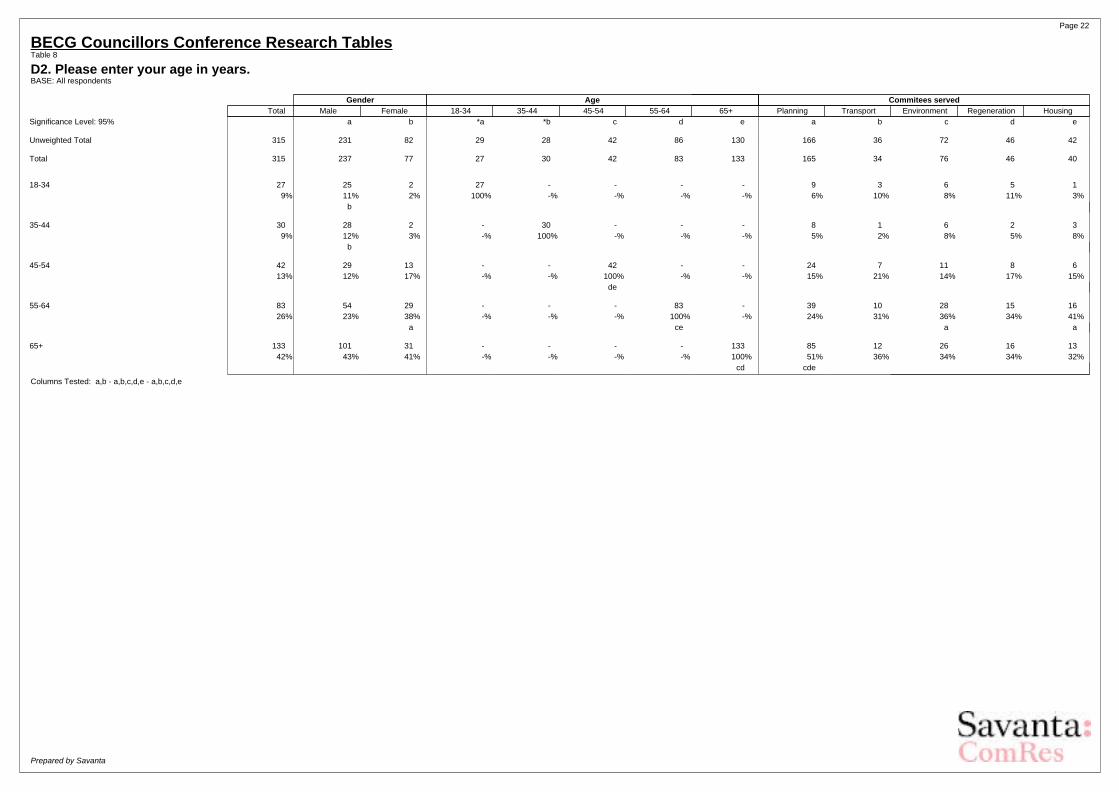
BECG Councillors Conference Research TablesTable 8
D2. Please enter your age in years.BASE: All respondents
Gender Age Commitees servedTotal Male Female 18-34 35-44 45-54 55-64 65+ Planning Transport Environment Regeneration Housing
Significance Level: 95% a b *a *b c d e a b c d e
Unweighted Total 315 231 82 29 28 42 86 130 166 36 72 46 42
Total 315 237 77 27 30 42 83 133 165 34 76 46 40
18-34 27 25 2 27 - - - - 9 3 6 5 19% 11% 2% 100% -% -% -% -% 6% 10% 8% 11% 3%
b
35-44 30 28 2 - 30 - - - 8 1 6 2 39% 12% 3% -% 100% -% -% -% 5% 2% 8% 5% 8%
b
45-54 42 29 13 - - 42 - - 24 7 11 8 613% 12% 17% -% -% 100% -% -% 15% 21% 14% 17% 15%
de
55-64 83 54 29 - - - 83 - 39 10 28 15 1626% 23% 38% -% -% -% 100% -% 24% 31% 36% 34% 41%
a ce a a
65+ 133 101 31 - - - - 133 85 12 26 16 1342% 43% 41% -% -% -% -% 100% 51% 36% 34% 34% 32%
cd cde
Columns Tested: a,b - a,b,c,d,e - a,b,c,d,e
Prepared by Savanta
Page 23
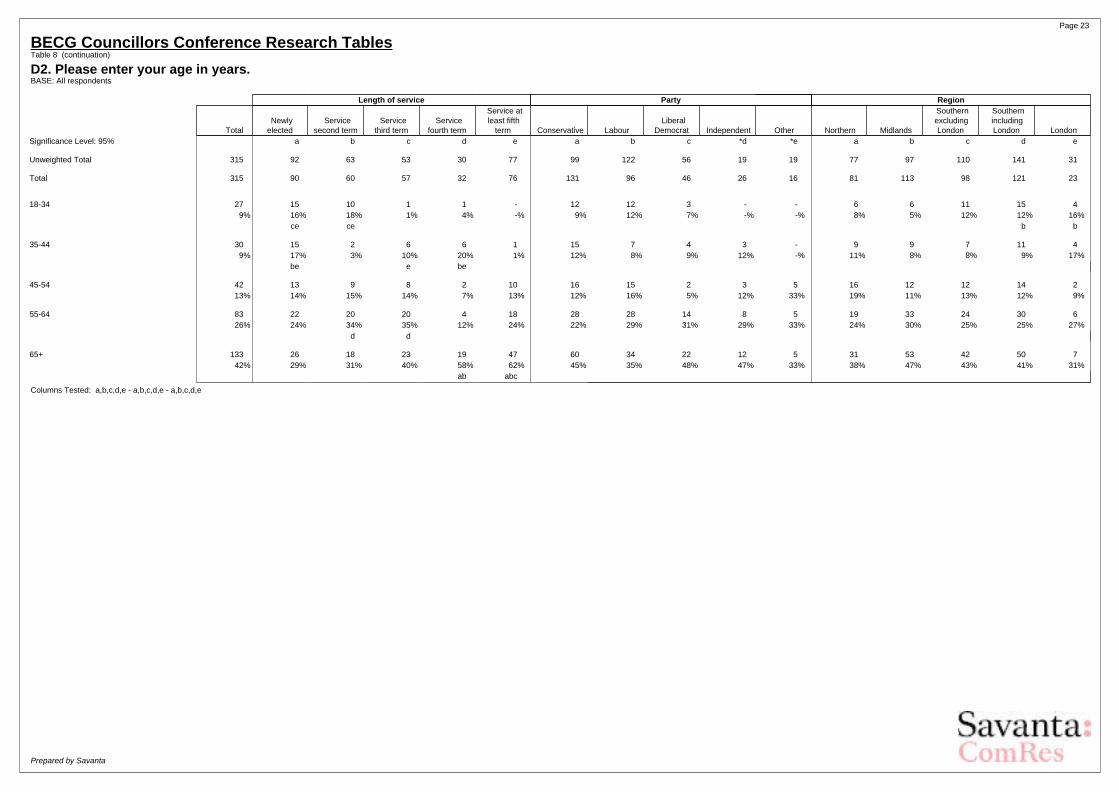
BECG Councillors Conference Research TablesTable 8 (continuation)
D2. Please enter your age in years.BASE: All respondents
Length of service Party Region
Total Newlyelected
Servicesecond term
Servicethird term
Servicefourth term
Service atleast fifth
term Conservative Labour Liberal
Democrat Independent Other Northern Midlands
SouthernexcludingLondon
SouthernincludingLondon London
Significance Level: 95% a b c d e a b c *d *e a b c d e
Unweighted Total 315 92 63 53 30 77 99 122 56 19 19 77 97 110 141 31
Total 315 90 60 57 32 76 131 96 46 26 16 81 113 98 121 23
18-34 27 15 10 1 1 - 12 12 3 - - 6 6 11 15 49% 16% 18% 1% 4% -% 9% 12% 7% -% -% 8% 5% 12% 12% 16%
ce ce b b
35-44 30 15 2 6 6 1 15 7 4 3 - 9 9 7 11 49% 17% 3% 10% 20% 1% 12% 8% 9% 12% -% 11% 8% 8% 9% 17%
be e be
45-54 42 13 9 8 2 10 16 15 2 3 5 16 12 12 14 213% 14% 15% 14% 7% 13% 12% 16% 5% 12% 33% 19% 11% 13% 12% 9%
55-64 83 22 20 20 4 18 28 28 14 8 5 19 33 24 30 626% 24% 34% 35% 12% 24% 22% 29% 31% 29% 33% 24% 30% 25% 25% 27%
d d
65+ 133 26 18 23 19 47 60 34 22 12 5 31 53 42 50 742% 29% 31% 40% 58% 62% 45% 35% 48% 47% 33% 38% 47% 43% 41% 31%
ab abc
Columns Tested: a,b,c,d,e - a,b,c,d,e - a,b,c,d,e
Prepared by Savanta
Page 24
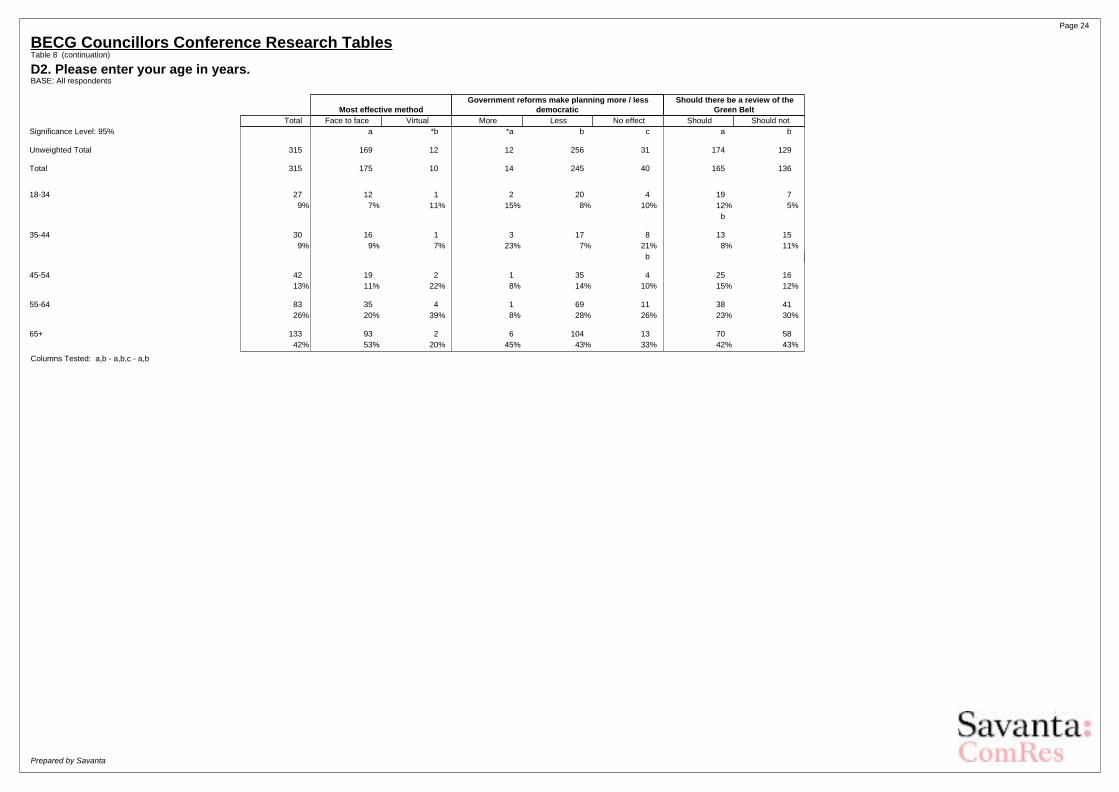
BECG Councillors Conference Research TablesTable 8 (continuation)
D2. Please enter your age in years.BASE: All respondents
Most effective methodGovernment reforms make planning more / less
democraticShould there be a review of the
Green BeltTotal Face to face Virtual More Less No effect Should Should not
Significance Level: 95% a *b *a b c a b
Unweighted Total 315 169 12 12 256 31 174 129
Total 315 175 10 14 245 40 165 136
18-34 27 12 1 2 20 4 19 79% 7% 11% 15% 8% 10% 12% 5%
b
35-44 30 16 1 3 17 8 13 159% 9% 7% 23% 7% 21% 8% 11%
b
45-54 42 19 2 1 35 4 25 1613% 11% 22% 8% 14% 10% 15% 12%
55-64 83 35 4 1 69 11 38 4126% 20% 39% 8% 28% 26% 23% 30%
65+ 133 93 2 6 104 13 70 5842% 53% 20% 45% 43% 33% 42% 43%
Columns Tested: a,b - a,b,c - a,b
Prepared by Savanta
Page 25
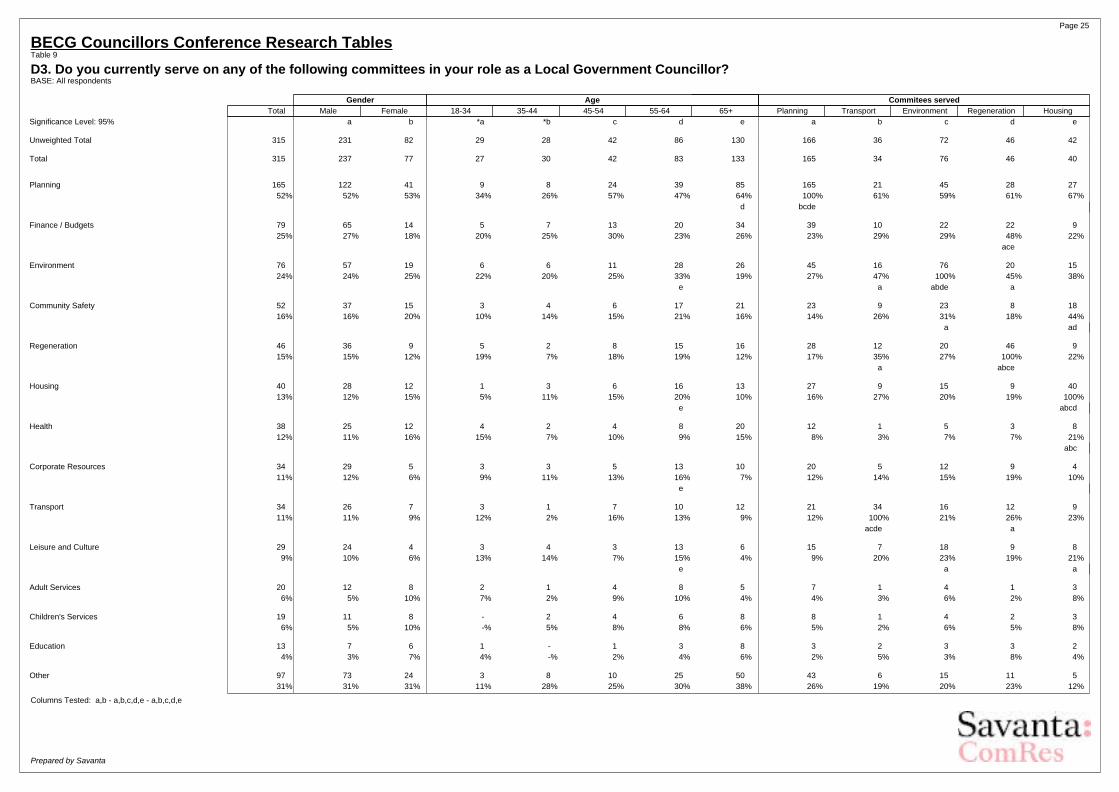
BECG Councillors Conference Research TablesTable 9
D3. Do you currently serve on any of the following committees in your role as a Local Government Councillor?BASE: All respondents
Gender Age Commitees servedTotal Male Female 18-34 35-44 45-54 55-64 65+ Planning Transport Environment Regeneration Housing
Significance Level: 95% a b *a *b c d e a b c d e
Unweighted Total 315 231 82 29 28 42 86 130 166 36 72 46 42
Total 315 237 77 27 30 42 83 133 165 34 76 46 40
Planning 165 122 41 9 8 24 39 85 165 21 45 28 2752% 52% 53% 34% 26% 57% 47% 64% 100% 61% 59% 61% 67%
d bcde
Finance / Budgets 79 65 14 5 7 13 20 34 39 10 22 22 925% 27% 18% 20% 25% 30% 23% 26% 23% 29% 29% 48% 22%
ace
Environment 76 57 19 6 6 11 28 26 45 16 76 20 1524% 24% 25% 22% 20% 25% 33% 19% 27% 47% 100% 45% 38%
e a abde a
Community Safety 52 37 15 3 4 6 17 21 23 9 23 8 1816% 16% 20% 10% 14% 15% 21% 16% 14% 26% 31% 18% 44%
a ad
Regeneration 46 36 9 5 2 8 15 16 28 12 20 46 915% 15% 12% 19% 7% 18% 19% 12% 17% 35% 27% 100% 22%
a abce
Housing 40 28 12 1 3 6 16 13 27 9 15 9 4013% 12% 15% 5% 11% 15% 20% 10% 16% 27% 20% 19% 100%
e abcd
Health 38 25 12 4 2 4 8 20 12 1 5 3 812% 11% 16% 15% 7% 10% 9% 15% 8% 3% 7% 7% 21%
abc
Corporate Resources 34 29 5 3 3 5 13 10 20 5 12 9 411% 12% 6% 9% 11% 13% 16% 7% 12% 14% 15% 19% 10%
e
Transport 34 26 7 3 1 7 10 12 21 34 16 12 911% 11% 9% 12% 2% 16% 13% 9% 12% 100% 21% 26% 23%
acde a
Leisure and Culture 29 24 4 3 4 3 13 6 15 7 18 9 89% 10% 6% 13% 14% 7% 15% 4% 9% 20% 23% 19% 21%
e a a
Adult Services 20 12 8 2 1 4 8 5 7 1 4 1 36% 5% 10% 7% 2% 9% 10% 4% 4% 3% 6% 2% 8%
Children's Services 19 11 8 - 2 4 6 8 8 1 4 2 36% 5% 10% -% 5% 8% 8% 6% 5% 2% 6% 5% 8%
Education 13 7 6 1 - 1 3 8 3 2 3 3 24% 3% 7% 4% -% 2% 4% 6% 2% 5% 3% 8% 4%
Other 97 73 24 3 8 10 25 50 43 6 15 11 531% 31% 31% 11% 28% 25% 30% 38% 26% 19% 20% 23% 12%
Columns Tested: a,b - a,b,c,d,e - a,b,c,d,e
Prepared by Savanta

Page 26
BECG Councillors Conference Research TablesTable 9 (continuation)
D3. Do you currently serve on any of the following committees in your role as a Local Government Councillor?BASE: All respondents
Gender Age Commitees servedTotal Male Female 18-34 35-44 45-54 55-64 65+ Planning Transport Environment Regeneration Housing
Significance Level: 95% a b *a *b c d e a b c d e
Unweighted Total 315 231 82 29 28 42 86 130 166 36 72 46 42
Total 315 237 77 27 30 42 83 133 165 34 76 46 40
None of these 21 18 3 6 4 3 5 3 - - - - -7% 8% 4% 22% 14% 8% 6% 2% -% -% -% -% -%
Columns Tested: a,b - a,b,c,d,e - a,b,c,d,e
Prepared by Savanta

Page 27
BECG Councillors Conference Research TablesTable 9 (continuation)
D3. Do you currently serve on any of the following committees in your role as a Local Government Councillor?BASE: All respondents
Length of service Party Region
Total Newlyelected
Servicesecond term
Servicethird term
Servicefourth term
Service atleast fifth
term Conservative Labour Liberal
Democrat Independent Other Northern Midlands
SouthernexcludingLondon
SouthernincludingLondon London
Significance Level: 95% a b c d e a b c *d *e a b c d e
Unweighted Total 315 92 63 53 30 77 99 122 56 19 19 77 97 110 141 31
Total 315 90 60 57 32 76 131 96 46 26 16 81 113 98 121 23
Planning 165 45 36 23 14 47 73 44 31 11 6 32 64 57 69 1352% 50% 60% 40% 42% 62% 55% 46% 68% 43% 39% 39% 57% 58% 57% 54%
c c b a a a
Finance / Budgets 79 17 24 11 8 19 39 22 11 5 1 21 26 28 32 425% 19% 41% 20% 24% 25% 30% 22% 25% 21% 9% 26% 23% 29% 27% 16%
ace
Environment 76 19 12 20 9 16 34 17 14 8 3 19 28 22 28 524% 21% 20% 35% 27% 21% 26% 18% 30% 31% 22% 24% 25% 23% 23% 24%
Community Safety 52 8 9 18 9 7 21 17 6 4 4 21 13 16 18 216% 9% 15% 32% 28% 10% 16% 18% 12% 16% 26% 26% 11% 16% 15% 9%
abe ae bd
Regeneration 46 11 13 7 6 9 18 14 8 3 3 12 18 14 17 215% 12% 21% 13% 17% 12% 14% 14% 17% 12% 22% 14% 16% 15% 14% 9%
Housing 40 9 7 7 8 9 18 12 7 2 1 11 9 17 20 313% 10% 12% 12% 24% 12% 14% 12% 16% 6% 9% 14% 8% 17% 16% 12%
Health 38 8 9 10 7 5 13 14 6 3 2 16 11 9 12 312% 8% 15% 17% 23% 7% 10% 15% 14% 10% 10% 19% 9% 9% 10% 15%
ae c
Corporate Resources 34 7 8 10 3 6 13 13 5 1 2 12 8 12 14 211% 7% 14% 18% 9% 8% 10% 14% 11% 4% 12% 14% 7% 12% 12% 11%
a
Transport 34 7 6 9 4 7 12 10 5 3 4 8 5 16 20 411% 8% 11% 16% 11% 9% 9% 10% 12% 11% 23% 10% 5% 16% 17% 17%
b b b
Leisure and Culture 29 8 7 9 2 3 11 8 7 1 2 9 9 7 11 49% 9% 12% 15% 7% 3% 8% 8% 16% 4% 12% 11% 8% 7% 9% 15%
e
Adult Services 20 7 5 3 3 2 4 10 2 3 1 13 4 3 3 16% 7% 8% 6% 10% 2% 3% 10% 5% 11% 5% 16% 3% 3% 3% 3%
bcd
Children's Services 19 6 2 4 4 2 5 7 2 2 3 11 2 4 6 16% 7% 4% 8% 12% 2% 4% 8% 3% 6% 21% 14% 2% 4% 5% 6%
e bcd
Education 13 1 2 4 3 2 5 7 2 - - 9 3 1 1 14% 2% 3% 8% 10% 3% 4% 7% 3% -% -% 11% 3% 1% 1% 3%
a bcd
Columns Tested: a,b,c,d,e - a,b,c,d,e - a,b,c,d,e
Prepared by Savanta
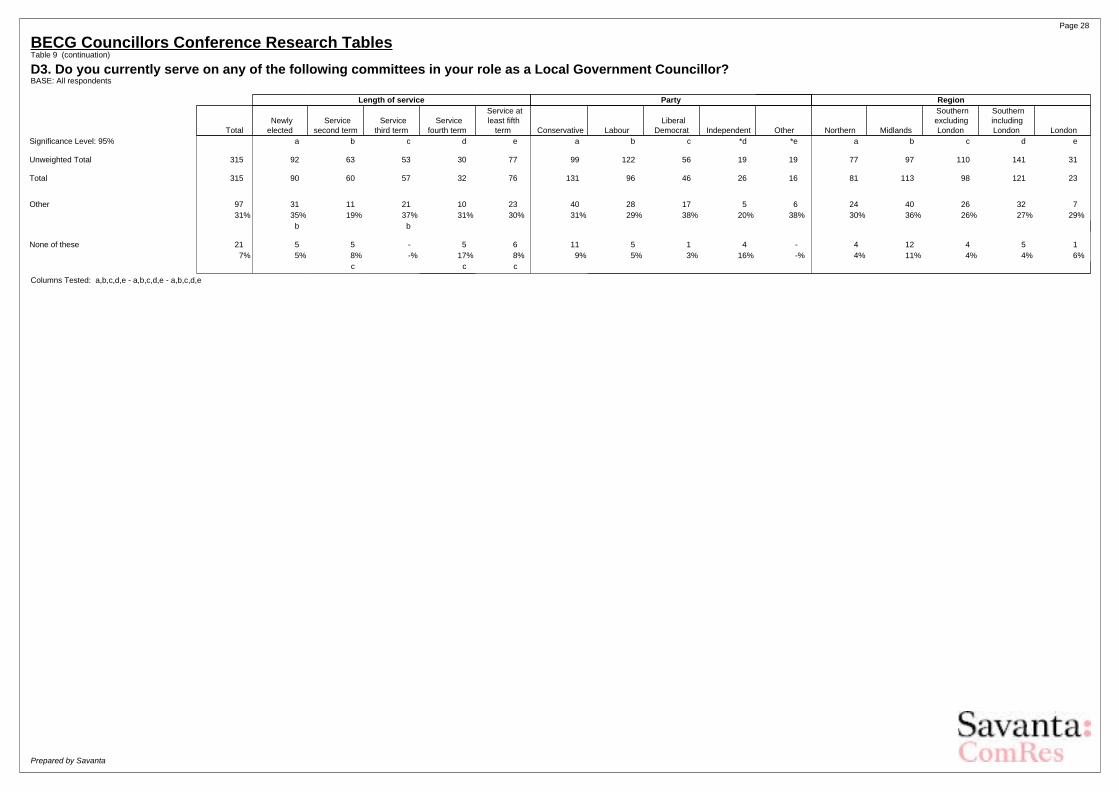
Page 28
BECG Councillors Conference Research TablesTable 9 (continuation)
D3. Do you currently serve on any of the following committees in your role as a Local Government Councillor?BASE: All respondents
Length of service Party Region
Total Newlyelected
Servicesecond term
Servicethird term
Servicefourth term
Service atleast fifth
term Conservative Labour Liberal
Democrat Independent Other Northern Midlands
SouthernexcludingLondon
SouthernincludingLondon London
Significance Level: 95% a b c d e a b c *d *e a b c d e
Unweighted Total 315 92 63 53 30 77 99 122 56 19 19 77 97 110 141 31
Total 315 90 60 57 32 76 131 96 46 26 16 81 113 98 121 23
Other 97 31 11 21 10 23 40 28 17 5 6 24 40 26 32 731% 35% 19% 37% 31% 30% 31% 29% 38% 20% 38% 30% 36% 26% 27% 29%
b b
None of these 21 5 5 - 5 6 11 5 1 4 - 4 12 4 5 17% 5% 8% -% 17% 8% 9% 5% 3% 16% -% 4% 11% 4% 4% 6%
c c c
Columns Tested: a,b,c,d,e - a,b,c,d,e - a,b,c,d,e
Prepared by Savanta

Page 29
BECG Councillors Conference Research TablesTable 9 (continuation)
D3. Do you currently serve on any of the following committees in your role as a Local Government Councillor?BASE: All respondents
Most effective methodGovernment reforms make planning more / less
democraticShould there be a review of the
Green BeltTotal Face to face Virtual More Less No effect Should Should not
Significance Level: 95% a *b *a b c a b
Unweighted Total 315 169 12 12 256 31 174 129
Total 315 175 10 14 245 40 165 136
Planning 165 93 3 4 138 15 84 7352% 53% 32% 26% 56% 37% 51% 54%
c
Finance / Budgets 79 44 1 6 57 11 45 3425% 25% 13% 44% 23% 27% 27% 25%
Environment 76 45 1 3 62 8 37 3424% 26% 9% 20% 25% 20% 22% 25%
Community Safety 52 29 1 2 42 5 26 2316% 17% 9% 14% 17% 11% 16% 17%
Regeneration 46 25 1 1 37 6 29 1715% 14% 9% 10% 15% 14% 18% 12%
Housing 40 17 2 - 32 7 24 1513% 10% 16% -% 13% 18% 15% 11%
Health 38 21 4 1 31 3 22 1612% 12% 40% 10% 13% 9% 14% 12%
Corporate Resources 34 18 1 - 28 5 19 1511% 10% 7% -% 11% 12% 12% 11%
Transport 34 15 2 2 28 4 20 1211% 8% 19% 14% 11% 9% 12% 9%
Leisure and Culture 29 13 2 - 24 4 14 139% 7% 16% -% 10% 11% 9% 10%
Adult Services 20 8 - - 16 1 14 66% 5% -% -% 7% 3% 8% 4%
Children's Services 19 8 1 3 11 1 10 96% 5% 13% 20% 4% 3% 6% 7%
Education 13 6 1 - 9 3 8 54% 4% 6% -% 4% 6% 5% 4%
Other 97 55 3 3 75 14 48 4631% 32% 29% 22% 31% 34% 29% 34%
None of these 21 10 2 3 13 5 13 87% 6% 24% 22% 5% 13% 8% 6%
Columns Tested: a,b - a,b,c - a,b
Prepared by Savanta
Page 30
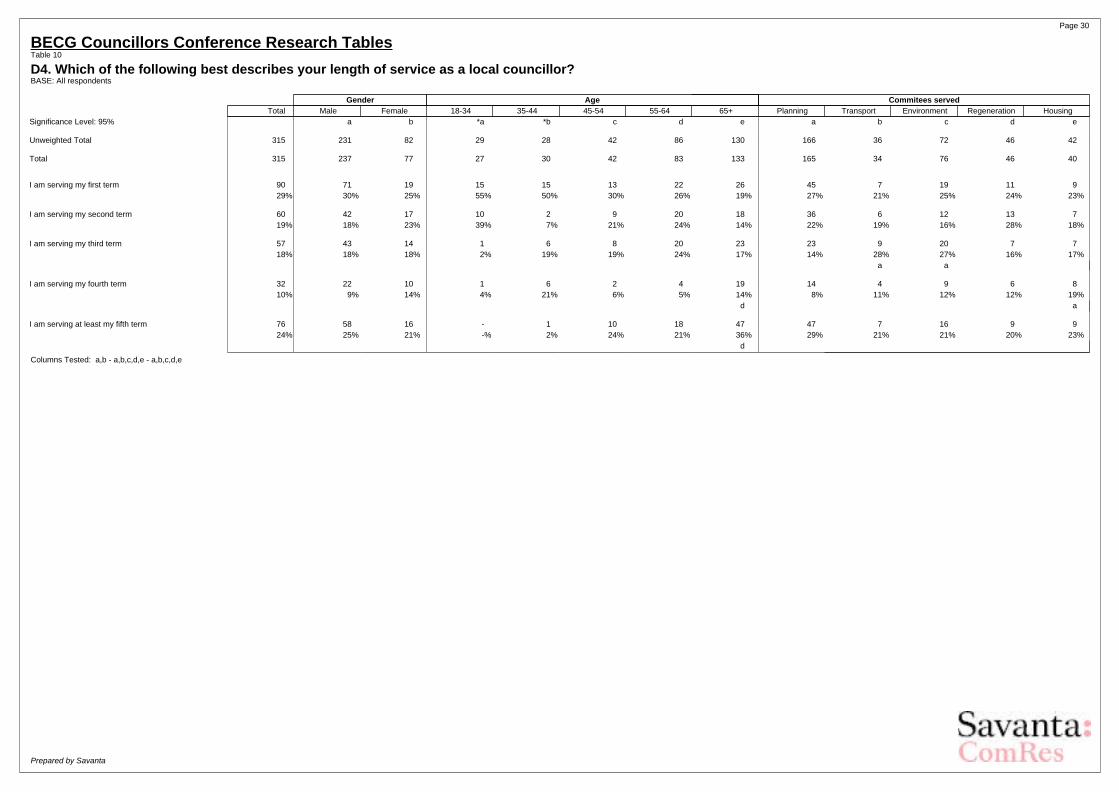
BECG Councillors Conference Research TablesTable 10
D4. Which of the following best describes your length of service as a local councillor?BASE: All respondents
Gender Age Commitees servedTotal Male Female 18-34 35-44 45-54 55-64 65+ Planning Transport Environment Regeneration Housing
Significance Level: 95% a b *a *b c d e a b c d e
Unweighted Total 315 231 82 29 28 42 86 130 166 36 72 46 42
Total 315 237 77 27 30 42 83 133 165 34 76 46 40
I am serving my first term 90 71 19 15 15 13 22 26 45 7 19 11 929% 30% 25% 55% 50% 30% 26% 19% 27% 21% 25% 24% 23%
I am serving my second term 60 42 17 10 2 9 20 18 36 6 12 13 719% 18% 23% 39% 7% 21% 24% 14% 22% 19% 16% 28% 18%
I am serving my third term 57 43 14 1 6 8 20 23 23 9 20 7 718% 18% 18% 2% 19% 19% 24% 17% 14% 28% 27% 16% 17%
a a
I am serving my fourth term 32 22 10 1 6 2 4 19 14 4 9 6 810% 9% 14% 4% 21% 6% 5% 14% 8% 11% 12% 12% 19%
d a
I am serving at least my fifth term 76 58 16 - 1 10 18 47 47 7 16 9 924% 25% 21% -% 2% 24% 21% 36% 29% 21% 21% 20% 23%
d
Columns Tested: a,b - a,b,c,d,e - a,b,c,d,e
Prepared by Savanta
Page 31
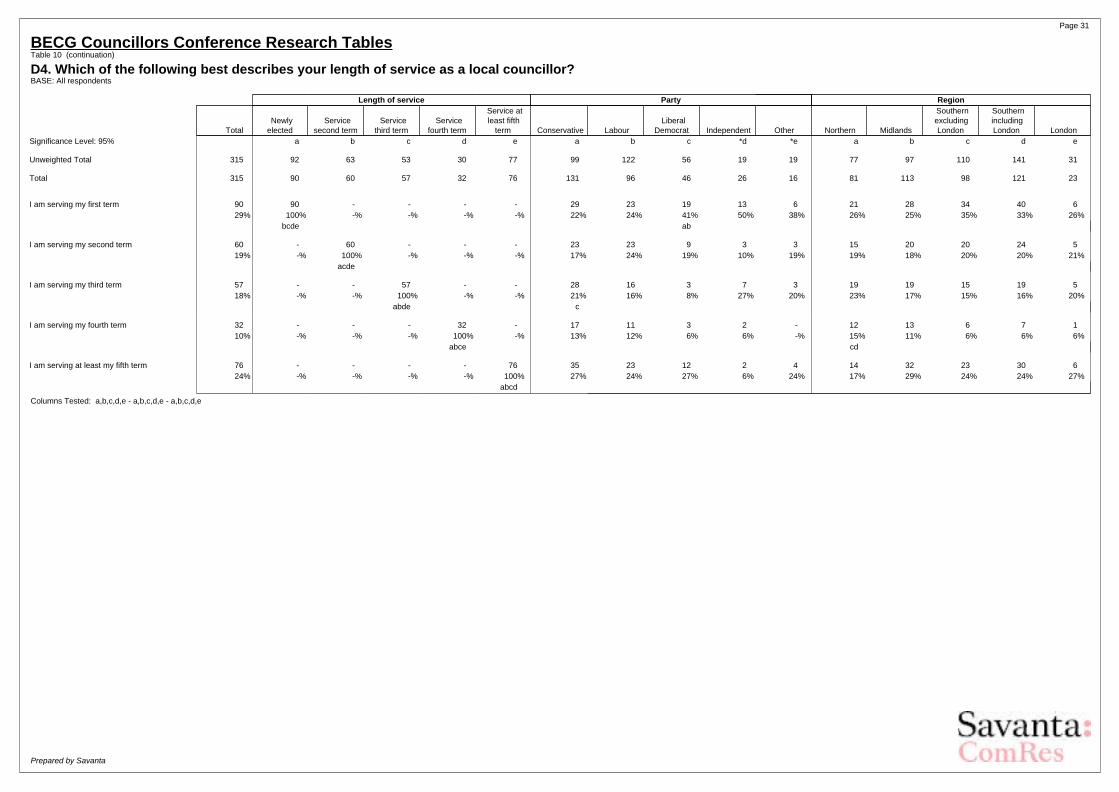
BECG Councillors Conference Research TablesTable 10 (continuation)
D4. Which of the following best describes your length of service as a local councillor?BASE: All respondents
Length of service Party Region
Total Newlyelected
Servicesecond term
Servicethird term
Servicefourth term
Service atleast fifth
term Conservative Labour Liberal
Democrat Independent Other Northern Midlands
SouthernexcludingLondon
SouthernincludingLondon London
Significance Level: 95% a b c d e a b c *d *e a b c d e
Unweighted Total 315 92 63 53 30 77 99 122 56 19 19 77 97 110 141 31
Total 315 90 60 57 32 76 131 96 46 26 16 81 113 98 121 23
I am serving my first term 90 90 - - - - 29 23 19 13 6 21 28 34 40 629% 100% -% -% -% -% 22% 24% 41% 50% 38% 26% 25% 35% 33% 26%
bcde ab
I am serving my second term 60 - 60 - - - 23 23 9 3 3 15 20 20 24 519% -% 100% -% -% -% 17% 24% 19% 10% 19% 19% 18% 20% 20% 21%
acde
I am serving my third term 57 - - 57 - - 28 16 3 7 3 19 19 15 19 518% -% -% 100% -% -% 21% 16% 8% 27% 20% 23% 17% 15% 16% 20%
abde c
I am serving my fourth term 32 - - - 32 - 17 11 3 2 - 12 13 6 7 110% -% -% -% 100% -% 13% 12% 6% 6% -% 15% 11% 6% 6% 6%
abce cd
I am serving at least my fifth term 76 - - - - 76 35 23 12 2 4 14 32 23 30 624% -% -% -% -% 100% 27% 24% 27% 6% 24% 17% 29% 24% 24% 27%
abcd
Columns Tested: a,b,c,d,e - a,b,c,d,e - a,b,c,d,e
Prepared by Savanta
Page 32
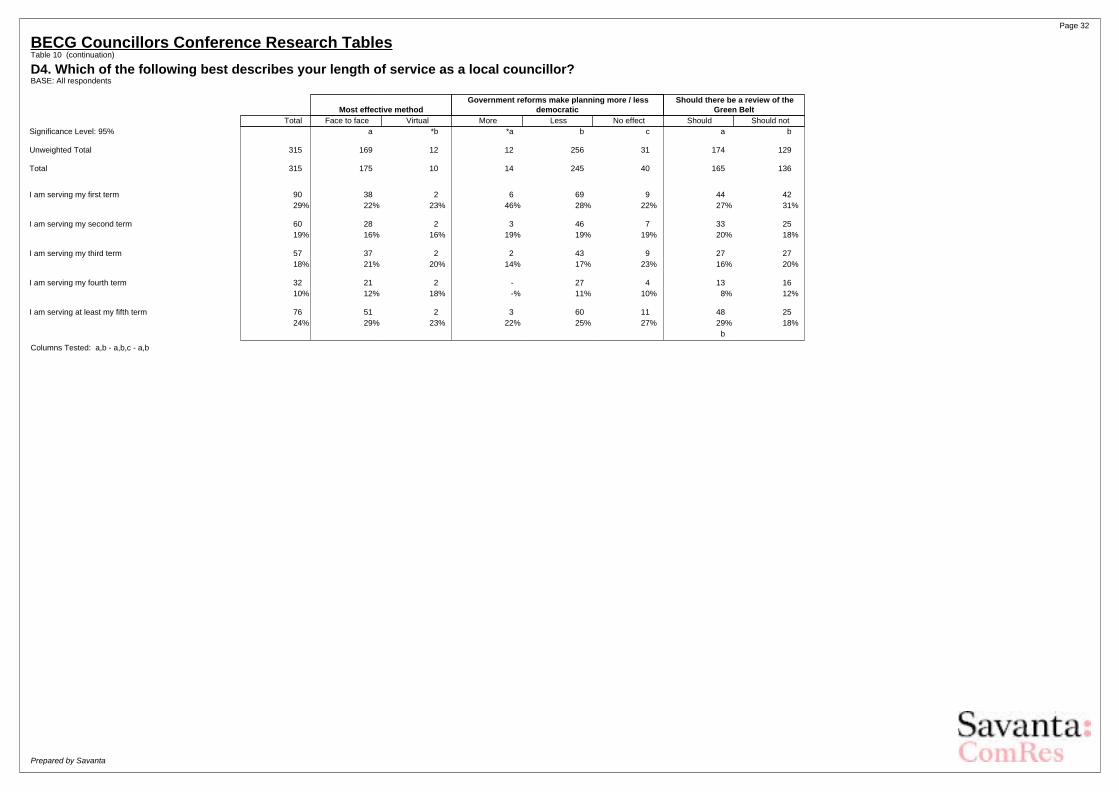
BECG Councillors Conference Research TablesTable 10 (continuation)
D4. Which of the following best describes your length of service as a local councillor?BASE: All respondents
Most effective methodGovernment reforms make planning more / less
democraticShould there be a review of the
Green BeltTotal Face to face Virtual More Less No effect Should Should not
Significance Level: 95% a *b *a b c a b
Unweighted Total 315 169 12 12 256 31 174 129
Total 315 175 10 14 245 40 165 136
I am serving my first term 90 38 2 6 69 9 44 4229% 22% 23% 46% 28% 22% 27% 31%
I am serving my second term 60 28 2 3 46 7 33 2519% 16% 16% 19% 19% 19% 20% 18%
I am serving my third term 57 37 2 2 43 9 27 2718% 21% 20% 14% 17% 23% 16% 20%
I am serving my fourth term 32 21 2 - 27 4 13 1610% 12% 18% -% 11% 10% 8% 12%
I am serving at least my fifth term 76 51 2 3 60 11 48 2524% 29% 23% 22% 25% 27% 29% 18%
b
Columns Tested: a,b - a,b,c - a,b
Prepared by Savanta