Backdrafting Overblown! Rethinking Combustion Appliance Safety
February 26, 2014 RESNET, Atlanta, GA
Brett Singer & Vi Rapp [email protected] [email protected]
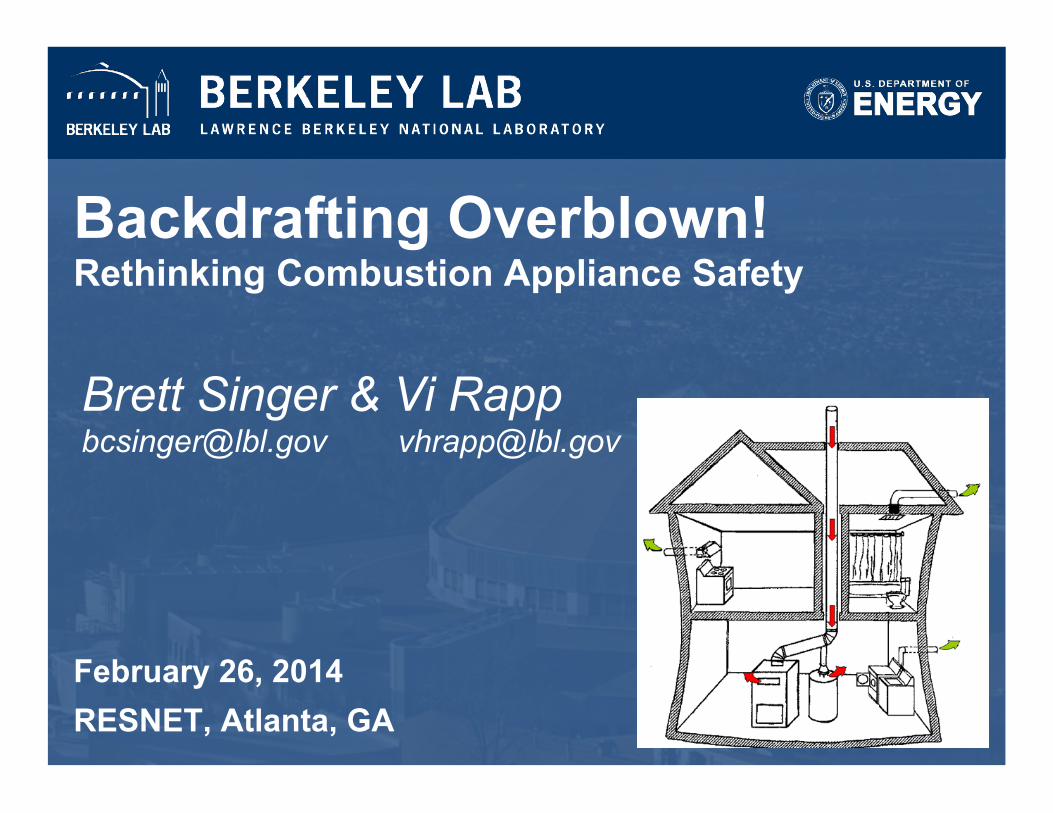
Why do we conduct combustion safety tests?
Singer & Rapp 2 Feb 26, 2014
What are we worried about?
What are we trying to prevent?

What are the most severe combustion appliance hazards?
Singer & Rapp 3 Feb 26, 2014
What are the most common combustion appliance hazards?

What level of health risk are we willing to tolerate?
Singer & Rapp 4 Feb 26, 2014
Key Point: Objectives
Critical: Identify appliances and venting systems that are broken or likely to break.
Critical: Identify gas leaks and other life-safety hazards.
Important: Identify appliances that cannot reliably establish draft under conditions that are likely to be encountered.
Feb 26, 2014 Singer & Rapp 5

Natural draft appliance + airtight home
Source: Moore, Rich (2011). CAZ Pressure Testing. ACI Presentation, March, Denver, CO.
Death by Carbon
Monoxide
Feb 26, 2014 Singer & Rapp 6
= DANGER
IS THIS TRUE?

Engine Driven Tools
49%
Furnaces 14%
Other Heating Systems
17%
Water Heaters
2%
Ranges and Ovens
2% Multiple Products
8%
Other 8%
Reality: more deaths by lightning than by furnace or water heater CO
Source: Hnatov, M.V., Non-Fire Carbon Monoxide Deaths Associated with the Use of consumer
Products: 2007 Annual Estimates (2011)
2002-2011 average:37 deaths / year from lightning
(NOAA)
< 32 deaths / year from water heaters
and furnaces
U.S. average 2005-2007: 184 deaths / year from unintentional CO poisoning
Feb 26, 2014 Singer & Rapp 7

Health hazards associated with combustion appliances
Singer & Rapp 8 Feb 26, 2014
Life-Safety CO at level that impairs judgment, creates risk of more severe effects including death (100+ ppm CO)
Acute Impacts sensitive individuals when CO & NO2 exceed outdoor air quality standards
(10-50 ppm CO; 100-200 ppb NO2)
Chronic Low-level exposures over periods of weeks or more (5-10 ppm CO)
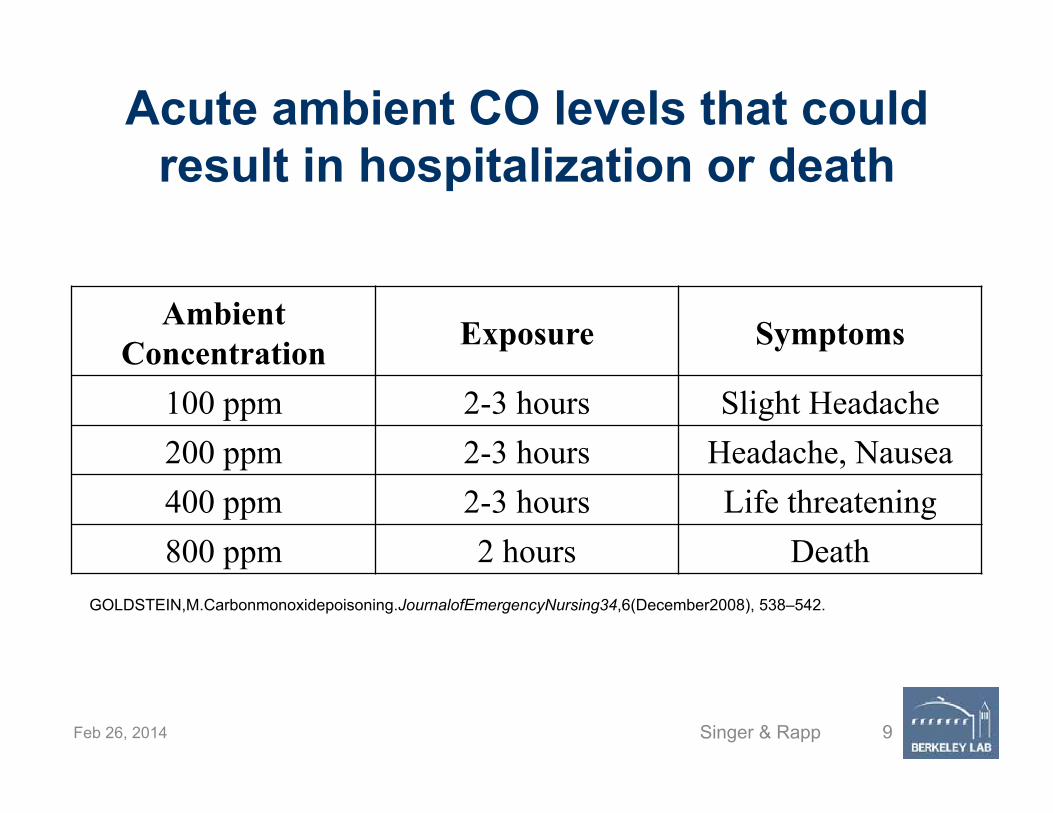
Acute ambient CO levels that could result in hospitalization or death
Ambient Concentration Exposure Symptoms
100 ppm 2-3 hours Slight Headache 200 ppm 2-3 hours Headache, Nausea 400 ppm 2-3 hours Life threatening 800 ppm 2 hours Death
Feb 26, 2014 Singer & Rapp 9
GOLDSTEIN,M.Carbonmonoxidepoisoning.JournalofEmergencyNursing34,6(December2008), 538–542.

CO standards to protect sensitive sub-populations of general population
Organization 1 hour average (ppm)
8 hour average (ppm)
National Ambient Air Quality Stds
35 9
California Ambient Air Quality Stds
20 9
Health Canada 25 10** Consumer Product Safety Commission
25 15
** 24 hour time-weighted average
Feb 26, 2014 Singer & Rapp 10

Health hazards associated with combustion appliances
Singer & Rapp 11 Feb 26, 2014
Life-Safety: Must NEVER happen Requires extreme failure of burner and venting; not just depressurization-induced spillage
Acute: Costly to eliminate; must manage Sustained spillage + problem with combustion
Chronic: Minimal risk achievable Requires routine spillage + compromised combustion Moisture can can still be a problem even if CO low
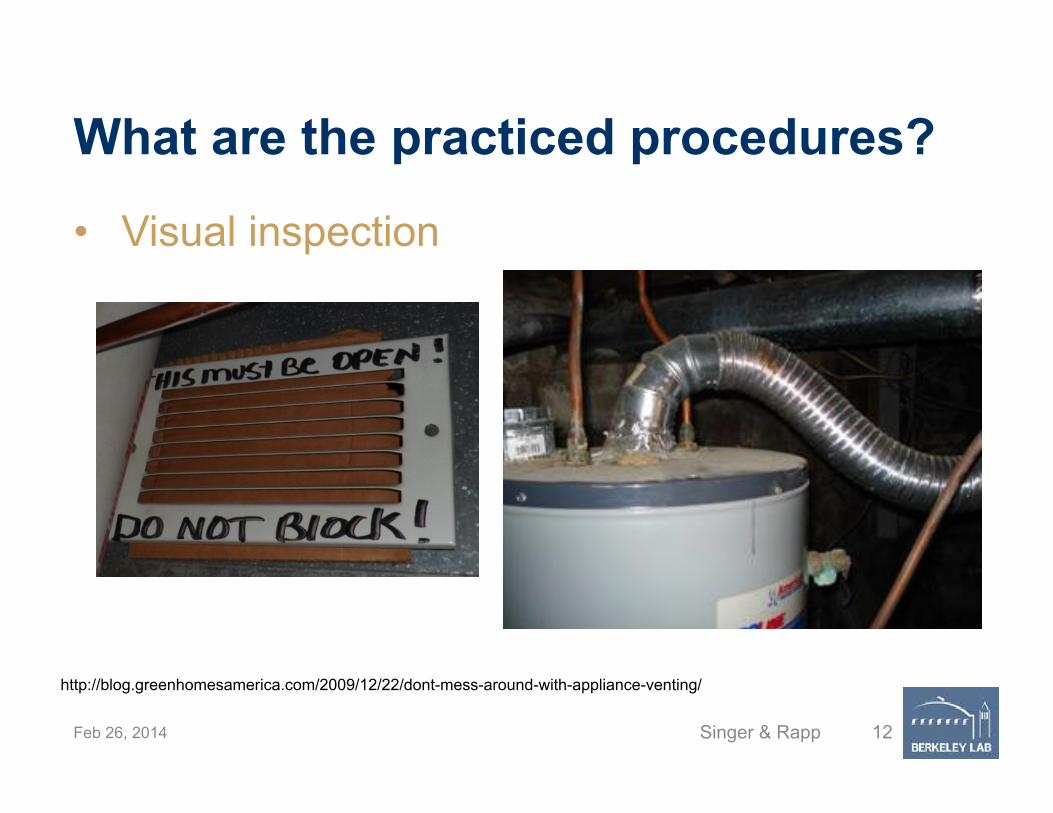
What are the practiced procedures?
Singer & Rapp 12 Feb 26, 2014
Visual inspection
http://blog.greenhomesamerica.com/2009/12/22/dont-mess-around-with-appliance-venting/
Singer & Rapp 13 Feb 26, 2014
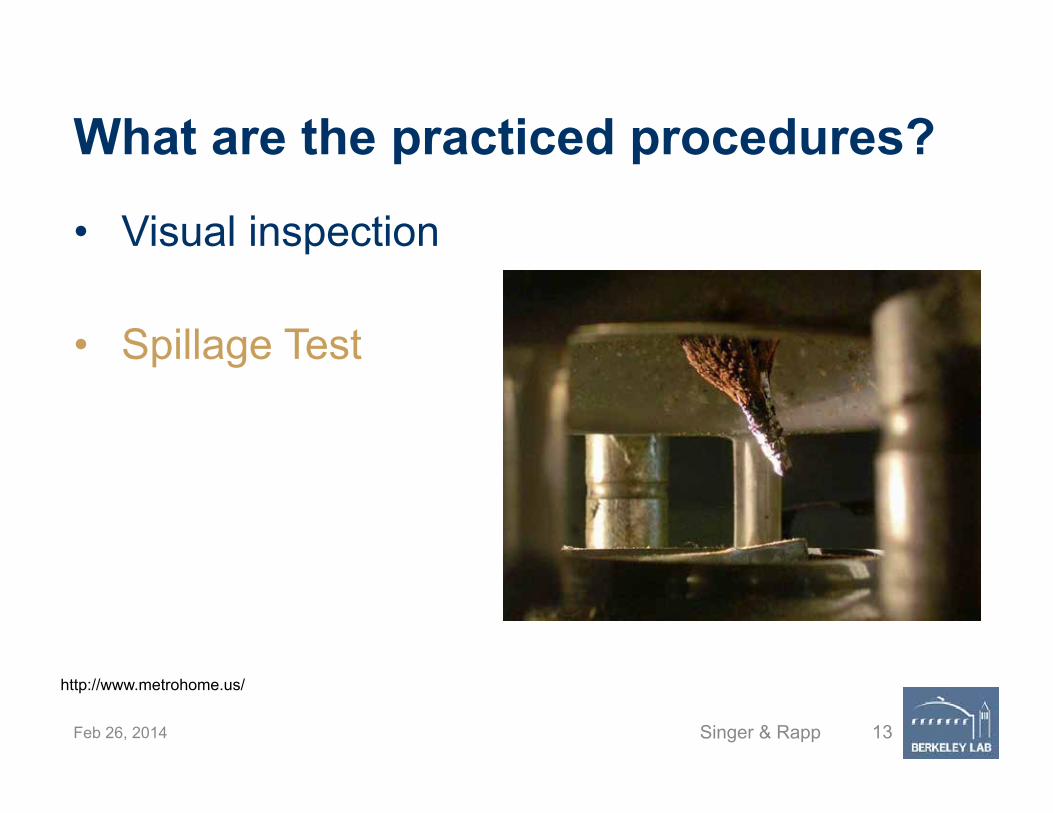
Visual inspection
Spillage Test
http://www.metrohome.us/
What are the practiced procedures?

Singer & Rapp 14 Feb 26, 2014
Visual inspection
Spillage Test
Flue CO Test
http://www.htownhomeinspector.com/node/56 http://www.plumbtechnj.com/wp-content/uploads/2012/09/Carbon-monoxide-awareness.jpg
What are the practiced procedures?
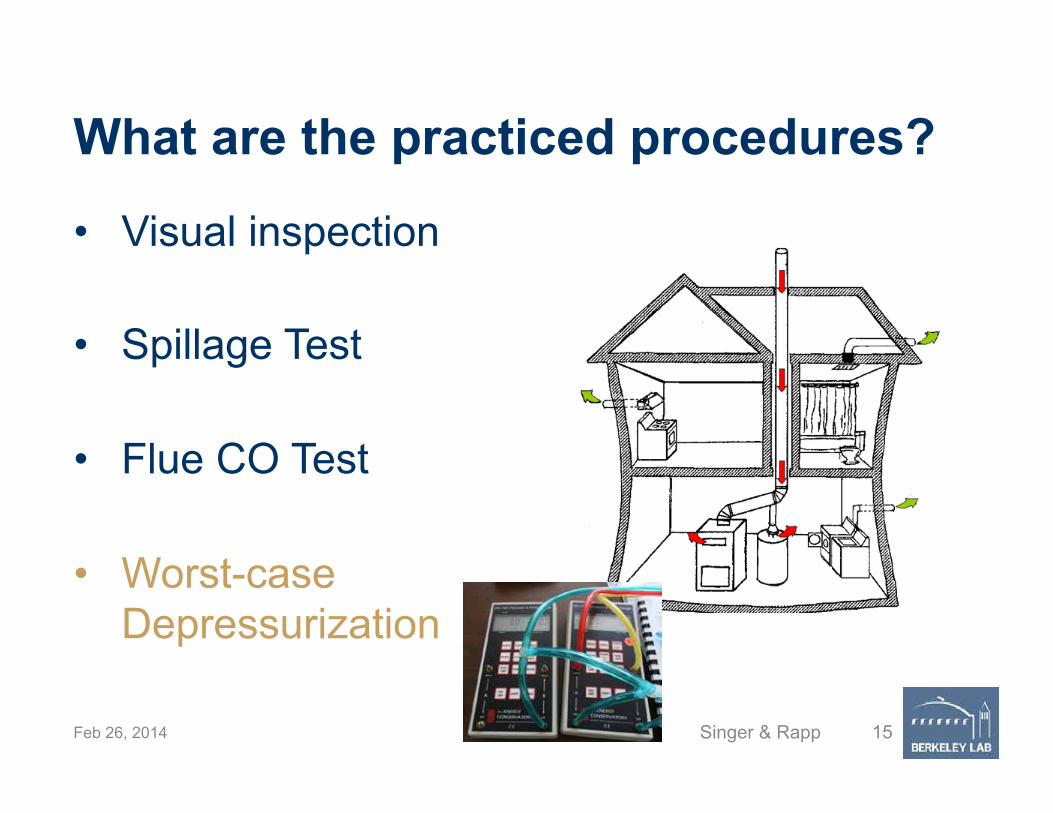
What are the practiced procedures?
Singer & Rapp 15 Feb 26, 2014
Visual inspection
Spillage Test
Flue CO Test
Worst-case Depressurization

What are the practiced procedures?
Singer & Rapp 16 Feb 26, 2014
Visual inspection
Spillage Test
Flue CO Test
Worst-case Depressurization
What do the results mean?
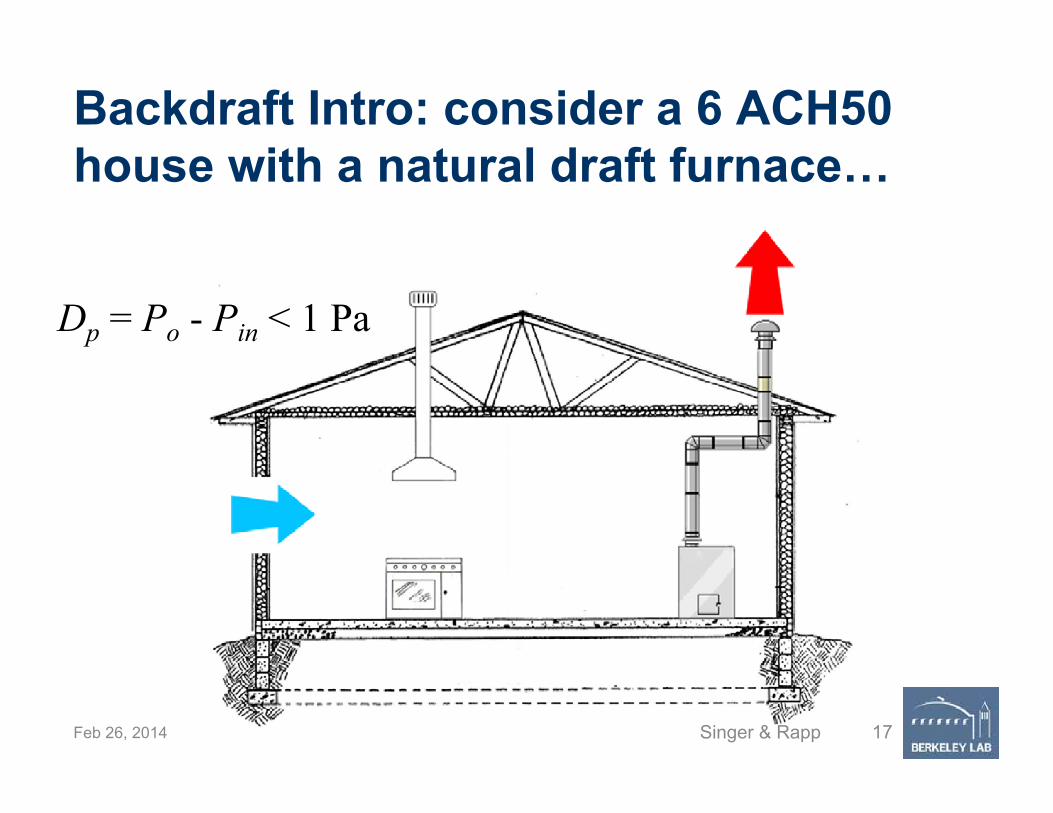
Backdraft Intro: consider a 6 ACH50 house with a natural draft furnace…
Dp = Po - Pin < 1 Pa
Feb 26, 2014 Singer & Rapp 17
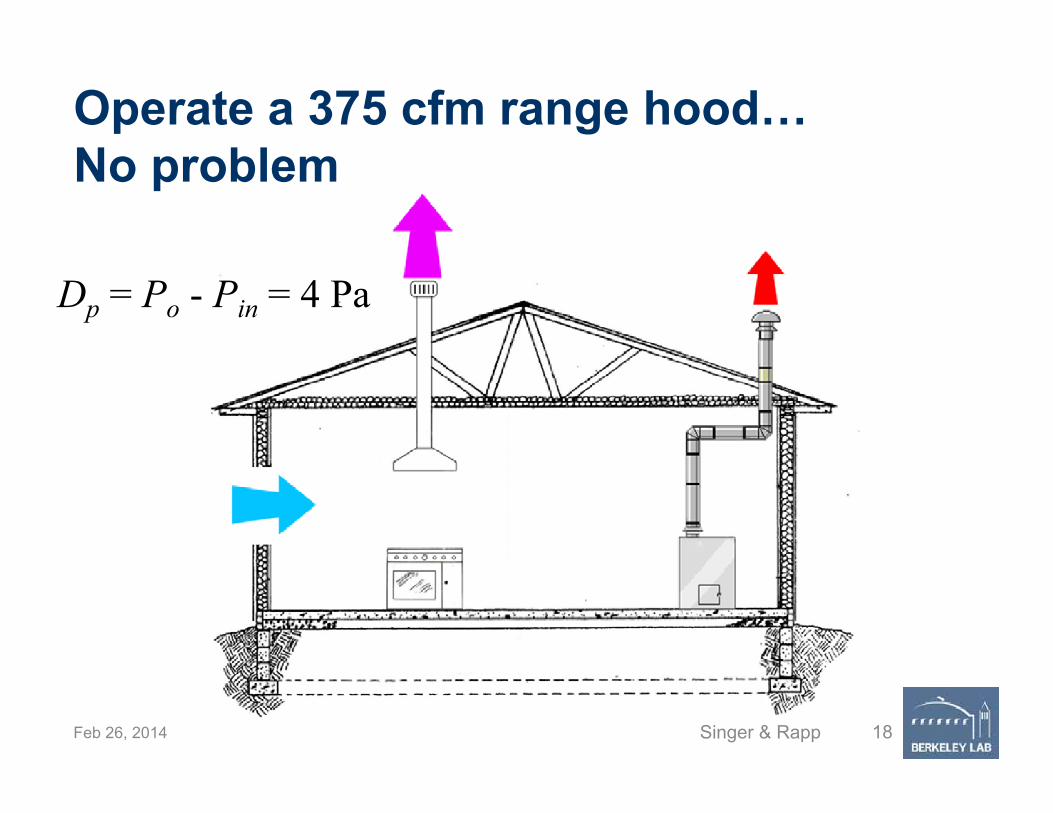
Operate a 375 cfm range hood… No problem
Dp = Po - Pin = 4 Pa
Feb 26, 2014 Singer & Rapp 18
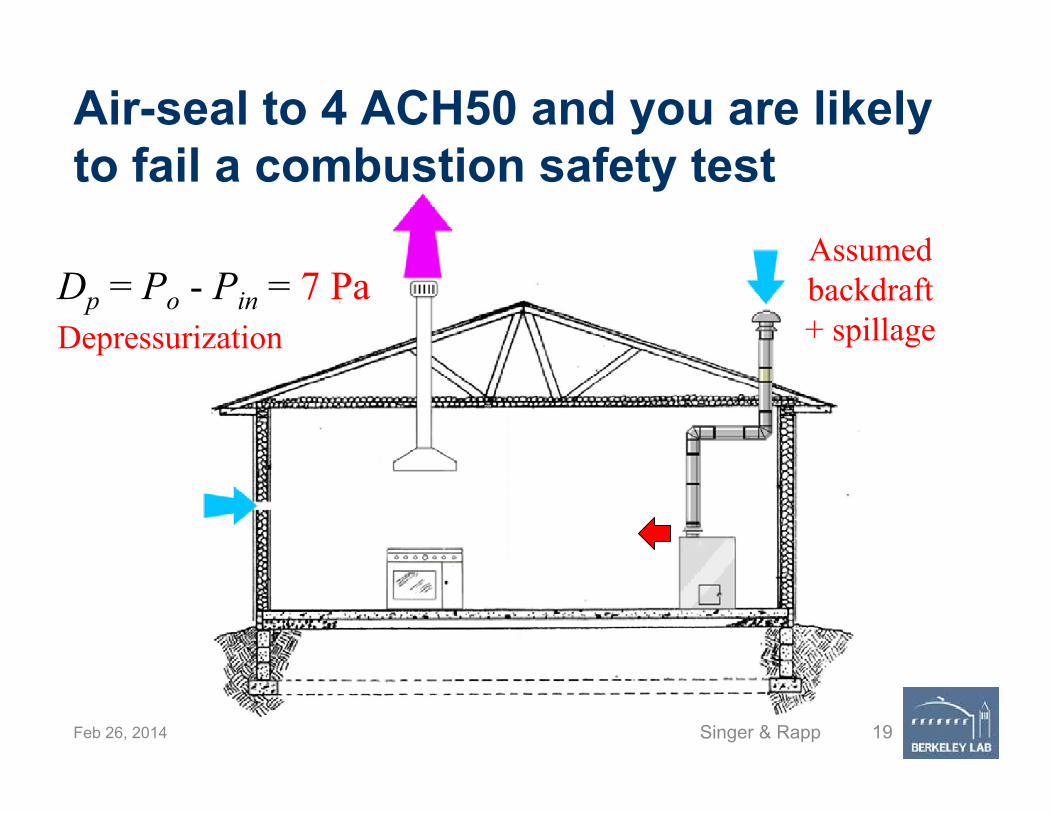
Air-seal to 4 ACH50 and you are likely to fail a combustion safety test
Assumed backdraft + spillage Depressurization
Dp = Po - Pin = 7 Pa
Feb 26, 2014 Singer & Rapp 19
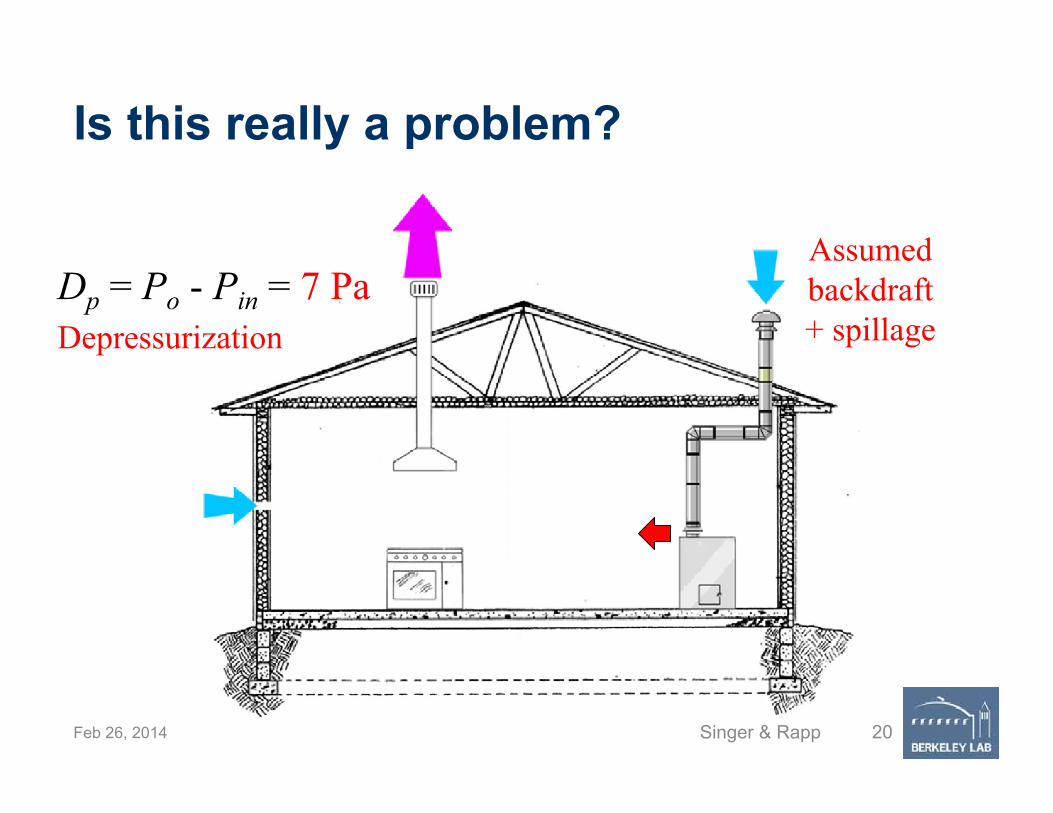
Is this really a problem?
Assumed backdraft + spillage Depressurization
Dp = Po - Pin = 7 Pa
Feb 26, 2014 Singer & Rapp 20
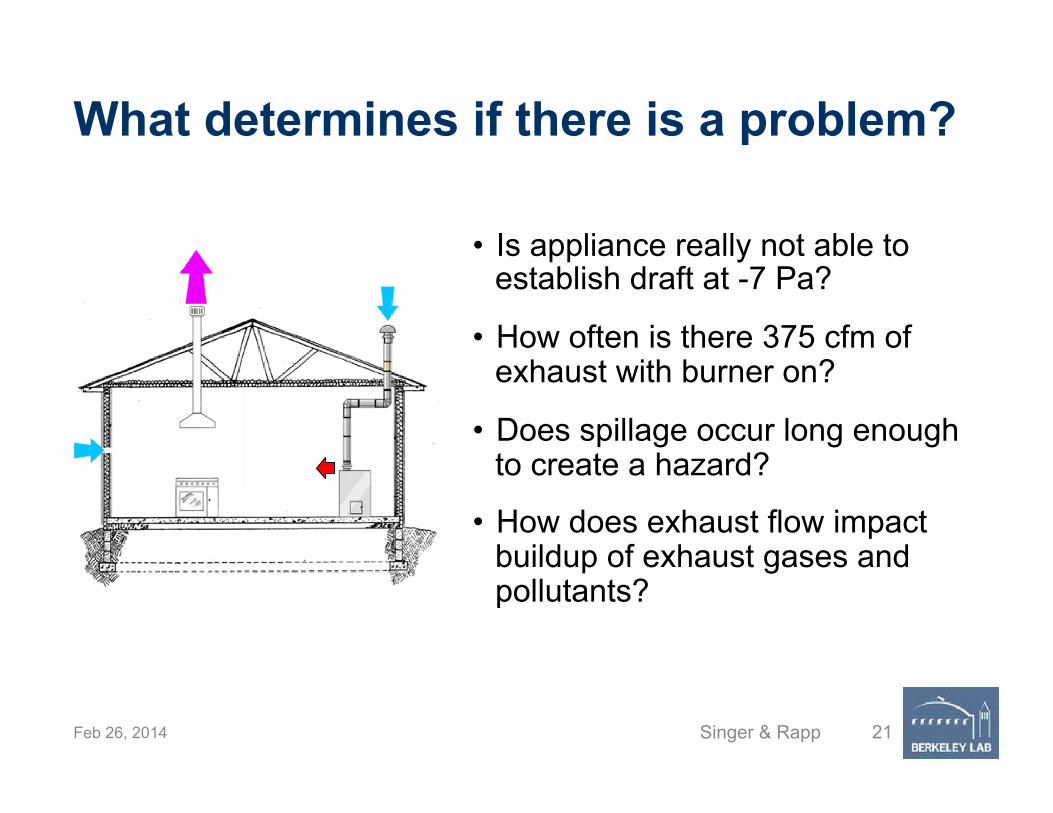
What determines if there is a problem?
Feb 26, 2014 Singer & Rapp 21
Is appliance really not able to establish draft at -7 Pa?
How often is there 375 cfm of exhaust with burner on?
Does spillage occur long enough to create a hazard?
How does exhaust flow impact buildup of exhaust gases and pollutants?

Combustion hazards depend on both physics and statistics
Feb 26, 2014 Singer & Rapp 22
Is appliance really not able to establish draft at -7 Pa? Vent configuration Atmospheric conditions
How often is there 375 cfm of exhaust with burner on?
Does spillage occur long enough to create a hazard?
How does exhaust flow impact buildup of exhaust gases and pollutants? How much CO emitted?

Worst-Case Depressurization Test
Threshold Test: Compare to depressurization limit
Draft Test: Does the appliance draft under WCD?
Feb 26, 2014 Singer & Rapp 23
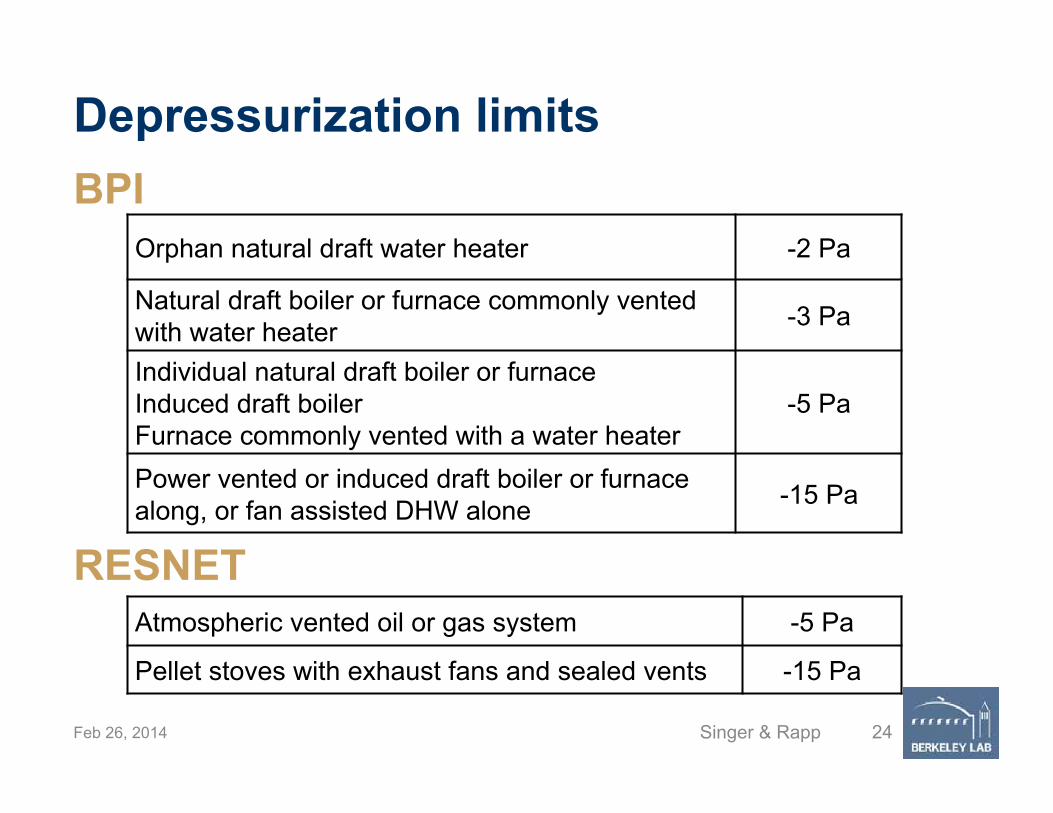
Depressurization limits BPI RESNET
Feb 26, 2014 Singer & Rapp 24
Orphan natural draft water heater -2 Pa
Natural draft boiler or furnace commonly vented with water heater -3 Pa
Individual natural draft boiler or furnace Induced draft boiler Furnace commonly vented with a water heater
-5 Pa
Power vented or induced draft boiler or furnace along, or fan assisted DHW alone -15 Pa
Atmospheric vented oil or gas system -5 Pa
Pellet stoves with exhaust fans and sealed vents -15 Pa
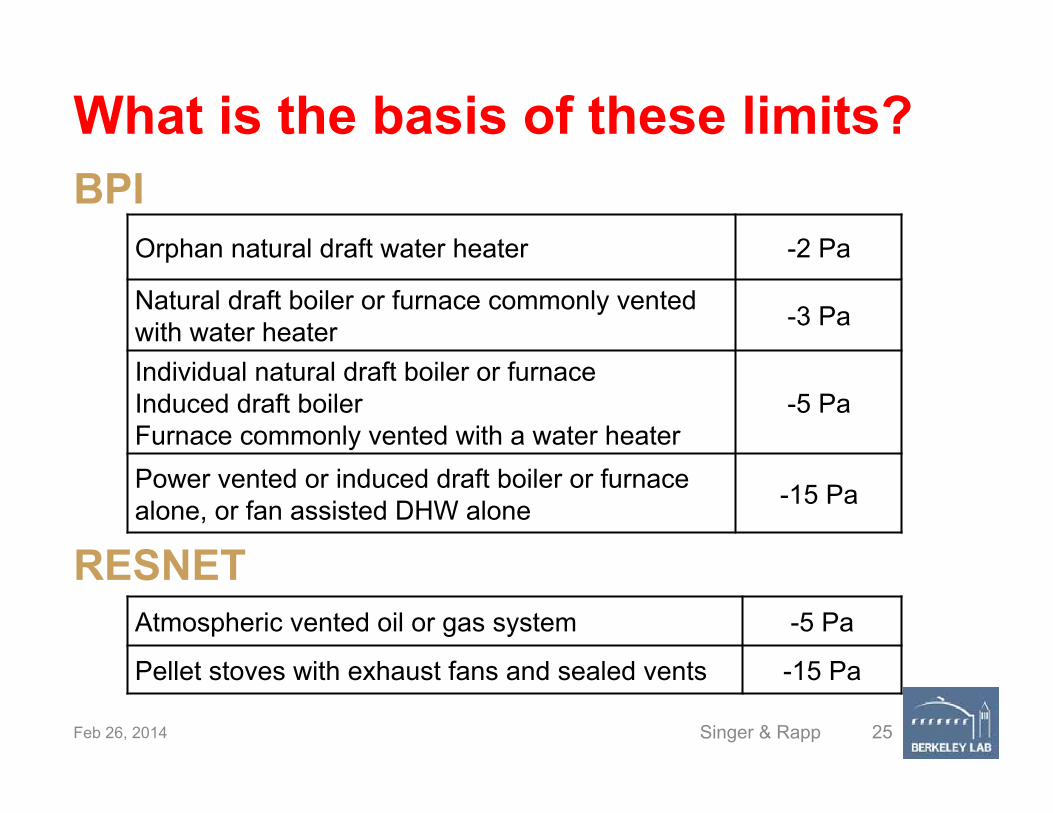
What is the basis of these limits? BPI RESNET
Feb 26, 2014 Singer & Rapp 25
Orphan natural draft water heater -2 Pa
Natural draft boiler or furnace commonly vented with water heater -3 Pa
Individual natural draft boiler or furnace Induced draft boiler Furnace commonly vented with a water heater
-5 Pa
Power vented or induced draft boiler or furnace alone, or fan assisted DHW alone -15 Pa
Atmospheric vented oil or gas system -5 Pa
Pellet stoves with exhaust fans and sealed vents -15 Pa

The physics of draft
Da Dt ΔΔpLoss Dp
Theoretical Draft
Flow Losses
Depressurization
Depressurization just one part of the equation
Feb 26, 2014 Singer & Rapp 26
2008 ASHRAE Handbook – HVAC Systems and Equipment, Chapter 34
Available Draft

The physics of drafting
Da Dt ΔΔpLoss Dp Burner
Size
Appliance Efficiency
Vent Dimension
Weather
Feb 26, 2014 Singer & Rapp 27
Depressurization just one part of the equation
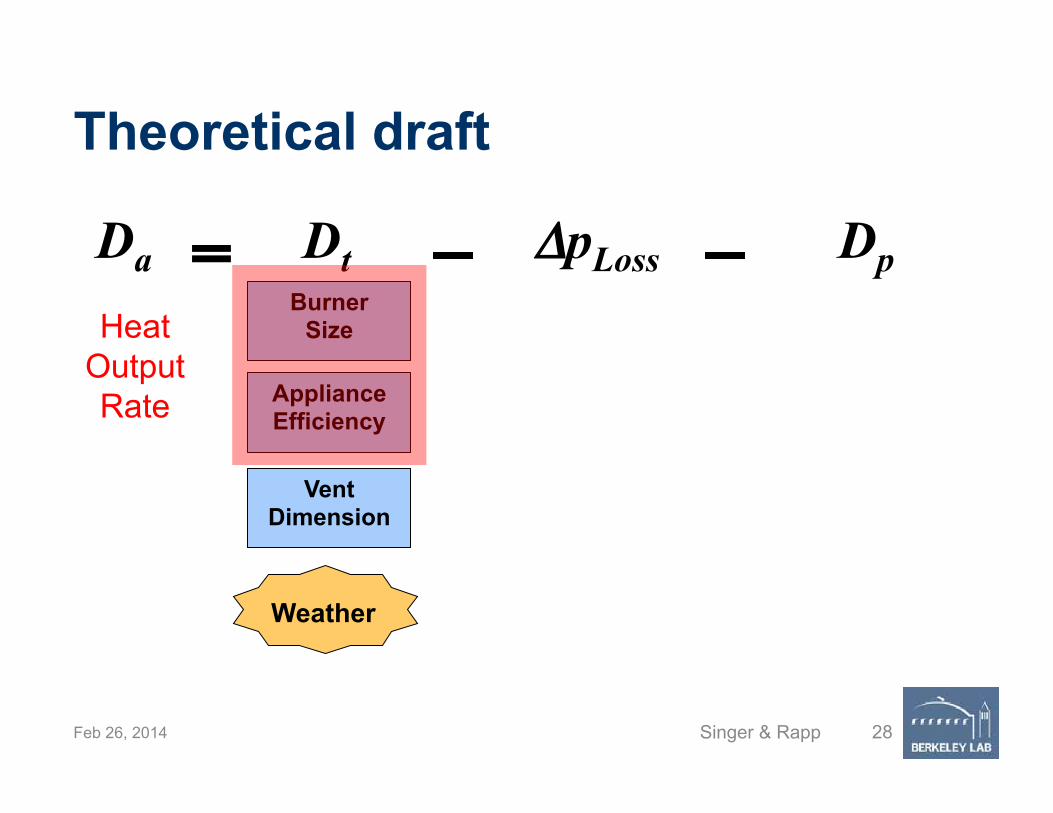
Theoretical draft
Da Dt ΔΔpLoss Dp Burner
Size
Appliance Efficiency
Vent Dimension
Weather
Heat Output Rate
Feb 26, 2014 Singer & Rapp 28

Theoretical draft
Da Dt ΔΔpLoss Dp Burner
Size
Appliance Efficiency
Vent Dimension
Weather
Buoyancy
Feb 26, 2014 Singer & Rapp 29

Friction losses in vent
Da Dt ΔΔpLoss Dp Vent
Design (Bends)
Bird Nest
Weather
Feb 26, 2014 Singer & Rapp 30
Vent Location &
Material
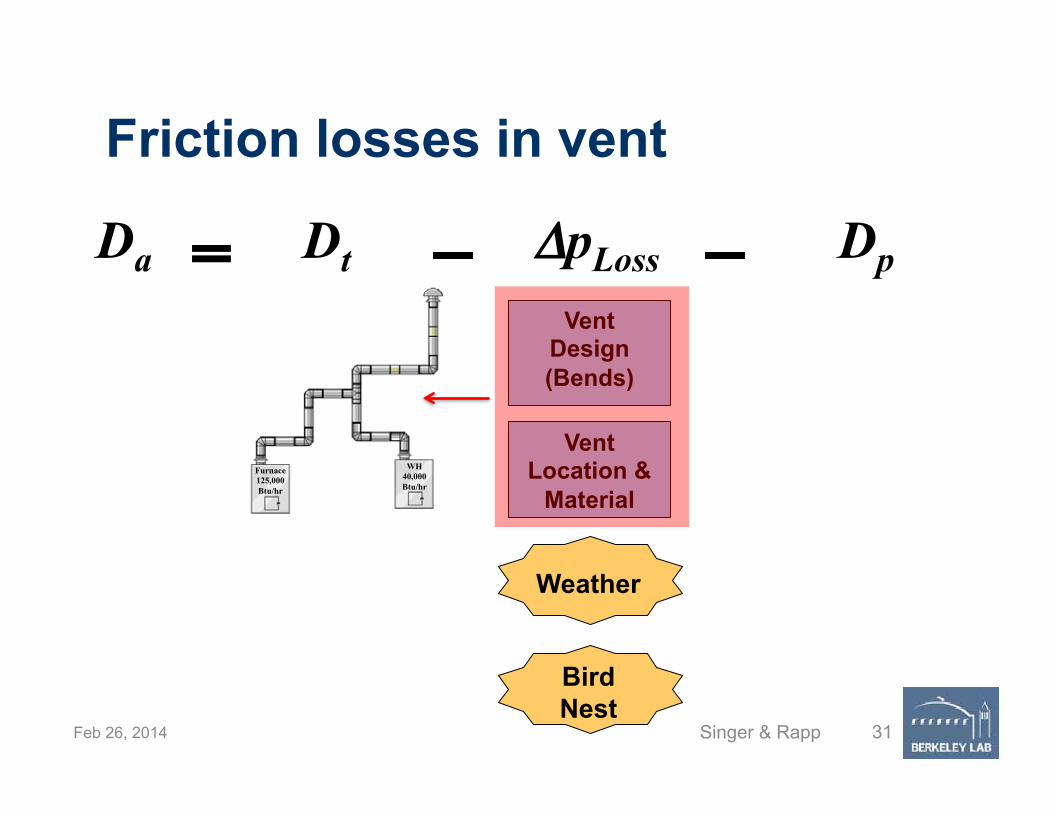
Friction losses in vent
Da Dt ΔΔpLoss Dp
WH 40,000 Btu/hr
Furnace 125,000 Btu/hr
Vent Design (Bends)
Vent Location &
Material
Bird Nest
Weather
Feb 26, 2014 Singer & Rapp 31

Friction losses in vent
Da Dt ΔΔpLoss Dp
Heat Loss
Vent Design (Bends)
Bird Nest
Weather
Vent Location &
Material
Feb 26, 2014 Singer & Rapp 32

Depressurization
Da Dt ΔΔpLoss Dp Exhaust
Fans
CAZ Location
Envelope Tightness
Other Appliances
Usage Patterns
Weather Feb 26, 2014 Singer & Rapp 33
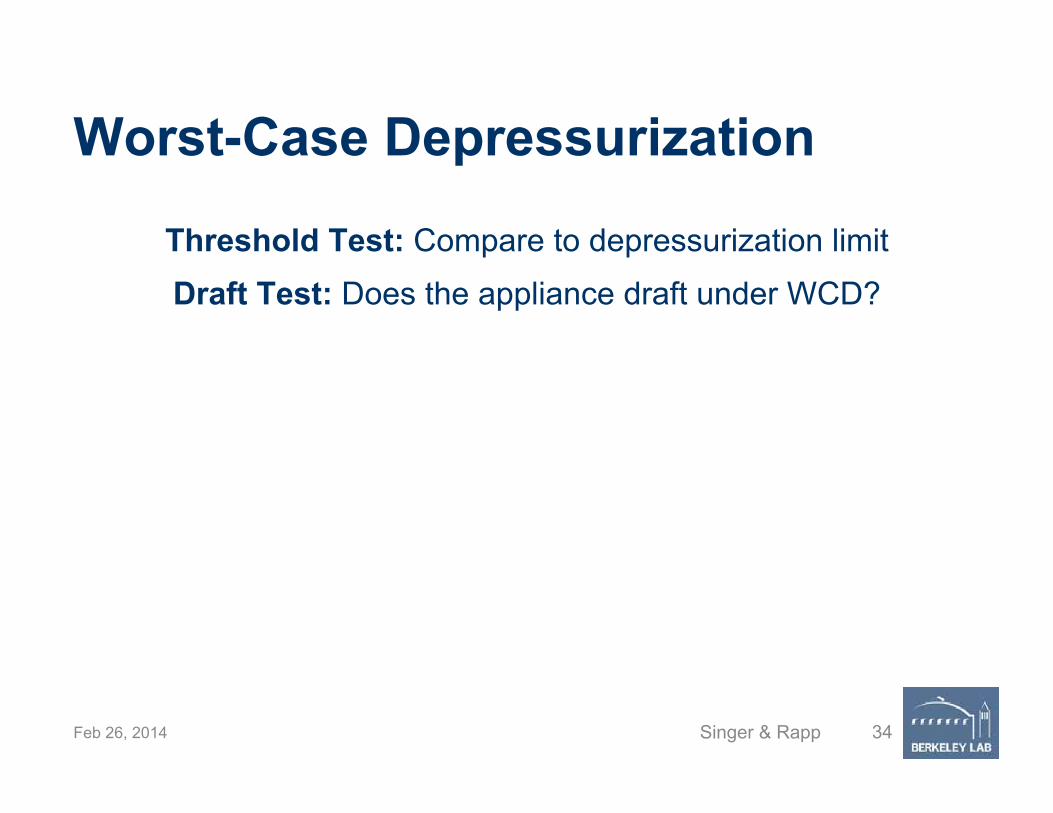
Worst-Case Depressurization
Threshold Test: Compare to depressurization limit
Draft Test: Does the appliance draft under WCD?
Feb 26, 2014 Singer & Rapp 34

CVEP is the maximum depressurization an appliance can overcome Cold Vent Establishment Pressure (CVEP)
1. Measure diff. pressure between CAZ and outdoors 2. Depressurize house using blower door 3. Turn on the appliance (should be spilling)* 4. Lower house depressurization until appliance
establishes draft 5. Record the differential pressure when the appliance
established draft *Measure downdraft CO at this point if not before
Feb 26, 2014 Singer & Rapp 35
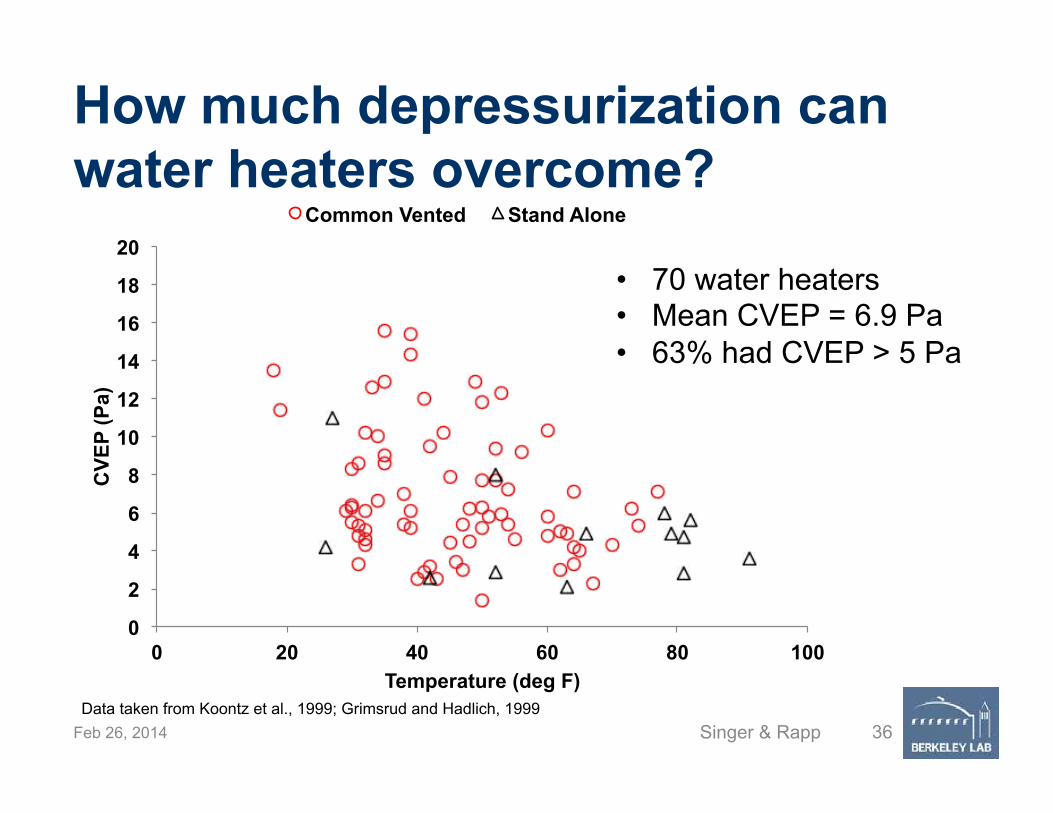
How much depressurization can water heaters overcome?
Singer & Rapp 36 Feb 26, 2014
0
2
4
6
8
10
12
14
16
18
20
0 20 40 60 80 100
CV
EP
(Pa)
Temperature (deg F)
Common Vented Stand Alone
70 water heaters Mean CVEP = 6.9 Pa 63% had CVEP > 5 Pa
Data taken from Koontz et al., 1999; Grimsrud and Hadlich, 1999

How much depressurization can furnaces overcome?
Singer & Rapp 37 Feb 26, 2014
0
5
10
15
20
25
30
0 20 40 60 80 100
CVE
P (-P
a)
Temperature (deg F)
58 common vented furnaces Mean CVEP = 9.4 Pa 81% had CVEP > 5 Pa
Data taken from Koontz et al., 1999; Grimsrud and Hadlich, 1999

-20
-15
-10
-5
0
5 0 20 40 60 80 100
Diff
eren
tial P
ress
ure
[Hou
se -
Out
door
] (P
a)
Temperature (deg F)
Baseline Maximum
Weather affects depressurization
Singer & Rapp 38 Feb 26, 2014 Data taken from Koontz et al., 1999; Grimsrud and Hadlich, 1999

-20
-15
-10
-5
0
5 0 20 40 60 80 100
Diff
eren
tial P
ress
ure
[Hou
se -
Out
door
] (P
a)
Temperature (deg F)
Baseline Incremental
Should we subtract “baseline”?
Singer & Rapp 39 Feb 26, 2014 Data taken from Koontz et al., 1999; Grimsrud and Hadlich, 1999
Are the thresholds saving lives or only limiting tightness?
Singer & Rapp 40 Feb 26, 2014

What is the risk of depressurization induced spillage?
Singer & Rapp 41 Feb 26, 2014
P1 = probability that conditions exist to cause backdrafting and spillage if the appliance operates
P2 = probability that the appliance will operate during the time
that the conditions of P1 persist P3 = probability that the appliance emits pollutants at a
sufficient rate to cause an IAQ problem if P1 and P2 occur
Risk = P1 x P2 x P3
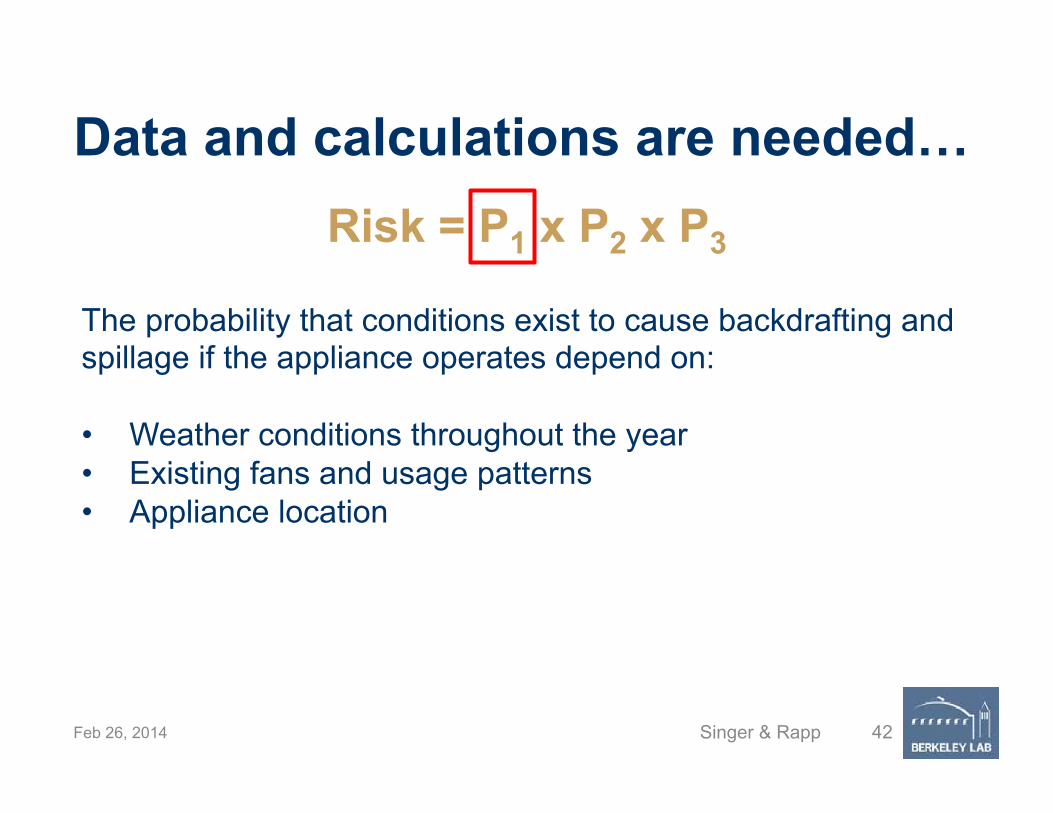
Data and calculations are needed…
Singer & Rapp 42 Feb 26, 2014
The probability that conditions exist to cause backdrafting and spillage if the appliance operates depend on: Weather conditions throughout the year Existing fans and usage patterns Appliance location
Risk = P1 x P2 x P3

Data can provide probability an appliance will be operating
Singer & Rapp 43 Feb 26, 2014
Risk = P1 x P2 x P3
143 California homes showed a maximum continuous on-time of 139 minutes in 8 hours for water heaters
Wall furnace could operate continuously
Data for central furnaces & boilers?

Data can provide probability of appliance pollutant emission rates
Singer & Rapp 44 Feb 26, 2014
0%
2%
4%
6%
8%
25!50 50!100 100!150 150!250 250!500 >500
Perc
ent o
f App
lianc
es
Carbon Monoxide Test Results (ppm)
Furnaces Water Heaters
Risk = P1 x P2 x P3
Bohac, D., et al., Ventilation and Depressurization Information for Houses Undergoing Remodeling (2002)
1,427 homes in Twin Cities, MN

Data can provide probability of appliance pollutant emission rates
Singer & Rapp 45 Feb 26, 2014
0%
2%
4%
6%
8%
25!50 50!100 100!150 150!250 250!500 >500
Perc
ent o
f App
lianc
es
Carbon Monoxide Test Results (ppm)
Furnaces Water Heaters
Bohac, D., et al., Ventilation and Depressurization Information for Houses Undergoing Remodeling (2002)
1,427 homes in Twin Cities, MN
Standard “clean and tune” resolved many CO problems

Calculating pollutant concentrations and risk
Feb 26, 2014 Singer & Rapp 46
Mass Balance Pollutants removed
Pollutants added
Mass of Pollutants

What are ppm anyway?
Feb 26, 2014 Singer & Rapp 47
100ppm CO =100 parts CO
1,000,000 parts Air
10ppm CO =10 parts CO
1,000,000 parts Air

How do we get to danger?
Feb 26, 2014 Singer & Rapp 48
Given: 40,000 btuh water heater -> 40 ft3 fuel / h Need roughly 10 ft3 air per ft3 fuel
-> 400 ft3 exhaust per hour Assume:
1000 ppm CO in exhaust 10,000 ft3 home (1250 sf x 8 ft ceiling) 1 h of spillage with no ventilation
1000ppm CO! 400 ft3
10, 000 ft3= 40ppm CO
This is a health hazard but not a life-safety hazard

But we can’t assume no ventilation… That’s how we get depressurization!
Singer & Rapp 49 Feb 26, 2014

40,000 btuh appliance spilling for five minutes of every hour
Singer & Rapp 50 Feb 26, 2014
0 2 4 6 8 10 12 14 16 18 20 22 240
5
10
15
Indo
or C
O C
once
ntra
tion
(ppm
v)
Time (hr)
Flue AF-CO=200ppmFlue AF-CO=1200ppm
2400 sqft house 4 ACH50 -2 Pa depressurization
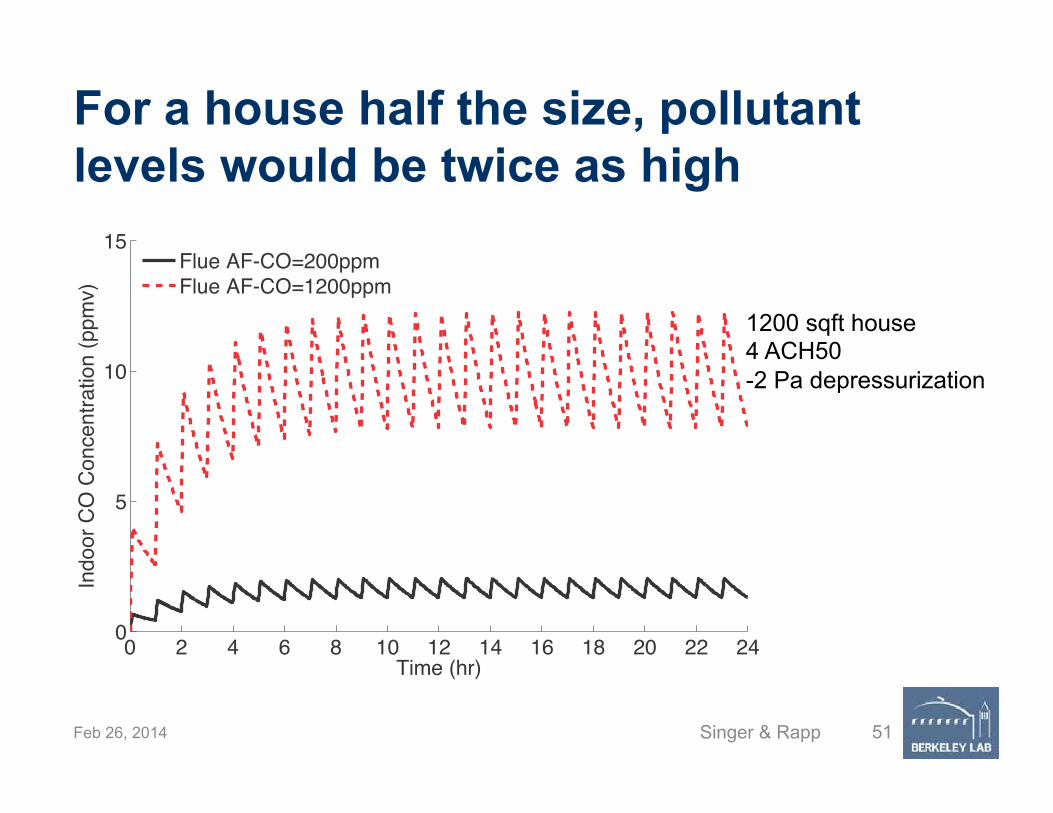
For a house half the size, pollutant levels would be twice as high
Singer & Rapp 51 Feb 26, 2014
0 2 4 6 8 10 12 14 16 18 20 22 240
5
10
15
Indo
or C
O C
once
ntra
tion
(ppm
v)
Time (hr)
Flue AF-CO=200ppmFlue AF-CO=1200ppm
1200 sqft house 4 ACH50 -2 Pa depressurization

What do simulations and data tell us?
Greatest hazard is when flow just reverses (lowest dilution)
Increasing depressurization increases exhaust airflow, which dilutes any emitted CO
Halving the house size, ACH50, or doubling the appliance size, doubles ambient CO
BPI and RESNET CO and depressurizations limits are overly conservative
Recommend use of range hood when cooking
Advise against unvented heaters and fireplaces
Feb 26, 2014 Singer & Rapp 52

Unvented combustion appliances pose the highest health risk
Appliance Pollutant Exposure Risk
Induced Draft Very Low: Unlikely to backdraft and spill
Water heater Low: non-continuous operation; vented
Vented furnace Medium-Low: Possible long-term operation; vented; wall furnaces can have lower draft
Range & Ovens Medium-high: 100% spillage in living space; some venting through range hood, higher CO
Unvented heater High: 100% spillage in living space; possible long-term operation; higher CO and NO2
Feb 26, 2014 Singer & Rapp 53

Recommendations: Combustion Safety Diagnostics Focus first on basic safety - Proactively check for unvented heating. Primary appliance has to work. Ask
about other heaters including oven
- Inspect for gas leaks; check appliance burner, flue, combustion air to CAZ
- Check vent sizing and horizontal runs
Focus on finding appliances that could backdraft often - Depressurization draft test with exhaust fans that can run for extended
periods (dryer, bathroom; no range hood on high).
Add safety by checking CO during induced downdraft Confirm range hood is venting & advise it be used
Feb 26, 2014 Singer & Rapp 54
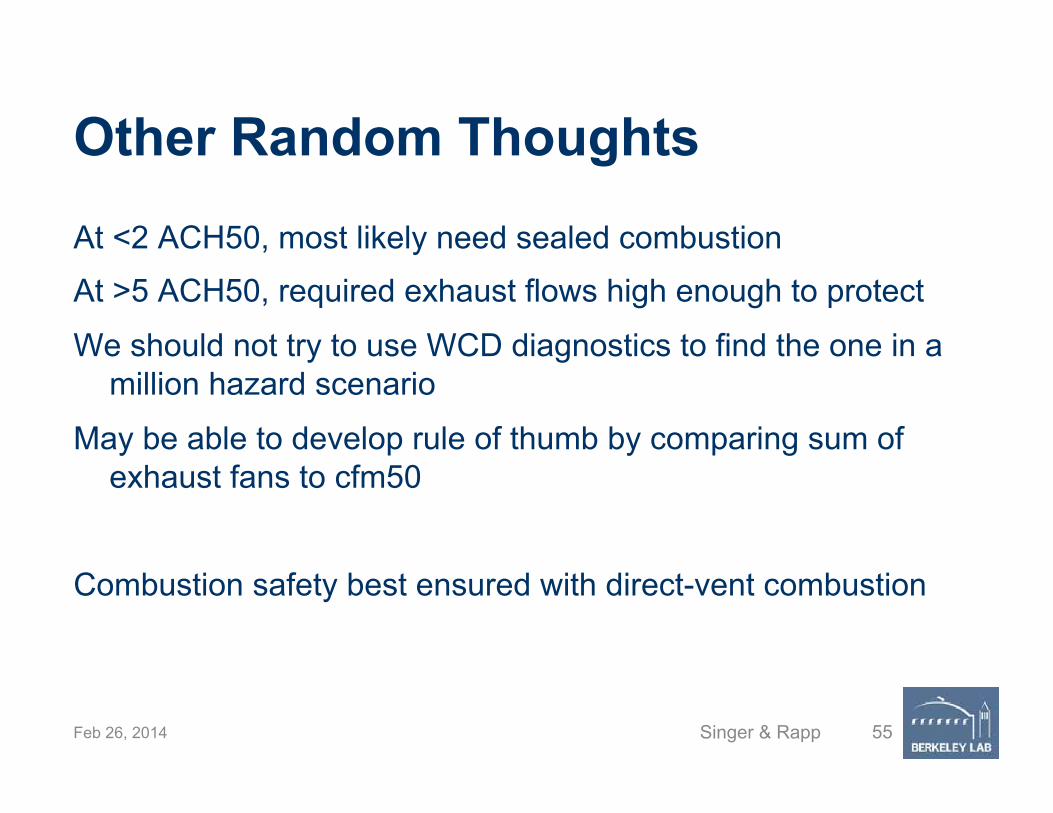
Other Random Thoughts
At <2 ACH50, most likely need sealed combustion
At >5 ACH50, required exhaust flows high enough to protect
We should not try to use WCD diagnostics to find the one in a million hazard scenario
May be able to develop rule of thumb by comparing sum of exhaust fans to cfm50
Combustion safety best ensured with direct-vent combustion
Feb 26, 2014 Singer & Rapp 55
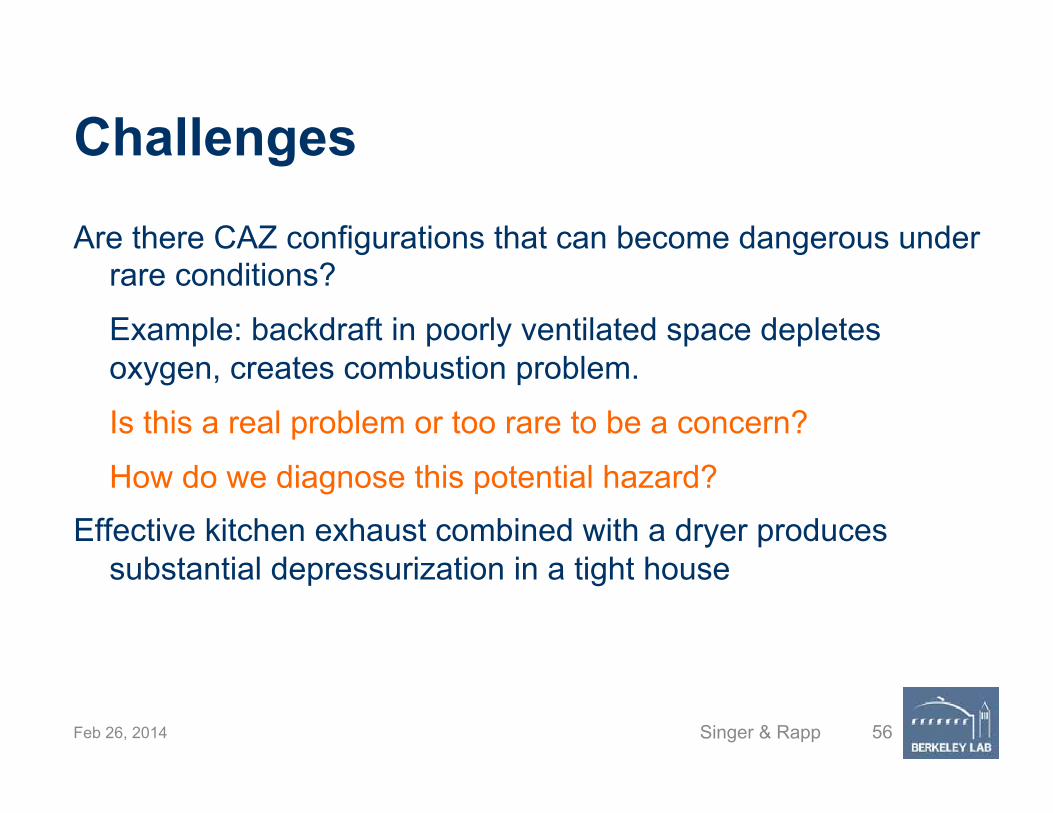
Challenges
Are there CAZ configurations that can become dangerous under rare conditions?
Example: backdraft in poorly ventilated space depletes oxygen, creates combustion problem.
Is this a real problem or too rare to be a concern?
How do we diagnose this potential hazard?
Effective kitchen exhaust combined with a dryer produces substantial depressurization in a tight house
Feb 26, 2014 Singer & Rapp 56
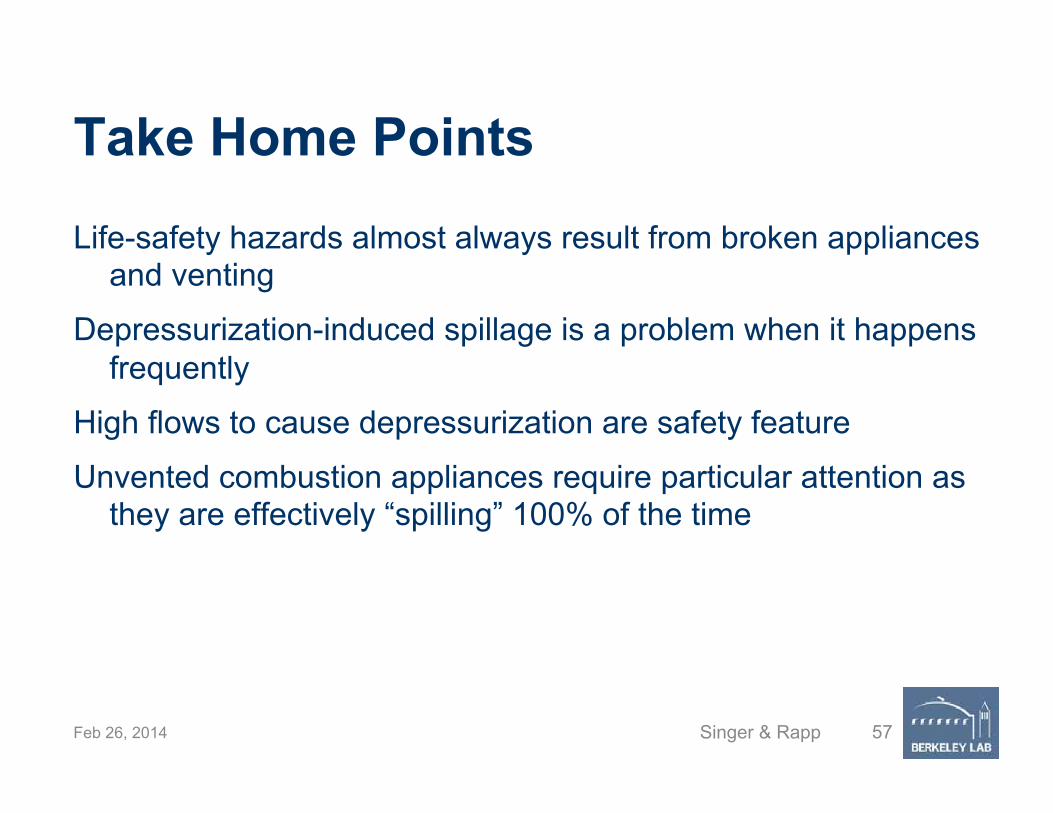
Take Home Points
Life-safety hazards almost always result from broken appliances and venting
Depressurization-induced spillage is a problem when it happens frequently
High flows to cause depressurization are safety feature
Unvented combustion appliances require particular attention as they are effectively “spilling” 100% of the time
Feb 26, 2014 Singer & Rapp 57

If time permits…
Singer & Rapp 58 Feb. 26, 2014
(It didn’t. Reader is cautioned to not refer to information in these extra slides without contacting presenter to confirm accurate understanding.)
Furnaces
Feb 26, 2014 Singer & Rapp 59

Continuous spillage for 8-hours reaches a steady-state concentration
0 2 4 6 80
10
20
30
40
50
60
Indo
or C
O C
once
ntra
tion
(ppm
v)
Time (hr)
Flue AF-CO=200ppmFlue AF-CO=1200ppm
- 1200 sqft home; ACH50=4; 20 kBTU/hr appliance - 8-hours of spillage; -5 Pa depressurization
Feb 26, 2014 Singer & Rapp 60
CO Poisoning (2-3 h) 100 ppm: headache 400 ppm: life threatening

What about a larger furnace? Doubling size doubles indoor CO concentrations
0 2 4 6 80
10
20
30
40
50
60
Indo
or C
O C
once
ntra
tion
(ppm
v)
Time (hr)
Flue AF-CO=200ppmFlue AF-CO=1200ppm
- 1200 sqft home; ACH50=4; 40 kBTU/hr appliance - 8-hours of spillage; -5 Pa depressurization
Feb 26, 2014 Singer & Rapp 61
CO Poisoning (2-3 h) 100 ppm: headache 400 ppm: life threatening

Larger depressurization reduces ambient CO concentrations
0 1 2 3 4 5 6 7 8 9 10 11 12 13 14 150
20
40
60
80
100
Stea
dy-S
tate
Indo
or C
O C
once
ntra
tion
(ppm
)
Depressurization (-Pa)
Flue AF-CO=200ppmFlue AF-CO=1200ppm
- 1200 sqft home; ACH50=4; 40 kBTU/hr appliance - Continuous Spillage (Steady-state concentrations)
Feb 26, 2014 Singer & Rapp 62
CO Poisoning (2-3 h) 100 ppm: headache 400 ppm: life threatening
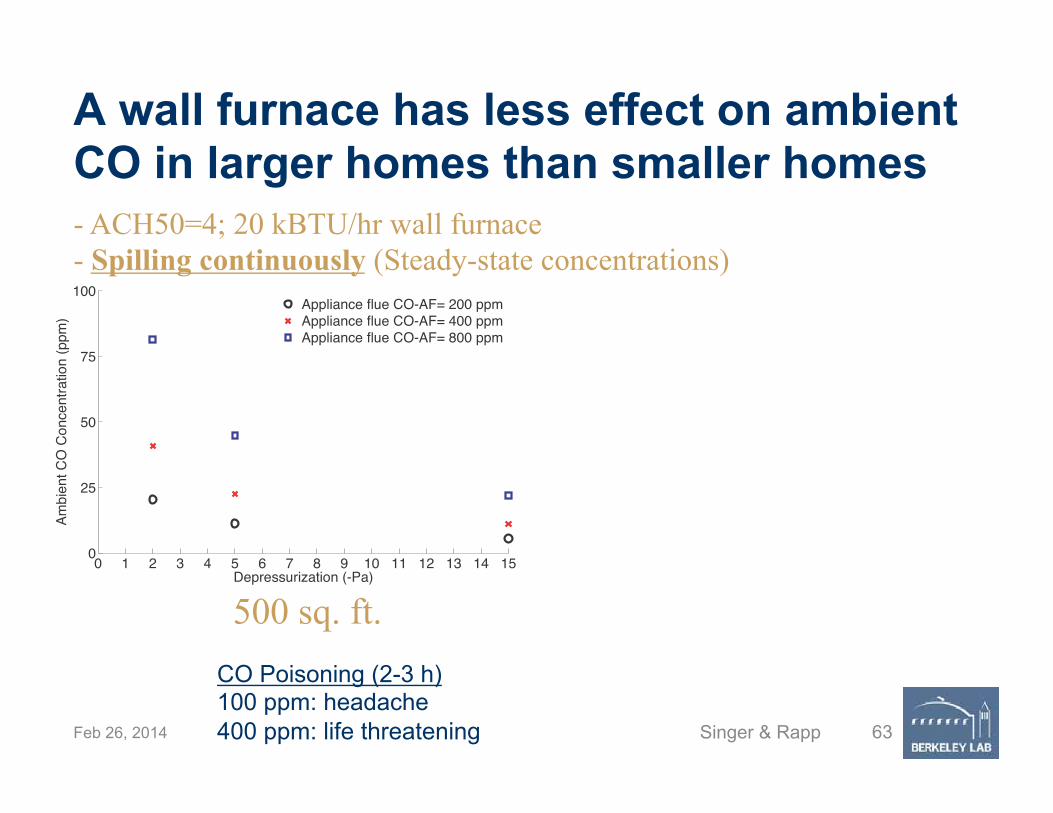
A wall furnace has less effect on ambient CO in larger homes than smaller homes - ACH50=4; 20 kBTU/hr wall furnace - Spilling continuously (Steady-state concentrations)
0 1 2 3 4 5 6 7 8 9 10 11 12 13 14 150
25
50
75
100
Ambi
ent C
O C
once
ntra
tion
(ppm
)
Depressurization (-Pa)
Appliance flue CO-AF= 200 ppmAppliance flue CO-AF= 400 ppmAppliance flue CO-AF= 800 ppm
500 sq. ft.
Feb 26, 2014 Singer & Rapp 63
CO Poisoning (2-3 h) 100 ppm: headache 400 ppm: life threatening

A wall furnace has less effect on ambient CO in larger homes than smaller homes - ACH50=4; 20 kBTU/hr wall furnace - Spilling continuously (Steady-state concentrations)
0 1 2 3 4 5 6 7 8 9 10 11 12 13 14 150
25
50
75
100
Ambi
ent C
O C
once
ntra
tion
(ppm
)
Depressurization (-Pa)
Appliance flue CO-AF= 200 ppmAppliance flue CO-AF= 400 ppmAppliance flue CO-AF= 800 ppm
500 sq. ft.
Feb 26, 2014 Singer & Rapp 64
1000 sq. ft. 0 1 2 3 4 5 6 7 8 9 10 11 12 13 14 150
25
50
75
100
Ambi
ent C
O C
once
ntra
tion
(ppm
)
Depressurization (-Pa)
Appliance flue CO-AF= 200 ppmAppliance flue CO-AF= 400 ppmAppliance flue CO-AF= 800 ppm
CO Poisoning (2-3 h) 100 ppm: headache 400 ppm: life threatening
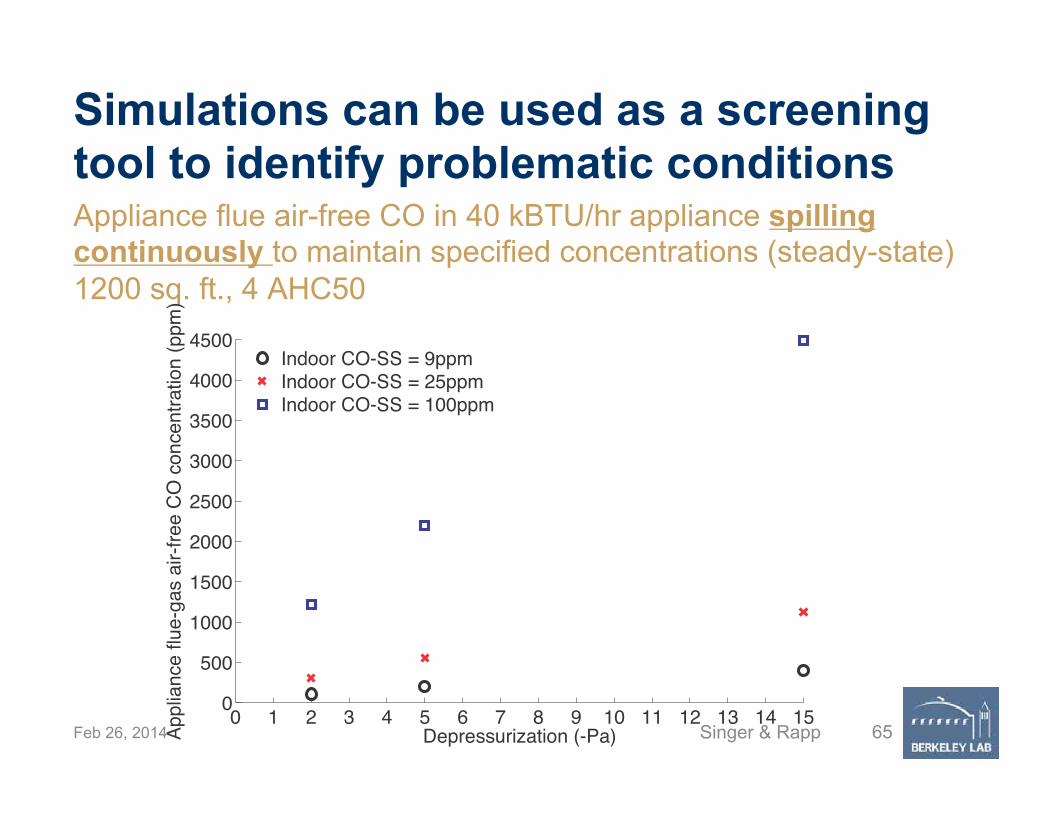
Simulations can be used as a screening tool to identify problematic conditions Appliance flue air-free CO in 40 kBTU/hr appliance spilling continuously to maintain specified concentrations (steady-state) 1200 sq. ft., 4 AHC50
0 1 2 3 4 5 6 7 8 9 10 11 12 13 14 150
500
1000
1500
2000
2500
3000
3500
4000
4500
Appl
ianc
e flu
e-ga
s ai
r-fre
e CO
con
cent
ratio
n (p
pm)
Depressurization (-Pa)
Indoor CO-SS = 9ppmIndoor CO-SS = 25ppmIndoor CO-SS = 100ppm
Feb 26, 2014 Singer & Rapp 65

Simulations can be used as a screening tool to identify problematic conditions Appliance flue air-free NO2 in 40 kBTU/hr appliance spilling continuously to maintain specified concentrations (steady-state) 1200 sq. ft., 4 AHC50
0 1 2 3 4 5 6 7 8 9 10 11 12 13 14 150
2
4
6
8
10
12
Appl
ianc
e flu
e-ga
s ai
r-fre
e NO
2 con
cent
ratio
n (p
pm)
Depressurization (-Pa)
Indoor NO2-SS = 0.1ppmIndoor NO2-SS = 0.18ppm
Feb 26, 2014 Singer & Rapp 66
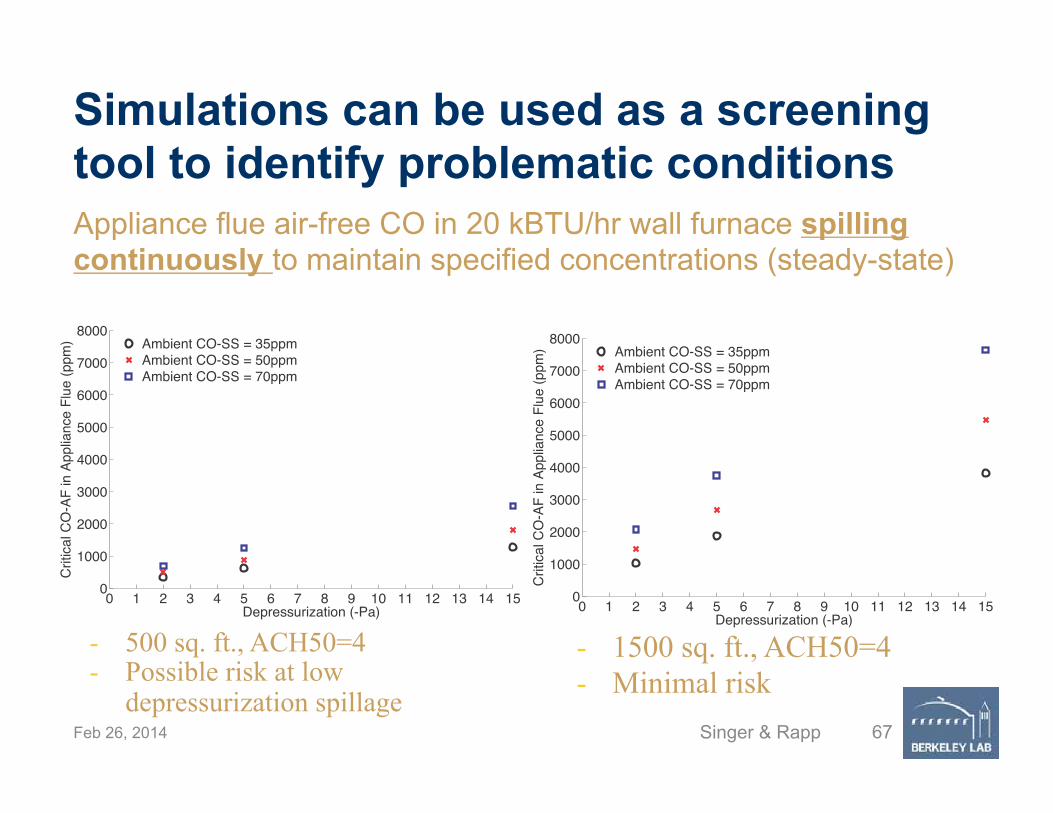
Simulations can be used as a screening tool to identify problematic conditions
0 1 2 3 4 5 6 7 8 9 10 11 12 13 14 150
1000
2000
3000
4000
5000
6000
7000
8000
Critic
al C
O-A
F in
App
lianc
e Fl
ue (p
pm)
Depressurization (-Pa)
Ambient CO-SS = 35ppmAmbient CO-SS = 50ppmAmbient CO-SS = 70ppm
- 500 sq. ft., ACH50=4 - Possible risk at low
depressurization spillage
0 1 2 3 4 5 6 7 8 9 10 11 12 13 14 150
1000
2000
3000
4000
5000
6000
7000
8000
Critic
al C
O-A
F in
App
lianc
e Fl
ue (p
pm)
Depressurization (-Pa)
Ambient CO-SS = 35ppmAmbient CO-SS = 50ppmAmbient CO-SS = 70ppm
- 1500 sq. ft., ACH50=4 - Minimal risk
Feb 26, 2014 Singer & Rapp 67
Appliance flue air-free CO in 20 kBTU/hr wall furnace spilling continuously to maintain specified concentrations (steady-state)
Water Heaters
Feb 26, 2014 Singer & Rapp 68
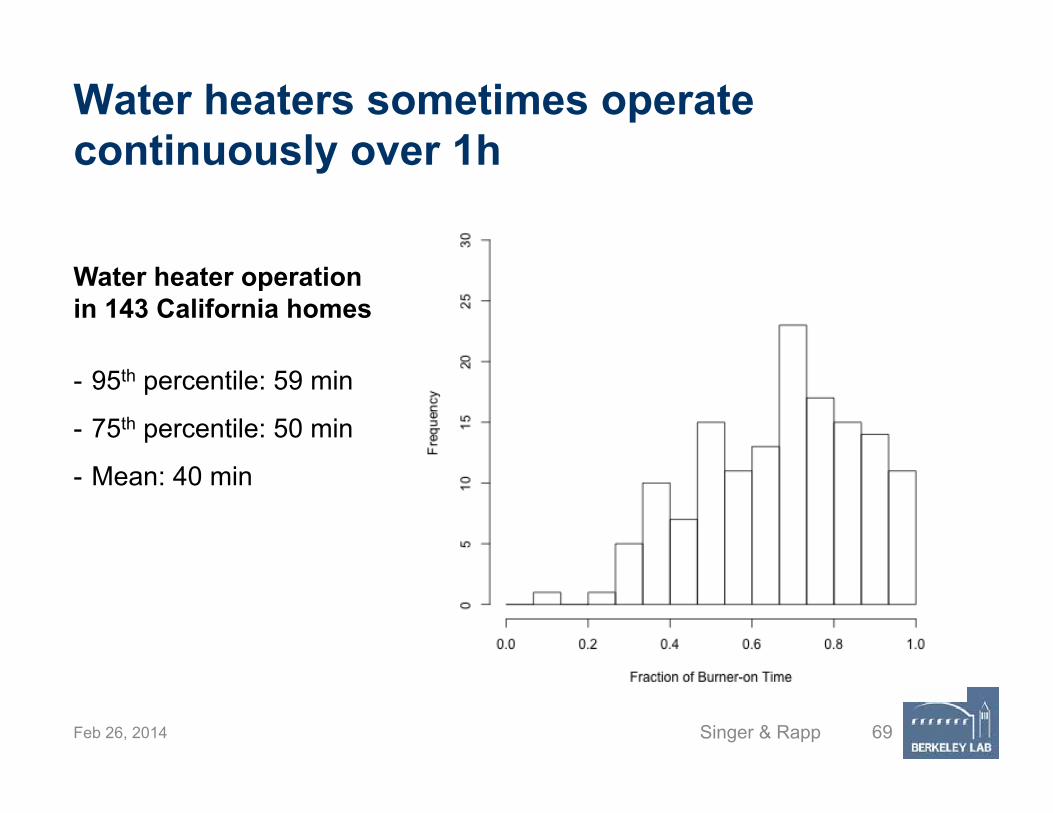
Water heaters sometimes operate continuously over 1h
Water heater operation in 143 California homes
- 95th percentile: 59 min
- 75th percentile: 50 min
- Mean: 40 min
Feb 26, 2014 Singer & Rapp 69

Simulation shows 1h of WH backdraft-induced spillage is not a life-safety issue
0 10 20 30 40 50 600
10
20
30
40
50
Indo
or C
O C
once
ntra
tion
(ppm
v)
Time (min)
Flue AF-CO=200ppmFlue AF-CO=1200ppm
Max 1 hr avg = 21 ppm
- 1200 sqft home; ACH50=4; 40 kBTU/hr appliance; - 59 minutes of spillage; -2 Pa depuressurization
CO Poisoning (2-3 hrs) 100 ppm: headache 400 ppm: life threatening
Feb 26, 2014 Singer & Rapp 70
Max 1 hr avg = 3 ppm
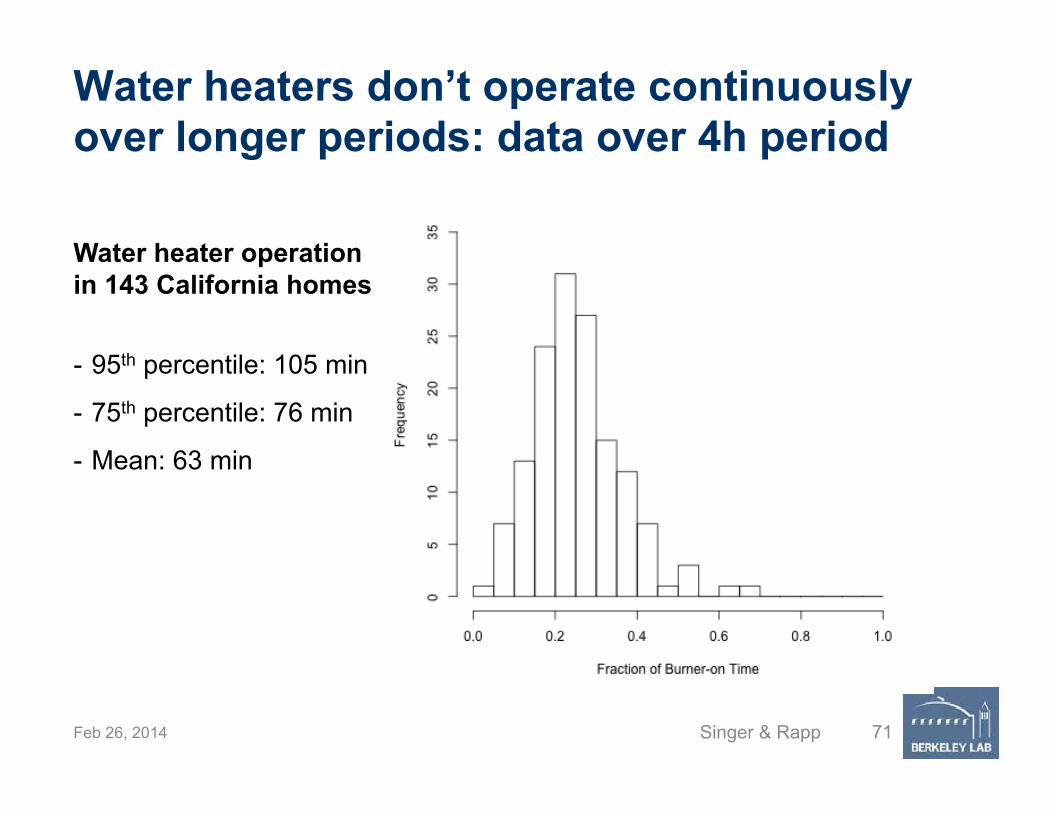
Water heaters don’t operate continuously over longer periods: data over 4h period
Water heater operation in 143 California homes
- 95th percentile: 105 min
- 75th percentile: 76 min
- Mean: 63 min
Feb 26, 2014 Singer & Rapp 71
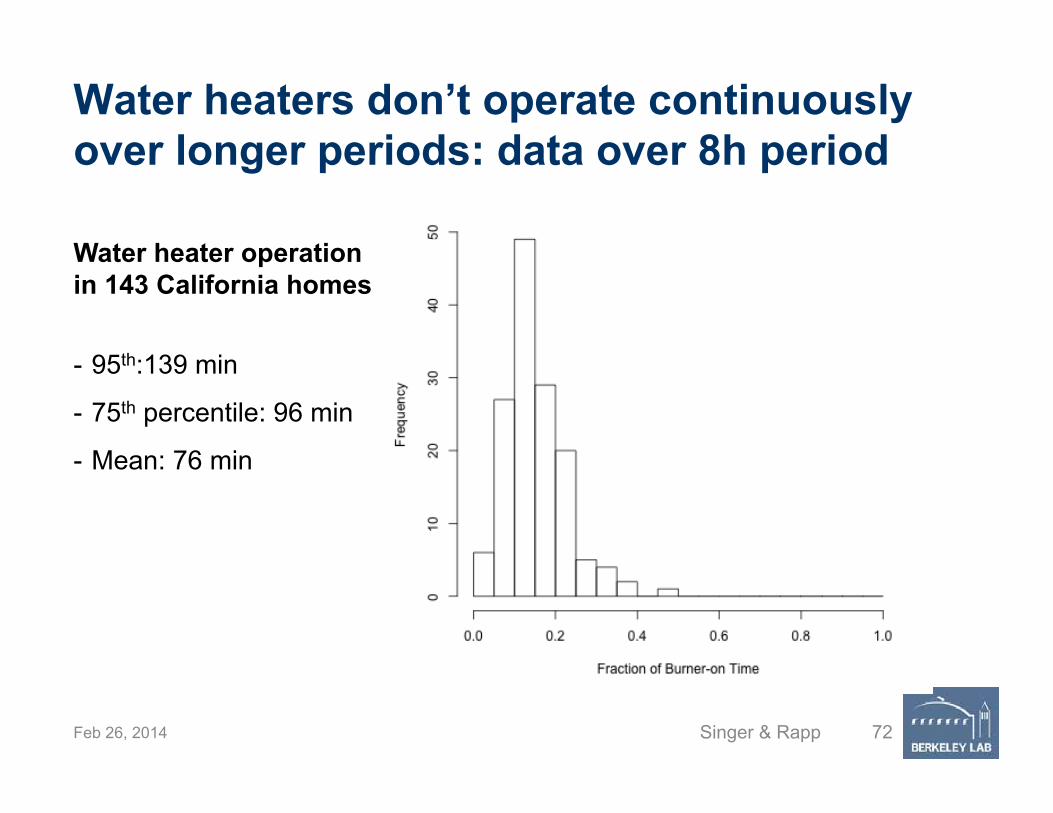
Water heaters don’t operate continuously over longer periods: data over 8h period
Water heater operation in 143 California homes
- 95th:139 min
- 75th percentile: 96 min
- Mean: 76 min
Feb 26, 2014 Singer & Rapp 72

0 2 4 6 8 10 12 14 16 18 20 22 240
5
10
15
20
Indo
or C
O C
once
ntra
tion
(ppm
)
Time (hr)
Steady-State, Flue AF-CO=200ppmCycling, Flue AF-CO=200ppm
- 1000 sqft home; ACH50=4; 40 kBTU/hr appliance, 400 ppm CO-AF - 139 minutes of spillage, -2 Pa depressurization
Feb 26, 2014 Singer & Rapp 73
CO Poisoning (2-3 h) 100 ppm: headache 400 ppm: life threatening
Simulation shows 8h of WH backdraft-induced spillage is not a life-safety issue
Cooking
Feb 26, 2014 Singer & Rapp 74

Estimated exposures to pollutants from natural gas cooking burners in SoCal
75
iiiiioutiii LRaVCVCkCaVPE
dtCV −−−+=∂
,
a
iEik
ioutC ,
Physics-based simulation of each home
Apply to large sample of homes that cook with gas
Data from RASS: - Data on age, size - Demographics - Cooking frequency
NHAPS occupancy patterns Emissions measured from used stoves. Cooking times from surveys
Using LBNL’s Population Impact Assessment Model
Feb 26, 2014 Singer & Rapp

Simulations show many homes exceeding air quality standards when no range hood is used
Singer & Rapp 76 Feb 26, 2014
500
400
300
200
100
030
30
25
20
15
10
5
0
200
150
100
50
0
NO2 (ppb)
CO (ppm)
HCHO (ppb)
No kitchen exhaust
55% eff. range hood
No kitchen exhaust
55% eff. range hood
No kitchen exhaust
55% eff. range hood
Use of 55% efficient range hood reduces exceedances
Highest 1h concentrations during typical week in winter

Measurements show that cooktops are most common problem in California
Singer & Rapp 77
Hig
hest
1h
CO
(ppm
) In
door
-em
itted
NO
2 (pp
b)
Results from 5-6 day monitoring in ~350 California homes
Feb 26, 2014

Unvented Heaters and Fireplaces
Feb 26, 2014 Singer & Rapp 78
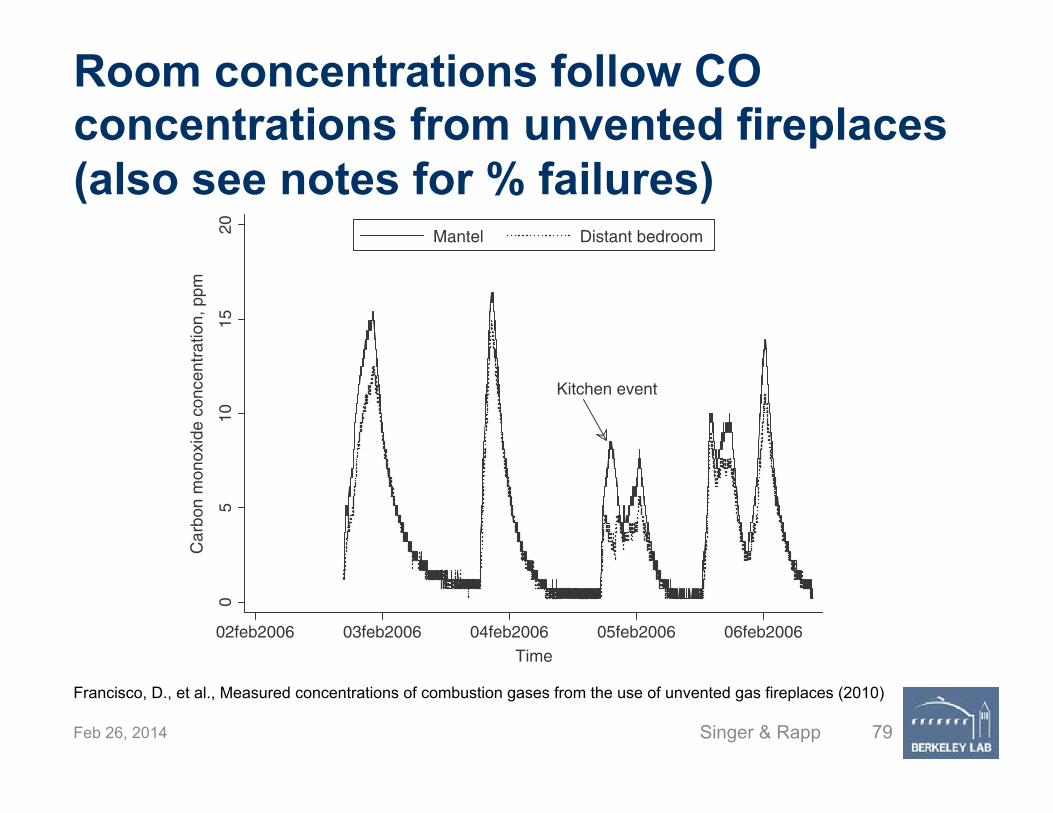
Room concentrations follow CO concentrations from unvented fireplaces (also see notes for % failures)
Francisco, D., et al., Measured concentrations of combustion gases from the use of unvented gas fireplaces (2010)
Feb 26, 2014 Singer & Rapp 79
Kitchen event
05
1015
20
Car
bon
mon
oxid
e co
ncen
trat
ion,
ppm
02feb2006 03feb2006 04feb2006 05feb2006 06feb2006
Time
Mantel Distant bedroom

Prevent use of unvented heaters and fireplaces Located in the living space and continuously spill
combustion gases
Increase risk CO, NO2, and moisture problems
Produce 1qt/hr of water vapor
Canada and many U.S. states ban the use of unvented heaters
http://ventyes.org/
Feb 26, 2014 Singer & Rapp 80