This article appeared in a journal published by Elsevier. The attachedcopy is furnished to the author for internal non-commercial researchand education use, including for instruction at the authors institution
and sharing with colleagues.
Other uses, including reproduction and distribution, or selling orlicensing copies, or posting to personal, institutional or third party
websites are prohibited.
In most cases authors are permitted to post their version of thearticle (e.g. in Word or Tex form) to their personal website orinstitutional repository. Authors requiring further information
regarding Elsevier’s archiving and manuscript policies areencouraged to visit:
http://www.elsevier.com/copyright
Author's personal copy
Self-bioremediation of cork-processing wastewaters by(chloro)phenol-degrading bacteria immobilised onto residualcork particles
I. del Castillo, P. Hernandez, A. Lafuente, I.D. Rodrıguez-Llorente, M.A. Caviedes,E. Pajuelo*
Departamento de Microbiologıa y Parasitologıa, Facultad de Farmacia, Universidad de Sevilla, c/Profesor Garcıa Gonzalez, 2,
41012 Sevilla, Spain
a r t i c l e i n f o
Article history:
Received 15 September 2011
Received in revised form
16 December 2011
Accepted 18 December 2011
Available online 30 December 2011
Keywords:
Phenol
Chlorophenols
Bacteria
Biofilms
Cork-processing wastewater
Bioremediation
a b s t r a c t
Cork manufacturing is a traditional industry in Southern Europe, being the main applica-
tion of this natural product in wine stoppers and insulation. Cork processing begins at
boiling the raw material. As a consequence, great volumes of dark wastewaters, with
elevated concentrations of chlorophenols, are generated, which must be depurated
through costly physicochemical procedures before discarding them into public water
courses. This work explores the potential of bacteria, isolated from cork-boiling waters
storage ponds, in bioremediation of the same effluent. The bacterial population present in
cork-processing wastewaters was analysed by DGGE; low bacterial biodiversity was found.
Aerobic bacteria were isolated and investigated for their tolerance against phenol and two
chlorophenols. The most tolerant strains were identified by sequencing 16S rDNA. The
phenol-degrading capacity was investigated by determining enzyme activities of the
phenol-degrading pathway. Moreover, the capacity to form biofilms was analysed in
a microtitre plate assay. Finally, the capacity to form biofilms onto the surface of residual
small cork particles was evaluated by acridine staining followed by epifluorescence
microscopy and by SEM. A low-cost bioremediation system, using phenol-degrading
bacteria immobilised onto residual cork particles (a by-product of the industry) is
proposed for the remediation of this industrial effluent (self-bioremediation).
ª 2011 Elsevier Ltd. All rights reserved.
Abbreviations: BLAST, Basic Local Alignment Search Tool; BOD, biological oxygen demand; BOX-PCR, PCR based on primers targetingthe highly conserved repetitive DNA sequences of BOX elements; CFU, colony forming unit; COD, chemical oxygen demand; DGGE,denaturing gradient gel electrophoresis; DTT, dithiothreitol; EPA, Environmental Protection Agency (US); MTC, maximum toleratedconcentration; NADH, nicotinamide-adenine-dinucletotide (reduced form); OD, optical density; PMSF, phenyl-methyl-sulfonyl fluoride;SEM, scanning electron microscopy; SP, storage pond (residual water of the storage pond); SPE, storage pond e “enriched” (residual waterof the storage pond after enrichment with 10% TSB); TAE, Tris-acetate-EDTA buffer for electrophoresis; TP, treatment pool (residualwater of the treatment pool); TPE, treatment pool e “enriched” (residual water of the treatment pool after enrichment with 10% TSB);TRITC, fluorescence filter for the detection of the fluorochrome tetramethylrhodamine isothiocyanate; TSA, trypticase-soya agar; TSB,trypticase-soya broth.* Corresponding author. Tel.: þ34 954556924; fax: þ34 954628162.E-mail address: [email protected] (E. Pajuelo).
Available online at www.sciencedirect.com
journal homepage: www.elsevier .com/locate/watres
wat e r r e s e a r c h 4 6 ( 2 0 1 2 ) 1 7 2 3e1 7 3 4
0043-1354/$ e see front matter ª 2011 Elsevier Ltd. All rights reserved.doi:10.1016/j.watres.2011.12.038

Author's personal copy
1. Introduction
Industrialisation is the main source of huge amounts of toxic
compounds being released to the biosphere, threatening
public health, wild life, and the environment. The list of toxic
compounds or elements published by US-EPA (Environmental
Protection Agency, www.epa.gov/oppt/p2home/) includes
over 6000 substances. Among them, phenolic compounds and
therein haloaromatic compounds (such as chlorophenols and
pentachlorophenol) are some of the most recalcitrant
organics, being degradation more difficult as the degree of
halogenation increases (Janssen et al., 2005; Solyanikova and
Golovleva, 2004).
Main uses of cork are the production of wine stoppers and
the utilisation as insulation material for thermal-, acoustic-
and electrical-insulation. The largest cork production and
manufacturing in the world is concentrated in the Mediter-
ranean basin. Spain is one of the most important cork
producers (22% of the total world production), together with
Portugal (the first one), Italy, Greece, Tunisia and Morocco. In
particular, in Southern Spain, around 40,000 tons cork per year
are produced. First step in cork manufacturing is focused on
cleaning and softening the raw material. For this purpose,
cork is boiled at 95�e100 �C for around 1 h in big treatment
pools. The same water can be used in 15e20 treatments, and
at the end, a dark wastewater resulting from this process is
collected in big storage ponds near the companies for later
depuration. Cork boiling water is characterised by high
chemical oxygen demand (COD), biological oxygen demand
(BOD) and phenol and polyphenols content, in the range of
4.5e5.5 g l�1, 1.1e1.8 g l�1 and 0.6e0.9 g l�1, respectively, and
by an acidic pH around 5 (Benitez et al., 2003; Domınguez et al.,
2007; Pintor et al., 2011). Phenolic fraction contains
compounds such as phenol, tannin fraction together with
gallic, protocatechuic, vanillic, syringic and ellagic acids, 2,4,6-
trichloroanisol and pentachlorophenol, (Benitez et al., 2003,
2006). Some of these compounds are among the most toxic
substances, as considered by EPA.
Chemical depuration treatments are expensive (Mendonca
et al., 2004), so little companies associate in order to share the
costs. Sometimes, wastewaters are stored in big ponds near
the manufacturing companies, and later on, transported to
a central treatment unit for reclamation using physicochem-
ical procedures. Physicochemical treatment of cork-boiling
water includes ozonation (Benitez et al., 2003; Lan et al.,
2008), Fenton oxidation, (Beltran de Heredia et al., 2004;
Guedes et al., 2003), flocculation (Domınguez et al., 2007) and
filtration techniques (Benitez et al., 2006, 2008; Bernardo et al.,
2011) or combinations of these methods, in order to decrease
the chemical oxygen demand (COD) in 75e85%. Any alterna-
tive treatment that can substitute all or part of these steps is of
great interest to the cork industry, since it can significantly
decrease the cost of wastewater treatment, especially if
alternative techniques can be applied in situ.
Bioremediation, i.e., the use of living organisms for envi-
ronmental cleaning, is an ecological and low-cost alternative
to the most traditional physicochemical remediation tech-
niques (Dıaz, 2004; Galvao et al., 2005; Stapleton and Singh,
2002). Major limitations are the bioavailability of organic
matter and finding efficient biodegraders. Many microorgan-
isms being able to degrade phenolic compounds have been
described, both in aerobic (Pseudomonas, Burkholderia, Sphin-
gomonas, Ralstonia, Arthrobacter, Acinetobacter, Alcaligenes) or
anaerobic conditions, (Desulfitebacterium, Dehalomonas, Deha-
lococcoides, Dehalobacter) (Adrian et al., 2000; Bunge et al., 2003;
Chang et al., 2003; Dıaz, 2004; Furukawa, 2003; Parvanov and
Topalova, 2008; Smidt and De Vos, 2004; Van der Meer, 2008).
Haloaromatic compounds are more difficult to degrade
because the high stability of the carbon-halogen bond.
However, some genera of bacteria have been also reported
being able to degrade (totally or partially) this kind or organics,
both in aerobic or anaerobic conditions, such as Sphingobium,
Sphingomonas, Dehalobacter, Dechloromonas, Dehalococcoides,
Rhodococcus (Furukawa, 2006; Solyanikova and Golovleva,
2004; Van der Meer, 2008; Cai and Xun, 2005).
To our knowledge, little information has been produced on
the biotechnological use of microorganisms in the treatment
of this effluent (Dias-Machado et al., 2006; Mendonca et al.,
2004). In this work, the complete bacterial population of
cork-processing wastewaters has been analysed. Also, culti-
vable bacteria have been tested for their ability to degrade
(chloro)phenols. A system is proposed by which phenol-
degrading bacteria from cork wastewaters storage ponds are
immobilised onto residual cork particles for wastewater
remediation.
2. Materials and methods
2.1. Total DNA isolation from cork-processingwastewaters
In this work, two kinds of water samples were utilised: the
water of the treatment pool (TP) had been used between 10
and 15 times, (the exact number depends on every particular
treatment), and it was close to exhaustion (just to be dis-
charged into the storage pond). The storage pond (SP) is a very
big pool containing the residual waters for long time. The
main difference between the two samples is the time that the
water remains in the pool. In the treatment pool the water
remains only the time needed for 10e15 treatments. However,
in the storage pond the water can remain for months, until it
is brought to the depuration central. The bacterial population
present in both wastewaters has been analysed using DGGE.
Samples of 2 L of the wastewaters of a local industry were
collected from the treatment pool (TP) and the storage pond
(SP) and divided into two flasks of 1 L each one. One of each
was supplementedwith 100mL (10%v/v) of TSB (trypticase soy
broth) medium (Vincent, 1970). These enriched samples,
designed TP-E and SP-E, were incubated at 28 �C for 48 h. Total
DNA was isolated from all the four samples using the Pow-
erSoil� DNA isolation kit (MoBio Laboratories, Inc. California)
following the instructions of the manufacturer with several
modifications, in order to adapt the protocol to a liquid
sample. 100 mL of samples TP-E and SP-E (containing higher
bacterial density after enrichment) were centrifuged at 1100 g
for 10 min at 4 �C and bacterial pellets were resuspended in
1 mL in sterile 0.9% NaCl. 1 L of samples TP and SP, with
wat e r r e s e a r c h 4 6 ( 2 0 1 2 ) 1 7 2 3e1 7 3 41724
Author's personal copy
a lower concentration of bacteria, were concentrated by
filtering through a 0.45 mm Millipore filter. The filter was
washed with 1 mL of sterile 0.9% NaCl. From this step, DNA
was extracted following the instructions of the manufacturer.
2.2. PCR-DGGE analysis
Amplification of partial 16S rDNAwas performed according to
Weisburg et al. (1991) using the modified primers fD1
(50CCGAATTCGTCGACAACAGACTTTGA TCCTGGCTCAG30)and rD1 (50CCCGGGATCCAAGCTTAAGGAGGTGATCCAG CC30)and Taq polymerase ExpandHigh Fidelity PCR System (Roche).
PCR reaction consisted in an initial denaturation step at 94 �Cfor 2 min, followed by 15 cycles (94 �C for 60 s, 55 �C for 45 s
and 72 �C for 2 min). The second PCR reaction was
performed according to Heuer et al. (1997) on 1e3 mL of the
previous PCR product using primers F984GC: (50
CGCCCGGGGCGCGCCCCGGGCGGGGCGGGGGCACGGGGGGAA
CGCGAAGAACCTTAC30) and R1378 (50GCGTGTGTACAAGACCC30). PCR conditions were as follows: an initial denatur-
ation step at 94 �C for 2min, followed by 10 cycles inwhich the
annealing temperature decreased from 65 to 55 �C (30 s at
94 �C, 1 min at [65e55 �C] and 2 min at 68 �C), followed by 25
cycles at low constant annealing temperature (30 s at 94 �C,1 min at 55 �C and 2min at 68 �C), and a final extension step at
68 �C for 10min. DGGE conditionswere as previously described
Heuer et al. (1997), using polyacrilamide gels with a gradient of
two denaturing agents: urea (from 3.0 to 4.5M) and formamide
(from 25 to 35%). Denaturing gradient gel electrophoresis of
PCR products was performed in a DCODE Universal Mutation
Detection System (Bio-Rad). at constant temperature (60 �C) at200 V for 15 min to compact the samples, followed by 16 h at
70 V. Gels were stained for 15 min with ethidium bromide and
washed with distilled water until obtain a clear image. Gels
banding patterns were derived from captured gel images and
analysed using Quantity One 1-D analysis software.
2.3. Comparison of bacterial communities based onDGGE pattern analysis
The richness, diversity, evenness, and stability of bacterial
communities at the respective habitats were estimated based
on the number and the relative intensity of the DGGE bands.
Phylotype (band) richness (R) was evaluated from total
different DGGE bands (Fromin et al., 2002). Diversity and
evenness of the communities were estimated by using Shan-
non’s diversity index with the formula, H0 ¼ �PPi ln Pi, for the
calculation of the index, where Pi is the relative intensity of
band i (Pi ¼ Ni/N; Ni, intensity of band i; N, sum of the inten-
sities of all bands) (Maggurran, 1988). Evenness was calculated
by using the formula, E ¼ H0/lnR, where R is the total different
number of DGGE bands (richness).
2.4. Extraction of the DGGE bands
The predominant bands in DGGE gel were excised and purified
frompolyacrilamide gel as described byWatanabe et al. (1998).
DNA was re-amplified with the second pairs of primers (F984
and R1378) without the GC-clamp (underlined in section 2.2)
and in a reaction with 35 cycles at 55 �C annealing
temperature. The products of the second PCR were electro-
phoresed through a 1.5% agarose gel in TAE buffer and purified
using the Ilustra GFX�PCR DNA and Gel Band Purification Kit
(GE Healthcare). The extracted DNA was quantified by
measuring the absorbance at 260 nm and sequenced.
2.5. Isolation of cultivable bacteria from wastewatersponds
Cultivable bacteria were isolated from all the four samples.
We have focused on the isolation of aerobic and facultative
anaerobic bacteria. Samples of wastewater were plated on
TSA plates and incubated at 28 �C for 4 days for bacteria
isolation. Colonies with different morphology and pigmenta-
tion were selected, purified in TSA plates, and stored at
�S80 �C.
2.6. Genetic diversity by BOX-PCR
BOX-PCR was performed according to the method of Johnson
et al. (2003) using the BOXA1R primer and 1 ml of DNA at 40 ng/
ml. The PCR products were electrophoresed through a 1.5%
agarose gel in TAE buffer, at constant voltage 70 V for 2 h and
30 min. BOX-PCR fingerprint similarities were determined by
calculating the Pearson’s product moment correlation coeffi-
cient (Jobson, 1991). In the current study, isolates were
considered to be identical if they exhibited BOX-PCR finger-
prints that were at least 90% similar, in order to discriminate
all repetitive strains.
2.7. Identification of cultivable bacteria
Bacteria with different BOX fingerprints were identified by
PCR-amplification and sequencing of the 16S rDNA. Primers
and PCR conditions used for 16S rDNA amplification are
described by Rivas et al. (2002). Biochemical characterisation
of some strains was performed using commercial systems
(API20E, API 20 NE from Biomerieux, RapID from Oxoid) [see
supplementary information Tables S1 and S2].
2.8. Resistance against phenolic compounds
The resistance of the isolates against phenol and chlor-
ophenols was determined on plates containing TSA medium
supplemented with increasing concentrations of these
compounds, ranging from 0 to 10mM (phenol), from 0 to 4mM
4-chlorophenol and 0e3 mM 2,4-dichlorophenol. Plates were
incubated at 28 �C for 3e4 days. The tolerance is expressed as
the MTC, maximum tolerated concentration, which is the
maximal concentration of the toxic allowing bacterial growth.
2.9. Phenol consumption
Phenol degrading capacitywas tested inmedia containing this
compound as the sole carbon source. Bacteria were grown in
minimalmedium (Foght et al., 1989) for 72 h at 28 �C at 200 rpm
constant shaking. 25 mL of liquid minimal medium supple-
mented with 2.5 mM phenol were inoculated with 100 mL of
the abovementioned cultures (approx. 108 C.F.U./mL). Aliquots
of 2mLwere taken at 1 h intervals during the first 6 h and up to
wat e r r e s e a r c h 4 6 ( 2 0 1 2 ) 1 7 2 3e1 7 3 4 1725
Author's personal copy
26 h. OD at 600 nm was measured. Aliquots were centrifuged
at 8000 g for 10min and phenol concentrationwas determined
in the supernatants using 4-amino-antipirine according to the
method previously described by Lacoste et al. (1959) using
minimal medium for establishing the background of the
colorimetric determination.
2.10. Enzymatic activities of phenol degradation pathway
Phenol hydroxylase activity (EC1.14.13.7) and catechol dioxy-
genases (catechol 1,2-dioxygenase (EC1.13.11.1) and catechol
2,3-dioxygenase (EC 1.13.11.2)) were determined in crude
extracts prepared from bacteria grown for 10 days in minimal
medium supplemented with 2.5mMphenol. 250mL of culture
were centrifuged and resuspended in 5 mL of 50 mM potas-
sium phosphate buffer, pH 7.5, containing 1 mM PMSF and
0.1 mM DTT. Bacterial cells were disrupted by sonication and
the lisate was centrifuged at 12,500 g for 10 min at 4 �C.Enzymatic activities were determined in the crude extract
according to Zaki (2006).
2.11. Adhesion assay on microtitre plates
Adhesion capacity in the presence of phenol wasmeasured as
theabilityof cultures toadhere to thesurfaceofwellsof 96-well
microtitre plates, as described by Favre-Bonte et al. (2007).
Cultures were grown in minimal medium supplemented with
2.5mMphenol at 28 �C for 48 h. All cultureswerenormalised at
OD600nm 1.0. 20 mL of the corresponding cultures were added to
12 wells of microtitre plates (a row for each microorganism).
For the control, 20 mL of minimal medium was added. The
plateswere sealedwith parafilm and incubated at 28 �C during
4 days. After this time, the medium was removed, the wells
were washed 5 times with 200 mL distilled water, and the bio-
films were stained with 200 mL 0.01% crystal violet for 20 min.
Plates were rinsed three times with 200 mL sterile water. The
dyewassolubilisedwith100mL95%ethanol 33%acetic acidand
quantified by measuring the absorbance at 570 nm/595 nm.
2.12. Biofilms formation onto cork particles
The formation of biofilms on the surface of cork particles was
examined. Cork particles were collected on the ground of the
cork industry (in fact, it is a residue of the industry). Cork
particles were homogenised in a coffee grinder and sieved
through a 0.5 mm sieve. They were then washed three times
with 25 mL 10 mM HCl for 10 min, and neutralised with the
appropriate volume of 1 N NaOH, rinsed five times in sterile
distilled water and air-dried. Flasks with 15 mL of minimal
medium supplemented with 2.5 mM phenol and 0.15 g of
treated cork particles were first autoclaved and then inocu-
lated with the selected microorganisms, previously grown on
2.5 mM phenol and normalised at OD600nm ¼ 1.0, and incu-
bated at 28 �C for 10 days. After that, particleswere transferred
to petri dishes, washed five times with distilled water, air-
dried and stained with Acridine Orange (Johansson et al.,
2008). Bacterial attachment to cork surface was examined
with an epifluorescence microscope (Olympus BX61) using
�100 objective lens and a TRITC green filter. Bacterial
attachment was also analysed by SEM (scanning electron
microscopy). Cork particles incubated in the presence of
bacteria as described above were fixed overnight in the pres-
ence of OsO4, followed by Au treatment, and observed under
a Jeol 6460LV microscope.
3. Results
3.1. Analysis of bacterial communities in cork-processing wastewaters
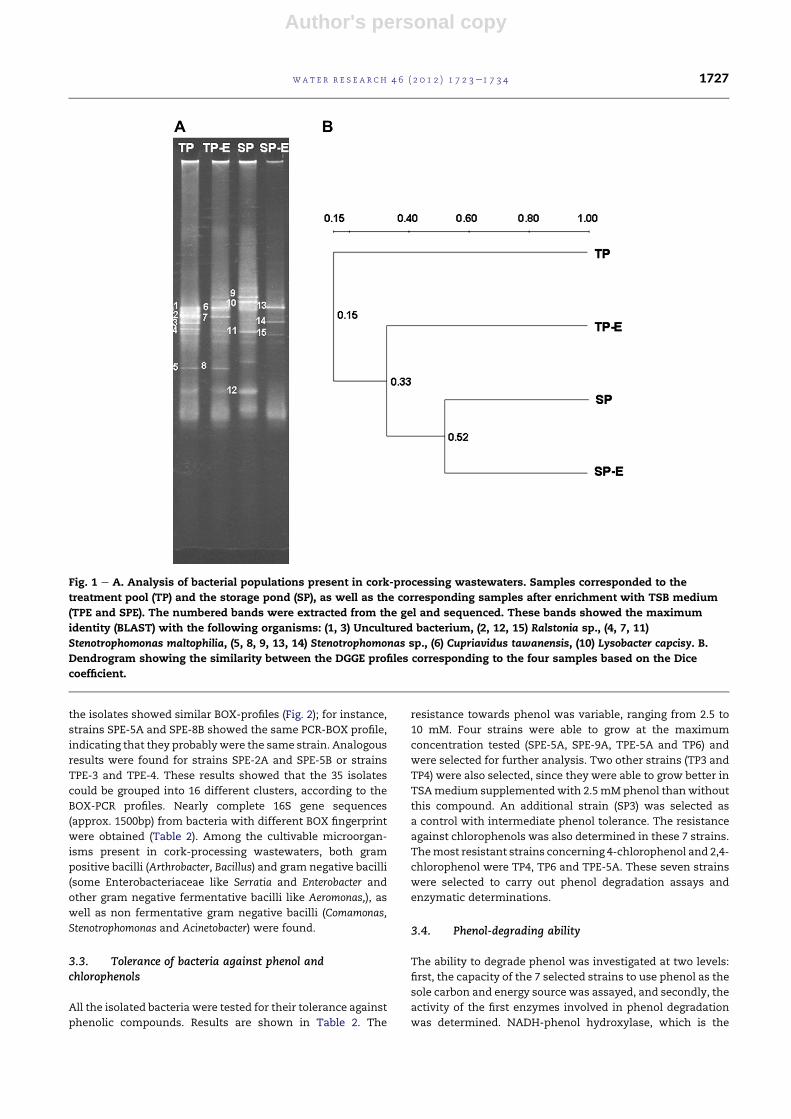
The biodiversity of bacteria present in cork-processing
wastewaters was analysed by DGGE in crude samples (TP,
TPE, SP and SPE) (Fig. 1A). Indices for diversity, richness and
evenness of bacterial communities are shown in Table 1. The
overall community diversity as a function of both the total
number of species (richness) present in the samples and their
relative distribution (evenness) was calculated from the data
obtained from the bacterial 16S rDNA DGGE profile. Diversity
(H0) in all samples was medium, between 2 and 2.6, and the
number of total different DGGE bands (ranging from 11 to 14
bands)was lower than that of other residual waters. Phylotype
(band) richness of the bacterial communities in the enriched
samples (TPE and SPE) was not significantly greater than that
of the initial samples (TP and SP). The algorithm for
computing similarity through this program was the Dice
coefficient. This coefficient has been used by other
researchers as the quantitative measurement of DGGE band-
ing patterns (Trevors et al., 2010). Fig. 1B shows the compar-
ison of the four profiles. TP and TPE were the samples whose
profiles showed the highest similarity, being SPE and TPE the
most different. Therewere common bands in the four profiles,
showing the presence of common microorganisms in all
pools, probably corresponding to cultivable (since they also
appeared in the enriched samples) and very competitive
bacteria, whereas some other bands disappeared in the
enriched samples or showed a lower intensity when
compared to the initial samples. The most intense bands in
DGGE profiles were excised, amplified and sequenced. These
organisms were coincident with bacteria described as phenol
degraders in previous works, such as Ralstonia, Steno-
trophomonas, Cupriavidus and Lysobacter (Zaki, 2006; Dong et al.,
2008; Basile and Erijman, 2010).
3.2. Isolation and identification of bacteria from cork-processing wastewaters
Aliquots of the four samples indicated above were stroked out
on TSA plates for colony isolation. Bacteria with different
colony morphology were selected. Initially, 35 isolates were
obtained in total; 4 apparently different colonies were
observed in SP and 6 in TP. Enriched samples showed more
diversity of cultivable microorganisms; 14 different colonies
were seen in SPE sample and 11 in TP-E. In the original
samples, both Gram negative and Gram positive bacteria were
isolated, while in the enriched samples, mainly Gramnegative
bacteria were identified.
In order to discriminate redundancy, PCR-BOX was per-
formed and bacteria with the same band profile were
considered as the same strain (Johnson et al., 2003). Some of
wat e r r e s e a r c h 4 6 ( 2 0 1 2 ) 1 7 2 3e1 7 3 41726
Author's personal copy
the isolates showed similar BOX-profiles (Fig. 2); for instance,
strains SPE-5A and SPE-8B showed the same PCR-BOX profile,
indicating that they probably were the same strain. Analogous
results were found for strains SPE-2A and SPE-5B or strains
TPE-3 and TPE-4. These results showed that the 35 isolates
could be grouped into 16 different clusters, according to the
BOX-PCR profiles. Nearly complete 16S gene sequences
(approx. 1500bp) from bacteria with different BOX fingerprint
were obtained (Table 2). Among the cultivable microorgan-
isms present in cork-processing wastewaters, both gram
positive bacilli (Arthrobacter, Bacillus) and gram negative bacilli
(some Enterobacteriaceae like Serratia and Enterobacter and
other gram negative fermentative bacilli like Aeromonas,), as
well as non fermentative gram negative bacilli (Comamonas,
Stenotrophomonas and Acinetobacter) were found.
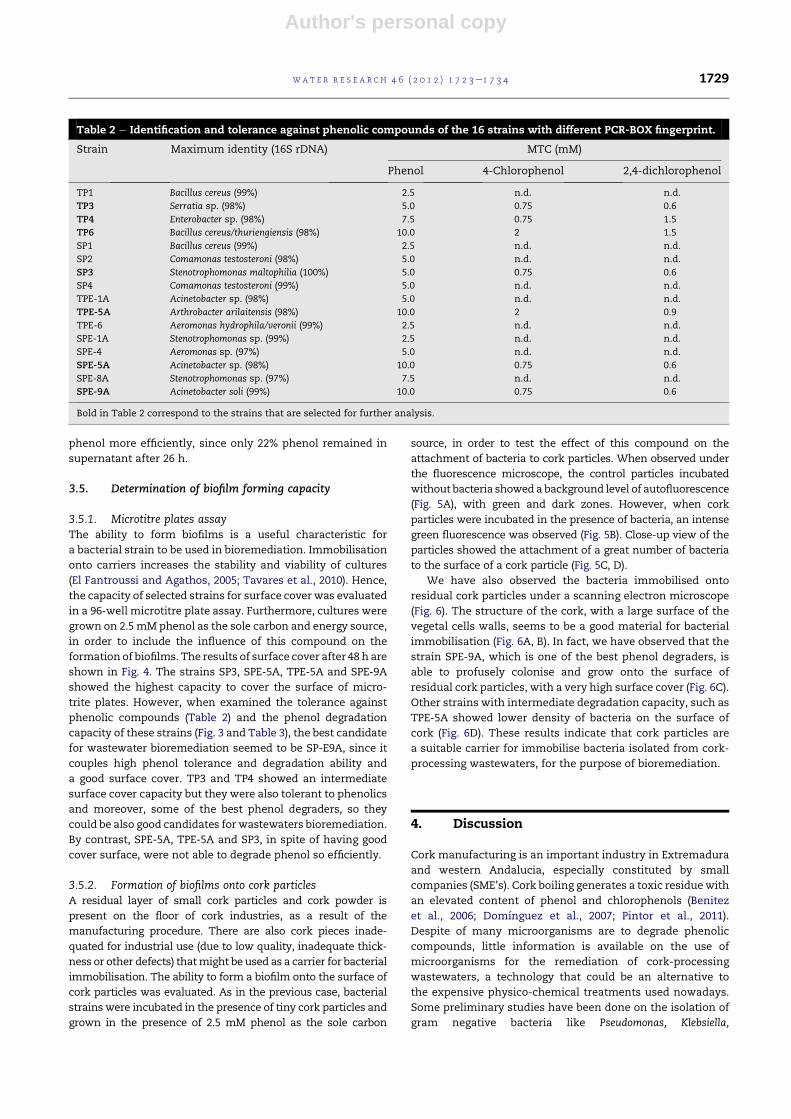
3.3. Tolerance of bacteria against phenol andchlorophenols
All the isolated bacteria were tested for their tolerance against
phenolic compounds. Results are shown in Table 2. The
resistance towards phenol was variable, ranging from 2.5 to
10 mM. Four strains were able to grow at the maximum
concentration tested (SPE-5A, SPE-9A, TPE-5A and TP6) and
were selected for further analysis. Two other strains (TP3 and
TP4) were also selected, since they were able to grow better in
TSAmedium supplemented with 2.5mM phenol thanwithout
this compound. An additional strain (SP3) was selected as
a control with intermediate phenol tolerance. The resistance
against chlorophenols was also determined in these 7 strains.
Themost resistant strains concerning 4-chlorophenol and 2,4-
chlorophenol were TP4, TP6 and TPE-5A. These seven strains
were selected to carry out phenol degradation assays and
enzymatic determinations.
3.4. Phenol-degrading ability
The ability to degrade phenol was investigated at two levels:
first, the capacity of the 7 selected strains to use phenol as the
sole carbon and energy source was assayed, and secondly, the
activity of the first enzymes involved in phenol degradation
was determined. NADH-phenol hydroxylase, which is the
Fig. 1 e A. Analysis of bacterial populations present in cork-processing wastewaters. Samples corresponded to the
treatment pool (TP) and the storage pond (SP), as well as the corresponding samples after enrichment with TSB medium
(TPE and SPE). The numbered bands were extracted from the gel and sequenced. These bands showed the maximum
identity (BLAST) with the following organisms: (1, 3) Uncultured bacterium, (2, 12, 15) Ralstonia sp., (4, 7, 11)
Stenotrophomonas maltophilia, (5, 8, 9, 13, 14) Stenotrophomonas sp., (6) Cupriavidus tawanensis, (10) Lysobacter capcisy. B.
Dendrogram showing the similarity between the DGGE profiles corresponding to the four samples based on the Dice
coefficient.
wat e r r e s e a r c h 4 6 ( 2 0 1 2 ) 1 7 2 3e1 7 3 4 1727

Author's personal copy
enzyme involved in the first step of the phenol degradation
pathway, was determined. In addition, catechol 1,2-
dioxygenase and catechol 2,3-dioxygenase activities were
also measured, in order to clarify if the breakdown of the
aromatic ring occurred in the ortho or the meta position.
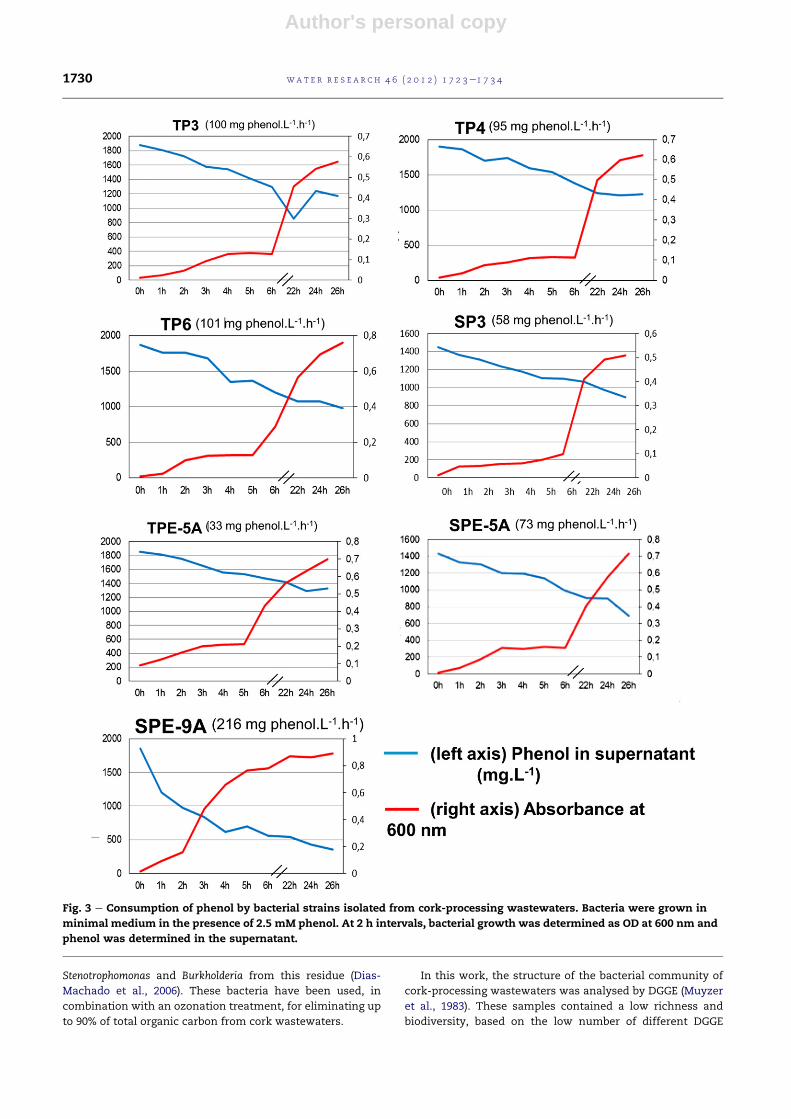
3.4.1. Phenol consumptionThe strains were cultivated in minimal medium supple-
mented with 2.5 mM phenol as the sole carbon and energy
source. The optical density at 600 nm was measured as
a parameter of bacterial growth. In the other hand, the
disappearance of phenol in the culture medium was evalu-
ated. Results are shown in Fig. 3. The ability to grow on phenol
as the sole carbon source varied among strains. Lag phases of
1 he2 h approx. were observed for some strains, such as TP3,
TP6, SPE-5A and SPE-9A. After this period, SPE-9A showed
a fast growth rate in the presence of phenol. Other strains like
TP3, TP4 and TP6 showed slower growth rates. Phenol was
determined every hour in the supernatant of these cultures
for 26 h (Fig. 3), and the rate of phenol degradation during the
first 6 h was calculated (Fig. 3). Final phenol concentration in
the supernatant of the cultures after 26 h incubation was also
measured (Table 3). SPE-9A was the most efficient phenol
degrader bacteria, with the highest phenol degradation rate
(216mg L�1 h�1), followed by TP3, TP4 and TP6 (around 100mg
phenol L�1 h�1). The other strains, SP3, SPE-5A and TPE-5A
degraded phenol less efficiently.
3.4.2. Determination of phenol hydroxylase activityThe metabolic pathway of phenol degradation is well known.
First step is the oxidation of the aromatic ring by phenol
hydroxylase to form the intermediate catechol (1,2-di-
hidroxibenzene). Then, the aromatic ring is opened by diox-
ygenases, either catechol-1,2-dioxygenase (ortho-cleavage) or
catechol-2,3-dioxygenase (meta-cleavage), followed by reduc-
tions finally leading to central metabolism intermediates
(Solyanikova and Golovleva, 2004).
The activity of the NADH-phenol hydroxylase was deter-
mined in all the resistant strains (Table 3). All the strains able
to grow on phenols showed phenol hydroxilase activity. The
strain showing the highest level was SPE-9A, coinciding with
the highest phenol consumption and tolerance, followed by
strains TP3 and TP4, which also were able to grow on phenol
and use it as the sole carbon and energy source (Fig. 3). Lower
phenol hydroxylase activity was found in SPE-5A and TPE-5A,
whereas TP6 and SP3 displayed almost undetectable levels. No
phenol hydroxilase activity was observed using NADPH as the
electron donor in any of the strains (not shown).
The activities of catechol-1,2- and 2,3-dioxygenases were
also measured. In all the strains, the activity of 2,3-
dioxygenase showed a higher value than that of catechol-
1,2-dioxygenase. However, in some strains (TP6, SP3, SPE-5A
and SPE-9A) the ratio between meta and ortho fission path-
ways was very high, indicating that they degraded phenol
mainly through the catechol meta fission pathway. On the
contrary, the other three strains (TP3, TP4 and TPE-5A) seemed
to perform both the ortho and meta fission pathways simulta-
neously, though at different rates. Furthermore, the absolute
values of the activities varied considerably. The strain SPE-9A
showed the highest levels of all the phenol degrading activi-
ties per mL culture, suggesting that this bacterium is an effi-
cient phenol degrader. These data were further confirmed by
determination of remaining phenol in the supernatant of the
cultures (Table 3), which showed that in fact SP-E9A degraded
Table 1 e Richness (R), diversity (H0) and evenness (E) ofbacterial communities at the respective samples.
Sample Richness (R) Diversity index (H0) Evenness (E)
TP 13 2.386 0.930
TPE 12 2.094 0.843
SP 11 2.309 0.963
SPE 14 2.606 0.987
Fig. 2 e BOX-PCR profiles of bacterial strains isolated from cork-processing wastewaters. MM, molecular markers.
wat e r r e s e a r c h 4 6 ( 2 0 1 2 ) 1 7 2 3e1 7 3 41728
Author's personal copy
phenol more efficiently, since only 22% phenol remained in
supernatant after 26 h.
3.5. Determination of biofilm forming capacity
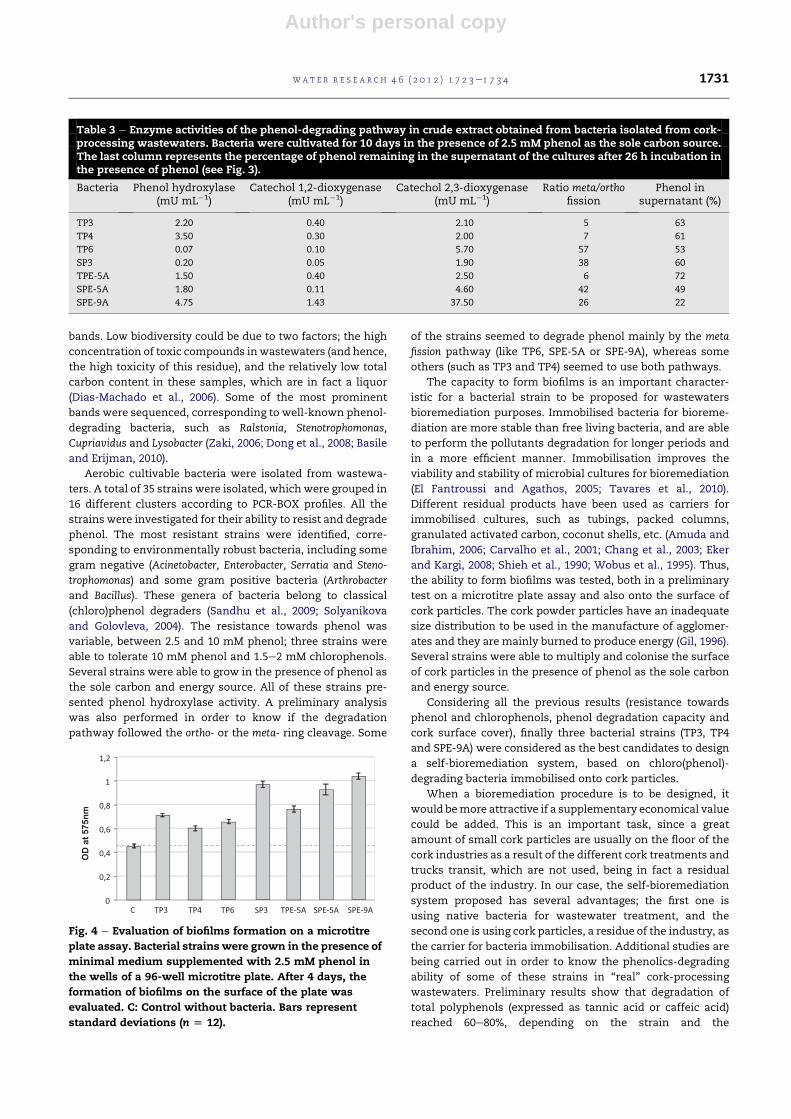
3.5.1. Microtitre plates assayThe ability to form biofilms is a useful characteristic for
a bacterial strain to be used in bioremediation. Immobilisation
onto carriers increases the stability and viability of cultures
(El Fantroussi and Agathos, 2005; Tavares et al., 2010). Hence,
the capacity of selected strains for surface cover was evaluated
in a 96-well microtitre plate assay. Furthermore, cultures were
grown on 2.5mMphenol as the sole carbon and energy source,
in order to include the influence of this compound on the
formation of biofilms. The results of surface cover after 48 h are
shown in Fig. 4. The strains SP3, SPE-5A, TPE-5A and SPE-9A
showed the highest capacity to cover the surface of micro-
trite plates. However, when examined the tolerance against
phenolic compounds (Table 2) and the phenol degradation
capacity of these strains (Fig. 3 and Table 3), the best candidate
for wastewater bioremediation seemed to be SP-E9A, since it
couples high phenol tolerance and degradation ability and
a good surface cover. TP3 and TP4 showed an intermediate
surface cover capacity but they were also tolerant to phenolics
and moreover, some of the best phenol degraders, so they
could be also good candidates for wastewaters bioremediation.
By contrast, SPE-5A, TPE-5A and SP3, in spite of having good
cover surface, were not able to degrade phenol so efficiently.
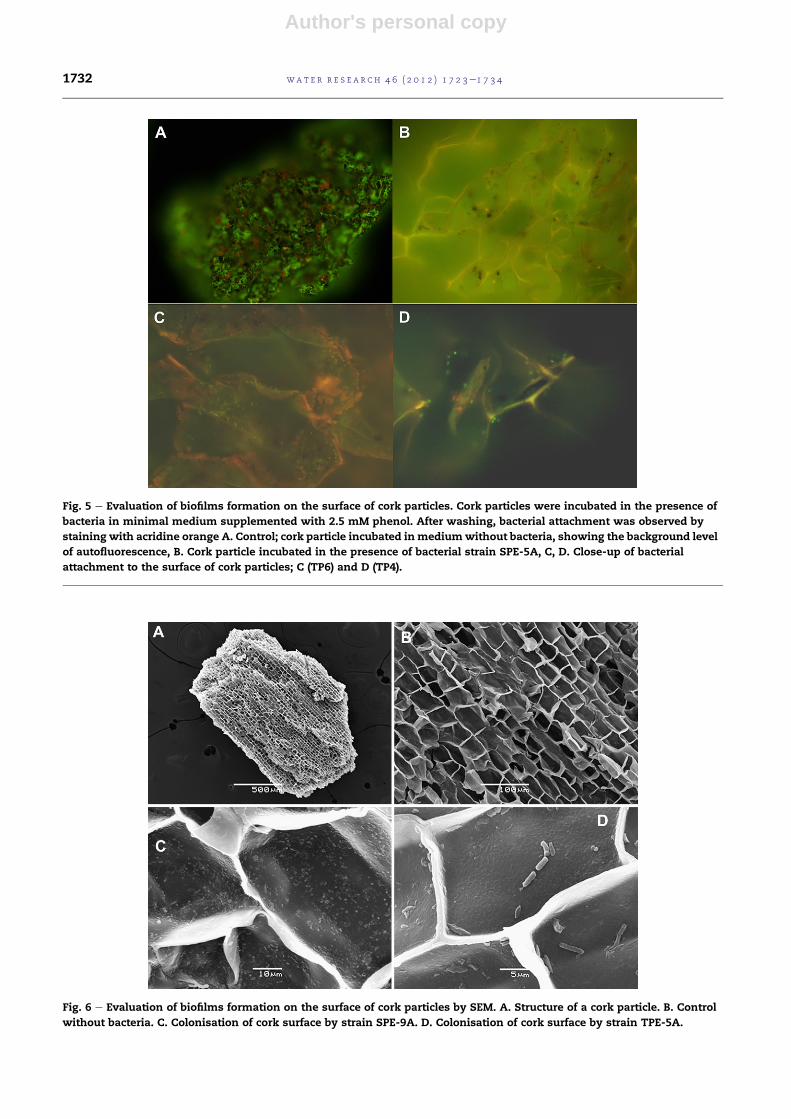
3.5.2. Formation of biofilms onto cork particlesA residual layer of small cork particles and cork powder is
present on the floor of cork industries, as a result of the
manufacturing procedure. There are also cork pieces inade-
quated for industrial use (due to low quality, inadequate thick-
ness or other defects) thatmight be used as a carrier for bacterial
immobilisation. The ability to form a biofilm onto the surface of
cork particles was evaluated. As in the previous case, bacterial
strains were incubated in the presence of tiny cork particles and
grown in the presence of 2.5 mM phenol as the sole carbon
source, in order to test the effect of this compound on the
attachment of bacteria to cork particles. When observed under
the fluorescence microscope, the control particles incubated
without bacteria showed a background level of autofluorescence
(Fig. 5A), with green and dark zones. However, when cork
particles were incubated in the presence of bacteria, an intense
green fluorescence was observed (Fig. 5B). Close-up view of the
particles showed the attachment of a great number of bacteria
to the surface of a cork particle (Fig. 5C, D).
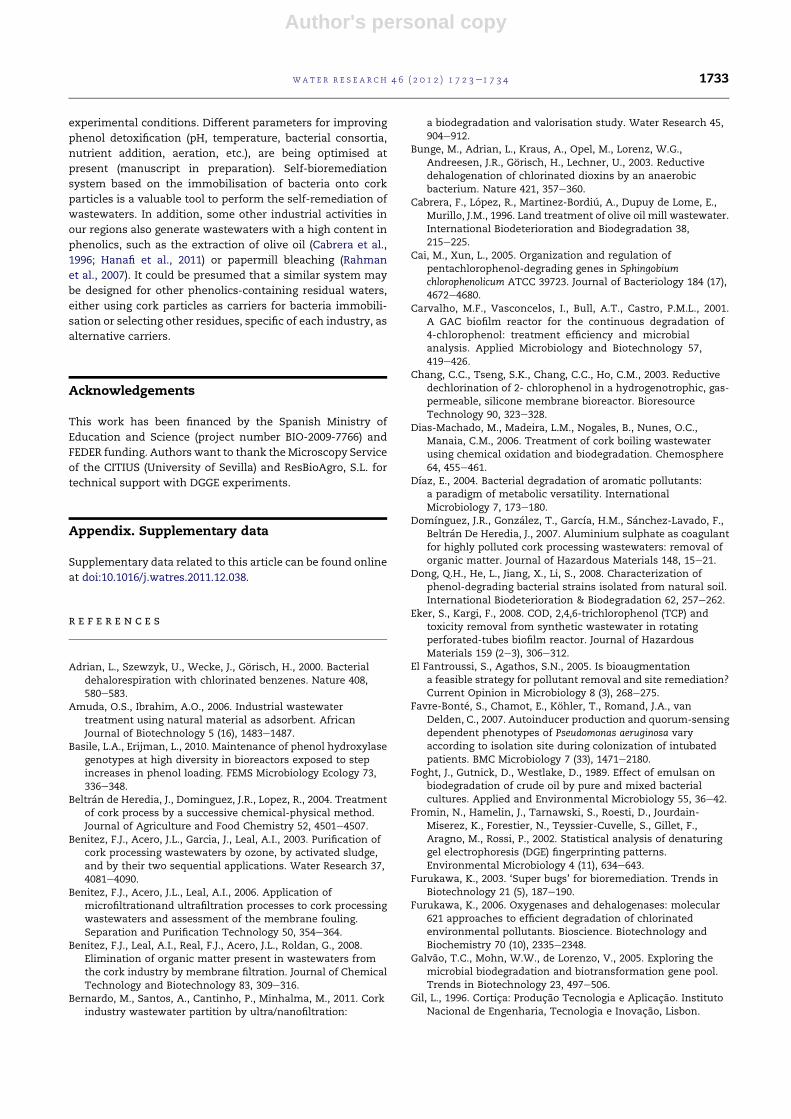
We have also observed the bacteria immobilised onto
residual cork particles under a scanning electron microscope
(Fig. 6). The structure of the cork, with a large surface of the
vegetal cells walls, seems to be a good material for bacterial
immobilisation (Fig. 6A, B). In fact, we have observed that the
strain SPE-9A, which is one of the best phenol degraders, is
able to profusely colonise and grow onto the surface of
residual cork particles, with a very high surface cover (Fig. 6C).
Other strains with intermediate degradation capacity, such as
TPE-5A showed lower density of bacteria on the surface of
cork (Fig. 6D). These results indicate that cork particles are
a suitable carrier for immobilise bacteria isolated from cork-
processing wastewaters, for the purpose of bioremediation.
4. Discussion
Cork manufacturing is an important industry in Extremadura
and western Andalucia, especially constituted by small
companies (SME’s). Cork boiling generates a toxic residuewith
an elevated content of phenol and chlorophenols (Benitez
et al., 2006; Domınguez et al., 2007; Pintor et al., 2011).
Despite of many microorganisms are to degrade phenolic
compounds, little information is available on the use of
microorganisms for the remediation of cork-processing
wastewaters, a technology that could be an alternative to
the expensive physico-chemical treatments used nowadays.
Some preliminary studies have been done on the isolation of
gram negative bacteria like Pseudomonas, Klebsiella,
Table 2 e Identification and tolerance against phenolic compounds of the 16 strains with different PCR-BOX fingerprint.
Strain Maximum identity (16S rDNA) MTC (mM)
Phenol 4-Chlorophenol 2,4-dichlorophenol
TP1 Bacillus cereus (99%) 2.5 n.d. n.d.
TP3 Serratia sp. (98%) 5.0 0.75 0.6
TP4 Enterobacter sp. (98%) 7.5 0.75 1.5
TP6 Bacillus cereus/thuriengiensis (98%) 10.0 2 1.5
SP1 Bacillus cereus (99%) 2.5 n.d. n.d.
SP2 Comamonas testosteroni (98%) 5.0 n.d. n.d.
SP3 Stenotrophomonas maltophilia (100%) 5.0 0.75 0.6
SP4 Comamonas testosteroni (99%) 5.0 n.d. n.d.
TPE-1A Acinetobacter sp. (98%) 5.0 n.d. n.d.
TPE-5A Arthrobacter arilaitensis (98%) 10.0 2 0.9
TPE-6 Aeromonas hydrophila/veronii (99%) 2.5 n.d. n.d.
SPE-1A Stenotrophomonas sp. (99%) 2.5 n.d. n.d.
SPE-4 Aeromonas sp. (97%) 5.0 n.d. n.d.
SPE-5A Acinetobacter sp. (98%) 10.0 0.75 0.6
SPE-8A Stenotrophomonas sp. (97%) 7.5 n.d. n.d.
SPE-9A Acinetobacter soli (99%) 10.0 0.75 0.6
Bold in Table 2 correspond to the strains that are selected for further analysis.
wat e r r e s e a r c h 4 6 ( 2 0 1 2 ) 1 7 2 3e1 7 3 4 1729
Author's personal copy
Stenotrophomonas and Burkholderia from this residue (Dias-
Machado et al., 2006). These bacteria have been used, in
combination with an ozonation treatment, for eliminating up
to 90% of total organic carbon from cork wastewaters.
In this work, the structure of the bacterial community of
cork-processing wastewaters was analysed by DGGE (Muyzer
et al., 1983). These samples contained a low richness and
biodiversity, based on the low number of different DGGE
Fig. 3 e Consumption of phenol by bacterial strains isolated from cork-processing wastewaters. Bacteria were grown in
minimal medium in the presence of 2.5 mM phenol. At 2 h intervals, bacterial growth was determined as OD at 600 nm and
phenol was determined in the supernatant.
wat e r r e s e a r c h 4 6 ( 2 0 1 2 ) 1 7 2 3e1 7 3 41730
Author's personal copy
bands. Low biodiversity could be due to two factors; the high
concentration of toxic compounds inwastewaters (and hence,
the high toxicity of this residue), and the relatively low total
carbon content in these samples, which are in fact a liquor
(Dias-Machado et al., 2006). Some of the most prominent
bands were sequenced, corresponding to well-known phenol-
degrading bacteria, such as Ralstonia, Stenotrophomonas,
Cupriavidus and Lysobacter (Zaki, 2006; Dong et al., 2008; Basile
and Erijman, 2010).
Aerobic cultivable bacteria were isolated from wastewa-
ters. A total of 35 strains were isolated, which were grouped in
16 different clusters according to PCR-BOX profiles. All the
strains were investigated for their ability to resist and degrade
phenol. The most resistant strains were identified, corre-
sponding to environmentally robust bacteria, including some
gram negative (Acinetobacter, Enterobacter, Serratia and Steno-
trophomonas) and some gram positive bacteria (Arthrobacter
and Bacillus). These genera of bacteria belong to classical
(chloro)phenol degraders (Sandhu et al., 2009; Solyanikova
and Golovleva, 2004). The resistance towards phenol was
variable, between 2.5 and 10 mM phenol; three strains were
able to tolerate 10 mM phenol and 1.5e2 mM chlorophenols.
Several strains were able to grow in the presence of phenol as
the sole carbon and energy source. All of these strains pre-
sented phenol hydroxylase activity. A preliminary analysis
was also performed in order to know if the degradation
pathway followed the ortho- or the meta- ring cleavage. Some
of the strains seemed to degrade phenol mainly by the meta
fission pathway (like TP6, SPE-5A or SPE-9A), whereas some
others (such as TP3 and TP4) seemed to use both pathways.
The capacity to form biofilms is an important character-
istic for a bacterial strain to be proposed for wastewaters
bioremediation purposes. Immobilised bacteria for bioreme-
diation are more stable than free living bacteria, and are able
to perform the pollutants degradation for longer periods and
in a more efficient manner. Immobilisation improves the
viability and stability of microbial cultures for bioremediation
(El Fantroussi and Agathos, 2005; Tavares et al., 2010).
Different residual products have been used as carriers for
immobilised cultures, such as tubings, packed columns,
granulated activated carbon, coconut shells, etc. (Amuda and
Ibrahim, 2006; Carvalho et al., 2001; Chang et al., 2003; Eker
and Kargi, 2008; Shieh et al., 1990; Wobus et al., 1995). Thus,
the ability to form biofilms was tested, both in a preliminary
test on a microtitre plate assay and also onto the surface of
cork particles. The cork powder particles have an inadequate
size distribution to be used in the manufacture of agglomer-
ates and they are mainly burned to produce energy (Gil, 1996).
Several strains were able to multiply and colonise the surface
of cork particles in the presence of phenol as the sole carbon
and energy source.
Considering all the previous results (resistance towards
phenol and chlorophenols, phenol degradation capacity and
cork surface cover), finally three bacterial strains (TP3, TP4
and SPE-9A) were considered as the best candidates to design
a self-bioremediation system, based on chloro(phenol)-
degrading bacteria immobilised onto cork particles.
When a bioremediation procedure is to be designed, it
would bemore attractive if a supplementary economical value
could be added. This is an important task, since a great
amount of small cork particles are usually on the floor of the
cork industries as a result of the different cork treatments and
trucks transit, which are not used, being in fact a residual
product of the industry. In our case, the self-bioremediation
system proposed has several advantages; the first one is
using native bacteria for wastewater treatment, and the
second one is using cork particles, a residue of the industry, as
the carrier for bacteria immobilisation. Additional studies are
being carried out in order to know the phenolics-degrading
ability of some of these strains in “real” cork-processing
wastewaters. Preliminary results show that degradation of
total polyphenols (expressed as tannic acid or caffeic acid)
reached 60e80%, depending on the strain and the
Table 3 e Enzyme activities of the phenol-degrading pathway in crude extract obtained from bacteria isolated from cork-processing wastewaters. Bacteria were cultivated for 10 days in the presence of 2.5 mM phenol as the sole carbon source.The last column represents the percentage of phenol remaining in the supernatant of the cultures after 26 h incubation inthe presence of phenol (see Fig. 3).
Bacteria Phenol hydroxylase(mU mL�1)
Catechol 1,2-dioxygenase(mU mL�1)
Catechol 2,3-dioxygenase(mU mL�1)
Ratio meta/orthofission
Phenol insupernatant (%)
TP3 2.20 0.40 2.10 5 63
TP4 3.50 0.30 2.00 7 61
TP6 0.07 0.10 5.70 57 53
SP3 0.20 0.05 1.90 38 60
TPE-5A 1.50 0.40 2.50 6 72
SPE-5A 1.80 0.11 4.60 42 49
SPE-9A 4.75 1.43 37.50 26 22
OD
a
t 5
75
nm
Fig. 4 e Evaluation of biofilms formation on a microtitre
plate assay. Bacterial strains were grown in the presence of
minimal medium supplemented with 2.5 mM phenol in
the wells of a 96-well microtitre plate. After 4 days, the
formation of biofilms on the surface of the plate was
evaluated. C: Control without bacteria. Bars represent
standard deviations (n [ 12).
wat e r r e s e a r c h 4 6 ( 2 0 1 2 ) 1 7 2 3e1 7 3 4 1731
Author's personal copy
Fig. 6 e Evaluation of biofilms formation on the surface of cork particles by SEM. A. Structure of a cork particle. B. Control
without bacteria. C. Colonisation of cork surface by strain SPE-9A. D. Colonisation of cork surface by strain TPE-5A.
Fig. 5 e Evaluation of biofilms formation on the surface of cork particles. Cork particles were incubated in the presence of
bacteria in minimal medium supplemented with 2.5 mM phenol. After washing, bacterial attachment was observed by
staining with acridine orange A. Control; cork particle incubated inmediumwithout bacteria, showing the background level
of autofluorescence, B. Cork particle incubated in the presence of bacterial strain SPE-5A, C, D. Close-up of bacterial
attachment to the surface of cork particles; C (TP6) and D (TP4).
wat e r r e s e a r c h 4 6 ( 2 0 1 2 ) 1 7 2 3e1 7 3 41732
Author's personal copy
experimental conditions. Different parameters for improving
phenol detoxification (pH, temperature, bacterial consortia,
nutrient addition, aeration, etc.), are being optimised at
present (manuscript in preparation). Self-bioremediation
system based on the immobilisation of bacteria onto cork
particles is a valuable tool to perform the self-remediation of
wastewaters. In addition, some other industrial activities in
our regions also generate wastewaters with a high content in
phenolics, such as the extraction of olive oil (Cabrera et al.,
1996; Hanafi et al., 2011) or papermill bleaching (Rahman
et al., 2007). It could be presumed that a similar system may
be designed for other phenolics-containing residual waters,
either using cork particles as carriers for bacteria immobili-
sation or selecting other residues, specific of each industry, as
alternative carriers.
Acknowledgements
This work has been financed by the Spanish Ministry of
Education and Science (project number BIO-2009-7766) and
FEDER funding. Authors want to thank the Microscopy Service
of the CITIUS (University of Sevilla) and ResBioAgro, S.L. for
technical support with DGGE experiments.
Appendix. Supplementary data
Supplementary data related to this article can be found online
at doi:10.1016/j.watres.2011.12.038.
r e f e r e n c e s
Adrian, L., Szewzyk, U., Wecke, J., Gorisch, H., 2000. Bacterialdehalorespiration with chlorinated benzenes. Nature 408,580e583.
Amuda, O.S., Ibrahim, A.O., 2006. Industrial wastewatertreatment using natural material as adsorbent. AfricanJournal of Biotechnology 5 (16), 1483e1487.
Basile, L.A., Erijman, L., 2010. Maintenance of phenol hydroxylasegenotypes at high diversity in bioreactors exposed to stepincreases in phenol loading. FEMS Microbiology Ecology 73,336e348.
Beltran de Heredia, J., Dominguez, J.R., Lopez, R., 2004. Treatmentof cork process by a successive chemical-physical method.Journal of Agriculture and Food Chemistry 52, 4501e4507.
Benitez, F.J., Acero, J.L., Garcia, J., Leal, A.I., 2003. Purification ofcork processing wastewaters by ozone, by activated sludge,and by their two sequential applications. Water Research 37,4081e4090.
Benitez, F.J., Acero, J.L., Leal, A.I., 2006. Application ofmicrofiltrationand ultrafiltration processes to cork processingwastewaters and assessment of the membrane fouling.Separation and Purification Technology 50, 354e364.
Benitez, F.J., Leal, A.I., Real, F.J., Acero, J.L., Roldan, G., 2008.Elimination of organic matter present in wastewaters fromthe cork industry by membrane filtration. Journal of ChemicalTechnology and Biotechnology 83, 309e316.
Bernardo, M., Santos, A., Cantinho, P., Minhalma, M., 2011. Corkindustry wastewater partition by ultra/nanofiltration:
a biodegradation and valorisation study. Water Research 45,904e912.
Bunge, M., Adrian, L., Kraus, A., Opel, M., Lorenz, W.G.,Andreesen, J.R., Gorisch, H., Lechner, U., 2003. Reductivedehalogenation of chlorinated dioxins by an anaerobicbacterium. Nature 421, 357e360.
Cabrera, F., Lopez, R., Martinez-Bordiu, A., Dupuy de Lome, E.,Murillo, J.M., 1996. Land treatment of olive oil mill wastewater.International Biodeterioration and Biodegradation 38,215e225.
Cai, M., Xun, L., 2005. Organization and regulation ofpentachlorophenol-degrading genes in Sphingobiumchlorophenolicum ATCC 39723. Journal of Bacteriology 184 (17),4672e4680.
Carvalho, M.F., Vasconcelos, I., Bull, A.T., Castro, P.M.L., 2001.A GAC biofilm reactor for the continuous degradation of4-chlorophenol: treatment efficiency and microbialanalysis. Applied Microbiology and Biotechnology 57,419e426.
Chang, C.C., Tseng, S.K., Chang, C.C., Ho, C.M., 2003. Reductivedechlorination of 2- chlorophenol in a hydrogenotrophic, gas-permeable, silicone membrane bioreactor. BioresourceTechnology 90, 323e328.
Dias-Machado, M., Madeira, L.M., Nogales, B., Nunes, O.C.,Manaia, C.M., 2006. Treatment of cork boiling wastewaterusing chemical oxidation and biodegradation. Chemosphere64, 455e461.
Dıaz, E., 2004. Bacterial degradation of aromatic pollutants:a paradigm of metabolic versatility. InternationalMicrobiology 7, 173e180.
Domınguez, J.R., Gonzalez, T., Garcıa, H.M., Sanchez-Lavado, F.,Beltran De Heredia, J., 2007. Aluminium sulphate as coagulantfor highly polluted cork processing wastewaters: removal oforganic matter. Journal of Hazardous Materials 148, 15e21.
Dong, Q.H., He, L., Jiang, X., Li, S., 2008. Characterization ofphenol-degrading bacterial strains isolated from natural soil.International Biodeterioration & Biodegradation 62, 257e262.
Eker, S., Kargi, F., 2008. COD, 2,4,6-trichlorophenol (TCP) andtoxicity removal from synthetic wastewater in rotatingperforated-tubes biofilm reactor. Journal of HazardousMaterials 159 (2e3), 306e312.
El Fantroussi, S., Agathos, S.N., 2005. Is bioaugmentationa feasible strategy for pollutant removal and site remediation?Current Opinion in Microbiology 8 (3), 268e275.
Favre-Bonte, S., Chamot, E., Kohler, T., Romand, J.A., vanDelden, C., 2007. Autoinducer production and quorum-sensingdependent phenotypes of Pseudomonas aeruginosa varyaccording to isolation site during colonization of intubatedpatients. BMC Microbiology 7 (33), 1471e2180.
Foght, J., Gutnick, D., Westlake, D., 1989. Effect of emulsan onbiodegradation of crude oil by pure and mixed bacterialcultures. Applied and Environmental Microbiology 55, 36e42.
Fromin, N., Hamelin, J., Tarnawski, S., Roesti, D., Jourdain-Miserez, K., Forestier, N., Teyssier-Cuvelle, S., Gillet, F.,Aragno, M., Rossi, P., 2002. Statistical analysis of denaturinggel electrophoresis (DGE) fingerprinting patterns.Environmental Microbiology 4 (11), 634e643.
Furukawa, K., 2003. ‘Super bugs’ for bioremediation. Trends inBiotechnology 21 (5), 187e190.
Furukawa, K., 2006. Oxygenases and dehalogenases: molecular621 approaches to efficient degradation of chlorinatedenvironmental pollutants. Bioscience. Biotechnology andBiochemistry 70 (10), 2335e2348.
Galvao, T.C., Mohn, W.W., de Lorenzo, V., 2005. Exploring themicrobial biodegradation and biotransformation gene pool.Trends in Biotechnology 23, 497e506.
Gil, L., 1996. Cortica: Producao Tecnologia e Aplicacao. InstitutoNacional de Engenharia, Tecnologia e Inovacao, Lisbon.
wat e r r e s e a r c h 4 6 ( 2 0 1 2 ) 1 7 2 3e1 7 3 4 1733

Author's personal copy
Guedes, A.M.F.M., Madeira, L.M.P., Boaventura, R.A.R.,Costa, C.A.V., 2003. Fenton oxidation of cork cookingwastewater: overall kinetic analysis. Water Research 37 (13),3061e3069.
Hanafi, F., Belaoufia, A., Mountadarb, M., Assobheia, O., 2011.Augmentation of biodegradability of olive mill wastewater byelectrochemical pre-treatment: effect on phytotoxicity andoperating cost. Journal of Hazardous Materials 190, 94e99.
Heuer, H., Krsek, M., Baker, P., Smalla, K., Wellington, E.M.H.,1997. Analysis of Actinomycetes communities by specificamplification of genes encoding 16S rRNA and Gel-Electrophoretic separation in denaturing gradients. Appliedand Environmental Microbiology 63 (8), 3233e3241.
Janssen, D.B., Drinkla, I.J.T., Poelarends, G.J., Terpstra, P., 2005.Bacterial degradation of xenobiotic compounds: evolution anddistribution of novel enzyme activities. EnvironmentalMicrobiology 7, 1868e1882.
Jobson, J., 1991. Applied Multivariate Data Analysis, vol. 1.Springer Verlag, New York, USA, pp. 621.
Johansson, E.M.V., Shanika, A.C., Kolomiets, E., Buts, L.,Kadam, R.U., Cacciarini, M., Bartels, K.M., Diggle, S.P.,Camara, M., Williams, P., Loris, R., Nativi, C., Rosenau, F.,Jaeger, K.E., Darbre, T., Reymond, J.L., 2008. Inhibition anddispersion of Pseudomonas aeruginosa biofilms by glycopeptidesdendrimers targeting the fucose-specific lectin LecB.Chemistry and Biology 15, 1249e1257.
Johnson, M.J., Lee, K.Y., Scow, K.M., 2003. DNA fingerprintingreveals links among agricultural crops, soil properties, and thecomposition of soil microbial communities. Geoderma 114,279e303.
Lacoste, R.J., Venable, S.H., Stone, J.C., 1959. Modified 4-aminoantipyrine colorimetric method for phenols. AnalyticalChemistry 31, 1246e1249.
Lan, B.Y., Nigmatullin, R., Puma, G.L., 2008. Ozonation kinetics ofcork-processing water in a bubble column reactor. WaterResearch 42, 2473e2482.
Maggurran, A.E., 1988. Ecological Diversity and Its Measurement.Princeton University Press, Princeton, New Jersey.
Mendonca, E., Pereira, P., Martins, A., Anselmo, A.M., 2004. Fungalbiodegradation and detoxification of cork boiling wastewaters.Engineering In Life Sciences 4 (2), 144e149.
Muyzer, G., de Waal, E.C., Uitterlinden, A.G., 1983. Profiling ofcomplex microbial populations by denaturing gradient gelelectrophoresis analysis of polymerase chain reactionamplified genes coding for 16S rRNA. Applied andEnvironmental Microbiology 59, 695e700.
Parvanov, D., Topalova, Y., 2008. Biodegradation potential ofphenol-resistant bacteria localized in different streamhabitats. Biotechnology & Biotechnology Equipment 22,709e715.
Pintor, A.M.A., Vilar, V.J.P., Boaventura, R.A.R., 2011.Decontamination of cork wastewaters by solar-photo-Fentonprocess using cork bleaching wastewater as H2O2 source.Solar Energy 85, 579e587.
Rahman, R.A., Zahrim, A.Y., Abu Bakar, A., 2007. Chloro-organicsin papermill effluent: identification and removal bysequencing batch biofilm reactor. Journal of Applied Sciences7, 2160e2163.
Rivas, R., Velazquez, E., Willems, A., Vizcaıno, N., Subba-Rao, N.S.,Mateos, P.F., Gillis, M., Martınez-Molina, E., 2002. A newspecies of Devosia that forms a unique nitrogen-fixing root-nodule symbiosis with the aquatic legume Neptunia natans(L.f.) Druce. Applied and Environmental Microbiology 68 (11),5217e5222.
Sandhu, A., Halberson, L.J., Beattie, G.A., 2009. Identification andgenetic characterization of phenol-degrading bacteria fromleaf microbial communities. Microbial Ecology 57, 276e285.
Shieh, W.K., Puhakka, J.A., Melin, E., Tuhkanen, T., 1990.Immobilized-Cell degradation of chlorophenols. Journal ofEnvironmental Engineering 116 (4), 683e687.
Smidt, H., De Vos, W.M., 2004. Anaerobic microbialdehalogenation. Annual Review of Microbiology 58, 43e73.
Solyanikova, I.P., Golovleva, L.A., 2004. Bacterial Degradation ofchlorophenols: pathways, biochemical, and genetic aspects.Journal of Environmental Science and Health B39 (3), 333e351.
Stapleton, R.D., Singh, V.P., 2002. Biotransformations:Bioremediation Technology for Health and EnvironmentalProtection. Elsevier Science, ISBN 978-0444509970.
Tavares, C., Michelon, M., Fernandes de Medeiros, J., Juliano, S.,Veiga, C.A., 2010. Biodegradation of phenol by free andencapsulated cells of a new Aspergillus sp. isolated froma contaminated site in southern Brazil. African Journal ofBiotechnology 9 (40), 6716e6720.
Trevors, J.T., Kevan, P.G., Tam, L., 2010. Microbial diversity acrossa Canadian sub-Arctic, isostatically rebounding, soil transect.Polar Science 4, 81e91.
Van der Meer, J.R., 2008. A genomic view on the evolution ofcatabolic pathways and bacterial adaptation to xenobioticcompounds. In: Dıaz, E. (Ed.), Microbial Biodegradation:Genomics and Molecular Biology, ISBN 978-1-904455-17-2,pp. 219e267.
Vincent, J.M., 1970. A Manual for the Practical Study of Root-nodule Bacteria. Blackwell Scientific Publications, Oxford, UK.
Watanabe, K., Teramoto, M., Futamata, H., Harayama, S., 1998.Molecular detection, isolation, and physiologicalcharacterization of functionally dominant phenol-degradingbacteria in activated sludge. Applied and EnvironmentalMicrobiology 64 (11), 4396e4402.
Weisburg, D.A., Barns, S.M., Land, D.A., Pelletier, D.J., 1991. 16Sribosomal DNA amplification for phylogenetic study. Journalof Bacteriology 173, 697e703.
Wobus, A., Ulrich, S., Roske, I., 1995. Degradation ofchlorophenols by biofilms on semipermeable membranes intwo types of fixed bed reactors. Water Science and Technology32 (8), 205e212.
Zaki, S., 2006. Detection of meta- and ortho-cleavagedioxygenases in bacterial phenol degraders. Journal of AppliedSciences and Environmental Management 10 (3), 75e81.
wat e r r e s e a r c h 4 6 ( 2 0 1 2 ) 1 7 2 3e1 7 3 41734