Assessing Information from Multilevel and Continuous
Tests
Likelihood Ratios for results other than “+” or “-”
Michael A. Kohn, MD, MPP10/2/2008

Four Main Points
1) Dichotomizing a multi-level test by choosing a fixed cutpoint reduces the value of the test.
2) The ROC curve summarizes the ability of the test to differentiate between D+ and D- individuals.
3) LR(result) = P(result|D+)/P(result|D-) = slope of ROC curve.
(NOTE: Do not calculate an LR(+) or LR(-) for a multilevel test.)
4) Pre-Test Odds x LR(result) = Post-Test Odds

NOTE
Do not calculate an LR(+) or LR(-) for a test with more than two possible results.

Additional Topics
Optimal Cutoffs Walking Man C Statistic
Example from Chapter 3
65-year-old woman with mammogram suspicious for malignancy
Pre-test probability ≈ 0.015LR(“suspicious for malignancy”) ≈
100Post-test probability = ?
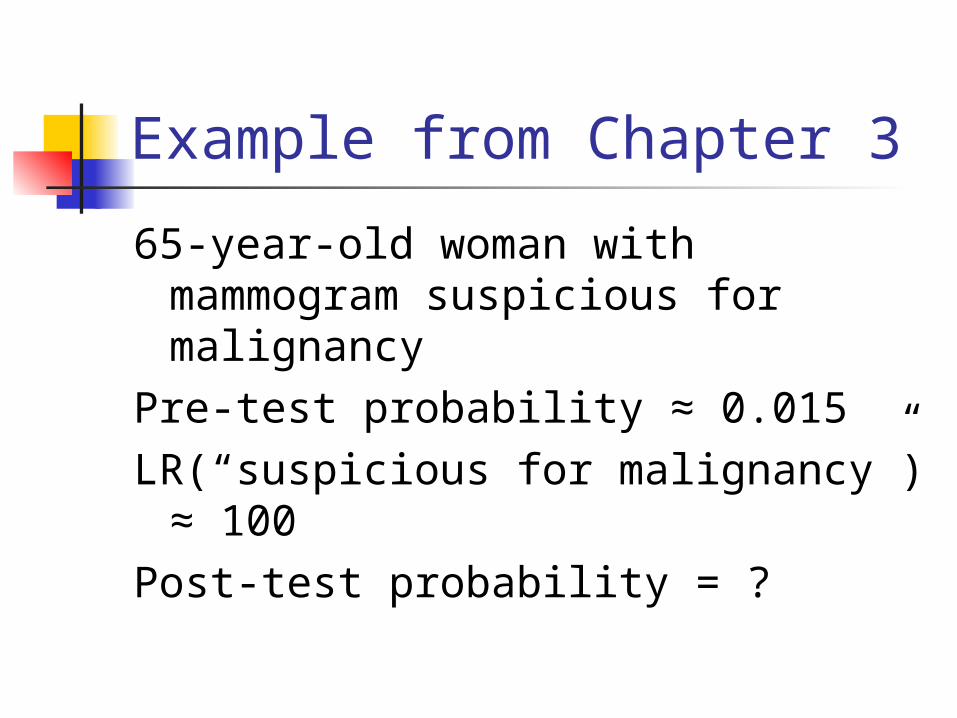
Update Pre-Test Probability Using LR(test result)
1) Convert pre-test probability (P) to pre-test odds. Pre-Test Odds = P/(1-P)
2) Calculate LR. P(result|D+)/P(result|D-). 3) Post-Test Odds = Pre-Test Odds × LR4) Convert post-test odds to post-test
probability. Prob = Odds/(1+Odds)

Update Pre-Test Probability Using LR(test result)
1) Pre-test probability P = 0.015Pre-test odds = P/(1-P) ≈ 0.015
2) LR(“Suspicious for Malignancy”) = 100
3) Post-Test Odds = 0.015 × 100 = 1.54) Post-test probability =
Odds/(1+Odds) = 1.5/2.5 = 0.60

Can Use Slide Rule
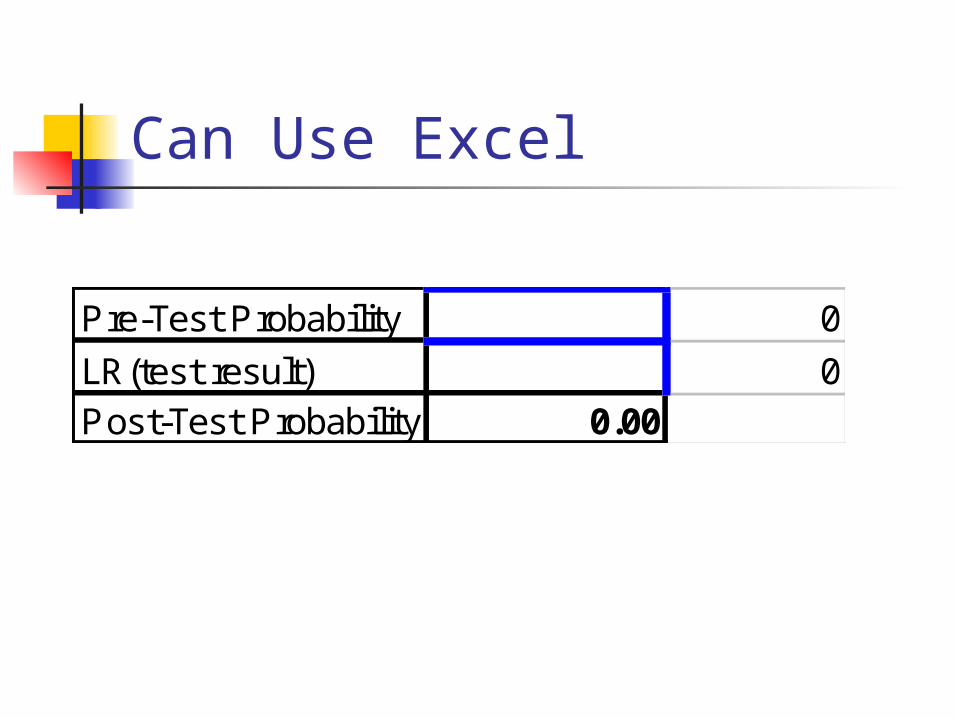
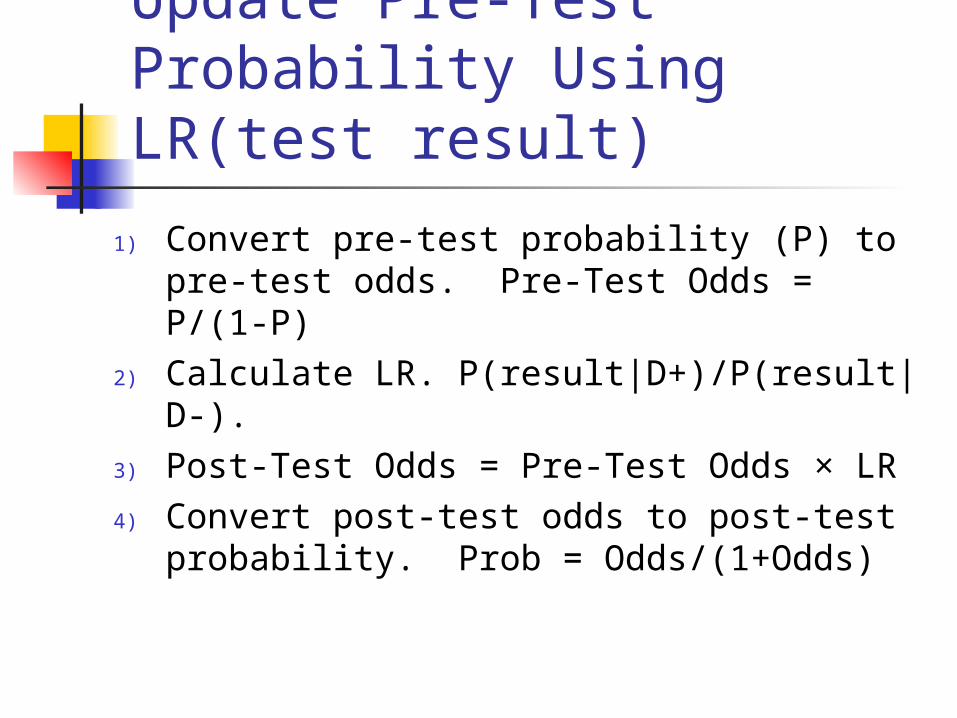
Can Use Excel
Pre-Test Probability 0
LR(test result) 0Post-Test Probability 0.00

Can Use Web-Based Calculator
We will come back to this
(This ends the example for Chapter 3.)

Evaluating the Test--Test Characteristics
For dichotomous tests, we discussed sensitivity P(+|D+) and specificity P(-|D-)
For multi-level and continuous tests, we will discuss the Receiver Operating Characteristic (ROC) curve
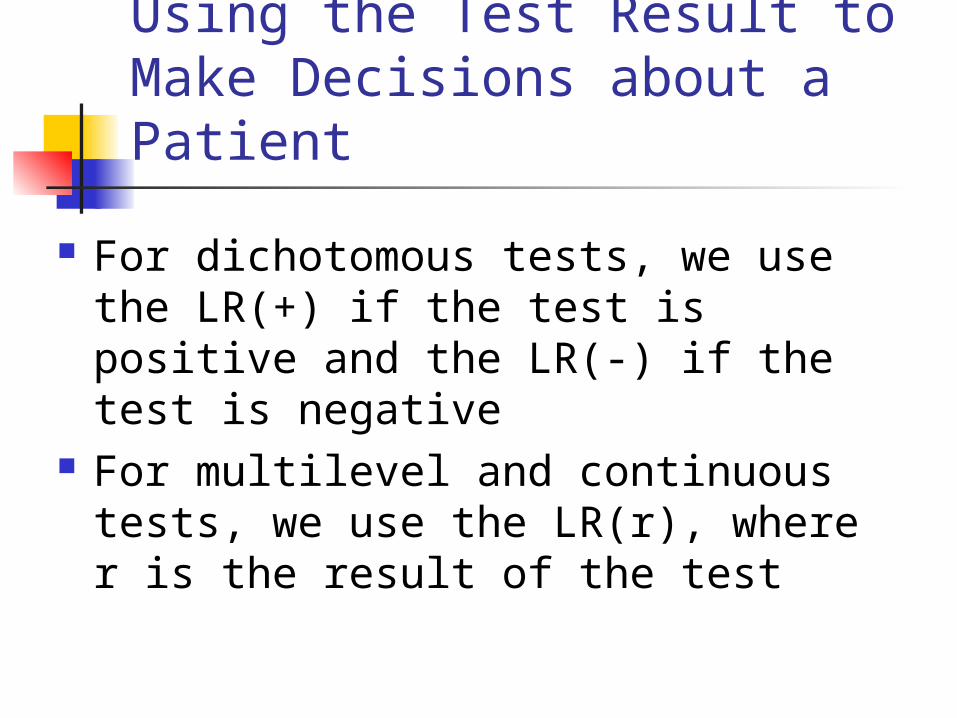
Using the Test Result to Make Decisions about a Patient
For dichotomous tests, we use the LR(+) if the test is positive and the LR(-) if the test is negative
For multilevel and continuous tests, we use the LR(r), where r is the result of the test

Septic ArthritisBacterial infection in a joint.

Clinical ScenarioDoes this Adult Patient Have Septic Arthritis?

Clinical ScenarioDoes this Adult Patient Have Septic Arthritis?
A 48-year-old woman with a history of rheumatoid arthritis who has been treated with long-term, low-dose prednisone presents to the emergency department with a 2-day history of a red, swollen right knee that is painful to touch. She reports no prior knee swelling and no recent trauma or knee surgery, illegal drug use, rash, uveitis, or risky sexual behavior. On examination, she is afebrile and has a right knee effusion. Her peripheral white blood cell (WBC) count is 11 000/µL and her erythrocyte sedimentation rate (ESR) is 55 mm/h. An arthrocentesis is performed, and the initial Gram stain is negative.
Margaretten, M. E., J. Kohlwes, et al. (2007). Jama 297(13): 1478-88.
You have the synovial white blood cell (WBC) count.

Clinical ScenarioDoes this Adult Patient Have Septic Arthritis?
Assume pre-test probability of septic arthritis is 0.38.
How do you use the synovial WBC result to determine the likelihood of septic arthritis?
Margaretten, M. E., J. Kohlwes, et al. (2007). Jama 297(13): 1478-88.
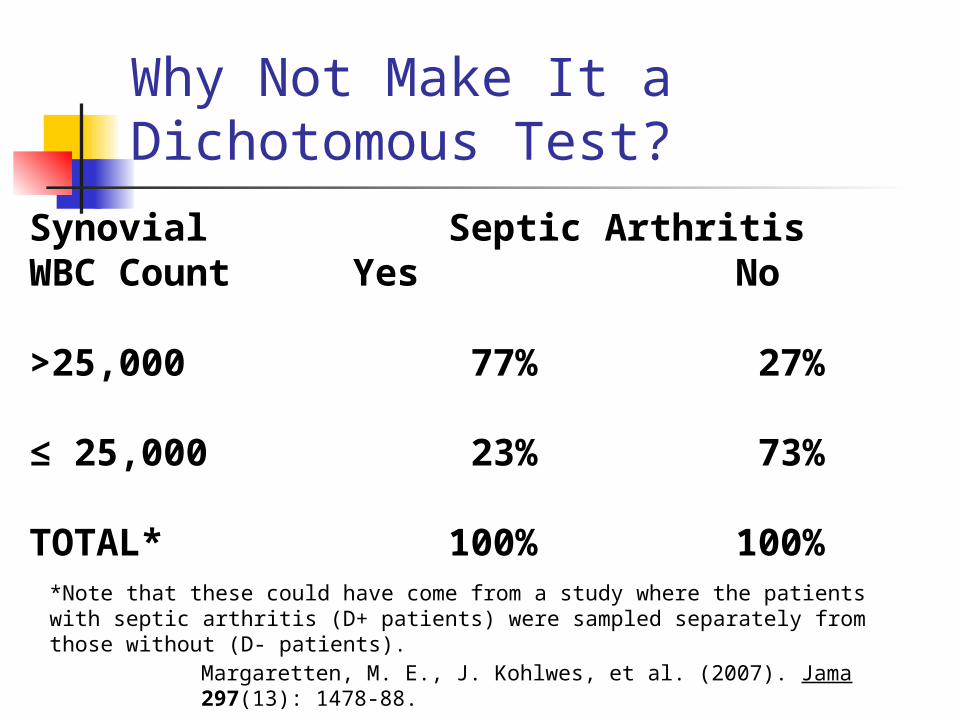
Why Not Make It a Dichotomous Test?
Synovial Septic ArthritisWBC Count Yes No
>25,000 77% 27%
≤ 25,000 23% 73%
TOTAL* 100% 100%*Note that these could have come from a study where the patients with septic arthritis (D+ patients) were sampled separately from those without (D- patients).
Margaretten, M. E., J. Kohlwes, et al. (2007). Jama 297(13): 1478-88.

Why Not Make It a Dichotomous Test?
Sensitivity = 77%Specificity = 73%
LR(+) = 0.77/(1 - 0.73) = 2.9LR(-) = (1 - 0.77)/0.73 = 0.32
“+” = > 25,000/uL “-” = ≤ 25,000/uL
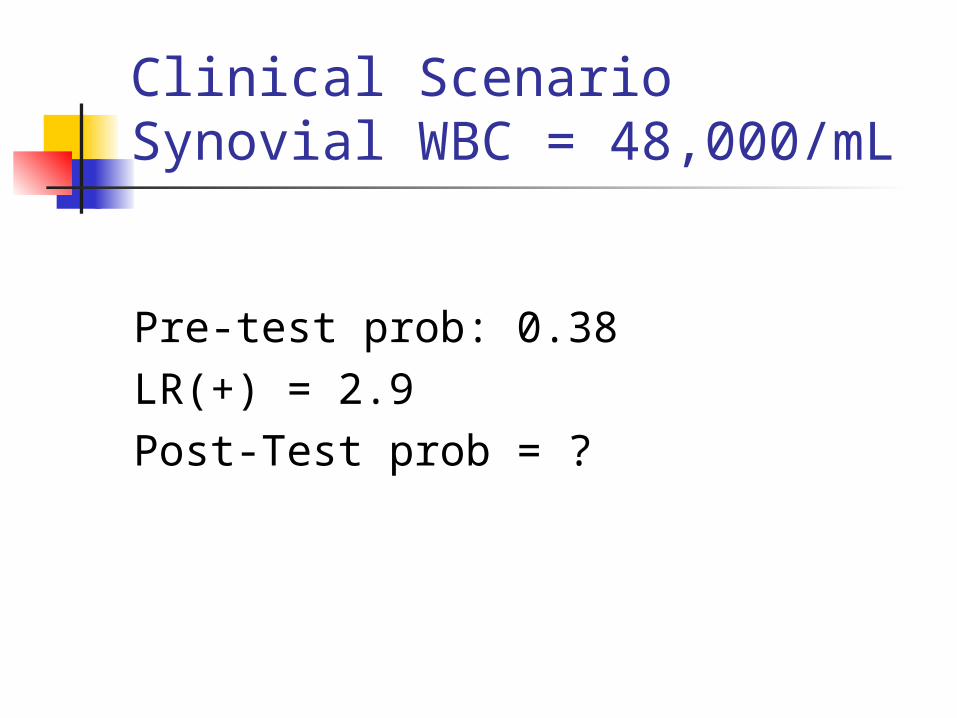
Clinical ScenarioSynovial WBC = 48,000/mL
Pre-test prob: 0.38LR(+) = 2.9Post-Test prob = ?
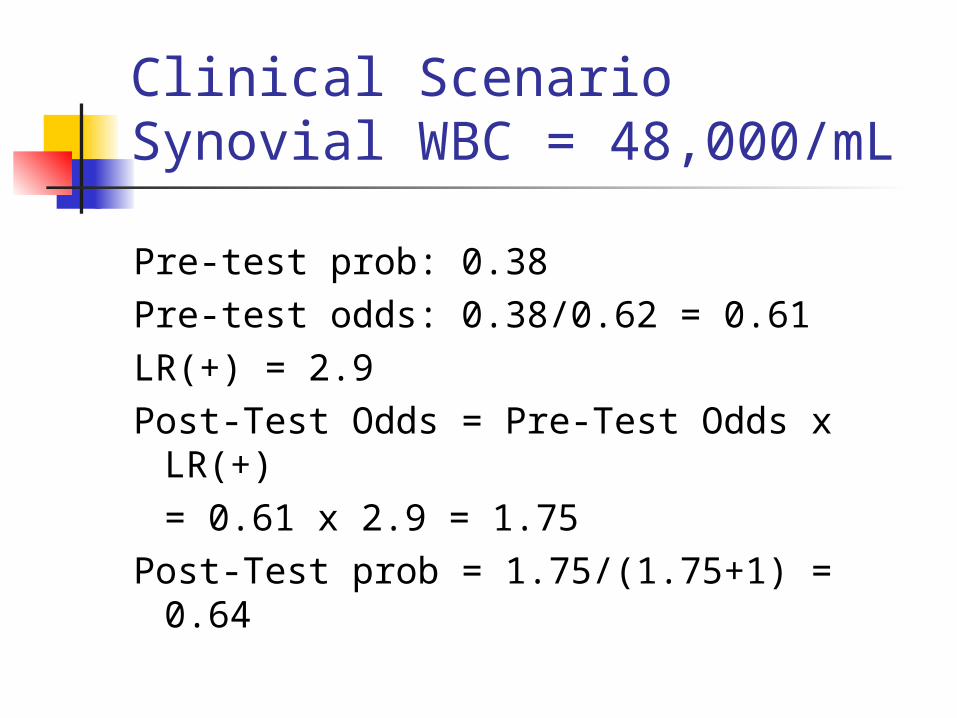
Clinical ScenarioSynovial WBC = 48,000/mL
Pre-test prob: 0.38Pre-test odds: 0.38/0.62 = 0.61LR(+) = 2.9Post-Test Odds = Pre-Test Odds x
LR(+)= 0.61 x 2.9 = 1.75
Post-Test prob = 1.75/(1.75+1) = 0.64

Clinical ScenarioSynovial WBC = 48,000/mLSlide Rule
Pre-test prob: 0.38LR(+) = 2.9Post-Test prob =
(Demonstrate Slide Rule)

Can Use Excel
Pre-Test Probability 0.38 0.612903
LR(test result) 2.9 1.777419Post-Test Probability 0.64
Pre-test prob: 0.38LR(+) = 2.9Post-Test prob =

Can Use Web-Based Calculator
http://www.quesgen.com/Calculators/PostProdOfDisease/PostProdOfDisease.html
P(+|D+) = Sensitivity = 77%P(+|D-) = 1 - Specificity = 1 - 73% = 27%
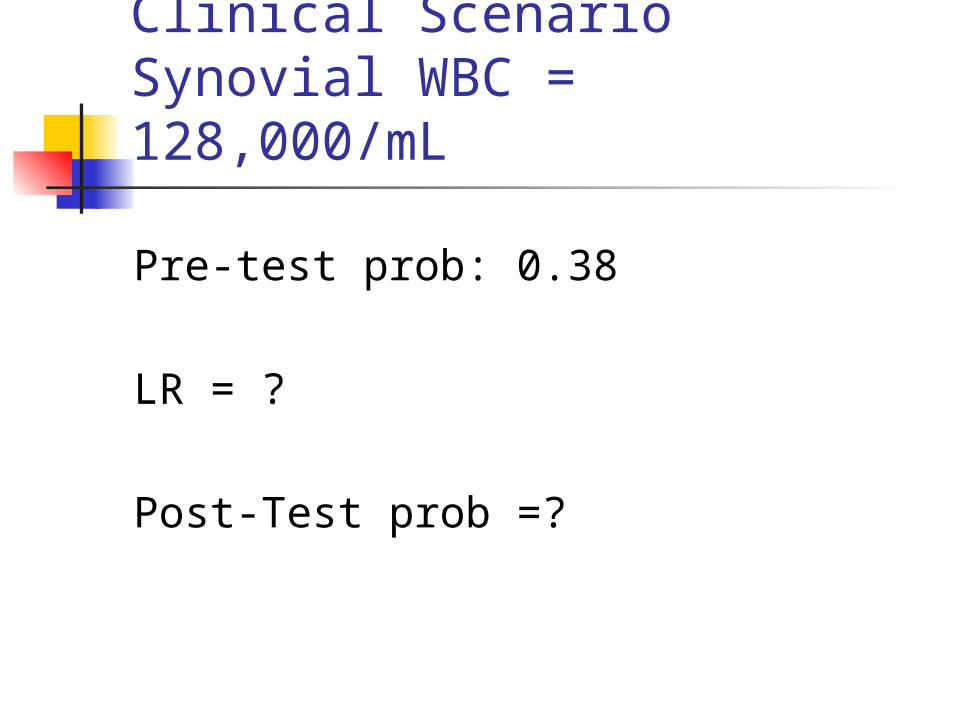
Clinical ScenarioSynovial WBC = 128,000/mL
Pre-test prob: 0.38
LR = ?
Post-Test prob =?
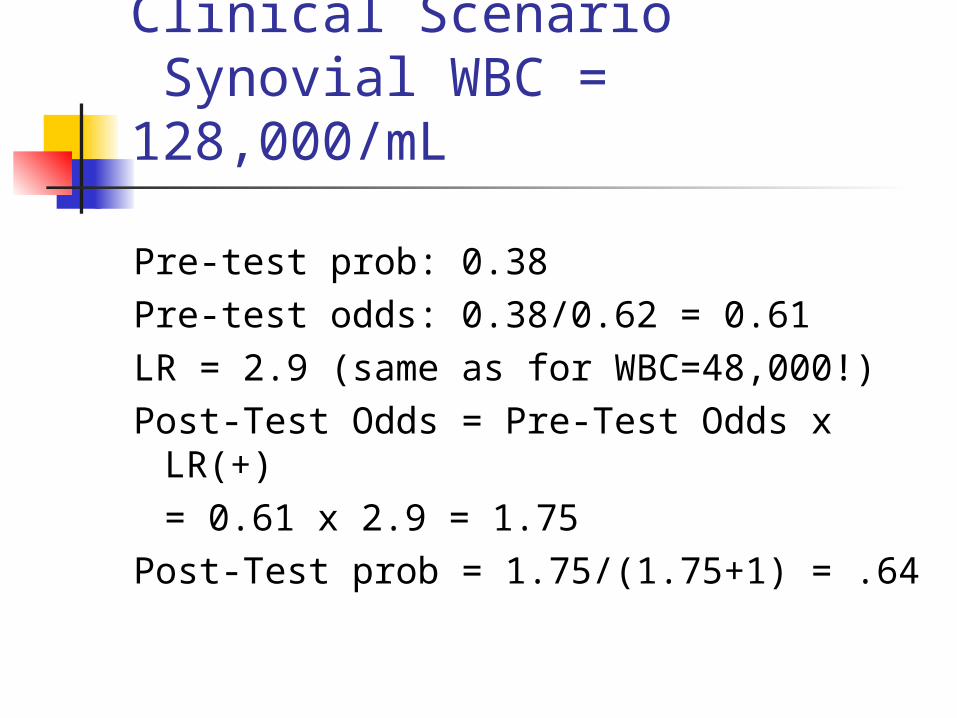
Clinical Scenario Synovial WBC = 128,000/mL
Pre-test prob: 0.38 Pre-test odds: 0.38/0.62 = 0.61LR = 2.9 (same as for WBC=48,000!)Post-Test Odds = Pre-Test Odds x
LR(+)= 0.61 x 2.9 = 1.75
Post-Test prob = 1.75/(1.75+1) = .64

Why Not Make It a Dichotomous Test?
Because you lose information. The risk associated with a synovial WBC=48,000 is equated with the risk associated with WBC=128,000.
Choosing a fixed cutpoint to dichotomize a multi-level or continuous test throws away information and reduces the value of the test.

Main Point 1: Avoid Making Multilevel Tests Dichotomous
Dichotomizing a multi-level or continuous test by choosing a fixed cutpoint reduces the value of the test

WBC (/uL) Interval
% of Septic Arthritis
% of No Septic Arthritis
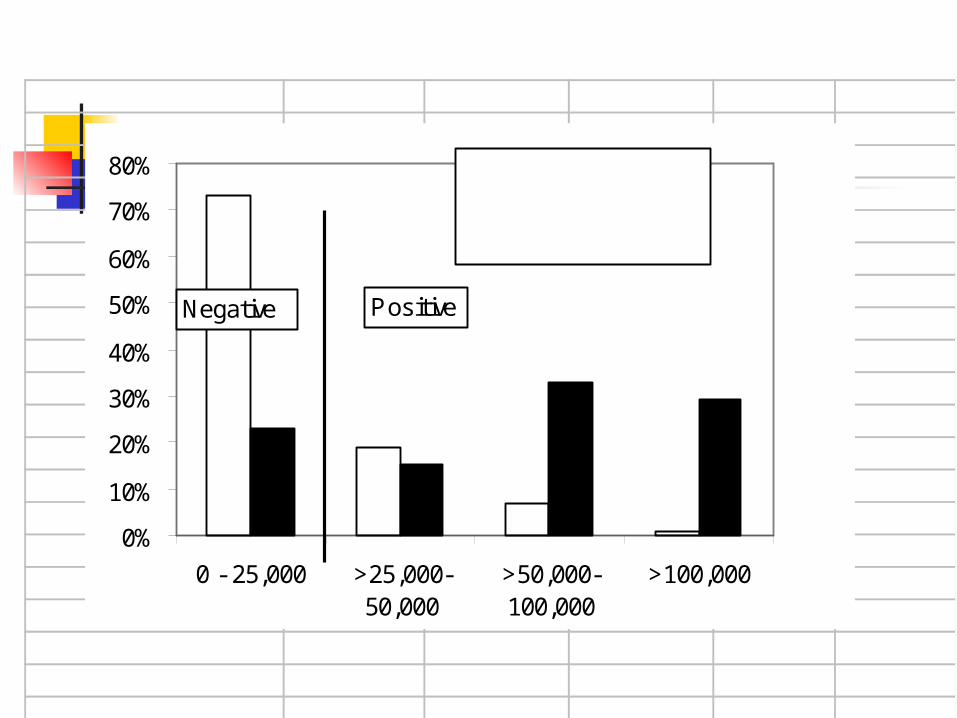
>100,000 29% 1%>50,000-100,000 33% 7%
>25,000-50,000 15% 19%
0 - 25,000 23% 73%
TOTAL 100% 100%

0%
10%
20%
30%
40%
50%
60%
70%
80%
0 - 25,000 >25,000-50,000
>50,000-100,000
>100,000
No Septic Arthritis
Septic Arthritis
Synovial Fluid WBC Count
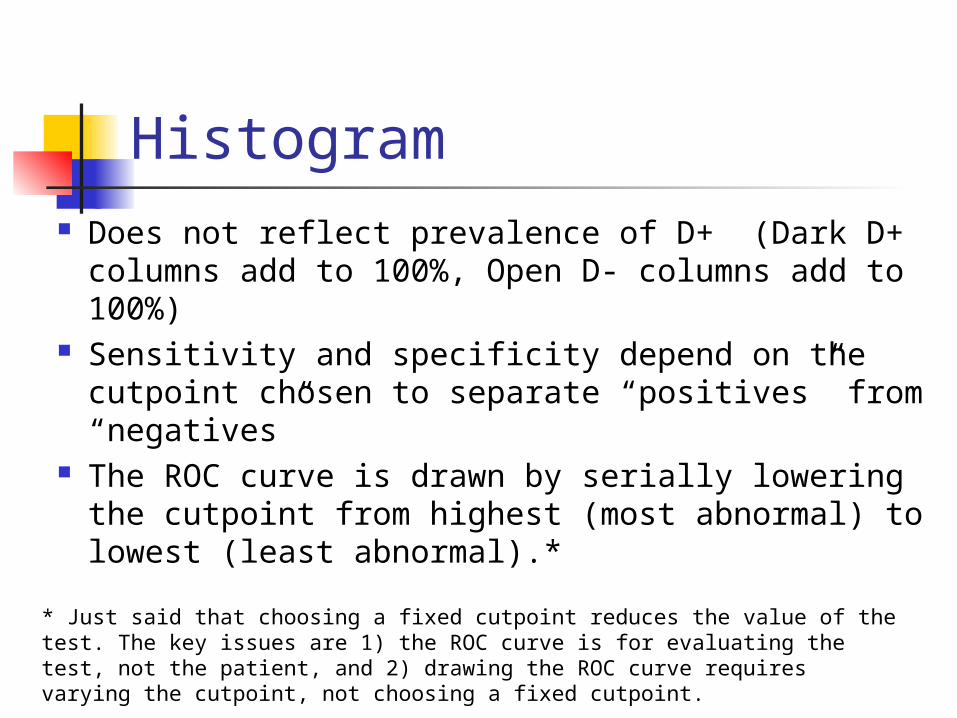
Histogram Does not reflect prevalence of D+ (Dark D+
columns add to 100%, Open D- columns add to 100%)
Sensitivity and specificity depend on the cutpoint chosen to separate “positives” from “negatives”
The ROC curve is drawn by serially lowering the cutpoint from highest (most abnormal) to lowest (least abnormal).*
* Just said that choosing a fixed cutpoint reduces the value of the test. The key issues are 1) the ROC curve is for evaluating the test, not the patient, and 2) drawing the ROC curve requires varying the cutpoint, not choosing a fixed cutpoint.

0%
10%
20%
30%
40%
50%
60%
70%
80%
0 - 25,000 >25,000-50,000
>50,000-100,000
>100,000
Negative Positive
Cutoff = ∞Sensitivity = 0%1 - Specificity = 0%

0%
10%
20%
30%
40%
50%
60%
70%
80%
0 - 25,000 >25,000-50,000
>50,000-100,000
>100,000
Negative Positive
Cutoff = 100,000Sensitivity = 29%1 - Specificity = 1%

0%
10%
20%
30%
40%
50%
60%
70%
80%
0 - 25,000 >25,000-50,000
>50,000-100,000
>100,000
Negative Positive
Cutoff = 50,000Sensitivity = 62%1 - Specificity = 8%
0%
10%
20%
30%
40%
50%
60%
70%
80%
0 - 25,000 >25,000-50,000
>50,000-100,000
>100,000
Negative Positive
Cutoff = 25,000Sensitivity = 77%1 - Specificity = 27%

0%
10%
20%
30%
40%
50%
60%
70%
80%
0 - 25,000 >25,000-50,000
>50,000-100,000
>100,000
Negative Positive
Cutoff = 0Sensitivity = 100%1 - Specificity = 100%

WBC Count (x1000/uL)
Sensitivity
1 - Specificity
> ∞ 0% 0%
> 100 29% 1%
> 50 62% 8%
> 25 77% 27%
≥ 0 100% 100%
Margaretten, M. E., J. Kohlwes, et al. (2007). Jama 297(13): 1478-88.

0%
10%
20%
30%
40%
50%
60%
70%
80%
90%
100%
0% 10% 20% 30% 40% 50% 60% 70% 80% 90% 100%
1 - Specificity
Sen
sitiv
ity
Cutoff > ∞
Cutoff > 100k
Cutoff > 50k
Cutoff > 25k
Cutoff ≥ 0
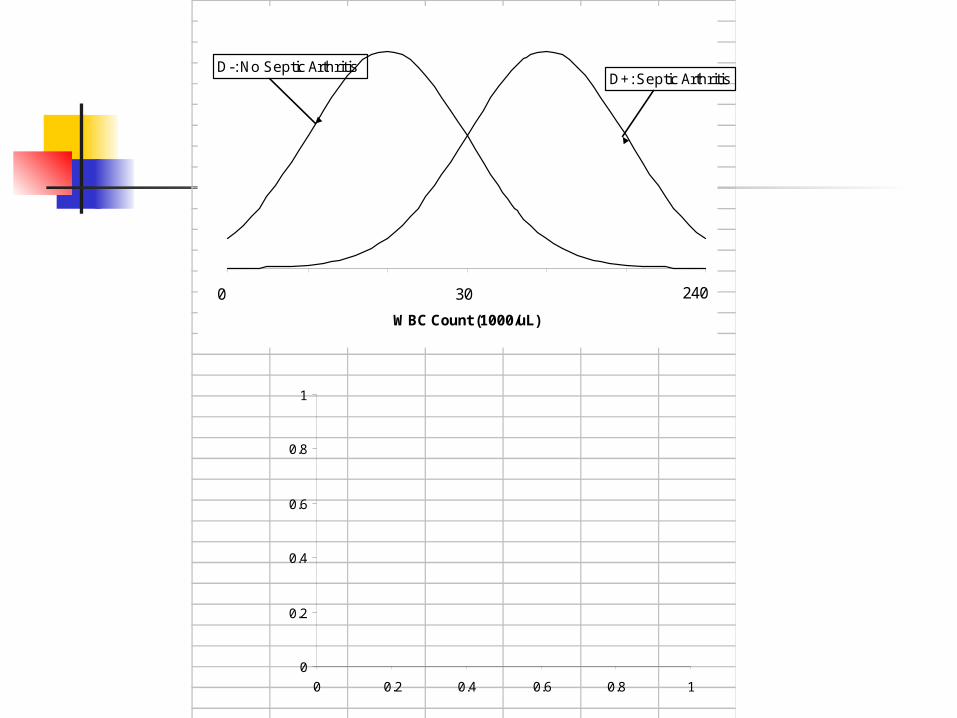
0 5 10 15 20 25 30
WBC Count (1000/uL)
D-: No Septic ArthritisD+: Septic Arthritis
30 2400
0
0.2
0.4
0.6
0.8
1
0 0.2 0.4 0.6 0.8 1

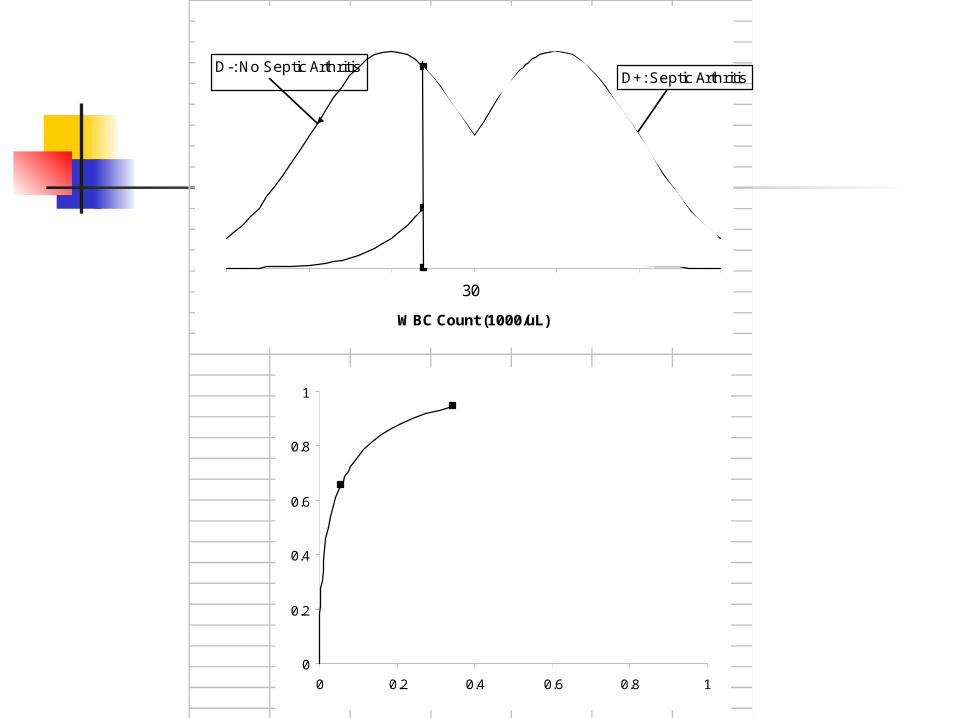
0 5 10 15 20 25 30
WBC Count (1000/uL)
D-: No Septic ArthritisD+: Septic Arthritis
30 2400
0
0.2
0.4
0.6
0.8
1
0 0.2 0.4 0.6 0.8 1
0 5 10 15 20 25 30
WBC Count (1000/uL)
D-: No Septic ArthritisD+: Septic Arthritis
0
0.2
0.4
0.6
0.8
1
0 0.2 0.4 0.6 0.8 1
30 2400

0 5 10 15 20 25 30
WBC Count (1000/uL)
D-: No Septic ArthritisD+:Septic Arthritis
0
0.2
0.4
0.6
0.8
1
0 0.2 0.4 0.6 0.8 1
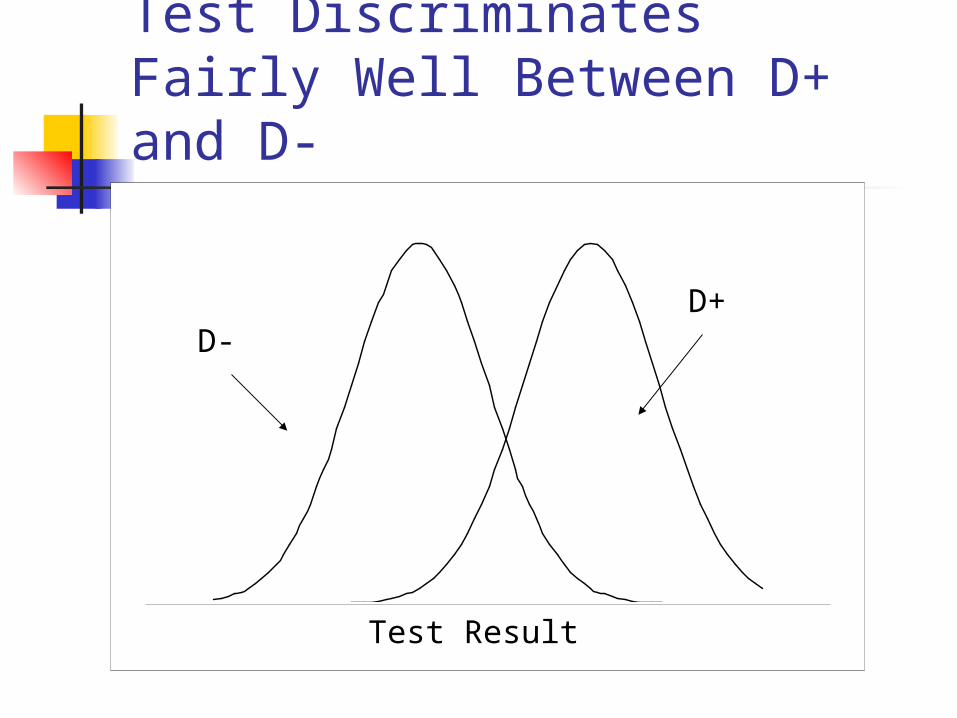
Test Discriminates Fairly Well Between D+ and D-
-40 -20 0 20 40 60Test Result
D-D+

Test Discriminates Well Between D+ and D-
0
0.2
0.4
0.6
0.8
1
0 0.2 0.4 0.6 0.8 1
1 - Specificity
Se
ns
itiv
ity

Test Discriminates Poorly Between D+ and D-
-40 -20 0 20 40 60Test Result
D-D+

Test Discriminates Poorly Between D+ and D-
0
0.2
0.4
0.6
0.8
1
0 0.2 0.4 0.6 0.8 1
1 - Specificity
Se
ns
itiv
ity

0%
10%
20%
30%
40%
50%
60%
70%
80%
90%
100%
0% 10% 20% 30% 40% 50% 60% 70% 80% 90% 100%
1 - Specificity
Sen
sitiv
ity
Cutoff > ∞
Cutoff > 100k
Cutoff > 50k
Cutoff > 25k
Cutoff ≥ 0
Area Under Curve = 0.8114
Area Under ROC Curve
Area Under ROC Curve
Summary measure of test’s discriminatory ability
Probability that a randomly chosen D+ individual will have a more positive test result than a randomly chosen D- individual

Area Under ROC Curve
Corresponds to the Mann-Whitney U Test Statistic (= Wilcoxon Rank Sum), which is the non-parametric equivalent of Student’s t test.
Also corresponds to the “c statistic” reported in logistic regression models

Main Point 2ROC Curve Describes the Test,
Not the Patient
Describes the test’s ability to discriminate between D+ and D- individuals
Not particularly useful in interpreting a test result for a given patient

ROC Curve Describes the Test, Not the Patient
Clinical Scenario
Synovial WBC count = 48,000
Synovial WBC count = 128,000

Synovial WBC count = 48,000

0%
10%
20%
30%
40%
50%
60%
70%
80%
90%
100%
0% 10% 20% 30% 40% 50% 60% 70% 80% 90% 100%
1 - Specificity
Sen
sitiv
ity
Cutoff > ∞
Cutoff > 100k
Cutoff > 50k
Cutoff > 25k
Cutoff ≥ 0
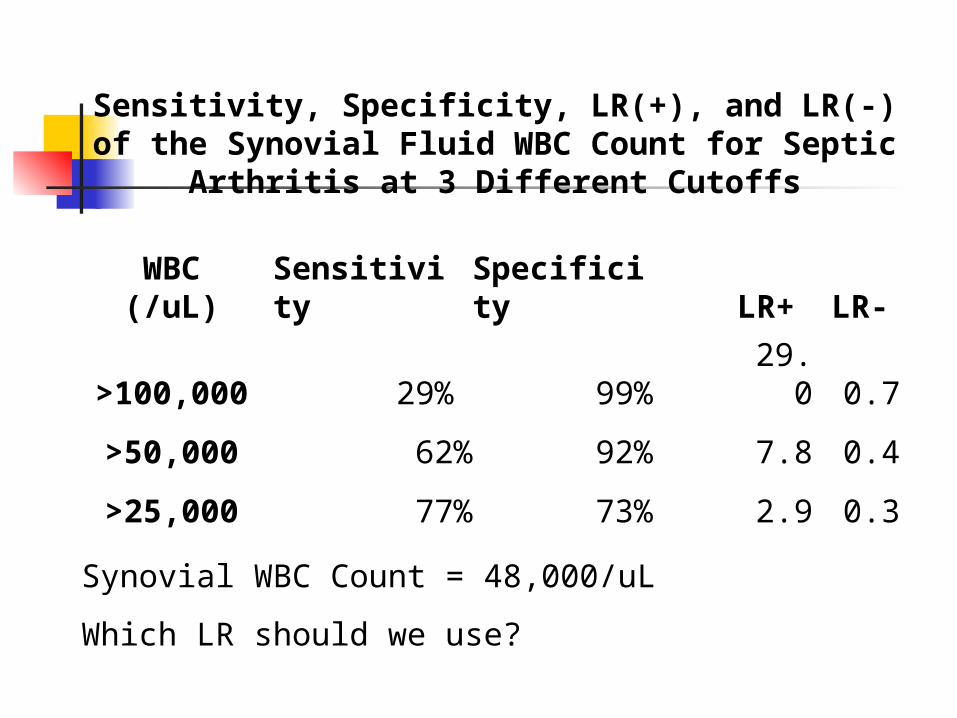
Sensitivity, Specificity, LR(+), and LR(-) of the Synovial Fluid WBC Count for Septic
Arthritis at 3 Different Cutoffs
WBC (/uL)
Sensitivity
Specificity LR+ LR-
>100,000 29% 99% 29.0 0.7
>50,000 62% 92% 7.8 0.4
>25,000 77% 73% 2.9 0.3
Synovial WBC Count = 48,000/uL
Which LR should we use?
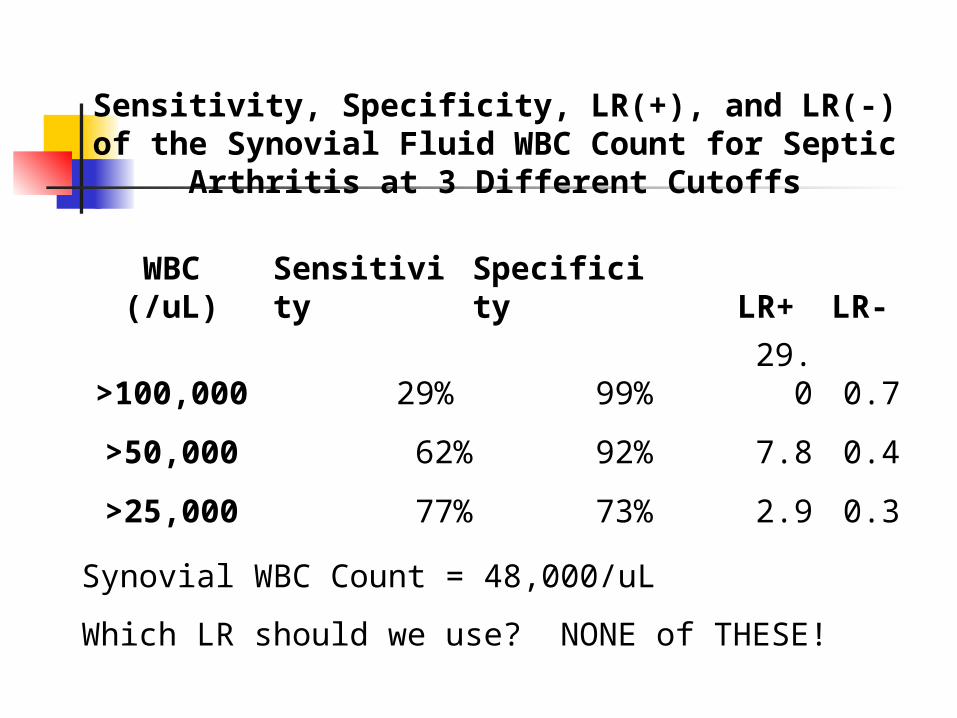
Sensitivity, Specificity, LR(+), and LR(-) of the Synovial Fluid WBC Count for Septic
Arthritis at 3 Different Cutoffs
WBC (/uL)
Sensitivity
Specificity LR+ LR-
>100,000 29% 99% 29.0 0.7
>50,000 62% 92% 7.8 0.4
>25,000 77% 73% 2.9 0.3
Synovial WBC Count = 48,000/uL
Which LR should we use? NONE of THESE!

Likelihood Ratios
LR(+) = Sensitivity/(1 – Specificity) = P(+|D+)/P(+|D-)
LR(-) = (1 – Sensitivity)/Specificity
= P(-|D+)/P(-|D-)

Likelihood Ratios
LR(result) = P(result|D+)/P(result|D-)
P(Result) in patient WITH disease----------------------------------------------------P(Result) in patients WITHOUT disease

WOWO
With Over WithOut

0%
10%
20%
30%
40%
50%
60%
70%
80%
0 - 25,000 >25,000-50,000
>50,000-100,000
>100,000
No Septic Arthritis
Septic Arthritis
Likelihood RatiosThe ratio of the height of the D+ distribution to the height of the D- distribution
15%19%
LR = 15%/19% = 0.8

0%
10%
20%
30%
40%
50%
60%
70%
80%
90%
100%
0% 10% 20% 30% 40% 50% 60% 70% 80% 90% 100%
1 - Specificity
Sen
sitiv
ity
> 50k
> 25k
15%
19%Slope = 15%/19% =0.8
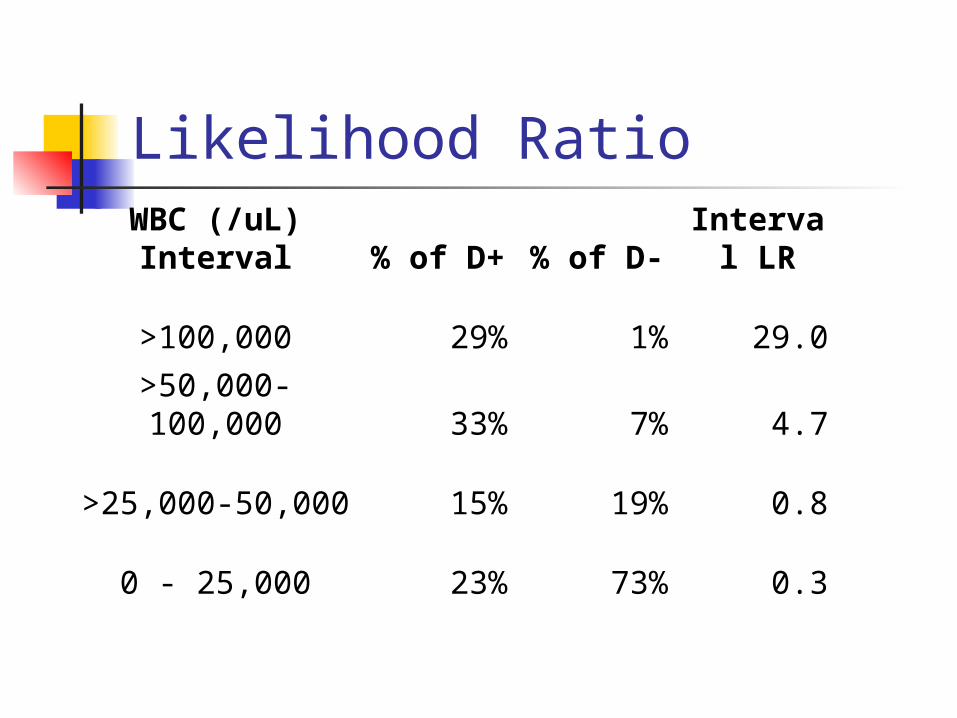
Likelihood RatioWBC (/uL) Interval
% of D+ % of D-
Interval LR
>100,000 29% 1% 29.0
>50,000-100,000 33% 7% 4.7
>25,000-50,000 15% 19% 0.8
0 - 25,000 23% 73% 0.3

Common Mistake
When given an “ROC Table,” it is tempting to calculate an LR(+) or LR(-) as if the test were “dichotomized” at a particular cutoff.
Example: LR(+,25,000) = 77%/27% = 2.9This is NOT the LR of a particular result
(e.g. WBC >25,000 and ≤ 50,000); it is the LR(+) if you divide “+” from “-” at 25,000.

WBC (/uL)
Sensitivity
Specificity LR+ LR-
>100,000 29% 99% 29.0 0.7
>50,000 62% 92% 7.8 0.4
>25,000 77% 73% 2.9 0.3
Common Mistake

0%
10%
20%
30%
40%
50%
60%
70%
80%
90%
100%
0% 10% 20% 30% 40% 50% 60% 70% 80% 90% 100%
1 - Specificity
Sen
sit
ivit
y
Slope = 77%/27% = 2.9
Slope = 0.8
27%
77%
> 25,000
Common Mistake

Common Mistake
From JAMA paper:“Her synovial WBC count of 48,000/µL
increases the probability from 38% to 64%.” (Used LR = 2.9)
Correct calculation:Her synovial WBC count of 48,000/µL
decreases the probability from 38% to 33%.” (Used LR = 0.8)

Main Point 3 Likelihood Ratio
P(Result) in patients WITH disease------------------------------------------------------P(Result) in patients WITHOUT disease
Slope of ROC Curve
Do not calculate an LR(+) or LR(-) for a multilevel test.
NOTE
Do not calculate an LR(+) or LR(-) for a test with more than two possible results.

Clinical ScenarioSynovial WBC = 48,000/uL*
Pre-test prob: 0.38Pre-test odds: 0.38/0.62 = 0.61LR(WBC btw 25,000 and 50,000) = 0.8Post-Test Odds = Pre-Test Odds x LR(48)
= 0.61 x 0.8 = 0.49Post-Test prob = 0.49/(0.49+1) = 0.33
*Can use slide rule, Excel, or web page

Clinical ScenarioSynovial WBC = 128,000/uL*
Pre-test prob: 0.38Pre-test odds: 0.38/0.62 = 0.61LR(128,000/uL) = 29Post-Test Odds = Pre-Test Odds x
LR(128)= 0.61 x 29 = 17.8
Post-Test prob = 17.8/(17.8+1) = 0.95
*Can use slide rule, Excel, or web page

Clinical Scenario
WBC = 48,000/uL Post-Test Prob = 0.33WBC = 128,000/uL Post-Test Prob = 0.95
(Recall that dichotomizing the WBC with a fixed cutpoint of 25,000/uL meant that WBC = 48,000/uL would be treated the same as WBC = 128,000/uL and post-test prob = 0.64)
Main Point 4Bayes’s Rule
Pre-Test Odds x LR(result) = Post-Test Odds
What you knew before + What you learned = What you know now
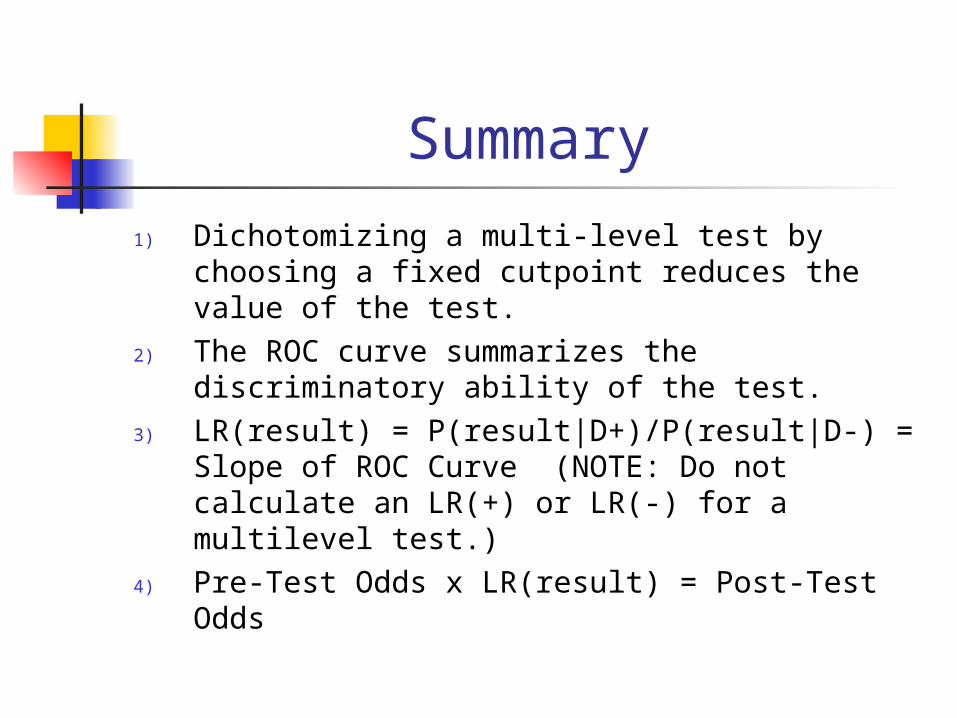
Summary
1) Dichotomizing a multi-level test by choosing a fixed cutpoint reduces the value of the test.
2) The ROC curve summarizes the discriminatory ability of the test.
3) LR(result) = P(result|D+)/P(result|D-) = Slope of ROC Curve (NOTE: Do not calculate an LR(+) or LR(-) for a multilevel test.)
4) Pre-Test Odds x LR(result) = Post-Test Odds

Conforms to Clinical Intuition

Synovial WBC for Septic Arthritis
WBC < 2000 very reassuring WBC 2000 – 25,000 somewhat
reassuringWBC 25,000 – 50,000 indeterminateWBC 50,000 – 100,000 worrisomeWBC > 100,000 very worrisome

Peripheral WBC Count for Bacteremia in Febrile Infant
Bacteremia No Bacteremia
WBC Number % Number % LR
<5 8 21% 201 5% 3.95
5-15 13 34% 2727 72% 0.47
≥15 17 45% 844 22% 2.00
≥20 9 24% 255 7%3.50 [& 0.82]
Total 38 3772
“Interval” LRs as reported in the paper (Ann Emerg Med 42:216-225)
What if WBC count is 18? Which LR should you use? LR = 2.0 because 18 ≥ 15, or LR = 0.82 because 18 < 20?

Peripheral WBC Count for Bacteremia in Febrile Infant
Actual Interval LRs
What if WBC count is 18? Which LR should you use? LR = 1.35.
Bacteremia No Bacteremia
WBC Number % Number % LR
<5 8 21% 201 5% 3.95
5-15 13 34% 2727 72% 0.47
15-20 8 21% 589 16% 1.35
> 20 9 24% 255 7% 3.50
38 3772
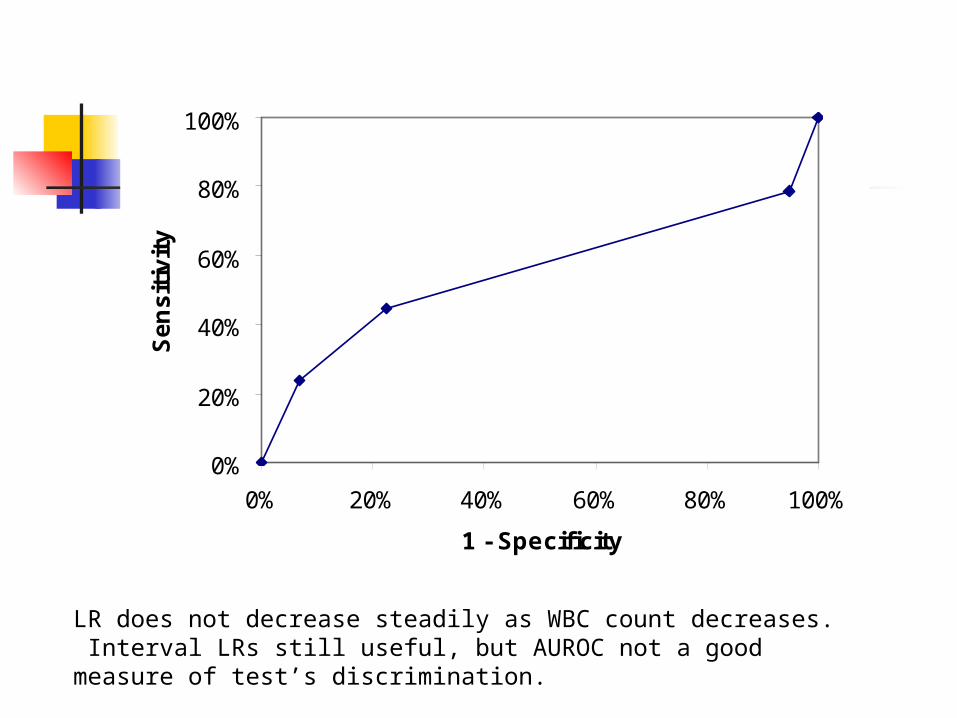
0%
20%
40%
60%
80%
100%
0% 20% 40% 60% 80% 100%
1 - Specificity
Se
ns
itiv
ity
>20
> 15
> 5
LR does not decrease steadily as WBC count decreases. Interval LRs still useful, but AUROC not a good measure of test’s discrimination.

Peripheral WBC Count for Bacteremia in Febrile Infant < 3 Months Old
< 5 Very concerning5 – 15 Slightly reassuring16 – 20 Slightly concerning> 20 Concerning

Additional Topics
Optimal Cutoffs Walking Man C Statistic

#Wang, C. S., J. M. FitzGerald, et al. (2005). "Does this dyspneic patient in the emergency department have congestive heart failure?" JAMA 294(15): 1944-56.
Refers to:Maisel, A. S., P. Krishnaswamy, et al. (2002). "Rapid
measurement of B-type natriuretic peptide in the emergency diagnosis of heart failure." N Engl J Med 347(3): 161-7.
Optimal Cutoffs
BNP to distinguish between COPD exacerbation and CHF in the ED patient with dyspnea

Optimal Cutoffs
What is the single best cutoff to define a BNP as “positive” for CHF?

BNP, 500 pg/ml?
BNP, 1000 pg/ml ?

Optimal Cutpoints
Dichotomizing a continuous test by choosing a fixed cutoff reduces the value of the test.
And do NOT choose the point where the ROC curve is closest to the upper left hand corner.

Optimal Cutoffs
But, for a continuous variable, you do have to define intervals.
How do you choose your cutpoints to define the intervals?

BNP, 500 pg/ml?
BNP, 1000 pg/ml ?
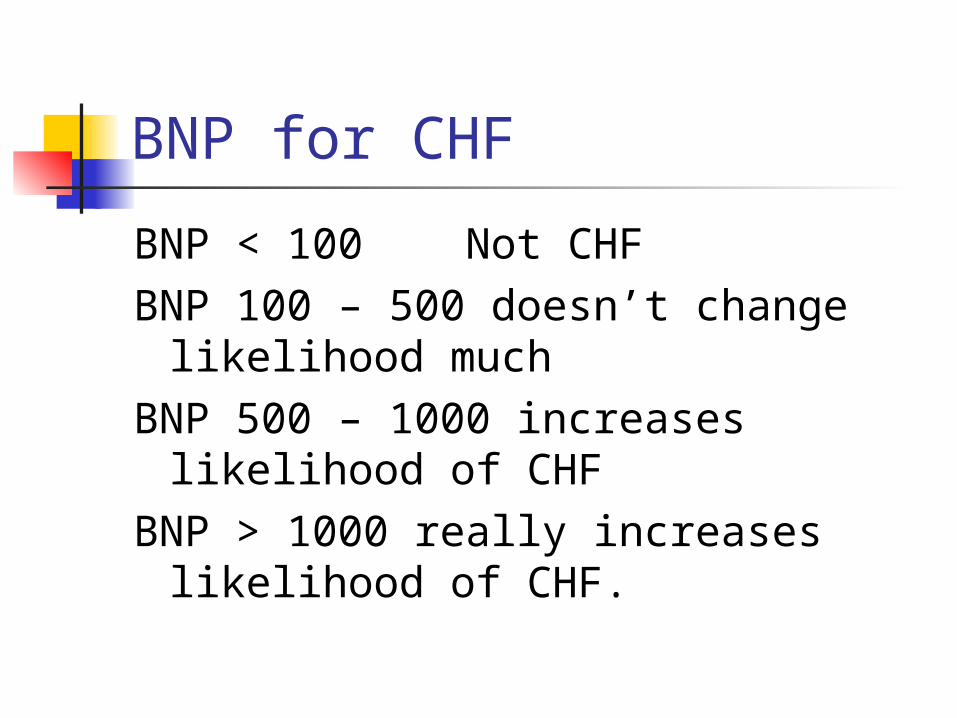
BNP for CHF
BNP < 100 Not CHFBNP 100 – 500 doesn’t change
likelihood muchBNP 500 – 1000 increases likelihood
of CHFBNP > 1000 really increases
likelihood of CHF.

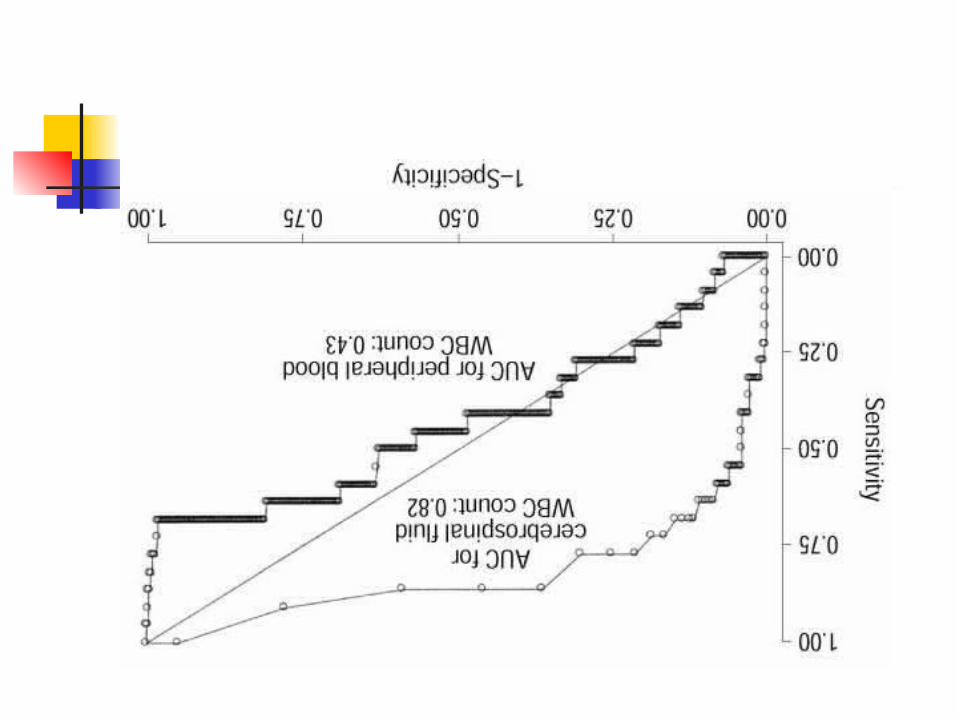
THE WALKING MAN OR …

… WHAT CAN YOU LEARN FROM ROC CURVES LIKE THESE?
Bonsu, B. K. and M. B. Harper (2003). "Utility of the peripheral blood white blood cell count for identifying sick young infants who need lumbar puncture." Ann Emerg Med 41(2): 206-14.

“Walking Man” Approach to ROC Curves
Divide vertical axis into d steps, where d is the number of D+ individuals
Divide horizontal axis into n steps, where n is the number of D- individuals
Sort individuals from most to least abnormal test result
Moving from the first individual (with the most abnormal test result) to the last (with the least abnormal test result)…

“Walking Man” (continued) …call out “D” if the individual is D+
and “N” if the individual is D- Let the walking man know when you
reach a new value of the test The walking man takes a step up
every time he hears “D” and a step to the right every time he hears “N”
When you reach a new value of the test, he drops a stone.
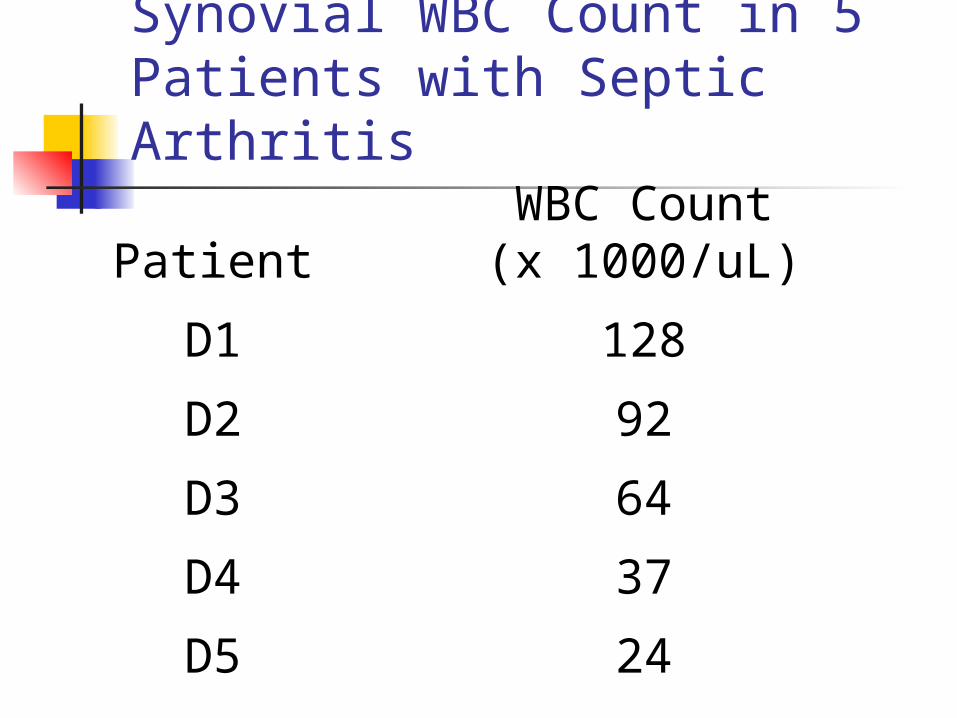
Synovial WBC Count in 5 Patients with Septic Arthritis
PatientWBC Count(x 1000/uL)
D1 128
D2 92
D3 64
D4 37
D5 24

Synovial WBC Count in 10 Patients Without Septic Arthritis
Patient WBC Count (x 1000)
N1 71
N2 48
N3 37
N4 23
N5 12
N6 12
N7 8
N8 7
N9 6
N10 0

Septic Arthritis No Septic Arthritis
128
92
71
64
48
37 37
24
23
12
12
8
7
6
0

DDNDN(DN)DN(NN)NNNN

0
1
2
3
4
5
0 1 2 3 4 5 6 7 8 9 10
D-
D+

0
1
2
3
4
5
0 1 2 3 4 5 6 7 8 9 10
D-
D+

… WHAT CAN YOU LEARN FROM ROC CURVES LIKE THESE?

Calculating the c Statistic
The c statistic for the area under an ROC curve is calculated using the same information as the Wilcoxon Rank Sum statistic (or Mann-Whitney U, which is equivalent) and gives identical P values.
Non-parametric equivalent of the t test statistic comparing two means.
In the “walking man” approach to tracing out the ROC curve, the actual values of the test are not important for the shape of the ROC curve or the area under it--only the ranking of the values.

Septic Arthritis No Septic Arthritis
128
92
71
64
48
37 37
24
23
12
12
8
7
6
0

0
1
2
3
4
5
0 1 2 3 4 5 6 7 8 9 10
D-
D+
Boxes under Curve = 43.5
Total Boxes = 50
Area Under Curve = 43.5/50 = 0.87
BACTEREMIA NO BACTEREMIA
1
2
3
4
5
6.5 6.5
8
9
10.5
10.5
12
13
14
15
S = 21.5
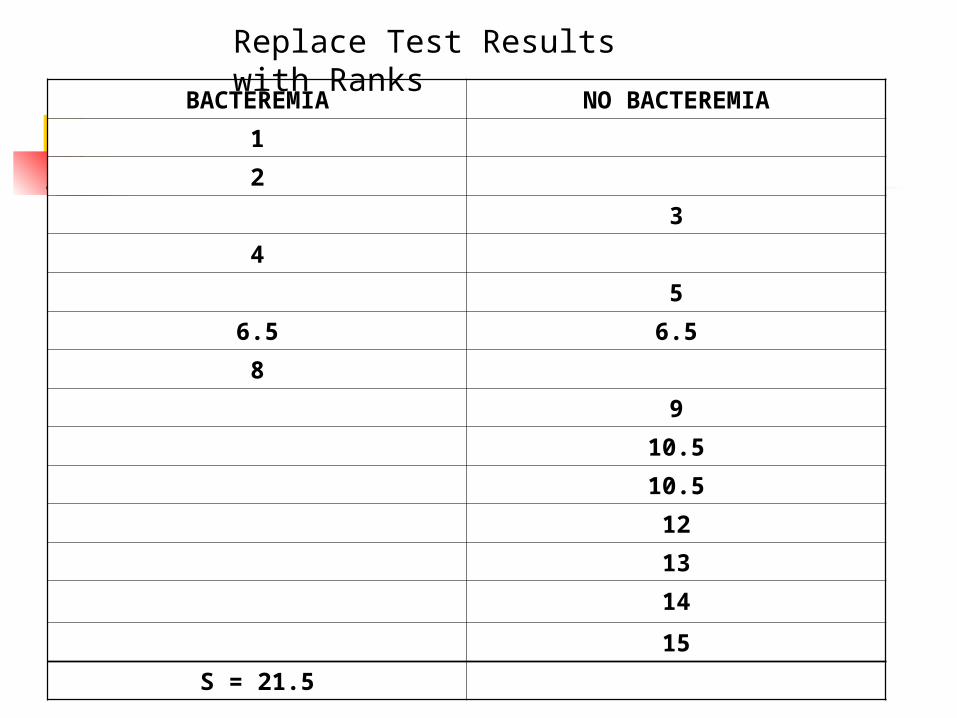
Replace Test Results with Ranks

S = 21.5Smin = d(d+1)/2 = 5(6)/2 = 15Smax = dn + Smin = 5(10) + 15 = 65
C = (Smax – S) / (Smax – Smin)* = (65 – 21.5) / (65 – 15) = 43.5/50 = 0.87
* Smax – Smin = dn
Calculating the C Statistic