Multilevel Tests (Michael) Likelihood ratios for results other than “+” or “-” Evidence Based Diagnosis Michael A. Kohn, MD MPP 6/28/2012

Welcome message from author
This document is posted to help you gain knowledge. Please leave a comment to let me know what you think about it! Share it to your friends and learn new things together.
Transcript

Multilevel Tests (Michael)
Likelihood ratios for results other than “+” or “-”
Evidence Based DiagnosisMichael A. Kohn, MD MPP
6/28/2012
Four Main Points1) Dichotomizing a multi-level test by
choosing a fixed cutpoint reduces the value of the test.
2) The ROC curve summarizes the ability of the test to differentiate between D+ and D- individuals.
3) LR(result) = P(result|D+)/P(result|D-) = slope of ROC curve.
(NOTE: Do not calculate an LR(+) or LR(-) for a multilevel test.)
4) Pre-Test Odds x LR(result) = Post-Test Odds

Septic ArthritisBacterial infection in a joint.

Clinical ScenarioDoes this Adult Patient Have Septic Arthritis?

Clinical ScenarioDoes this Adult Patient Have Septic Arthritis?
A 48-year-old woman … presents to the emergency department with a 2-day history of a red, swollen right knee that is painful to touch. She reports no prior knee swelling and no recent trauma or knee surgery …. [S]he is afebrile and has a right knee effusion. Her peripheral white blood cell (WBC) count is 11 000/µL and her erythrocyte sedimentation rate (ESR) is 55 mm/h. An arthrocentesis is performed, and the initial Gram stain is negative.
Margaretten, M. E., J. Kohlwes, et al. (2007). Jama 297(13): 1478-88.
You have the synovial white blood cell (WBC) count.

Clinical ScenarioDoes this Adult Patient Have Septic Arthritis?
Assume pre-test probability of septic arthritis is 0.38.
How do you use the synovial WBC result to determine the likelihood of septic arthritis?
Margaretten, M. E., J. Kohlwes, et al. (2007). Jama 297(13): 1478-88.

Why Not Make It a Dichotomous Test?
Synovial Septic ArthritisWBC Count Yes No
>25,000 77% 27%
≤ 25,000 23% 73%
TOTAL* 100% 100%*Note that these could have come from a study where the patients with septic arthritis (D+ patients) were sampled separately from those without (D- patients).
Margaretten, M. E., J. Kohlwes, et al. (2007). Jama 297(13): 1478-88.

Why Not Make It a Dichotomous Test?
Sensitivity = 77%Specificity = 73%
LR(+) = 0.77/(1 - 0.73) = 2.9LR(-) = (1 - 0.77)/0.73 = 0.32
“+” = > 25,000/uL “-” = ≤ 25,000/uL

Clinical ScenarioSynovial WBC = 48,000/mL
Pre-test prob: 0.38Pre-test odds: 0.38/0.62 = 0.61LR(+) = 2.9Post-Test Odds = Pre-Test Odds x
LR(+)= 0.61 x 2.9 = 1.75
Post-Test prob = 1.75/(1.75+1) = 0.64

Clinical Scenario Synovial WBC = 128,000/mL
Pre-test prob: 0.38 Pre-test odds: 0.38/0.62 = 0.61LR = 2.9 (same as for WBC=48,000!)Post-Test Odds = Pre-Test Odds x
LR(+)= 0.61 x 2.9 = 1.75
Post-Test prob = 1.75/(1.75+1) = .64

Why Not Make It a Dichotomous Test?
Because you lose information. The risk associated with a synovial WBC=48,000 is equated with the risk associated with WBC=128,000.
Choosing a fixed cutpoint to dichotomize a multi-level or continuous test throws away information and reduces the value of the test.

Main Point 1: Avoid Making Multilevel Tests Dichotomous
Dichotomizing a multi-level or continuous test by choosing a fixed cutpoint reduces the value of the test

WBC (/uL) Interval
% of Septic Arthritis
% of No Septic Arthritis
>100,000 29% 1%
50,001-100,000 33% 7%
25,001-50,000 15% 19%
0 - 25,000 23% 73%
TOTAL 100% 100%

0%
10%
20%
30%
40%
50%
60%
70%
80%
0 - 25,000 >25,000-50,000
>50,000-100,000
>100,000
No Septic Arthritis
Septic Arthritis
Synovial Fluid WBC Count

Histogram Does not reflect prevalence of D+ (Dark D+
columns add to 100%, Open D- columns add to 100%)
Sensitivity and specificity depend on the cutpoint chosen to separate “positives” from “negatives”
The ROC curve is drawn by serially lowering the cutpoint from highest (most abnormal) to lowest (least abnormal).*
* Just said that choosing a fixed cutpoint reduces the value of the test. The key issues are 1) the ROC curve is for evaluating the test, not the patient, and 2) drawing the ROC curve requires varying the cutpoint, not choosing a fixed cutpoint.

0%
10%
20%
30%
40%
50%
60%
70%
80%
0 - 25,000 >25,000-50,000
>50,000-100,000
>100,000
Negative Positive
Cutoff = ∞Sensitivity = 0%1 - Specificity = 0%

0%
10%
20%
30%
40%
50%
60%
70%
80%
0 - 25,000 >25,000-50,000
>50,000-100,000
>100,000
Negative Positive
Cutoff = 100,000Sensitivity = 29%1 - Specificity = 1%

0%
10%
20%
30%
40%
50%
60%
70%
80%
0 - 25,000 >25,000-50,000
>50,000-100,000
>100,000
Negative Positive
Cutoff = 50,000Sensitivity = 62%1 - Specificity = 8%

0%
10%
20%
30%
40%
50%
60%
70%
80%
0 - 25,000 >25,000-50,000
>50,000-100,000
>100,000
Negative Positive
Cutoff = 25,000Sensitivity = 77%1 - Specificity = 27%

0%
10%
20%
30%
40%
50%
60%
70%
80%
0 - 25,000 >25,000-50,000
>50,000-100,000
>100,000
Negative Positive
Cutoff = 0Sensitivity = 100%1 - Specificity = 100%

WBC Count (x1000/uL)
Sensitivity
1 - Specificity
> ∞ 0% 0%
> 100 29% 1%
> 50 62% 8%
> 25 77% 27%
≥ 0 100% 100%
Margaretten, M. E., J. Kohlwes, et al. (2007). Jama 297(13): 1478-88.

0%
10%
20%
30%
40%
50%
60%
70%
80%
90%
100%
0% 10% 20% 30% 40% 50% 60% 70% 80% 90% 100%
1 - Specificity
Sen
sitiv
ity
Cutoff > ∞
Cutoff > 100k
Cutoff > 50k
Cutoff > 25k
Cutoff ≥ 0
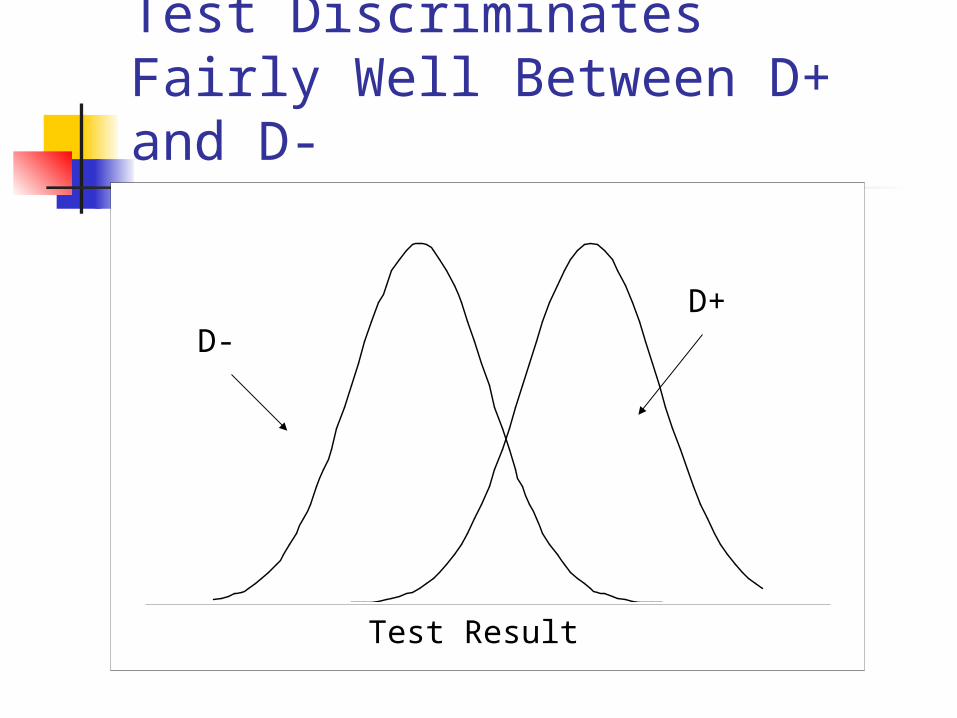
Test Discriminates Fairly Well Between D+ and D-
-40 -20 0 20 40 60Test Result
D-D+

Test Discriminates Well Between D+ and D-
0
0.2
0.4
0.6
0.8
1
0 0.2 0.4 0.6 0.8 1
1 - Specificity
Se
ns
itiv
ity

Test Discriminates Poorly Between D+ and D-
-40 -20 0 20 40 60Test Result
D-D+
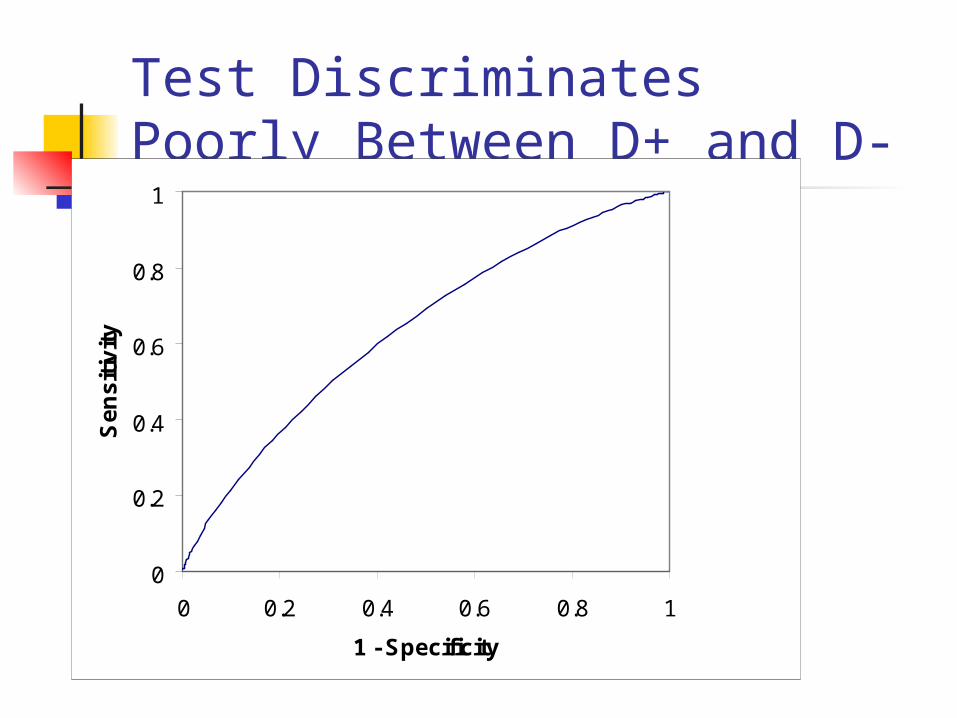
Test Discriminates Poorly Between D+ and D-
0
0.2
0.4
0.6
0.8
1
0 0.2 0.4 0.6 0.8 1
1 - Specificity
Se
ns
itiv
ity

0%
10%
20%
30%
40%
50%
60%
70%
80%
90%
100%
0% 10% 20% 30% 40% 50% 60% 70% 80% 90% 100%
1 - Specificity
Sen
sitiv
ity
Cutoff > ∞
Cutoff > 100k
Cutoff > 50k
Cutoff > 25k
Cutoff ≥ 0
Area Under Curve = 0.8114
Area Under ROC Curve

Area Under ROC Curve
Summary measure of test’s discriminatory ability
Probability that a randomly chosen D+ individual will have a more positive test result than a randomly chosen D- individual

Main Point 2ROC Curve Describes the Test,
Not the Patient
Describes the test’s ability to discriminate between D+ and D- individuals
Not particularly useful in interpreting a test result for a given patient

ROC Curve Describes the Test, Not the Patient
Clinical Scenario
Synovial WBC count = 48,000

0%
10%
20%
30%
40%
50%
60%
70%
80%
90%
100%
0% 10% 20% 30% 40% 50% 60% 70% 80% 90% 100%
1 - Specificity
Sen
sitiv
ity
Cutoff > ∞
Cutoff > 100k
Cutoff > 50k
Cutoff > 25k
Cutoff ≥ 0

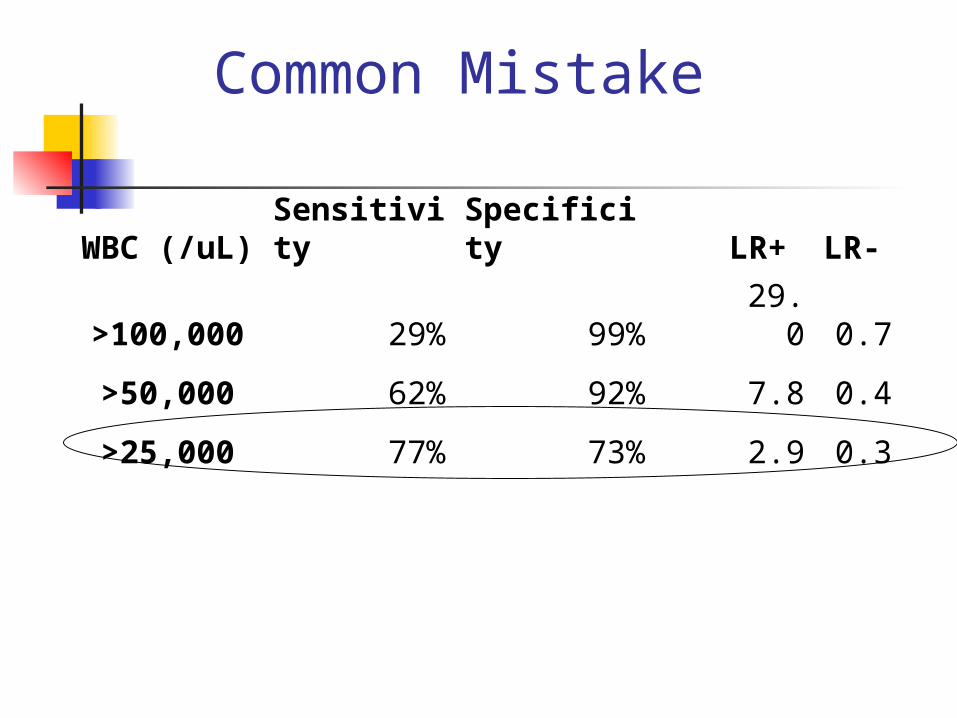
Sensitivity, Specificity, LR(+), and LR(-) of the Synovial Fluid WBC Count for Septic
Arthritis at 3 Different Cutoffs
WBC (/uL)
Sensitivity
Specificity LR+ LR-
>100,000 29% 99% 29.0 0.7
>50,000 62% 92% 7.8 0.4
>25,000 77% 73% 2.9 0.3
Synovial WBC Count = 48,000/uL
Which LR should we use?

Sensitivity, Specificity, LR(+), and LR(-) of the Synovial Fluid WBC Count for Septic
Arthritis at 3 Different Cutoffs
WBC (/uL)
Sensitivity
Specificity LR+ LR-
>100,000 29% 99% 29.0 0.7
>50,000 62% 92% 7.8 0.4
>25,000 77% 73% 2.9 0.3
Synovial WBC Count = 48,000/uL
Which LR should we use? NONE of THESE!

Likelihood Ratios
LR(result) = P(result|D+)/P(result|D-)
P(Result) in patient WITH disease----------------------------------------------------P(Result) in patients WITHOUT disease

WOWO
With Over WithOut

0%
10%
20%
30%
40%
50%
60%
70%
80%
0 - 25,000 >25,000-50,000
>50,000-100,000
>100,000
No Septic Arthritis
Septic Arthritis
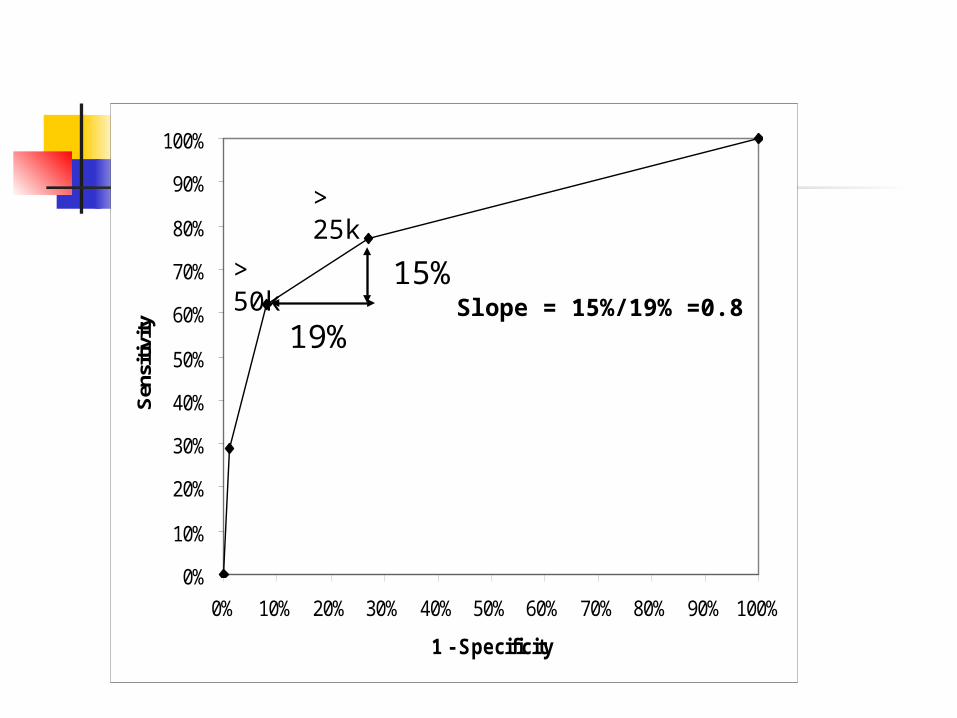
Interval Likelihood RatiosThe ratio of the height of the D+ distribution to the height of the D- distribution
15%19%
LR = 15%/19% = 0.8
0%
10%
20%
30%
40%
50%
60%
70%
80%
90%
100%
0% 10% 20% 30% 40% 50% 60% 70% 80% 90% 100%
1 - Specificity
Sen
sitiv
ity
> 50k
> 25k
15%
19%Slope = 15%/19% =0.8

Interval Likelihood RatioWBC (/uL) Interval
% of D+ % of D-
Interval LR
>100,000 29% 1% 29.0
50,001-100,000 33% 7% 4.7
25,001-50,000 15% 19% 0.8
0 - 25,000 23% 73% 0.3
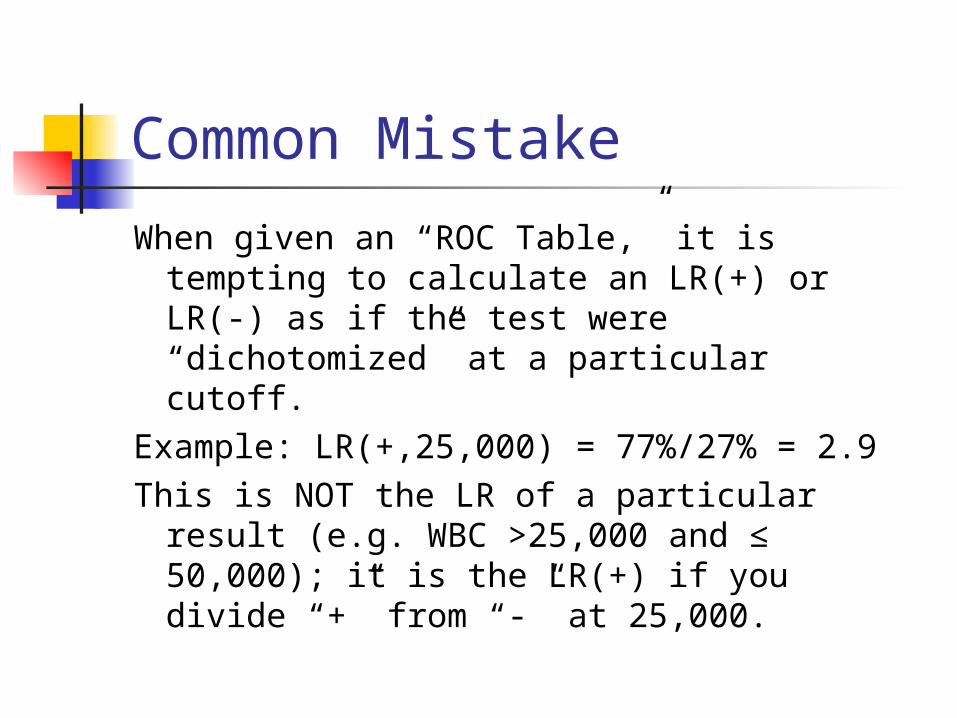
Common Mistake
When given an “ROC Table,” it is tempting to calculate an LR(+) or LR(-) as if the test were “dichotomized” at a particular cutoff.
Example: LR(+,25,000) = 77%/27% = 2.9This is NOT the LR of a particular result
(e.g. WBC >25,000 and ≤ 50,000); it is the LR(+) if you divide “+” from “-” at 25,000.
WBC (/uL)
Sensitivity
Specificity LR+ LR-
>100,000 29% 99% 29.0 0.7
>50,000 62% 92% 7.8 0.4
>25,000 77% 73% 2.9 0.3
Common Mistake

0%
10%
20%
30%
40%
50%
60%
70%
80%
90%
100%
0% 10% 20% 30% 40% 50% 60% 70% 80% 90% 100%
1 - Specificity
Sen
sit
ivit
y
Slope = 77%/27% = 2.9
Slope = 0.8
27%
77%
> 25,000
Common Mistake
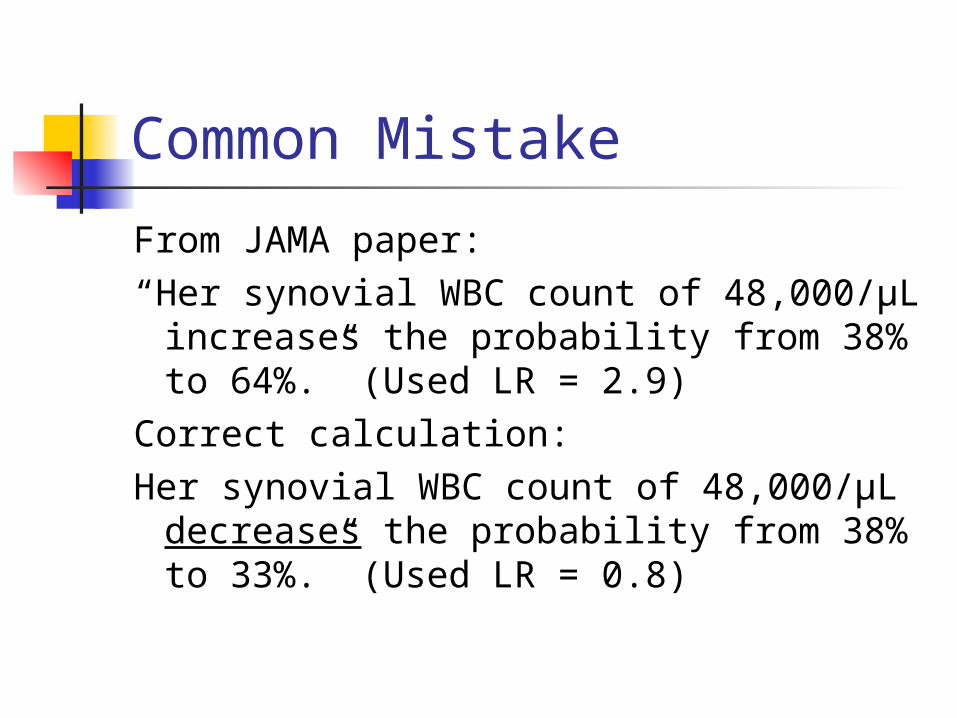
Common Mistake
From JAMA paper:“Her synovial WBC count of 48,000/µL
increases the probability from 38% to 64%.” (Used LR = 2.9)
Correct calculation:Her synovial WBC count of 48,000/µL
decreases the probability from 38% to 33%.” (Used LR = 0.8)

Main Point 3 Likelihood Ratio
P(Result) in patients WITH disease------------------------------------------------------P(Result) in patients WITHOUT disease
Slope of ROC Curve
Do not calculate an LR(+) or LR(-) for a multilevel test.

Clinical ScenarioSynovial WBC = 48,000/uL*
Pre-test prob: 0.38Pre-test odds: 0.38/0.62 = 0.61LR(WBC btw 25,000 and 50,000) = 0.8Post-Test Odds = Pre-Test Odds x LR(48)
= 0.61 x 0.8 = 0.49Post-Test prob = 0.49/(0.49+1) = 0.33
*Can use slide rule, Excel, or web page

Clinical ScenarioSynovial WBC = 128,000/uL*
Pre-test prob: 0.38Pre-test odds: 0.38/0.62 = 0.61LR(128,000/uL) = 29Post-Test Odds = Pre-Test Odds x
LR(128)= 0.61 x 29 = 17.8
Post-Test prob = 17.8/(17.8+1) = 0.95
*Can use slide rule, Excel, or web page

Clinical Scenario
WBC = 48,000/uL Post-Test Prob = 0.33WBC = 128,000/uL Post-Test Prob = 0.95
(Recall that dichotomizing the WBC with a fixed cutpoint of 25,000/uL meant that WBC = 48,000/uL would be treated the same as WBC = 128,000/uL and post-test prob = 0.64)
Main Point 4Bayes’s Rule
Pre-Test Odds x LR(result) = Post-Test Odds
What you knew before + What you learned = What you know now

Summary
1) Dichotomizing a multi-level test by choosing a fixed cutpoint reduces the value of the test.
2) The ROC curve summarizes the discriminatory ability of the test.
3) LR(result) = P(result|D+)/P(result|D-) = Slope of ROC Curve (NOTE: Do not calculate an LR(+) or LR(-) for a multilevel test.)
4) Pre-Test Odds x LR(result) = Post-Test Odds

Funny Times: 1-888-Funnytimes x 2111

Getting the most out of ROC Curves
THE WALKING MAN OR …
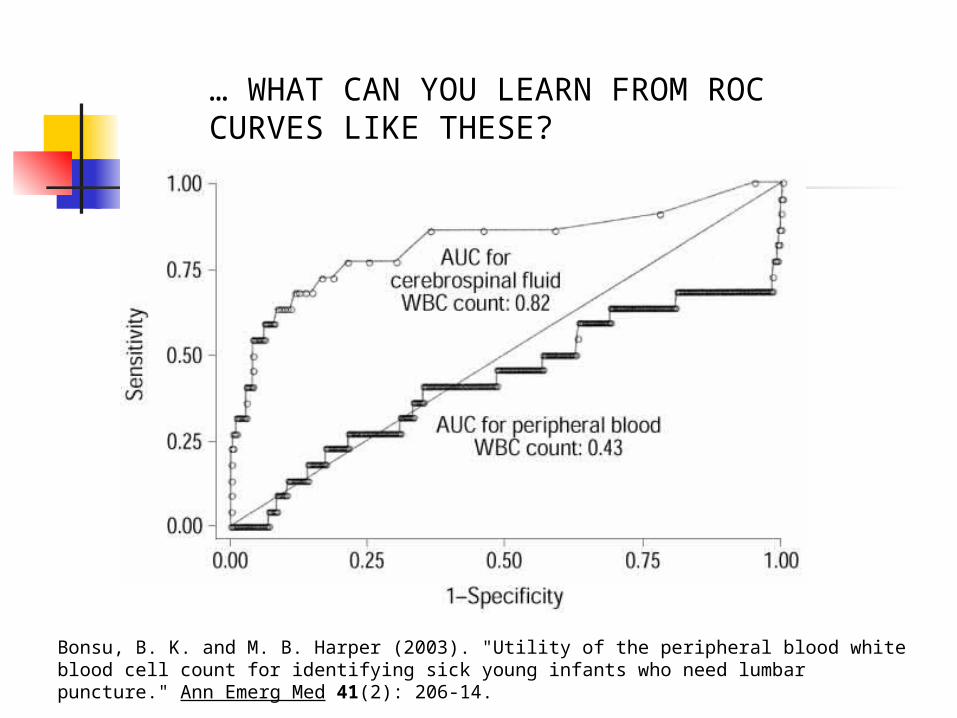
… WHAT CAN YOU LEARN FROM ROC CURVES LIKE THESE?
Bonsu, B. K. and M. B. Harper (2003). "Utility of the peripheral blood white blood cell count for identifying sick young infants who need lumbar puncture." Ann Emerg Med 41(2): 206-14.

“Walking Man” Approach to ROC Curves
Divide vertical axis into d steps, where d is the number of D+ individuals
Divide horizontal axis into n steps, where n is the number of D- individuals
Sort individuals from most to least abnormal test result
Moving from the first individual (with the most abnormal test result) to the last (with the least abnormal test result)…

“Walking Man” (continued) …call out “D” if the individual is D+ and
“N” if the individual is D- Let the walking man know when you
reach a new value of the test The walking man takes a step up every
time he hears “D” and a step to the right every time he hears “N”
When you reach a new value of the test, he drops a stone.

… WHAT CAN YOU LEARN FROM ROC CURVES LIKE THESE (Diagnosing meningitis in infants from WBC counts)?*
*Bonsu BK, Harper MB. Ann Emerg Med 2003;41:206-14

Calculating the c Statistic
C= (Smax – S)/(Smax – Smin) where Smin = d(d+1)/2 and Smax = Smin+dn
Actual values of the test are not important for the shape of the ROC curve or the area under it--only the ranking of the values
Area under an ROC (“C statistic”) curve uses the same information as the Wilcoxon Rank Sum (or Mann-Whitney U) and gives identical P values.

Illustration: shorter stature as a test for female gender identification
Class arranges itself in order of height (shortest person at the head of the line)
Make a grid on flip chart, Y axis has F steps, X axis has M steps
Class draws ROC curve: F draw a vertical line segment M draw horizontal line segment Tied height: diagonal line segment

11:15-11:30 Break11:30-1:00 Small
Groups1:00-2:00 Lunch
Related Documents