ASHMORE REEF NATIONAL NATURE RESERVE AND CARTIER ISLAND MARINE RESERVE
MARINE SURVEY 2009
Zoe Richards, Maria Beger, Jean-Paul Hobbs, Tom Bowling,
Karen Chong-Seng and Morgan Pratchett*
FINAL REPORT – November 10th, 2009
Produced for Department of the Environment, Water Heritage & the Arts
*Corresponding author – Dr Morgan Pratchett, ARC Centre of Excellence for Coral Reef Studies, James Cook University, Townsville QLD 4811. E-mail: [email protected], Telephone/ Fax: (07) 47815747/ 47816722

In responding to a tender from the Department of the Environment, Water, Heritage & the Arts, a team of researchers representing the ARC Centre of Excellence for Coral Reef Studies at James Cook University (JCU) completed surveys of the coral reef fauna at Ashmore Reef National Nature Reserve and Cartier Island Marine Reserve. The field team comprised Dr Maria Beger (University of Queensland), Ms Zoe Richards (James Cook University), Mr Jean-Paul Hobbs (James Cook University), and Mr Thomas Bowling (National Marine Science Centre). This report was prepared by the above-mentioned researchers, working in conjunction with Dr Morgan Pratchett, Ms Karen Chong-Seng, with further specific input from Dr Andrew Baird, Dr Nick Graham, and Professor David Yellowlees (ARC Centre of Excellence, James Cook University).
© Commonwealth of Australia 2009 This work is copyright. Apart from any use as permitted under the Copyright Act 1968, no part may be reproduced by any process without prior written permission from the Commonwealth. Requests and inquiries concerning reproduction and rights should be addressed to the Commonwealth Copyright Administration, Attorney General’s Department, Robert Garran Offices, National Circuit, Barton ACT 2600 or posted at http://www.ag.gov.au/cca
The views and opinions expressed in this publication are those of the authors and do not necessarily reflect those of the Australian Government or the Minister for the Environment, Heritage and the Arts or the Minister for Climate Change and Water.
This report has been produced for the sole use of the party who requested it. The application or use of this report and of any data or information (including results of experiments, conclusions, and recommendations) contained within it shall be at the sole risk and responsibility of that party. JCU does not provide any warranty or assurance as to the accuracy or suitability of the whole or any part of the report, for any particular purpose or application. Address all correspondence regarding this report to Dr Morgan Pratchett. E-mail: [email protected]
Page 2

1 Executive Summary
Field-based surveys of demersal coral reef fishes (Acanthuridae, Chaetodontidae,
Haemulidae, Labridae, Lethrinidae, Lutjanidae, Mullidae, Pomacanthidae, Pomacentridae,
Scaridae, Serranidae and Siganidae), commercially important invertebrates (trochus, sea
cucumbers, clams and sea stars), coral biodiversity, habitat structure (percentage cover of
hard and soft corals, sponges and algae) and coral health (the incidence of coral disease
and coral predation) were undertaken at Ashmore and Cartier Reefs between April 28th and
May 7th, 2009. Two habitats (shallow reef top and deep reef slope) were sampled at each of
8 sites established during the last comprehensive survey conducted in 2005. Pelagic fishes,
as well as sharks, turtles and any other marine mega-fauna were also sampled along the
reef front at each site, using replicate 500-m transects.
Main findings include:-
• Mean abundance of demersal reef fishes has declined significantly since 2005,
especially at Cartier Reef. This is attributable to localised declines in the abundance of
Pomacentridae, Labridae, Scaridae and Siganidae, which may be explained by
increased fishing effort and/ or changes in habitat structure between 2005 and 2009.
• Demersal fishes at Ashmore Reef, and especially the Pomacentridae, had very high and
unprecedented parasite loads. For example, up to 90% of Chromis weberi within a given
site were infected with cymothoid isopods. High parasitic loads are generally considered
to be indicative of poor condition among reef fishes, but this would need to be tested for
the specific situation.
• The slope of the size-spectra for all fishes surveyed at all study sites across both
Ashmore and Cartier Reefs was -0.23, which is suggestive of moderate fishing pressure.
However, size-spectra will need to be compared through time, and within other
Commonwealth Marine Reserves, to test for sustained and ongoing fisheries effects.
• Densities of coral reef sharks at Ashmore and Cartier (whitetip sharks: 0.29 sharks.ha-1
±0.13 SE, grey reef sharks 0.17 sharks.ha-1 ±0.09 SE) are equivalent to those reported in
areas of the Great Barrier Reef that are subject to fishing, and less than one quarter of
those reported for Cocos (Keeling) Islands. While there is no baseline data on shark
abundance, the data is highly suggestive of sustained fishing for sharks.
• Densities of sea-snakes recorded in 2009 (1.42 individuals per hectare ±0.51 SE) were
much lower than recorded in 2006 (4.67 individuals per hectare ±1.37 SE). The extent
Page 3
and cause(s) of these declines are not known but clearly, more research is required to
assess the population status and vulnerability of these species.
• Commercially important invertebrates (holuthurians, trochus and tridacnid clams) all
exhibited significant declines in abundance from 2005 to 2009, based on comparable
sampling conducted at the same 8 sites. Declines are apparent at both Ashmore Reefs
and Cartier Island, and if anything, are more pronounced at Cartier Island. It is premature
to ascribe these declines to over-fishing, but it is clear that either adult populations are
experiencing higher than normal mortality rates or recruitment is insufficient to maintain
these populations.
• Mean cover of hard (scleractinian) corals was 25.6% ±2.8 SE at Ashmore Reef and
29.4% ±1.8) at Cartier Island, which is 1.8-2.4 times higher compared to coral cover
reported in 2005. Sustained increases in coral cover reflect recovery since the 1998
bleaching event, and are attributable to increased growth of existing colonies as well as
apparent recruitment of new colonies.
• A total of 186 species of scleractinian coral were recorded across both Ashmore and
Cartier Reefs, including 24 species that have not previously been recorded at these
locations.
• While definitely present, densities of potentially devastating coral predators (Drupella
snails and crown-of-thorns starfish, Acanthaster planci) were very low and currently
causing negligible coral damage. Similarly, there was a low incidence of coral disease at
Ashmore and Cartier Reefs, reflective of normal background levels of infection.
Page 4

Table of Contents 1. Executive Summary 3
2. Introduction 10
3. Methods 14
3.1 Distribution, abundance and size-structure of fishes 15
3.2 Commercially important invertebrates 16
3.3 Habitat structure and coral health 17
4. Findings 20
4.1 Distribution, abundance and size-structure of fishes 20
4.1.1 Abundance and species richness 20
4.1.2 Community structure 22
4.1.3 Temporal variation: 2005 versus 2009 25
4.1.4 Size-spectra analysis 28
4.1.5 Densities of reef sharks 30
4.1.6 Sea snakes 31
4.2 Commercially important invertebrates 34
4.2.1 Holothurians 34
4.2.2 Trochus 41
4.2.3 Clams 44
4.3 Habitat structure 48
4.3.1 Hard coral cover 48
4.3.2 Coral composition 51
4.3.3 Benthic structure 52
4.3.4 Coral diversity 56
4.4 Coral health 65
4.4.1 Coral predators 65
4.4.2 Coral disease 65
5. Conclusions 67
6. Recommendations 71
7. References 73
Page 5

List of Figures Figure 1. Location of Ashmore Reef National Nature Reserve within the area
covered under the Memorandum of Understanding between Australian and
Indonesia (the MOU Box) in the Indian Ocean (image from DEH 2005).
12
Figure 2. Sites surveyed at Ashmore Reef and Cartier Island. Satellite imagery
from NASA.
14
Figure 3. Mean abundance (± SE) of demersal reef fishes in each depth zone
(shallow reef crest or reef top, versus deeper reef slope) across 8 sites at Cartier
Island (sites 1 & 2) and Ashmore Reef (sites 3-8).
20
Figure 4. Mean species richness (± SE) of demersal reef fishes in each depth
zone (shallow reef crest or reef top, versus deeper reef slope) across 8 sites at
Cartier Island (sites 1 & 2) and Ashmore Reef (sites 3-8).
22
Figure 5. CDA of community structure of demersal reef fishes. 23
Figure 6. Mean abundance (± SE) of demersal fishes within each of the major
reef fish families at each of the 8 survey sites across Ashmore Reef and Cartier
Island.
24
Figure 7. Inter-annual variation in the mean abundance (± SE) of demersal reef
fishes at each of the 8 survey sites across Ashmore Reef and Cartier Island.
26
Figure 8. Inter-annual variation in the mean abundance (± SE) of demersal reef
fishes at Cartier Island.
27
Figure 9. Size-spectra relationship for entire fish community surveyed across 8
replicate sites at Ashmore and Cartier Reef.
29
Figure 10. Densities of reef sharks along reef fronts at Cocos (Keeling) Islands
and throughout the Great Barrier Reef (GBR) in different management zones, to
compare against overall densities recorded at Ashmore and Cartier Reefs.
30
Figure 11. Comparison of mean density (+SE) of Sea Snakes recorded across
all survey sites at Asmore Reef in 2006 (Kospartov et al. 2006) and 2009 (the
present study).
32
Figure 12. Total number of individuals of each species of holothurian known to
exist in the Reserves. Species are presented in order of decreasing abundance.
Species with no data were not encountered in the present survey.
35
Page 6

Figure 13. Mean number (± SE) of holothurians per hectare within shallow reef
crest or deeper reef slopes at sites across Cartier Island and Ashmore Reef
(sites 3-8). All other holothurian species were only recorded on the reef slope.
36
Figure 14. Mean density of holothurian individuals (+SE) at survey sites in 2005,
2006 and 2009. 2006 data is for Ashmore Reef only.
37
Figure 15. Mean density of trochus (+SE) at survey sites in 2005, 2006 and
2009. 2006 data is for Ashmore Reef only.
42
Figure 16. Mean trochus basal shell width in the Reserves in 2006 and 2009
(2006 data excludes Cartier Island).
43
Figure 17. Size frequency distribution of trochus recorded on transects in the
Reserves in 2006 and 2009 (2006 data does not include Cartier Island).
43
Figure 18. Mean (± SE) density of clams on shallow reef crest (white bars) or
deeper reef slopes (grey bars) at sites across Cartier Island (sites 1-2) and
Ashmore Reef (sites 3-8).
45
Figure 19. Mean density of clams (+SE) at survey sites in 2005, 2006 and 2009.
2006 data is for Ashmore Reef only.
46
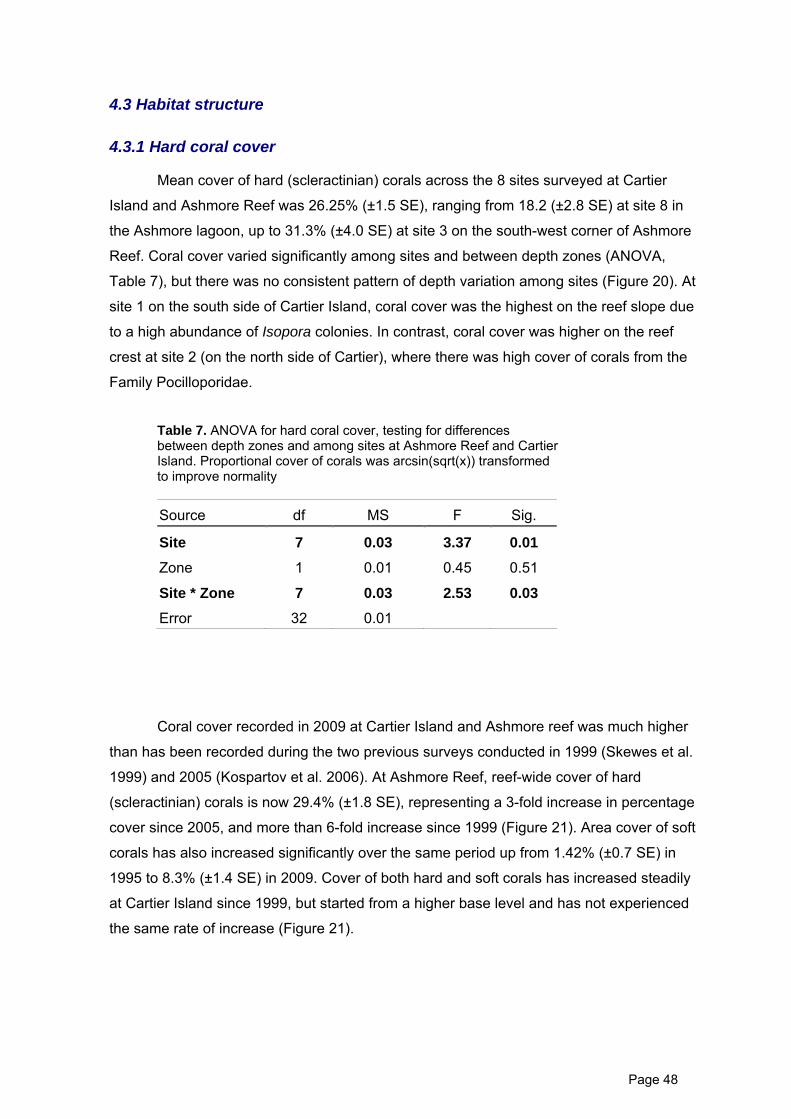
Figure 20. Mean percent scleractinian coral cover (± SE) in each depth zone
(shallow reef crest or reef top, versus deeper reef slope) across 8 sites at Cartier
Island (sites 1 & 2) and Ashmore Reef (sites 3-8).
49
Figure 21. Temporal variation in mean (± SE) cover of hard and soft corals at
Cartier Island and Ashmore Reef, based on comparisons between this study and
comparable surveys conducted by Skewes et al (1999) and Kospartov et al
(2006).
49
Figure 22. Temporal comparison of hard coral cover for i) the reef crest and ii)
the reef slope, comparing coral cover recorded in 2009 to comparable data from
surveys undertaken by Kospartov et al (2006).
50
Figure 23. CDA of community structure for hard corals,. 52
Figure 24. CDA of community structure for all coral reef benthos. 54
Figure 25. Proportional composition of major habitat categories within each
depth zone across 8 sites at Cartier Island (sites 1 & 2) and Ashmore Reef (sites
3-8).
55
Figure 26. Mean percent cover (± SE) of different genera of soft corals at Cartier 56
Page 7

Island versus Ashmore Reef.
Figure 27. Mean scleractinian species richness at the eight Reserve sites
showing the deep sites have higher coral biodiversity than shallow sites.
59
Figure 28. Regression of hard coral cover against species richness of
scleractinian corals on each individual transect (n = 48).
64
Figure 29. Major current systems in the southeast Indian Ocean and ocean
basins around western Australia (from Domingues et al., 2007).
68
Plate 1. Fishes and reptiles in the Reserves. 33
Plate 2. Selection of invertebrates occurring in the Reserves. 47
Plate 3. Selection of hard coral occurring in the Reserves. 62
Plate 4. Soft coral and sea fans occurring within the Reserves. 63
Plate 5. Selection of degraded reef shots. 66
Page 8

List of Tables
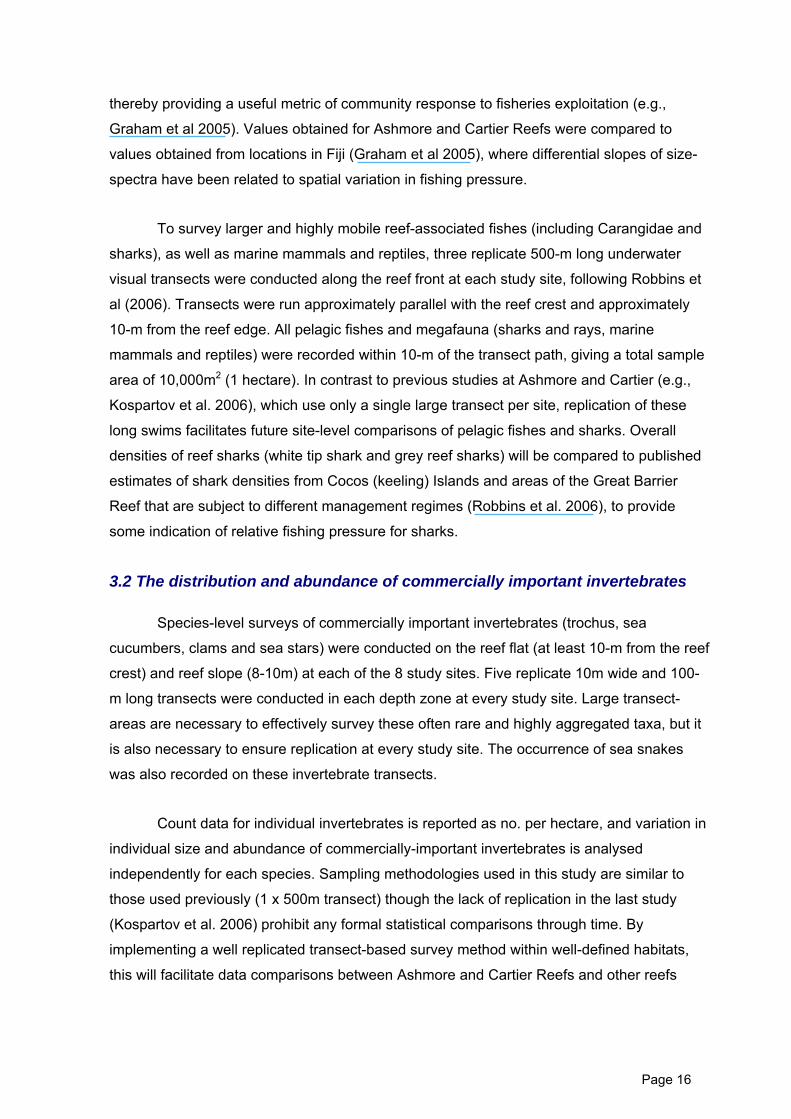
Table 1. GPS Co-ordinates of the 2009 survey sites 18
Table 2. ANOVA for i) abundance and ii) species richness of demersal reef
fishes, testing for differences between depth zones and among sites at Ashmore.
21
Table 3. MANOVA for community structure of demersal reef fish,. 23
Table 4. Total number of fishes assigned to each size class based on
comprehensive surveys of reef fish communities at 8 sites across both Ashmore
and Cartier Reef
29
Table 5. ANOVA for total abundance of a) holothurians, b) trochus and c) clams. 38
Table 6. Comparisons of the density (individuals per hectare) of holothurian
species on transects between 2006 and 2009.
39
Table 7. ANOVA for hard coral cover, testing for differences between depth
zones and among sites at Ashmore Reef and Cartier Island.
48
Table 8. MANOVA for community structure of hard corals (based on the 10 most
abundant genera).
51
Table 9. Mean percent cover (± SE) of major benthic categories at Cartier Island
and Ashmore Reef.
53
Table 10. MANOVA for community structure of coral reef benthos. 53
Table 11. New coral records from Ashmore Reef and Cartier Island Marine
Reserves.
57
Table 12. Species recorded in Kospartov et al. (2006) but not in the current
survey.
57
Table 13. Regional comparison of scleractinian coral biodiversity. 58
Table 14. Ranked list of ‘key’ hard coral species that occur within the Reserves. 61
Page 9

2 Introduction
Coral reef ecosystems have enormous ecological, economic, social and cultural
value both in Australia (Oxford Economics, 2009), and throughout the world (Moberg and
Folke, 1999). However, coral reefs throughout the world are being rapidly degraded due to
direct anthropogenic pressures (e.g., overfishing) and climate change (Hughes et al., 2003).
Thus, the management and protection of coral reef organisms and ecosystems throughout
Australia’s territorial waters must remain a national imperative.
Ashmore Reef National Nature Reserve and Cartier Island Marine Reserve (herein
described collectively as ‘the Reserves’) are two discontinuous exposed open ocean
platform reefs located on the North-Western edge of the Sahul Shelf in North West Australia
that are managed federally by the Department of Environment, Water, Heritage and the Arts
(DEWHA). Ashmore Reef (12° 17’S, 123° 02’E) encloses an area of approximately 583
square kilometres and comprises three small vegetated islands, a number of sand cay, two
lagoons and extensive reef. Cartier Island (12° 32’S, 123° 33’E) covers approximately 167
square kilometres and is located approximately 25 nautical miles to the south-east of
Ashmore Reef. Cartier Island is an unvegetated sand cay surrounded by coral reef with an
extensive reef flat and no lagoon. The Reserve description includes the seabed and
substrata to 1000 metres depth, their boundaries are shown in Figure 1.
The Reserves are protected for three reasons. Firstly, they have extremely high
biodiversity with regionally and internationally significant fauna including marine
invertebrates (coral, sponge, mollusc, crustacean, echinoderm and others), reef and pelagic
fish, dugongs, turtles, sea snakes, seabirds and shorebirds. Secondly, the Reserves occur in
a unique isolated oceanic location meaning that these systems are relatively undisturbed
compared with many other coral reefs around the world. Thirdly, the Reserves are iconic and
have extraordinary cultural value. For these reasons, Ashmore Reef National Nature
Reserve is included on the Register of the National Estate and included on the World
Conservation Union (IUCN) list of Coral Reefs of International Significance.
The Reserves occur in a unique oceanographic setting because they are placed in
the only area where low-latitude exchange of Pacific and Indian Ocean water masses can
occur. A pressure gradient between the two oceans drives the Pacific through-flow current
westward through the Timor Strait over winter months (May-September) (Wyrtki, 1987).
Throughout summer months (November-March), the sea-level difference between the two
Page 10

oceans is smaller and this causes the westward through-flow current to weaken enabling the
South Java Current and the Eastern Gyral Current (Sprintall et al., 2002) to recirculate over
the inshore part of the Sahul shelf. Ashmore Reef and Cartier Island occur on the edge of
the continental shelf and border the Timor Strait so they are influenced by these seasonal
circulation regimes (Cresswell et al., 1993). Hence, because the Reserves occur in a
transition zone and receive water of mixed origins, they supports an exceptionally high
biodiversity of marine life. The Reserves also have high cultural value because traditional
Indonesian fishers (particularly people of Palau Roti which is only 150km away) have fished
reefs in this region since the early eighteenth century (Fox 1998, Stacey 1999).
In recognition of traditional fishing grounds in the North West Shelf, a Memorandum
of Understanding (MOU) between the Australian and Indonesian governments was
established in 1974, and reviewed in 1989, sets out arrangements by which traditional
fishers may access marine resources in the region. The MOU allows for continued
Indonesian traditional fishing activities in an area known as the MOU Box, which includes
Ashmore and Cartier Reserves. Traditional Indonesian fishermen are permitted to visit the
MOU Box area including a small area known as West Island Lagoon in the Ashmore Reef
Reserve. Access to the remaining area of Ashmore Reef Reserve and all of Cartier Island
Reserve is prohibited unless under authorisation from the Director of National Parks.
Despite this MOU arrangement, illegal harvesting and fishing of holothurians,
trochus, clams, turtles, sharks and other resources remain a constant threat in the Reserves.
The Australian Customs Service (Customs) has provided a compliance and enforcement
presence at Ashmore for many years, however it became clear that a dedicated vessel was
required to protect the reserve’s unique environment. As such, in April 2008, the Customs
vessel, Ashmore Guardian, has since provided a near permanent presence at Ashmore,
offering an unparalleled level of protection.
In 2006 the suspicion of illegal fishing prompted DEWHA to conduct additional
reactive Reserve-wide surveys of commercially targeted invertebrates (trochus, holothurians
and tridacnid clams). This survey generally indicated that giant clams (Tridacna gigas),
valuable species of sea cucumber (Holuthuria. nobilis, H. fuscogilva) and large individuals of
trochus (Trochus niloticus) had had declined between 2005 and 2006, possibly due to
overexpolitation. Detecting statistically significant declines in stock numbers is a challenge at
the Reserve-wide level, and the stocks of some species of macroinvertebrates have proven
difficult to monitor because for example some species (e.g. trochus) are cryptic, while others
such as holothurians tend to aggregate and are difficult to detect.
Page 11

Figure 1. Location of Ashmore Reef National Nature Reserve within the area covered under the Memorandum of Understanding between Australian and Indonesia (the MOU Box) in the Indian Ocean (image from DEH 2005).
The last full marine survey of Ashmore and Cartier Reef’s undertaken in 2005
(Kospartov et al., 2006) showed low levels of hard coral cover (10% at Ashmore, 16% at
Cartier). The benthic communities were dominated by coralline and turf alga and there was
substantial evidence of recent coral mortality. It was interpreted that the poor condition of
benthic communities related to the 2003 coral bleaching events. Of concern in the Kospartov
Page 12

et al. (2006) report is that few large mature coral individuals or coral recruits were observed.
Also, it is important to note that this survey reports an apparent decline in coral biodiversity
since surveys were first undertaken in 1986 (Marsh et al., 1993). Fish communities in the
reserves were found to be diverse in 2005 and there were high densities of finfish stocks. In
2005, fish densities were observed to have increased at Cartier Island, but not at Ashmore.
This could indicate healthy unfished stocks on the reef, or a positive effect of the closure to
fishing (Kospartov et al., 2006). However the density of valuable marine invertebrates has
declined since the start of the monitoring programme. The condition of the coral community
is of particular interest to interpreting the medium-long term resilience of the Reserve reef
communities as a whole.
Since their inscription as protected areas (Ashmore in 1983; Cartier in 2000),
monitoring of the marine resources in the Reserves has been conducted in accordance with
the Reserves Management Plans (Environment Australia 2002). With the expiration of the
Reserves management plan in June 2009, interim management arrangements have been
enacted through the Environment Protection and Biodiversity Conservation Act 1999 (EPBC
Act). A new management plan is being formulated as part of the North West bioregional
planning process. The long-term monitoring of the Reserves provides a key performance
measure critical to ensuring optimal management of marine resources.
In the current survey we implement a rigorous sampling methodology, based on
fixed-area (transect-based) surveys for fishes, benthic invertebrates and habitat structure,
which will maximise resolution and precision for detecting temporal and spatial changes in
coral reef ecosystems. The results of the current survey have been compared, where
possible to the critical baseline information provided in previous surveys to give a more
comprehensive understanding of the marine environment inside the Reserves. Surveys
include small and large reef fish biodiversity, hard coral biodiversity, benthic cover estimates,
holothurians, trochus and clams diversity and biomass. We also report on coral health and
comment on other significant aspects of community condition and status. We make
management recommendations to benefit the marine resources of the Reserve.
Page 13
3 Methods
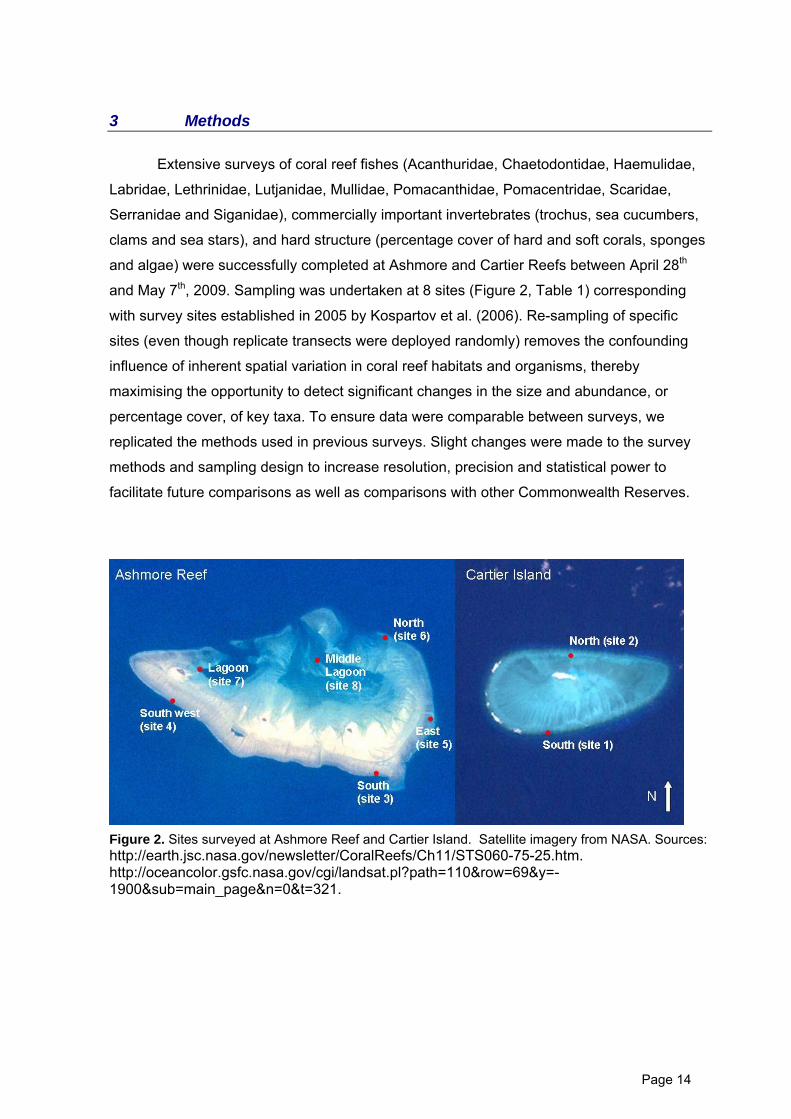
Extensive surveys of coral reef fishes (Acanthuridae, Chaetodontidae, Haemulidae,
Labridae, Lethrinidae, Lutjanidae, Mullidae, Pomacanthidae, Pomacentridae, Scaridae,
Serranidae and Siganidae), commercially important invertebrates (trochus, sea cucumbers,
clams and sea stars), and hard structure (percentage cover of hard and soft corals, sponges
and algae) were successfully completed at Ashmore and Cartier Reefs between April 28th
and May 7th, 2009. Sampling was undertaken at 8 sites (Figure 2, Table 1) corresponding
with survey sites established in 2005 by Kospartov et al. (2006). Re-sampling of specific
sites (even though replicate transects were deployed randomly) removes the confounding
influence of inherent spatial variation in coral reef habitats and organisms, thereby
maximising the opportunity to detect significant changes in the size and abundance, or
percentage cover, of key taxa. To ensure data were comparable between surveys, we
replicated the methods used in previous surveys. Slight changes were made to the survey
methods and sampling design to increase resolution, precision and statistical power to
facilitate future comparisons as well as comparisons with other Commonwealth Reserves.
Figure 2. Sites surveyed at Ashmore Reef and Cartier Island. Satellite imagery from NASA. Sources: http://earth.jsc.nasa.gov/newsletter/CoralReefs/Ch11/STS060-75-25.htm. http://oceancolor.gsfc.nasa.gov/cgi/landsat.pl?path=110&row=69&y=-1900&sub=main_page&n=0&t=321.
Page 14

3.1 The distribution, abundance and size-structure of coral reef fishes
The size and abundance for coral reef fishes, as well as other large reef-associated
marine fauna, were surveyed using underwater visual census along replicate transects, with
transect dimensions (length and width) adjusted according to the size and abundance of the
focal species. For demersal (habitat-associated) reef fishes, surveys were completed in both
shallow (2-5 metres depth) reef crest habitats and deeper (8-10 metres depth) reef slope
habitats. Surveys were undertaken along three replicate 50-m belt transects within each
depth zone at every study site. Larger fishes (e.g. Acanthuridae, Labridae, Lethrinidae,
Scaridae, and Serranidae) were surveyed 2.5m either side of the transect path (giving a
sample area of 250m2 per transect), while smaller more site attached species
(Chaetodontidae, and especially Pomacentridae) were documented 1m either side of the
transect tape (giving a sample area of 100m2 per transect). In addition to counting fish from
each species within each family, we also estimated total length (to the nearest cm) for each
individual fish.
Variation in the abundance of habitat-associated coral reef fishes (between years,
between depth zones, and among sites) was analysed using analysis of variance (ANOVA),
based on log-transformed counts of fish abundance. Separate analyses were conducted for
each family of fishes to test for significant changes in abundance through time, and so
significant differences were interpreted very cautiously given the potential for elevated Type I
error rates. Community structure of fish assemblages (based on relative abundance of fishes
in each of the major families) was also analysed using MANOVA, testing for differences
between depth zones and among sites. The extent of similarity in fish assemblages was then
displayed using a CDA. The CDA plots display each combination of site and depth zone in a
two dimensional space to illustrate the relative similarity in community structure. In addition
structural coefficients are plotted in the space to assist with interpretation.
The size composition of reef fish communities was characterised using size-spectra,
which is the relative abundance of fishes in different size classes regardless of taxonomy. In
order to explore the size structure of reef fishes in Ashmore and Cartier all data on the size
of individual fishes was aggregated across all sites. Fishes were assigned to one of 13
different 5cm size classes, ranging ≤5cm up to ≥60cm (Table 3). The slopes of the size-
spectra were calculated from linear regressions of log10 (x+1) numbers per size class on the
rescaled log10 mid-point of each length class. In order to calculate the mid-point height as
opposed to the intercept, we also centered the regression around the independent variable
(size classes). The resulting slopes of the size-spectra respond to changes in mortality rates,
Page 15
thereby providing a useful metric of community response to fisheries exploitation (e.g.,
Graham et al 2005). Values obtained for Ashmore and Cartier Reefs were compared to
values obtained from locations in Fiji (Graham et al 2005), where differential slopes of size-
spectra have been related to spatial variation in fishing pressure.
To survey larger and highly mobile reef-associated fishes (including Carangidae and
sharks), as well as marine mammals and reptiles, three replicate 500-m long underwater
visual transects were conducted along the reef front at each study site, following Robbins et
al (2006). Transects were run approximately parallel with the reef crest and approximately
10-m from the reef edge. All pelagic fishes and megafauna (sharks and rays, marine
mammals and reptiles) were recorded within 10-m of the transect path, giving a total sample
area of 10,000m2 (1 hectare). In contrast to previous studies at Ashmore and Cartier (e.g.,
Kospartov et al. 2006), which use only a single large transect per site, replication of these
long swims facilitates future site-level comparisons of pelagic fishes and sharks. Overall
densities of reef sharks (white tip shark and grey reef sharks) will be compared to published
estimates of shark densities from Cocos (keeling) Islands and areas of the Great Barrier
Reef that are subject to different management regimes (Robbins et al. 2006), to provide
some indication of relative fishing pressure for sharks.
3.2 The distribution and abundance of commercially important invertebrates
Species-level surveys of commercially important invertebrates (trochus, sea
cucumbers, clams and sea stars) were conducted on the reef flat (at least 10-m from the reef
crest) and reef slope (8-10m) at each of the 8 study sites. Five replicate 10m wide and 100-
m long transects were conducted in each depth zone at every study site. Large transect-
areas are necessary to effectively survey these often rare and highly aggregated taxa, but it
is also necessary to ensure replication at every study site. The occurrence of sea snakes
was also recorded on these invertebrate transects.
Count data for individual invertebrates is reported as no. per hectare, and variation in
individual size and abundance of commercially-important invertebrates is analysed
independently for each species. Sampling methodologies used in this study are similar to
those used previously (1 x 500m transect) though the lack of replication in the last study
(Kospartov et al. 2006) prohibit any formal statistical comparisons through time. By
implementing a well replicated transect-based survey method within well-defined habitats,
this will facilitate data comparisons between Ashmore and Cartier Reefs and other reefs
Page 16

Page 17
systems around the world, as well as enabling better temporal comparisons through future
surveys.
3.3 Habitat structure
Biological and physical structure of benthic reef habitats was documented using 3
replicate 50-m point- intercept transects, with 100 uniformly distributed points (50cm apart)
per transect, as utilised in extensive regional surveys of coral reef habitats on the Great
Barrier Reef (e.g., Pratchett et al., 2006) and throughout the Indo-Pacific (Pratchett et al.
2009). All scleractinian (hard) corals underlying specific survey points were identified to
genus, providing a rigorous measure of coral cover and composition to facilitate spatial and
temporal comparisons. Hard coral cover, soft coral cover and algal cover are all reported as
percentages as per the accepted scientific standard. Moreover, coral diversity, benthic
cover and composition were documented along the same transects used to quantify size and
abundance of fishes, allowing for fine-scale comparisons of fish and habitat structure.
Replicate measures of topographic complexity, which is a fundamental component of reef
habitats (Graham et al. 2006), were also obtained at the start of each transect, using the
five-point scale formalised by Wilson et al. (2007).
Variation in mean coral cover (both among sites and among years) was analysed
using univariate parametric analyses (ANOVA) following appropriate (square root – arcsine)
transformation of proportional cover. Community structure of benthic assemblages was then
analysed using multivariate analyses (MANOVA and CDA). Two separate analyses of
benthic composition were conducted; Firstly to explore variation in broad habitat categories
(e.g., hard coral, soft-coral turf algae, macroalage) and secondly, to assess variation in the
taxonomic composition (family-level) of hard coral assemblages.
To document coral biodiversity as well colony level measures of coral health, all coral
colonies >5cm diameter were surveyed 1-m either side of the transect path, and identified to
species. Three replicated 50m transects were conducted at two depths. This provided a
rigorous measure of species diversity, with controls for area surveyed as well as number of
colonies surveyed. The number of species per unit area provides a standardised measure of
coral diversity that can be later compared among Commonwealth Marine reserves, taking
account of variation in coral cover and colony density. Whilst surveying corals along 50 x 2m
belt transects, any evidence of adverse coral health, such as coral bleaching, recent coral
predation and coral disease was also recorded. In addition, the size and abundance of A.
planci was quantified, and the density of Drupella spp, were recorded along each transect.

Table 1. GPS Co-ordinates of the 2009 survey sites
Replicate Location Site Number
Equivalent 2005 Site Number
Start Latitude (degrees South)
Start Longitude (degrees East)
End Latitude (degrees South)
End Longitude (degrees East)
Reef fish/Benthic Transects - Deep Cartier South Site 1 D13 12.54.684 123.55.236 12.54.606 123.55.698 Reef fish/Benthic Trans. - Shallow Cartier South Site 1 D14 12.54.589 123.55.249 12.54.519 123.55.706 Pelagic Transect 1 Cartier South Site 1 D13 12.32.701 123.33.690 12.32.764 123.33.419 Pelagic Transect 2 Cartier South Site 1 D13 12.32.764 123.33.419 12.32.819 123.33.078 Pelagic Transect 3 Cartier South Site 1 D13 12.32.819 123.33.078 12.32.864 123.32.798 Invert Transects - Deep Cartier South Site 1 D13 12.32.819 123.33.078 12.32.984 123.32.798 Invert Transects - Shallow Cartier South Site 1 D14 12.32.651 123,33,074 12.32.642 123.33.137 Reef fish/Benthic Transects - Deep Cartier North Site 2 D15 12.52.374 123.55.849 12.54.393 123.55.386 Reef fish/Benthic Trans. - Shallow Cartier North Site 2 D16 12.52.419 123.55.858 12.54.436 123.55.428 Pelagic Transect 1 Cartier North Site 2 D15 12.31.387 123.32.973 12.31.404 123.33.252 Pelagic Transect 2 Cartier North Site 2 D15 12.31.404 123.33.252 12.31.412 123.33.550 Pelagic Transect 3 Cartier North Site 2 D15 12.31.412 123.33.550 12.31.421 123.33.834 Invert Transects - Deep Cartier North Site 2 D15 12.31.447 123.33.510 12.31.444 123.32.957 Invert Transects - Shallow Cartier North Site 2 D16 12.31.521 123.33.235 12.31.638 123.33.484 Reef fish/Benthic Transects - Deep Ashmore South Site 3 D1 12.29.14 123.11.65 12.29.06 123.12.12 Reef fish/Benthic Trans. - Shallow Ashmore South Site 3 D2 12.28.97 123.12.13 12.28.97 123.12.13 Pelagic Transect 1 Ashmore South Site 3 D1 12.17.483 123.07.329 12.17.472 123.07.052 Pelagic Transect 2 Ashmore South Site 3 D1 12.17.472 123.07.052 12.17.530 123.06.782 Pelagic Transect 3 Ashmore South Site 3 D1 12.17.530 123.06.782 12.17.587 123.06.482 Invert Transects - Deep Ashmore South Site 3 D1 12.17.476 123.06.990 12.17.546 123.06.715 Invert Transects - Shallow Ashmore South Site 3 D2 12.17.371 123.06.984 12.17.280 123.07.238 Reef fish/Benthic Transects - Deep Ashmore SW Site 4 D3 12.26.63 122.96.19 12.26.47 122.9576 Reef fish/Benthic Trans. - Shallow Ashmore SW Site 4 D4 12.26.67 122.96.24 12.26.12 122.9514 Pelagic Transect 1 Ashmore SW Site 4 D3 12.16.140 122.57.924 12.15.999 122.57.691 Pelagic Transect 2 Ashmore SW Site 4 D3 12.15.999 122.57.691 12.15.857 122.57.456 Pelagic Transect 3 Ashmore SW Site 4 D3 12.15.857 122.57.456 12.15.801 122.57.454 Invert Transects - Deep Ashmore SW Site 4 D3 12.15.864 122.57.442 12.15.782 122.57.171 Invert Transects - Shallow Ashmore SW Site 4 D4 12.15.804 122.57.725 12.15.627 122.57.517
Page 18
Page 19
Reef fish/Benthic Transects - Deep Ashmore East Site 5 D5 12.25.45 123.15.69 12.24.71 123.16.04 Reef fish/Benthic Trans. - Shallow Ashmore East Site 5 D6 12.24.94 123.15.62 12.25.35 123.15.46 Pelagic Transect 1 Ashmore East Site 5 D5 12.15.039 123.09.649 12.15.291 123.09.456 Pelagic Transect 2 Ashmore East Site 5 D5 12.15.291 123.09.456 12.15.498 123.09.261 Pelagic Transect 3 Ashmore East Site 5 D5 12.15.498 123.09.261 12.15.685 123.09.068 Invert Transects - Deep Ashmore East Site 5 D5 12.15.135 123.09.439 12.15.320 123.09.241 Invert Transects - Shallow Ashmore East Site 5 D6 12.14.884 123.09.245 12.15.118 123.09.111 Reef fish/Benthic Transects - Deep Ashmore North Site 6 D9 12.18.41 123.10.57 12.18.45 123.11.124 Reef fish/Benthic Trans. - Shallow Ashmore North Site 6 D10 12.18.45 123.10.67 12.18.53 123.11.11 Pelagic Transect 1 Ashmore North Site 6 D9 12.13.980 122.59.457 12.14.116 122.59.213 Pelagic Transect 2 Ashmore North Site 6 D9 12.14.116 122.59.213 12.14.245 122.58.948 Pelagic Transect 3 Ashmore North Site 6 D9 12.14.245 122.58.948 12.14.339 122.58.728 Invert Transects - Deep Ashmore North Site 6 D9 12.11.078 123.06.596 12.11.047 123.06.328 Invert Transects - Shallow Ashmore North Site 6 D10 12.13.980 122.59.457 12.14.116 122.59.213 Reef fish/Benthic Transects - Deep Ashmore Lagoon Site 7 D7 12.23.08 122.99.75 12.23.07 122.99.42 Reef fish/Benthic Trans. - Shallow Ashmore Lagoon Site 7 D8 12.23.27 122.99.57 12.23.05 122.99.27 Pelagic Transect 1 Ashmore Lagoon Site 7 D7 12.11.074 123.06.568 12.11.074 123.06.454 Pelagic Transect 2 Ashmore Lagoon Site 7 D7 12.11.045 123.06.139 12.11.097 123.06.022 Pelagic Transect 3 Ashmore Lagoon Site 7 D7 12.11.105 123.05.934 12.11.123 123.05.731 Invert Transects - Deep Ashmore Lagoon Site 7 D7 12.11.074 123.06.568 12.11.094 123.06.454 Invert Transects - Shallow Ashmore Lagoon Site 7 D8 12.11.105 123.05.934 12.11.123 123.05.731 Reef fish/Benthic Transects - Deep Ashmore Mid. Lag. Site 8 D11 12.20.06 123.08.29 12.20.06 123.08.29 Reef fish/Benthic Trans. - Shallow Ashmore Mid. Lag Site 8 D12 12.20.74 123.06.63 12.20.92 123.07.27 Pelagic Transect 1 Ashmore Mid. Lag Site 8 D11 12.12.490 123.04.444 12.12.526 123.04.213 Pelagic Transect 2 Ashmore Mid. Lag Site 8 D11 12.12.527 123.04.134 12.12.407 123.03.926 Pelagic Transect 3 Ashmore Mid. Lag Site 8 D11 12.11.338 123.04.649 12.11.091 123.04.536 Invert Transects - Deep Ashmore Mid. Lag Site 8 D11 12.11.338 123.04.649 12.11.091 123.04.536 Invert Transects - Shallow Ashmore Mid. Lag Site 8 D12 12.12.490 123.04.444 12.12.526 123.04.213

4 Findings
4.1 The distribution, abundance and size-structure of coral reef fishes
4.1.1 Abundance and diversity of reef fishes
A total of 13,564 fishes were counted during visual surveys of fishes within
specified families (Acanthuridae, Chaetodontidae, Haemulidae, Kyphosidae, Labridae,
Lethrinidae, Lutjanidae, Mullidae, Pomacanthidae, Pomacentridae, Scaridae,
Serranidae and Siganidae) across 48 transects surveyed at Ashmore Reef and Cartier
Island in 2009, corresponding with a mean of 282.6 (±103.1 SE) fishes per transect.
The abundance of fishes varied significantly among sites (ANOVA, Table 2), ranging
from 202.8 fishes per transect (±14.9 SE) at site 4 on the south-west side of Ashmore
reef, up to 407.8 fishes per transect (±39.1 SE) at site 3 on the south-east side of
Ashmore. Overall abundance was also fairly consistent among zones within a given
site (Table 2, Figure 3).
0
100
200
300
400
500
600
1 2 3 4 5 6 7 8
CrestSlope
No.
per
tran
sect
Sites
Figure 3. Mean abundance (± SE) of demersal reef fishes in each depth zone (shallow reef crest or reef top, versus deeper reef slope) across 8 sites at Cartier Island (sites 1 & 2) and Ashmore Reef (sites 3-8).
Page 20

A total of 273 species of fishes were recorded during visual surveys of fishes
within specified families (Acanthuridae, Chaetodontidae, Haemulidae, Labridae,
Lethrinidae, Lutjanidae, Mullidae, Pomacanthidae, Pomacentridae, Scaridae,
Serranidae and Siganidae). The number of species recorded on a single transect
varied greatly among transects (even within a given site) ranging from 11 to 73, with a
mean of 45.6 (±39.1 SE) species per transect. In all, the mean species richness did not
vary greatly among sites , but was significantly different between zones (Table 2) and
generally higher on the reef slope compared to the reef crest (Figure 4). The only
exception to this pattern was at site 8 (in the Ashmore lagoon) were fish diversity was
actually higher on the reef crest compared to the associated reef slope.
Table 2. ANOVA for i) abundance and ii) species richness of demersal reef fishes, testing for differences between depth zones and among sites at Ashmore Reef and Cartier Island. Raw counts were log(x+1) transformed to improve normality.
i) Log Abundance
Source df MS F Sig.
Site 7 0.07 2.41 0.04
Zone 1 0.01 0.12 0.73
Site * Zone 7 0.02 0.82 0.58
Error 32 0.03
ii) Species Richness
Source df MS F Sig.
Site 7 282.9 3.04 0.01
Zone 1 892.7 9.61 0.00
Site * Zone 7 221.9 2.39 0.04
Error 32 92.9
Page 21

0
10
20
30
40
50
60
70
1 2 3 4 5 6 7 8
CrestSlope
No.
spe
cies
per
tran
sect
Sites Figure 4. Mean species richness (± SE) of demersal reef fishes in each depth zone (shallow reef crest or reef top, versus deeper reef slope) across 8 sites at Cartier Island (sites 1 & 2) and Ashmore Reef (sites 3-8).
4.1.2 Community structure of demersal reef fishes
Demersal reef fish assemblages were strongly dominated by the family
Pomacentridae, which accounted for 59% (8,011/ 13,546) of individuals counted. It is
important to remember however, that we specifically excluded several other families of
reef fishes (Apogonidae, Blennidae, and Gobiidae) which are generally cryptic, but
often very abundant within coral reef habitats. Other dominant families recorded during
these surveys were the Labridae and Acanthuridae, which each accounted for
approximately 13.3% of fishes counted. Overall community structure varied significantly
and among sites, but there was also significant variation among zones within sites
(MANOVA, Table 3). The greatest difference was between Cartier Island (sites 1 and 2)
and Ashmore reef (sites 3-8), where Balistidae were much more abundant around
Cartier Island (Figure 5), while Siganidae were only found at Ashmore Reef (Figure 6).
There was also marked spatial variation in the abundance of some other families, such
as the Lethrinidae (Figure 6), which could be compared to spatial variation in fishing
intensity if this data was available.
Page 22

Table 3. MANOVA for community structure of demersal reef fish, testing for differences between depth zones and among sites at Ashmore Reef and Cartier Island. Families included in this analysis were Acanthuridae, Balistidae, Chaetodontidae, Haemulidae, Labridae, Lethrinidae, Lutjanidae, Mullidae, Pomacanthidae, Pomacentridae, Scaridae, Serranidae and Siganidae. Raw counts were log(x+1) transformed to improve normality.
Effect Value F Hypothesis df Error df Sig.
Site 3.68 2.22 91 182 0.00
Zone 0.79 5.79 13 20 0.00
Site * Zone 3.31 1.80 91 182 0.00
-8
8
-8 8
2-C
1-C
1-S
3-C
7-C
4-C6-S
2-S
5-S
8-S 3-S
7-S5-C
6-C
8-C
4-S
Chaetodontidae
Haemulidae
Balistidae
Lutjanidae
Mullidae
Pomacanthidae Serranidae
Lethrinidae Scaridae
Pomacentridae
Labridae
Axis 2 21.0%
Axis 1 38.1%
Figure 5. CDA of community structure of demersal reef fishes, comparing the shallow reef crest (open circles), versus deeper reef slope (grey circles) across 8 sites at Cartier Island (sites 1 & 2) and Ashmore Reef (sites 3-8). The influence of key families on community structure are indicated by structural vectors.
Page 23

Acanthuridae
0102030405060708090
100
1 2 3 4 5 6 7 8
Mea
n no
. per
Tra
nsec
t
Chaetodontidae
0
5
10
15
20
25
1 2 3 4 5 6 7 8
Mea
n no
. per
Tra
nsec
t
Labridae
0102030405060708090
1 2 3 4 5 6 7 8
Mea
n no
. per
Tra
nsec
t
Lethrinidae
-202468
10121416
1 2 3 4 5 6 7 8
Mea
n no
. per
Tra
nsec
t
Lutjanidae
0
10
20
30
40
50
1 2 3 4 5 6 7 8Sites
CrestSlope
Mullidae
02468
10121416
1 2 3 4 5 6 7 8
Pomacanthidae
0123456789
1 2 3 4 5 6 7 8
Pomacentridae
050
100150200250300350400
1 2 3 4 5 6 7 8
Sites Sites
Figure 6. Mean abundance (± SE) of demersal fishes within each of the major reef fish families at each of the 8 survey sites across Ashmore Reef and Cartier Island.
Page 24

Scaridae
010203040506070
1 2 3 4 5 6 7 8
Sites
CrestSlope
Serranidae
0
2
4
6
8
10
12
1 2 3 4 5 6 7 8
Mea
n no
. per
Tra
nsec
t
Siganidae
0
1
2
3
4
5
1 2 3 4 5 6 7 8Sites
M
Figure 6. continued
4.1.3 Temporal variation in reef fishes: 2005 versus 2009
Based on a subset of families counted in both 2005 and 2009 (Acanthuridae,
Chaetodontidae, Haemulidae, Labridae, Lethrinidae, Lutjanidae, Mullidae,
Pomacanthidae, Pomacentridae, Scaridae, Serranidae and Siganidae) there has been
a significant decline through time in abundance of coral reef fishes at Ashmore Reef
and Cartier Island (ANOVA, F= 10.3, df =1,7, p = 0.002). At Ashmore Reef, declines in
abundance of reef fishes were only apparent at site 6 (on the north-east corner) due to
a decline in the abundance of Pomacentridae. In 2005, there were in excess of 1,000
damselfish recorded on 2 of the 3 transects surveyed at site 6, whereas mean densities
of pomacentrids across all other sites were <200 fishes per transect. At the two sites at
Cartier Island, however, there was a consistent decline in the abundance of reef fishes
from 2005 to 2009 (Figure 7), and this is only partly attributable to changes in
abundance of Pomacentridae.
ean
no. p
er T
ect
rans
Page 25

0
200
400
600
800
1000
1200
1400
1 2 3 4 5 6 7 8
Mea
n no
. of r
eef f
ishe
s pe
r tra
nsec
t20052009
Figure 7. Inter-annual variation in the mean abundance (± SE) of demersal reef fishes at each of the 8 survey sites across Ashmore Reef and Cartier Island. Densities of reef fishes were calculated based on a restricted set of families (Acanthuridae, Chaetodontidae, Haemulidae, Labridae, Lethrinidae, Lutjanidae, Mullidae, Pomacanthidae, Pomacentridae, Scaridae, Serranidae and Siganidae) surveyed in both 2005 and 2009.
Declines in abundance of reef fishes at Cartier Island between 2005 and 2009
were most pronounced for fishes from the family Pomacentridae, which declined by
more then 55% from a mean of 320.7 (± 60.8 SE) individuals per transect down to
140.1 (± 25.6 SE). Three other families, the Labridae, Scaridae and Siganidae, also
exhibited significant declines in abundance over this period (Figure 8). For the
Signanidae, there was not a single individual counted on transects surveyed at Cartier
Reef in 2009, whereas 30 individuals were recorded on similar transects surveyed at
the same sites in 2005. Declines in abundance of these reef fishes may be attributable
to increased fishing at Cartier Island since 2005, but it is notable that there were no
apparent declines in abundance of large piscivores species, including Lethrinidae,
Lutjanidae and Serranidae, which are all potential targets of local fishing effort.
Moreover, declines were most apparent among the Pomacentridae, which is
suggestive of some change in habitat structure rather than fishing pressure, as was
shown during rigorous path-analyses undertaken by Wilson et al. (2008) to explain
Page 26

declines in abundance of Pomacentridae (and other reef fishes) during habitat
degradation in Fiji.
0
20
40
60
80
100
120
140
Aca
nthu
ridae
Cha
etod
ontid
ae
Labr
idae
Leth
rinid
ae
Lutja
nida
e
Mul
lidae
Pom
acan
thid
ae
Sca
ridae
Ser
rani
dae
Sig
anid
ae
Mea
n no
. fis
hes
per t
rans
ect 2005
2009
*
* *
Figure 8. Inter-annual variation in the mean abundance (± SE) of demersal reef fishes at Cartier Island. Four families (including Pomacentridae, not shown) exhibited statistically significant declines in abundance between years (T-test, α< 0.05) as indicated by “*”.
Aside from declines in abundance of several families of fishes at Cartier Reef,
the spatial and temporal patterns of abundance for demersal reef fishes were fairly
consistent between 2005 and 2009. The only significant changes apparent from
rigorous parametric analyses (ANOVA, Appendix 1) of individual families were:
i) Acanthuridae - There was an interaction between Year, Depth and Site, whereby
spatial patterns of abundance are different between years, but there was no overall
change in abundance between years.
ii) Chaetodontidae - There was significant variation between depth Sites, whereby
butterflyfishes are generally more abundant on the reef slope compared to the reef
crest. This is contrary to patterns of abundance recorded elsewhere (e.g., Pratchett and
Page 27

Berumen 2008), but densities on the reef crest may increase as coral cover continues
to recover (discussed later).
iii) Pomacentridae – There was an interaction between Year, Depth and Site,
attributable to declines in abundance of Pomacentridae at sites 1, 2 and 6 (as
discussed previously).
iv) Scaridae – There was an interaction between Year, Depth and Site, attributable to
declines in abundance of Scaridae on the reef crest at Cartier, whereas densities were
constant elsewhere.
v) Serranidae - There was an interaction between Year, Depth and Site, whereby
spatial patterns of abundance are different between years, but there was no overall
change in abundance between years.
4.1.4 Size spectra analysis for demersal reef fishes
Total length was estimated for a total of 13,590 individual fishes across all sites
at both Ashmore and Cartier Reef (Table 4). As expected, the reef fish community was
dominated by small fishes. More than 90% of all fishes surveyed were less than 25cm
total length. even though we did not sample many of the smallest fish species (blennies
and gobies). Fishing is expected to further reduce the number of large fishes, thereby
leading to a steeper size-spectra. The slope of the size-spectra for all sites combined
was -0.23 (Figure 9), which is towards the upper end of slopes recorded among
relatively remote islands of Fiji with moderate fishing pressure (Graham et al. 2005).
This suggests that there is evidence of fishing impacts in the size structure of the fish
communities, but this data will be most useful in comparing to comparable data
collected during subsequent surveys at Ashore and Cartier Reefs, as well as in other
Commonwealth Marine Reserves around Australia.
Page 28

Table 4. Total number of fishes assigned to each size class based on comprehensive surveys of reef fish communities at 8 sites across both Ashmore and Cartier Reef
Size Class Frequency Cumulative % ≤5cm 6558 48.26% 6-10cm 2550 67.02% 11-15cm 1577 78.62% 16-20cm 1090 86.64% 21-25cm 1003 94.03% 26-30cm 239 95.78% 31-35cm 198 97.24% 36-40cm 124 98.15% 41-45cm 168 99.39% 46-50cm 40 99.68% 51-55cm 17 99.81% 56-60cm 16 99.93% >60cm 10 100.00% TOTAL 13590
y = -0.2304x + 2.3454
0
0.5
1
1.5
2
2.5
3
3.5
4
4.5
-6 -3 0 3 6
Centred size classes
Log(
frequ
ency
)
Figure 9. Size-spectra relationship for entire fish community surveyed across 8 replicate sites at Ashmore and Cartier Reef.
Page 29

4.1.5 Densities of coral reef sharks
Only 11 sharks were observed (7 whitetip reef sharks; Triaenodon obesus, and
4 grey reef sharks; Carcharhinus amblyrhynchos) during 24 (3 transects at each of 8
sites) replicate 10,000-m2 transects conducted along the reef front. This corresponds to
an overall density of 0.29 (± 0.13 SE) sharks per hectare for whitetip reef sharks, and
0.17 (± 0.09 SE) sharks per hectare for grey reef sharks. These densities are very
similar to those reported by Robbins et al. (2006) for regions of the Great Barrier Reef
that are open to fishing (Figure 10). While there is no baseline data on shark densities
from Ashmore and Cartier reefs it would be presumed that previous densities would
have resembled those of Cocos (Keeling) islands, where both grey reef sharks and
whitetip reef sharks are 4-5 time more abundant. This suggests that shark fishing has
significantly depleted the shark populations within the vicinity of Ashmore and Cartier
Reefs, much as it has throughout most of the Great Barrier Reef (Figure 10).
0
0.5
1
1.5
2
2.5
3
Cocos(Keeling)
No-Entry(GBR)
No-take(GBR)
Limited-fishing(GBR)
Open-Fishing(GBR)
Ashmore &Cartier
Mea
n no
. sha
rks
per h
ecta
re whitetip reef sharksgrey reef shark
Figure 10. Densities of reef sharks along reef fronts at Cocos (Keeling) Islands and throughout the Great Barrier Reef (GBR) in different management zones, to compare against overall densities recorded at Ashmore and Cartier Reefs. Data from Cocos (Keeling) and the GBR was extracted from Robbins et al (2006), which used similar survey methods to those which were used at Ashmore and Cartier Reefs.
Page 30

Densities of sharks reported in 2009 are not statistically different from densities
reported in 2005 (Kospartov et al. 2006), though the large variance (due to limited
replication) in the 2005 estimates limit the ability to detect any meaningful changes in
abundance. The current technique (although reasonably well replicated; n = 3 per site)
may also suffer the same problems. While densities of sharks recorded using replicate
transects are consistent with similar studies conducted elsewhere, it is questionable
whether these techniques will provide necessary resolution to detect any further
declines in shark populations. Two problems emerge when trying to sample large
fishes along visual transects: i) inherently low densities mean that there will nearly
always be very large variance in transect-based counts, ii) it is unclear to what extent
sharks may actively avoid, or be attracted to, divers in the water, and this may
significantly affect estimates of shark densities.. Novel sampling techniques, such as
baited video, may overcome issues associated with diver presence and reveal the high
diversity of reef-associated sharks (Meekan and Cappo 2004), and thereby provide
better methods to monitor sharks assemblages with the Ashmore Reef National Nature
Reserve and Cartier Island Marine Reserves.
4.1.6 Sea snakes
Only two species of Sea Snake were recorded in the current survey (Olive Sea
Snake Aipyurus laevis and Turtle-headed Sea Snake Emydocephalus annulatus)
despite 13 species of Sea Snake reported to occur in the Reserves (Wilson and Swan,
2004). The overall density of Sea Snakes recorded across all sites and zones in 2009
was also much lower than that recorded in 2006 (Figure 11). These findings are
consistent with other research that reports significant recent declines in the abundance
and diversity of Sea Snakes in the Reserves (M. Guinea pers. comm.), though the
reason for these declines in unknown. It is important to note that Sea Snakes were only
recorded anecdotally on the 2006 and 2009 surveys and on-going dedicated surveys
are strongly recommended.
Page 31

0
1
2
3
4
5
6
7
2006 2009
Mea
n no
. of i
ndiv
idua
ls p
er h
ecta
re
Figure 11. Comparison of mean density (+SE) of Sea Snakes recorded across all survey sites at Asmore Reef in 2006 (Kospartov et al. 2006) and 2009 (the present study).
Page 32

Plate 1. Fishes and reptiles in the Reserves. A). Cymothoid Isopod on Pomacentrus vaiuli B). Neoglyphidodon oxyodon C). Chaetodon punctatofasciatus, D). Pterois volitans – lionfish E). Premnas biaculeatus on Entacmea quadricolor, F) Stegastoma fasciatum – Leopard Shark G). Pseudoanthias tuka on Tubipora musica H). Rare species of Wobbegong - Orectolobus wardi. I). Aipysurus laevis – Olive Sea Snake
Page 33

4.2 Commercially important invertebrates
4.2.1 Holothurians
Eleven species of holothurian were recorded at Cartier Island and Ashmore
Reef during the most recent biological survey in 2009, including one undescribed
species (See Plate 2 A & B). Nine species previously reported from within the Reserves
were not encountered in the present survey (Figure 12), though sampling during this
study was restricted to consolidated reef frameworks. Sampling for this study was
intentionally restricted to permanent sites which are mostly sighted in areas of
contiguous reef matrix, suitable for surveying reef-associated fauna and flora.
Consequently, limited sampling was conducted in sandy areas of the lagoon where
many holothurian species are known to reside. Even so, 151 holothurians were
counted across the 24 transects, of which the most commonly encountered species
were Holuthuria atra (82 individuals) and Pearsonothuria graeffei (29 individuals).
Mean densities of holothurians were higher at Ashmore Reef than Cartier Island
sites, even when comparing comparable reef habitats (exposed reef crests and
slopes). In the shallow reef crest and lagoon habitat, only four species were
encountered (Figure 13). At the southern and south-western shallow sites H. atra was
recorded in high numbers and was surprisingly absent on all deep transects with the
exception of the SW Ashmore site (Figure 13). All eleven species occurred in the deep
reef slope and lagoonal habitat, albeit in low numbers. P. graeffei was the most
commonly recorded holothurian in the deep habitat but importantly, this species also
reached similar densities in the shallow habitat. Two species considered of high
market value (H. nobilis and H. fuscogilva) were very rare in the Reserves. Three other
species considered of medium market value (Stichopus chloronotus, Thelenota ananas
and Actinopyga miliaris) were also recorded in low numbers at only a single deep site
with the exception of S. chloronotus, which reached comparatively higher density in the
shallow habitat at South Cartier Island. The new unidentified species was recorded in
the deep habitat of Ashmore lagoon, but only a single individual was observed.
High-density aggregations of H. leucospilota recorded in 2005 and 2006
surveys were not encountered, however the eastern lagoon where this aggregation
was recorded, was not surveyed in the present study. H. coluber was recorded in 2006
Page 34

on intertidal lagoon walks but this habitat was not examined in the present survey. An
additional seven species were not encountered in the present survey and this is most
likely because surveys were conducted at monitoring sites only, enabling only a subset
of habitat types to be surveyed.
0
10
20
30
40
50
60
70
80
90
H. a
tra
P. g
raef
fei
S. c
hlor
onot
us
H. e
dulis
H. n
obilis
S. h
erm
anni
B. a
rgus
H. f
usco
gilv
a
T. a
nana
s
A. m
iliaris
Uni
dent
ified
H. l
euco
spilo
ta
T. a
nax
A. m
aurit
iana
H. f
usco
punc
tata
B. m
arm
orat
a
A. l
ecan
ora
H. t
iman
a
H. c
olub
er
H. f
usco
rubr
a
Holothurian species
Tota
l num
ber o
f ind
ivid
uals
Figure 12. Total number of individuals of each species of holothurian known to exist in the Reserves. Species are presented in order of decreasing abundance. Species with no data were not encountered in the present survey.
Page 35

Figure 13. Mean number (±SE) of holothurians per hectare within shallow reef crest or deeper reef slopes at sites across Cartier Island and Ashmore Reef (sites 3-8). All other holothurian species were only recorded on the reef slope.
The assemblage of holothurians in the Reserves is spatially and temporally
dynamic. In 2005, 16 species of holothurians were recorded at survey sites and two
other species were detected outside survey sites. In 2006, 14 species of holothurian
were recorded on transects (13 species were present in shallow habitat and 10 present
in deep habitat) and again, two additional species were detected in other habitats. In
H. nobilis (whitmaei)
02468
1012
1 2 3 4 5 6 7 8
H. atra
020406080
100120140
1 2 3 4 5 6 7 8
CrestM
ean
no. p
er h
ecta
re
Slope
S. chloronotus
0
5
10
15
20
25
1 2 3 4 5 6 7 8
B. graeffei
05
101520253035
1 2 3 4 5 6 7 8
Mea
n no
. per
hec
tare
H. edulis
05
1015202530
1 2 3 4 5 6 7 8
S. hermanni
0
2
46
8
10
12
1 2 3 4 5 6 7 8
ctar
eM
ean
no. p
er h
e
Page 36

the current survey, only 11 species were encountered on transects at survey sites,
while there was no sampling of diverse habitats that were considered in 2005.
The density of holothurians recorded in 2009 was lower than recorded
previously in 2005 and 2006 (Figure 14). The high density of holothurians recorded at
survey sites in 2006 was driven largely by the aggregation of H. edulis recorded at the
deep East Ashmore site. While a smaller aggregation of the same species was present
at the same site in 2005, this species was recorded in far lower density in 2009. When
compared in detail with 2006 survey results, there have been marked declines in both
the diversity and density of holothurians at both shallow and deep survey sites (Table
6). Overall densities of holothurians are significantly lower now compared to 2005
(ANOVA, Table 5), and much lower than reported in 2006 (Figure 14). For example S.
chloronotus was found in relatively high density in 2006 however in the present survey
its density has declined to zero at most sites. Further three other species recorded in
low density in 2006 (T. anax, H. coluber, H. fuscopunctata) were not detected in
present surveys. A substantial increase in the density of H. atra was recorded in the
shallow habitat at Southern Ashmore sites and the density of P. graeffei while
decreasing at exposed sites, increased in the lagoon. H. nobilis was detected for the
first time in both deep and shallow habitats at the East Ashmore site.
0
10
20
30
40
50
60
70
2005 2006 2009
Years
No.
of i
ndiv
idua
ls p
er h
ecta
re
Figure 14. Mean density of holothurians (+SE) at survey sites in 2005, 2006 and 2009. 2006 data is relevant to Ashmore Reef only.
Page 37

Page 38
Table 5. ANOVA for total abundance of a) holothurians, b) trochus and c) clams, testing for variation between years (2005 and 2009), between depth zones, and among sites at Ashmore Reef and Cartier Island. Count data was log transformed to improve normality.
a) Holothurians
Source df MS F Sig.
Years 1 22.05 105.21 0.00
Site 7 3.23 15.40 0.00
Zone 1 0.43 2.05 0.16
Year * Site 7 2.18 10.41 0.00
Year * Zone 1 0.46 2.20 0.14
Site * Zone 7 1.23 5.89 0.00
Year * Site * Zone 7 0.96 4.57 0.00
b) Trochus
Source df MS F Sig.
Years 1 23488 5.34 0.05
Site 7 4492.1 0.96 0.53
Zone 1 3378.7 2.30 0.17
Year * Site 7 4440.1 3.64 0.06
Year * Zone 1 2341.9 1.93 0.21
Site * Zone 7 1476.3 1.21 0.40
Year * Site * Zone 7 1218.6 1.55 0.16
c) Clams
Source df MS F Sig.
Years 1 3.02 9.59 0.00
Site 7 1.41 4.46 0.00
Zone 1 0.60 1.89 0.17
Year * Site 7 0.29 0.94 0.48
Year * Zone 1 0.27 0.84 0.36
Site * Zone 7 0.43 1.37 0.23
Year * Site * Zone 7 0.23 0.72 0.65

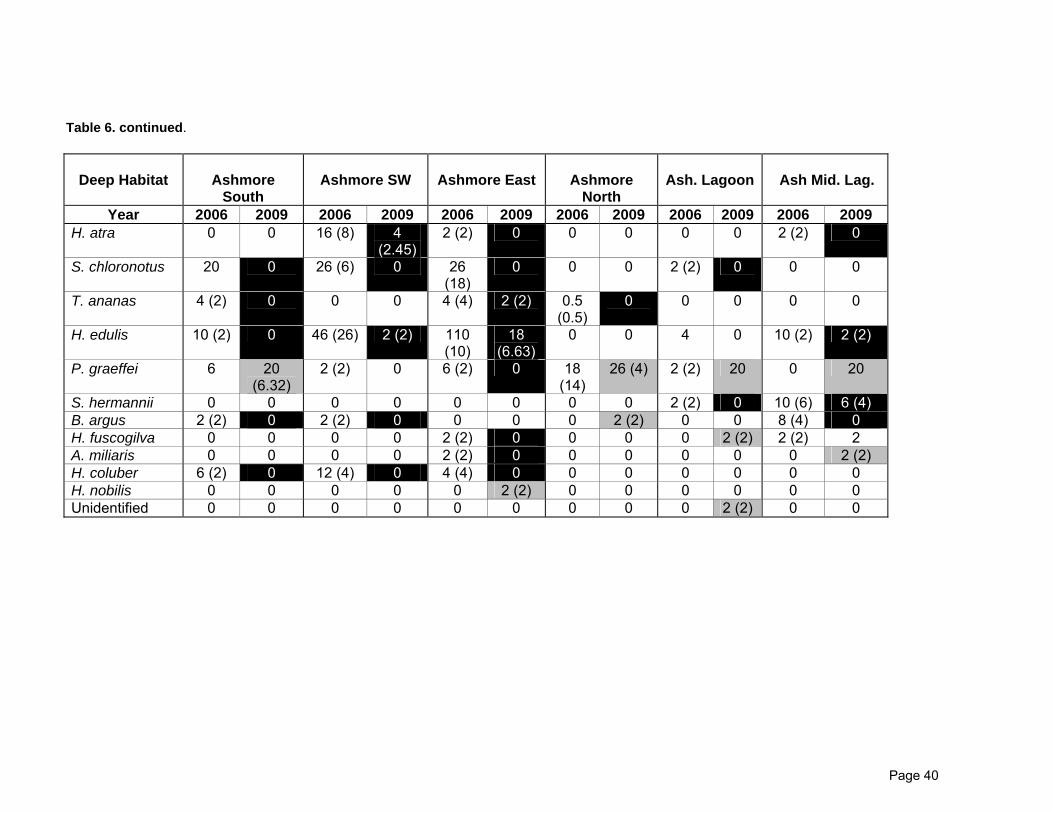
Table 6. Comparisons of the density (individuals per hectare) of holothurian species on transects between 2006 and 2009. Standard errors are given in brackets. Figures for Cartier Island are not presented because Cartier was not surveyed in 2006. Black cells indicates a decrease in density, grey cells indicates an increase in density.
Shallow Habitat
Ashmore
South
Ashmore SW
Ashmore East
Ashmore
North
Ash. Lagoon
Ash Mid. Lag.
Year 2006 2009 2006 2009 2006 2009 2006 2009 2006 2009 2006 2009 H. atra 0 96
(29.76) 16 (16) 56
(11.66)4 (4) 0 0 0 0 0 4 (4) 0
S. chloronotus 14 (6) 0 28 (12) 0 2 (2) 2 (2) 0 4 (2.45)
4 (2) 0 0 0
T. ananas 2 (2) 0 0 0 0 0 0 0 2 0 4 0 H. edulis 0 0 2 (2) 0 20 (8) 0 6 (2) 0 0 0 14 (2) 0 T. anax 0 0 0 0 0 0 0 0 0 0 2 (2) 0 P. graeffei 28 (4) 0 0 0 8 (4) 0 78
(10) 20 0 20 0 20
S. hermannii 0 0 2 (2) 0 0 0 0 0 0 0 6 (2) 0 A. mauritiana 0 0 8 (8) 0 0 0 0 0 0 0 0 0 H. fuscopunctata
0 0 0 0 0 0 0 0 4 0 0 0
B. argus 0 0 0 0 0 0 0 0 0 0 4 0 H. fuscogilva 0 0 0 0 0 0 0 0 0 0 6 (2) 0 A. lecanora 2 (2) 0 0 0 2 0 0 0 0 0 0 0 H. coluber 4 0 0 0 0 0 0 0 0 0 2 (2) 0 H. nobilis 0 0 0 0 0 6 (4) 0 0 0 0 0 0
Page 39
Page 40
Table 6. continued.
Deep Habitat
Ashmore
South
Ashmore SW
Ashmore East
Ashmore
North
Ash. Lagoon
Ash Mid. Lag.
Year 2006 2009 2006 2009 2006 2009 2006 2009 2006 2009 2006 2009 H. atra 0 0 16 (8) 4
(2.45) 2 (2) 0 0 0 0 0 2 (2) 0
S. chloronotus 20 0 26 (6) 0 26 (18)
0 0 0 2 (2) 0 0 0
T. ananas 4 (2) 0 0 0 4 (4) 2 (2) 0.5 (0.5)
0 0 0 0 0
H. edulis 10 (2) 0 46 (26) 2 (2) 110 (10)
18 (6.63)
0 0 4 0 10 (2) 2 (2)
P. graeffei 6 20 (6.32)
2 (2) 0 6 (2) 0 18 (14)
26 (4) 2 (2) 20 0 20
S. hermannii 0 0 0 0 0 0 0 0 2 (2) 0 10 (6) 6 (4) B. argus 2 (2) 0 2 (2) 0 0 0 0 2 (2) 0 0 8 (4) 0 H. fuscogilva 0 0 0 0 2 (2) 0 0 0 0 2 (2) 2 (2) 2 A. miliaris 0 0 0 0 2 (2) 0 0 0 0 0 0 2 (2) H. coluber 6 (2) 0 12 (4) 0 4 (4) 0 0 0 0 0 0 0 H. nobilis 0 0 0 0 0 2 (2) 0 0 0 0 0 0 Unidentified 0 0 0 0 0 0 0 0 0 2 (2) 0 0

4.2.2 Trochus
A total of 38 individual trochus were encountered on transects, which surveyed a
total of 10 hectares, representing a mean density of 3.8 (+1.61 SE) individuals per hectare.
At the same sites in 2005, almost 14x more trochus were recorded with 528 individual
trochus encountered, at a mean density of 28.46 (+8.37 SE) individuals per hectare.
Clearly, there has been a significant decline in the abundance of trochus (ANOVA, Table
5B). In 2006, 261 individual trochus were encountered at the same Ashmore Reef sites
and the mean density was 39.0 (+17.52 SE) individuals per hectare (Figure 15). The
apparent decline in the number of trochus recorded on transects in the present survey is
alarming, but these results should be interpreted with caution because trochus are mobile
and tend to aggregate so it is possible that aggregations formally present at the survey
sites have moved. For example, in 2005 there was a high-density aggregation of trochus
on the reef slope at site 5 (on the east side of Ashmore reef), whereas in 2006 the largest
aggregation was detected on the reef crest at site 3. In the current survey 92% of trochus
individuals were recorded on the reef slope at site 3. It is conceivable, that these
aggregations located on different parts of the reef are ostensibly the same individuals.
The abundance of trochus has declined from 2005 to 2009, but it is important to
recognise that there appears to be considerable temporal variation in these populations.
From Ceccarelli et al. (2007) it is apparent that at the reef-wide level trochus mean
densities increased from 0.96 (±0.15 SE) individuals per hectare in 1999 to 37.7 (±6.7 SE)
individuals per hectare in 2005 (Ceccarelli et al., 2007). In 2009, mean densities are
approximately equivalent to densities recorded in 1999.
Page 41

0
10
20
30
40
50
60
2005 2006 2009Year
Mea
n no
. per
hec
tare
Figure 15. Mean density of trochus (+SE) at survey sites in 2005, 2006 and 2009. 2006 data is relevant to Ashmore Reef only.
The average basal shell width of trochus at survey sites in the current survey was
82.61 (+1.97 SE) (Figure 16). This is substantially larger than the mean basal width
recorded in 2005 and 2006 surveys however this result is driven by the lower variability in
mean trochus sizes in the current survey due to the absence of juvenile trochus (<55mm)
(Figure 17). In both 2005 and 2006 a large proportion of juveniles were recorded it the
shallow habitat at survey sites (Ceccarelli et al., 2007) however no juveniles were present
in the shallow habitat in the current survey despite thorough searching. As in previous
years, there is still a lack of large trochus individuals. While the largest proportion of
individual trochus occurs in the medium size category in the current survey, it is important
to note that this relates to a comparatively small number of individuals recorded on the reef
slope at site 3 (south side of Ashmore Reef) and may represent a single cohort.
Page 42

60
65
70
75
80
85
2005 2006 2009
Mea
n ba
sal s
hell
wid
th (m
m)
Figure 16. Mean trochus basal shell width in the Reserves in 2006 and 2009 (2006 data excludes Cartier Island).
0
5
10
15
20
25
30
35
40
<45
46-5
5
56-6
5
66-7
5
76-8
5
86-9
5
96-1
05
106-
115
116-
125
>126
Size class (mm)
Pro
porti
on o
f ind
ivid
uals
(%)
200520062009
Figure 17. Size frequency distribution of trochus recorded on transects in the Reserves in 2006 and 2009 (2006 data does not include Cartier Island).
Page 43
4.2.3 Clams
Tridacnid clams were surveyed along the same transects used to survey
holothurians and trochus. Five species of clam were counted (Hippopus hippopus,
Tridacna maxima, T. crocea, T, squamosa, and T. derasa), but no giant clams (T. gigas)
were encountered on transects. The mean density of clams at survey sites was 7.75
(+2.01 SE) individuals per hectare. Ashmore Reef supported a higher density of clams
than Cartier Island. Tridacna maxima was the most common species encountered in both
shallow and deep habitat, but the distribution of clams was very patchy on transects (as
indicated by the large error bars, Figure18). H. hippopus and T. crocea were only recorded
on the shallow reef crest or reef top (2-5 metres depth), while T. squamosa and T. derasa
were only recorded on the reef slope (8-10 metres depth)
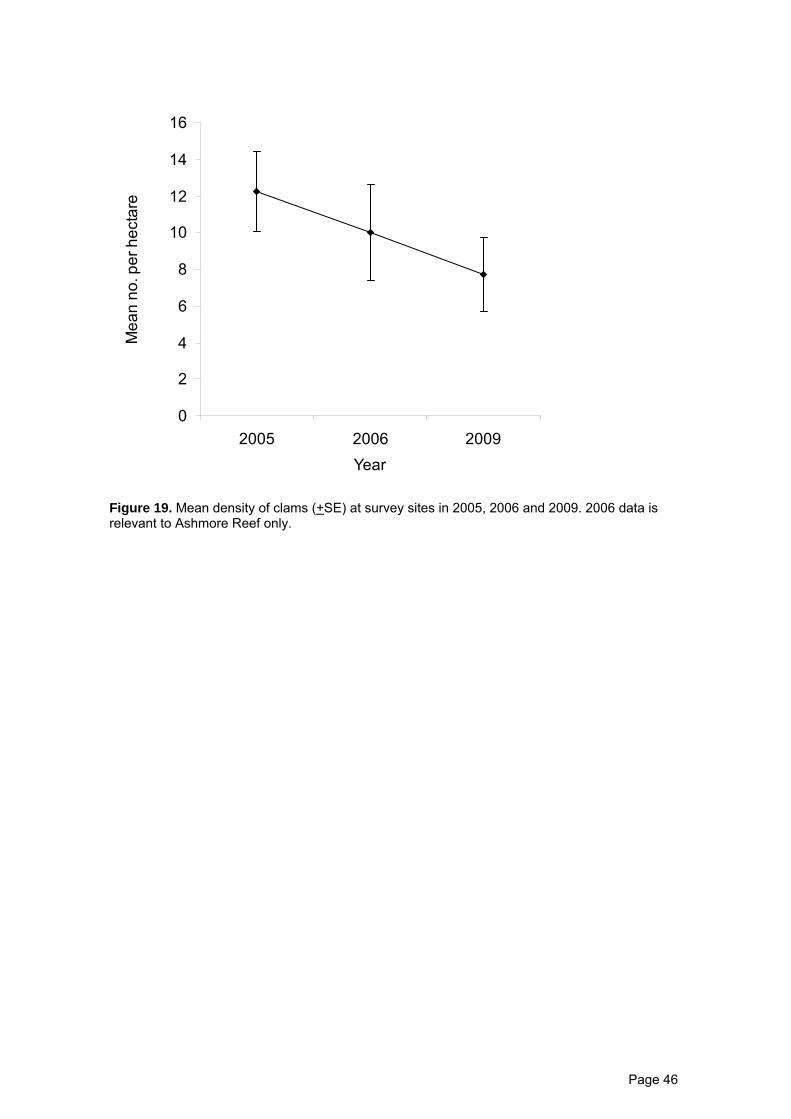
Overall densities of tridacnid clams recorded at survey sites in 2009 are
significantly lower than were recorded in 2005 for the exact same study sites (ANOVA,
Table 5), but also reflect a sustained decline in abundance since 2006 (Figure 19).
Declines in abundance are very consistent among sites (even at Cartier Reef). This rate of
decline indicates that exploitation of clams continues to occur in the Reserves and/or that
clam populations are experiencing elevated rates of mortality due to some other cause
(e.g. ocean warming or ocean acidification).
Page 44

Figure 18. Mean (± SE) density of clams on shallow reef crest (white bars) or deeper reef slopes (grey bars) at sites across Cartier Island (sites 1-2) and Ashmore Reef (sites 3-8).
Sites
Sites
T. maxima
0
5
10
15
20
25
1 2 3 4 5 6 7 8
T. crocea
00.5
11.5
22.5
33.5
44.5
1 2 3 4 5 6 7 8
Mea
n no
. per
hec
taree
hect
ar p
er
ean
no.
M
H. hippopus
0
2
4
6
8
10
12
14
1 2 3 4 5 6 7 8
Mea
n no
. per
hec
tare
T. squamosa
0123456789
1 2 3 4 5 6 7 8
Mea
n no
. per
hec
tare
T. derasa
0123456789
1 2 3 4 5 6 7 8
Mea
n no
. per
hec
tare
Page 45
0
2
4
6
8
10
12
14
16
2005 2006 2009Year
Mea
n no
. per
hec
tare
Figure 19. Mean density of clams (+SE) at survey sites in 2005, 2006 and 2009. 2006 data is relevant to Ashmore Reef only.
Page 46
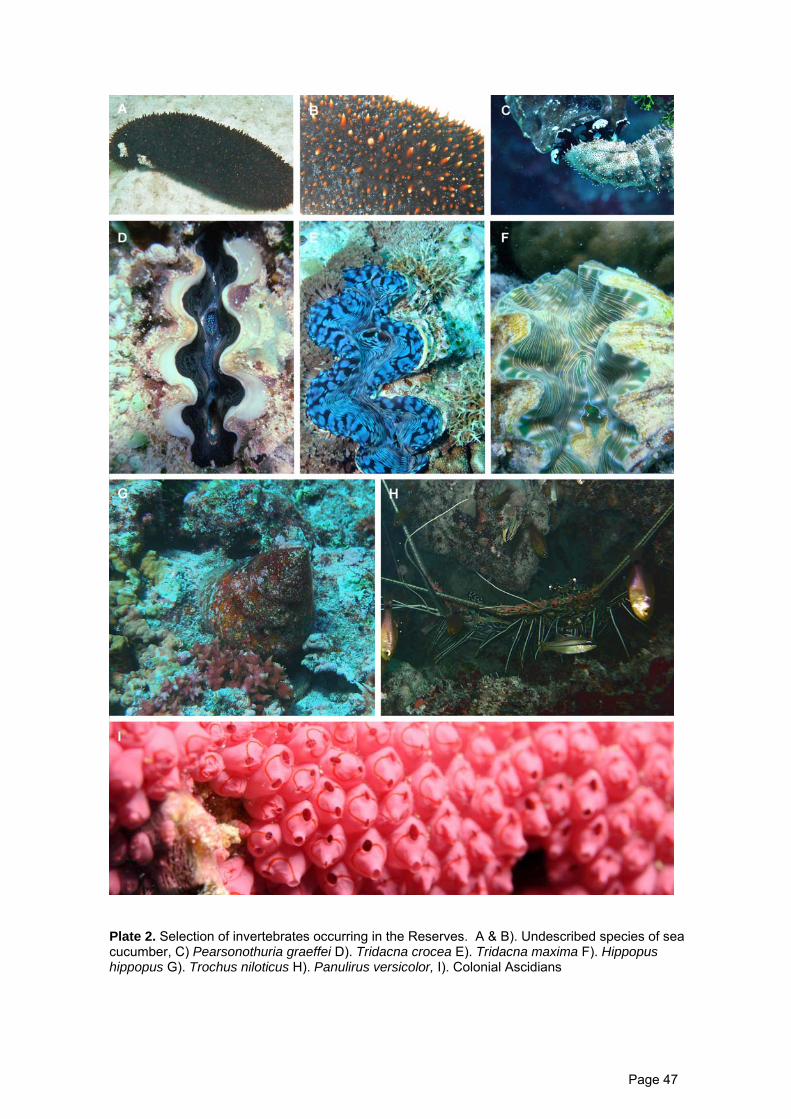
Plate 2. Selection of invertebrates occurring in the Reserves. A & B). Undescribed species of sea cucumber, C) Pearsonothuria graeffei D). Tridacna crocea E). Tridacna maxima F). Hippopus hippopus G). Trochus niloticus H). Panulirus versicolor, I). Colonial Ascidians
Page 47
4.3 Habitat structure
4.3.1 Hard coral cover
Mean cover of hard (scleractinian) corals across the 8 sites surveyed at Cartier
Island and Ashmore Reef was 26.25% (±1.5 SE), ranging from 18.2 (±2.8 SE) at site 8 in
the Ashmore lagoon, up to 31.3% (±4.0 SE) at site 3 on the south-west corner of Ashmore
Reef. Coral cover varied significantly among sites and between depth zones (ANOVA,
Table 7), but there was no consistent pattern of depth variation among sites (Figure 20). At
site 1 on the south side of Cartier Island, coral cover was the highest on the reef slope due
to a high abundance of Isopora colonies. In contrast, coral cover was higher on the reef
crest at site 2 (on the north side of Cartier), where there was high cover of corals from the
Family Pocilloporidae.
Table 7. ANOVA for hard coral cover, testing for differences between depth zones and among sites at Ashmore Reef and Cartier Island. Proportional cover of corals was arcsin(sqrt(x)) transformed to improve normality
Source df MS F Sig.
Site 7 0.03 3.37 0.01 Zone 1 0.01 0.45 0.51
Site * Zone 7 0.03 2.53 0.03 Error 32 0.01
Coral cover recorded in 2009 at Cartier Island and Ashmore reef was much higher
than has been recorded during the two previous surveys conducted in 1999 (Skewes et al.
1999) and 2005 (Kospartov et al. 2006). At Ashmore Reef, reef-wide cover of hard
(scleractinian) corals is now 29.4% (±1.8 SE), representing a 3-fold increase in percentage
cover since 2005, and more than 6-fold increase since 1999 (Figure 21). Area cover of soft
corals has also increased significantly over the same period up from 1.42% (±0.7 SE) in
1995 to 8.3% (±1.4 SE) in 2009. Cover of both hard and soft corals has increased steadily
at Cartier Island since 1999, but started from a higher base level and has not experienced
the same rate of increase (Figure 21).
Page 48
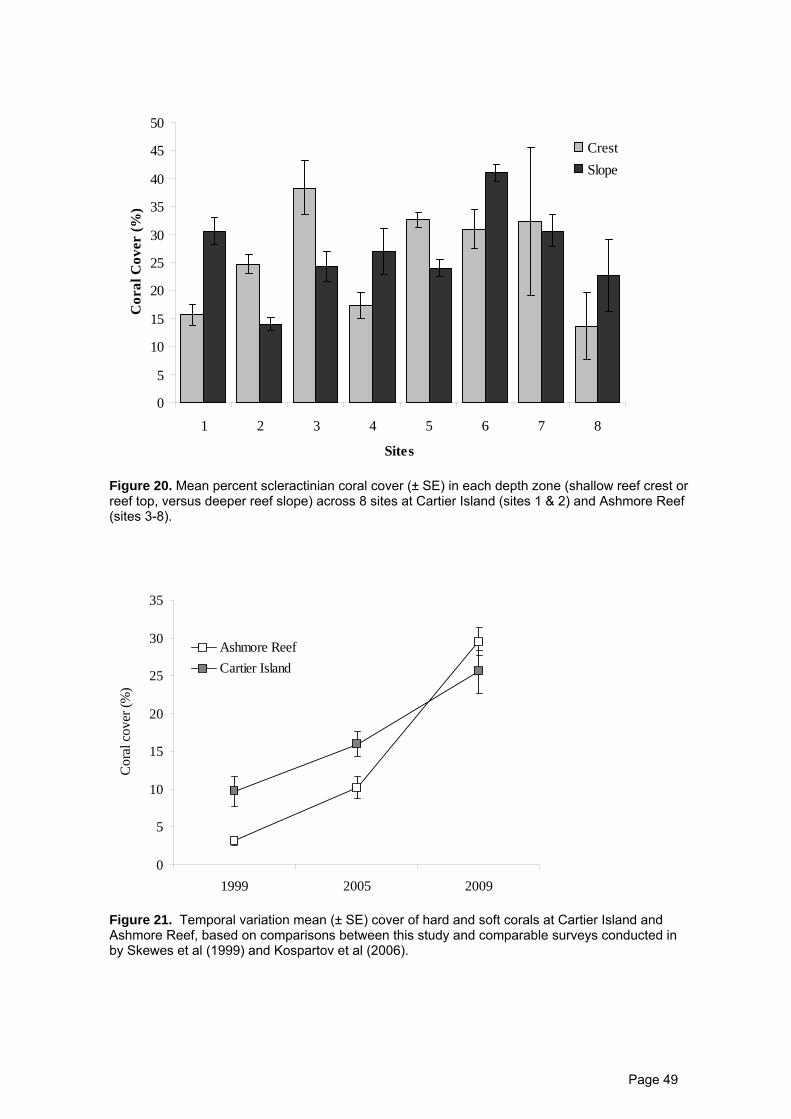
0
5
10
15
20
25
30
35
40
45
50
1 2 3 4 5 6 7 8
Sites
Cor
al C
over
(%)
CrestSlope
Figure 20. Mean percent scleractinian coral cover (± SE) in each depth zone (shallow reef crest or reef top, versus deeper reef slope) across 8 sites at Cartier Island (sites 1 & 2) and Ashmore Reef (sites 3-8).
0
5
10
15
20
25
30
35
1999 2005 2009
Cor
al c
over
(%)
Ashmore ReefCartier Island
Figure 21. Temporal variation mean (± SE) cover of hard and soft corals at Cartier Island and Ashmore Reef, based on comparisons between this study and comparable surveys conducted in by Skewes et al (1999) and Kospartov et al (2006).
Page 49

Shallow reef habitat (3-5m depth)
0
5
10
15
20
25
30
35
40
45
50
CartierSouth
CartierNorth
AshmoreSouth
AshmoreSW
AshmoreEast
AshmoreNorth
Ashmorelagoon
Ashmoremiddlelagoon
Mean
hard
co
ral
cover
(+S
E)
2005 2009
Deep reef habitat (8-10m depth)
0
5
10
15
20
25
30
35
40
45
CartierSouth
CartierNorth
AshmoreSouth
AshmoreSW
AshmoreEast
AshmoreNorth
AshmoreLagoon
Ashmoremiddlelagoon
Mean
hard
co
ral
cover
(+S
E)
2005 2009
Figure 22. Temporal comparison of hard coral cover for i) the reef crest and ii) the reef slope, comparing coral cover recorded in 2009 to comparable data from surveys undertaken by Kospartov et al (2006).
Sustained increases in coral cover since 1999 are suggestive of coral recovery in
the aftermath of the 1998 coral bleaching events. Coral cover typically takes 5-10 years to
Page 50

recover following major disturbances (e.g., Halford et al. 2004), but this will depend on the
local abundance of corals and availability of brood stock in the aftermath of the
disturbance. In 2005, there was a general absence of new recruits and large colonies and
also a high proportion of dead coral (Kospartov et al, 2006). Whilst there is still a lack of
large colonies, it is evident that 2006/2007 were successful years for coral recruitment
especially within the families Acroporidae and Pocilliporidae.
4.3.2 Coral composition
The relative abundance of different coral genera varied significantly between depth
zones and among sites at Ashmore Reef and Cartier Island (Figure 23, Table 8), but there
were no consistent differences between zones. The reef crest communities at site 2 (at
Cartier Island) were among the most unique, characterised by very high cover of
Stylophora. Elsewhere, coral communities tended to be dominated by Acropora and/ or
Seriatopora. Variation in coral composition may occur due to stochastic variation in
recruitment patterns, but may also reflect differences in the successional stages of
recovery at different sites. Ongoing monitoring of community structure is critical to test for
potential changes due to differential susceptibility to major disturbances.
Table 8. MANOVA for community structure of hard corals (based on the 10 most abundant genera), testing for differences between depth zones and among sites at Ashmore Reef and Cartier Island. Proportional cover of corals was arcsine(square-root(x)) transformed to improve normality.
Effect Value F Hypothesis df Error df Sig.
Site 3.982 3.82 70.0 203.0 0.00
Zone 0.665 4.56 10.0 23.0 0.01
Site * Zone 3.195 2.43 70.0 203.0 0.00
Page 51
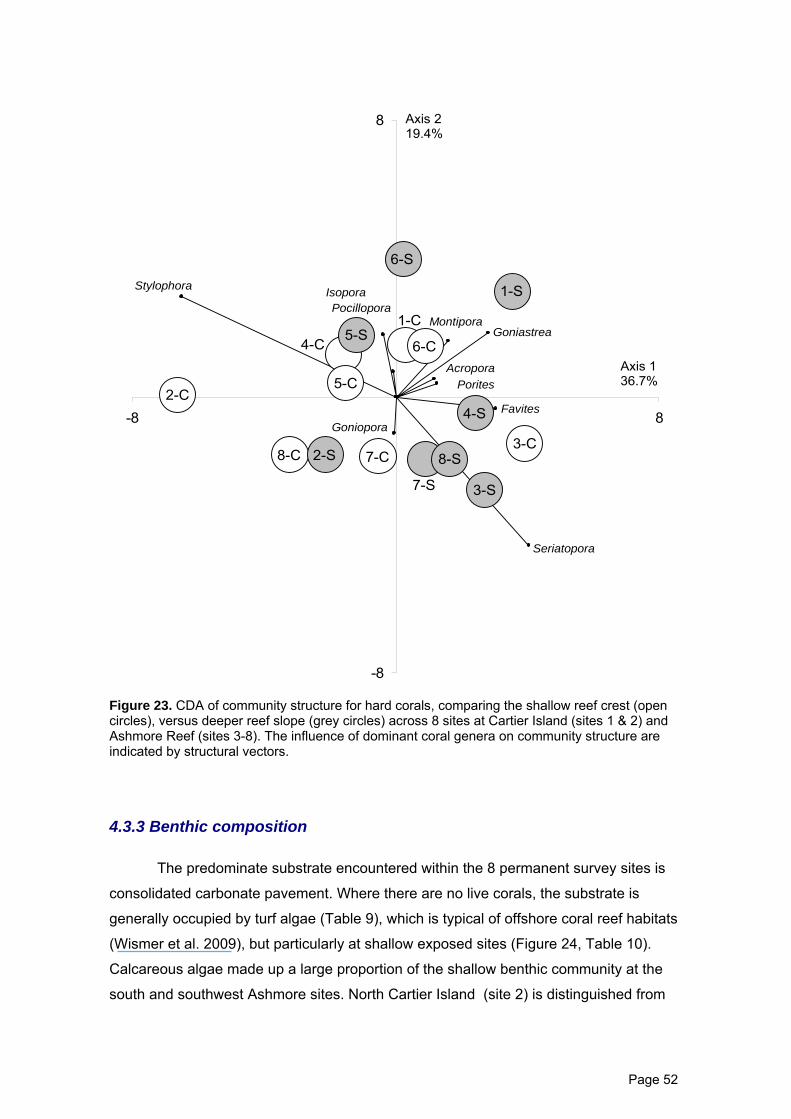
-8
8
-8 8
Axis 2 19.4%
Axis 1 36.7%
1-C
2-C
3-C
4-C
5-C
6-C
7-C8-C 2-S
3-S
4-S
5-S
6-S
7-S
8-S
1-S
Goniopora
Acropora Porites
Seriatopora
Isopora
Montipora Pocillopora
Stylophora
Favites
Goniastrea
Figure 23. CDA of community structure for hard corals, comparing the shallow reef crest (open circles), versus deeper reef slope (grey circles) across 8 sites at Cartier Island (sites 1 & 2) and Ashmore Reef (sites 3-8). The influence of dominant coral genera on community structure are indicated by structural vectors.
4.3.3 Benthic composition
The predominate substrate encountered within the 8 permanent survey sites is
consolidated carbonate pavement. Where there are no live corals, the substrate is
generally occupied by turf algae (Table 9), which is typical of offshore coral reef habitats
(Wismer et al. 2009), but particularly at shallow exposed sites (Figure 24, Table 10).
Calcareous algae made up a large proportion of the shallow benthic community at the
south and southwest Ashmore sites. North Cartier Island (site 2) is distinguished from
Page 52
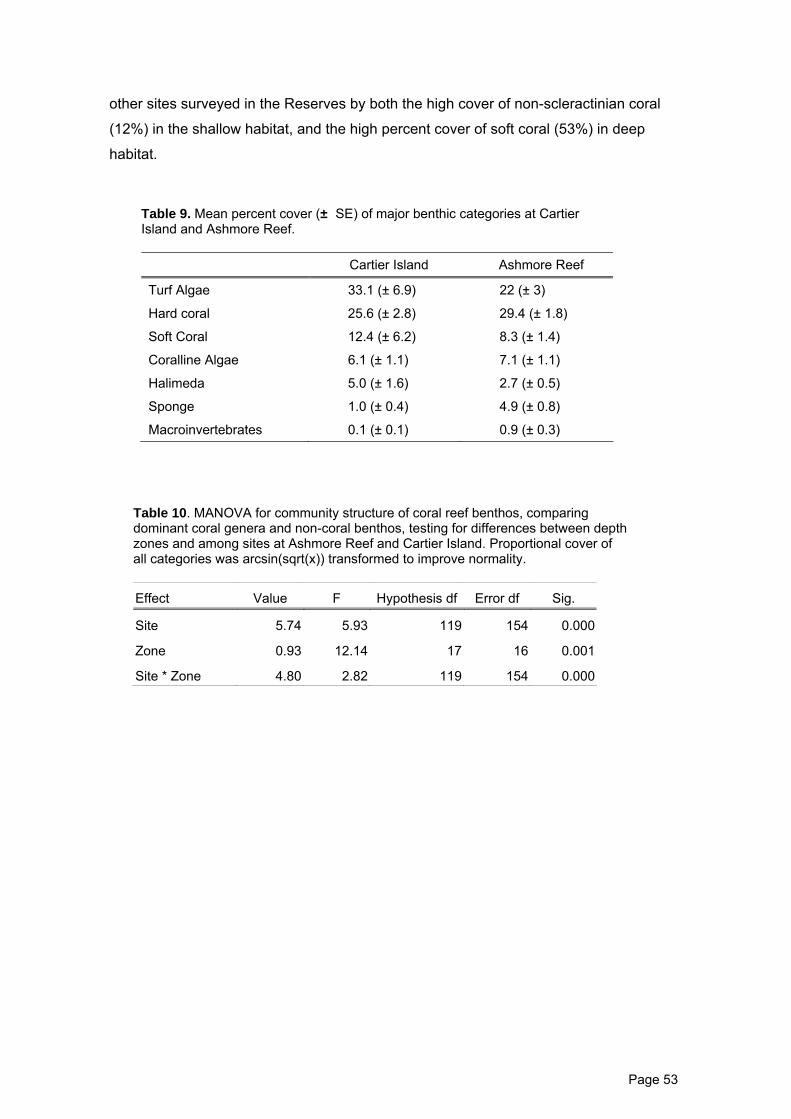
other sites surveyed in the Reserves by both the high cover of non-scleractinian coral
(12%) in the shallow habitat, and the high percent cover of soft coral (53%) in deep
habitat.
Table 9. Mean percent cover (± SE) of major benthic categories at Cartier Island and Ashmore Reef.
Cartier Island Ashmore Reef
Turf Algae 33.1 (± 6.9) 22 (± 3)
Hard coral 25.6 (± 2.8) 29.4 (± 1.8)
Soft Coral 12.4 (± 6.2) 8.3 (± 1.4)
Coralline Algae 6.1 (± 1.1) 7.1 (± 1.1)
Halimeda 5.0 (± 1.6) 2.7 (± 0.5)
Sponge 1.0 (± 0.4) 4.9 (± 0.8)
Macroinvertebrates 0.1 (± 0.1) 0.9 (± 0.3)
Table 10. MANOVA for community structure of coral reef benthos, comparing dominant coral genera and non-coral benthos, testing for differences between depth zones and among sites at Ashmore Reef and Cartier Island. Proportional cover of all categories was arcsin(sqrt(x)) transformed to improve normality.
Effect Value F Hypothesis df Error df Sig.
Site 5.74 5.93 119 154 0.000
Zone 0.93 12.14 17 16 0.001
Site * Zone 4.80 2.82 119 154 0.000
Page 53
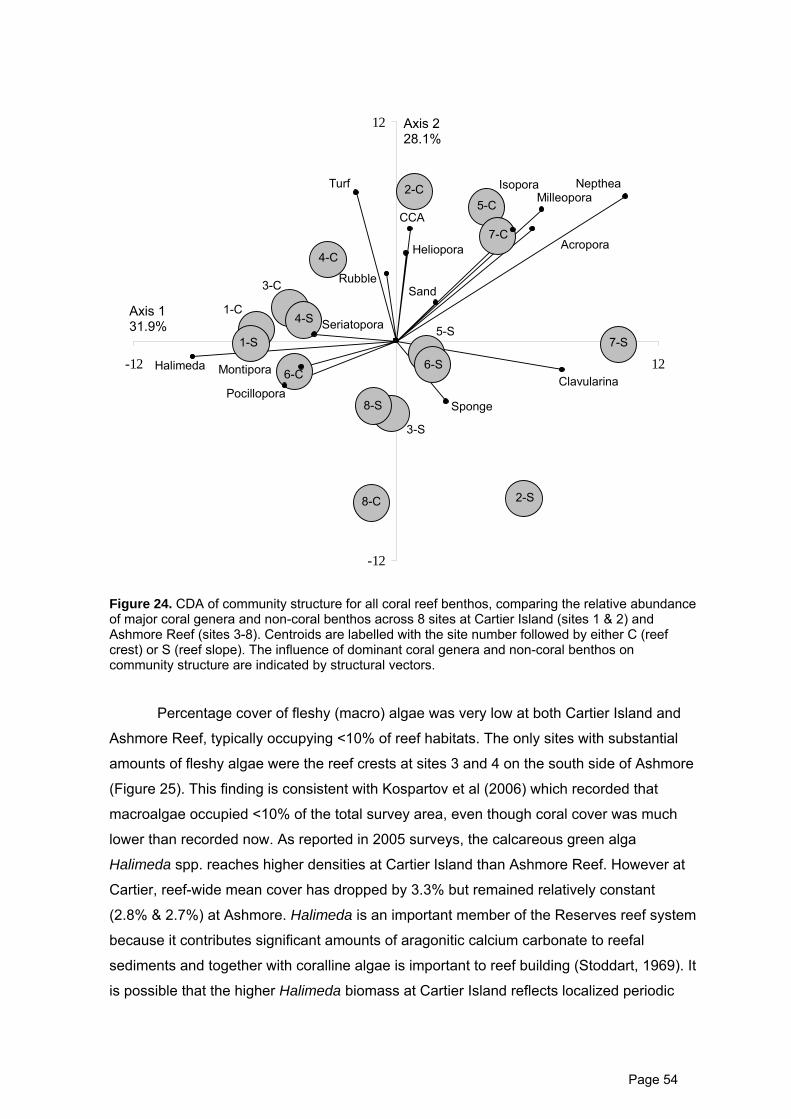
-12
12
-12 12
Nepthea
Halimeda
Pocillopora
Montipora
Seriatopora
Rubble
Sponge
Clavularina
Milleopora
CCA
Acropora
Isopora
Sand
Heliopora
Turf
1-C
1-S
2-C
2-S
3-C
3-S
4-C
4-S
5-C
5-S
6-C 6-S
7-C
7-S
8-C
8-S
Axis 2 28.1%
Axis 1 31.9%
Figure 24. CDA of community structure for all coral reef benthos, comparing the relative abundance of major coral genera and non-coral benthos across 8 sites at Cartier Island (sites 1 & 2) and Ashmore Reef (sites 3-8). Centroids are labelled with the site number followed by either C (reef crest) or S (reef slope). The influence of dominant coral genera and non-coral benthos on community structure are indicated by structural vectors.
Percentage cover of fleshy (macro) algae was very low at both Cartier Island and
Ashmore Reef, typically occupying <10% of reef habitats. The only sites with substantial
amounts of fleshy algae were the reef crests at sites 3 and 4 on the south side of Ashmore
(Figure 25). This finding is consistent with Kospartov et al (2006) which recorded that
macroalgae occupied <10% of the total survey area, even though coral cover was much
lower than recorded now. As reported in 2005 surveys, the calcareous green alga
Halimeda spp. reaches higher densities at Cartier Island than Ashmore Reef. However at
Cartier, reef-wide mean cover has dropped by 3.3% but remained relatively constant
(2.8% & 2.7%) at Ashmore. Halimeda is an important member of the Reserves reef system
because it contributes significant amounts of aragonitic calcium carbonate to reefal
sediments and together with coralline algae is important to reef building (Stoddart, 1969). It
is possible that the higher Halimeda biomass at Cartier Island reflects localized periodic
Page 54

upwellings of nutrient rich water that stimulates productivity (see Andrews and Gentien
1982).
0%
20%
40%
60%
80%
100%1
- Cre
st
1 - S
lope
2- C
rest
2- S
lope
3- C
rest
3- S
lope
4 - C
rest
4 -
Slo
pe
5 - C
rest
5 - S
lope
6 - C
rest
6 - S
lope
7 - C
rest
7 - S
lope
8 - C
rest
8 - S
lope
Med
ian
Per
cent
Ben
thic
Cov
er
Scleractinian coral Non-scleractinian coral Soft coralSponge Turf Algae Coralline AlgaeHalimeda Other Algae MacroinvertebratesAbiotic
Figure 25. Proportional composition of major habitat categories within each depth zone across 8 sites at Cartier Island (sites 1 & 2) and Ashmore Reef (sites 3-8)
Soft coral cover (Order Alcyonacea) was an important component of the benthic
cover at some sites at Cartier and Ashmore Reefs, where it accounted for >20% and up to
50% of benthic cover. Cover of soft coral was highest on the reef slope at site 2 (north
Cartier Island) but was completely absent from transects conducted at the South Cartier
site (Figure 25). At Ashmore Reef, soft coral was more prevalent on the reef slope and
was most abundant at site 7 in Ashmore lagoon (Figure 25). Thirteen types of soft coral
were recorded on point-intercept transects. At Cartier Island, Clavularia was the dominant
soft coral taxon, whilst at Ashmore Reef Isis hippuris was the most commonly recorded
taxon (Figure 26). Briarium and Sinularia were recorded from Cartier Island only and
Klyxum and Pinnigorgia were recorded from Ashmore Reef only. Ten taxa of soft coral
recorded during 2005 surveys were not encountered in the current survey. Some taxa
were observed off transects, e.g. Xenia.
Page 55
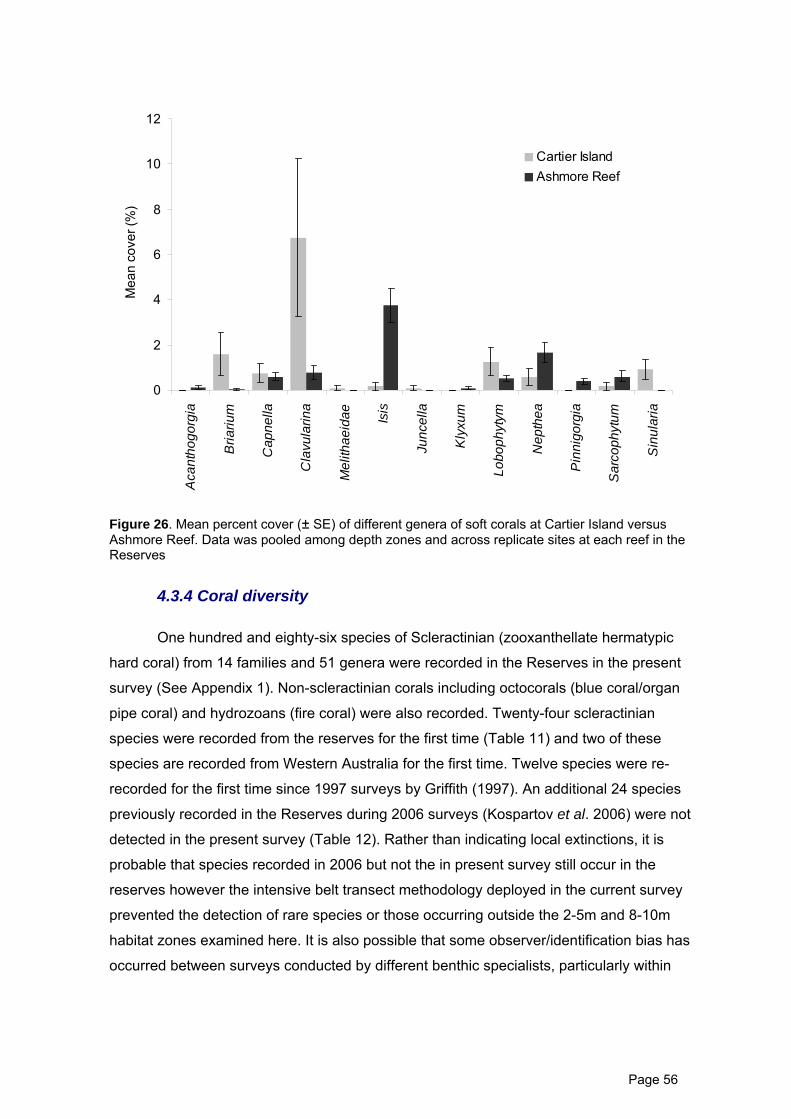
0
2
4
6
8
10
12
Aca
ntho
gorg
ia
Bria
rium
Cap
nella
Cla
vula
rina
Mel
ithae
idae Isis
Junc
ella
Kly
xum
Lobo
phyt
ym
Nep
thea
Pin
nigo
rgia
Sar
coph
ytum
Sin
ular
ia
Mea
n co
ver (
%)
Cartier IslandAshmore Reef
Figure 26. Mean percent cover (± SE) of different genera of soft corals at Cartier Island versus Ashmore Reef. Data was pooled among depth zones and across replicate sites at each reef in the Reserves
4.3.4 Coral diversity
One hundred and eighty-six species of Scleractinian (zooxanthellate hermatypic
hard coral) from 14 families and 51 genera were recorded in the Reserves in the present
survey (See Appendix 1). Non-scleractinian corals including octocorals (blue coral/organ
pipe coral) and hydrozoans (fire coral) were also recorded. Twenty-four scleractinian
species were recorded from the reserves for the first time (Table 11) and two of these
species are recorded from Western Australia for the first time. Twelve species were re-
recorded for the first time since 1997 surveys by Griffith (1997). An additional 24 species
previously recorded in the Reserves during 2006 surveys (Kospartov et al. 2006) were not
detected in the present survey (Table 12). Rather than indicating local extinctions, it is
probable that species recorded in 2006 but not the in present survey still occur in the
reserves however the intensive belt transect methodology deployed in the current survey
prevented the detection of rare species or those occurring outside the 2-5m and 8-10m
habitat zones examined here. It is also possible that some observer/identification bias has
occurred between surveys conducted by different benthic specialists, particularly within
Page 56

genera such as Montipora however without the collection of skeletal samples the extent to
which this has occurred is difficult to quantify
Table 11. New coral records from Ashmore Reef and Cartier Island Marine Reserves. Asterix indicates species recorded from Western Australia for the first time.
Genera Species Genera Species
Acanthastrea lordhowensis Favites stylifera Acropora grandis Favia rotumana Acropora microclados Leptastrea purpurea Acropora micropthalma Leptoseris yabei Acropora secale Montipora aequituberculata Acropora spicifera Montipora calcarea Acropora willisae Montipora incrassata Astreopora listeri Montipora stellata Echinophyllia orpheensis Platygyra acuta Favia veroni Platygyra verweyi Favia maritima* Psammocora obtusangula* Favia speciosa Psammocora superficialis
Table 12. Species recorded in Kospartov et al. (2006) but not in the current survey.
Genera Species Genera Species
Acanthastrea hillae Montastrea annuligera Acropora anthocercis Montipora caliculata Acropora subglabra Montipora efflorescens Acropora yongei Montipora nodosa Favites flexuosa Montipora venosa Fungia danai Mycedium elephantotus Goniastrea favulus Mycedium mancaoi Goniopora norfolkensis Oxypora glabra Goniopora pendulus Pavona clavus Leptoseris mycetoseroides Pavona minuta Lobophyllia flabelliformis Physogyra lichtensteini Lobophyllia hataii Sandalolitha robusta
The number of species recorded in the present survey is substantially less than the
251 recorded to occur in the Reserves in 1997 by Griffith (1997). However, the
methodologies employed during this survey were not intended to ascertain reef-wide levels
of biodiversity, rather sampling was focussed on providing intensive within habitat/site
assessment of coral biodiversity. To better establish reef-wide levels of biodiversity
sampling would need to be conducted across a wide range of different habitat-types.
Nevertheless, when the additional new species recorded in the present survey are added
Page 57

to the pre-existing Reserve species list, the overall biodiversity at Ashmore Reef and
Cartier Island is estimated to be 275 species
A recent survey of Scott Reef conducted by the West Australian Museum reported
306 species (Gilmore et al., 2008), and 278 species were recorded from the Bonaparte
Archipelago (Kimberley coastline - Richards et. al. unpublished) (Table 13). Coral
biodiversity decreases with increasing latitude along the West Australian coastline. Hence
the current estimate of 275 species is regionally appropriate and in this context; Ashmore
and Cartier Reefs are important reservoirs of regional coral biodiversity. The Reserves are
optimally placed to receive warm water from the West Central Pacific Ocean via the
Indonesian-flow through current (Wyrtki, 1987) which joins with the Leewin Current in the
East Pilbara region and flows southward along the West Australian coastline.
Table 13. Regional comparison of scleractinian coral biodiversity.
West Australian location Reference Species Richness
Ashmore Reef This study 275
Scott Reef Gilmore et al., 2008 306
Bonaparte Archipelago Z. Richards et al. unpub. 278
Dampier Archipelago Veron, 2004 217
Barrow Island Veron, 2004 208
Ningaloo Reef Veron, 2004 209
Houtman Abrolhos Is. Veron, 2004 192
Rowley Shoals Veron, 2004 187
Shark Bay Veron, 2004 81
Geraldton Region Veron, 2004 14
Rottnest Island Veron, 2004 19
The mean site species richness of scleractinian corals is slightly higher at Ashmore
Reef than Cartier Island and higher in the deep habitat at both locations (Figure 27).
Higher species richness on the slope than the reef crest is commonly observed due to the
high disturbance regime in shallows from extreme hydrodynamic forces (Cornell and
Karlson, 1996). Biodiversity is similar between locations at Cartier Island whereas at
Ashmore Reef there are clear directional trends. In particular, the north Ashmore site has
the highest coral biodiversity, followed by Ashmore South site (Figure 27). Site
biodiversity is lowest at the south-west Ashmore site and also comparatively low at both
lagoon locations. A larger amount of error is associated with the mean species richness
at the Ashmore middle lagoon site due to the large amount of sand recorded on one of the
transects.
Page 58

0
10
20
30
40
50
60
70
CartierSouth
CartierNorth
AshmoreSouth
AshmoreSouth-west
AshmoreEast
AshmoreNorth
AshmoreWest
Lagoon
AshmoreMiddleLagoon
Mean
Scl
era
ctin
ian
Sp
eci
es
Ric
hn
ess
(+
SE
)Shallow
Deep
Figure 27. Mean scleractinian species richness at the eight Reserve sites showing the deep sites have higher coral biodiversity than shallow sites.
Overall, 9397 hard coral colonies were counted across the 48 belt transects. The
species with the largest number of colonies recorded on transects was Seriatopora hystrix
(10.6%, n = 1003 colonies). By ranking species according to their summed abundance,
we describe 35 species (18.8% of the hard coral assemblage) as being ‘key’ species
within the reserves because their total colony count is within 75% of that of S. hystrix
(listed in Table 14). These ‘key’ species are critical for reef building and are the primary
contributors to the observed level of coral cover (see next section). It is important to note
however that a large proportion of the S. hystrix colonies at Ashmore Reef were juveniles
(<3 years old) that appear to have established since the 2003 bleaching event. Eight
species of common Acropora corals appear on the list of ‘key’ species confirming Acropora
as one of the most important genera of corals in the context of reef building. Again, a
large proportion of the Acropora colonies recorded were juveniles of approximately two
years of age. Species with particularly high numbers of juvenile recruits include A.
cerealis, A. microphthalma, A. nana, A. millepora and A. acuminata. It is important to note
however that species belonging to 14 different genera appear on the list so numerous
types of coral are functionally important for reef-building within the Reserves. Octocoral
(Heliopora coerulea i.e. blue coral) and Hydrozoans (Millepora spp. i.e. fire coral) also are
important contributors to reef growth in the Reserves. Isopora palifera is a particularly
Page 59

important microhabitat building coral forming solid vertical upgrowths on the exposed reef
fronts.
The largest proportion of coral species are rare within the reserves (41.4% of the
assemblage, n = 77) meaning their sum of abundance is only 10% or less of that recorded
for S. hystrix. Amongst those species classified here as rare are Favia maritima and
Psammocora obtusangula (i.e. the two new species records for Western Australia),
Lithophyllon undulatum (a species whose Australian range is restricted to WA and NT),
and Lobophyllia robusta (Ashmore Reef is the western-most limit of this species). Six
colonies of Tubipora musica (organ pipe coral) were recorded on transects however
additional colonies were observed off transects. The remaining 39.8% (n=74) of species
recorded in the Reserves reach intermediate local abundance.
Page 60

Table 14. Ranked list of ‘key’ hard coral species that occur within the Reserves. Key species are classified as those species with a total sum of abundance 75% or more of the most abundant species S. hystrix of which 1003 colonies were recorded on transects. All corals are scleractinian unless stated.
Genus Species 1 Seriatopora hystrix 2 Isopora brueggemanni 3 Acropora austera 4 Acropora millepora 5 Isopora palifera 6 Porites cylindrica 7 Acropora cerealis 8 Pocillopora verrucosa 9 Heliopora coerulea (Octocoral) 10 Symphyllia radians 11 Seriatopora aculeata 12 Porites lutea 13 Goniastrea retiformis 14 Porites lichen 15 Montipora turgescens 16 Favites abdita 17 Acropora nasuta 18 Cyphastrea microphthalma 19 Pavona varians 20 Acropora digitifera 21 Acropora gemmifera 22 Montipora undata 23 Pocillopora damicornis 24 Porites rus 25 Montipora peltiformis 26 Galaxea fascicularis 27 Pocillopora meandrina 28 Millepora branching spp. (Hydrozoa) 29 Goniopora lobata 30 Porites nigrescens 31 Acropora cytherea 32 Acropora intermedia 33 Goniastrea pectinata 34 Millepora encrusting spp. (Hydrozoa) 35 Echinopora lamellosa
Page 61
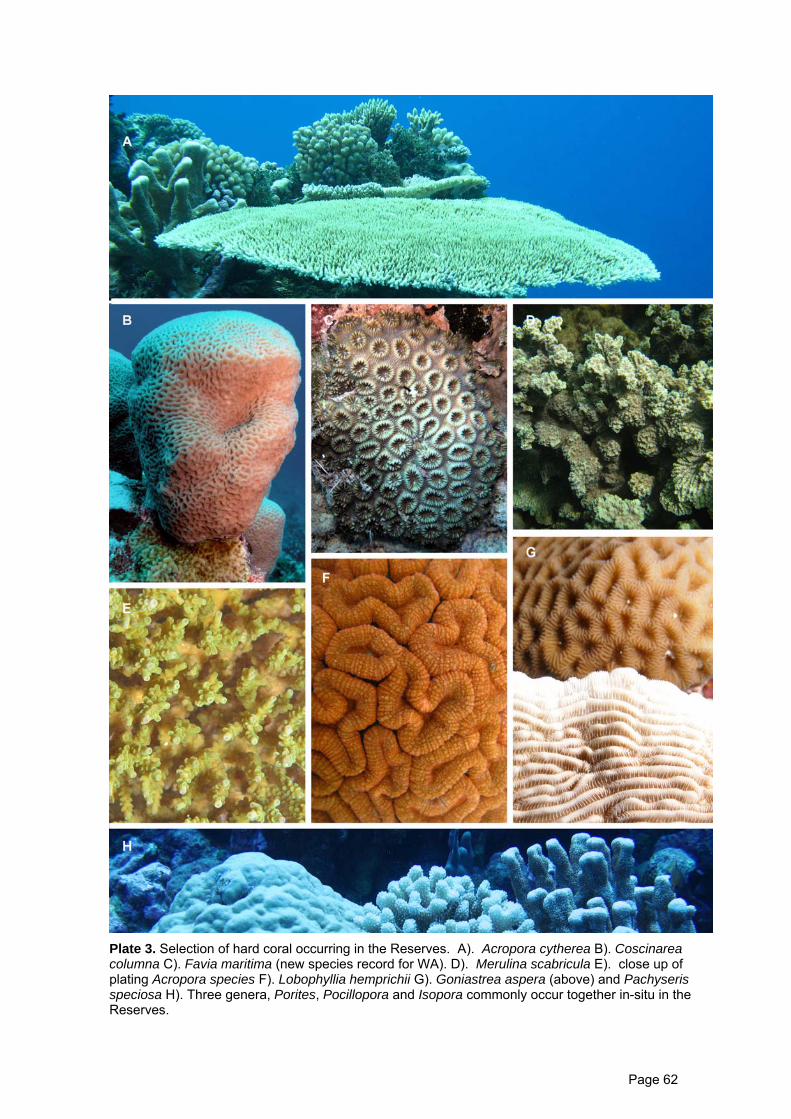
Plate 3. Selection of hard coral occurring in the Reserves. A). Acropora cytherea B). Coscinarea columna C). Favia maritima (new species record for WA). D). Merulina scabricula E). close up of plating Acropora species F). Lobophyllia hemprichii G). Goniastrea aspera (above) and Pachyseris speciosa H). Three genera, Porites, Pocillopora and Isopora commonly occur together in-situ in the Reserves.
Page 62

Plate 4. Soft coral and sea fans occurring within the Reserves. A). Sinularia. B). Isis (centre) and Junceella. C). Antipatharian (black coral). D). Klyxum. E). Melithaeid Fan.
Page 63

Percentage cover of scleractinian corals recorded across all transects was
unrelated to species richness of corals on the same transects (Figure 28), which has
important implications for management because it demonstrates that percent coral cover
estimates alone do not adequately represent coral biodiversity or reef condition.
Essentially this is because in coral communities it is commonly observed that a small
number of species can dominate the community and obtain a high level of cover. In such
situations, the monopolizing species (e.g. thickets of branching Acropora) are often clonal
hence, even though there is a high level of coral cover, there is a low level of species and
genetic variability within the community making it vulnerable to density dependent
processes. For example, high host density is a major factor driving disease prevalence
and transmission in animals (Altizer and Augistine, 1997; Rudolf and Antonics, 2005),
especially under thermal stress (Bruno et al, 2007). High coral cover reduces the distance
between neighbouring coral colonies (Connell, 2004) and thus between infected and
healthy hosts, increasing the potential for horizontal disease transmission between corals
in close proximity. It is important therefore that both coral cover estimates and coral
biodiversity estimates are collected in tandem in standardized and replicated ways.
0
10
20
30
40
50
60
70
80
0 20 40Coral cover (%)
Spe
cies
rich
ness
60
Figure 28. Regression of hard coral cover against species richness of scleractinian corals on each individual transect (n = 48). No significant relationship exists between these two variables (Regression analysis, r2 = 0.03, df = 45, p=0.28).
Page 64

4.4 Coral health
4.4.1 Coral predators
Densities of two major invertebrate corallivores, Drupella snails and Crown-of-
Thorns Starfish (Acanthaster planci) were very low at Ashmore Reef and Cartier Island.
Drupella sp. were detected on 9 species of coral (A. acuminata, A. austera, A. intermedia,
A. nasuta, A. subulata, A. verweyi, P. eudoxyi, P. verrucosa, S. hystrix) across 3 sites at
Ashmore Reef (3, 4 and 6), and were most abundant at site 3. No A. planci were counted
on transects, though solitary individuals were observed at the sites 3 and 6. There was
also evidence of feeding scars , presumably caused A. planci on 2 species of coral at
Ashmore Reef (A. digitifera and A. subulata) and 3 species at Cartier Island (Astreopora
myriopthalma, Montipora peltiformis and Pocillopora verrucosa). Most massive and
encrusting Porites colonies also had numerous distinct feeding scars (Plate 5C) at both
exposed and lagoonal Ashmore Reef sites, caused by coral-feeding fishes (Cole et al.
2009).
4.4.2 Coral disease
Prevalence of coral disease on belt transects was very low at Cartier Island and
Ashmore Reef. No coral disease was recorded at Cartier Island, but one instance of a
tumor was observed on A. microcladosI at site 1, and one colony of Porites lutea exhibited
a pigmentation response at site 2. At Ashmore Reef, only 11 isolated cases of coral
disease were observed across all 36 transects. At the southern Ashmore site, black band
disease was observed on A. myriopthalma and Galaxea fascicularis. Also at this site,
white syndrome was observed on Porites lichen and Echinopora mammiformis. Tumors
were observed on M. peltiformis. There were also a variety of pigmentation responses on
corals that appeared to be in response to abrasive impacts due to the large amount of
rubble at this site. At the east Ashmore site, P. cylindrica was observed with black band
disease and various white, pink and yellow pigmentation responses were observed on
Montipora folveolata and Porites lutea. At the north Ashmore site, white syndrome was
observed on A.austera, A. gemmifera and Montipora aequituberculata. At the Ashmore
lagoon site, white syndrome was observed on Acropora intermedia, Acropora tenuis and
Fungia repanda.
Page 65

Plate 5. Selection of degraded reef shots. A). White band disease transmitted between Acropora colonies. B). A recently dead Acropora colony. C). Fish feeding scars on Porites lutea. D). White band disease advancing up the branches of Isopora palifera. E). Compound ascidian overgrowing a dead coral. F). Acropora rubble dominates the southern exposed reef site. G). Filamentous algae growing on rubble at the Southern exposed site.
Page 66
5 Conclusions
5.3 Biogeography
Ashmore Reef National Nature Reserve and Cartier Island Marine Reserve are
evolutionary significant biodiversity hotspots. The reasons for this are 2-fold. Firstly, the
Reserves lie at the edge of the continental shelf in the Timor Sea directly in the path of the
fast westward surface flowing South Equatorial Current (10°S - 15° S) that introduces low
salinity North Pacific water into the Indian Ocean (Wyrtki, 1987). However this is not the
only current influencing the region. The Indonesian through-flow current is augmented by
outflows from the Indonesian Seas (Godfrey, 1996) and Anticyclonic eddies (100-150km
diameter) associated with the South Java Current and the Eastern Gyral Current (Sprintall
et al., 2002) drive recirculation in the vicinity of the Reserves (Feng et al. 2005) (Figure
29). This unique amalgamation of currents with mixed origins creates unique opportunities
for diversification.
The second reason why Ashmore and Cartier are evolutionarily significant hotspots
is that these reefs are thought to have persisted during glacial maxima when sea levels
were more than 100m below present levels. Paleoclimatic events during the Pleistocene
epoch led to an unprecedented level of speciation (Hewitt, 2000) due to the cyclic
emergence and transgression of Australia’s continental shelf that led to population
bottlenecks during lowered sea stands and population expansions at times of high sea
level. In the Timor Shelf region, sea level fluctuations caused the Reserves to become
increasingly isolated. Recent research on Sea Snakes shows that in the Ashmore Reef
region Aipysurus laevis (olive sea snakes) are genetically distinct and more genetically
diverse than populations from the GBR and Gulf of Carpentaria (Lukoschek et al., 2007b).
Such traits make the Ashmore Reef region of great importance for conservation.
Page 67

Figure 29. Major current systems in the southeast Indian Ocean and ocean basins around western
Australia (from Domingues et al., 2007).
5.2 Benthic communities
Data presented here shows that coral cover has increased in the Reserves since
the 2005 marine survey. The benthic communities are recovering well from the 1998 and
2003 bleaching events. An important finding of the current survey is that a large number of
juvenile corals (2-3years old) were recorded. In 2005, there was a general absence of
new recruits (Kospartov et al, 2006). Hence it is apparent that 2006/2007 was successful
years for coral recruitment especially within the families Acroporidae and Pocilliporidae.
The finding of 186 species of Scleractinian (zooxanthellate hermatypic hard coral)
from 14 families and 51 genera on belt transects is important because it confirms that this
methodology is sufficient to detect a significant proportion of the 275 species of coral that
are predicted to occur in the Reserves. However it is important to reiterate that the current
coral biodiversity methodology did not enable a full Reserve wide assessment of coral
biodiversity moreover it provided an intensive within habitat/site assessment of coral
biodiversity. Nevertheless, these results confirm that Ashmore and Cartier Reefs are
important reservoirs of regional coral biodiversity.
Page 68

Corals in the reserves are generally in a healthy state. At most sites, coral
predators (Drupella spp., Acanthaster plancii) are present in low numbers (with the
exception of the South Ashmore site where a large number of Drupella spp. were
observed). There was no evidence of A. planci outbreaks however there was evidence of
recent COT feeding at both Ashmore Reef and Cartier Island. The prevalence of coral
disease was low at Ashmore Reef with only 11 isolated cases observed (black band and
white syndrome) and no instances of coral disease were observed at Cartier Island.
There are important differences in benthic community structure between Ashmore
Reef and Cartier Island. For example, Acropora, Isopora, Porites and Seriatopora are the
dominant genera at Ashmore Reef, whilst at Cartier Island, two non-Scleractinian hard
coral species (Heliopora (blue coral), Millepora (fire coral) join with species from the
genera Acropora, Seriatopora and Pocillopora to dominant the coral community. Cartier
Island (particularly the north site) is also uniquely defined by its high abundance and
diversity of soft coral. While sharing a close affinity, the Ashmore Reef and Cartier Island
Reserves are warranted as distinct management units and it is advisable that separate
conservation strategies are constructed for them.
5.3 Sea snakes
Data presented here suggests that the Ashmore Reef sea snake populations have
declined precipitously (see also Guinea 2006), but the reasons for this are currently
unknown. The movement patterns of Sea Snakes have not been well documented so it is
not clear if the Ashmore Reef Sea Snake populations have moved to another location.
However research on the Olive Sea Snake (A. laevis) shows this species has a small
home range and shows some site fidelity (Burns and Heatwole, 1998). A. laevis exhibits
an aggregated distribution pattern whereby it can be abundant on certain reefs and absent
from adjacent reefs (Lukoschek et al., 2007a). Two species endemic to Ashmore Reef
Aipsyurus apraefrontalis (Short-nosed Sea Snake) and Aipsyurus foliosquama (Leaf-
scaled Sea Snake} have recently been listed as Critically Endangered under EPBC
categories and criteria (V. Lukoschek pers comm.). For the EPBC assessments all
available information about past and present abundance estimates of these two species,
as well as potential threatening process at Ashmore Reef was complied. We recommend
the status of Sea Snakes at Ashmore reef is of specific and imminent conservation interest
and further research promoting Sea Snake biology, ecology and conservation at Ashmore
Reef should be supported.
Page 69
5.4 Declines in key fisheries taxa
This survey has revealed marked declines in the abundance of several different
taxa including reef fishes (Pomacentridae, Labridae, Scaridae and Siganidae),
holothurians, trochus and clams at sites across Ashmore Reef and Cartier Island. These
declines are occurring despite an increase in coral cover, which is indicative of optimal
environmental conditions and gradual improvement in habitat condition. An obvious
explanation for these declines would be an increase in mortality rates (e.g., due to fishing
and harvesting) across all study sites, though there may also be other explanations. For
example, declines in the abundance of herbivorous fishes (Scaridae and Siganidae) may
reflect movement away from the current survey sites due to declines in the relative
abundance of algae, as corals (hard and soft) occupy a greater proportion of the available
space. It is also possible that long-term declines in recruitment rates (caused by prior
reductions in the size of reproductive populations) is causing gradual declines in these
populations. Irrespective of the cause, these declines (especially among sessile
organisms, such as trochus, holothurians and clams) are cause for concern and efforts
need to be taken to establish the most likely mechanism behind these declines.
In the light of the negative trajectories for macroinvertebrate abundance and
distribution in the Reserves it is likely that some local extinctions have taken place. Local
extinctions (the disappearance of a species from part of its range) can have a major
impact on the structure of marine assemblages and the functioning of marine ecosystems
(Estes et al., 1989). Local extinctions (especially, among key herbivorous fishes) can also
lead to phase shifts to less desirable ecological states and there can be latent (or
unknown) effects on ecological functioning. Such shifts in community structure can also
occur without local extinction. 'Ecological' extinction arises when a species is reduced to
such low abundance that, although still present, it no longer plays the ecological role it
used to (Estes et al. 1989). For example, in North America the overfishing of lobsters -
once important predators in shallow kelp forest systems - has led to alternative benthic
community structures even though lobsters are still present though in low numbers.
Overfishing of triggerfish on Kenyan reefs also has not led to local extinction. However,
because these fish had a natural predatory role, the reduction in their number had a major
impact on coral reef communities (McClanahan & Muthiga 1988). It is our view that many
species of clam (including the giant clam) and holothurians are facing ecological (if not
actual) extinction in the Reserves
Page 70
6 Recommendations
1. Anthropogenic disturbances in the Reserves must be minimized by maintaining, at a
minimum, the current level of protection and regulation.
2. The new management plan for Ashmore and Cartier must recognize the value of long-
term monitoring at regular intervals (every 2 years) and incorporate long-term monitoring
as a strategic management objective. Reactive monitoring after disturbance events (i.e.
after illegal fishing/cyclones/bleaching events) must also be enabled.
3. The core sampling methodology used in the present survey and core sites examined
should be retained in future surveys. Implementation of this standardized core
methodology within other Commonwealth Marine Reserves would also enable meaningful
temporal and spatial comparisons.
4. Future surveys at Ashmore Reef and Cartier Island would be best conducted in August-
November to coincide with optimal weather conditions. A minimum of 2 survey days
should also be budgeted to account for adverse weather conditions.
5. Greater field survey time commitment (2-3 days) is required to provide optimal levels of
sampling (5 replicate fish/coral transects) at all sites, as well as survey a greater range of
study sites (see below). The present survey focuses on most appropriate habitats (reef
slope and the reef crest) for corals and fishes, but fails to adequately sample key habitats
in which trochus and holothurians typically reside.
6. Consideration must be given to increasing the number and diversity of study sites to
better account for inherent variation among sites and better represent different habitat-
types. Critically, there needs to be at least 4 sites around Cartier Reef, and additional sites
added to represent the inner reef habitats at Ashmore Reef.
7. Additional sites should be considered on the western side of Ashmore Reef (e.g., D17 &
D18 in Ceccarelli et al. 2007) as this is closer to where fishing and collecting is allowed
and would be most informative for assessing impacts of permitted fishing activities and site
comparison purposes.
8. Two tenders must be made available to ensure safe operations for field surveyors
because the pelagic fish/shark surveyor travels >1.5km from the fish/coral surveyors.
Page 71

9. To facilitate temporal comparisons, data should be centralized into an accessible
database (excel format).
10. Process-orientated monitoring (e.g., measuring coral growth, mortality, and coral
recruitment) would significantly augment monitoring of standard state variables (e.g., coral
cover). Though timely, these studies would improve understanding of the dynamics of
coral reef assemblages and enable better predictions about the future status of coral reef
assemblages.
11. Implementation of targeted research may be relatively cost-effective if DEHWA support
collaborative partnerships with the ARC Centre of Excellence for Coral Reef Studies, and
other relevant academic institutions, to enable process-orientated monitoring and targeted
research in the Reserves into critically important issues such as the status of Sea Snakes,
Dugongs, valuable macro-invertebrates and parasitic Isopods.
12. Significant supplementary information might be gleaned through the continual
presence of the crew aboard the Ashmore Guardian. DEWHA should engage the crew of
the Ashmore Guardian to record marine megafauna sightings (i.e. Turtles, Dugongs, Sea
Snakes, Whales, Manta Rays) and/ or conduct formal social surveys of fisherman to
record their place of origin, intended destination, fishing routes, intended catches, actual
catches, time at sea.
Page 72

7 References
Altizer SM, Augustine DJ (1997) Interactions between frequency-dependent and vertical transmission in host-parasite systems. Proceedings of the Royal Society of London Series B-Biological Sciences 264: 807-814
Andrews JC, Gentien P (1982) Upwelling as a source of nutrients for the Great Barrier Reef ecosystems: a solutin of Darwin’s question? Marine Ecology Progress Series 8:257-269
Bruno JF, Selig ER, Casey KS, Page CA, Willis BL, Harvell CD, Sweatman H, Melendy AM (2007). Thermal Stress and Coral Cover as Drivers of Coral Disease Outbreaks. PLoS Biology 5: e124
Burns GW, Heatwole H (1998) Home range and habitat use of the olive sea snake, Aipysurus laevis, on the Great Barrier Reef, Australia. Journal of Herpetology, 32. 350-358.
Ceccarelli D, Kospartov M, Beger M, Richards Z, Birrell C (2007) Survey of the distribution and abundance of trochus, holothurians and tridacnid clams at Ashmore Reef in 2006, to assess the impact of recent illegal fishing on target invertebrate stocks. Report for Department of the Environment and Heritage, Marine Protected Areas Management.
Cole AJ, Pratchett MS, Jones GP (2009) Coral-feeding wrasse scars massive Porites colonies. Coral Reefs. 28(1): 207
Connell JH, Hughes TP, Wallace CC, Tanner JE, Harms KE, Kerr AM (2004) A long-term study of competition and diversity of corals. Ecological Monographs 74:179-210
Cornell HV, Karlson RH (1996) Species richness of reef-building corals determined by local and regional processes. Journal of Animal Ecology 65: 233-241
Cresswell G, Frische A, Peterson J, Quadfasel D (1993) Circulation in the Timor Sea. Journal of Geophysical Research 98:379-389
Domingues CM, Maltrud ME, Wijffels SE, Church JA, Tomczak M (2007) Simulated Lagrangian pathways between the Leeuwin Current system and the upper-ocean circulation of the southeast Indian Ocean. Deep-Sea Research II 54:797-817
Environment Australia (2002) Ashmore Reef National Nature reserve and Cartier Island Marine Reserve (Commonwealth Waters) Management Plans. Environment Australia, Canberra. 92 p.
Estes JA, Duggins DO, Rathbun GB (1989). The Ecology of Extinctions in Kelp Forest Communities. Conservation Biology 3: 252
Feng M, Wijffels SE, Godfrey JS, Meyers G (2005) Do eddies play a role in the momentum balance of the Leewin Current? Journal of Physical Oceanography 35: 964-975
Fox J (1998) Reefs and Shoals in Australia-Indonesian Relations: Traditional Indonesian Fisherman. In: Milner AC, Quilty MC (eds) Australian in Asia: Episodes. Oxford University Press, Melbourne. p 111-139
Page 73

Gilmour JP, Travers MJ, Underwood, JN, McKinney DW, Gates EN, Birrell CL, Fitzgerald KL (2008) The status of shallow-water coral and fish communities at Scott Reef. Report to the Browse Joint Venture Partners. Australian Institute of Marine Science, Perth Western Australia.
Godfrey JS (1996) The effect of the Indonesian throughflow on ocean circulation and heat exchange with the atomosphere: a review. Journal of Geophysical Research 101: 12217-12238
Graham NAJ, Dulvy NK, Jennings S, Polunin NVC (2005) Size-spectra as indicators of the effects of fishing on coral reef fish assemblages. Coral Reefs 24: 118-124
Graham NAJ, Wilson SK, Jennings S, Polunin NVC, Bijoux JP, Robinson J (2006) Dynamic fragility of oceanic coral reef ecosystems. Proceedings of the National Academy of Sciences of the United States of America 103, 8425-8429.
Griffith JK (1997) The corals collected during September/ October 1997 at Ashmore Reef, Timor Sea, Western Australian Museum, Perth.
Guinea ML (2006) Sea snakes of Ashmore Reef, Hiberia Reef and Cartier Island. 37pps/ DEWR Final Report - Survey 2005.
Halford A, Cheal AJ, Ryan D, Williams DMcB (2004) Resilience to large-scale disturbance in coral and fish assemblages on the Great Barrier Reef, Australia. Ecology 85: 1892–1905
Hewitt GM (2000). The genetic legacy of the quaternary ice ages. Nature 405: 907-913.
Hughes TP, Baird AH, Bellwood DR, Card M, Connolly SR, Folke C, Grosberg R, Hoegh-Guldberg O, Jackson JBC, Kleypas J, Lough JM, Marshall P, Nystrom M, Palumbi SR, Pandolfi JM, Rosen B, Roughgarden J (2003) Climate change, human impacts and the resilience of coral reefs. Science 301: 929–933
Kospartov M, Beger M, Ceccarelli D, Richards Z (2006) An assessment of th edistrbiution and abundance of sea cucmbers, trochus, giant clams, coral, fish and invasive marine species at Ashmore Reef National Nature Reserve and Cartier Island Marine Reserve 2005. Report for Department of the Environment and Heritage, Marine Protected Areas Management.
Lukoschek V, Heatwole H, Grech A, Burns G, Marsh H (2007a) Distribution of two species of marine snakes, Aipysaurus laevis and Emydocephalus annulatus, in the southern Great Barrier Reef: metapopulation dynamics, marine protected areas and conservation. Coral Reefs, http://dx.doi.org/10.1007/s00338-006-0192-8.
Lukoschek V, Waycott M, Marsh H (2007b) Phylogeography of olive sea snake, Aipysurus laevis (Hydrophiinae) indicates Pleistocene range expansion around northern Australia but low contemporary gene flow. Molecular Ecology 16: 3406-3422.
Marsh LM, Vail LL, Hoggett AK, Rowe FEW (1993) Echinoderms of Ashmore Reef and Carteri Island. Pages 53-65 In: Berry PF (Ed) Marine faunal surveys of Ashmore Reef and Cartier Island, North-western Australia. Records of the Western Australian Museum, Supplement No. 44, Perth.
McClanahan TR, Muthiga NA (1988). Changes in Kenyan coral reef community structure and function due to exploitation. Hydrobiologia 166: 269-276.
Page 74

Meekan M, Cappo M (2004) Non-destructive techniques for rapid assessment of shark abundance in Northern Asutralia. Report to Australian Government Department of Agriculture, Fisheries and Forestry, Canberra. 29 p.
Moberg F, Folke C (1999) Ecological goods and services of coral reef ecosystems. Ecological Economics 29: 215-233
Oxford Economics (2009) Valuing the effects of Great Barrier Reef Bleaching. Great Barrier Reef Foundation, Australia. 95 p.
Pratchett MS, Berumen ML (2008) Interspecific variation in distributions and diets of coral reef butterflyfishes (Teleostei: Chaetodontidae). Journal of Fish Biology 73: 1730-1747.
Pratchett MS, Wilson SK, Baird AH (2006) Declines in the abundance of Chaetodon butterflyfishes (Chaetodontidae) following extensive coral depletion. Journal of Fish Biology 69, 1269-1280.
Pratchett MS, Wilson SK, Graham NAJ, Munday PL, Jones GP, Polunin NVC (2009) Coral Bleaching and Consequences for Motile Reef Organisms: Past, Present and Uncertain Future Effects Pages 139-158. In: M van Oppen and J Lough (ed). Coral Bleaching: patterns and processes, causes and consequences. Springer, Heidelberg.
Robbins WD, Hisano M, Connolly SR, Choat JH (2006) Ongoing collapse of coral reef shark populations. Current Biology 16: 2314-2319
Rudolf VHW, Antonovics J (2005) Species coexistence and pathogens with frequency dependent transmission. American Naturalist 166: 112-118
Skewes TD, Dennis DM, Jacobs DR, Gordon SR, Taranto TJ, Haywood M, Pitcher CR, Smith GP, Milton D, Poiner IR (1999) Survey and stock size estimates of the shallow reef (0-15m deep) and shoal area (15-50 m deep) marine resources and habitat mapping within the Timor Sea MOU74 Box. CSIRO Marine Research.
Sprintall J, Wijffels S, Chereskin T, Bray N (2002) The JADE and WOCE I10/IR6 throughflow sections in the southeast Indian Ocean Part 2: velocity and transports. Deep Sea Research II 49: 1363-1389
Stacey N (1999) Boats to Burn: Bajo fishing activity in the Australian Fishing Zone. PhD thesis in Anthropology, Charles Darwin University, Darwin.
Stoddart DR (1969) Ecology and morphology of recent coral reefs. Biological Reviews 44: 433-498
Veron JEN (2004) Coral survey at selected sites in Arnhem Land. Australian Institute of Marine Science. Report prepared for National Oceans Office. 14 p.
Wilson SK, Fisher R, Pratchett MS, Graham NAJ, Dulvy NK, Turner RA, Cakacaka A, Polunin NVC, Rushton SP (2008) Exploitation and habitat degradation as agents of change within coral reef fish communities. Global Change Biology 14: 2796-2809
Wilson SK, Graham NAJ, Polunin NVC (2007) Appraisal of visual assessments of habitat complexity and benthic composition on coral reefs. Marine Biology 151: 1069-1076.
Wilson SK, Swan G (2004) A complete guide to reptiles of Australia. Reed New Holland. Australia.
Page 75

Wismer S, Hoey AS, Bellwood DR (2009) Cross-shelf benthic community structure on the Great Barrier Reef: relationships between macroalgal cover and herbivore biomass. Marine Ecology Progress Series 376: 45-54.
Wyrtki K (1987) Indonesian through flow and the associated pressure gradient. Journal of Geophysical Research 92: 941-946
Page 76

8 Appendices
9.1 ANOVA tables for each family of demersal reef fishes
Univariate ANOVAs were run for each family of reef fishes, testing for variation in
abundance between years (2005 versus 2009), between depth zones (reef crest versus
reef slope), and among sites (8 sites; 2 sites at Cartier and 6 sites at Ashmore). Count
data was log-transformed prior to analysis. Significant effects (at α = 0.05) are shown in
bold, but significance values >0.004 (indicated by “*”) need to be treated cautiously, due to
risk of elevated errors from running multiple comparisons.
Acanthuridae
Source df MS F Significance
Year 1 0.02 0.91 0.68
Depth 1 0.05 0.36 0.57
Site 7 0.00 0.00 0.00 Year * Depth 1 0.15 0.36 0.57
Year * Site 7 0.11 0.27 0.95
Depth * Site 7 0.14 0.32 0.92
Year * Depth * Site 7 0.43 6.00 0.00
Error 64 0.07
Chaetodontidae
Source df MS F Significance
Year 1 0.46 2.20 0.18
Depth 1 1.35 10.91 0.01* Site 7 0.30 1.26 0.40
Year * Depth 1 0.11 1.23 0.30
Year * Site 7 0.21 2.27 0.15
Depth * Site 7 0.12 1.34 0.35
Year * Depth * Site 7 0.09 0.92 0.50
Error 64 0.10
Page 77

Haemulidae
Source df MS F Significance
Year 1 0.02 0.59 0.47
Depth 1 0.03 0.40 0.55
Site 7 0.04 0.56 0.77
Year * Depth 1 0.15 5.23 0.06
Year * Site 7 0.04 1.23 0.40
Depth * Site 7 0.07 2.24 0.15
Year * Depth * Site 7 0.03 1.06 0.40
Error 64 0.03
Labridae
Source df MS F Significance
Year 1 0.33 5.33 0.05* Depth 1 0.00 0.05 0.83
Site 7 0.34 16.82 0.72
Year * Depth 1 0.02 0.14 0.72
Year * Site 7 0.06 0.54 0.78
Depth * Site 7 0.07 0.63 0.71
Year * Depth * Site 7 0.12 2.18 0.05*
Error 64 0.05
Lethrinidae
Source df MS F Significance
Year 1 0.44 3.95 0.09
Depth 1 1.82 8.59 0.02* Site 7 0.20 3.03 0.71
Year * Depth 1 0.00 0.00 0.96
Year * Site 7 0.11 0.44 0.85
Depth * Site 7 0.21 0.82 0.60
Year * Depth * Site 7 0.26 2.51 0.02*
Error 64 0.10
Page 78

Lutjanidae
Source df MS F Significance
Year 1 0.08 0.57 0.48
Depth 1 0.68 2.11 0.19
Site 7 0.44 1.43 0.38
Year * Depth 1 0.13 0.81 0.40
Year * Site 7 0.15 0.90 0.55
Depth * Site 7 0.32 1.99 0.19
Year * Depth * Site 7 0.16 1.31 0.26
Error 64 0.13
Mullidae
Source df MS F Significance
Year 1 0.10 0.31 0.60
Depth 1 1.90 8.74 0.02* Site 7 0.68 1.65 0.25
Year * Depth 1 0.00 0.00 0.99
Year * Site 7 0.30 2.85 0.10
Depth * Site 7 0.21 2.01 0.18
Year * Depth * Site 7 0.11 1.31 0.26
Error 64 0.08
Pomacentridae
Source df MS F Significance
Year 1 0.15 0.86 0.39
Depth 1 0.00 0.03 0.87
Site 7 0.29 1.57 0.36
Year * Depth 1 0.04 0.32 0.59
Year * Site 7 0.18 1.38 0.34
Depth * Site 7 0.13 1.03 0.48
Year * Depth * Site 7 0.13 3.30 0.01*
Error 64 0.04
Page 79
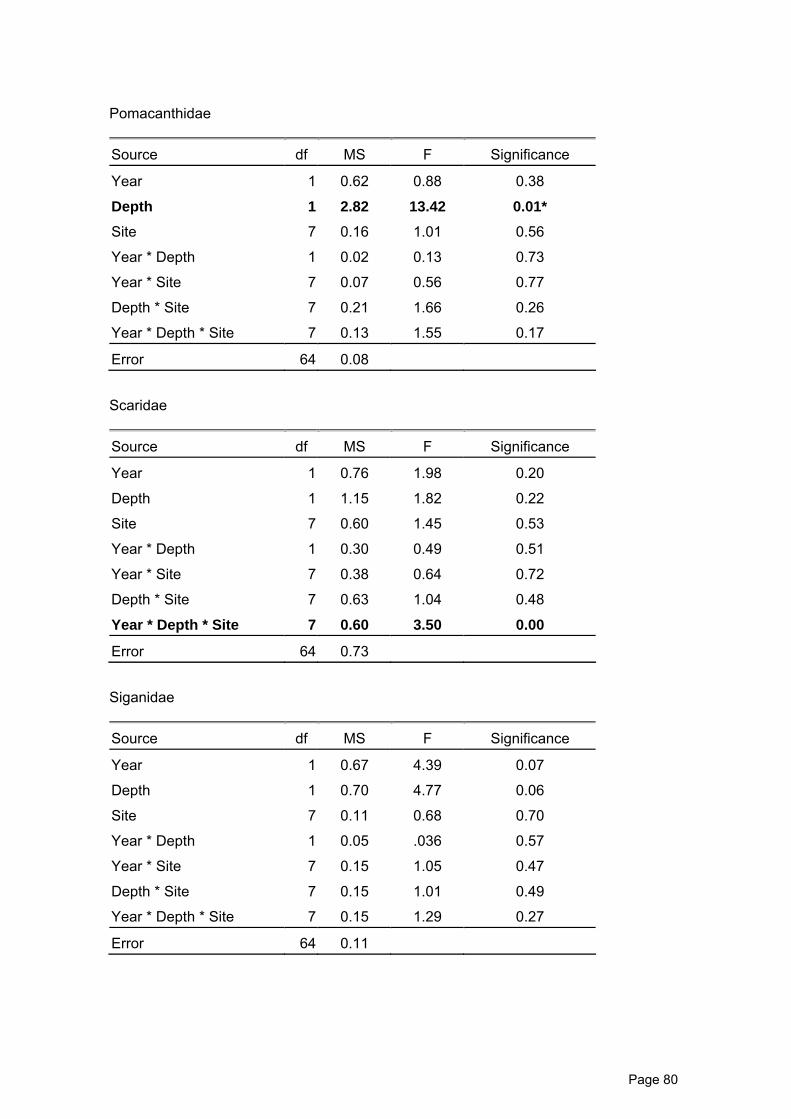
Pomacanthidae
Source df MS F Significance
Year 1 0.62 0.88 0.38
Depth 1 2.82 13.42 0.01* Site 7 0.16 1.01 0.56
Year * Depth 1 0.02 0.13 0.73
Year * Site 7 0.07 0.56 0.77
Depth * Site 7 0.21 1.66 0.26
Year * Depth * Site 7 0.13 1.55 0.17
Error 64 0.08
Scaridae
Source df MS F Significance
Year 1 0.76 1.98 0.20
Depth 1 1.15 1.82 0.22
Site 7 0.60 1.45 0.53
Year * Depth 1 0.30 0.49 0.51
Year * Site 7 0.38 0.64 0.72
Depth * Site 7 0.63 1.04 0.48
Year * Depth * Site 7 0.60 3.50 0.00
Error 64 0.73
Siganidae
Source df MS F Significance
Year 1 0.67 4.39 0.07
Depth 1 0.70 4.77 0.06
Site 7 0.11 0.68 0.70
Year * Depth 1 0.05 .036 0.57
Year * Site 7 0.15 1.05 0.47
Depth * Site 7 0.15 1.01 0.49
Year * Depth * Site 7 0.15 1.29 0.27
Error 64 0.11
Page 80

Serranidae
Source df MS F Significance
Year 1 0.86 2.22 0.18
Depth 1 2.09 4.26 0.08
Site 7 0.44 0.98 0.58
Year * Depth 1 0.26 0.59 0.47
Year * Site 7 0.39 0.90 0.56
Depth * Site 7 0.49 1.13 0.44
Year * Depth * Site 7 0.43 5.03 0.00
Error 64 0.09
Page 81
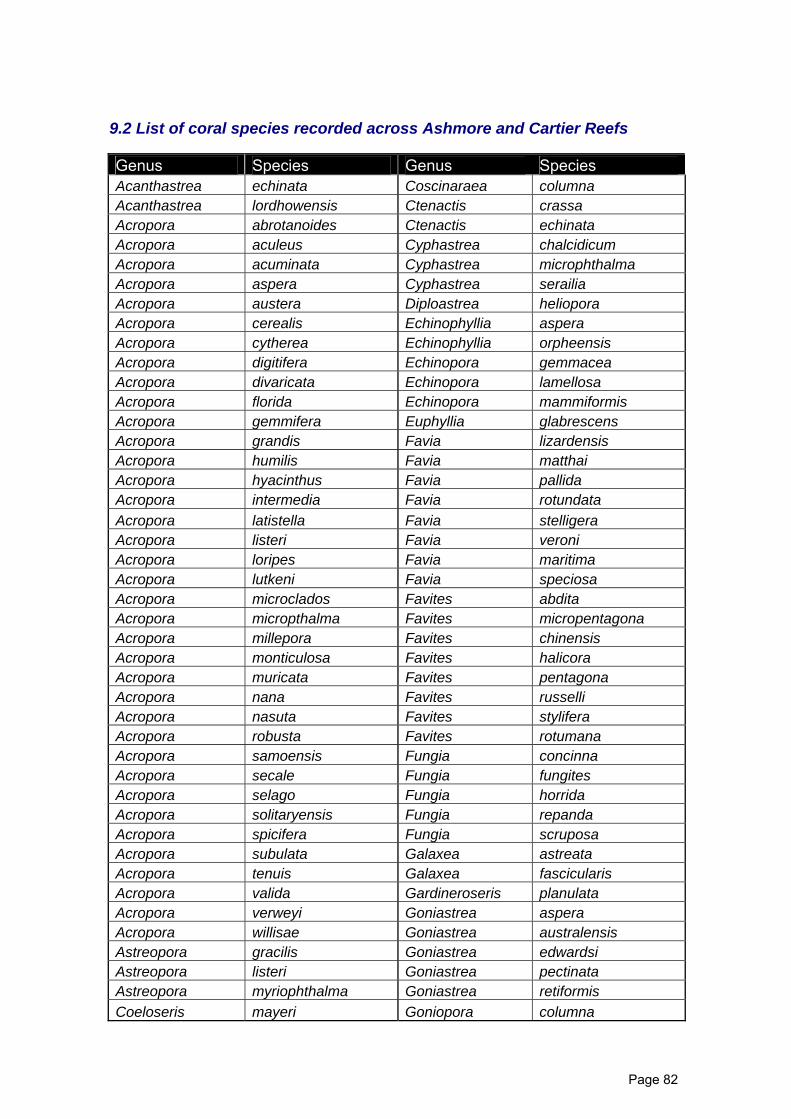
9.2 List of coral species recorded across Ashmore and Cartier Reefs
Genus Species Genus Species Acanthastrea echinata Coscinaraea columna Acanthastrea lordhowensis Ctenactis crassa Acropora abrotanoides Ctenactis echinata Acropora aculeus Cyphastrea chalcidicum Acropora acuminata Cyphastrea microphthalma Acropora aspera Cyphastrea serailia Acropora austera Diploastrea heliopora Acropora cerealis Echinophyllia aspera Acropora cytherea Echinophyllia orpheensis Acropora digitifera Echinopora gemmacea Acropora divaricata Echinopora lamellosa Acropora florida Echinopora mammiformis Acropora gemmifera Euphyllia glabrescens Acropora grandis Favia lizardensis Acropora humilis Favia matthai Acropora hyacinthus Favia pallida Acropora intermedia Favia rotundata Acropora latistella Favia stelligera Acropora listeri Favia veroni Acropora loripes Favia maritima Acropora lutkeni Favia speciosa Acropora microclados Favites abdita Acropora micropthalma Favites micropentagona Acropora millepora Favites chinensis Acropora monticulosa Favites halicora Acropora muricata Favites pentagona Acropora nana Favites russelli Acropora nasuta Favites stylifera Acropora robusta Favites rotumana Acropora samoensis Fungia concinna Acropora secale Fungia fungites Acropora selago Fungia horrida Acropora solitaryensis Fungia repanda Acropora spicifera Fungia scruposa Acropora subulata Galaxea astreata Acropora tenuis Galaxea fascicularis Acropora valida Gardineroseris planulata Acropora verweyi Goniastrea aspera Acropora willisae Goniastrea australensis Astreopora gracilis Goniastrea edwardsi Astreopora listeri Goniastrea pectinata Astreopora myriophthalma Goniastrea retiformis Coeloseris mayeri Goniopora columna
Page 82

Genus Species Genus Species Goniopora djiboutiensis Montipora porites Goniopora lobata Montipora tuberculosa Goniopora minor Montipora turgescens Goniopora somaliensis Montipora stellata Goniopora tenuidens Montipora undata Goniopora pandorensis Montipora verrucosa Halomitra pileus Oulophyllia bennettae Heliopora coerulea (Octocoral) Oulophyllia crispa Herpolitha limax Oxypora lacera Hydnoohora excesa Pachyseris speciosa Hydnophora microconos Pachyseris rugosa Hydnophora rigida Pavona cactus Isopora brueggemani Pavona decussata Isopora palifera Pavona duerdeni Isopora palifera Pavona explanulata Leptastrea pruinosa Pavona maldivensis Leptastrea purpurea Pavona varians Leptastrea transversa Pavona venosa Leptoria phrygia Pectinia lactuca Leptoseris yabei Platygyra acuta Lithophyllon undulatum Platygyra yaeyamaensis Lobophyllia robusta Platygyra daedalea Lobophyllia diminuta Platygyra lamellina Lobophyllia hemprichii Platygyra pini Merulina ampliata Platygyra sinensis Merulina scabricula Platygyra verweyi Millepora spp. Branching (Hydrozoa) Platygyra ryukensis Millepora spp. Encrusting (Hydrozoa) Plesiastrea versipora Montastrea curta Pocillopora damicornis Montastrea magnistellata Pocillopora eydouxi Montastrea salebrosa Pocillopora meandrina Montastrea valenciennesi Pocillopora verrucosa Montipora aequituberculata Polyphyllia talpina montipora calcarea Porites cylindrica Montipora crassituberculata Porites lichen Montipora danae Porites lobata Montipora digitata Porites lutea Montipora foveolata Porites nigrescens Montipora grisea Porites rus Montipora hispida Psammocora digitata Montipora incrassata Psammocora haimeana Montipora monasteriata Psammocora nietzrazi Montipora peltiformis Psammocora obtusangula
Page 83

Genus Species Psammocora superficialis Seriatopora aculeata Seriatopora caliendrum Seriatopora dentritica Seriatopora hystrix Stylocoeniella armata Stylophora pistillata Symphyllia agaricia Symphyllia radians Symphyllia recta Symphyllia valenciennesi Tubastrea micrantha Tubipora musica (Octocoral) Turbinaria frondens Turbinaria mesenterina Turbinaria peltata Turbinaria reniformis Turbinaria stellulata
Page 84