Seediscussions,stats,andauthorprofilesforthispublicationat:https://www.researchgate.net/publication/233446274
ApplyingLeanSixSigmaandTRIZmethodologyinbankingservices
ArticleinTotalQualityManagementandBusinessExcellence·March2010
DOI:10.1080/14783360903553248
CITATIONS
45
READS
303
2authors,including:
Fu-KwunWang
NationalTaiwanUniversityofScienceandTechnology
125PUBLICATIONS1,585CITATIONS
SEEPROFILE
AllcontentfollowingthispagewasuploadedbyFu-KwunWangon18September2014.
Theuserhasrequestedenhancementofthedownloadedfile.
This article was downloaded by: [National Taiwan University]On: 18 October 2011, At: 20:55Publisher: RoutledgeInforma Ltd Registered in England and Wales Registered Number: 1072954 Registeredoffice: Mortimer House, 37-41 Mortimer Street, London W1T 3JH, UK
Total Quality Management & BusinessExcellencePublication details, including instructions for authors andsubscription information:http://www.tandfonline.com/loi/ctqm20
Applying Lean Six Sigma and TRIZmethodology in banking servicesFu-Kwun Wang a b & Kao-Shan Chen ba Department of Industrial Management, National TaiwanUniversity of Science and Technology, Taiwan, ROCb Graduate Institute of Management, National Taiwan Universityof Science and Technology, Taiwan, ROC
Available online: 08 Apr 2010
To cite this article: Fu-Kwun Wang & Kao-Shan Chen (2010): Applying Lean Six Sigma and TRIZmethodology in banking services, Total Quality Management & Business Excellence, 21:3, 301-315
To link to this article: http://dx.doi.org/10.1080/14783360903553248
PLEASE SCROLL DOWN FOR ARTICLE
Full terms and conditions of use: http://www.tandfonline.com/page/terms-and-conditions
This article may be used for research, teaching, and private study purposes. Anysubstantial or systematic reproduction, redistribution, reselling, loan, sub-licensing,systematic supply, or distribution in any form to anyone is expressly forbidden.
The publisher does not give any warranty express or implied or make any representationthat the contents will be complete or accurate or up to date. The accuracy of anyinstructions, formulae, and drug doses should be independently verified with primarysources. The publisher shall not be liable for any loss, actions, claims, proceedings,demand, or costs or damages whatsoever or howsoever caused arising directly orindirectly in connection with or arising out of the use of this material.
Applying Lean Six Sigma and TRIZ methodology in banking services
Fu-Kwun Wanga,b and Kao-Shan Chenb
aDepartment of Industrial Management, National Taiwan University of Science and Technology,Taiwan, ROC; bGraduate Institute of Management, National Taiwan University of Science andTechnology, Taiwan, ROC
Service operations now comprise more than 80% of the GDP in the United States andare rapidly growing around the world. The cost to maintain and service an application istypically more than the initial purchase price. The revenue growth potential ofimproving the speed and quality of service often overshadows the cost reductionopportunities. The Lean Six Sigma approach is a popular methodology to improvethe business opportunities in customer satisfaction, cost and process speed formanufacturing. In this study, we attempt to extend the Lean Six Sigma approach to abroader application in the service industry and integrate TRIZ methodology to enhancethe traditional techniques of Lean Six Sigma. Theoria Resheneyva IsobretatelskehuhZadach (TRIZ) is an effective method for analysing customer needs and developinginnovative solutions to meet those needs. A sample problem of the banking service isused to demonstrate how TRIZ can be applied to a real-world problem while in a LeanSix Sigma DMAIC process. The results show that the application of Lean Six Sigmamethodology with TRIZ performs effectively in the improvement of banking services.
Keywords: Lean Six Sigma; DMAIC; TRIZ; banking services
Introduction
Over the past two decades, industrial organisations have embraced a wide variety of man-
agement programmes that they hope will enhance competitiveness. Currently, two of the
most popular programmes are Six Sigma and Lean management. The Six Sigma approach
is primarily a methodology for improving the capability of business processes by using
statistical methods to identify and decrease or eliminate process variation. Its goal is
reduction of defects and improvements in profits, employee morale and product quality.
Lean management originated at Toyota Motor Corporation in Japan and is an approach
that eliminates waste by reducing costs in the overall production process, in operations
within that process, and in the utilisation of production labour. Inventory waste is also
eliminated by producing to customer order rather than to forecasted requirements.
In more recent times, some businesses have combined the ideas of Six Sigma and Lean
management, to produce a method called Lean Six Sigma (LSS), to emphasise the quality
and service improvement process offered by Six Sigma and the productivity and cost
reduction tools offered by Lean management. Thus LSS improvement is brought out of
manufacturing and into services as much of the world economy is now based on services
rather than manufacturing.
When we surveyed the application of LSS approach locally, we found that most
research usually focuses on the process improvement of manufacturing spots and
ISSN 1478-3363 print/ISSN 1478-3371 online
# 2010 Taylor & Francis
DOI: 10.1080/14783360903553248
http://www.informaworld.com
�Email: [email protected]
Total Quality Management
Vol. 21, No. 3, March 2010, 301–315
Dow
nloa
ded
by [
Nat
iona
l Tai
wan
Uni
vers
ity]
at 2
0:55
18
Oct
ober
201
1
seldom discusses business performance from the viewpoint of the service industry,
especially in banking services, which is the most critical topic in service operations.
Service operations now comprise more than 80% of the GDP in the United States and
are rapidly growing around the world, and banking services are the most critical
concern in the service industry. It is necessary to find a method to improve the performance
of service operations. LSS for service is a business improvement methodology that maxi-
mises shareholder value by achieving the fastest rate of improvement in customer satisfac-
tion, cost, quality, process speed and invested capital. Most of the applications of LSS used
in the improve phase rely on psychological brainstorming tools that make the improve-
ment inadequately. There is lack of a systematic method in the improve phase of LSS.
The theory of inventive problem solving (TRIZ) is a systematic methodology that
allows creative problems in any field of knowledge to be revealed and solved, while devel-
oping creative (inventive) thinking skills and a creative personality. Often at the root of a
problem’s solution lies what seems at first glance to be a wild idea. TRIZ gives one the
ability not only to be prepared for such ideas, but to create them. TRIZ is an effective
method for analysing customer needs and developing innovative solutions to meet
customer needs. Here, we propose a new approach that integrates TRIZ into the
improve phase of the LSS approach to illustrate the business improvement for the
service industry focusing on banking services.
The rest of this paper is organised as follows. Section 2 reviews the related research on
LSS and TRIZ methodology. Section 3 describes a case study using our proposed method
to improve the business performance in banking services. The final section presents the
conclusions and directions for future research.
Literature review
In the past, Six Sigma and the principles behind Lean management have often seemed
more like competitors than co-conspirators. The recent LSS approach in general
outline is a powerful action plan for dramatically improving quality, increasing speed
and reducing waste. Arnheiter and Maleyeff (2005) suggested that a LSS organisation
would capitalise on the strengths of both Lean management and Six Sigma. There are
many examples of implementing the LSS approach in the manufacturing industry.
Pickrell et al. (2005) presented two case studies for LSS projects completed at a world-
wide manufacturer of precision slip rings and integrated motion systems for high
performance requirements in military and commercial aircraft, satellites and space
vehicles, missiles, and automated industrial machinery. The results show that the LSS
approach can reduce the costs, cycle time, customer returns and inventory, and increase
in production capacity.
Furterer and Elshennawy (2005) presented a case study of applying Lean and Six
Sigma tools and principles to improving the quality and timeliness in a city’s finance
department. After implementing a LSS programme, the time to process payroll, purchas-
ing and accounts payable were reduced by 60%, 40% and 87%, respectively. Heuvel et al.
(2006) stated that hospitals faced major challenges where patients demand that quality of
care be improved continuously and health insurance companies demand the lowest poss-
ible prices. They applied a LSS programme to help healthcare providers to achieve these
conflicting goals. Koning et al. (2006) illustrated how principles of Lean thinking and Six
Sigma can be combined to provide an effective framework for producing systematic inno-
vation efforts in healthcare and emphasised that a service operation requires systematic
innovation efforts to remain competitive, cost efficient, and up to date.
302 F.-K. Wang and K.-S. Chen
Dow
nloa
ded
by [
Nat
iona
l Tai
wan
Uni
vers
ity]
at 2
0:55
18
Oct
ober
201
1
The theory of inventive problem solving (TRIZ) is a science that allows creative pro-
blems in any field of knowledge to be revealed and solved, while developing creative
(inventive) thinking skills and a creative personality (Altshuller, 2000). Often at the root
of a problem’s solution lies what seems at first glance to be a wild idea. TRIZ gives one
the ability not only to be prepared for such ideas, but to create them. TRIZ is the knowl-
edge-based, systematic approach to innovation. TRIZ methods are drawn from analysis
of the most innovative inventions in different industries, technologies, and fields of engin-
eering. These principles can be used to consciously develop a system along its path of tech-
nical evolution. It has been proved that TRIZ is a powerful problem-solving methodology
through its development over about 60 years. TRIZ provides people with a dialectic way of
thinking, which guides us to understand the problem as a system, to get an image of the ideal
solution first and to promote the performance of products by solving contradictions. Domb
and Dettmer (1999) reported that inventors using TRIZ experienced an improvement of
70% to 300% or more in the number of creative ideas that they generated for solving tech-
nical problems and in the speed with which they generated innovative ideas.
Many researches that integrate or compare TRIZ with different creativity tools,
methods and philosophies have shown that TRIZ provides the most useful help to
designers for developing high-level products and service application as well. Manufactur-
ing is an area wherein one can easily find applications of TRIZ integrated with problem-
solving tools (Stratton & Mann, 2003; Stratton & Warburton, 2003). During the
application, it is important to define the conflicts, and then based on the conflicts, to
develop innovative solutions. The service industry is an area where TRIZ is difficult to
apply; but along with its fast development and its integration with problem-solving
tools, integrated methods have been applied in this area (King, 2004).
Lean Six Sigma with TRIZ
No matter what the approach is for deploying improvements within the company, having a
standard improvement model like DMAIC (Define, Measure, Analyse, Improve, Control)
is extremely helpful because it provides the company with an improvement roadmap.
There are a lot of resources out there that describe the DMAIC process. Generally, after
the project’s definition phase, key process characteristics are identified and benchmarked
in the measure and analyse phases; this is then followed by the improve phase where a
process is modified for better performance, and the control phase aims at monitoring
and sustaining the gains. The basic elements and key tools in LSS DMAIC are as follows.
In the define phase, a team and its sponsors reach agreement on what the project is and
what it should accomplish. They should establish some metrics to measure the success of
the project, such as customer satisfaction, speed or lead time, sigma level improvement,
and financial outcomes. In order to accomplish the objectives of this step, a tool is used
to help in confirming or refining project scope and boundaries. A common tool is a
SIPOC diagram which includes Suppliers, Inputs, Process, Outputs and Customers for
creating a high-level map of process:
. Suppliers – the entities that provide whatever is worked on in the process. The
supplier may be an outside vendor or another division or a co-worker.. Inputs – the information or material provided.. Process – the steps used to transfer (both those that add value and those do not add value).. Outputs – the product, service or information being sent to the customer (preferably
emphasising critical quality features).
Total Quality Management 303
Dow
nloa
ded
by [
Nat
iona
l Tai
wan
Uni
vers
ity]
at 2
0:55
18
Oct
ober
201
1
. Customers – the next step in the process, or the final customers. A core principle of
LSS is that defects can relate to anything that makes a customer unhappy, such as
long lead time, poor quality, or high cost, for instance.
To address any of these problems, the first step is to take a process view of how the
company goes about satisfying a particular customer requirement.
In the measure phase, the performance standard of the process is verified and estab-
lished to obtain a baseline for future improvements. One of the major advances of LSS
is its demand for data-driven management. Most other problem-solving methodologies
tended to dive from identifying a project into the improve phrase without sufficient data
to really understand the underlying causes of the problem. A service that is trying to
improve the process will spend a great deal of its time dealing with data problems.
There are a lot of measure tools that includes everything from data collection to brain-
storming methods and prioritising tools. Some of the most common tools are process
description tools (value stream maps, process cycle efficiency, and time value analysis),
focus/prioritisation tools (FMEA (failure mode and effects analysis), Pareto), data collec-
tion, and quantifying and describing variation (control charts).
The purpose of the analyse phase is to make sense of all information and data collection in
the measure phase, and to use that data to confirm the source of delays, waste and poor quality.
The most common tools used in the analyse phase are those used to map out and explore cause
and effect relationships such as ‘5 Whys’ analysis, cause and effect diagrams, scatter plots,
etc. One of the major themes of LSS is that slow processes are expensive processes. Value
stream mapping analysis is also a key tool for a team to identify the hidden time traps, and
to find out the root causes to achieve a substantial increase in value-added time in process.
The purpose of the improve phase is to make changes in a process that will eliminate
the defects, waste, costs, etc. Common tools are those such as solution matrices that link
brainstormed solution alternatives to customer needs and the project purpose. Many of
the Lean tools play their most important role in the improve phase, for instance the pull
system, set-up reduction, queuing methods for reducing congestion and delays, and 5s
(structurise, systemise, sanitise, standardise and self-discipline). As regards the service
industry, in particular the banking service, the above-mentioned tools for the improve
phase would be insufficient to solve the problem. Here we introduce TRIZ methodology
to substitute the tools. TRIZ provides people with a dialectic way of thinking, which
guides us to understand the problem as a system, to visualise the ideal solution first and to
promote the performance of products by solving contradictions. Except for the areas of
science and technology, TRIZ also has been applied to non-technical problems.
The purpose of the control phase is to make sure that any gains made will be preserved
until new knowledge and data show that there is an even better way to operate the process.
There are some areas of control that are critical in service environments, such as making sure
the improved process is documented, turning results into dollars, ensuring that maintenance
of gains is verified down the road, ensuring that an automatic monitoring system is installed
which will identify any ‘out of control’ situation, piloting the implementation, and develop-
ing a control plan. A control chart is one of the key control tools; mistake prevention and
mistake proofing are two other very helpful closely related concepts in the control phase.
Case study
We proposed a new approach that integrated TRIZ into the improve phase of the LSS
approach to demonstrate performance improvement in banking services. The case study
304 F.-K. Wang and K.-S. Chen
Dow
nloa
ded
by [
Nat
iona
l Tai
wan
Uni
vers
ity]
at 2
0:55
18
Oct
ober
201
1
in this research is a practical project involved in improving wealth management and
customer services in a representative savings bank. The case company called company-T
was established in 1966. During many years of operation, the company has provided a com-
plete range of services, including savings deposits, loans, guarantees, foreign exchange,
overseas banking unit (OBU), trusts, credit cards, cash cards, securities, bonds, financial
derivatives, electronic banking, etc. The growth of the company has been closely linked
to Taiwan’s economic development, as the company both experienced and played a part
in the formation and development of the country’s financial market. To enhance customers’
satisfaction and improve competitive advantage in the banking industry is very important.
In order to strengthen its position in 2006, in view of the hyper-competition in business, the
top management of company-T determined to gain further competitive advantage by utilis-
ing the Lean Six Sigma approach. One of the projects was to improve the operation of
savings accounts. Others include cycle time reduction of call centres, IT process redesign
and improvement of the operation of remittance based on the KPIs (key performance
indicators) of MBO (management by objectives) in the company’s yearly plan.
The sample of the savings account project was selected in this article because the
project is very important for both internal and external customers. The representative
activities of the LSS approach and TRIZ in this case study are demonstrated as follows.
Define phase
In the define phase there are three steps:
Step 1
Identify the important problems and select the project – according to the experience of
company-T, it takes much more time and resources to serve the customers as compared
to the expectations of top management and external customers. Consequently, it was ident-
ified that the important problem was to shorten the cycle time of operation of the savings
account. Thus, for better turnover efficiency, according to the voices of customers, the
project title is identified as ‘to reduce the cycle time of operation in savings account’.
Step 2
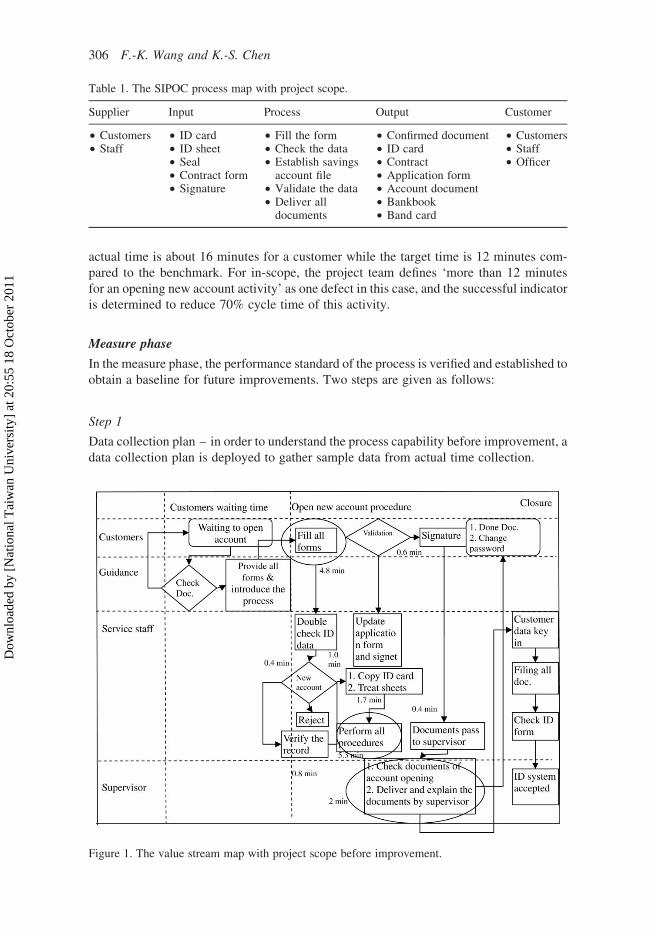
Define the value stream map and determine the vital few factors – based on step 1, the
project team analyses the high-level process of SIPOC-related activities and value
stream map. It is a very effective and important communication tool in service operation.
It ensures that the team members are all reviewing the process in the same way. It also
informs leadership of exactly what the team is working on. The process is mapped at a
high level. Then working from the right, identify the customers, the outputs, the inputs
and the suppliers as shown in Table 1. Based on the high-level process of SIPOC, and
the value stream map of the project which the activity is ‘value added’ or ‘non-value
added’ as the process of Figure 1. According to the value stream map as shown in
Figure 1, all procedures as circled will be identified the main problems in this project.
Step 3
Define defects and determine the successful indicators – according to the cycle time col-
lection from the value stream map, there is approximately 40% difference between target
and actual time in the banking service activities for opening a new account, i.e. the average
Total Quality Management 305
Dow
nloa
ded
by [
Nat
iona
l Tai
wan
Uni
vers
ity]
at 2
0:55
18
Oct
ober
201
1
actual time is about 16 minutes for a customer while the target time is 12 minutes com-
pared to the benchmark. For in-scope, the project team defines ‘more than 12 minutes
for an opening new account activity’ as one defect in this case, and the successful indicator
is determined to reduce 70% cycle time of this activity.
Measure phase
In the measure phase, the performance standard of the process is verified and established to
obtain a baseline for future improvements. Two steps are given as follows:
Step 1
Data collection plan – in order to understand the process capability before improvement, a
data collection plan is deployed to gather sample data from actual time collection.
Table 1. The SIPOC process map with project scope.
Supplier Input Process Output Customer
† Customers† Staff
† ID card† ID sheet† Seal† Contract form† Signature
† Fill the form† Check the data† Establish savings
account file† Validate the data† Deliver all
documents
† Confirmed document† ID card† Contract† Application form† Account document† Bankbook† Band card
† Customers† Staff† Officer
Figure 1. The value stream map with project scope before improvement.
306 F.-K. Wang and K.-S. Chen
Dow
nloa
ded
by [
Nat
iona
l Tai
wan
Uni
vers
ity]
at 2
0:55
18
Oct
ober
201
1
Step 2
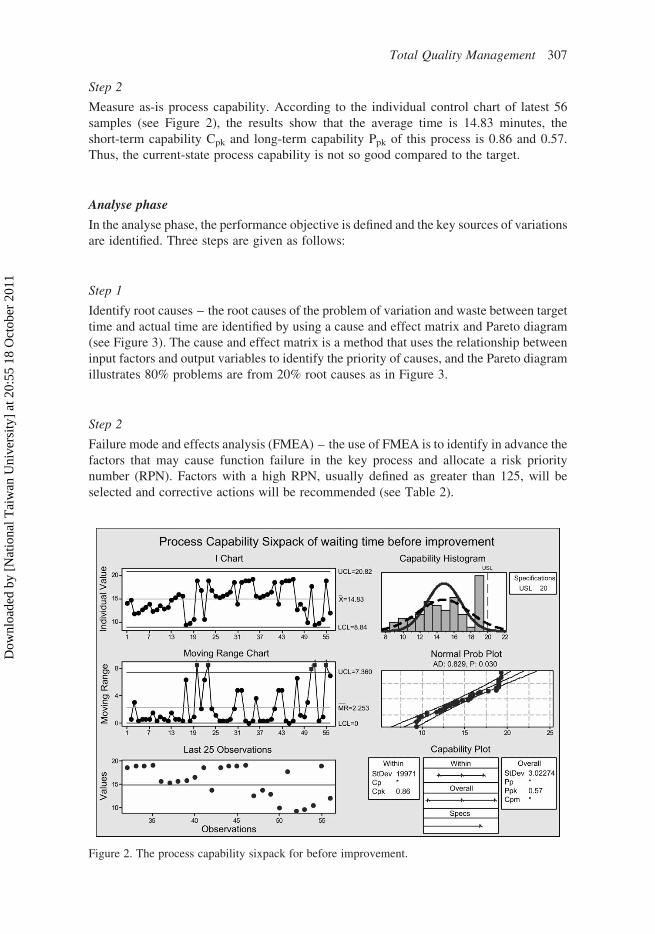
Measure as-is process capability. According to the individual control chart of latest 56
samples (see Figure 2), the results show that the average time is 14.83 minutes, the
short-term capability Cpk and long-term capability Ppk of this process is 0.86 and 0.57.
Thus, the current-state process capability is not so good compared to the target.
Analyse phase
In the analyse phase, the performance objective is defined and the key sources of variations
are identified. Three steps are given as follows:
Step 1
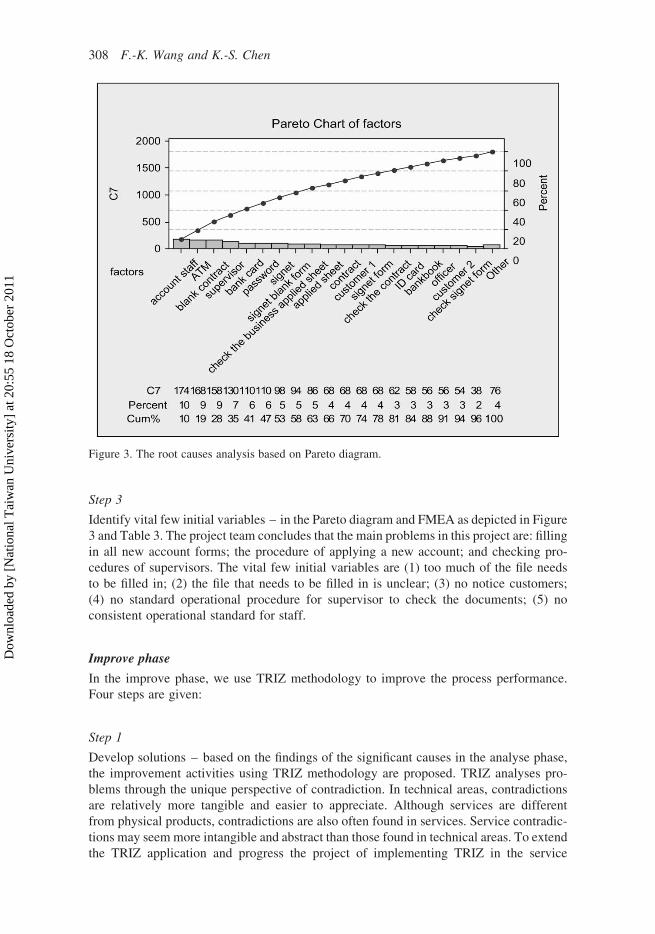
Identify root causes – the root causes of the problem of variation and waste between target
time and actual time are identified by using a cause and effect matrix and Pareto diagram
(see Figure 3). The cause and effect matrix is a method that uses the relationship between
input factors and output variables to identify the priority of causes, and the Pareto diagram
illustrates 80% problems are from 20% root causes as in Figure 3.
Step 2
Failure mode and effects analysis (FMEA) – the use of FMEA is to identify in advance the
factors that may cause function failure in the key process and allocate a risk priority
number (RPN). Factors with a high RPN, usually defined as greater than 125, will be
selected and corrective actions will be recommended (see Table 2).
Figure 2. The process capability sixpack for before improvement.
Total Quality Management 307
Dow
nloa
ded
by [
Nat
iona
l Tai
wan
Uni
vers
ity]
at 2
0:55
18
Oct
ober
201
1
Step 3
Identify vital few initial variables – in the Pareto diagram and FMEA as depicted in Figure
3 and Table 3. The project team concludes that the main problems in this project are: filling
in all new account forms; the procedure of applying a new account; and checking pro-
cedures of supervisors. The vital few initial variables are (1) too much of the file needs
to be filled in; (2) the file that needs to be filled in is unclear; (3) no notice customers;
(4) no standard operational procedure for supervisor to check the documents; (5) no
consistent operational standard for staff.
Improve phase
In the improve phase, we use TRIZ methodology to improve the process performance.
Four steps are given:
Step 1
Develop solutions – based on the findings of the significant causes in the analyse phase,
the improvement activities using TRIZ methodology are proposed. TRIZ analyses pro-
blems through the unique perspective of contradiction. In technical areas, contradictions
are relatively more tangible and easier to appreciate. Although services are different
from physical products, contradictions are also often found in services. Service contradic-
tions may seem more intangible and abstract than those found in technical areas. To extend
the TRIZ application and progress the project of implementing TRIZ in the service
Figure 3. The root causes analysis based on Pareto diagram.
308 F.-K. Wang and K.-S. Chen
Dow
nloa
ded
by [
Nat
iona
l Tai
wan
Uni
vers
ity]
at 2
0:55
18
Oct
ober
201
1
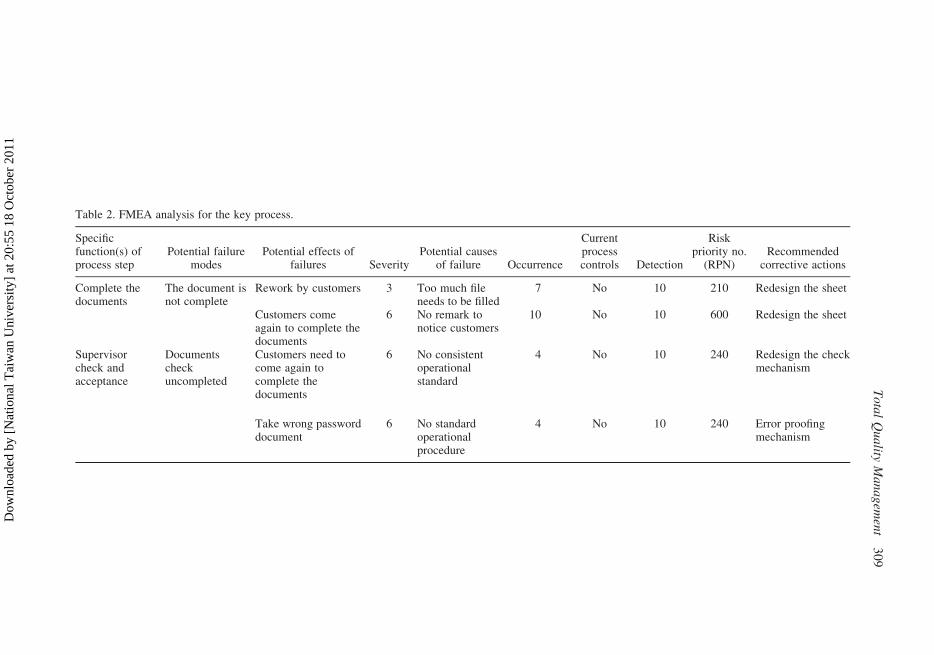
Table 2. FMEA analysis for the key process.
Specificfunction(s) ofprocess step
Potential failuremodes
Potential effects offailures Severity
Potential causesof failure Occurrence
Currentprocesscontrols Detection
Riskpriority no.
(RPN)Recommended
corrective actions
Complete thedocuments
The document isnot complete
Rework by customers 3 Too much fileneeds to be filled
7 No 10 210 Redesign the sheet
Customers comeagain to complete thedocuments
6 No remark tonotice customers
10 No 10 600 Redesign the sheet
Supervisorcheck andacceptance
Documentscheckuncompleted
Customers need tocome again tocomplete thedocuments
6 No consistentoperationalstandard
4 No 10 240 Redesign the checkmechanism
Take wrong passworddocument
6 No standardoperationalprocedure
4 No 10 240 Error proofingmechanism
To
tal
Qu
ality
Ma
na
gem
ent
30
9
Dow
nloa
ded
by [
Nat
iona
l Tai
wan
Uni
vers
ity]
at 2
0:55
18
Oct
ober
201
1
industry, 40 non-technical inventive principles with applications in service operations
(Saliminamin & Nezafati, 2003) will be applied in this case to solve the service contradic-
tions. Based on the professional analysis in the analyse phase and the experience of the
project team, it could be observed that customer satisfaction is the primary problem.
Improvement of customer satisfaction becomes the goal of the company as it tries to
gain a competitive advantage in the operation of its business. The other problems
include extra costs due to waiting time of operation and working errors. For this
purpose, the project team delivered new business solutions to customers. From this,
improved customer satisfaction, operation cost and time management are acquired
through the useful functions of improving operational availability and enhancing the oper-
ational performance. However, the harmful functions (HF) of an operation cost and
waiting of service availability are accompanied by a corresponding increase in the com-
pany’s total operation cost. Since there are inherent contradicting relationships existing
in this situation, we could identify the problems to be within the various areas of the
operation’s efficiency, waiting time, cost of operation, and performance of operation.
To improve the performance of the accounting operation, the project team attempted to
simplify the checking process of opening an account, enhance the filing capacity,
shorten waiting times, and enhance ease of use within the operations. Corresponding to
the definition of the 39 features of the contradiction matrix, the features will be considered
for improvement as follows:
. 3 Speed (corresponding to the operation’s efficiency).
. 19 Loss of time (corresponding to waiting time).
. 27 Ease of use (corresponding to ease of use).
. 32 Extent of automation (corresponding to simplify the checking process).
On the other hand, in the process redesigns, the risk will be increased when the new
process is released, and the operation becomes complex. Add to these the difficulties
encountered and we now come up with the worsening situations occurring in the new oper-
ation. Hence, we consider the following contradiction matrix as the ones which became
worse:
. 2 Weight of stationary object (shorten the waiting time, the voice of customer will be
ignored).. 21 Reliability (simplify the checking process, the performance will be worse).
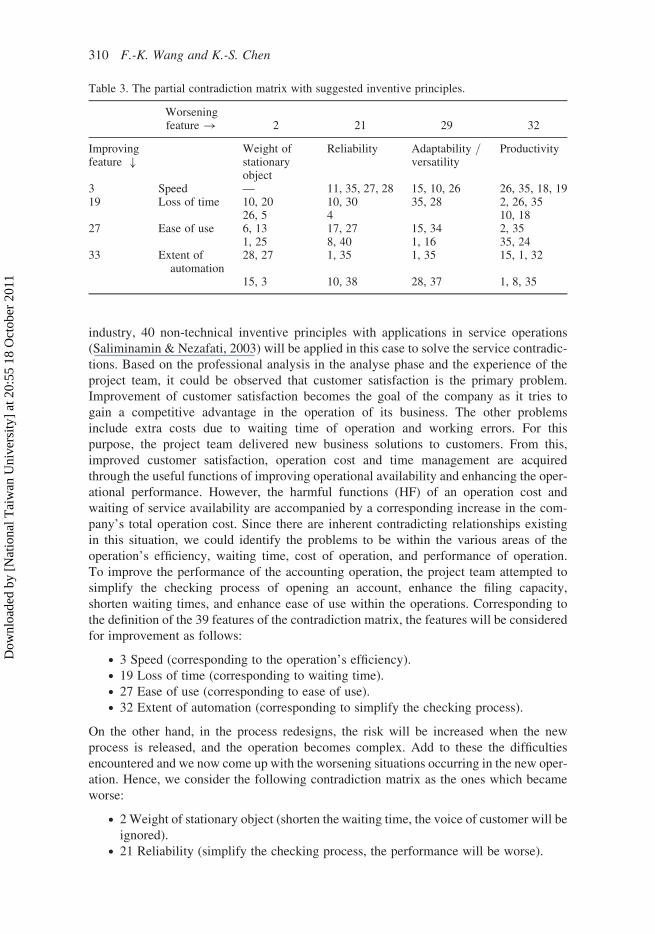
Table 3. The partial contradiction matrix with suggested inventive principles.
Worseningfeature ! 2 21 29 32
Improvingfeature �
Weight ofstationaryobject
Reliability Adaptability /versatility
Productivity
3 Speed — 11, 35, 27, 28 15, 10, 26 26, 35, 18, 1919 Loss of time 10, 20 10, 30 35, 28 2, 26, 35
26, 5 4 10, 1827 Ease of use 6, 13 17, 27 15, 34 2, 35
1, 25 8, 40 1, 16 35, 2433 Extent of
automation28, 27 1, 35 1, 35 15, 1, 32
15, 3 10, 38 28, 37 1, 8, 35
310 F.-K. Wang and K.-S. Chen
Dow
nloa
ded
by [
Nat
iona
l Tai
wan
Uni
vers
ity]
at 2
0:55
18
Oct
ober
201
1
. 29 Adaptability/Versatility (enhance the filing capacity, the operation system will
be limited).. 33 Productivity (enhance ease of use, the output of operation will be worse).
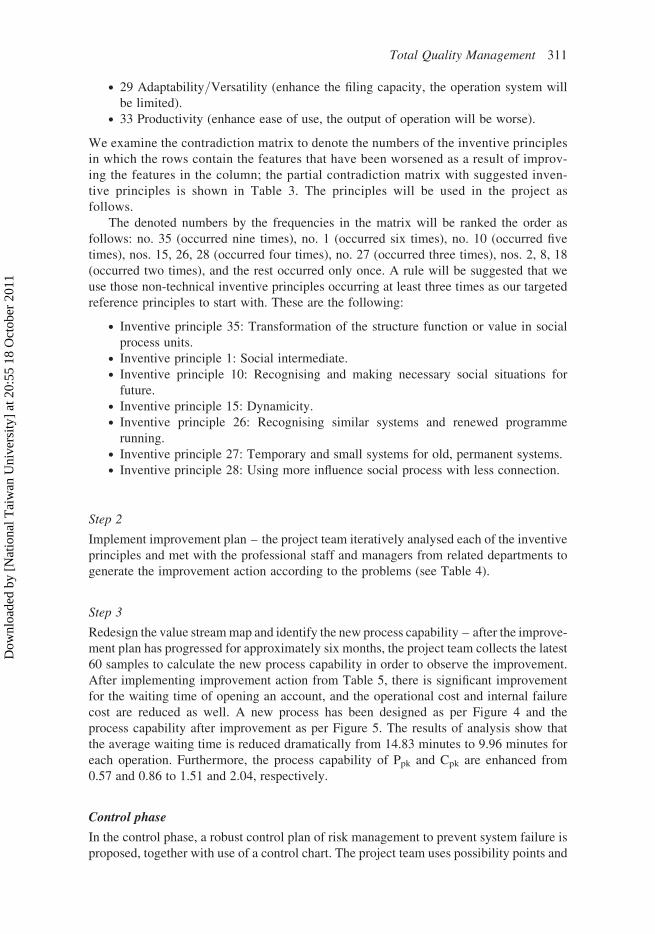
We examine the contradiction matrix to denote the numbers of the inventive principles
in which the rows contain the features that have been worsened as a result of improv-
ing the features in the column; the partial contradiction matrix with suggested inven-
tive principles is shown in Table 3. The principles will be used in the project as
follows.
The denoted numbers by the frequencies in the matrix will be ranked the order as
follows: no. 35 (occurred nine times), no. 1 (occurred six times), no. 10 (occurred five
times), nos. 15, 26, 28 (occurred four times), no. 27 (occurred three times), nos. 2, 8, 18
(occurred two times), and the rest occurred only once. A rule will be suggested that we
use those non-technical inventive principles occurring at least three times as our targeted
reference principles to start with. These are the following:
. Inventive principle 35: Transformation of the structure function or value in social
process units.. Inventive principle 1: Social intermediate.. Inventive principle 10: Recognising and making necessary social situations for
future.. Inventive principle 15: Dynamicity.. Inventive principle 26: Recognising similar systems and renewed programme
running.. Inventive principle 27: Temporary and small systems for old, permanent systems.. Inventive principle 28: Using more influence social process with less connection.
Step 2
Implement improvement plan – the project team iteratively analysed each of the inventive
principles and met with the professional staff and managers from related departments to
generate the improvement action according to the problems (see Table 4).
Step 3
Redesign the value stream map and identify the new process capability – after the improve-
ment plan has progressed for approximately six months, the project team collects the latest
60 samples to calculate the new process capability in order to observe the improvement.
After implementing improvement action from Table 5, there is significant improvement
for the waiting time of opening an account, and the operational cost and internal failure
cost are reduced as well. A new process has been designed as per Figure 4 and the
process capability after improvement as per Figure 5. The results of analysis show that
the average waiting time is reduced dramatically from 14.83 minutes to 9.96 minutes for
each operation. Furthermore, the process capability of Ppk and Cpk are enhanced from
0.57 and 0.86 to 1.51 and 2.04, respectively.
Control phase
In the control phase, a robust control plan of risk management to prevent system failure is
proposed, together with use of a control chart. The project team uses possibility points and
Total Quality Management 311
Dow
nloa
ded
by [
Nat
iona
l Tai
wan
Uni
vers
ity]
at 2
0:55
18
Oct
ober
201
1
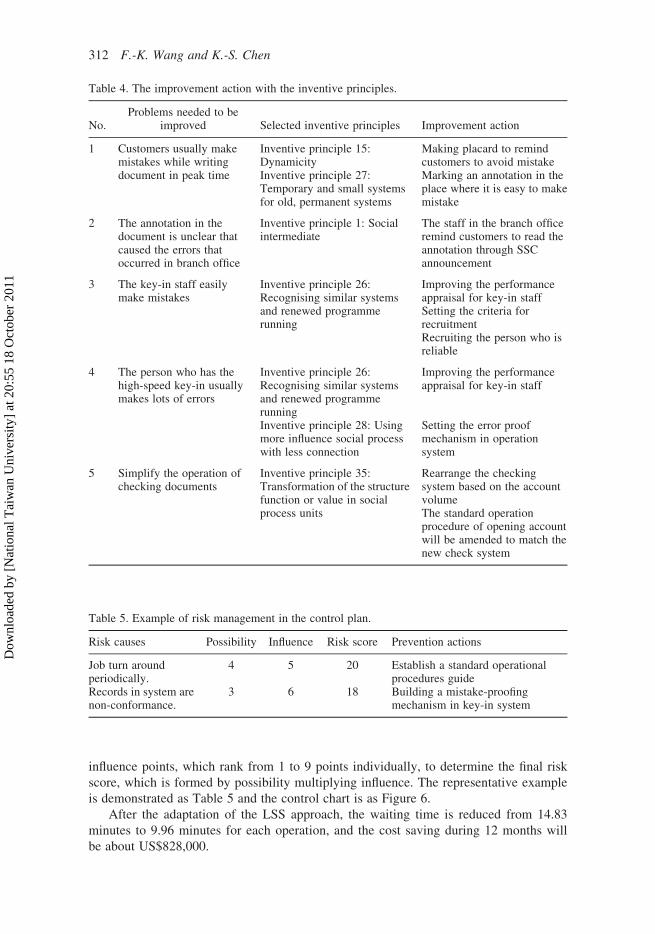
influence points, which rank from 1 to 9 points individually, to determine the final risk
score, which is formed by possibility multiplying influence. The representative example
is demonstrated as Table 5 and the control chart is as Figure 6.
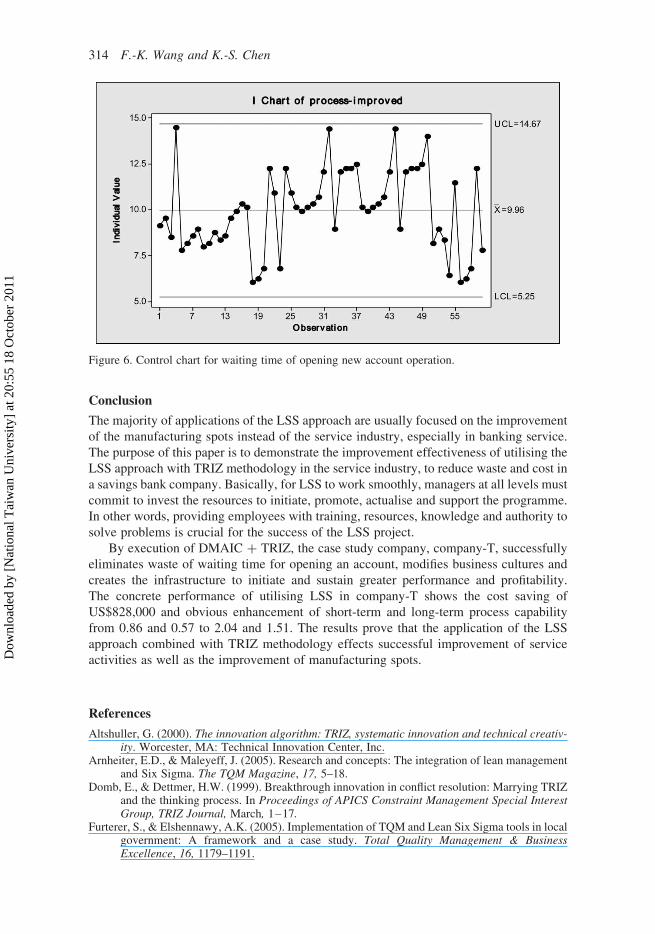
After the adaptation of the LSS approach, the waiting time is reduced from 14.83
minutes to 9.96 minutes for each operation, and the cost saving during 12 months will
be about US$828,000.
Table 4. The improvement action with the inventive principles.
No.Problems needed to be
improved Selected inventive principles Improvement action
1 Customers usually makemistakes while writingdocument in peak time
Inventive principle 15:Dynamicity
Making placard to remindcustomers to avoid mistake
Inventive principle 27:Temporary and small systemsfor old, permanent systems
Marking an annotation in theplace where it is easy to makemistake
2 The annotation in thedocument is unclear thatcaused the errors thatoccurred in branch office
Inventive principle 1: Socialintermediate
The staff in the branch officeremind customers to read theannotation through SSCannouncement
3 The key-in staff easilymake mistakes
Inventive principle 26:Recognising similar systemsand renewed programmerunning
Improving the performanceappraisal for key-in staffSetting the criteria forrecruitmentRecruiting the person who isreliable
4 The person who has thehigh-speed key-in usuallymakes lots of errors
Inventive principle 26:Recognising similar systemsand renewed programmerunning
Improving the performanceappraisal for key-in staff
Inventive principle 28: Usingmore influence social processwith less connection
Setting the error proofmechanism in operationsystem
5 Simplify the operation ofchecking documents
Inventive principle 35:Transformation of the structurefunction or value in socialprocess units
Rearrange the checkingsystem based on the accountvolumeThe standard operationprocedure of opening accountwill be amended to match thenew check system
Table 5. Example of risk management in the control plan.
Risk causes Possibility Influence Risk score Prevention actions
Job turn aroundperiodically.
4 5 20 Establish a standard operationalprocedures guide
Records in system arenon-conformance.
3 6 18 Building a mistake-proofingmechanism in key-in system
312 F.-K. Wang and K.-S. Chen
Dow
nloa
ded
by [
Nat
iona
l Tai
wan
Uni
vers
ity]
at 2
0:55
18
Oct
ober
201
1
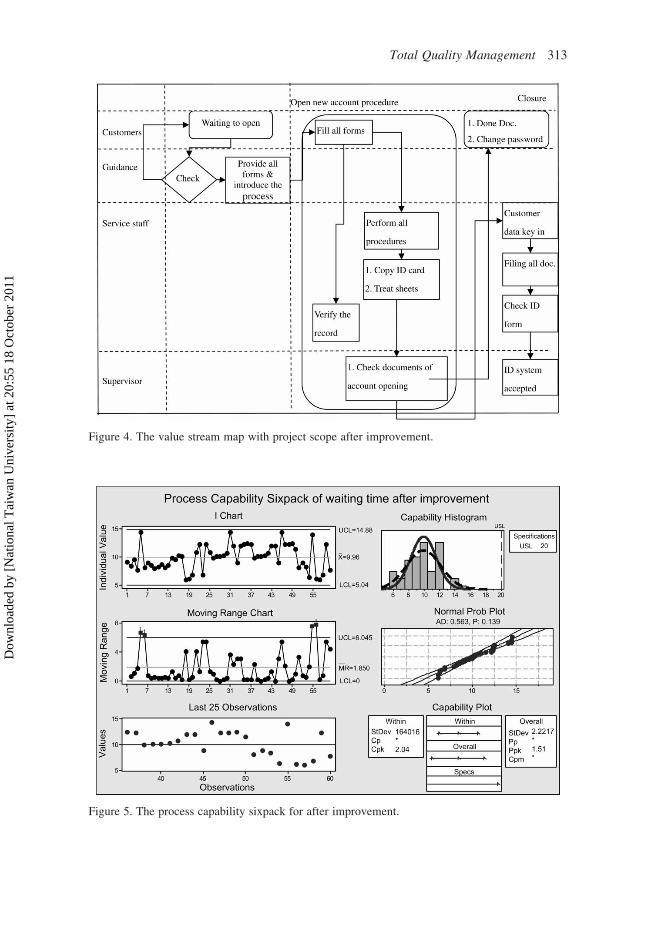
Figure 4. The value stream map with project scope after improvement.
Figure 5. The process capability sixpack for after improvement.
Total Quality Management 313
Dow
nloa
ded
by [
Nat
iona
l Tai
wan
Uni
vers
ity]
at 2
0:55
18
Oct
ober
201
1
Conclusion
The majority of applications of the LSS approach are usually focused on the improvement
of the manufacturing spots instead of the service industry, especially in banking service.
The purpose of this paper is to demonstrate the improvement effectiveness of utilising the
LSS approach with TRIZ methodology in the service industry, to reduce waste and cost in
a savings bank company. Basically, for LSS to work smoothly, managers at all levels must
commit to invest the resources to initiate, promote, actualise and support the programme.
In other words, providing employees with training, resources, knowledge and authority to
solve problems is crucial for the success of the LSS project.
By execution of DMAIC þ TRIZ, the case study company, company-T, successfully
eliminates waste of waiting time for opening an account, modifies business cultures and
creates the infrastructure to initiate and sustain greater performance and profitability.
The concrete performance of utilising LSS in company-T shows the cost saving of
US$828,000 and obvious enhancement of short-term and long-term process capability
from 0.86 and 0.57 to 2.04 and 1.51. The results prove that the application of the LSS
approach combined with TRIZ methodology effects successful improvement of service
activities as well as the improvement of manufacturing spots.
References
Altshuller, G. (2000). The innovation algorithm: TRIZ, systematic innovation and technical creativ-ity. Worcester, MA: Technical Innovation Center, Inc.
Arnheiter, E.D., & Maleyeff, J. (2005). Research and concepts: The integration of lean managementand Six Sigma. The TQM Magazine, 17, 5–18.
Domb, E., & Dettmer, H.W. (1999). Breakthrough innovation in conflict resolution: Marrying TRIZand the thinking process. In Proceedings of APICS Constraint Management Special InterestGroup, TRIZ Journal, March, 1–17.
Furterer, S., & Elshennawy, A.K. (2005). Implementation of TQM and Lean Six Sigma tools in localgovernment: A framework and a case study. Total Quality Management & BusinessExcellence, 16, 1179–1191.
Figure 6. Control chart for waiting time of opening new account operation.
314 F.-K. Wang and K.-S. Chen
Dow
nloa
ded
by [
Nat
iona
l Tai
wan
Uni
vers
ity]
at 2
0:55
18
Oct
ober
201
1

George, M.L. (2003). Lean Six Sigma for service: How to use Lean speed and Six Sigma quality toimprove services and transactions. New York: McGraw-Hill.
Heuvel, J.V.D., Ronald, J.M.M., Does, R.J.M.M., & Koning, H.D. (2006). Lean Six Sigma in a hos-pital. International Journal of Six Sigma and Competitive Advantage, 2, 377–388.
King, R.K. (2004). Enhancing SWOT analysis using TRIZ and the bipolar conflict graph: A casestudy on Microsoft corporation. In Proceedings of TRIZCON2004, 6th Annual Conferenceof the Altshuller Institute for TRIZ Studies, April 25–27, 2004, Seattle, WA, USA.
Koning, H., Verver, H.P.S., Heuvel, J., Bisgaard, S., & Does, R.J.M.M. (2006). Lean Six Sigma inhealthcare. Journal for Healthcare Quality, 28(2), 4–11.
Pfeifer, T., & Tillmann, M. (2003). Innovative process chain optimization – utilizing the tools ofTRIZ and TOC manufacturing. ETRIA World Conference: TRIZ Future 2003, November12–14, 2003, Technologiezentrum am Europaplatz, Aachen, Germany.
Pickrell, G., Lyons, H.J., & Shaver, J. (2005). Lean Six Sigma implementation case studies.International Journal of Six Sigma and Competitive Advantage, 1, 369–379.
Saliminamin, M.H., & Nezafati, N. (2003). A new method for creating non-technological principlesof TRIZ. The TRIZ Journal, October issue. Retrieved from http://www.triz-journal.com.
Stratton, R., & Mann, D. (2003). Systematic innovation and the underlying principles behind TRIZand TOC. Journal of Materials Processing Technology, 139, 120–126.
Stratton, R., & Warburton, R.D.H. (2003). The strategic integration of agile and lean supply.International Journal of Production Economics, 85, 183–198.
Total Quality Management 315
Dow
nloa
ded
by [
Nat
iona
l Tai
wan
Uni
vers
ity]
at 2
0:55
18
Oct
ober
201
1