PORTSMOUTH CITY COUNCIL
1
Appendix A. Local air quality problem and underlying causes
A.1. Introduction
This appendix provides supporting data in relation to the Strategic Case set out in Chapter 2
(primarily Section 2.2 Local air quality problem).
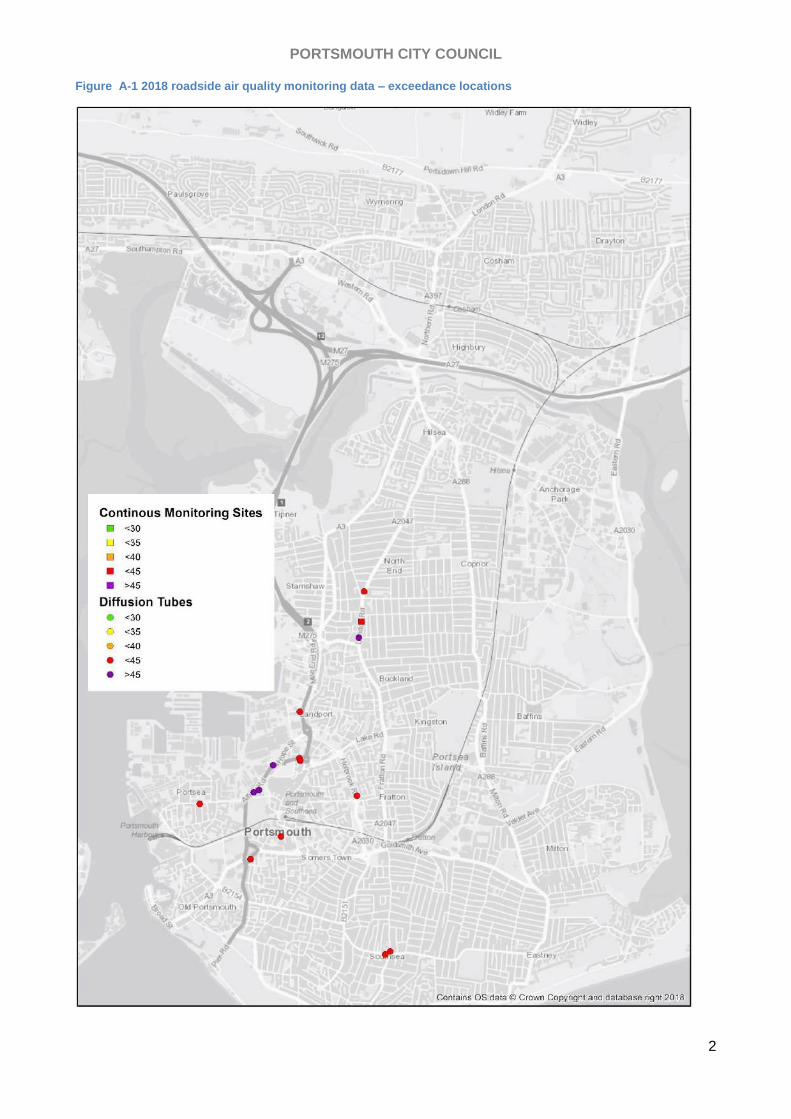
A.2. 2018 roadside monitoring data
PCC currently has 107 diffusion tube locations, with 59 new locations added during 2018 and 4
continuous air quality monitoring stations (CAQMs) to measure local air quality.
Further detail can be found in the 2019 Air Quality Annual Status Report (June 2019).
Table A-1 2018 roadside air quality monitoring data – exceedance locations
Site
ID
Exceedance locations Annual mean emissions
– Bias adjusted (0.891)
and annualised
117 A3 - Alfred Road Column 9 (AR-Col 9) 50.42
118 A3 - Alfred Road Column 12 (AR-Col 12) 50.38
120 A3 - Alfred Road Opposite MW-StABS (MW-OppStABS) 47.51
46 A3 - Mile End Road Column 5 (MERCol5) 44.51
26 A2047 - "The Tap Pub" London Road (Tap PH) 46.02
108 A2047 - 137 London Road (LR-137) 44.18
37 A2047 – London Road (continuous monitoring site) 40.57
94 Fratton - 2&3 Selborn Terrace Changed to Column5 Fratton Road
(FR-Col5)
40.33
133 Fratton - Labour Party Club Holbrook Road (HR-LPC) – Based on
two months only.
43.07
1 City Centre - Lord Montgomery Way (FST) (St Michael’s Gyratory) 42.92
45 City Centre - Opposite 6 Market Way (Opp MW-6) 41.97
44 City Centre - 4 Market Way (MW-4) 40.41
50 City Centre - Queen Street-47 (QS-47) 40.37
84 Southsea - Albert Road-145 on Lawrence Road (AR-145) 42.82
85 Southsea - Albert Road-98/100 (AR-98/100) 40.41
PORTSMOUTH CITY COUNCIL
2
Figure A-1 2018 roadside air quality monitoring data – exceedance locations

PORTSMOUTH CITY COUNCIL
3
A.3. Contributory factors
A.3.1. Background air quality
Figure A-2 1km grid squares used by Defra to model background air quality concentrations

PORTSMOUTH CITY COUNCIL
4
A.3.2. Traffic characteristics
Traffic volume
Figure A-3 2022 two-way flows in 2022 (SRTM, 2022)
P:\GBEMB\TP\HA\PROJECTS\5185637 - PCC AQ Plan - ROBI2323\40. Technical\07b. AQ baseline\Traffic flow analysis\Two-way
traffic flows
PORTSMOUTH CITY COUNCIL
5
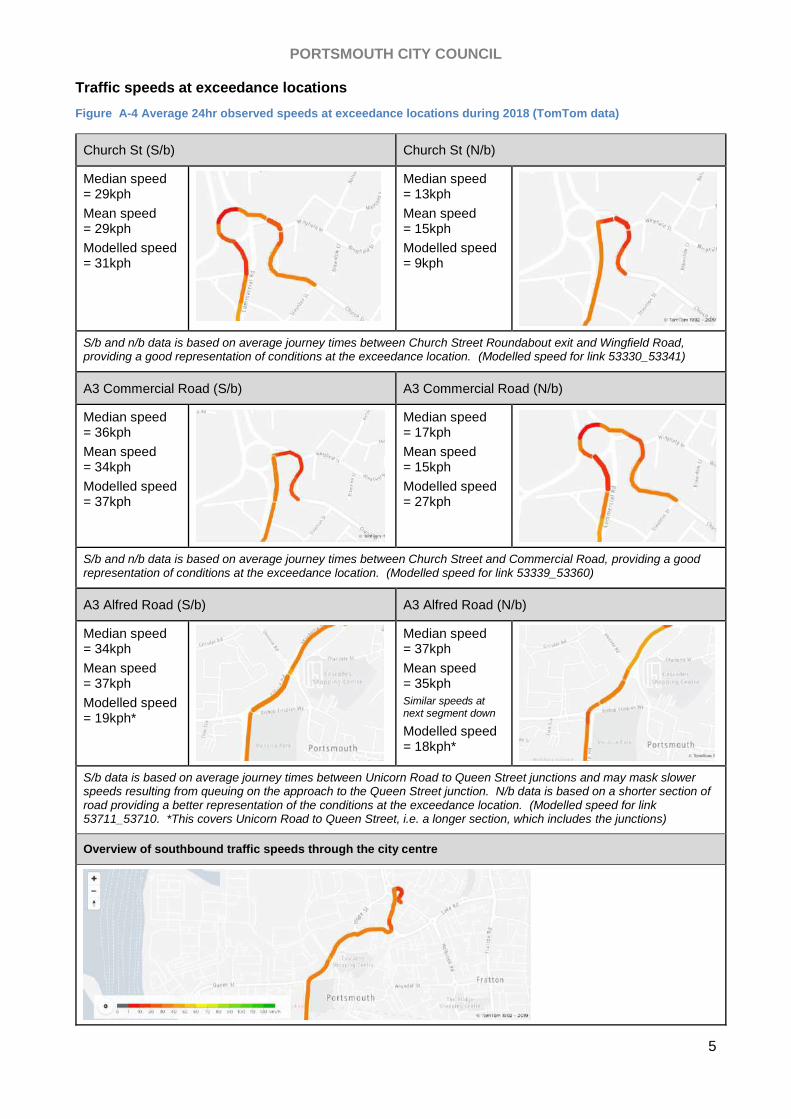
Traffic speeds at exceedance locations
Figure A-4 Average 24hr observed speeds at exceedance locations during 2018 (TomTom data)
Church St (S/b) Church St (N/b)
Median speed = 29kph
Mean speed = 29kph
Modelled speed = 31kph
Median speed = 13kph
Mean speed = 15kph
Modelled speed = 9kph
S/b and n/b data is based on average journey times between Church Street Roundabout exit and Wingfield Road, providing a good representation of conditions at the exceedance location. (Modelled speed for link 53330_53341)
A3 Commercial Road (S/b) A3 Commercial Road (N/b)
Median speed = 36kph
Mean speed = 34kph
Modelled speed = 37kph
Median speed = 17kph
Mean speed = 15kph
Modelled speed = 27kph
S/b and n/b data is based on average journey times between Church Street and Commercial Road, providing a good representation of conditions at the exceedance location. (Modelled speed for link 53339_53360)
A3 Alfred Road (S/b) A3 Alfred Road (N/b)
Median speed = 34kph
Mean speed = 37kph
Modelled speed = 19kph*
Median speed = 37kph
Mean speed = 35kph
Similar speeds at next segment down
Modelled speed = 18kph*
S/b data is based on average journey times between Unicorn Road to Queen Street junctions and may mask slower speeds resulting from queuing on the approach to the Queen Street junction. N/b data is based on a shorter section of road providing a better representation of the conditions at the exceedance location. (Modelled speed for link 53711_53710. *This covers Unicorn Road to Queen Street, i.e. a longer section, which includes the junctions)
Overview of southbound traffic speeds through the city centre

PORTSMOUTH CITY COUNCIL
6
Local and non-local movements by user category and vehicle compliance
Table A-2 Local and non-local movements by user category – Proxy for 2022 Baseline (SRTM, 2026)
User category Total trips within
Portsea Island % user type
Trips
within Island
Trips
to/from Island
Car – Business (all vehicles) 31,090 9% 34% 66%
Car – Other (all vehicles) 279,034 78% 47% 53%
LGV (all vehicles) 25,992 7% 57% 43%
HGV (all vehicles) 23,726 7% 39% 61%
All user classes 359,842 100% 46% 54%
Source: SRTM 2026, Baseline, All day
P:\GBEMB\TP\HA\PROJECTS\5185637 - PCC AQ Plan - ROBI2323\60. Incoming + Background Docs\2019,06,28 - Systra Local vs. non-local movements (Based on 2026, so not affected by recent changes to baseline) (EJV2026)
Vehicle trips within Portsea Island, by time period
Table A-3 Vehicle trips within Portsea Island, by time period – Proxy for 2022 Baseline (SRTM, 2026)
Portsmouth District Cars/Taxi LGVs HGVs Total
AM Peak 64,473 6,825 6,183 77,481
Inter-Peak 135,747 13,333 9,902 158,982
PM Peak 79,432 5,832 4,696 89,960
Off-Peak 30,471 2 2,945 33,419
Total 310,124 25,992 23,726 359,842
Source: SRTM 2026, Baseline, All day
P:\GBEMB\TP\HA\PROJECTS\5185637 - PCC AQ Plan - ROBI2323\60. Incoming + Background Docs\2019,06,28 - Systra Local vs. non-local movements (Based on 2026, so not affected by recent changes to baseline) (EJV2026)

PORTSMOUTH CITY COUNCIL
7
A.3.3. Vehicle characteristics
Variation in emissions rates across different vehicle types
Figure A-5 Emissions factors by vehicle type and Euro category (all vehicles) - NOx emissions are 40 kph
P:\GBEMB\TP\HA\PROJECTS\5185637 - PCC AQ Plan - ROBI2323\40. Technical\08. Emissions Calculations\Em_Factors\
EF_summmary_40kphv2.xlsx
Figure A-6 Emissions factors by vehicle type and Euro category (cars and LGVs) - NOx emissions are 40 kph
P:\GBEMB\TP\HA\PROJECTS\5185637 - PCC AQ Plan - ROBI2323\40. Technical\08. Emissions Calculations\Em_Factors\
EF_summmary_40kphv2.xlsx
Euro VI Artic HGVs
Euro VI Rigid HGVs
Euro VI Buses
0
0.0005
0.001
0.0015
0.002
0.0025
0.003
0.0035
0.004
0.0045
0.005
Art
ic H
GV
Pre
-Euro
IA
rtic
HG
V E
uro
IA
rtic
HG
V E
uro
II
Art
ic H
GV
Euro
III
Art
ic H
GV
Euro
IV
Art
ic H
GV
Euro
V E
GR
Art
ic H
GV
Euro
V S
CR
Art
ic H
GV
Euro
VI
Rig
id H
GV
Pre
-Euro
IR
igid
HG
V E
uro
IR
igid
HG
V E
uro
II
Rig
id H
GV
Euro
III
Rig
id H
GV
Euro
IV
Rig
id H
GV
Euro
V E
GR
Rig
id H
GV
Euro
V S
CR
Rig
id H
GV
Euro
VI
Bu
ses P
re-E
uro
IB
uses E
uro
IB
uses E
uro
II
Bu
ses E
uro
III
Bu
ses E
uro
IV
Bu
ses E
uro
V E
GR
Bu
ses E
uro
V S
CR
Bu
ses E
uro
VI
Die
sel C
ar
Pre
-Euro
1D
iesel C
ar
Euro
1D
iesel C
ar
Euro
2D
iesel C
ar
Euro
3D
iesel C
ar
Euro
4D
iesel C
ar
Euro
5D
iesel C
ar
Euro
6D
iesel C
ar
Euro
6c
Die
sel C
ar
Euro
6d
Die
sel LG
V P
re-E
uro
1D
iesel LG
V E
uro
1D
iesel LG
V E
uro
2D
iesel LG
V E
uro
3D
iesel LG
V E
uro
4D
iesel LG
V E
uro
5D
iesel LG
V E
uro
6D
iesel LG
V E
uro
6c
Die
sel LG
V E
uro
6d
Pe
trol C
ar
Pre
-Euro
1P
etr
ol C
ar
Euro
1P
etr
ol C
ar
Euro
2P
etr
ol C
ar
Euro
3P
etr
ol C
ar
Euro
4P
etr
ol C
ar
Euro
5P
etr
ol C
ar
Euro
6P
etr
ol C
ar
Euro
6c
Euro 6 diesel vehicles (from 2020, shown in dark blue) will be much more efficient than earlier Euro 6 vehicles
0
0.0001
0.0002
0.0003
0.0004
0.0005
0.0006
PORTSMOUTH CITY COUNCIL
8
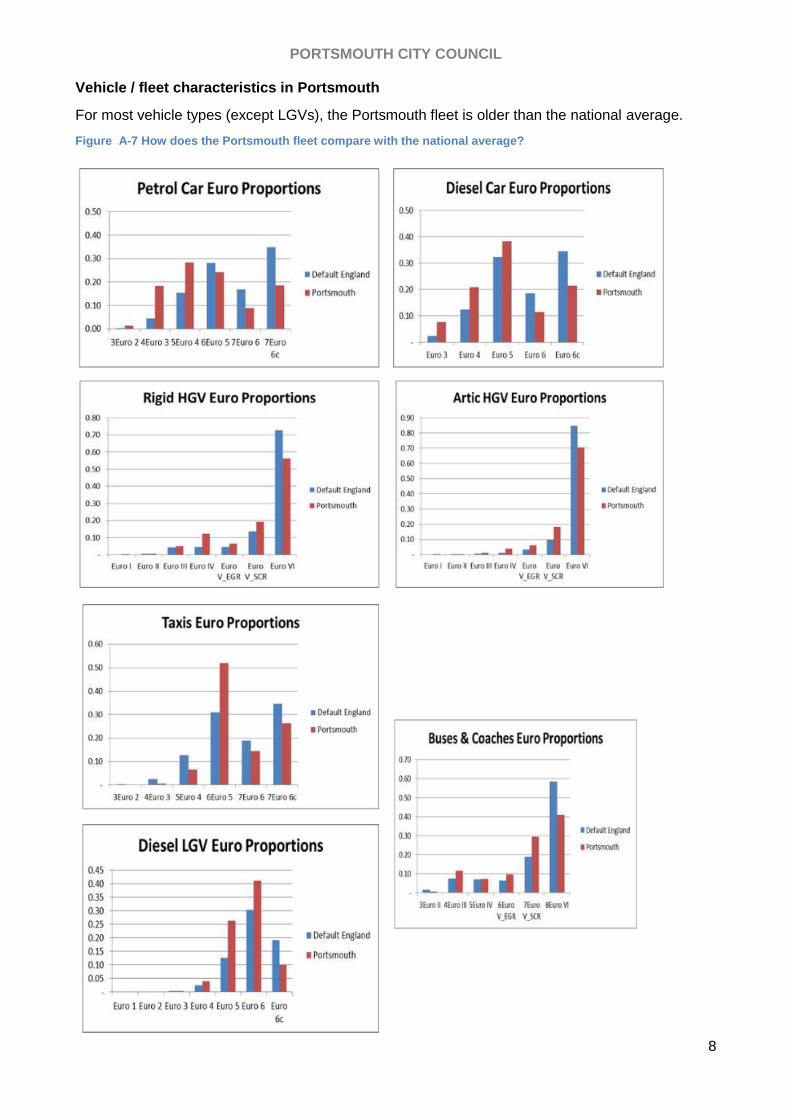
Vehicle / fleet characteristics in Portsmouth
For most vehicle types (except LGVs), the Portsmouth fleet is older than the national average.
Figure A-7 How does the Portsmouth fleet compare with the national average?

PORTSMOUTH CITY COUNCIL
9
Contribution of NOx emissions from different vehicle types in Portsmouth
Table A-4 Contribution of NOx emissions from different vehicle types in Portsmouth
Vehicle type 2018 Contribution 2022 Contribution
Petrol cars 8.4% 10.5%
Diesel cars 47.4% 49.6%
Taxis <1% <1%
Petrol LGVs <1% <1%
Diesel LGVs 19.6% 23.8%
Rigid HGVs 11.6% 7.9%
Artic HGVs 4.8% 3.8%
Buses / Coaches 7.8% 3.2%
Other <1% 1.2%
Light Duty Vehicles (cars, taxis, light goods vehicles, minibuses)
75.8% 85.2%
Heavy Duty Vehicles (HGVs, buses, coaches)
24.2% 14.8%
Source: Modelled estimates based on ANPR data (March 2019, 7 days), and Emissions Factor Toolkit (v9.1b).

PORTSMOUTH CITY COUNCIL
10
Number and type of non-compliant vehicle movements in Portsmouth
Table A-5 Number and type of non-compliant vehicle movements (observations) in Portsmouth
Vehicle type Non-compliant
vehicle movements
(2019)
Compliant vehicle
movements (2019)
Total vehicle movements
(2019)
% non-compliant
vehicle movements
(2019)
What % of the total fleet do
non-compliant vehicles
account for (2019)?
Predicted % non-
compliant vehicle
movements (2022 future
base)
Diesel cars 1,896,439 816,376 2,712,815 70% 23.5% 47%
Petrol cars 715,954 2,838,207 3,554,161 20% 8.9% 6%
Diesel black cabs 1,337 28 1,365 98% 0.0% 51%
Diesel taxi cars 170,113 200,417 370,530 46% 2.1% 32%
Petrol taxi cars 0 19746 19,746 0% 0.0% 0%
Other taxi cars 174 16566 16,740 1% 0.0% 0%
Electric cars 0 10011 10,011 0% 0.0% 0%
Hybrid cars 1546 102172 103,718 1% 0.0% 0%
Gas cars 2,625 0 2,625 100% 0.0% 100%
Diesel LGVs 730,820 282,869 1,013,689 72% 9.0% 45%
Petrol LGVs 3,155 3,922 7,077 45% 0.0% 6%
Other LGVs 679 2241 2,920 23% 0.0% 0%
Rigid HGVs 40,218 52,313 92,531 43% 0.5% 21%
Artic HGVs 13,633 32,543 46,176 30% 0.2% 10%
Mini buses 15,822 11,317 27,139 58% 0.2% n/a*
Diesel buses/coaches
62,220 42,479 104,699 59% 0.8% 11%
Total 3,654,735 4,431,207 8,085,942 45% - -
Source: Modelled estimates based on ANPR data (March 2019, 7 days), and Emissions Factor Toolkit (v9.0). The
results are unlikely to differ significantly from those based on the latest EFT.
*For emissions purpose, mini-buses are incorporated into diesel LGVs in 2022
PORTSMOUTH CITY COUNCIL
11
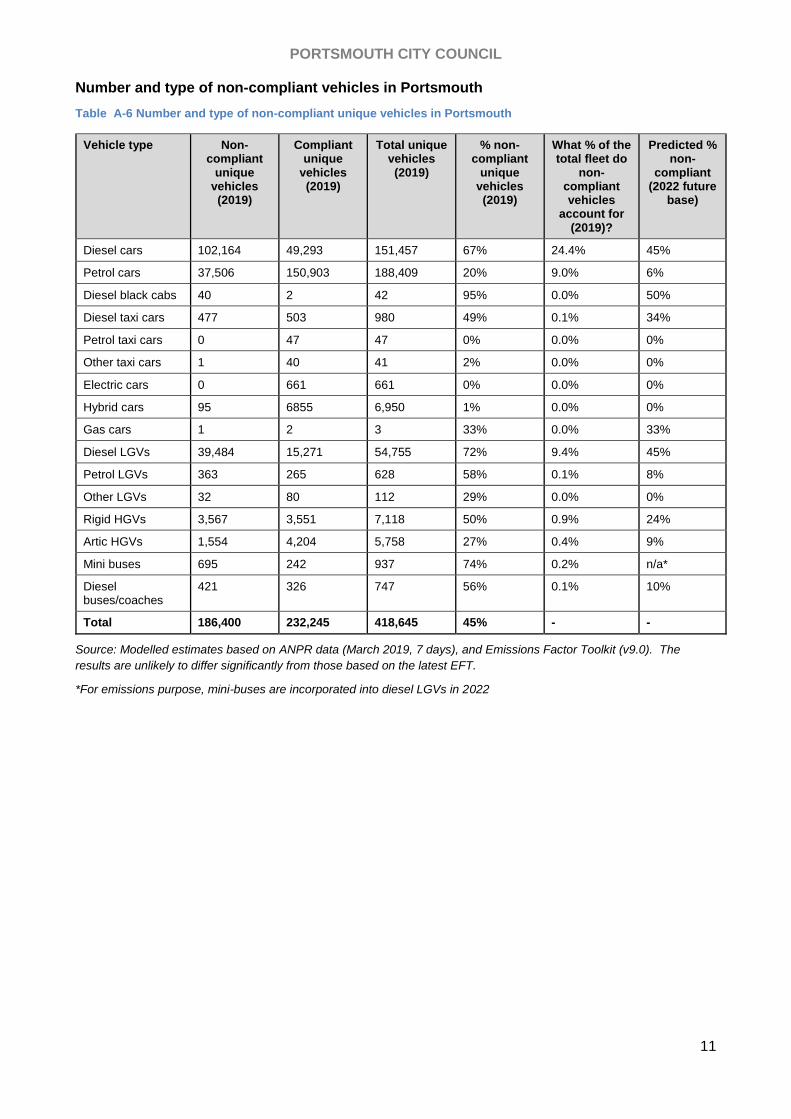
Number and type of non-compliant vehicles in Portsmouth
Table A-6 Number and type of non-compliant unique vehicles in Portsmouth
Vehicle type Non-compliant
unique vehicles (2019)
Compliant unique
vehicles (2019)
Total unique vehicles (2019)
% non-compliant
unique vehicles (2019)
What % of the total fleet do
non-compliant vehicles
account for (2019)?
Predicted % non-
compliant (2022 future
base)
Diesel cars 102,164 49,293 151,457 67% 24.4% 45%
Petrol cars 37,506 150,903 188,409 20% 9.0% 6%
Diesel black cabs 40 2 42 95% 0.0% 50%
Diesel taxi cars 477 503 980 49% 0.1% 34%
Petrol taxi cars 0 47 47 0% 0.0% 0%
Other taxi cars 1 40 41 2% 0.0% 0%
Electric cars 0 661 661 0% 0.0% 0%
Hybrid cars 95 6855 6,950 1% 0.0% 0%
Gas cars 1 2 3 33% 0.0% 33%
Diesel LGVs 39,484 15,271 54,755 72% 9.4% 45%
Petrol LGVs 363 265 628 58% 0.1% 8%
Other LGVs 32 80 112 29% 0.0% 0%
Rigid HGVs 3,567 3,551 7,118 50% 0.9% 24%
Artic HGVs 1,554 4,204 5,758 27% 0.4% 9%
Mini buses 695 242 937 74% 0.2% n/a*
Diesel buses/coaches
421 326 747 56% 0.1% 10%
Total 186,400 232,245 418,645 45% - -
Source: Modelled estimates based on ANPR data (March 2019, 7 days), and Emissions Factor Toolkit (v9.0). The
results are unlikely to differ significantly from those based on the latest EFT.
*For emissions purpose, mini-buses are incorporated into diesel LGVs in 2022

PORTSMOUTH CITY COUNCIL
12
a) Unique vehicle observations by day of survey – 2022 projection, based on cameras in Small Area CAZ
P:\GBEMB\TP\HA\PROJECTS\5185637 - PCC AQ Plan - ROBI2323\2019,10,16 - ANPR UniqVeh
Vehicle Type Compliance Day 1 Day 2 Day 3 Day 4 Day 5 Day 6 Day 7 Avg
BLACK_CAB 1 1 2 3 3 3 5 6 4
BLACK_CAB 0 2 3 4 4 3 5 7 4
BUSES & COACHES 1 216 236 213 238 170 178 223 211
BUSES & COACHES 0 25 28 25 28 20 21 26 25
CARS_DIESEL 1 9803 10078 10163 10669 10015 9524 9952 10029
CARS_DIESEL 0 9898 10175 10261 10772 10112 9617 10049 10126
CARS_DIESEL_HYBRID 1 15 11 10 14 16 20 15 14
CARS_DIESEL_HYBRID 0 1 1 1 1 1 1 1 1
CARS_ELECTRIC 1 80 73 83 75 61 58 82 73
CARS_ELECTRIC 0 0 0 0 0 0 0 0 0
CARS_LPG 1 0 0 0 0 0 0 0 0
CARS_LPG 0 19 18 26 23 18 17 21 20
CARS_PETROL 1 27435 28001 28525 29556 26701 24908 28261 27627
CARS_PETROL 0 1756 1793 1826 1892 1709 1595 1809 1769
CARS_PETROL_HYBRID 1 672 710 710 721 713 724 716 709
CARS_PETROL_HYBRID 0 0 0 0 0 0 0 0 0
HGV_ARTIC 1 167 160 151 159 101 71 157 138
HGV_ARTIC 0 19 19 18 18 12 8 18 16
HGV_RIGID 1 435 452 449 424 157 102 383 343
HGV_RIGID 0 118 122 121 115 43 28 104 93
LGVS_DIESEL 1 4100 4244 4200 4193 2446 1935 4100 3602
LGVS_DIESEL 0 3319 3437 3400 3395 1981 1567 3319 2917
LGVS_ELECTRIC 1 22 24 25 17 4 3 22 17
LGVS_ELECTRIC 0 0 0 0 0 0 0 0 0
LGVS_LPG 1 0 0 0 0 0 0 0 0
LGVS_LPG 0 4 5 4 5 5 4 3 4
LGVS_PETROL 1 57 58 59 71 57 54 62 60
LGVS_PETROL 0 3 4 4 4 3 3 4 4
LGVS_PETROL_HYBRID 1 7 3 7 7 0 0 6 4
LGVS_PETROL_HYBRID 0 0 0 0 0 0 0 0 0
MINIBUSES_DIESEL 1 103 103 100 101 49 42 99 85
MINIBUSES_DIESEL 0 83 84 81 82 39 34 80 69
MINIBUSES_PETROL 1 2 3 2 3 3 1 3 2
MINIBUSES_PETROL 0 0 0 0 0 0 0 0 0
MOPEDS 1 55 44 50 53 48 45 64 51
MOPEDS 0 1 1 1 1 1 1 2 1
MOTORCYCLES 1 157 133 151 152 119 142 170 146
MOTORCYCLES 0 12 10 11 11 9 11 13 11
TAXIS_DIESEL 1 515 517 525 533 510 487 527 516
TAXIS_DIESEL 0 244 245 249 253 243 231 251 245
TAXIS_DIESEL_HYBRID 1 1 2 2 1 1 1 2 1
TAXIS_DIESEL_HYBRID 0 0 0 0 0 0 0 0 0
TAXIS_ELECTRIC 1 1 1 1 1 0 0 1 1
TAXIS_ELECTRIC 0 0 0 0 0 0 0 0 0
TAXIS_PETROL 1 37 39 42 44 41 35 39 40
TAXIS_PETROL 0 0 0 0 0 0 0 0 0
TAXIS_PETROL_HYBRID 1 27 30 30 30 29 30 29 29
TAXIS_PETROL_HYBRID 0 0 0 0 0 0 0 0 0
Grand Total 59412 60869 61533 63669 55443 51508 60626 59005

PORTSMOUTH CITY COUNCIL
13
b) No. of days Unique vehicle observed – 2022 projection, based on cameras in Small Area CAZ
P:\GBEMB\TP\HA\PROJECTS\5185637 - PCC AQ Plan - ROBI2323\2019,10,16 - ANPR UniqVeh
Vehicle Type Compliance 1 2 3 4 5 6 7 Grand Total
Compliance/
NonCompliance
Rate
BLACK_CAB 1 6 1 1 0 0 1 0 11 49%
BLACK_CAB 0 7 2 2 1 0 1 1 12 51%
BUSES & COACHES 1 201 64 36 27 43 55 55 481 89%
BUSES & COACHES 0 24 7 4 3 5 6 7 56 11%
CARS_DIESEL 1 17621 5268 2482 1932 1842 1433 1295 31873 50%
CARS_DIESEL 0 17792 5319 2506 1951 1860 1446 1308 32182 50%
CARS_DIESEL_HYBRID 1 34 8 4 3 2 1 2 54 94%
CARS_DIESEL_HYBRID 0 2 1 0 0 0 0 0 3 6%
CARS_ELECTRIC 1 139 40 21 17 16 9 4 246 100%
CARS_ELECTRIC 0 0 0 0 0 0 0 0 0 0%
CARS_LPG 1 0 0 0 0 0 0 0 0 0%
CARS_LPG 0 29 5 7 4 4 3 4 56 100%
CARS_PETROL 1 42602 13849 7184 5683 5916 4259 3381 82874 94%
CARS_PETROL 0 2727 887 460 364 379 273 216 5306 6%
CARS_PETROL_HYBRID 1 1626 408 161 108 125 87 66 2581 100%
CARS_PETROL_HYBRID 0 0 0 0 0 0 0 0 0 0%
HGV_ARTIC 1 510 78 27 18 10 8 7 658 90%
HGV_ARTIC 0 59 9 3 2 1 1 1 76 10%
HGV_RIGID 1 932 239 85 53 59 28 9 1405 79%
HGV_RIGID 0 252 65 23 14 16 7 3 380 21%
LGVS_DIESEL 1 5763 1901 953 772 896 490 326 11102 55%
LGVS_DIESEL 0 4666 1540 772 625 726 397 264 8989 45%
LGVS_ELECTRIC 1 18 4 9 6 3 3 1 44 100%
LGVS_ELECTRIC 0 0 0 0 0 0 0 0 0 0%
LGVS_LPG 1 0 0 0 0 0 0 0 0 0%
LGVS_LPG 0 5 4 2 1 0 0 1 13 100%
LGVS_PETROL 1 140 37 21 11 5 7 5 225 94%
LGVS_PETROL 0 9 2 1 1 0 0 0 14 6%
LGVS_PETROL_HYBRID 1 2 2 2 2 2 0 0 10 100%
LGVS_PETROL_HYBRID 0 0 0 0 0 0 0 0 0 0%
MINIBUSES_DIESEL 1 111 42 18 18 36 9 6 240 55%
MINIBUSES_DIESEL 0 90 34 14 14 30 7 5 194 45%
MINIBUSES_PETROL 1 10 1 0 1 0 0 0 12 94%
MINIBUSES_PETROL 0 1 0 0 0 0 0 0 1 6%
MOPEDS 1 162 37 16 6 8 1 1 230 97%
MOPEDS 0 4 1 0 0 0 0 0 6 3%
MOTORCYCLES 1 557 71 34 28 11 7 3 709 93%
MOTORCYCLES 0 41 5 2 2 1 0 0 53 7%
TAXIS_DIESEL 1 40 30 26 36 55 106 340 633 68%
TAXIS_DIESEL 0 19 14 13 17 26 51 161 301 32%
TAXIS_DIESEL_HYBRID 1 0 0 1 0 0 0 1 2 94%
TAXIS_DIESEL_HYBRID 0 0 0 0 0 0 0 0 0 6%
TAXIS_ELECTRIC 1 0 0 0 0 1 0 0 1 100%
TAXIS_ELECTRIC 0 0 0 0 0 0 0 0 0 0%
TAXIS_PETROL 1 2 1 2 0 3 14 24 46 100%
TAXIS_PETROL 0 0 0 0 0 0 0 0 0 0%
TAXIS_PETROL_HYBRID 1 2 0 3 1 4 5 20 35 100%
TAXIS_PETROL_HYBRID 0 0 0 0 0 0 0 0 0 0%
Grand Total 96205 29976 14895 11721 12085 8715 7517 181114

PORTSMOUTH CITY COUNCIL
14
c) Unique vehicle observations by day of survey – 2022 projection, based on cameras in Portsea Island CAZ
P:\GBEMB\TP\HA\PROJECTS\5185637 - PCC AQ Plan - ROBI2323\2019,10,16 - ANPR UniqVeh
Vehicle Type Compliance Day 1 Day 2 Day 3 Day 4 Day 5 Day 6 Day 7 Avg
BLACK_CAB 1 3 4 4 6 6 6 9 6
BLACK_CAB 0 3 5 5 7 7 7 9 6
BUSES & COACHES 1 228 251 223 257 177 189 236 223
BUSES & COACHES 0 27 30 26 30 21 22 28 26
CARS_DIESEL 1 15451 15801 15886 16498 14861 14026 15620 15449
CARS_DIESEL 0 15600 15953 16039 16658 15004 14162 15772 15598
CARS_DIESEL_HYBRID 1 26 28 25 35 26 25 29 28
CARS_DIESEL_HYBRID 0 2 2 2 2 2 2 2 2
CARS_ELECTRIC 1 124 115 124 128 89 87 136 115
CARS_ELECTRIC 0 0 0 0 0 0 0 0 0
CARS_LPG 1 0 0 0 0 0 0 0 0
CARS_LPG 0 33 31 36 34 26 22 33 31
CARS_PETROL 1 43930 44395 45104 46374 40428 37759 44868 43265
CARS_PETROL 0 2812 2842 2887 2969 2588 2417 2872 2770
CARS_PETROL_HYBRID 1 1092 1127 1143 1136 1018 1019 1132 1095
CARS_PETROL_HYBRID 0 0 0 0 0 0 0 0 0
HGV_ARTIC 1 612 621 686 637 316 232 573 525
HGV_ARTIC 0 71 72 80 74 37 27 67 61
HGV_RIGID 1 940 985 974 917 282 157 871 732
HGV_RIGID 0 254 266 263 248 76 42 235 198
LGVS_DIESEL 1 7070 7176 7187 7181 4198 3259 7003 6153
LGVS_DIESEL 0 5724 5810 5820 5814 3399 2638 5671 4982
LGVS_ELECTRIC 1 29 29 32 23 7 5 25 21
LGVS_ELECTRIC 0 0 0 0 0 0 0 0 0
LGVS_LPG 1 0 0 0 0 0 0 0 0
LGVS_LPG 0 8 7 6 9 6 6 6 7
LGVS_PETROL 1 109 112 109 127 95 89 137 111
LGVS_PETROL 0 7 7 7 8 6 5 8 7
LGVS_PETROL_HYBRID 1 9 4 9 7 0 0 7 5
LGVS_PETROL_HYBRID 0 0 0 0 0 0 0 0 0
MINIBUSES_DIESEL 1 134 138 138 138 65 61 129 115
MINIBUSES_DIESEL 0 108 111 112 112 53 49 105 93
MINIBUSES_PETROL 1 6 5 6 8 4 3 6 5
MINIBUSES_PETROL 0 0 0 0 1 0 0 0 0
MOPEDS 1 95 84 78 87 88 82 115 90
MOPEDS 0 3 2 2 2 2 2 3 2
MOTORCYCLES 1 268 251 244 278 208 259 307 259
MOTORCYCLES 0 20 19 18 21 15 19 23 19
TAXIS_DIESEL 1 546 546 555 563 535 509 559 545
TAXIS_DIESEL 0 259 260 264 267 254 242 266 259
TAXIS_DIESEL_HYBRID 1 2 2 2 1 1 1 2 1
TAXIS_DIESEL_HYBRID 0 0 0 0 0 0 0 0 0
TAXIS_ELECTRIC 1 1 1 1 1 1 0 1 1
TAXIS_ELECTRIC 0 0 0 0 0 0 0 0 0
TAXIS_PETROL 1 40 41 43 44 43 39 44 42
TAXIS_PETROL 0 0 0 0 0 0 0 0 0
TAXIS_PETROL_HYBRID 1 30 31 33 32 32 31 32 32
TAXIS_PETROL_HYBRID 0 0 0 0 0 0 0 0 0
Grand Total 95676 97164 98173 100734 83976 77500 96941 92881
PORTSMOUTH CITY COUNCIL
15
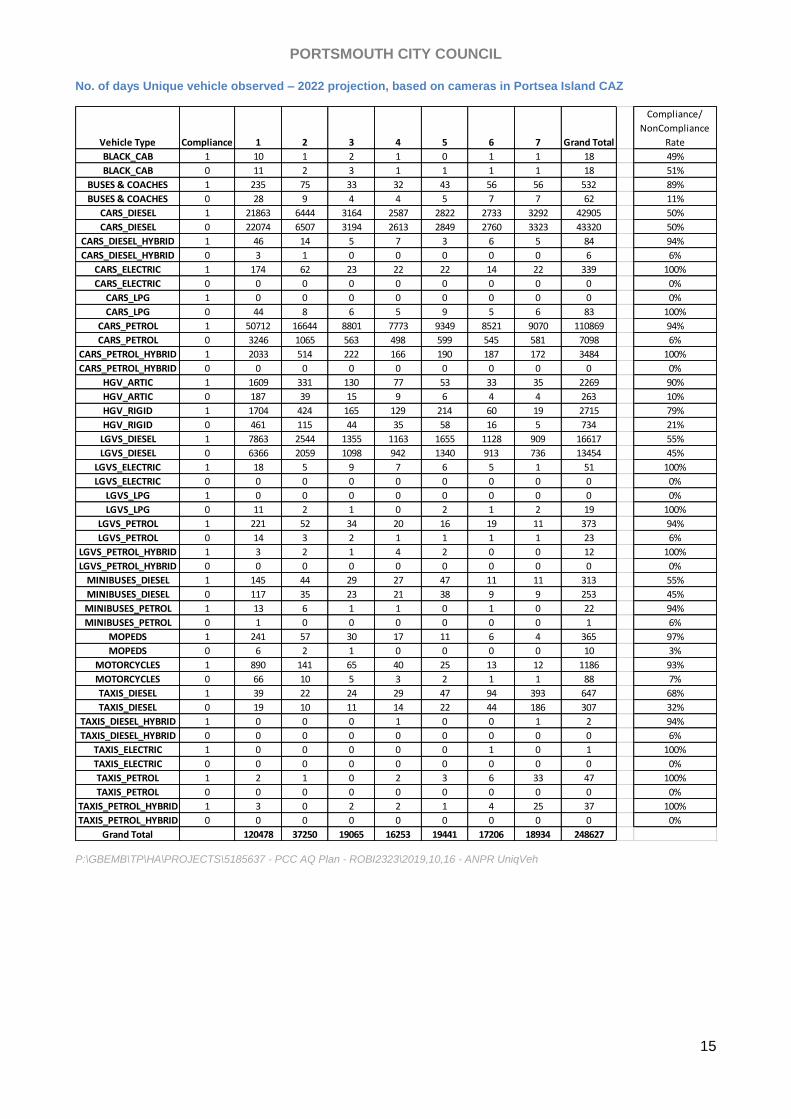
No. of days Unique vehicle observed – 2022 projection, based on cameras in Portsea Island CAZ
P:\GBEMB\TP\HA\PROJECTS\5185637 - PCC AQ Plan - ROBI2323\2019,10,16 - ANPR UniqVeh
Vehicle Type Compliance 1 2 3 4 5 6 7 Grand Total
Compliance/
NonCompliance
Rate
BLACK_CAB 1 10 1 2 1 0 1 1 18 49%
BLACK_CAB 0 11 2 3 1 1 1 1 18 51%
BUSES & COACHES 1 235 75 33 32 43 56 56 532 89%
BUSES & COACHES 0 28 9 4 4 5 7 7 62 11%
CARS_DIESEL 1 21863 6444 3164 2587 2822 2733 3292 42905 50%
CARS_DIESEL 0 22074 6507 3194 2613 2849 2760 3323 43320 50%
CARS_DIESEL_HYBRID 1 46 14 5 7 3 6 5 84 94%
CARS_DIESEL_HYBRID 0 3 1 0 0 0 0 0 6 6%
CARS_ELECTRIC 1 174 62 23 22 22 14 22 339 100%
CARS_ELECTRIC 0 0 0 0 0 0 0 0 0 0%
CARS_LPG 1 0 0 0 0 0 0 0 0 0%
CARS_LPG 0 44 8 6 5 9 5 6 83 100%
CARS_PETROL 1 50712 16644 8801 7773 9349 8521 9070 110869 94%
CARS_PETROL 0 3246 1065 563 498 599 545 581 7098 6%
CARS_PETROL_HYBRID 1 2033 514 222 166 190 187 172 3484 100%
CARS_PETROL_HYBRID 0 0 0 0 0 0 0 0 0 0%
HGV_ARTIC 1 1609 331 130 77 53 33 35 2269 90%
HGV_ARTIC 0 187 39 15 9 6 4 4 263 10%
HGV_RIGID 1 1704 424 165 129 214 60 19 2715 79%
HGV_RIGID 0 461 115 44 35 58 16 5 734 21%
LGVS_DIESEL 1 7863 2544 1355 1163 1655 1128 909 16617 55%
LGVS_DIESEL 0 6366 2059 1098 942 1340 913 736 13454 45%
LGVS_ELECTRIC 1 18 5 9 7 6 5 1 51 100%
LGVS_ELECTRIC 0 0 0 0 0 0 0 0 0 0%
LGVS_LPG 1 0 0 0 0 0 0 0 0 0%
LGVS_LPG 0 11 2 1 0 2 1 2 19 100%
LGVS_PETROL 1 221 52 34 20 16 19 11 373 94%
LGVS_PETROL 0 14 3 2 1 1 1 1 23 6%
LGVS_PETROL_HYBRID 1 3 2 1 4 2 0 0 12 100%
LGVS_PETROL_HYBRID 0 0 0 0 0 0 0 0 0 0%
MINIBUSES_DIESEL 1 145 44 29 27 47 11 11 313 55%
MINIBUSES_DIESEL 0 117 35 23 21 38 9 9 253 45%
MINIBUSES_PETROL 1 13 6 1 1 0 1 0 22 94%
MINIBUSES_PETROL 0 1 0 0 0 0 0 0 1 6%
MOPEDS 1 241 57 30 17 11 6 4 365 97%
MOPEDS 0 6 2 1 0 0 0 0 10 3%
MOTORCYCLES 1 890 141 65 40 25 13 12 1186 93%
MOTORCYCLES 0 66 10 5 3 2 1 1 88 7%
TAXIS_DIESEL 1 39 22 24 29 47 94 393 647 68%
TAXIS_DIESEL 0 19 10 11 14 22 44 186 307 32%
TAXIS_DIESEL_HYBRID 1 0 0 0 1 0 0 1 2 94%
TAXIS_DIESEL_HYBRID 0 0 0 0 0 0 0 0 0 6%
TAXIS_ELECTRIC 1 0 0 0 0 0 1 0 1 100%
TAXIS_ELECTRIC 0 0 0 0 0 0 0 0 0 0%
TAXIS_PETROL 1 2 1 0 2 3 6 33 47 100%
TAXIS_PETROL 0 0 0 0 0 0 0 0 0 0%
TAXIS_PETROL_HYBRID 1 3 0 2 2 1 4 25 37 100%
TAXIS_PETROL_HYBRID 0 0 0 0 0 0 0 0 0 0%
Grand Total 120478 37250 19065 16253 19441 17206 18934 248627

PORTSMOUTH CITY COUNCIL
16
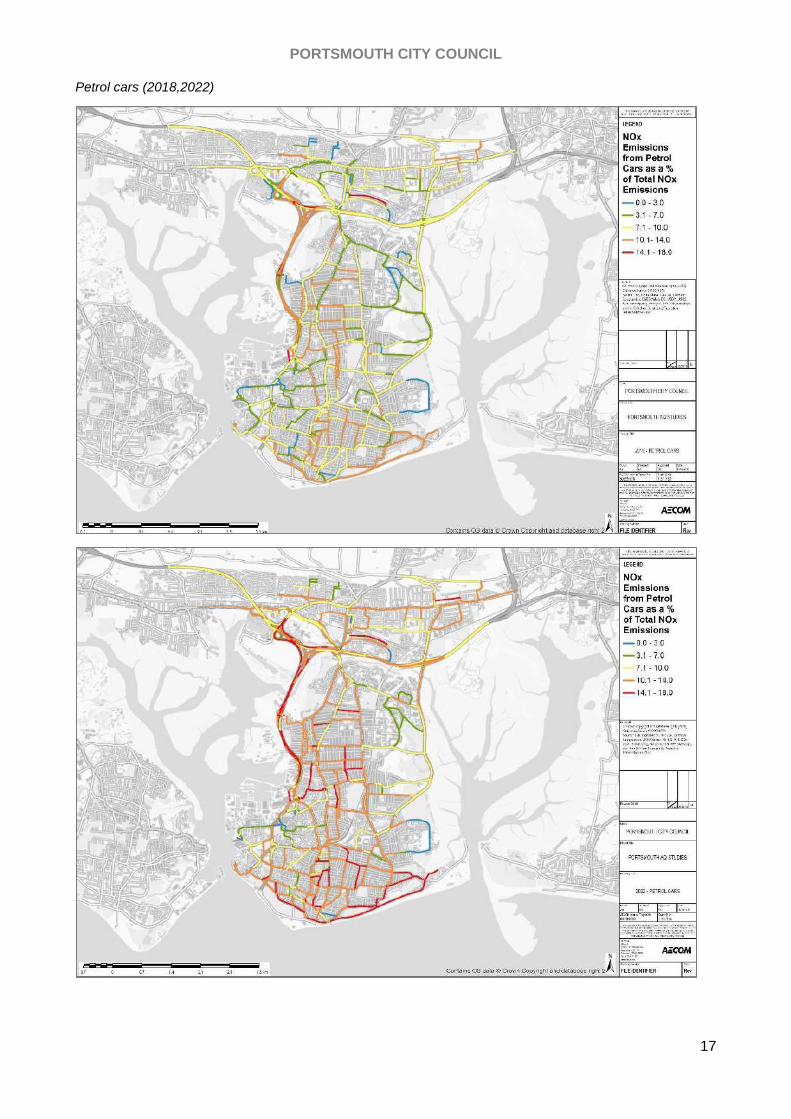
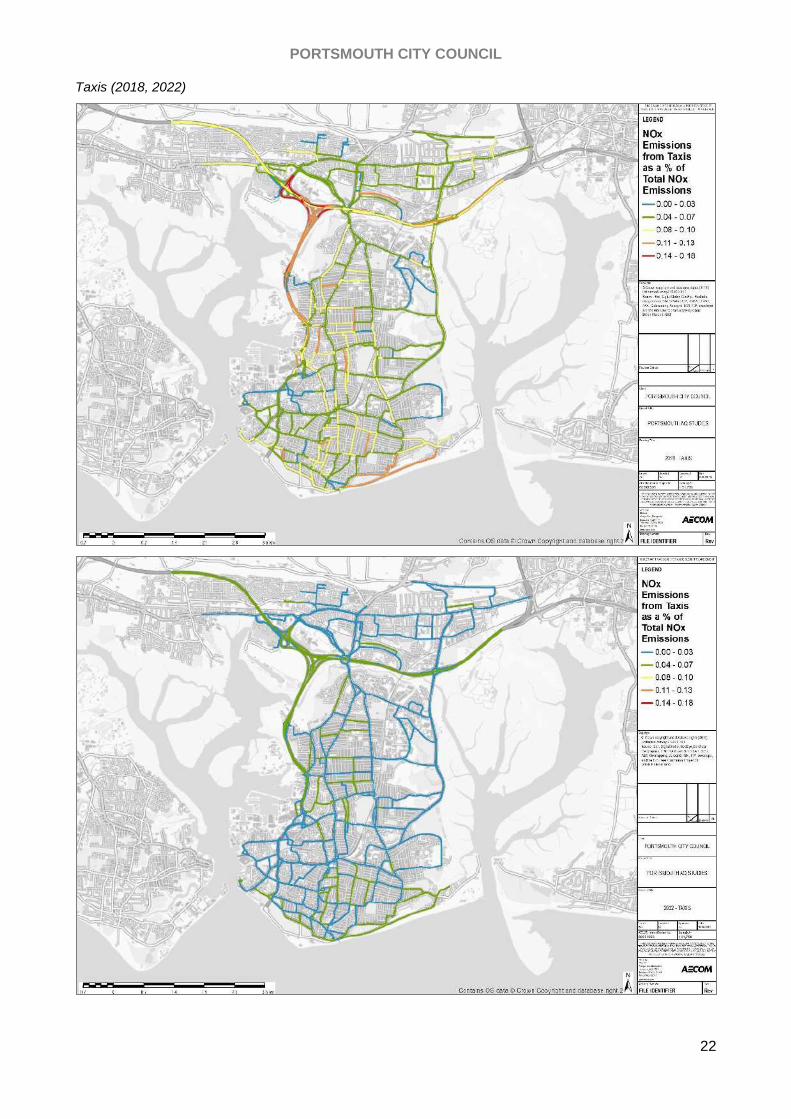
NOx emissions source apportionment (2018 and 2022)
Figure A-8 Source of road NOx by vehicle type across Portsmouth
Diesel cars (2018, 2022)
PORTSMOUTH CITY COUNCIL
17
Petrol cars (2018,2022)

PORTSMOUTH CITY COUNCIL
18
Diesel LGVs (2018,2022)

PORTSMOUTH CITY COUNCIL
19
Petrol LGVs (2018, 2022)

PORTSMOUTH CITY COUNCIL
20
Rigid HGVs (2018, 2022)

PORTSMOUTH CITY COUNCIL
21
Articulated HGVs (2018, 2022)
PORTSMOUTH CITY COUNCIL
22
Taxis (2018, 2022)

PORTSMOUTH CITY COUNCIL
23
Buses / coaches (2018, 2022)
Source: Modelled estimates based on ANPR data (March 2019, 7 days), and Emissions Factor Toolkit (v9.0). The
results are unlikely to differ significantly from those based on the latest EFT.
PORTSMOUTH CITY COUNCIL
24
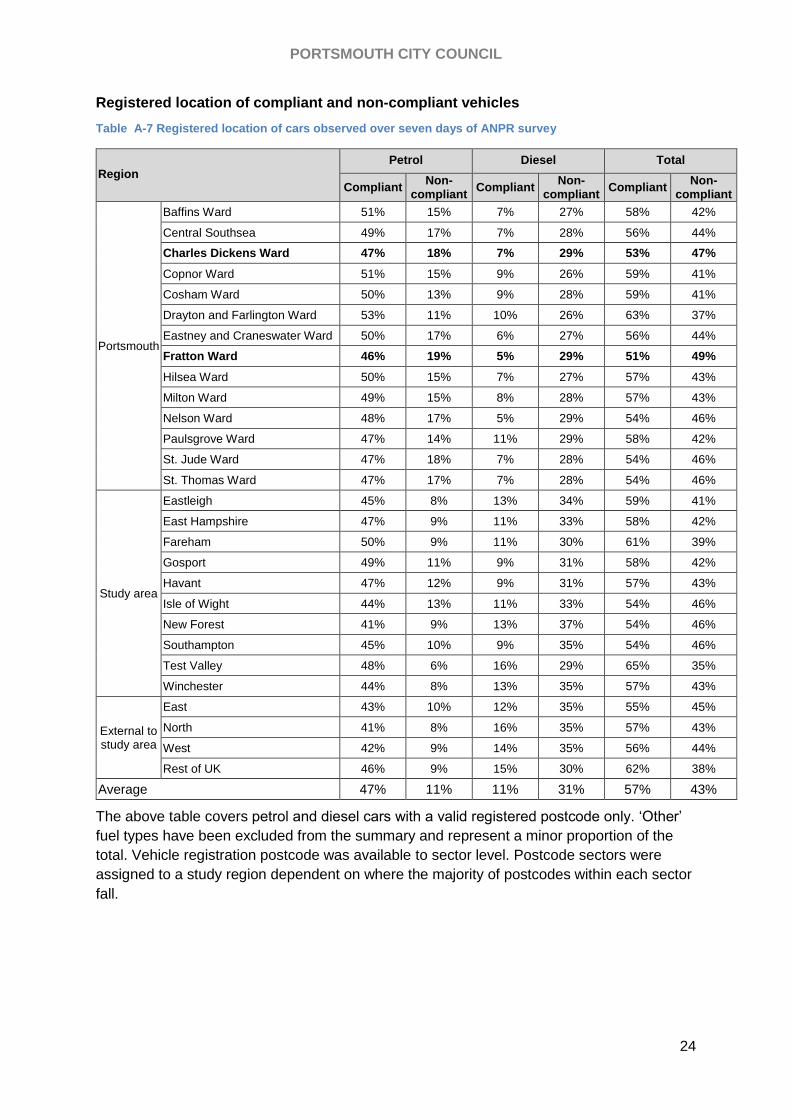
Registered location of compliant and non-compliant vehicles
Table A-7 Registered location of cars observed over seven days of ANPR survey
Region
Petrol Diesel Total
Compliant Non-
compliant Compliant
Non-compliant
Compliant Non-
compliant
Portsmouth
Baffins Ward 51% 15% 7% 27% 58% 42%
Central Southsea 49% 17% 7% 28% 56% 44%
Charles Dickens Ward 47% 18% 7% 29% 53% 47%
Copnor Ward 51% 15% 9% 26% 59% 41%
Cosham Ward 50% 13% 9% 28% 59% 41%
Drayton and Farlington Ward 53% 11% 10% 26% 63% 37%
Eastney and Craneswater Ward 50% 17% 6% 27% 56% 44%
Fratton Ward 46% 19% 5% 29% 51% 49%
Hilsea Ward 50% 15% 7% 27% 57% 43%
Milton Ward 49% 15% 8% 28% 57% 43%
Nelson Ward 48% 17% 5% 29% 54% 46%
Paulsgrove Ward 47% 14% 11% 29% 58% 42%
St. Jude Ward 47% 18% 7% 28% 54% 46%
St. Thomas Ward 47% 17% 7% 28% 54% 46%
Study area
Eastleigh 45% 8% 13% 34% 59% 41%
East Hampshire 47% 9% 11% 33% 58% 42%
Fareham 50% 9% 11% 30% 61% 39%
Gosport 49% 11% 9% 31% 58% 42%
Havant 47% 12% 9% 31% 57% 43%
Isle of Wight 44% 13% 11% 33% 54% 46%
New Forest 41% 9% 13% 37% 54% 46%
Southampton 45% 10% 9% 35% 54% 46%
Test Valley 48% 6% 16% 29% 65% 35%
Winchester 44% 8% 13% 35% 57% 43%
External to study area
East 43% 10% 12% 35% 55% 45%
North 41% 8% 16% 35% 57% 43%
West 42% 9% 14% 35% 56% 44%
Rest of UK 46% 9% 15% 30% 62% 38%
Average 47% 11% 11% 31% 57% 43%
The above table covers petrol and diesel cars with a valid registered postcode only. ‘Other’
fuel types have been excluded from the summary and represent a minor proportion of the
total. Vehicle registration postcode was available to sector level. Postcode sectors were
assigned to a study region dependent on where the majority of postcodes within each sector
fall.

PORTSMOUTH CITY COUNCIL
25
A.3.4. Site specific characteristics
Figure A-9 A3 Commercial Road (ID546, 538) – Looking north towards Church Street Roundabout
Figure A-10 A3 Alfred Road (ID573) – Unicorn Rd to Queen St (looking south towards junction)
PORTSMOUTH CITY COUNCIL
26
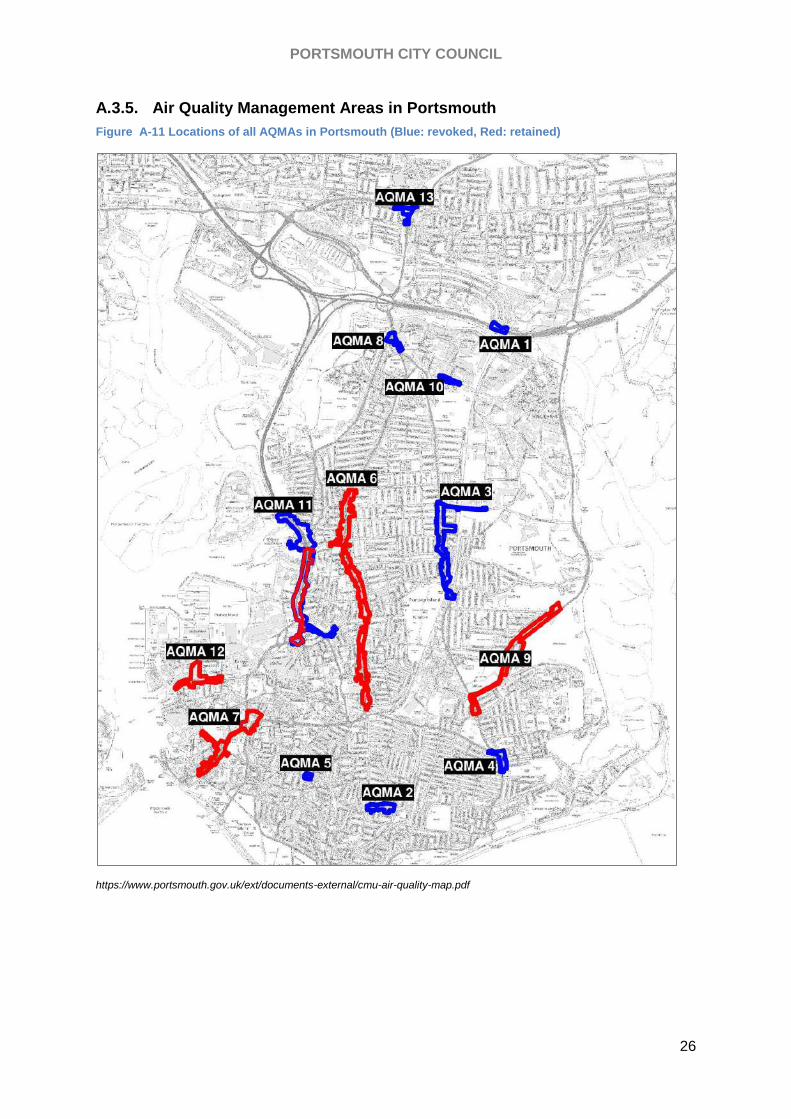
A.3.5. Air Quality Management Areas in Portsmouth
Figure A-11 Locations of all AQMAs in Portsmouth (Blue: revoked, Red: retained)
https://www.portsmouth.gov.uk/ext/documents-external/cmu-air-quality-map.pdf